


Abstract
Soil acidification and nutrient imbalances threaten mountain tea plantation sustainability, while nutrient-driven acidification mechanisms along elevation gradients in deep soil profiles remain poorly understood. This study examined three tea plantations at different elevations (107, 400, and 711 m) on Mount Lu, Jiangxi Province, sampling soils at five depths to 100 cm. Objectives were to quantify vertical differentiation of acidity, base ions, and nutrients, reveal altitudinal conversion patterns of acidification drivers, and guide fertilizer management. Soils exhibited strongly acidic conditions (pH 3.86–5.46), with the most severe acidification at the mountain foot and surface layer (0–20 cm). Potential acid accumulation in deep soils exceeded 75% (exchangeable aluminum/exchangeable acidity: 80.61%, 77.42%, 80.10% at mountain foot, mountainside, and mountaintop, respectively), and acidification spread was most pronounced at the mountain foot. The mountaintop and surface layer showed strongest acid–base resistance. Cation exchange capacity and base cations decreased with depth; base saturation in surface soil was 47.12% higher than in deeper layers. Organic matter, nitrogen, phosphorus, and available potassium were surface-enriched, whereas total potassium accumulated in deeper layers. Correlation analysis showed that pH was significantly negatively correlated with exchangeable acidity, exchangeable aluminum, organic matter, total nitrogen, and alkaline-hydrolyzable nitrogen, and significantly positively correlated with exchangeable calcium, exchangeable magnesium, and total potassium. Structural equation modeling revealed that nitrogen accumulation was the primary acidification driver, with total effect sizes ranking as total nitrogen (0.549) > organic matter (0.319) > total potassium (0.247) > alkaline-hydrolyzable nitrogen (0.156). Nitrogen drove soil acidification via direct and indirect pathways by increasing exchangeable acidity and depleting base cations dominated by Ca2+. Organic matter exerted bidirectional regulation on soil pH, while total potassium indirectly alleviated soil acidification. These findings underscored the need to adjust the N:K2O ratio from 2:1 to approximately 1.5:1; Organic fertilizers and soil amendments should be applied as base fertilizers, with the mountainside (400 m) being the most suitable elevation for tea cultivation.
1. Introduction
Tea (Camellia sinensis) is a major commercial crop in many countries in tropical and subtropical regions, including China, Kenya, India, Sri Lanka, etc. [1]. China is the largest tea grower, producer, and consumer worldwide [1], and its tea cultivation area has grown rapidly, expanding from 1.1 × 10⁶ ha in 2000 to 3.4 × 10⁶ ha in 2022 [2], with tea export revenue amounting to USD 2.5 billion [3]. As an important high-quality tea-producing region in China, Jiangxi’s tea plantations are mostly distributed in hilly and mountainous areas. Lushan is the core, characteristic tea-producing area of Jiangxi, and the annual output value of its tea has exceeded 1.6 billion yuan [4]. However, although the unique topographical conditions of the Lushan tea gardens endow the tea with distinct quality and flavor, the risk of soil degradation is also much higher there than that of tea gardens on flat land [5]. The reasons are as follows: (1) mountain terrain leads to rapid runoff of precipitation, and intense leaching from rainfall drives a large downward migration and loss of exchangeable base cations in the soil (such as Ca2+, Mg2+, and K+), resulting in relative enrichment of H+ and Al3+ [6,7]; and (2) strong slope runoff in mountainous areas causes nutrients from fertilization to be redistributed spatially through surface runoff and lateral seepage, making it difficult to retain them effectively in the root zone [8,9]. Currently, Lushan and most tea-growing areas in Jiangxi are facing the severe reality of rising tea production values year by year, while soil acidification becomes increasingly serious and nutrients are continually depleted. Therefore, an in-depth study of the soil acidification characteristics and major nutrient status of Lushan tea gardens is not only an urgent need to resolve bottlenecks in the sustainable development of the industry but also provides a theoretical basis for soil improvement and fertility enhancement in mountainous tea gardens.
The optimal soil pH for tea growth is 4.5~5.5 [10]. Tea growth is inhibited when the soil pH is below 4.0, and both the quality and quantity of the tea that is produced are negatively affected [11]. Tea gardens constitute a unique ecosystem. Compared with forests, cash crops, and cereal-planting areas, soil acidification in tea-planting areas is more severe, and pH decreases more significantly [12]. Teas are typical aluminum-accumulating and ammonium-preferring plants—they preferentially absorb NH4+ and Al3+. To maintain rhizosphere charge balance, the roots release a large number of H+ into the soil [13]. At the same time, tea roots secrete low-molecular-weight organic acids (oxalic acid and citric acid), which accelerate the activation of aluminum from soil minerals [14,15]. In addition, frequent tea harvesting removes a large amount of base cations, resulting in a gradual decline in soil base saturation over the years [12]. Nevertheless, approximately 46% of tea plantation soil in China has a pH below 4.5 [16], resulting in an escalating issue of soil acidification within Chinese tea plantations that is progressively intensifying. In recent years, numerous studies have demonstrated that soil acidification is not only limited to the surface layer but also shows a significant trend of spreading from the surface inward, extending throughout deeper soil profiles [17,18]. Yang et al. [19] found through long-term positioning experiments that tea garden soils continue to acidify at a rate of 0.071 units per year, with acidity exhibiting a trend of migrating to deeper layers; Yan et al. [11] further confirmed that the acidification effect induced by tea planting is not limited to the surface layer; its impact can extend to a soil profile as deep as 200 cm. This discovery expands the traditional understanding that tea garden acidification is limited only to surface-layer damage.
Previous studies have shown that altitudinal gradients can substantially reshape local hydrothermal conditions, rainfall-induced leaching intensity, and soil biogeochemical processes in montane tea plantations, resulting in pronounced differences among elevations in the extent of soil acidification, nutrient accumulation, and profile differentiation [7,20]. Favorable hydrothermal conditions at low elevations stimulate organic matter mineralization and nitrification, so that each unit of nitrogen applied yields more H+ and highly mobile NO3−; together with stronger runoff erosion and ion leaching, this accentuates base cation loss and thereby aggravates soil acidification [21,22]; tea gardens at high elevations are characterized by lower temperatures and higher humidity, where increased litterfall combined with suppressed microbial decomposition favors topsoil organic matter accumulation. The resulting enrichment in functional groups—particularly carboxyl (–COOH) and phenolic hydroxyl (–OH) moieties—confers a dual protective effect: dissociation of these groups consumes H+, while their complexation with Al3+ reduces the activity of toxic monomeric Al, collectively strengthening soil pH buffering capacity [6]. Throughout the world’s subtropical monsoon regions—including montane tea gardens in China, Japan, and Southeast Asia—intensive fertilization and the distinctive physiological traits of tea plants drive surface soil acidification, base cation depletion, and nutrient imbalance in a highly consistent manner [23,24]. Yet most previous work has been restricted to surface soil characterization of tea gardens on flat terrain or at a single elevation, leaving the vertical differentiation of acidification within deep profiles along elevation gradients—and the shift in its dominant driving mechanisms—largely unexplored. Consequently, the understanding of profile acidification theory and differential nutrient-regulation mechanisms for comparable mountain tea plantations worldwide remains relatively weak.
The tea plantations on Lushan Mountain possess a distinctive montane microclimate and a well-defined elevational gradient, making them an ideal setting for investigating elevation-driven variation in soil acidification; the acidification patterns observed there are also representative of the broader subtropical red-soil tea region. In this study, three typical tea gardens along an elevational transect—107 m, 400 m, and 711 m—were selected, and the sampling depth was extended to 100 cm (0–20, 20–40, 40–60, 60–80, and 80–100 cm). The objectives were as follows: (1) to determine the vertical differentiation of soil acidity indices, base cations, and major nutrient factors across the three elevations and five soil layers; (2) to identify the key nutrient-related drivers of soil acidification along the elevational gradient; and (3) to propose elevation-specific fertilization and soil acidification amelioration strategies for tea plantation management.
2. Materials and Methods
2.1. Experiment Site
2.1.1. Site Description
The experimental sites were located on the southwestern slope of Mount Lu in Jiangxi Province, China (116°0′35″–116°1′34″ E, 29°30′10″–29°32′21″ N) and were in a subtropical humid monsoon climate zone. Figure 1 was created with ArcGIS Pro 3.7. The highest peak of Mount Lu, Hanyang Peak, reaches 1474 m, and the mountainous vertical zonal climate differentiation is significant. From the foot to the top, the climate layers are sequentially subtropical, warm temperate, and temperate. The soil parent materials are mainly granite weathering residues and Quaternary red clay. According to the Chinese genetic soil classification, the zonal soil is red soil, which gradually transitions to mountain yellow–red soil and mountain yellow soil with increasing altitude [25]. In accordance with the World Reference Base for Soil Resources [26], all soil profiles across the elevation gradient are classified as Acrisols, characterized by intense weathering, low base saturation, and high aluminum activity. The mean annual temperatures at the mountain foot, mountainside, and mountaintop were approximately 16.0 °C, 15.0 °C, and 13.5 °C, respectively, with annual precipitation ranging from 1300 to 1600 mm, mainly concentrated from March to August.
Figure 1.
Location of the study area and the three sampling sites on Mount Lu, Jiangxi Province, China. Note: The left panel shows the position of Jiangxi Province within China, with the study area marked in red. The upper-right inset shows the location of Lushan City within Jiangxi Province. The main panel shows the three tea plantation sampling sites along an altitudinal gradient: mountain foot (107 m; 116°1′20″ E, 29°30′10″ N), mountainside (400 m; 116°1′34″ E, 29°32′0″ N), and mountaintop (711 m; 116°0′35″ E, 29°32′21″ N).The color gradient from blue through yellow to red represents elevation increasing from low to high.
2.1.2. Plantation Management
The tea cultivar used in this experiment was “Zhongcha 108”, planted in 2015, with row and plant spacings of 1.5 m and 0.3 m, respectively. Nitrogen fertilizer was applied as urea (46% N), phosphorus fertilizer as superphosphate (15% P2O5), and potassium fertilizer as potassium sulfate (50% K2O). The nutrient inputs in the experimental site were 300 kg N ha−1 yr−1, 150 kg P2O5 ha−1 yr−1, and 150 kg K2O ha−1 yr−1. Nitrogen fertilizer was applied in three splits at ratios of 40%, 30%, and 30% in late November, early March, and mid-August, respectively. Phosphorus and potassium fertilizers were applied once as basal fertilizer in late November. All fertilizers were applied by trenching between tea rows and then covering with soil. The tea plantations in the study area were located on slopes and were irrigated by drip irrigation, with additional irrigation applied during the spring bud emergence period and summer drought periods. Drainage systems were also constructed on the slopes to reduce surface runoff and the loss of base cations from the soil.
2.2. Soil Sample Collection
2.2.1. Sample Sites and Method
This study, combining topography, soil types, tea garden distribution, and tea tree growth conditions, selected one mature tea garden with an area of ≥3 ha, a concentrated contiguous layout, uniform tree age, and consistent growth at each of the three altitude gradients: mountain foot, mountainside, and mountaintop, as sampling sites (Figure 2). Due to terrain differences, different plot layout schemes were adopted at each elevation: the mountain foot was flat and used the diagonal point placement method; the mountainside and mountaintop were on the same slope with a certain gradient and used a serpentine dot arrangement method. The geographic coordinates (longitude, latitude, altitude) of the sampling points were recorded using handheld GPS.
Figure 2.
The field photograph of the tea plantation.
2.2.2. Sample Collection
In June 2024 (peak tea growing season), seven sampling points were established within each plot according to the sampling layout described above. Soil samples were collected at approximately 10 cm from the fertilizer furrow using a stainless-steel soil auger (5 cm inner diameter) from five depth intervals: 0–20, 20–40, 40–60, 60–80, and 80–100 cm. Prior to sampling, surface litter was carefully removed with a trowel. The auger was then driven vertically into the soil, and soil cores were collected continuously over each designated depth interval. Each drilled sample was placed in a separate bag, with approximately 200 g per bag; 105 soil samples were collected across three elevations. The collected soil samples were brought back to the laboratory and spread evenly on clean craft paper for natural air drying. During drying, plant roots, weeds, gravel, and other debris were carefully removed from the samples. After drying, the soil was ground and passed through 0.149 mm and 2 mm sieves, then stored in sealed bags for subsequent soil testing.
2.3. Chemical Analysis
2.3.1. Soil Indicator Measurement
The chemical properties of the soil were determined according to the method described by Bao [27]. The soil pH was measured with a 1:2.5 extraction mixture (soil/water, w/v) using a pH meter; exchangeable acidity (EA = EAl + EH) was determined by the neutralization titration method with potassium chloride; exchangeable aluminum (EAl) was separated by NaF complexation. Soil acid–base buffering capacity (pHBC) was measured using acid–base titration [28,29]; cation exchange capacity (CEC) was determined by the ammonium acetate exchange method; the Ca2+ and Mg2+ in the extracts were determined using atomic absorption spectrophotometry, and the K+ and Na+ were determined using flame photometry (AP1200, Shanghai, China); soil organic matter (SOM) was determined by oxidation with potassium dichromate and titration with ferrous ammonium sulfate; total nitrogen (TN) was determined using the Kjeldahl method; alkaline-hydrolyzable nitrogen (AN) was measured using the alkaline hydrolysis diffusion method; total phosphorus (TP) was determined using the H2SO4–HClO4–molybdenum–antimony colorimetric method; available phosphorus (AP) was extracted with NaHCO3 and measured spectrophotometrically; total potassium (TK) was determined using the NaOH fusion-flame photometry method; and available potassium (AK) was extracted with NH4OAc and measured using flame photometry. All soil analytical procedures in this study followed the classic agricultural soil chemical analysis methods widely adopted in Chinese soil research.
2.3.2. Soil Index Calculation
All soil indices were calculated following standard soil physical and chemical calculation methods.
(1) Base saturation (BS, %) and exchangeable acid saturation (EAS, %) were calculated as [30]:
where TEB was total exchangeable base cations (TEB = Ca2+ + Mg2+ + K+ + Na+), CEC was cation exchange capacity, and EA was exchangeable acidity (EA = EAl + EH). Base saturation and exchangeable acid saturation were complementary to each other.
BS = TEB/CEC × 100%; EAS = EA/CEC × 100%
(2) The vertical difference of soil pH and exchangeable acidity was calculated as [31,32]:
ΔpH = pH (0–20 cm) − pH (80–100 cm);
ΔEA = EA (0–20 cm) − EA (80–100 cm)
ΔpH and ΔEA reflect the vertical gradient of soil acidification from topsoil to deep soil layer, the magnitude of these differences reflects the extent to which acidification has migrated downwards.
(3) Soil pH buffer capacity (pHBC) was calculated as [33]:
pHBC indicated the acid–base buffer capacity at the end of the test and a was the slope of the linear fitting equation. A larger pHBC indicated a stronger capacity of the soil to resist changes in pH.
pHBC = 1/|a|
2.4. Tea Garden Soil Nutrient Grading Standards
According to the tea garden soil quality classification criteria specified in the Environmental Technical Conditions for Tea Production Areas (NY/T 853—2004) [34] and the Green Food—Environmental Quality Standard for Production Areas (NY/T 391—2021) [35], tthe tea garden soils were classified into three grades: Grade I, Grade II, and Grade III (Table 1). This grading system is widely used for subtropical tea plantation soils in China and is compatible with the analytical methods adopted in this study.
Table 1.
Standards for fertility classification of tea plantation soil.
2.5. Statistical Analysis
The experimental data were processed using Microsoft Excel 2010. Prior to formal analysis, all data were tested for normality and homogeneity of variance. Two-way analysis of variance (ANOVA) was performed using SPSS 23 with elevation and soil depth as fixed factors to test for their main effects and their interaction; where ANOVA indicated a significant effect (p < 0.05), means were compared using Duncan’s multiple range test at p < 0.05. Graphs were plotted using OriginPro 2022. Structural equation modelling was performed by partial least squares path modelling (PLS-PM) using the “plspm” package in R. The total path effect on soil pH was defined as [36]:
Total path effect = |direct effect + sum of all indirect effects|
The direct effect is the standardized path coefficient linking an explanatory variable directly to the response variable, the indirect effect is the sum of the products of path coefficients along all indirect pathways.
3. Results
3.1. Characteristics of Soil Acidification in Tea Gardens
3.1.1. Characteristics of Soil pH Changes in Tea Gardens
Overall, soil pH ranged from 3.94 to 5.01, indicating acidic conditions (Figure 3). Both altitude (H) and soil layer depth (S) had highly significant effects on soil pH (p < 0.01), while their interaction was not significant (p > 0.01). At different altitudes, the soil pH of tea garden profiles was in the order of 400 m (4.58) > 711 m (4.56) > 107 m (4.33), with pH at the mountain foot being significantly lower than that of the mountainside and mountaintop tea gardens, indicating a higher degree of acidification. Vertically across soil profiles, pH overall showed an increasing trend with soil depth, with the mean pH values of each soil layer as follows: 80–100 cm (4.65) > 60–80 cm (4.58) > 40–60 cm (4.52) > 20–40 cm (4.44) > 0–20 cm (4.26); reflecting more pronounced acidification in the surface soil. Examining the altitudinal gradients specifically, the soil pH at the foot and top of the mountain increased continuously with soil depth. No significant differences in pH were observed in different layers at the mountain foot, while at the mountaintop, the surface 0–20 cm layer (4.30) was significantly lower than the 80–100 cm layer (4.71). On the mountainside, soil pH initially increased and then decreased with soil depth, peaking at 60–80 cm (4.73).
Figure 3.
pH of tea garden profiles at different altitudes. Note: Different lowercases above the bars mean significant difference at the p < 0.05 level among soil depths for the same altitudes, and different capitals above the bars mean significant difference at the p < 0.05 level among different altitudes in whole profile. Similarly below.
3.1.2. Characteristics of Changes in Soil Exchangeable Acidity (Exchangeable Aluminum and Exchangeable Hydrogen) in Tea Gardens
The content of exchangeable acidity ranged from 0.61 cmol/kg to 7.29 cmol/kg, with the ranges of exchangeable aluminum and exchangeable hydrogen being 0.36~5.52 cmol/kg and 0.17~0.85 cmol/kg, respectively. All three decreased gradually with increasing soil depth. In this study, we characterized the acidification intensity of surface soil in tea gardens at different elevations by differences in pH and exchangeable acidity (ΔpH, ΔEA) between the surface layer (0–20 cm) and the deep layer (80–100 cm). The results (Table 2) indicated that both ΔpH and ΔEA were largest at the mountain foot, slightly lower at the mountaintop, and smallest on the mountainside, showing an overall elevation-dependent pattern of surface acidification intensity of 107 m > 711 m > 400 m. The EAl/EA in the deep soil layer reached 80.61%, 77.42%, and 80.10%, respectively. This indicated that there was a significant latent acid accumulation phenomenon in the deep soil of Lushan tea gardens, with soil acidification continuously spreading from the surface layer to the deeper layers, among which the trend of acidification spreading at the mountain foot was the most obvious.
Table 2.
Differences in ΔpH and ΔEA in the tea garden soil.
3.1.3. Acid–Base Buffering Capacity of Tea Garden Soil
As shown in Figure 4, the soil acid–base buffering curves of soil layers in tea gardens at all altitudes exhibited typical S-shaped segmented variations, with two obvious inflection points in each curve. The amount of acid or alkali added to reach the inflection points differs among soil layers at the same altitude, indicating that the buffering capacity of tea soil at the same altitude varies significantly with soil-layer depth. The steepness of the soil buffering curve was negatively correlated with its pH buffering capacity. Comparison of the curves across different soil layers showed that the 0–20 cm surface soil exhibits a significantly gentler variation in its buffering curve than the 80–100 cm deep soil, indicating that the overall acid–base buffering performance of the surface soil in tea gardens was superior to that of the subsurface soil.
Figure 4.
Integrated titration curve determined by acid and alkali addition of tea garden soil at different altitudes. Note: Positive values represent the alkali amount, while negative values represent the acid amount.
Soil base buffering capacity in tea gardens at different elevations generally ranged from 15.55 to 27.78 mmol/kg (Table 3). Along the elevation gradient, overall soil pHBC followed the trend 107 m < 400 m < 711 m, indicating increasing buffering capacity with increasing elevation. Along the vertical profile, pHBC in tea gardens at all three elevations decreased significantly with soil depth, with noticeable differences between layers. Overall, the 0–20 cm surface soils of tea gardens at all elevations had significantly higher acid–base buffering capacity, further demonstrating that the deep soils of Lushan tea gardens had weaker acid–base buffering performance and lower resistance to external acid–base disturbances.
Table 3.
The linear fitting equation and acid–base buffer capacity of the buffer curve of tea garden soil profile at different altitudes.
3.2. Cation-Exchange Capacity and Base Ions of Tea Garden Soil
There were no significant differences in soil cation-exchange capacity at different altitudes and different soil depths (Table 4). At the mountain foot and on the mountainside, the CEC of the surface 0–20 cm soil was 15.45% and 18.00% lower, respectively, than that of the deep 80–100 cm layer, whereas at the mountaintop, the surface 0–20 cm soil CEC was 6.30% higher than that of the deep 80–100 cm layer. Ca2+, Mg2+, K+, and Na+ at both the foot and the top of the mountain gradually decreased with increasing soil depth, with significant differences generally observed between the surface 0–20 cm and deep 80–100 cm. On the mountainside, Ca2+ and Mg2+ gradually increased with soil depth, while K+ and Na+ gradually decreased, showing significant differences between the surface 0–20 cm and deep 80–100 cm. BS showed no overall significant differences across soil depths; however, the surface 0–20 cm and deep 80–100 cm base saturation in tea gardens at all three altitudes differed significantly (p < 0.01).
Table 4.
Statistics on the mean content of exchangeable salt-based ions in tea plantations.
3.3. Characteristics of Changes in Soil Organic Matter and Nitrogen, Phosphorus, and Potassium in Tea Garden Soils
3.3.1. Soil Organic Matter Distribution Characteristics of Tea Garden Soils
Soil organic matter in the tea gardens was 5.41~42.92 g/kg (Figure 5). Both altitude and depth had highly significant effects on SOM (p < 0.01), and they interacted significantly (p < 0.01). SOM content differed significantly across elevations, with an overall trend of 711 m (27.67 g/kg) > 107 m (16.24 g/kg) > 400 m (10.80 g/kg). In the vertical soil profile direction, the average SOM content of each soil layer decreases with increasing soil depth, with the contents of each layer as follows: 0–20 cm (34.94 g/kg) > 20–40 cm (19.45 g/kg) > 40–60 cm (16.67 g/kg) > 60–80 cm (11.15 g/kg) > 80–100 cm (8.98 g/kg); showing a decreasing trend with increasing depth. Examined by elevation, the SOM content of tea gardens at the foot, middle, and top of the mountain all showed a clear surface aggregation characteristic, continuously decreasing with increasing soil depth, and the 0–20 cm SOM content was significantly higher.
Figure 5.
Soil organic matter of tea garden profiles at different altitudes. Note: Different lowercases above the bars mean significant difference at the p < 0.05 level among soil depths for the same altitudes, and different capitals above the bars mean significant difference at the p < 0.05 level among different altitudes.
3.3.2. Nitrogen Distribution Characteristics of Tea Garden Soils
Total nitrogen was 0.32~7.72 g/kg (Figure 6a). Both altitude and depth had a highly significant effect on total soil nitrogen (p < 0.01), while their interaction was not significant (p > 0.01). TN differs significantly across elevations, ranking as 400 m (1.05 g/kg) > 107 m (0.91 g/kg) > 711 m (0.81 g/kg). Among them, the TN content on the mountainside differs significantly from that at both the mountain foot and mountaintop. In the vertical soil profile, the average TN content of each soil layer follows the trend 0–20 cm (1.36 g/kg) > 20–40 cm (1.17 g/kg) > 40–60 cm (0.86 g/kg) > 60–80 cm (0.74 g/kg) > 80–100 cm (0.49 g/kg); overall showing a decreasing trend with increasing soil depth.
Figure 6.
Soil nitrogen of tea garden profiles atr different altitudes. Note: different lowercases above the bars mean significant difference at the p < 0.05 level among soil depths for the same altitude, and different capitals above the bars mean significant difference at the p < 0.05 level among different altitudes; (a) Soil total nitrogen of tea garden profiles at different altitudes; (b) Soil alkaline-hydrolyzable nitrogen of tea garden profiles at different altitudes.
Alkaline-hydrolyzable nitrogen in the tea garden soils is 15.62~59.22 mg/kg (Figure 6b). Both altitude and depth have extremely significant effects on AN (p < 0.01), while their interaction is not significant (p > 0.01). Overall, the average content of AN followed the order 107 m (108.66 mg/kg) > 400 m (102.43 mg/kg) > 711 m (101.07 mg/kg), with a significant difference between the mountain foot and the mountaintop. The vertical profile distribution shows that the average content of AN was 0–20 cm (130.55 mg/kg) > 20–40 cm (113.21 mg/kg) > 40–60 cm (98.66 mg/kg) > 60–80 cm (91.76 mg/kg) > 80–100 cm (85.90 mg/kg). Overall, the nitrogen content in the tea garden soils decreased with increasing soil depth, showing a clear feature of surface enrichment.
3.3.3. Phosphorus Distribution Characteristics in Tea Garden Soils
Total phosphorus was 0.18–0.55 g/kg (Figure 7a). Both altitude and depth had a highly significant effect (p < 0.01), whereas their interaction was not significant (p > 0.01). There were significant differences in TP, showing a trend of 711 m (0.40 g/kg) > 400 m (0.37 g/kg) > 107 m (0.25 g/kg), among which the TP content on the mountainside exhibited significant differences compared to both that of the mountain foot and mountaintop. In the vertical soil profile, TP content in the tea gardens first increased and then decreased with increasing soil layer depth, peaking in the 20–60 cm soil layer at an average of 0.34 g/kg.
Figure 7.
Soil phosphorus of tea garden profiles at different altitudes. Note: different lowercases above the bars mean significant difference at the p < 0.05 level among soil depths for the same altitude, and different capitals above the bars mean significant difference at the p < 0.05 level among different altitudes; (a) Soil total phosphorus of tea garden profiles at different altitudes; (b) Soil available phosphorus of tea garden profiles at different altitudes.
Available phosphorus in the tea garden soils ranged from 3.41 to 15.53 mg/kg (Figure 7b). Both altitude and depth (S) had extremely significant effects (p < 0.01), while their interaction was not significant (p > 0.01). Overall, average AP content in the tea garden soils followed the order 107 m (5.08 mg/kg) > 400 m (5.99 mg/kg) > 711 m (8.90 mg/kg), with significant differences among the three altitudes. Vertically, AP in the tea garden soils showed a trend of first increasing and then decreasing, before increasing again with soil depth, peaking at 40–60 cm (6.38 mg/kg). Overall, soil phosphorus in the tea garden soils showed a distribution characteristic of enrichment in the surface layer and decreasing levels in the lower layers with increasing soil depth.
3.3.4. Potassium Distribution Characteristics of Tea Garden Soils
Total potassium in the tea garden soils ranged from 9.90 to 19.28 g/kg (Figure 8a). Altitude had a highly significant effect (p < 0.01), while depth did not have a significant effect (p > 0.01), and their interaction was not significant (p > 0.01). TK content differs significantly among tea gardens at different elevations, showing an overall trend of 400 m (15.59 g/kg) > 711 m (13.57 g/kg) > 107 m (13.29 g/kg). The TK content at the mountainside level was significantly different from that at the mountain foot and mountain top. In the vertical profile, the average TK content in each soil layer followed the trend 0–20 cm (13.51 g/kg) < 20–40 cm (13.72 g/kg) < 40–60 cm (14.25 g/kg) < 60–80 cm (14.54 g/kg) < 80–100 cm (14.66 g/kg), generally showing a gradual increase with soil depth.
Figure 8.
Soil potassium of tea garden profiles at different altitudes. Note: different lowercases above the bars mean significant difference at the p < 0.05 level among soil depths for the same altitude, and different capitals above the bars mean significant difference at the p < 0.05 level among different altitudes; (a) Soil total potassium of tea garden profiles at different altitudes; (b) Soil available potassium of tea garden profiles at different altitudes.
Available potassium in the tea garden soils was 43.99~70.17 mg/kg (Figure 8b). Both altitude and depth had extremely significant effects (p < 0.01), and their interaction was significant (p < 0.01). AK content differed significantly at different altitudes, following the trend 107 m (46.92 mg/kg) < 400 m (51.58 mg/kg) < 711 m (59.25 mg/kg). Along the vertical profile, the average content of AK in each soil layer was 0–20 cm (58.56 mg/kg) > 20–40 cm (52.72 mg/kg) > 40–60 cm (50.84 mg/kg) > 60–80 cm (50.43 mg/kg) > 80–100 cm (50.38 mg/kg), showing a continuous decreasing trend with increasing soil depth. Considering the overall distribution characteristics of soil potassium, TK content increased with soil depth, whereas AK showed a clear surface enrichment pattern and gradually decreased with increasing soil depth.
3.4. Analysis of the Chemical Properties of Tea Garden Soil
3.4.1. The Relationships Between Tea Garden Soil pH and Exchangeable Acidity (EA, EAl, and EH) and Exchangeable Bases
As shown in Table 5, linear regressions were performed between tea garden soil pH and exchangeable acidity, including total exchangeable acidity (EA), exchangeable aluminum (EAl), and exchangeable hydrogen (EH). The results indicated that soil pH was extremely significantly negatively correlated with EA and EAl ( = 0.4 **, = 0.39 **, n = 105), whereas pH showed no significant correlation with EH. This suggested that the soil pH in the study area’s tea gardens was primarily constrained by the content of EA, with EAl being the dominant component of soil EA, confirming that the acidification process of tea garden soil was closely related to the EAl content. Further regression analysis of soil pH, Base Saturation (TEB/CEC), and exchangeable acid saturation (EA/CEC) revealed that soil pH fit a logarithmic model with both BS and EAS. Specifically, soil pH and BS (y = 0.43ln(x) − 0.27, R2 = 0.99 **) and EAS (y = −1.32ln(x) + 2.23, R2 = 0.41) followed a logarithmic relationship, indicating that soil pH was closely related to BS, and their relationship was not linear.
Table 5.
Correlation of pH with exchangeable acidity (EA, EAl, and EH) and exchangeable base of tea garden soils.
Correlation analysis between tea garden soil pH and exchangeable base ions (Table 6) showed that tea garden soil pH was extremely significantly correlated with Ca2+ (p < 0.01), significantly correlated with Mg2+ (p < 0.05), and not significantly correlated with K+ or Na+. Therefore, soil acidification in the study area’s tea gardens was primarily driven by EAl, rather than the accumulation of EH in the soil. Among the base ions, the loss of Ca2+ and Mg2+ was the main reason for the decrease in soil base saturation and the aggravation of soil acidification, whereas K+ and Na+ had relatively minor effects on the soil acidification process, and these effects were not significant.
Table 6.
Correlation of pH and exchangeable base cations of tea garden soils.
3.4.2. Correlation Between Soil pH and Soil Nutrients in Tea Gardens
Figure 9 shows that different soil nutrients have significant differences in their effects on soil pH. Among them, soil pH in tea gardens was significantly negatively correlated with SOM, extremely significantly negatively correlated with TN and AN (p < 0.01), and significantly positively correlated with TK (p < 0.05), while the remaining nutrient indicators showed no significant correlations with soil pH.
Figure 9.
Heatmap showing the correlation between pH and major nutrients. Note: * p ≤ 0.05; ** p ≤ 0.01; *** p ≤ 0.001.
3.4.3. The Pathways of Soil Nutrients Affect pH
Based on the results of the correlation analysis, eight indicators that were significantly associated with soil pH—EA, EAl, Ca2+, Mg2+, SOM, TN, AN, and TK—were selected to construct a structural equation model to further investigate the driving mechanisms of soil nutrients, acidifying factors, and base cations on soil acidification. The model’s goodness of fit (GoF) was 0.587 (Figure 10), indicating overall good fit and effectively explaining the regulatory pathways of soil pH. SOM, TK, and base cations (Ca2+ and Mg2+) showed direct positive effects on pH, whereas soil nitrogen (TN, AN) and acidifying factors (EA, EAl) exhibited direct negative effects. This indicated that the influence of soil nutrients on pH was not unidirectional but resulted from the combined action of both positive and negative effects.
Figure 10.
Structural equation model of major nutrients affecting soil pH. Note: The green boxes represent independent variables, the orange boxes represent mediating variables, and the yellow boxes represent dependent variables; red indicates positive paths, blue indicates negative paths, and the thickness of the lines represents the magnitude of significance.
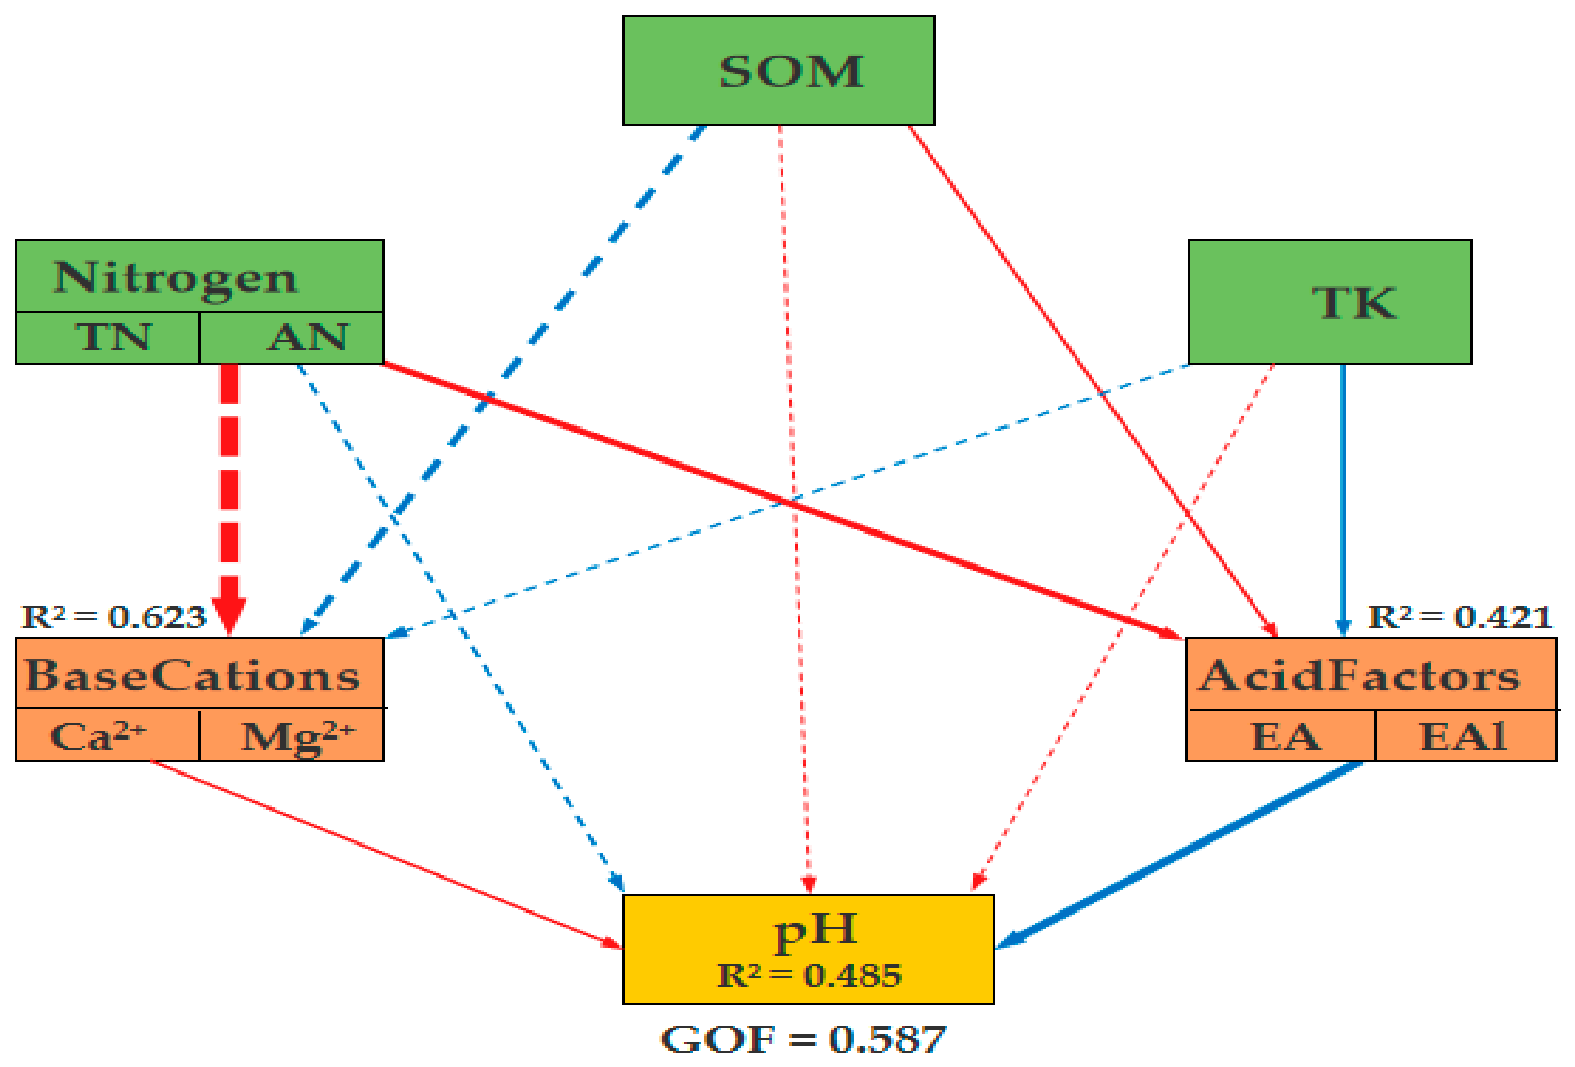
Path analysis was conducted on the structural equation model (Table 7). In terms of direct effects, soil organic matter (SOM, path coefficient = 0.150) and total potassium (TK, 0.014) had positive effects on pH, whereas total nitrogen (TN, −0.262) and available nitrogen (AN, −0.096) had negative effects. However, none of these four direct effects reached statistical significance (p > 0.05). Regarding indirect effects, each nutrient factor influenced pH indirectly through four pathways mediated by exchangeable calcium, exchangeable magnesium, exchangeable acidity, and exchangeable aluminum. Among these, the indirect effects of SOM (−0.117), TN (−0.209), and TK (0.109) were largest in absolute magnitude through the exchangeable acidity pathway, whereas the indirect effect of AN (−0.047) was largest in absolute magnitude through the exchangeable calcium pathway. The total effect of each factor was calculated as the sum of its direct effect and all indirect effects. The resulting total effects on soil pH were ranked as TN (0.549) > SOM (0.319) > TK (0.247) > AN (0.156). The total effect of TN was approximately 1.7 times that of SOM, 2.2 times that of TK, and 3.5 times that of AN, substantially exceeding the other three factors. Overall, the total effect analysis indicates that excessive nitrogen accumulation is the dominant nutrient factor driving soil acidification in the Lushan tea plantations.
Table 7.
Standardized path coefficients of major nutrients affecting soil pH.
4. Discussion
4.1. Characteristics of Soil Acidification in Tea Gardens
Soil acidification is a common problem in tea gardens across China. Tea gardens in Jiangxi are mostly distributed in red-soil areas, and the high-temperature, high-rainfall climate leads to intense weathering of red soils [37]. The decomposition of silicate minerals and the mineralization of organic matter are significant, making base ions such as Ca2+, Mg2+, K+, and Na+ highly prone to leaching and loss. This results in a continuous decrease in soil base saturation, ultimately causing the upper layer of the weathered soil to exhibit acidic characteristics [38]. The results of this study indicated that the overall soil pH in Lushan tea gardens was relatively low, at a strongly acidic level, and the degree of soil acidification showed a clear altitudinal differentiation, specifically with the strongest acidification at the mountain foot, followed by at the mountaintop, and relatively weakest on the mountainside (Figure 3). This distribution pattern differs from the research conclusion proposed by Yan et al. [7], which stated that ‘with increasing altitude, the degree of soil acidification decreases.’ This difference is mainly related to variations in soil-forming environments, soil physicochemical properties, and the intensity of human disturbance across altitudinal ranges. The most severe acidification at the mountain foot was attributable to its low elevation and gentle terrain, which favor warmer and wetter conditions and prolonged intensive cultivation. Under such conditions, organic matter mineralization and nitrification proceed vigorously, so that each unit of nitrogen input generates more H+ and readily leachable NO3− [39]. Meanwhile, the red soil at the mountain foot was deeply developed and strongly leached, with its basic ions nearly depleted and its acid–base buffering capacity at its weakest. The continuous input of exogenous acidic substances further accelerates soil acidification [40]. The mountainside soil was yellow–red soil, a transitional type between red and yellow soil, with clay minerals dominated by 2:1 minerals such as vermiculite and montmorillonite, which had a relatively high number of interlayer negative charges, providing strong adsorption and fixation capacity for H+ from acid deposition and exchangeable Al3+. Meanwhile, the water and heat conditions at this altitude were suitable, soil leaching intensity was moderate, and the weathering rate of primary minerals was stable, allowing the sustained release of basic ions such as Ca2+ and Mg2+ to buffer soil acidification [40]. This study also found that Ca2+ and Mg2+ content in deep hillside soil was higher than in surface soil, showing significant differences in vertical distribution compared with the mountain foot and mountain top areas (Table 4) and further confirming that mountainside soil had stronger acid-buffering capacity. The mountainous yellow soil at the mountaintop was less affected by human disturbance; however, the high-moisture environment intensifies soil base leaching, and low temperatures inhibit the mineralization of soil organic matter and the weathering of minerals. The parent materials released base ions weakly, and base saturation was relatively low; therefore, mountaintop soil acidification remains a prominent issue [6].
In the vertical profile, the pH of the tea garden soils on Mount Lu increased with depth, and acidification of the surface soil was significantly stronger than that of the deeper layers (Figure 3). This vertical distribution pattern was highly consistent with that reported for typical tea plantations in Guizhou Province, southwest China, both showing a spatial pattern in which soil pH was lowest at the surface and increased with depth [41]. The agreement between them indicates that the surface-enriched acidification pattern is a general feature of tea plantations rather than a local peculiarity of Mount Lu. This pattern is mainly caused by the long-term anthropogenic disturbance of the surface soil in the tea gardens, the continuous application of physiologically acidic fertilizers, the acidification resulting from the decomposition of tea litter, and atmospheric acid deposition. These drivers act predominantly at or near the soil surface, leading to a large accumulation of H+ in the topsoil and consequently to more severe acidification there [42]. The H+ accumulated in the surface layer is, however, not permanently retained there. With rainfall leaching, part of the H+ migrates downward with percolating water to deeper soil layers over time, which explains why acidification in these profiles was not confined to the surface but gradually spread downwards—consistent with the substantial potential acidity (EAl/EA accounting for 77–81%) that we observed in the deeper layers. According to soil chemistry theory, when soil pH falls below 5.0, a large amount of adsorbed H+ reacts with the soil mineral lattice, causing aluminium in the lattice to dissociate and be released as the much more active Al3+; the subsequent hydrolysis of this Al3+ releases further H+, so that activated aluminium becomes the main source of soil potential acidity [43,44]. When the EAl/EA exceeds 75%, this indicates that the soil buffering system has shifted from being “dominantly controlled by exchangeable H+” to “dominantly controlled by exchangeable Al3+”—an important marker that acidification had entered an “irreversible stage.” The hydrolysis reaction of aluminum ions (Al3+ + H2O → Al(OH)2+ + H+) continuously releases protons, forming a positive feedback loop of acidification that further solidifies soil acidity. Therefore, even if subsequent amelioration measures alleviate surface soil acidification, the deep soil aluminum acid pool can still diffuse upward to the upper soil layers through soil water movement and absorption and conduction by tea roots, posing a potential risk of continuously exacerbating the acidification of tea plantation soils [45,46].
Soil acid–base buffering capacity is a key indicator of the soil’s resistance to acid–base fluctuations and helps predict trends in soil acidification [47]. In the study area, surface soil exhibited a significantly higher buffering capacity than deep soil (Table 3). Although the surface soil was the most acidified (lowest pH), its organic matter content was significantly higher than that of the deeper soil layers (Figure 5). Soil organic matter is one of the main factors influencing the pHBC of acidic soils, providing abundant negative charge sites that enhance the soil’s adsorption and buffering capacity for H+ and Al3+ [45,47,48]. In contrast, the deep soil (80–100 cm) has a relatively higher pH but a lower pHBC, making its acid resistance extremely fragile. Once acidic substances accumulate in the surface soil and leach down with rainfall, exceeding the migration threshold to penetrate deeper soil layers, the deep soil, lacking sufficient buffering materials, struggles to neutralize the external acidic substances. This can lead to a rapid decline in soil pH, which in turn triggers the substantial release of exchangeable aluminum, exacerbating acidification in deep soil [48]. The content of exchangeable base cations (Ca2+, Mg2+, K+, Na+) in the soils of the tea gardens in the study area generally decreased with increasing soil depth. This vertical distribution characteristic differs from the findings of Zhao et al. [31] and can be explained as follows: (1) The soils at all three experimental sites have developed from granite weathering residues and Quaternary red clay, forming highly permeable, strongly weathered acidic soils (Acrisols in the WRB). Owing to their high permeability and the intense leaching under the humid subtropical monsoon climate, exchangeable base cations are readily leached out of the soil body with percolating water; moreover, because the strongly weathered profiles contain few weatherable primary minerals, the replenishment of base cations to the deeper layers is insufficient [17,37]. (2) The soil organic matter content decreases along the profile from surface to deep, continuously weakening the soil’s ability to retain base ions. Consequently, deep soils inherit the parent material’s relatively low base-ion content, ultimately forming a distribution pattern of surface enrichment and deep deficiency of base ions [49]. Correlation analysis indicated that soil pH in the tea gardens was extremely significantly correlated with EA, EAl, BS, and Ca2+, and significantly correlated with Mg2+, indicating that soil acidification was mainly regulated jointly by EA, EAl, and the content of Ca2+ and Mg2+ base ions. This conclusion was consistent with that of Wu et al. [43] on soil acidification in tea gardens.
4.2. Characteristics of Nutrients in Tea Garden Soil
The nutrient content of tea garden soil determines the growth quality of tea plants. In the profiles of red soil, mountain yellow–red soil, and mountain yellow soil developed from granite weathering residues and Quaternary red clay, the surface enrichment of organic matter is the core reason for the surface accumulation of nitrogen, phosphorus, and potassium nutrients. The clay minerals of red soil and mountain yellow soil are dominated by kaolinite and Fe/Al oxides, which have a weak capacity to retain nutrients. In contrast, organic matter provides numerous exchange sites through its abundant functional groups and serves as the primary carrier of nitrogen, phosphorus, and potassium nutrients, while organic matter accumulation directly determines the nitrogen supply potential [46,50,51]. Organic matter is mainly concentrated in the surface tillage layer through anthropogenic fertilization management, continuously supplying large amounts of carbon and nitrogen nutrients to the surface soil. Meanwhile, tea plant litter, root residues, and root exudates are primarily returned to the surface soil, continuously replenishing organic carbon, nitrogen, and other nutrients, thereby promoting the continuous accumulation of nutrients in the surface layer [41,52]. In addition, surface soil has high microbial biomass carbon and nitrogen content and strong soil enzyme activity; high microbial metabolic activity can accelerate the mineralization and decomposition of soil organic matter, releasing substantial amounts of alkaline-hydrolyzable nitrogen and further enriching carbon and nitrogen in the surface layer. As soil depth increases, the input of external organic materials sharply decreases, soil water and heat conditions and aeration worsen, microbial activity significantly declines, and the rate of organic matter decomposition and transformation is greatly reduced. The nutrient supply capacity is far below that of the surface layer, ultimately leading to a significant decrease in organic matter and nitrogen content in the deeper soil layers as depth increases [14,19,53].
Although TP and AP in the tea garden soils of the study area fluctuated along the vertical profile, overall, they showed a surface enrichment pattern. This distribution feature was mainly related to the low mobility of soil phosphorus and the field fertilization practices in tea gardens. The red soils in Jiangxi tea gardens are rich in iron and aluminum oxides. After phosphorus fertilizers are applied to the topsoil, water-soluble phosphate ions readily react with soil iron and aluminum oxides and clay minerals to form adsorbed or insoluble phosphorus, which greatly reduces phosphorus mobility and makes it difficult for it to leach into deeper soil layers. Meanwhile, the vigorous mineralization and decomposition of organic matter in the topsoil can continuously release available phosphorus [54,55]. Additionally, the concentration of tea roots in the topsoil and biological cycling from returning fallen leaves to the soil further promote phosphorus accumulation in the topsoil, resulting in a typical surface-enriched vertical distribution pattern for both TP and AP. This result was consistent with the survey conclusions of Lin et al. [56] regarding 372 typical tea gardens in Jiangxi Province, where soil organic matter, nitrogen, and phosphorus continued to accumulate as the tea garden aged, and the enrichment effect of nutrients in the topsoil was particularly significant.
In the study area, the AK and TK in tea garden soils exhibited completely opposite vertical distribution patterns. AK was enriched in the surface layer and relatively low in the deeper layers, whereas TK showed the opposite characteristics. AK mainly comprises water-soluble and exchangeable K, and its content and distribution are primarily regulated by short-term field fertilization, organic matter mineralization and decomposition, and soil biological cycling processes [57]. In tea gardens, potassium fertilizers are mostly applied to the surface tillage layer, and organic matter mineralization in the surface soil can continuously release potassium ions. In addition, the recycling of surface nutrients driven by tea leaf litter return and root exudates jointly promotes significant AK enrichment in the 0–20 cm soil layer. However, long-term soil acidification accelerates the leaching and loss of potassium ions from the soil, making surface-layer AK enrichment relatively unstable and fragile [58,59]. Unlike AK, soil TK exists in a mineral form, primarily in primary aluminosilicate minerals such as mica and feldspar, and its content is mainly determined by parent material, degree of weathering, and leaching intensity [60,61]. In the high-temperature, high-rainfall, and acidified soil environment of Lushan, the surface soil is subjected to prolonged acidification and complexation with organic acids, causing continuous release of large amounts of mineral potassium from weathering of potassium-containing primary minerals. K+ migrates to deeper layers under precipitation and anion leaching [62,63]. Compared with the surface layer, the soil at a depth of 80–100 cm exhibited weaker weathering and retained a substantial amount of primary potassium-containing minerals, resulting in relatively higher TK content.
In this study, correlation analysis confirmed that tea garden SOM, TK, and AK were extremely significantly negatively correlated with soil pH. Research by Lin et al. [17] found that when the average annual soil pH in tea gardens decreased by 0.031 units per year, the contents of TN, AN, and AP in the soil increased annually by 0.029 g/kg, 2.89 mg/kg, and 2.86 mg/kg, respectively. Overall, soil acidification in tea gardens not only directly leads to the leaching of base ions and reduced soil base saturation but also significantly alters the migration and transformation processes and bioavailability of nutrients such as organic matter, nitrogen, and phosphorus, interfering with the normal absorption and utilization of soil nutrients by tea plants, ultimately affecting both the growth and development of tea plants and the fertility and quality of tea garden soils [47].
4.3. The Pathways of Soil Nutrients in Tea Plantations Affect pH
A complex coupling relationship exists between soil acidification and nutrient status [17,64]. Soil acidification in tea plantations is a critical environmental issue that restricts the sustainable development of tea, characterized by the continuous accumulation of H+ in the soil solution, while the dynamic balance of soil nutrient pools plays a key regulatory role in the process of soil acidification [65].
Organic matter exerts a bidirectional regulatory effect on the pH of tea garden soils, with both a direct positive and an indirect negative impact (Table 7). Through the positive pathway (path coefficient 0.150), organic matter is rich in alkaline functional groups that can form complexes with ions such as Al3+ and H+, effectively reducing the activity and availability of exchangeable acids and directly alleviating soil acidity. Meanwhile, long-term application of organic fertilizers is accompanied by the continuous return and replenishment of base cations such as Ca2+, Mg2+, and K+, significantly increasing soil base saturation, enhancing the soil’s pHBC, and effectively mitigating soil acidification [1,32]. However, the acidification pathway driven by organic matter should not be overlooked. SOM indirectly affected pH negatively by increasing EA content (−0.117). The possible reasons for this phenomenon are as follows: (1) When the C/N ratio of organic fertilizers was relatively low, the decomposition rate of materials was fast and the mineralization intensity was high, and the acidifying effect generated significantly exceeds the acid–base buffering effect of the organic colloids themselves, overall showing an acidification-promoting effect [66,67]; (2) Low-molecular-weight organic acids (such as oxalic acid, citric acid, and malic acid) secreted by tea garden litter and roots can promote mineral weathering, causing previously fixed aluminum in the soil to dissolve, thereby leading to a decrease in soil pH [68]. These positive and negative pathways counterbalanced each other, ultimately resulting in an insignificant direct effect of organic matter on pH regulation. Therefore, increasing the application of organic materials did not always mitigate acidification; the net effect depended on the material’s C/N ratio and decomposition stage. Organic materials with a high C/N ratio can effectively slow down acidification by inhibiting nitrification, whereas materials with a low C/N ratio may exacerbate the decline in acidity by promoting nitrification [42]. The practical application of organic conditioners in the Lushan tea gardens also confirmed this pattern. Although organic conditioners such as rapeseed cake fertilizer could slow acidification, their effectiveness was strongly influenced by application rate and duration [68].
Nitrogen is a key nutrient factor driving soil acidification in tea gardens [38,41,68]. The most commonly used nitrogen fertilizer in tea garden management is urea. When urea is applied to the soil, it hydrolyzes into ammonium nitrogen, which is unstable, rapidly nitrified, and releases hydrogen ions. In this study, both TN and AN showed a negative direct effect on pH (path coefficients −0.262 and −0.096, respectively). This result was consistent with long-standing research conclusions that nitrogen fertilizer application leads to soil acidification [69,70]. The intrinsic mechanism of this phenomenon is mainly related to the ammonium preference of tea plants and the consequent rhizosphere proton release: tea plants prefer to absorb ammonium nitrogen. During absorption, their roots release H+ into the rhizosphere to maintain charge balance, thereby exacerbating rhizosphere acidification [71]. In addition, excessive nitrogen fertilizer application leads to large NH4+ accumulation in the soil, forming micro-areas of cation accumulation, disrupting soil aggregate structure, and promoting leaching of soil base ions (Ca2+, Mg2+, etc.), resulting in soil acidification [43]. This study also revealed two key indirect pathways through which nitrogen affects pH: (1) TN could indirectly reduce soil pH by positively increasing soil EA content (−0.209). This indicates that long-term excessive nitrogen input triggers nitrification reactions that continuously release H+, activate soil Al3+, and increase the reserve of EA [46]. This finding supports Guo et al.’s [72] view that excessive nitrogen fertilizer application is the primary cause of soil acidification in Chinese farmland. (2) AN reduces soil pH by consuming Ca2+ (−0.047). Nitrogen leaching is accompanied by the loss of Ca2+, reducing soil base saturation, weakening soil acid–base buffering capacity, and further exacerbating acidification [73]. This corresponds with Li et al.’s [74] finding that soil acidification in tea plantations can extend to a depth of 120 cm, accompanied by base-ion depletion.
The direct positive path coefficient of TK on soil pH was only 0.014, indicating a weak direct effect; however, a significant positive indirect pathway exists, whereby soil pH increases through reduced EA content, with an indirect path coefficient of 0.109. TK’s contribution to pH mainly arises from this indirect process. Most potassium was in the structural form, with a low proportion of AK, so the TK content cannot directly alter soil acid–base reactions. Its indirect positive mechanism was primarily reflected in the colloid exchange process of base cations: as a basic cation, an increase in the total potassium pool can enhance base-cation saturation on colloid surfaces. Simultaneously, K+ competes with H+/Al3+ at colloid sites, and K+ saturation at exchange sites can inhibit the hydrolysis of Al3+ that produces H+, thereby mitigating soil acidification and indirectly increasing pH [75,76].
Therefore, in the precise improvement and core nutrient management of acidified tea gardens, it is recommended to scientifically reduce and control the input of nitrogen fertilizer and organic fertilizer, and to abandon the fertilization pattern of high nitrogen and low potassium.
4.4. Suggestion
Based on the nutrient-driven acidification patterns identified in this study, we recommend reducing nitrogen application from the conventional N 300 kg ha−1 to 150–200 kg ha−1 for tea gardens with pH below 4.5, while increasing K2O application to 150–200 kg ha−1 and adjusting the N:K2O ratio from 2:1 to approximately 1.5:1. Organic fertilizer should be applied once as basal fertilizer in autumn at 150–200 kg ha−1, mixed with soil amendments where possible. From a soil quality perspective, the mountainside (400 m) showed a more balanced acid–base status and nutrient availability, suggesting it may be the most suitable elevation for tea cultivation. For sloping tea gardens, maintaining drip irrigation and effective drainage is recommended to reduce surface runoff and base cation leaching. These measures can help mitigate soil acidification while sustaining tea yield and quality in the Mount Lu region. These recommendations are supported by current policy: both provincial and local programs fund acid-soil amelioration, drip irrigation, drainage, and ecological tea-garden construction, giving growers a practical implementation pathway [77,78].
5. Conclusions
- (1)
- Overall, the soils of the tea gardens of Mount Lu exhibit strongly acidic conditions (pH 3.86–5.46); among them, those at the mountain foot and the surface layer (0–20 cm) had the lowest pH values, with the most severe acidification. The EAl/EA in the deep soil of tea gardens at three different heights, namely mountain foot, mountainside, and mountaintop, was 80.61%, 77.42%, and 80.10%, respectively, indicating severe potential acid accumulation, with the trend of acidification spreading most obviously at the mountain foot. The mountaintop and the surface layer exhibited the strongest resistance to acid–base disturbances.
- (2)
- The CEC and base cations (Ca2+, Mg2+, K+, and Na+) generally decreased gradually with increasing soil depth; the BS in the surface layer was 47.12% higher than that in the deeper layer. The contents of SOM, TN, AN, TP, AP, and AK in the tea garden soils exhibited a surface-concentrated nutrient pattern, whereas TK showed the opposite pattern, being enriched in the deeper layer.
- (3)
- Tea garden soil pH was extremely significantly negatively correlated with EA, EAl, SOM, TN, and AN, while it had a significant positive relationship with Ca2+, Mg2+, and TK. Using a structural equation model, the direct effect path coefficients of SOM, TN, AN, and TK on pH were 0.150, 0.014, −0.262, and −0.096, respectively. Among the indirect effects, SOM, TN, and TK affected pH through their influence on EA, with path coefficients of −0.117, −0.209, and 0.109, respectively, while AN affected pH via its influence on Ca2+, with a path coefficient of −0.047. The magnitude of nutrient effects on soil pH was ranked as TN (0.549) > SOM (0.319) > TK (0.247) > AN (0.156). The total effect of TN was approximately 1.7 times that of SOM, 2.2 times that of TK, and 3.5 times that of AN, substantially exceeding the other three factors. Overall, nitrogen accumulation was the primary driver of soil acidification in tea gardens.
Author Contributions
Conceptualization, X.Z. and J.W.; Methodology, X.Z.; Software, X.L.; Validation, X.Z.; Data curation, X.Z.; Writing—original draft, X.Z.; Writing—review and editing, X.Z., X.L., and J.W.; Supervision, X.L. and J.W.; Funding acquisition, X.Z. All authors have read and agreed to the published version of the manuscript.
Funding
This project was funded by the Jiangxi Provincial Department of Education (Grant No. 9020311449), under the project title “Research on the Characteristics of Soil Profile Acidity in Mountainous Tea Gardens—A Case Study of Lushan Tea Garden”.
Data Availability Statement
The data presented in this study are available upon request from the corresponding author.
Conflicts of Interest
The authors declare no conflicts of interest. All authors have contributed to, reviewed, and approved this submission.
Abbreviations
The following abbreviations are used in this manuscript:
| EA | Exchangeable acidity |
| EAl | Exchangeable aluminum |
| EH | Exchangeable hydrogen |
| pHBC | Acid–base buffer capacity |
| CEC | Cation exchange capacity |
| BS | Base Saturation |
| EAS | Exchangeable acid saturation |
| TEB | Total exchangeable base saturation |
| Ca2+ | Exchangeable calcium |
| Mg2+ | Exchangeable magnesium |
| K+ | Exchangeable potassium |
| Na+ | Exchangeable sodium |
| SOM | Soil organic matter |
| TN | Total nitrogen |
| AN | Alkaline-hydrolyzable nitrogen |
| TP | Total phosphorus |
| AP | Available phosphorus |
| TK | Total potassium |
| AK | Available potassium |
References
- FAO (Food and Agriculture Organization of the United Nations) and CAAS (Chinese Academy of Agricultureal Sciences): Carbon Neutral Tea Production in China—Three Pilot Case Studies. 2021. Available online: http://www.fao.org/3/cb4580en/cb4580en.pdf (accessed on 16 May 2023).
- NBS (National Bureau of Statistics): National Data. Available online: https://data.stats.gov.cn/easyquery.htm?cn=C01 (accessed on 5 April 2024).
- National Bureau of Statistics of China. Annual Data Table of National Tea Planting Area and outPut in 2025 [DB/OL]. (Unknown). Available online: https://data.stats.gov.cn/dg/website/page.html#/ (accessed on 31 May 2026).
- Jiujiang City Bureau of Statistics. Jiujiang Statistical Yearbook. 2025 [DB/OL]. 2026. Available online: https://www.jiujiang.gov.cn/ (accessed on 31 May 2026).
- Wang, L.X.; Shuang, Q.Y.; Wang, S.B.; Jiang, X.F. New quality productivity empowers the high-quality development of Jiangxi tea industry: Connotation significance, realistic challenges, and practical paths. Chin. J. Eco-Agric. 2025, 33, 1235–1244. [Google Scholar] [CrossRef]
- Fang, W. Acidification of Yellow Soil Tea Gardens in High-Altitude Areas and Analysis of Its Causes: A Case Study of Guadun Tea Garden. Anhui Agric. Bull. 2012, 18, 104–106. [Google Scholar]
- Yan, M.; Lin, C.; Chen, Z. Effects of Altitude and Tea Planting Years on Soil Fertility and Acidity in Tea Gardens. J. Tea Sci. 2019, 60, 27–31. [Google Scholar]
- Elser, J.J.; Brakcen, M.S.; Cleland, E.E. Global analysis of nitrogen and phosphorus limitation of primary producers in freshwater, marine and terrestrial ecosystems. Ecol. Lett. 2007, 10, 1135−1142. [Google Scholar] [CrossRef] [Scilit]
- Chen, F.S.; Nikls, K.J.; Liu, Y. Nitrogen and phosphorus additions alter nutrient dynamics but not resorption efficiencies of Chinese fir leaves and twigs differing in age. Tree Physiol. 2015, 35, 1106−1117. [Google Scholar] [CrossRef] [Scilit]
- Ruan, J.; Gerendás, J.; Härdter, R.; Sattelmacher, B. Effect of nitrogen form and root-zone pH on growth and nitrogen uptake of tea (Camellia sinensis) plants. Ann. Bot. 2007, 99, 301–310. [Google Scholar] [CrossRef] [Scilit]
- Yan, P.; Shen, C.; Fan, L. Tea planting affects soil acidification and nitrogen and phosphorus distribution in soil. Agric. Ecosyst. Environ. 2018, 254, 20–25. [Google Scholar] [CrossRef] [Scilit]
- Liao, W.Y. Soil acidification in tea plantantion and its prevention and management in China. Agro-Environ. Sci. 1998, 17, 178–180. [Google Scholar]
- Wu, X. Soil acidification in tea Plantations and its Prevention. Tea Commun. 1990, 17, 22–23. [Google Scholar]
- Yang, X.D.; Ni, K.; Shi, Z. Effects of long-term nitrogen application on soil acidification and solution chemistry of a tea plantation in China. Agric. Ecosyst. Environ. 2018, 252, 74−82. [Google Scholar] [CrossRef] [Scilit]
- Li, Y.; Liu, K.; Zhu, J. Manganese accumulation and plant physiology behavior of Camellia oleifera in response to different levels of nitrogen fertilization. Ecotox. Environ. Safe 2019, 184, 109603–109612. [Google Scholar] [CrossRef] [Scilit]
- Zhang, S.; Hu, S.; Pan, R. Research Progress on Soil Acidification in Tea Gardens. J. Tea Sci. 2019, 45, 17–23. [Google Scholar]
- Lin, C.; Chen, Z.; Wu, Y. Acidification characteristics and nutrient contents in soils of tea garden and adjacent woodland in subtropical region. J. Tea Sci. 2020, 40, 186–193. [Google Scholar]
- Yan, Y.L.; Zuo, P.; Wang, X.Y.; Wang, L.C. Distribution and suitability evaluation of the development of the foggy Tea Gardens on Lu Mountain. Nat. Prot. Areas 2025, 5, 147−158. [Google Scholar]
- Yang, P.X.; Ruan, J.Y.; Yin, X.Y. Current situation analysis of soil nutrient of main tea gardens in Jiangxi. Acta Agric. Jiangxi 2013, 25, 66–70. [Google Scholar]
- Ding, Y.; Zhang, B.L. Changes in Soil Properties and Tea Biochemical Indicators in Lushan Tea Gardens at Different Altitudes. J. Anhui Agric. Univ. 2017, 44, 959–962. [Google Scholar]
- Su, Y.; Liao, W.Y.; Wang, Y.J. Study on Nutrient Status and Soil Characteristics of Typical Mountain Tea Gardens in Anhui. Chin. Agric. Sci. Bull. 2013, 29, 205–210. [Google Scholar]
- Ruan, J.Y.; Ma, L.F.; Shi, Y.Z.; Zhang, F.S. Effects of litter incorporation and nitrogen fertilization on the contents of extractable aluminium in the rhizosphere soil of tea plant. Plant Soil 2004, 263, 283−296. [Google Scholar] [CrossRef] [Scilit]
- Oh, K.; Kato, T.; Li, Z.P.; Li, F.Y. Environmental problems from tea cultivation in Japan and a control measure using calcium cyanamide. Pedosphere 2006, 16, 770–777. [Google Scholar] [CrossRef] [Scilit]
- Alekseeva, T.; Alekseev, A.; Xu, R.K.; Zhao, A.Z.; Kalinin, P. Effect of soil acidification induced by a tea plantation on chemical and mineralogical properties of Alfisols in eastern China. Environ. Geochem. Health 2011, 33, 137–148. [Google Scholar] [CrossRef] [Scilit]
- Wang, J.M.; Lu, Z.; Wu, J.F. Characteristics and distribution patterns of soil types in Lushan. J. Jiangxi Agric. Univ. 2010, 32, 1284–1290. [Google Scholar]
- IUSS Working Group WRB. World Reference Base for Soil Resources 2014, Update 2015 International Soil Classification System for Naming Soils and Creating Legends for Soil Maps; World Soil Resources Reports No. 106; FAO: Rome, Italy, 2015. [Google Scholar]
- Bao, S.D. Soil and Agricultural Chemistry Analysis; China Agricultural Press: Beijing, China, 2000. [Google Scholar]
- Zheng, Y.W.; Chen, Y.L.; He, P. Study on Soil Acidity and Acid Buffering Capacity in Chengdu. J. Irrig. Drain. 2019, 38, 126–129. [Google Scholar]
- Xu, J.M.; Tang, C.; Chen, Z.L. The role of plant residues in pH change of acid soils differing in initial pH. Soil Bio-Logy Biochem. 2006, 38, 709–719. [Google Scholar] [CrossRef] [Scilit]
- Lu, R.K. Methods of Soil Agrochemical Analysis; China Agriculture Scientech Scientech Press: Beijing, China, 2000. [Google Scholar]
- Zhao, K.L.; Cai, Z.J.; Wang, B. Profile characteristics of pH and exchangeable acidity of red soils under different parent materials and vegetation types. Chin. Agric. Sci. 2015, 48, 4818–4826. [Google Scholar]
- Zhou, J.Y.; Li, M.D.; Zhou, X. Study on the acidification characteristics of profiles of paddy soils developed from typical southern parent materials. Chin. J. Soil Sci. Fertil. 2022, 7–13. [Google Scholar] [CrossRef]
- Liu, L.; Cheng, Y.; Li, Z.; Xie, D. Influence of fitting method on the accuracy of measuring soil acid buffering capacity by acid-base titration. Acta Pedol. Sin. 2022, 59, 509–516. [Google Scholar]
- NY/T 853—2004; Environmental Technical Conditions for Tea Production Areas. China Agriculture Press: Beijing, China, 2004; pp. 1–8.
- NY/T 391—2021; Green Food—Environmental Quality Standard for Production Areas. China Agriculture Press: Beijing, China, 2021; pp. 1–7.
- Zhu, Y.R.; Lin, H.L.; Zhang, Y.L.; Liang, Y.X. Effects of combined application of potassium and magnesium in ameliorating soil acidification of tea garden. Chin. J. Ecol. 2023, 42, 1554–1560. [Google Scholar]
- Sun, Y.M.; Zhang, K.; Ye, C. Acidification of Tea Garden Soils in Jiangxi and Countermeasures. Soil Crops 2017, 6, 139–145. [Google Scholar]
- Yan, L.L.; Meng, Z.; Yu, L. Influence of Nitrogen Fertilizer Application on Soil Acidification Characteristics of Tea plantations in Karst Areas of Southwest China. Agriculture 2023, 13, 849. [Google Scholar] [CrossRef] [Scilit]
- Zhang, T.L.; Wang, X.X.; Zhang, B. Soil Degradation in Relation to Land Use and Its Countermeasures in the Red and Yellow Soil Region of Southern China; CRC Press: Boca Raton, FL, USA, 1999; pp. 52–57. [Google Scholar]
- Diao, H.L.; Lian, X.D.; Zhang, L.; Cai, Z.J.; Xu, M.G. Effects and mechanisms of phosphorus fertilizer and corn stover in regulating the exchangeable aluminum content in red soil. Soils 2025, 57, 1378–1386. [Google Scholar] [CrossRef]
- Xie, S.; Chen, Z.Y.; Shu, Y. Characteristics of soil acidification and nutrient changes in typical tea plantations in Guizhou. Sci. Technol. Eng. 2024, 24, 8025–8035. [Google Scholar]
- Lin, Y.P.; Huang, Y.B.; Hu, Z.B. Effects of reduced nitrogen fertilizer and controlled-release fertilizer on the quality of Wuyi rock tea. Tea Commun. 2020, 47, 221–226. [Google Scholar]
- Wu, Z.D.; Jiang, F.; You, Z. Acidic characteristics of subtropical tea garden soil: A case study in Wuyishan city, Fujian. China Environ. Sci. 2016, 36, 181–189. [Google Scholar]
- Abe, S.S.; Ha, S.I.; Masunaga, T.; Wakatsuki, T. Soil profile alteration in a brown forest soil under high-input tea cultivation. Plant Prod. Sci. 2006, 9, 457–461. [Google Scholar] [CrossRef] [Scilit]
- Ding, R.X.; Huang, X. Biogeochemical cycle of aluminum and fluorine in tea plantation soil system and its relationship to soil acidification. Acta Pedol. Sin. 1991, 28, 229–236. [Google Scholar]
- Fung, K.F.; Carr, H.P.; Zhang, J.H.; Wong, M.H. Growth and nutrient uptake of tea under different aluminum concentrations. Sci. Food Agric. 2008, 88, 1582–1591. [Google Scholar] [CrossRef] [Scilit]
- Li, C.P.; Li, X.; Wang, X. Effect of the acidification environment on exchangeable cations and acid buffering capacity of weathering products of purple parent rock. Acta Pedol. Sin. 2024, 61, 258–271. [Google Scholar]
- Mulder, J.; Stein, A. The solubility of aluminum in acidic forest soils: Long-term changes due to acid deposition. Geochim. Cosmochim. Acta 1994, 58, 85–94. [Google Scholar] [CrossRef] [Scilit]
- Li, J.Y.; Xu, R.K.; Zhang, H. Iron oxides serve as natural anti-acidification agents in highly weathered soils. J. Soils Sediments 2012, 12, 876–887. [Google Scholar] [CrossRef] [Scilit]
- Li, J.; Hu, X.; Duan, X.H. The effect of tea planting age on soil and nutrient content of tea trees in hilly areas. J. Jiangxi Agric. Univ. 2012, 34, 1186–1192. [Google Scholar]
- Jiang, F.Y.; Wu, Z.D.; Zhang, L. Effects of different fertilization patterns on soil acidity and tea yield in tea gardens. J. Tea Sci. 2023, 64, 36−42. [Google Scholar]
- Luo, M. Study on the Current Situation of Soil Acidification in Tea Gardens of Jiangsu Province and Its Influencing Factors. Nanjing Agric. Univ. 2006, 9, 1512–1525. [Google Scholar]
- Geng, N.; Kang, X.; Yan, X.; Yin, N. Biochar mitigation of soil acidification and carbon sequestration is influenced by materials and temperature. Ecotoxicol. Environ. Saf. 2022, 232, 113241. [Google Scholar] [CrossRef] [Scilit]
- Wang, L.; Wang, Y.L.; Li, H. Redundancy analysis of influencing factors of phosphorus availability in red soil upland under long-term fertilization. Soil Fertil. Sci. China 2021, 2, 17–25. [Google Scholar]
- Chen, X.H.; Yan, X.J.; Wang, M.K. Long-term excessive phosphorus fertilization alters soil phosphorus fractions in the acidic soil of pomelo orchards. Soil Tillage Res. 2022, 215, 105214. [Google Scholar] [CrossRef] [Scilit]
- Lin, X.B.; Sun, Y.M.; Jiang, X.F. Characteristics of Soil Fertility and Its Influencing Factors in Tea Gardens of Jiangxi Province. Chin. J. Appl. Ecol. 2020, 31, 1163–1174. [Google Scholar]
- Ke, Z.; Lin, M.Q.; Qi, J. Effects of Nitrogen Reduction Combined with Organic Fertilizer Application on Potassium Uptake Efficiency of Crops and Soil Potassium Supply Capacity in Rice-Wheat Rotation System. Zhejiang Agric. Sci. 2025, 3, 1436–1446. [Google Scholar]
- Sparks, D.L.; Huang, P.M. Physical chemistry of soil potassium. Potassium Agric. 1985, 201–276. [Google Scholar] [CrossRef] [Scilit]
- Yang, T.Y.; Yang, Q.; Lan, Z.X. Research progress and prospects of potassium nutrition in tea plants. Advances in Soil Science 2026, 53, 190–198. [Google Scholar] [CrossRef]
- Hosseinpur, A.R.; Tadayon, M.R. Potassium quantity–intensity parameters and their correlation with bean plant indices in some calcareous soils. Commun. Soil Sci. Plan 2013, 44, 1480–1488. [Google Scholar] [CrossRef] [Scilit]
- Xu, G.H.; Bao, S.D.; Shi, R.H. Study on Soil Potassium Supply Status IV: Utilization of Potassium between Soil Layers by Cereal and Legume Crops. J. Nanjing Agric. Univ. 1991, 14, 47–52. [Google Scholar]
- Zhan, L.P.; Li, X.K.; Lu, J. Research Progress on Factors Affecting Soil Potassium Migration. Soil 2012, 44, 548–553. [Google Scholar]
- Barak, P.; Jobe, B.O.; Krueger, A.R.; Peterson, L.A. Effects of long-term soil acidification due to nitrogen fertilizer inputs in Wisconsin. Plant Soil 1997, 197, 61–69. [Google Scholar] [CrossRef] [Scilit]
- Zhang, X.Q.; Chen, J.; Gao, X.B. Analysis on pH and major soil nutrients of tea gardens in key tea producing areas of Guizhou. Southwest China J. Agric. Sci. 2015, 28, 286–291. [Google Scholar]
- Fu, X.Y.; Zi, W.L.; Yong, Q.J. Roles of N and P in Soil Acidification, Metals Mobilization and Bioavailable Concentration-Based Soil Fertility Assessment in Tea plantations in Yunnan, China. Agriculture 2025, 15, 543. [Google Scholar] [CrossRef] [Scilit]
- Posch, M.; Reinds, G.J. A very simple dynamic soil acidification model for scenario analyses and target load calculations. Environ. Model. Softw. 2009, 24, 329–340. [Google Scholar] [CrossRef] [Scilit]
- Vieira, F.; Bayer, C.; Mielniczuk, J. Long-term acidification of a Brazilian Acrisol as affected by no till cropping systems and nitrogen fertiliser. Soil Res. 2008, 46, 17–26. [Google Scholar] [CrossRef] [Scilit]
- Ding, Y.; Lu, C.; Hou, X. Regulatory effects of organic conditioners on soil nutrients and tea quality in Lushan tea gardens. J. Nanchang Hangkong Univ. 2022, 36, 100–105. [Google Scholar]
- Zhou, J.; Xia, F.; Liu, X.; He, Y.; Xu, J.; Brookes, P.C. Effects of nitrogen fertilizer on the acidification of two typical acid soils in South China. J. Soils Sediments 2013, 14, 415–422. [Google Scholar] [CrossRef] [Scilit]
- Juo, A.S.; Dabiri, A.; Franzi, K. Acidification of a kaolinitic Alfisol under continuous cropping with nitrogen fertilization in West Africa. Plant Soil 1995, 171, 245–253. [Google Scholar] [CrossRef] [Scilit]
- Rogeri, D.A.; Eranani, P.; Loure, K.S. Miner-alization and nitrification of nitrogen from poultry litter applied to soil. Rev. Bras. Eng. Agric. Ambient. 2015, 19, 534–540. [Google Scholar]
- Guo, J.; Liu, X.; Zhang, Y. Significant acidification in major Chinese croPlands. Science 2010, 327, 1008–1010. [Google Scholar] [CrossRef] [Scilit]
- Cen, W.L.; Jing, Y.; Yi, L. Effects of Co-Application of Biochar and Nitrogen Fertilizer on Soil Properties and Microbial Communities in Tea Plantation. Agriculture 2025, 15, 1941. [Google Scholar] [CrossRef] [Scilit]
- Li, S.Y.; Li, H.X.; Yang, C.L. Rates of soil acidification in tea plantations and possible causes. Agric. Ecosyst. Environ. 2016, 233, 60–66. [Google Scholar] [CrossRef] [Scilit]
- Wang, D.S.; Liang, C.H.; Du, L.Y. Effects of organic acids on potassium release from potassium-containing minerals. J. Shenyang Agric. Univ. 2007, 3, 65–69. [Google Scholar]
- Wang, D.S.; Wang, J. Mechanism of soil mineral potassium release under the action of low molecular weight organic acids. J. Liaoning Univ. Eng. Technol. 2009, 9, 259–261. [Google Scholar]
- Department of Agriculture and Rural Affairs of Jiangxi Province. Notice on the Selection and Application for the 2026 Jiangxi Tea Industry High-Quality Development Project; (Document No. 199 [2025], General Office); Department of Agriculture and Rural Affairs of Jiangxi Province: Nanchang, China, 2025. Available online: https://nync.jiangxi.gov.cn/jxsnynct/tzgg/content/content_1984084049820848128.html.
- Lushan City People’s Government. Action Plan for Strengthening the Lushan Yunwu Tea Brand and Coordinating Tea Culture, Tea Industry and Tea Science; Lushan City People’s Government: Jiujiang, China, 2025. Available online: https://www.lushan.gov.cn/zwgk_194695/zfxxgkzl_194696/fdzdgknr_194705/fgzc/wjk002/lfbf/202509/t20250901_7004310.html.
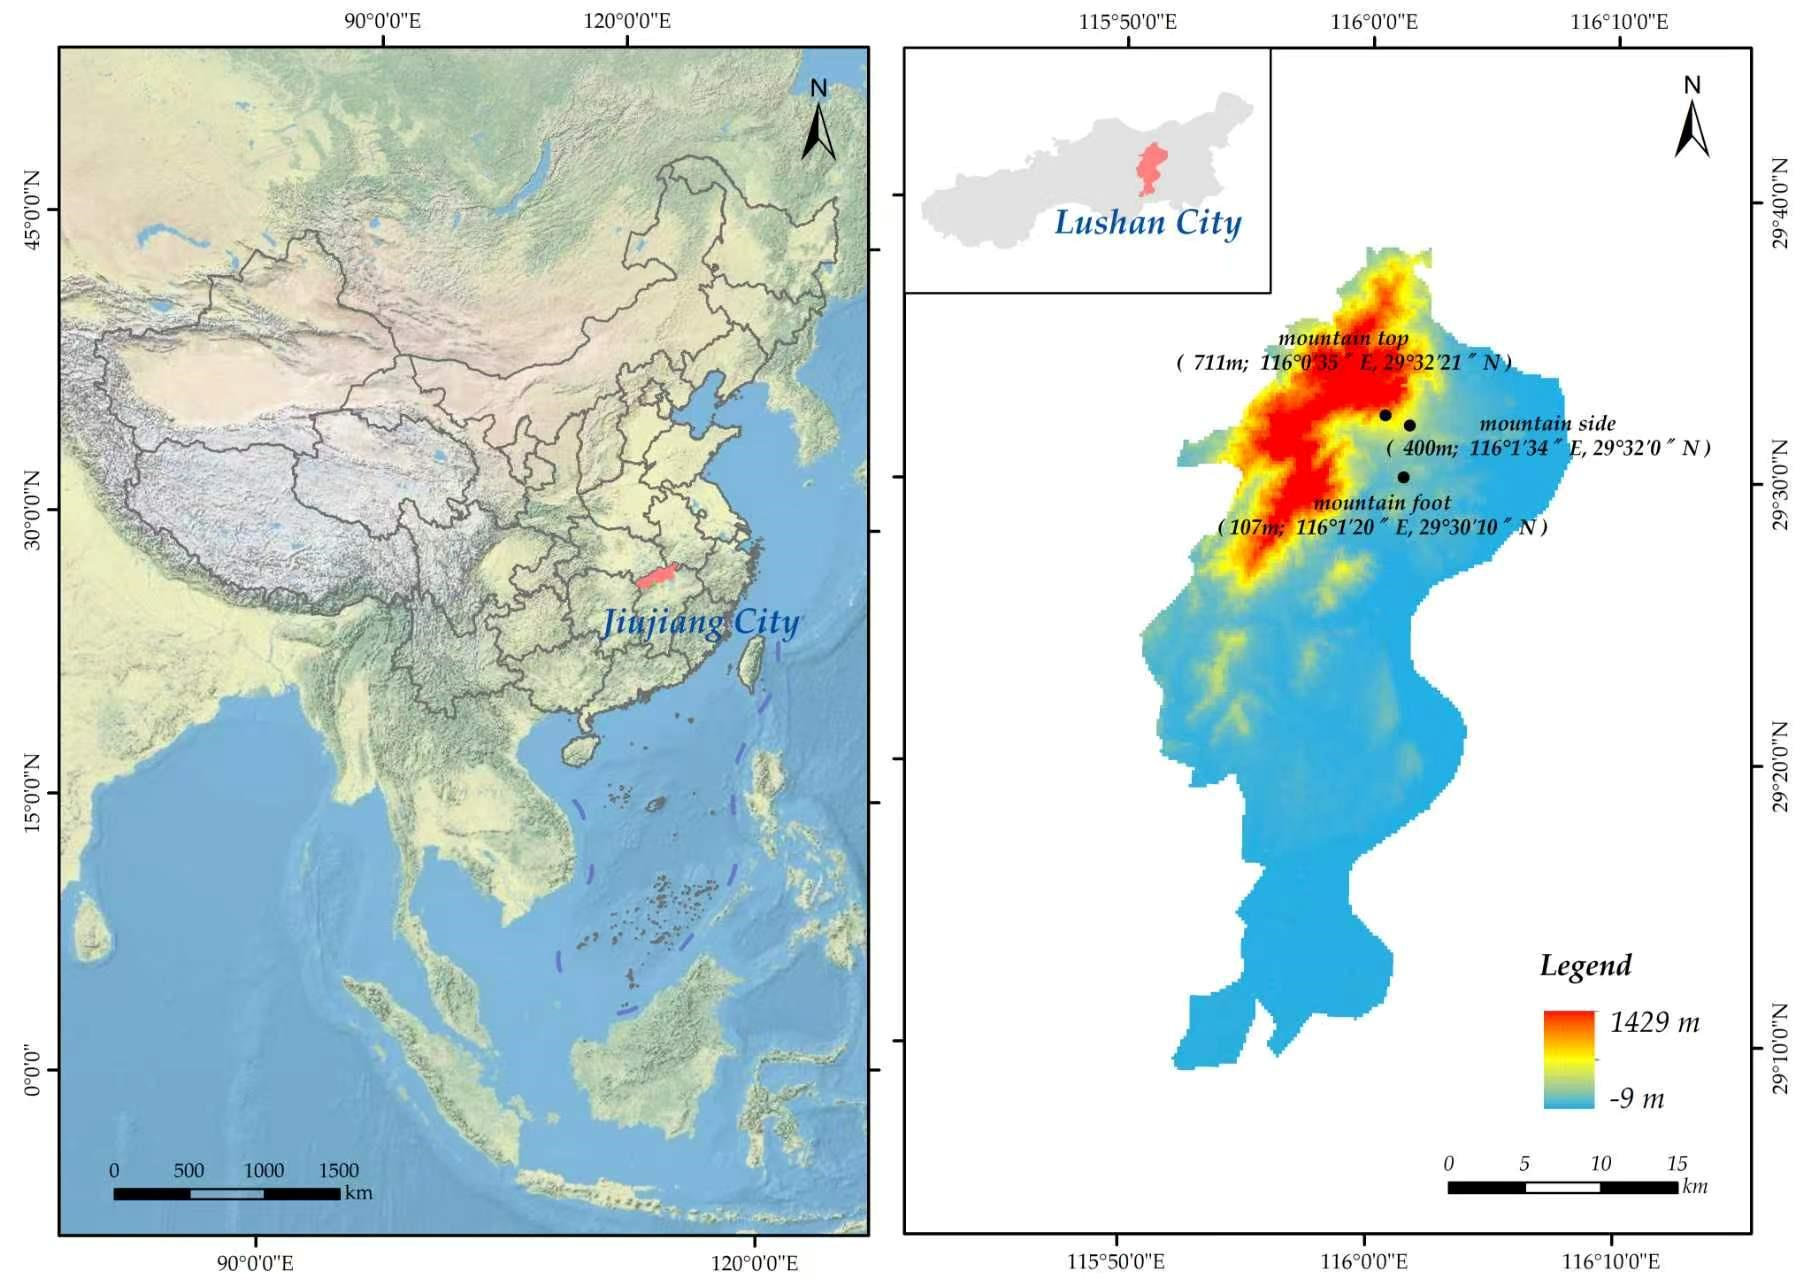
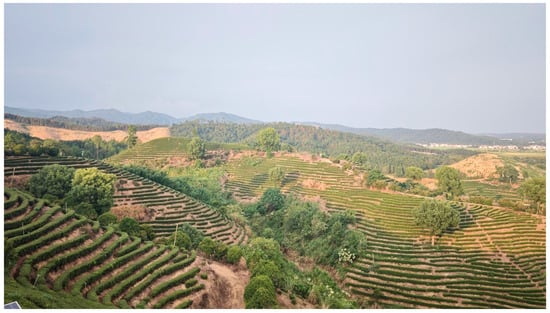
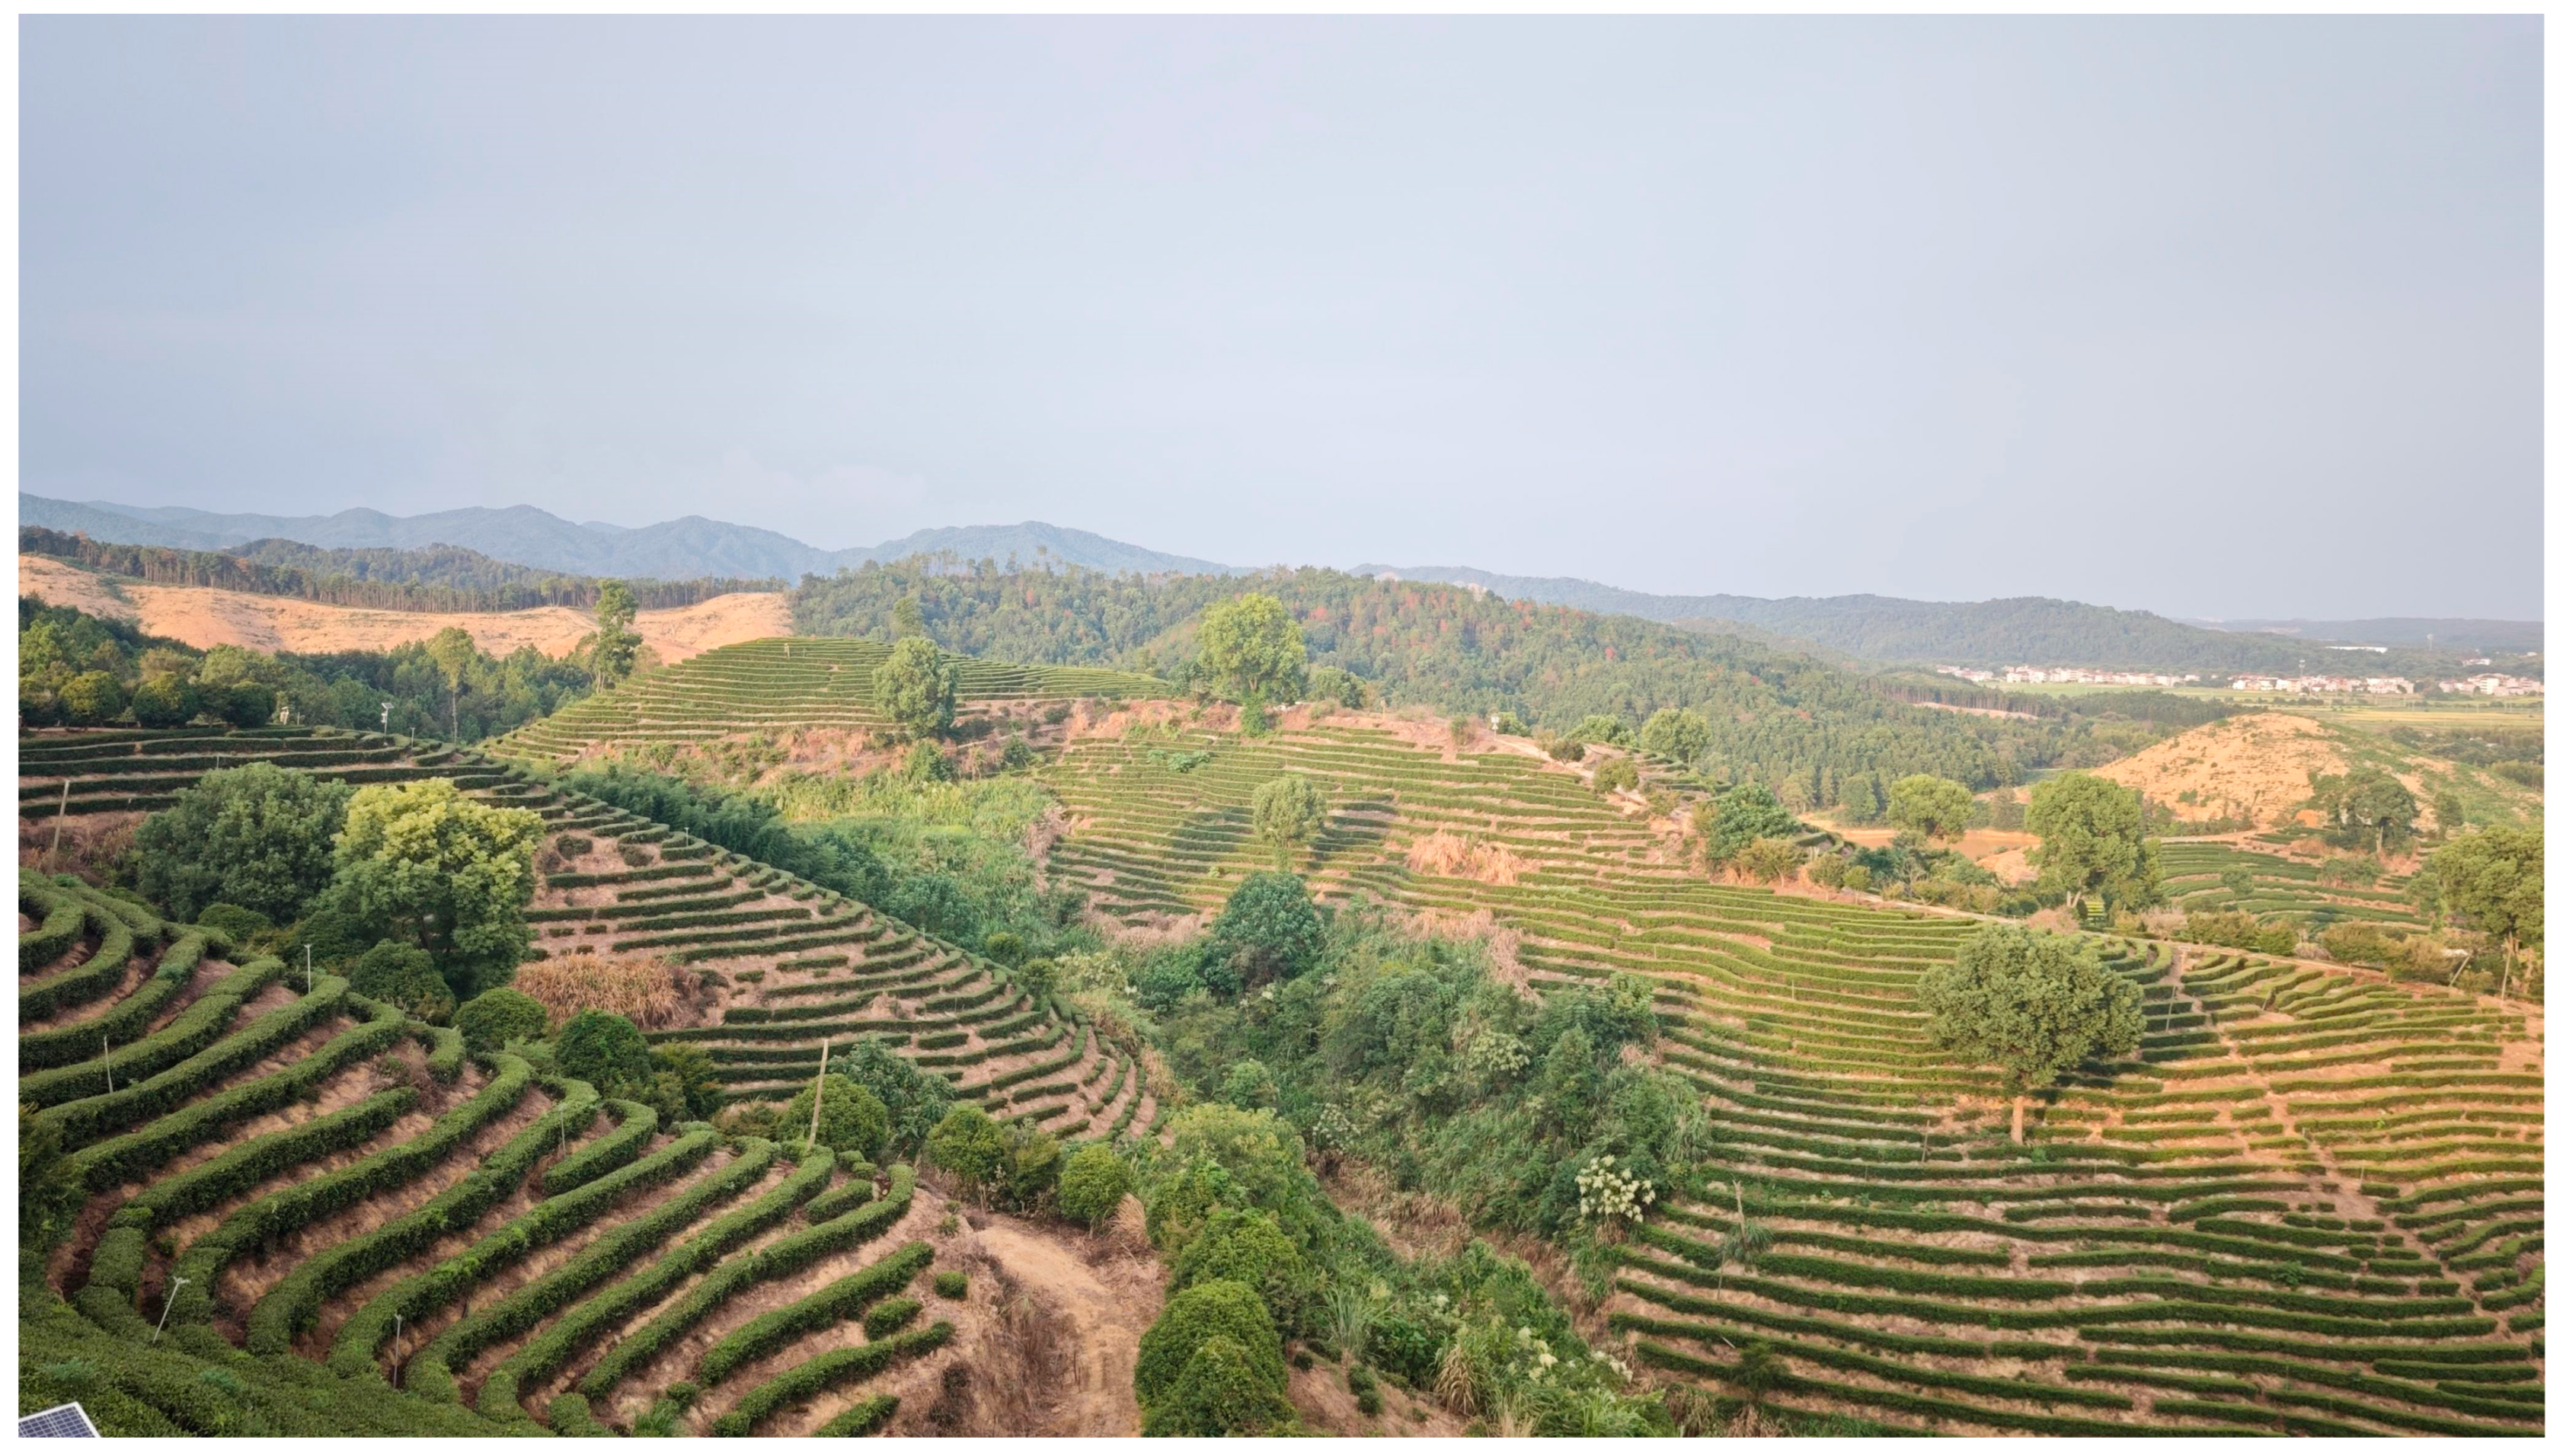
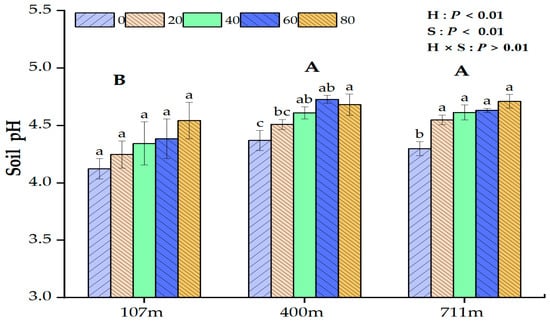
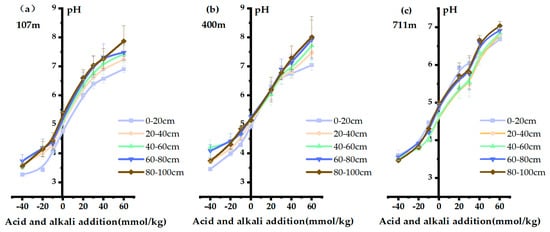
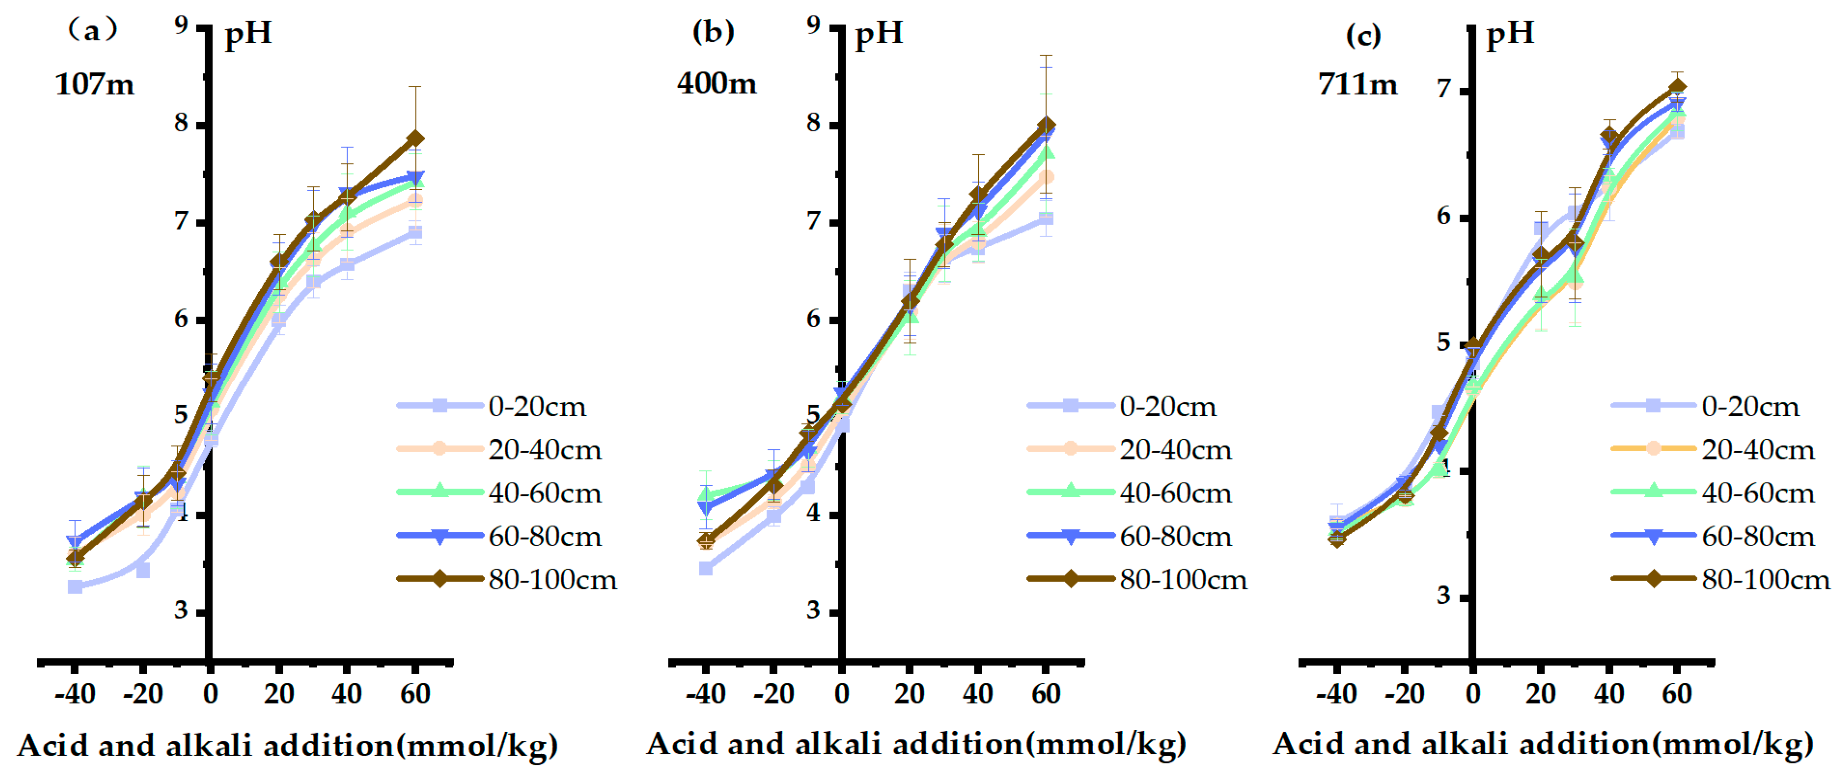
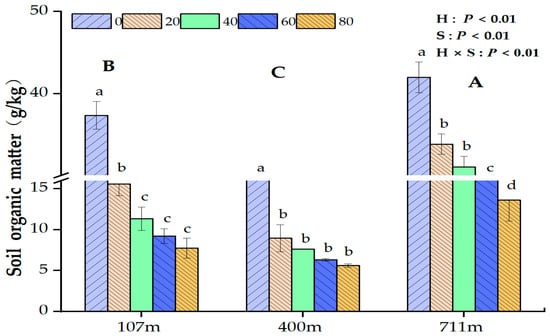
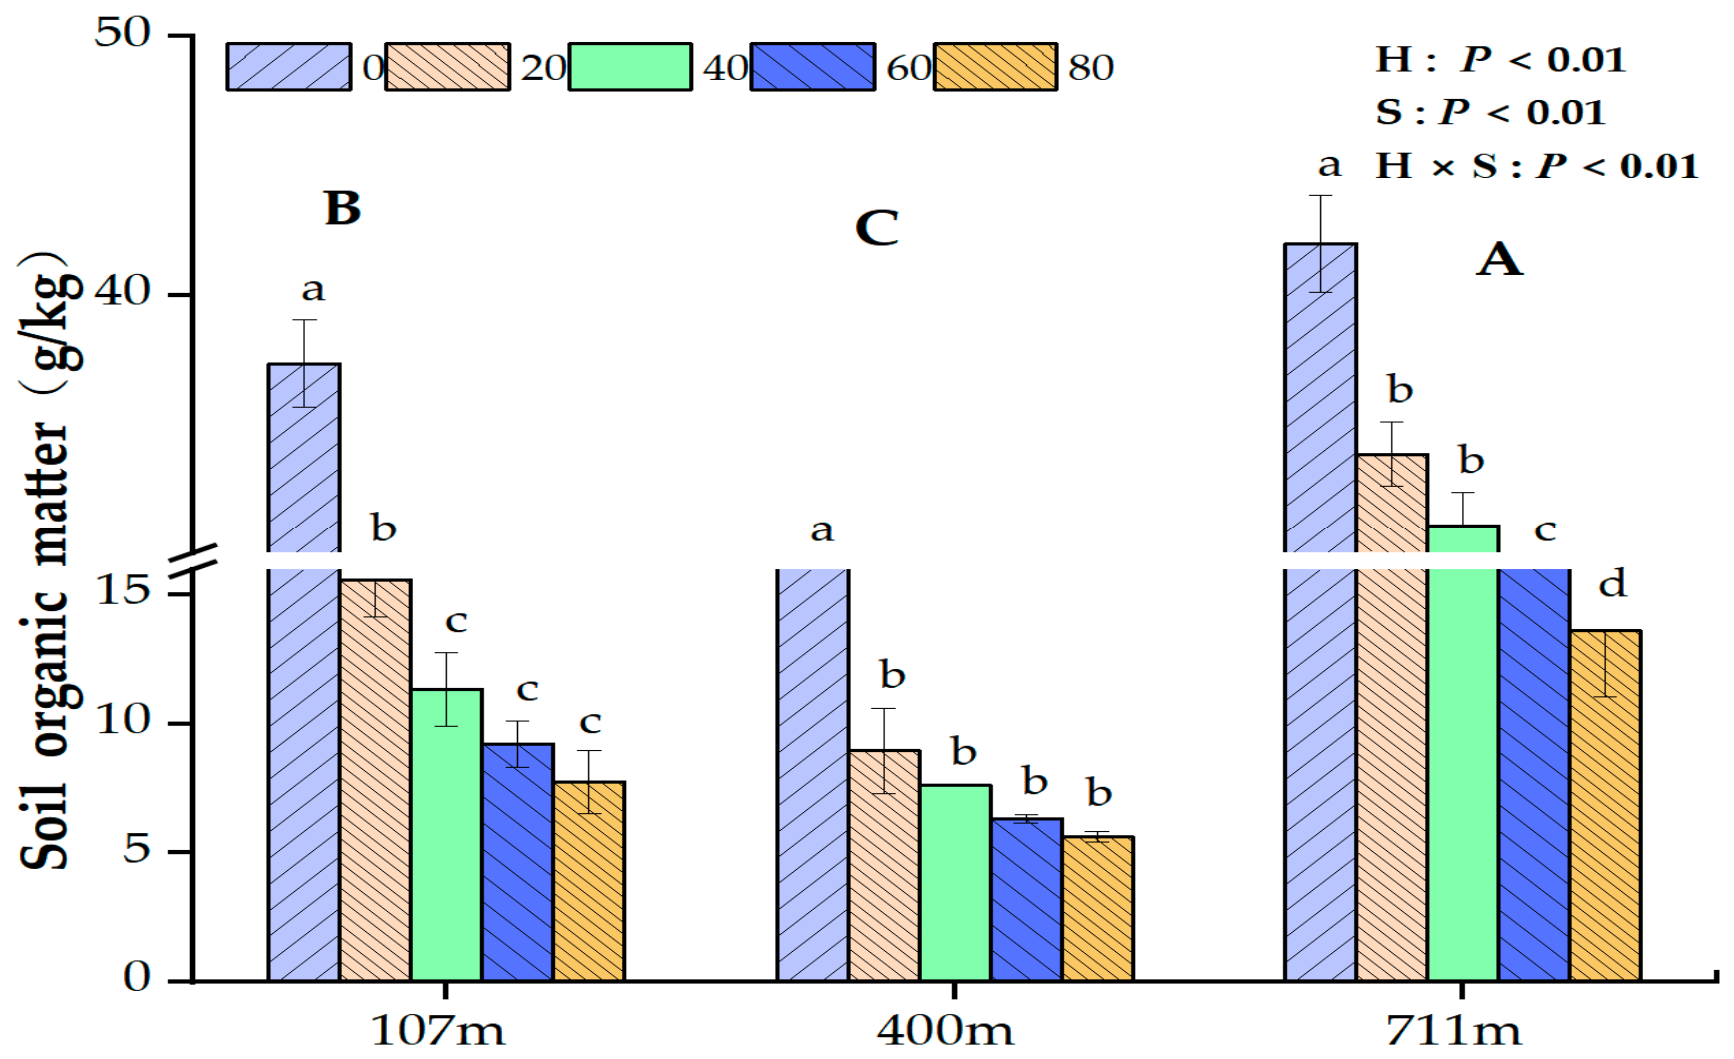
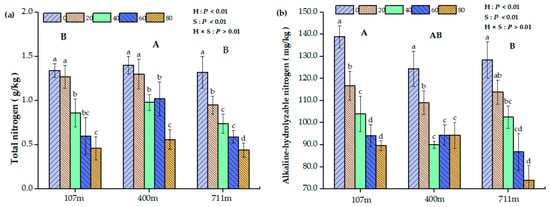
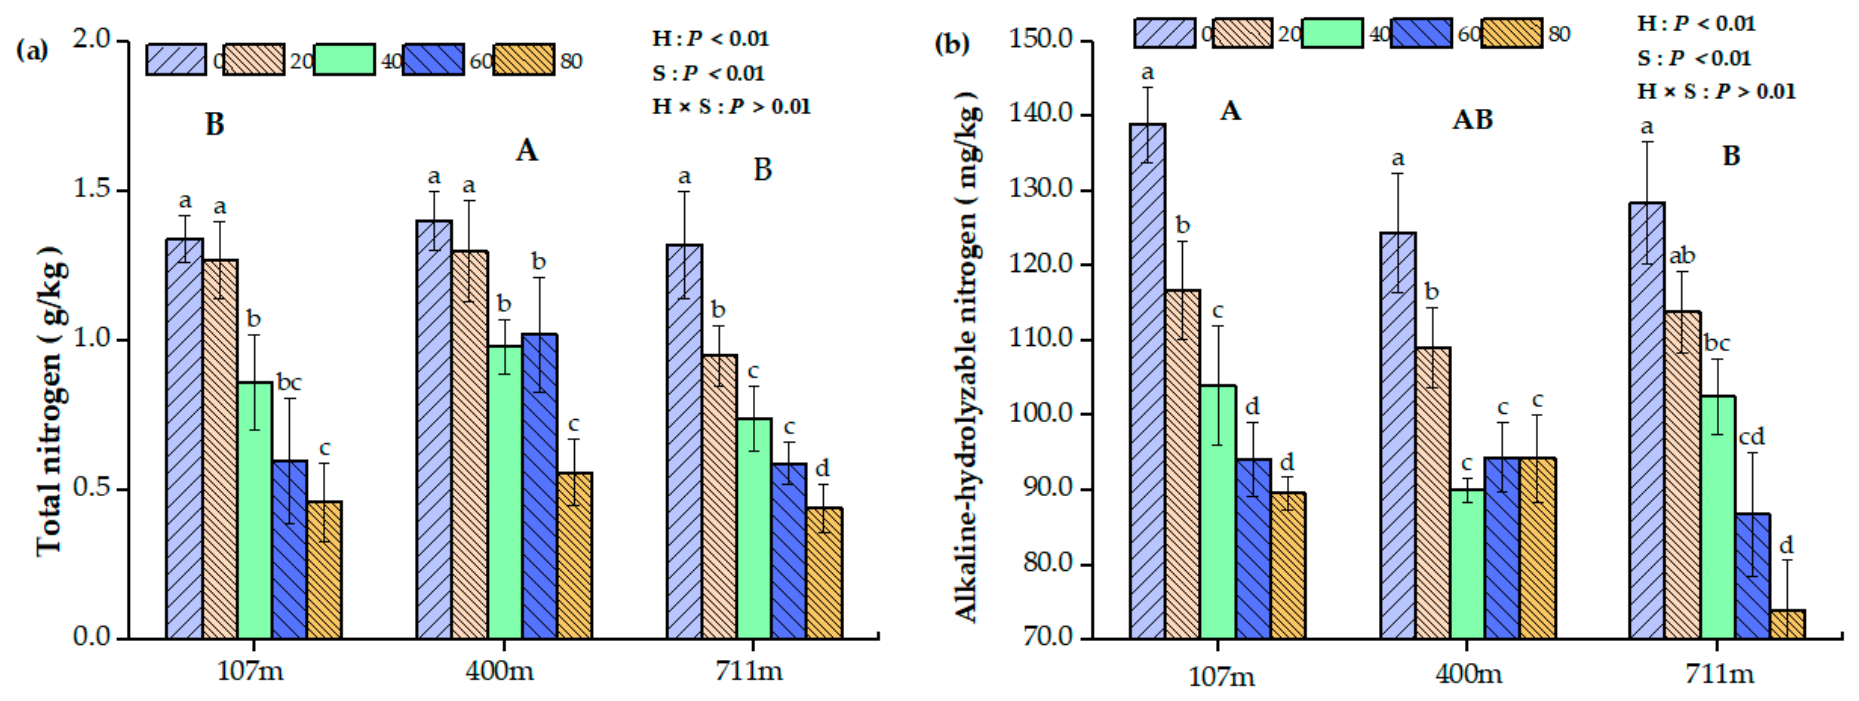
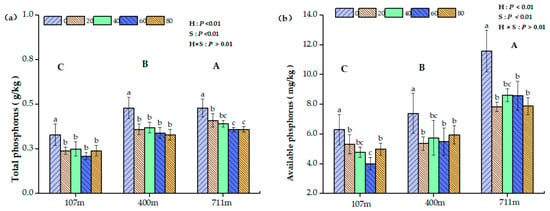
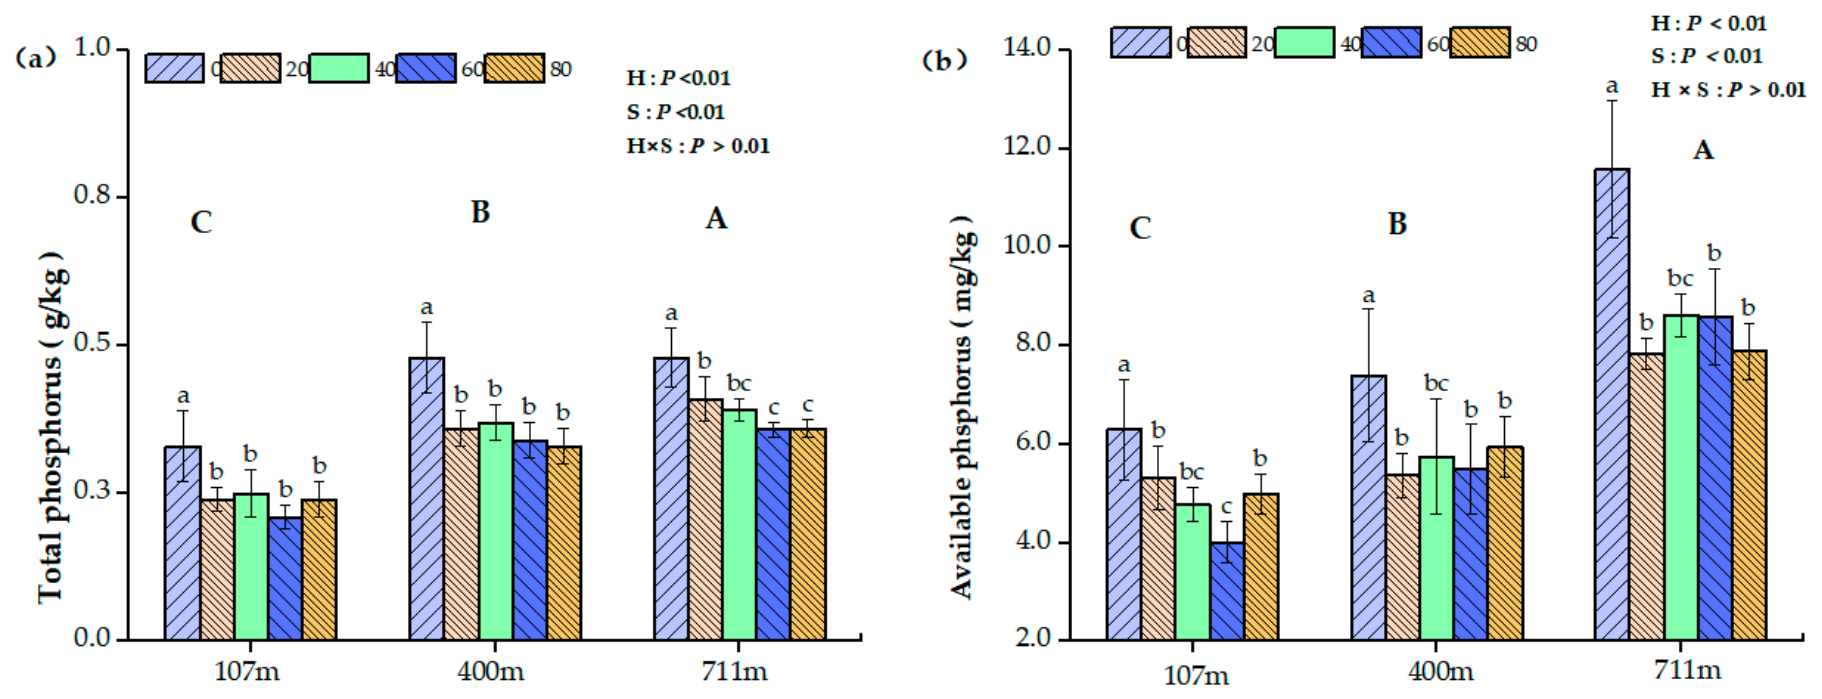
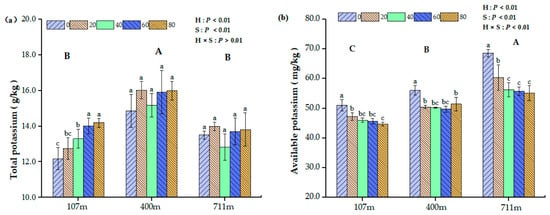
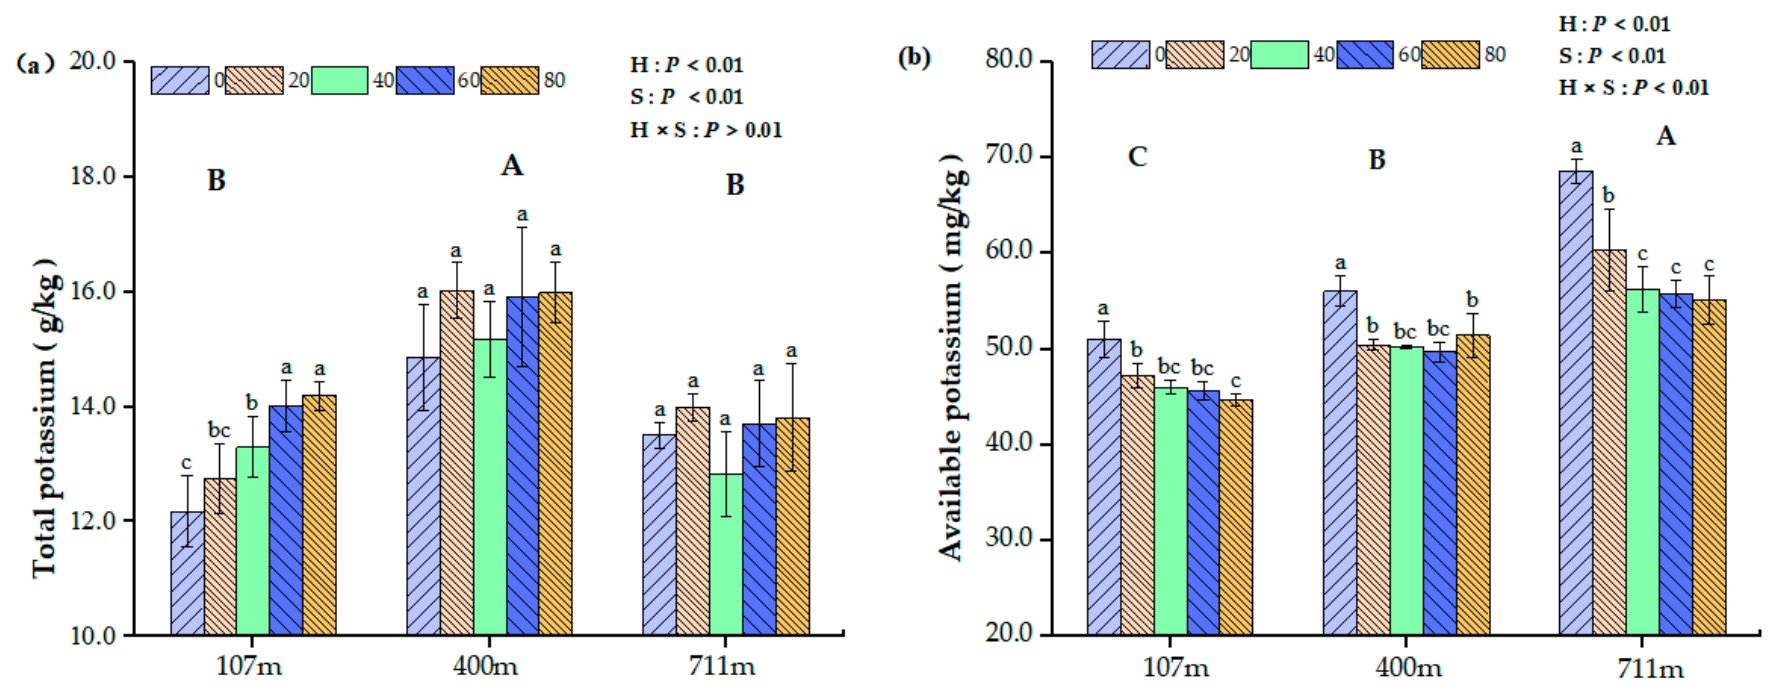
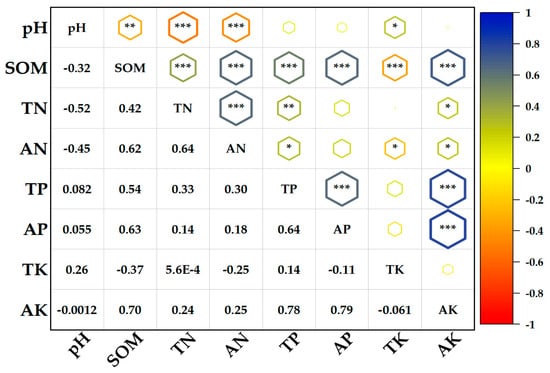
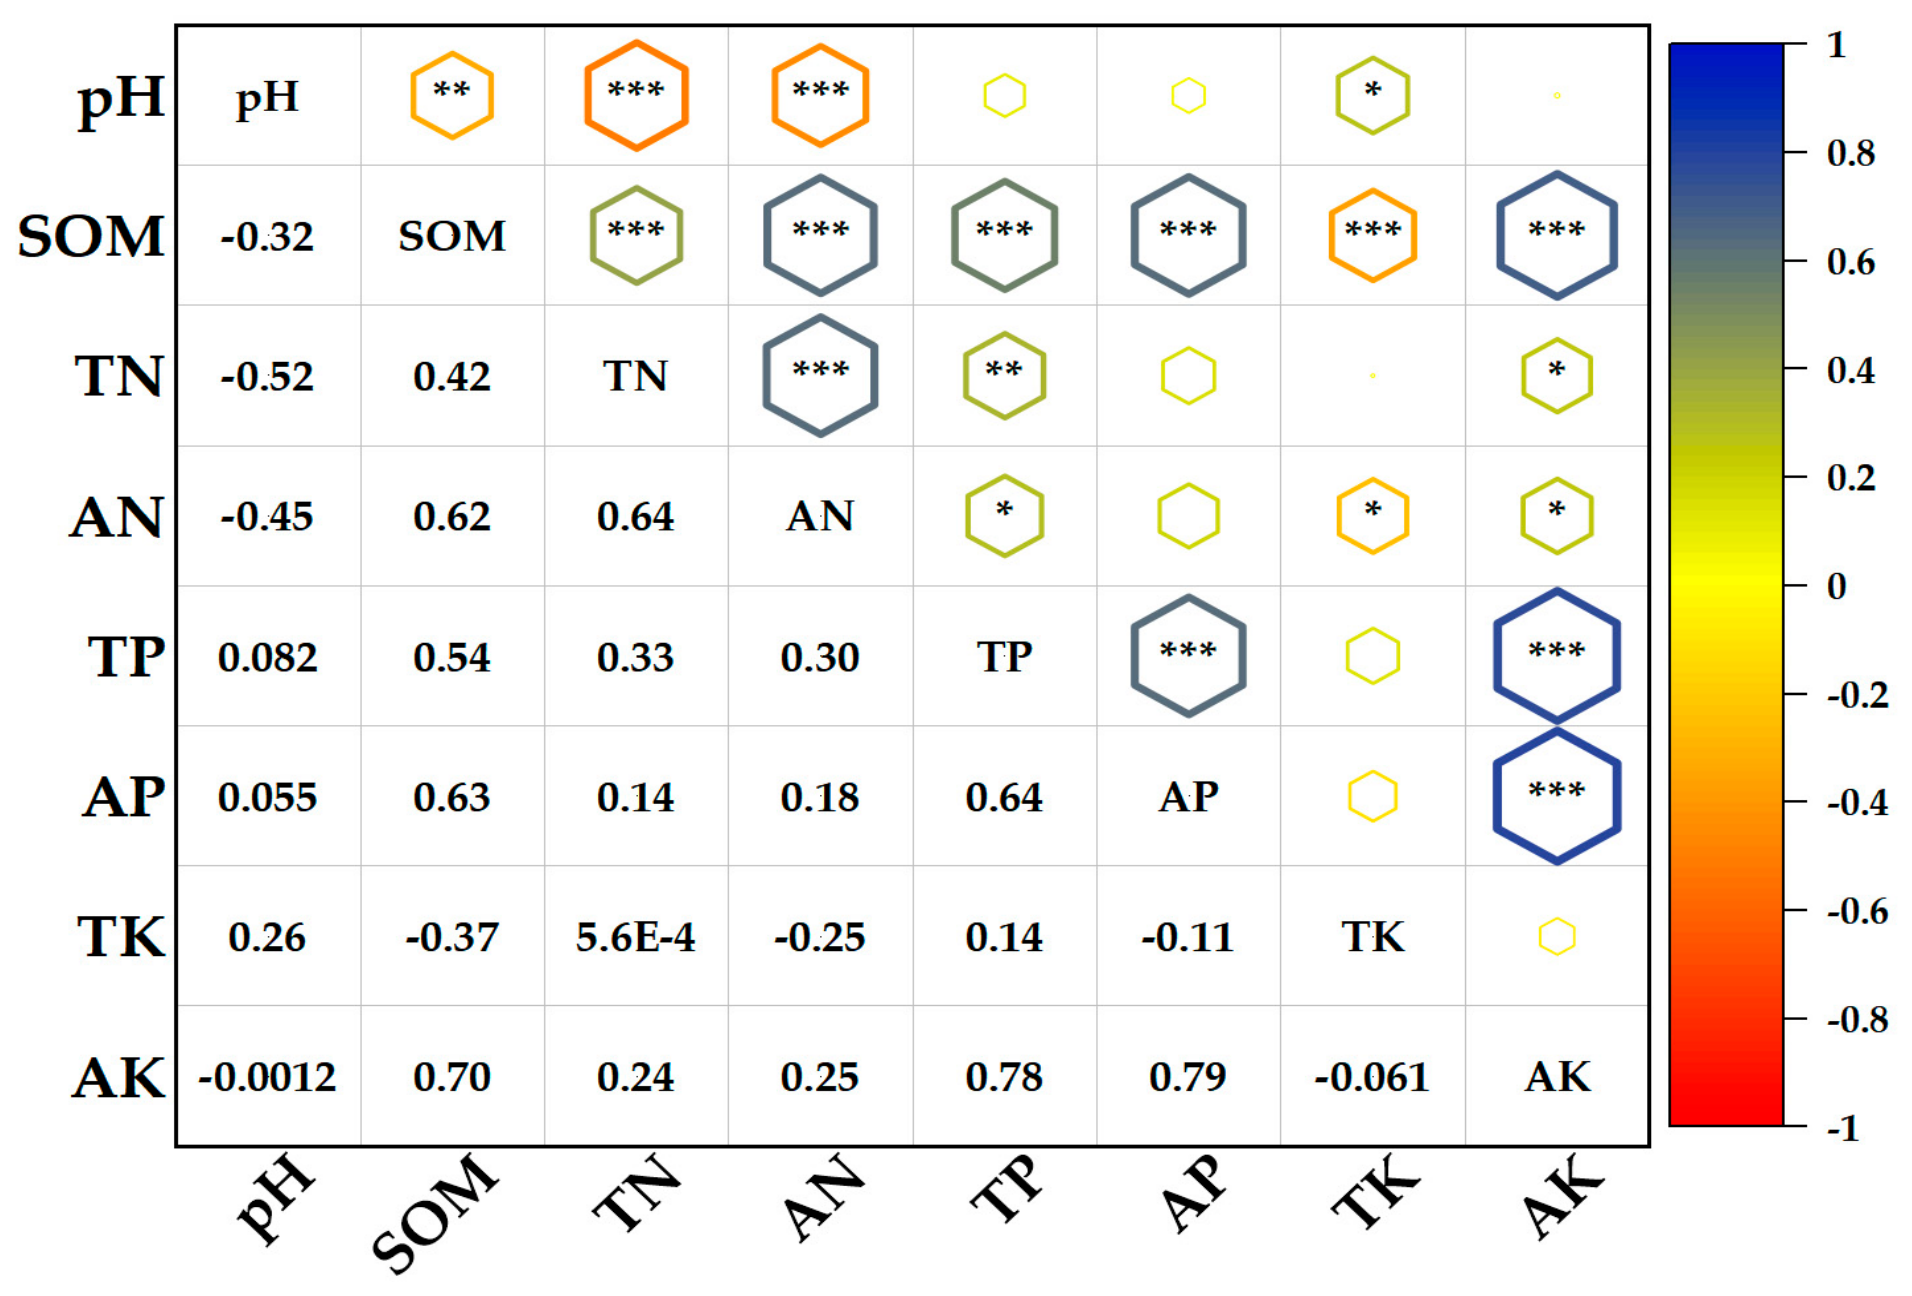

Disclaimer/Publisher’s Note: The statements, opinions and data contained in all publications are solely those of the individual author(s) and contributor(s) and not of MDPI and/or the editor(s). MDPI and/or the editor(s) disclaim responsibility for any injury to people or property resulting from any ideas, methods, instructions or products referred to in the content. |
© 2026 by the authors. Licensee MDPI, Basel, Switzerland. This article is an open access article distributed under the terms and conditions of the Creative Commons Attribution (CC BY) license.