


Abstract
Kidding in goats is a highly significant event with major economic implications and strong impacts on the welfare of both the offspring and the mothers. Monitoring the process is extremely demanding, as it is impossible to predict precisely when it will occur. For this reason, the automatic detection of kidding has the potential to generate substantial productivity gains while also improving animal well-being. Artificial intelligence techniques based on accelerometry data have been explored for identifying the event, but these approaches typically rely on data loggers, which cannot trigger real-time alerts or assistance. Embedding detection mechanisms directly into wearable devices enables much faster identification and supports energy-efficient operations. However, this approach also introduces considerable challenges, particularly due to the strict constraints of wearable devices in terms of weight, cost, and battery life. The present work documents the development of a real-time, automatic kidding-detection mechanism in which the detection workload is distributed between the collar and an edge device. System evaluation demonstrated the feasibility of this distributed architecture, confirming that both components can cooperate effectively to achieve reliable detection. The system achieved a Matthews Correlation Coefficient performance of 0.91, highlighting the robustness and practical viability of the proposed solution.
1. Introduction
Automatic kidding-detection systems are essential for goat health, welfare, and farm productivity. By enabling continuous monitoring, such systems allow for timely intervention during labor, significantly reducing kid mortality associated with dystocia, maternal neglect, or delayed colostrum intake. While manual observation is labor-intensive and often impractical due to staffing constraints and the unpredictability of delivery times, automating this process minimizes farmer workload and enhances economic sustainability.
Precision livestock farming tools are increasingly used to improve management; however, parturition detection in small ruminants remains less studied than in cattle. Most existing attempts rely on inertial sensors [1]. In earlier work [2], a lambing-detection system was developed, but the continuous transfer of monitoring data to edge devices compromised energy autonomy and scalability. Unlike sheep, for which commercial solutions exist, there are no such solutions for goats, and the literature reports few attempts to create detection mechanisms [1]. A 2022 trial [1] aimed at creating a dataset and algorithm [3] yielded limited results due to a small sample size, highlighting the need for more robust systems.
Prompt detection is critical because neonatal losses are often caused by complications such as dystocia, which can result from fetal malpresentation or maternal pelvic dimensions [4,5]. In lambs, parity also plays a significant role, with younger ewes facing higher stillbirth rates [6]. Fortunately, the physiological process of kidding presents distinct behavioral signs. The labor process involves preparatory restlessness and isolation, followed by active labor characterized by intense contractions and discomfort [7]. These repeated movements—lying down and standing up—are detectable via wearable inertial sensors [8].
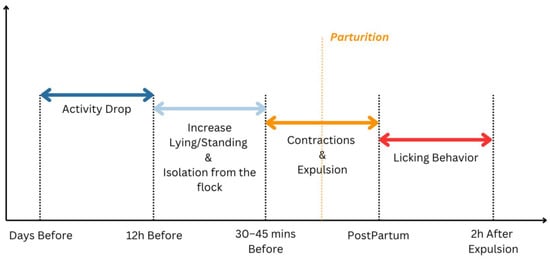
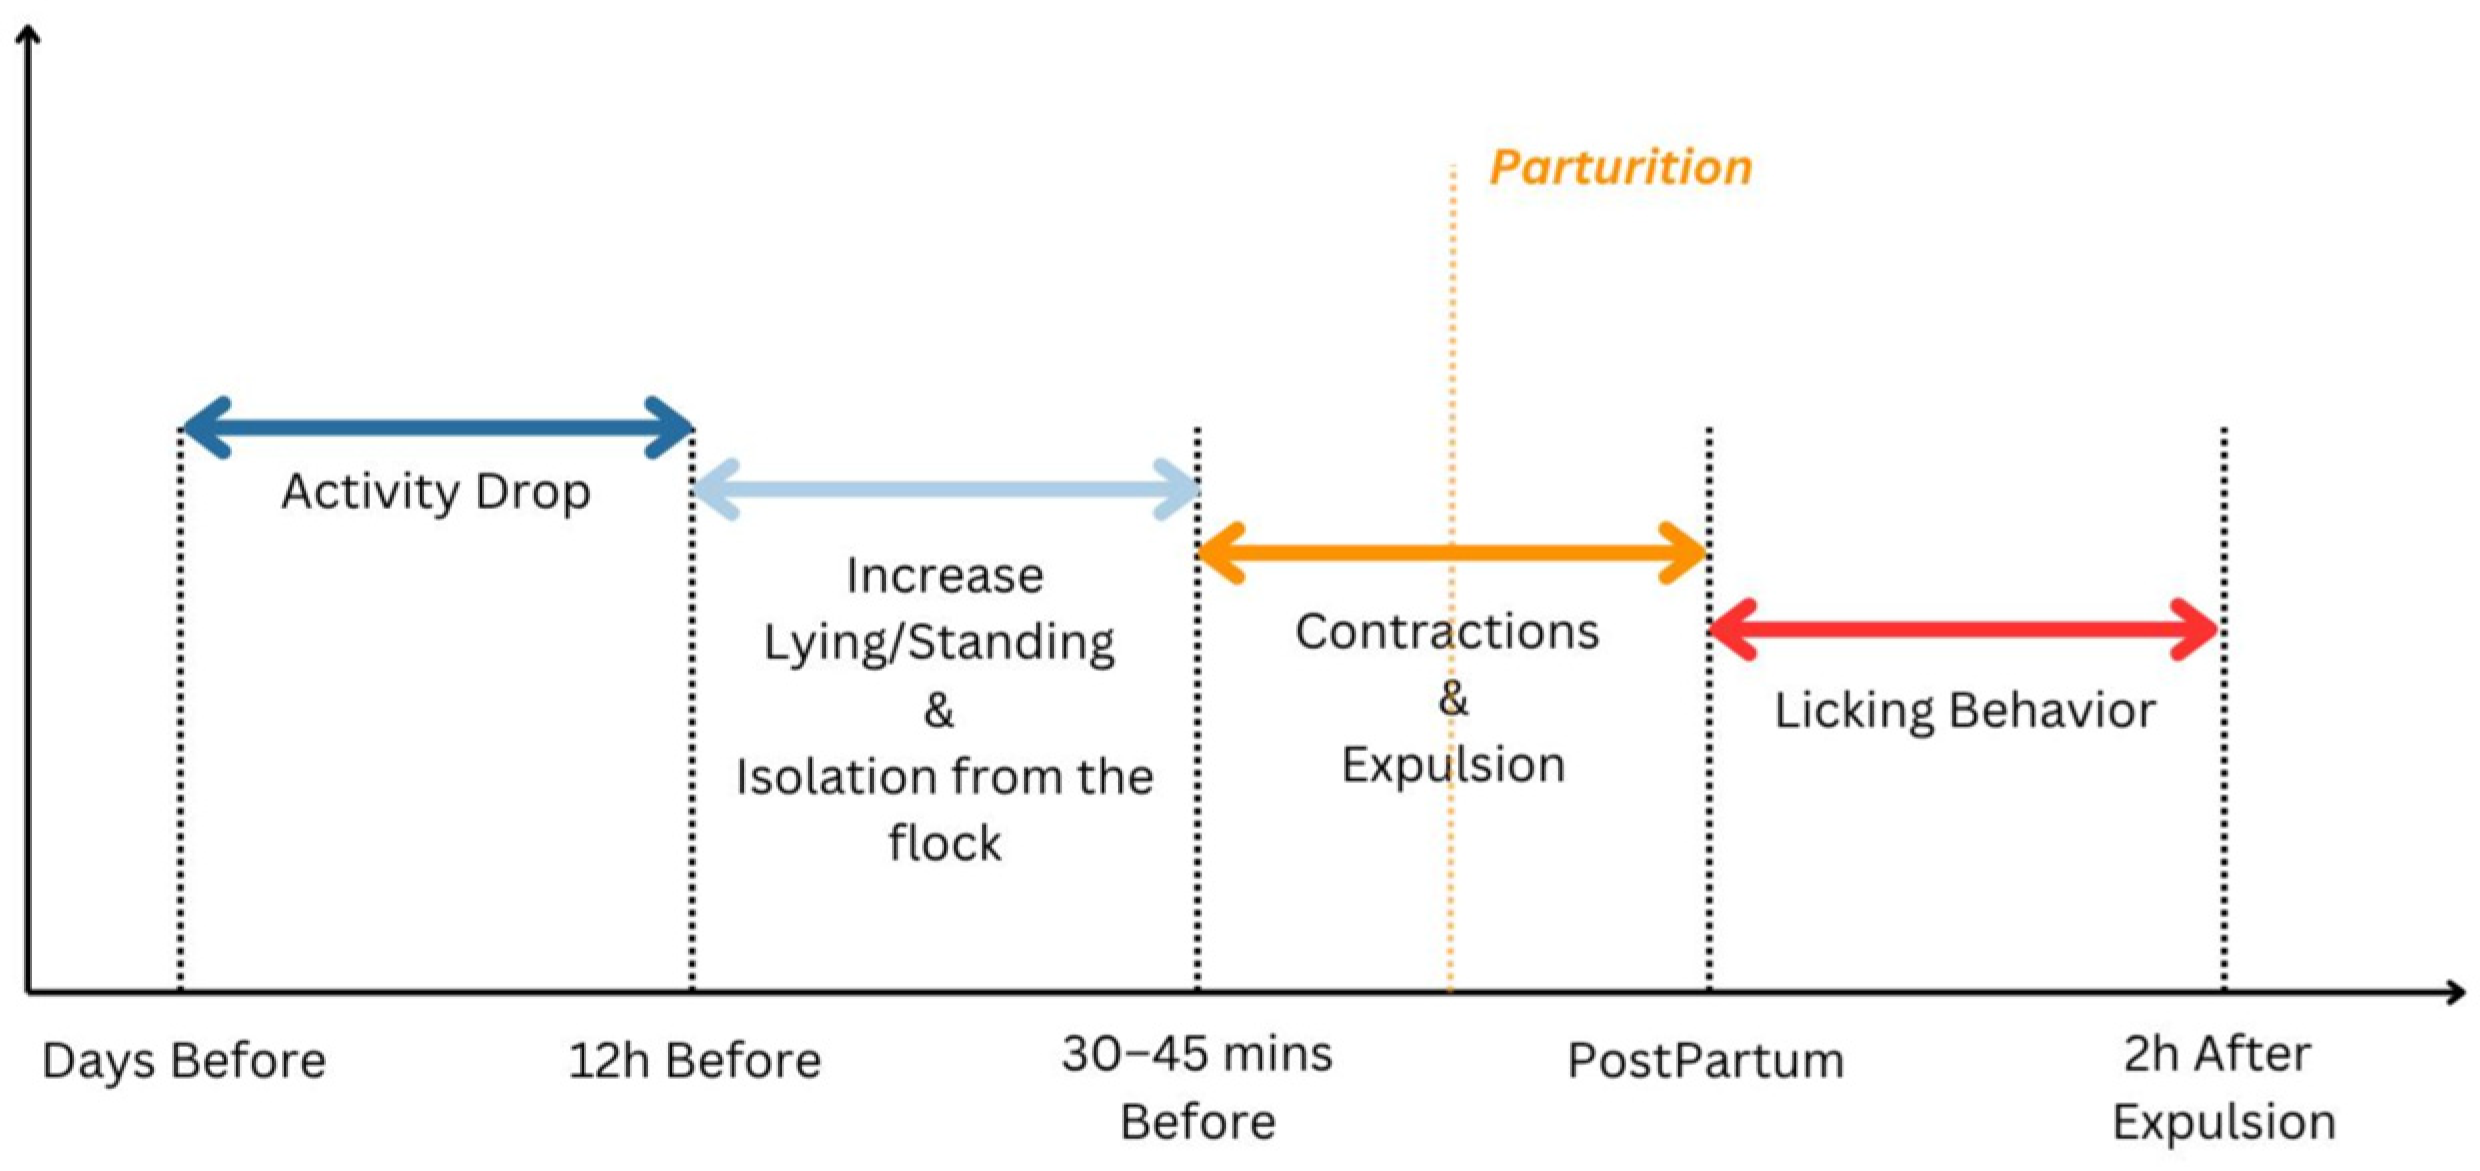
Although advances in wearable technology for sheep are being adapted for goats [9], species-specific differences in activity budgets and social structure [1,10] necessitate tailored algorithms. Research indicates that goats display recognizable changes prior to parturition, such as pawing and nesting [10,11]. Kim et al. [7] documented increased posture changes in the final 90 min before kidding, and Fogarty et al. [8] showed that accelerometer-based metrics reliably capture these transitions. A timeline of behavioral indicators derived from literature is shown in Figure 1.
Figure 1.
Behavioral timeline diagram synthesized from multiple studies in the literature.
To process this data, Machine Learning (ML) techniques are employed to extract patterns. Conventional algorithms like Decision Trees [12] and Random Forests [13] have been applied in sheep studies, while deep learning architectures such as LSTM [14] and CNN [15] show promise in modeling temporal dependencies [16]. In this study, model performance is evaluated using standard metrics, with particular emphasis on the Matthews Correlation Coefficient (MCC) [17]. The MCC is favored for its robustness in handling class imbalances common in kidding datasets [18].
The general goal of this research was to develop and validate a distributed machine-learning–based mechanism for detecting kidding events in goats using accelerometry data. From a scientific perspective, the study aims to adapt an existing methodological framework [15] to goat monitoring and determine the minimum sampling frequency and optimal sliding-window size. Practically, the objective was to design a reliable, scalable solution for on-farm deployment. To support these aims, experimental trials were conducted during the 2024 and 2025 kidding seasons.
2. Materials and Methods
This section outlines the implementation process of a two-stage detection machine learning system for kidding, which closely resembles the procedure carried out in a previous work [15]. The text details every single step and approaches used to implement it, outlining the philosophical foundations of this research and specific methodological choices made.
2.1. Monitoring Platform
The data acquisition methodology adopted in this study is based on the system described by Gonçalves et al. [15]. The system employs a tri-axial accelerometer, which measures acceleration along three orthogonal axes (X, Y, and Z), in conjunction with a temperature sensor. Both sensors are integrated into a collar worn around the animals’ necks. Data were collected at a sampling frequency of 20 Hz, capturing movement along the X-axis (left–right), Y-axis (forward–backward), and Z-axis (up–down), thereby enabling the monitoring of behavioral changes associated with the period preceding kidding.
The tri-axial accelerometer inherently captures movement patterns related to posture and activity transitions, including standing, lying, and walking. These movement patterns serve as indirect indicators of behaviors known to precede kidding. In the present study, such behaviors are not manually annotated; instead, they are represented through time-series features extracted from the raw acceleration signals.
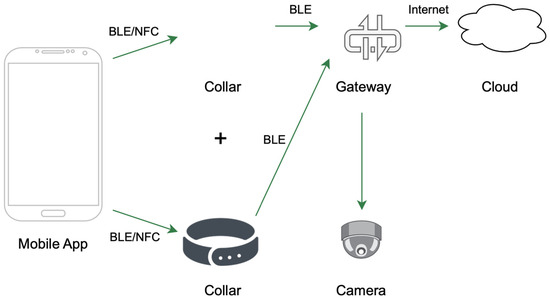
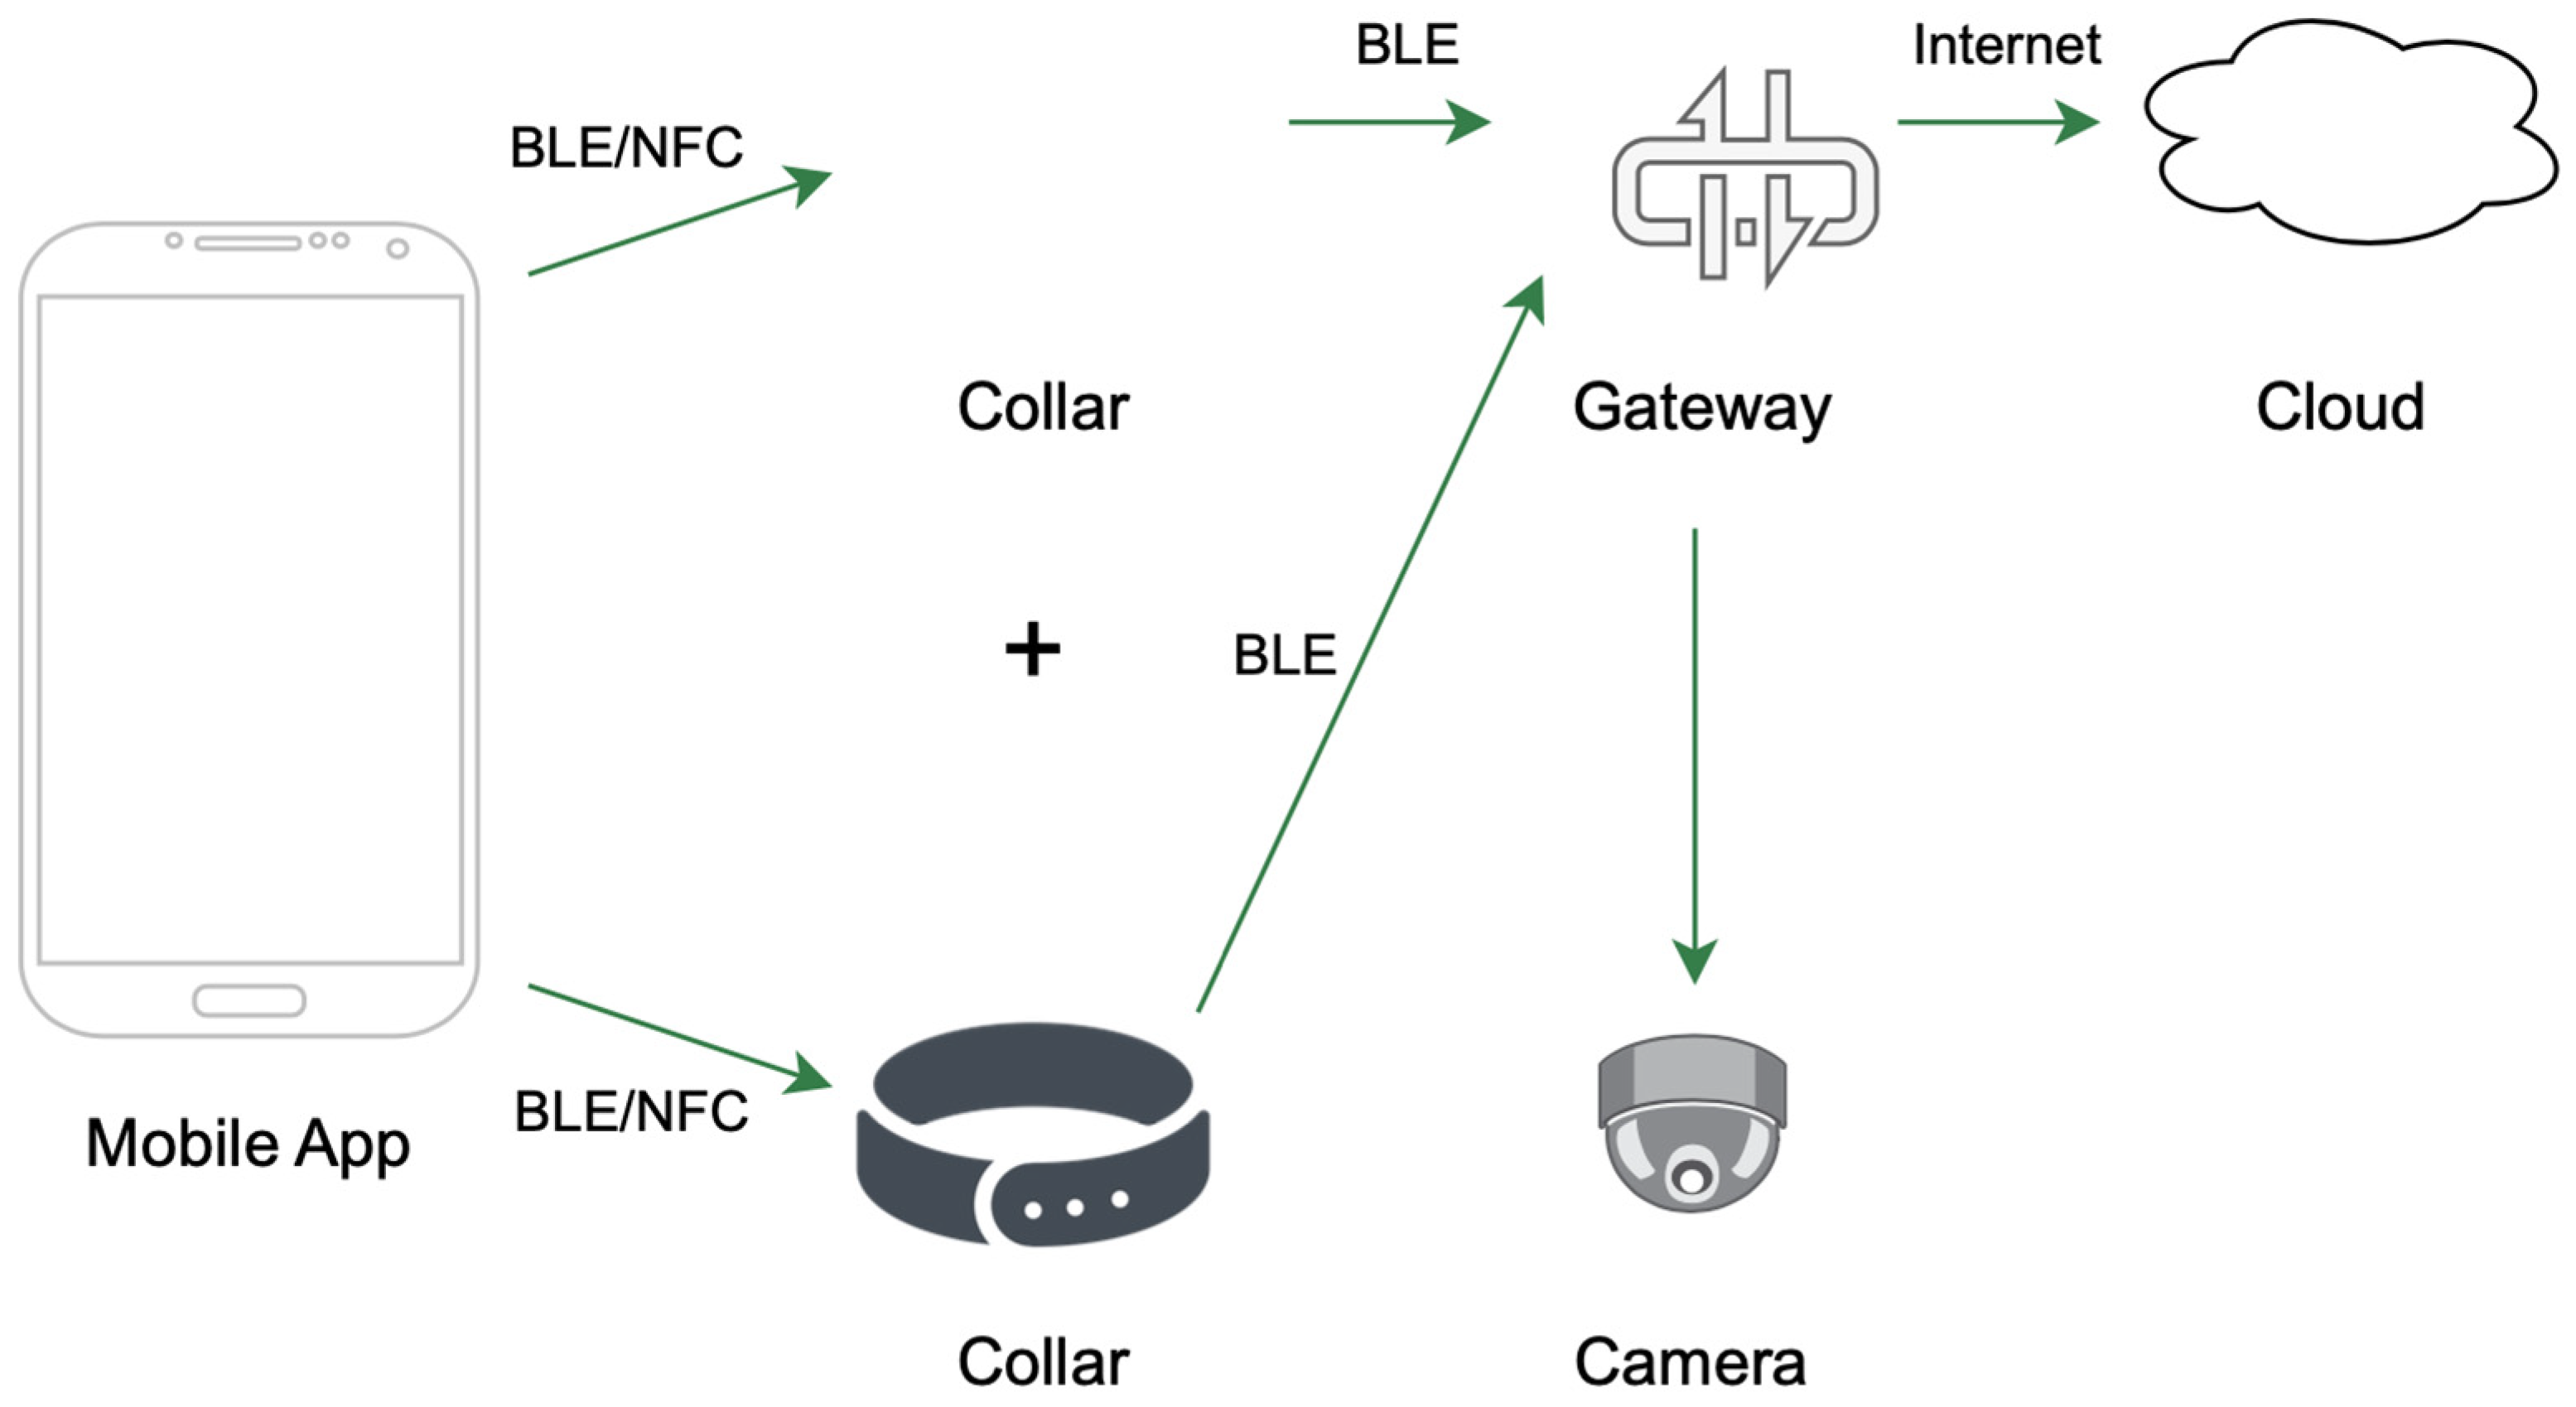
The collars are activated and configured using Near Field Communication (NFC) [19] or Bluetooth Low Energy (BLE) [20] and implement an opportunistic BLE-based communication protocol to transmit data to a gateway installed within the livestock facilities. The monitoring platform, illustrated in Figure 2, also incorporates a set of video cameras that continuously record the animals’ environment, enabling the acquisition of visual data over time. To ensure temporal synchronization across all monitoring devices, system time was standardized using a Network Time Protocol (NTP) server [21].
Figure 2.
Data Gathering System.
2.2. The Flock
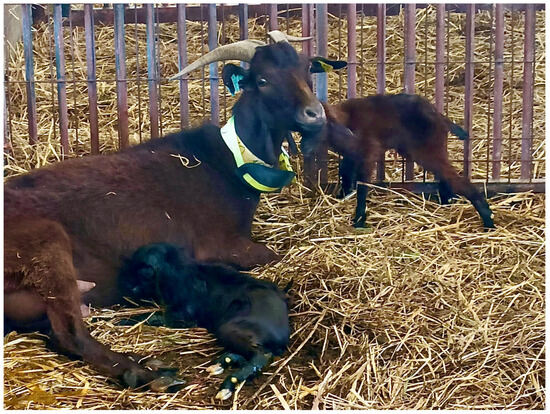
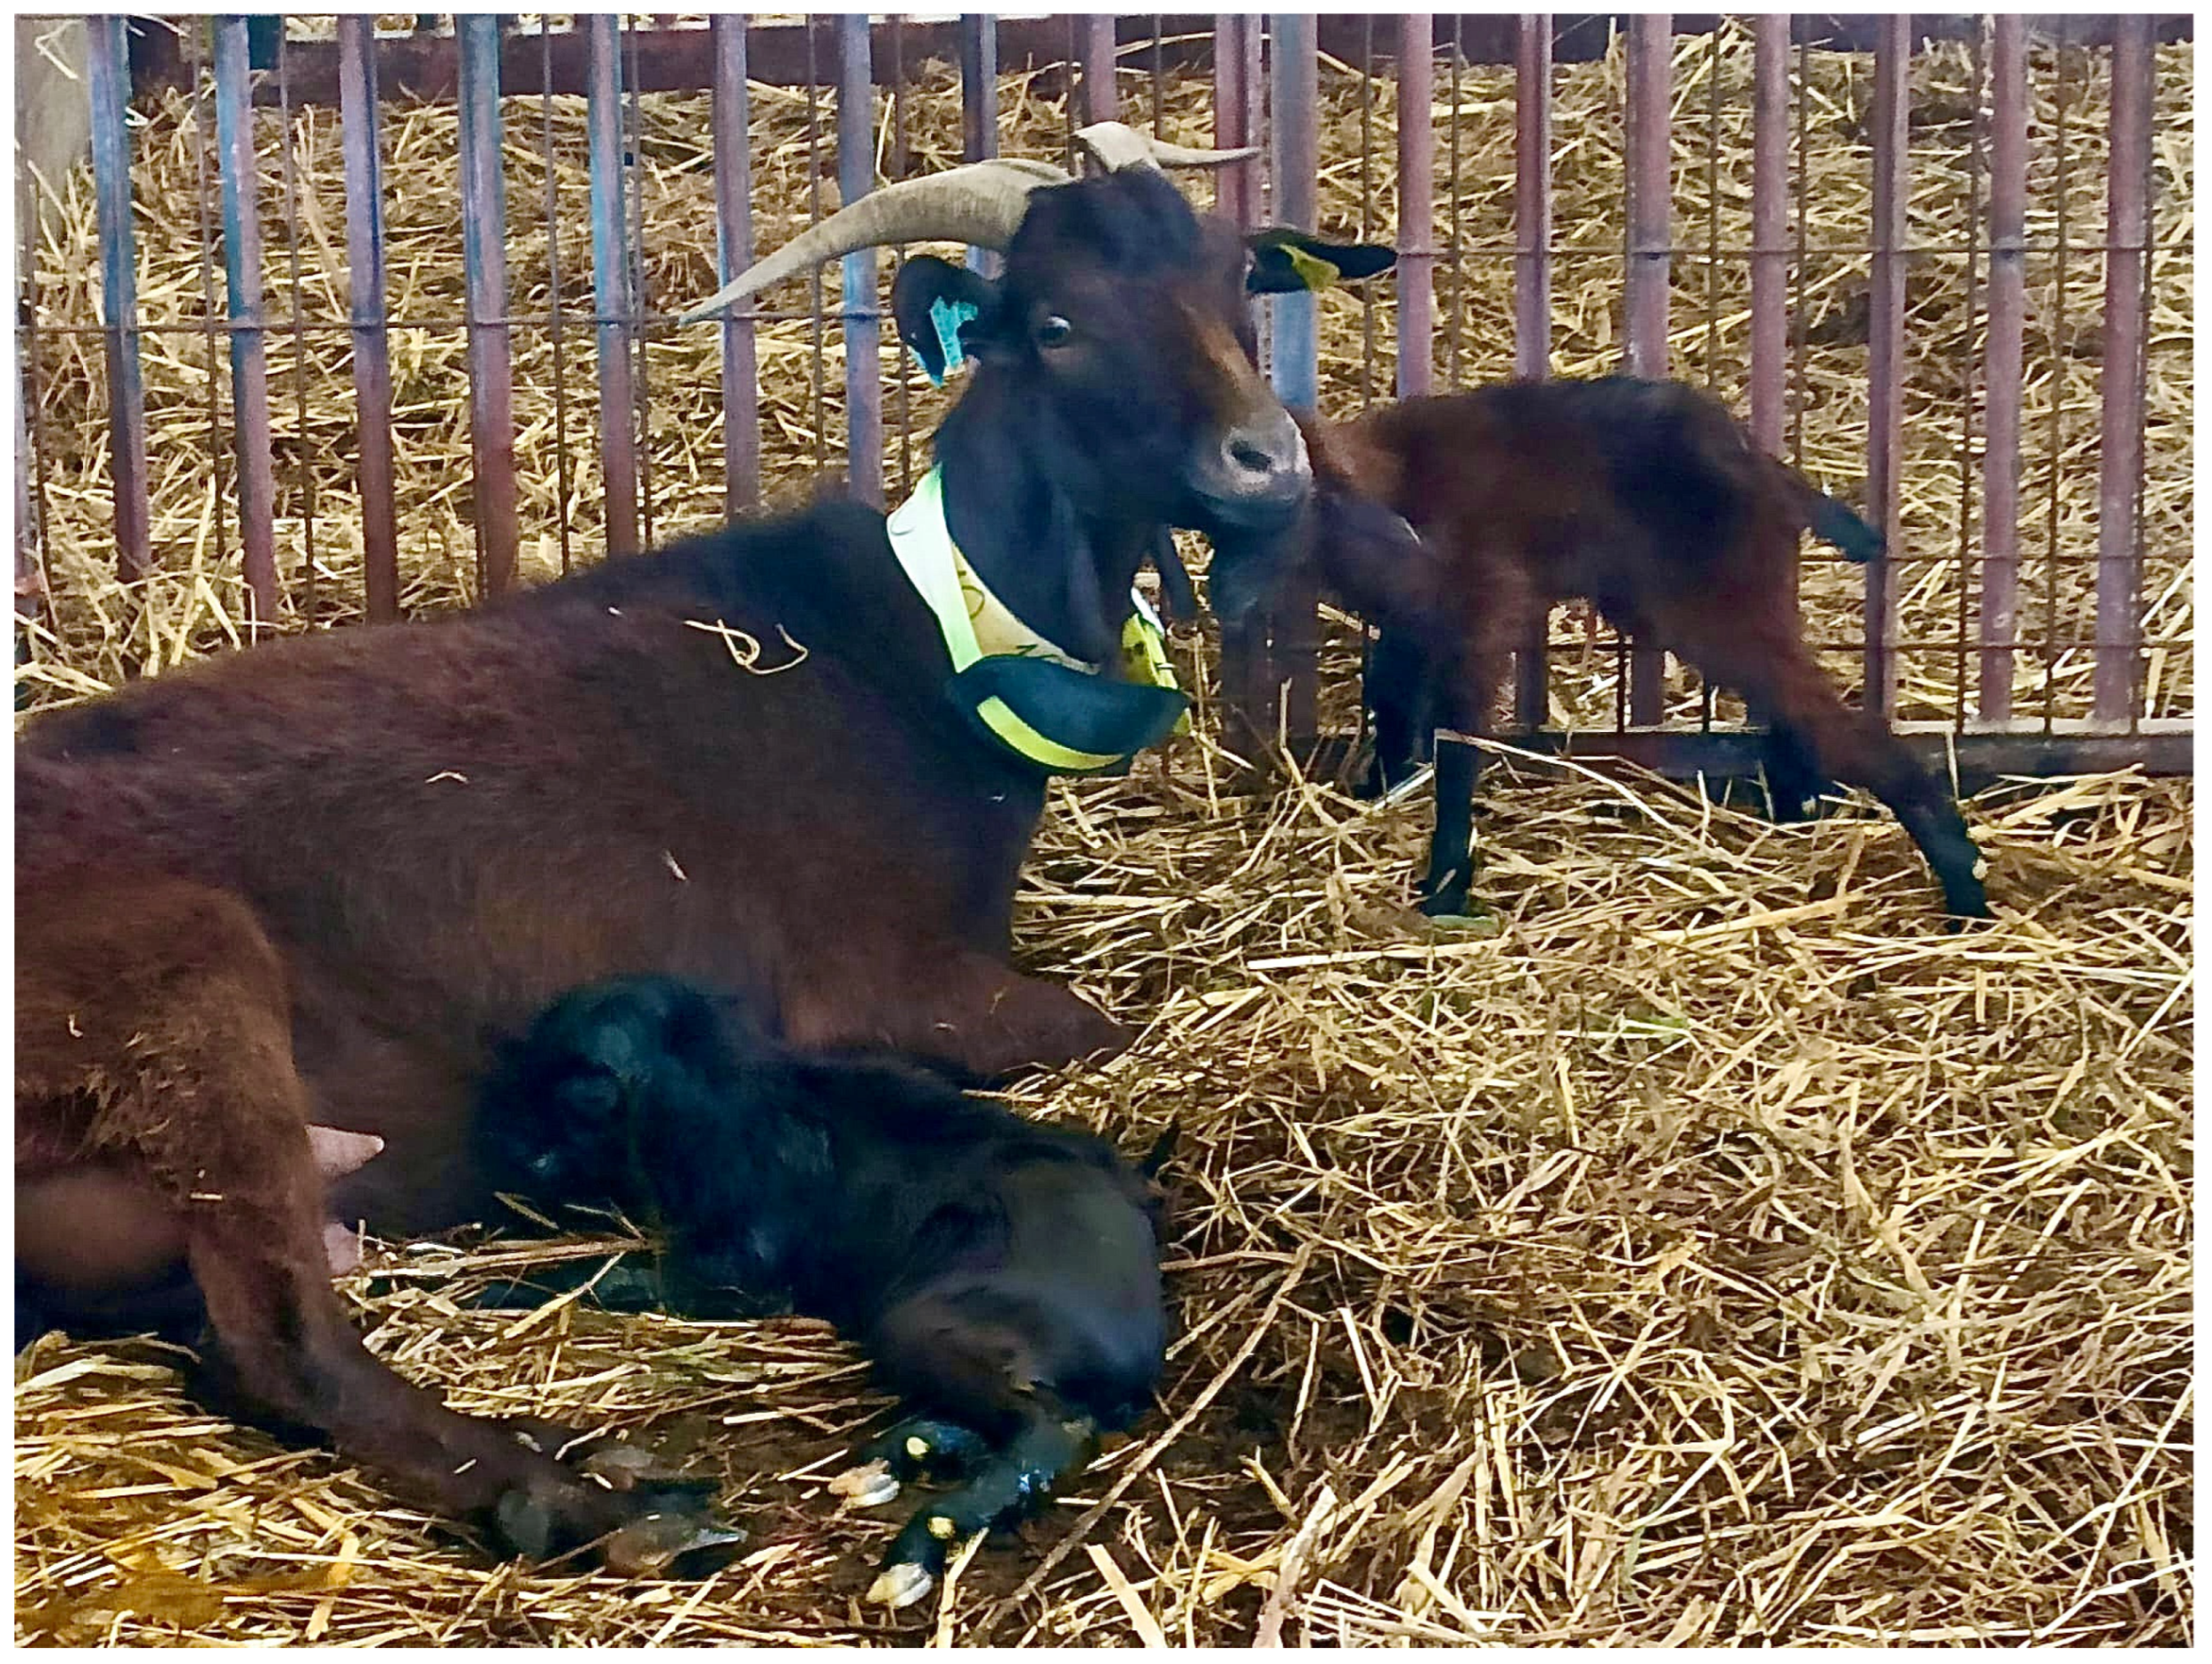
This study used data collected from wearable collars fitted to 28 Charnequeira goats (Figure 3) during the 2024 and 2025 kidding seasons in Santarém (39.19936, −8.73957), Portugal. In 2024, 10 goats gave birth to 10 kids, while in 2025, 18 goats gave birth to a total of 30 kids. Each collar captured tri-axial accelerometer signals (Acc_X, Acc_Y, Acc_Z) and temperature at 20 Hz, providing fine-grained behavioral information [1].
Figure 3.
Chanerqueira goat wearing a monitoring collar, and newborn kids.
The animals were managed according to the farm’s standard practices, ensuring that their routine and well-being were not disrupted for the purpose of the research. Throughout the day, the goats grazed/browsed in the surrounding natural pastures and shrub areas. At the end of each day, they were housed overnight in a controlled and safe environment, where the monitoring process took place. Goats suspected to be 24–48 h from parturition remained indoors. This management approach ensured that data were collected under typical farming conditions, reflecting the animals’ normal daily rhythms and providing a realistic context for monitoring behavior and physiological changes associated with the kidding process.
2.3. Dataset Labeling
To identify any patterns or trends that may be present in the data, a script was developed to design the process and preparation of the positional data collected from the goat collars for detailed analysis related to kidding events from the initial dataset. Its primary goals include:
- Individual goat filtering: Extracts and isolates data for each goat based on their unique collar IDs, allowing for personalized analysis.
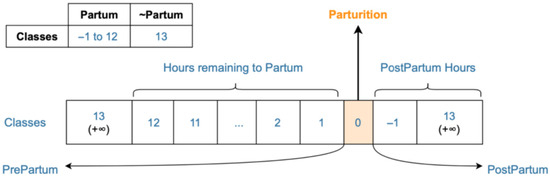
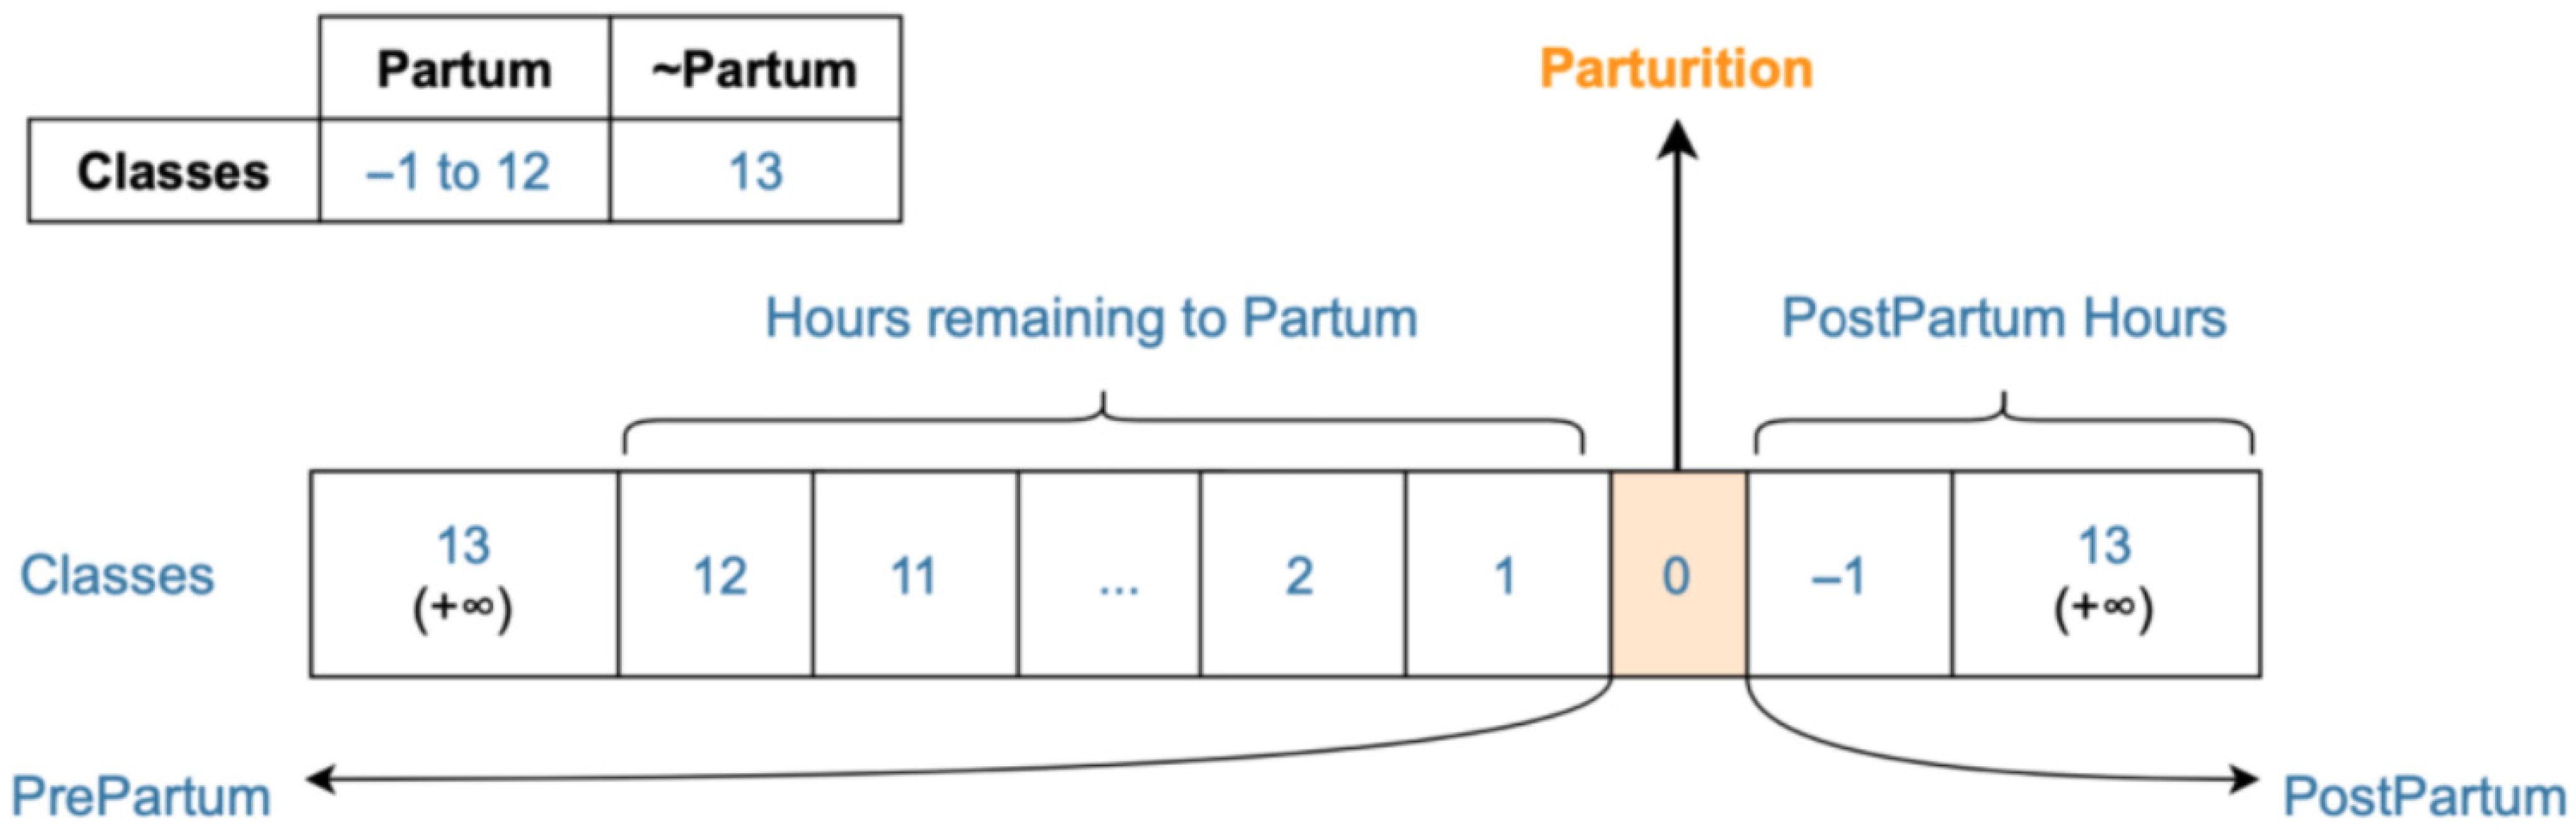
- Class annotation and labeling: Assigns specific class labels to each data point based on its temporal relationship to kidding times. These classes help distinguish periods before, during, and after kidding, enabling the identification of behavioral patterns associated with kidding, crucial for later machine learning predictions. Figure 4 outlines the class labeling process. Classes ranging from −1 to 12 are considered as representing the kidding event, while class 13 corresponds to the non-kidding category. To improve generalization and interpretability, classes are redefined as specific hours relative to kidding time. This allows models to learn temporal patterns and provides farmers with better, actionable forecasts.
- Output generation: Saves the processed and annotated data into individual CSV files for each goat, ready for further analysis and modeling.
Figure 4.
Class labels assigned to each data point based on its temporal relationship to kidding time.
2.4. Generated Dataset
After the dataset labeling process, a fully annotated dataset was generated for each individual goat. Each file corresponds to a single goat and contains time-stamped positional data with assigned kidding-related class labels. Table 1 provides an overview of the generated files, including the total number of records per goat.
Table 1.
Annotated Goat Dataset Overview.
The dataset captures detailed behavioral information across the entire kidding window, with classes reflecting hours relative to parturition. This structure enables both binary and multiclass analysis, supporting the development of ML models to predict kidding events. By storing each goat’s data in separate CSV files, the dataset ensures ease of access, reproducibility, and flexibility for further processing, including feature extraction, normalization, and modeling.
2.5. Dataset Preparation
The preprocessing pipeline ensured both data quality and efficiency. The dataset was then downsampled to 0.5 Hz, 1 Hz, and 2 Hz to explore trade-offs between temporal resolution and performance. Sliding window segmentation ranging from 15 min to 180 min and min-max normalization were applied to highlight temporal trends and standardize feature scales. A chunking strategy enabled large datasets to be processed in memory-efficient batches.
Once each animal’s kidding moment was reliably annotated and the final dataset consolidated, a dedicated preparation stage was initiated. This stage encompassed cleaning, transformation, and dimensionality reduction in the raw signals [22]. Because accelerometer traces inevitably contain noise, missing entries, and irregular motion patterns, these operations are essential, as emphasized by Turner et al. [16]. The preparation pipeline enforces consistency by removing anomalies, harmonizing numerical ranges, selecting salient attributes, and compressing the feature space.
Accurate predictive modeling depends on carefully prepared data. A key element of this workflow is normalization, implemented through Min–Max scaling to map all numeric attributes onto a common range (0–1). The scaling operation is expressed in Equation (1). This transformation ensures that each feature contributes comparably to the model and mitigates disparities caused by differences in animals’ activity levels or sensor placement. Converting heterogeneous acceleration values into the same scale shifts the focus from raw magnitudes toward behavioral trends, strengthening both accuracy and generalization.
where Xscaled—Scaled value; X—Value to normalize; Xmin—Minimum value detected; Xmax—Maximum value detected.
To examine how sampling frequency influences the information captured, the raw 20 Hz series was systematically resampled to alternative rates of 0.5, 1, and 2 Hz. For each resampled stream, numerical signals were aggregated with the median, whereas categorical labels were assigned using the mode, implemented efficiently with the polars library [23].
To capture temporal dynamics in the sensor data, a sliding-window transformation was applied, whereby each observation was augmented with a fixed-length history of preceding values. This approach generated additional time-lagged attributes (e.g., prev_101_Acc_X) for each accelerometer and temperature channel, enabling the models to learn sequential patterns rather than relying exclusively on instantaneous measurements.
Given that the complete dataset comprised several million records, loading the entire corpus into memory was not feasible. Therefore, a chunk-based processing strategy was adopted to partition the dataset into manageable segments [24]. Prior to large-scale model training, an initial hyperparameter optimization was conducted on five randomly selected chunks using Optuna [25], an automated hyperparameter optimization framework. The optimization targeted the Matthews Correlation Coefficient (MCC) [17] as the objective function and was performed separately for binary and multiclass classification configurations. Once the optimal hyperparameter settings were identified, they were applied uniformly across all data segments, thereby avoiding redundant tuning.
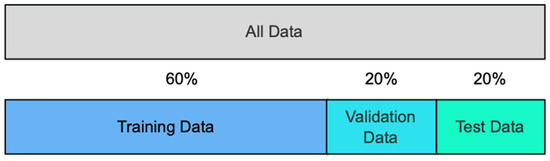
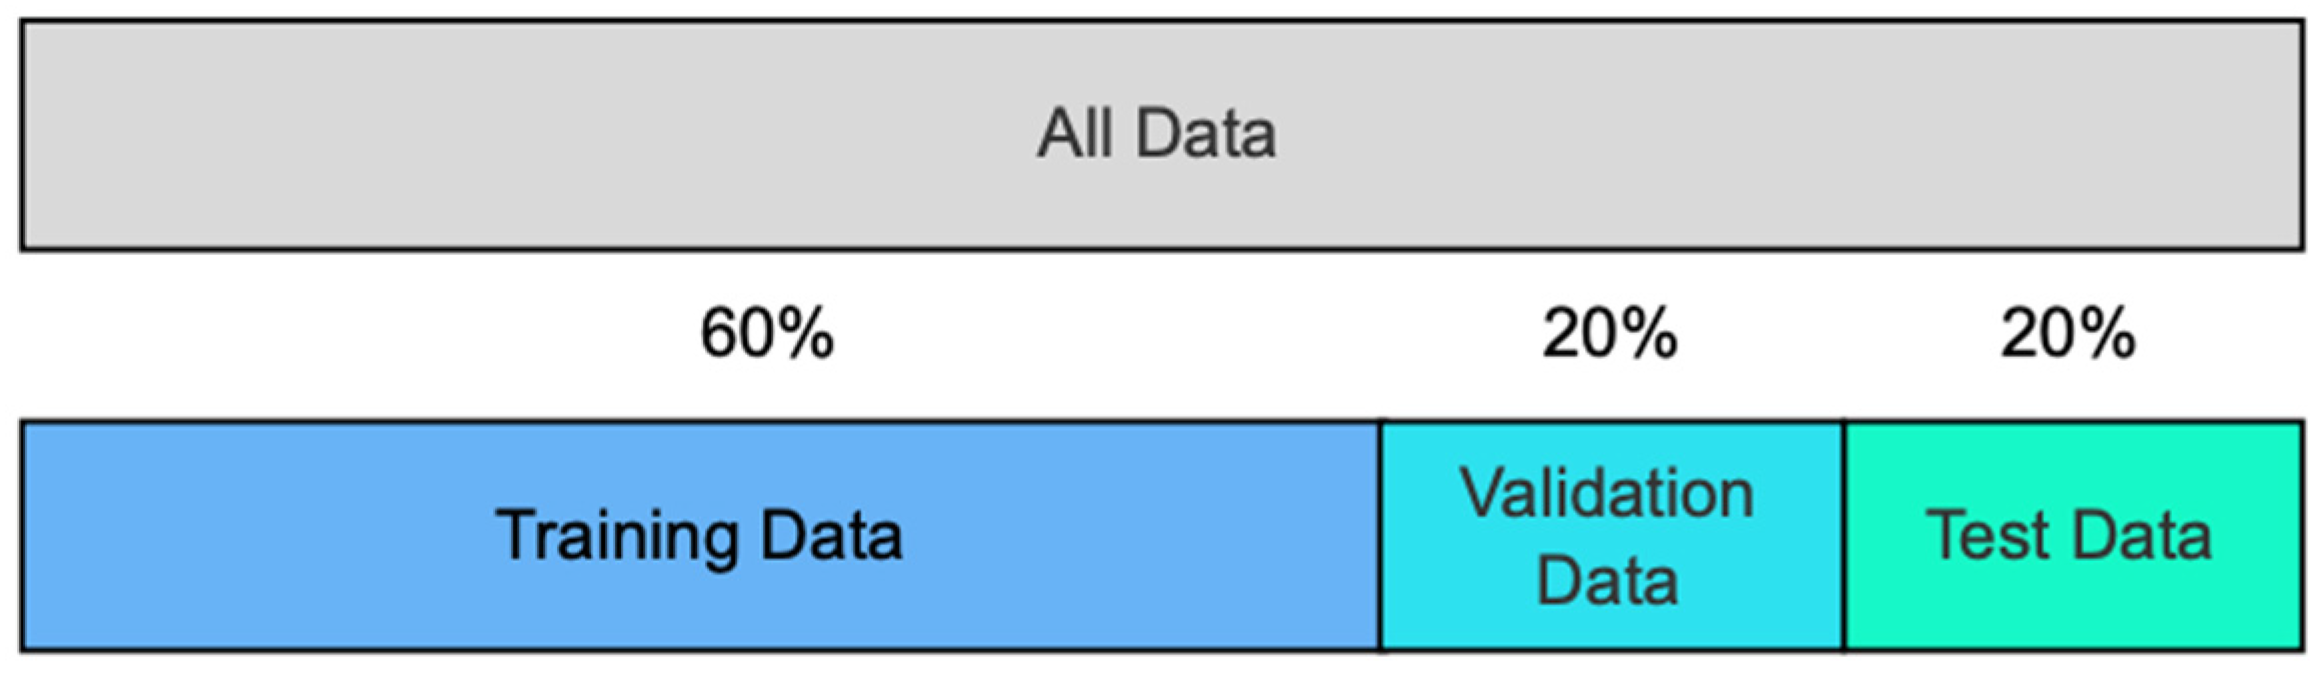
Model predictions were subsequently generated sequentially for each chunk and consolidated into a single prediction set. Because all segments shared identical hyperparameter configurations, the resulting outputs were directly comparable and could be aggregated without further normalization. This approach ensured robust and memory-efficient processing and enabled a coherent evaluation across the full dataset, without the need to average performance metrics across individual segments. For this experimental setup, the chunked dataset was divided into training (60%), validation (20%), and test (20%) subsets, as illustrated in Figure 5 To prevent information leakage and optimistic bias, the dataset splitting procedure followed a predefined strategy, which is described in detail later in this section.
Figure 5.
Dataset split into training, validation, and test subsets.
To ensure the model learns generalized behavioral patterns associated with the lambing event rather than overfitting to individual animal identities, we implemented a rigorous subject-specific normalization and temporal splitting strategy. Raw acceleration data inherently contains the “signature” of an individual sheep, driven by distinct physical constitutions, velocities, and forces; preliminary testing indicated that using raw values resulted in poor generalization (performance < 30%). By normalizing the data streams per subject, we effectively decoupled the movement intensity from the individual’s identity, isolating the behavioral dynamics relevant to the classification task. Furthermore, data partitioning was performed using a temporal sliding window approach rather than random shuffling. This strictly enforces a chronological separation where the test set consists of future segments relative to the training set, thereby simulating a real-world monitoring scenario where the goal is to detect the deviation from a baseline state over time.
2.6. A Two-Stage Architecture
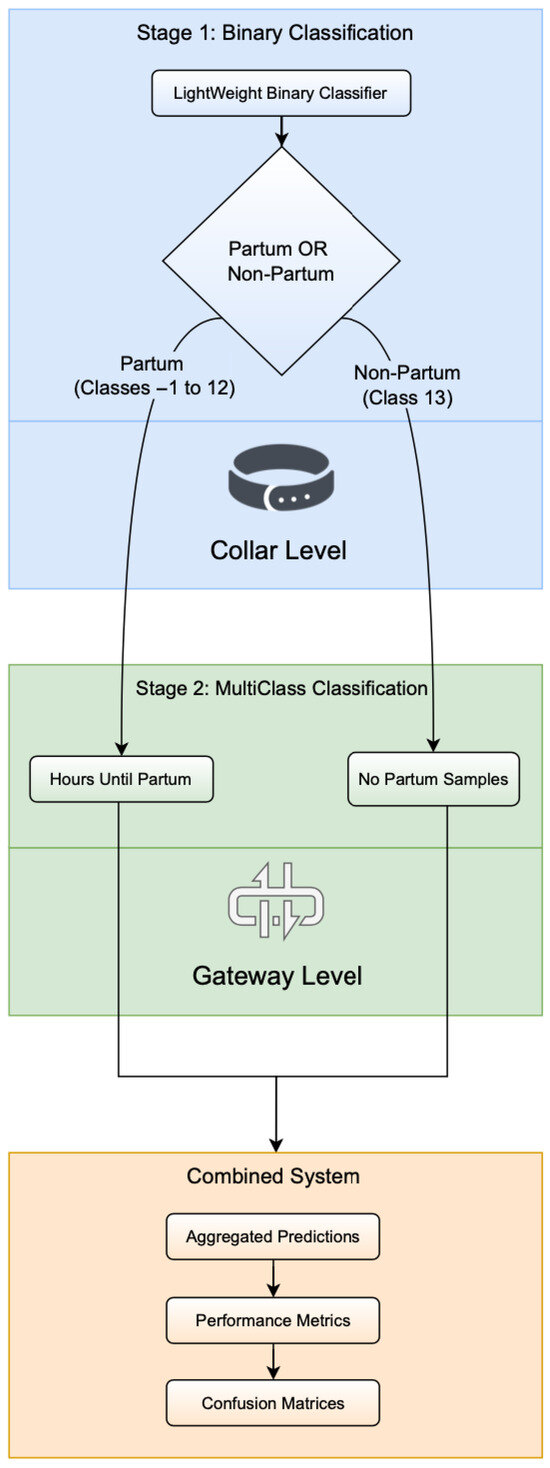
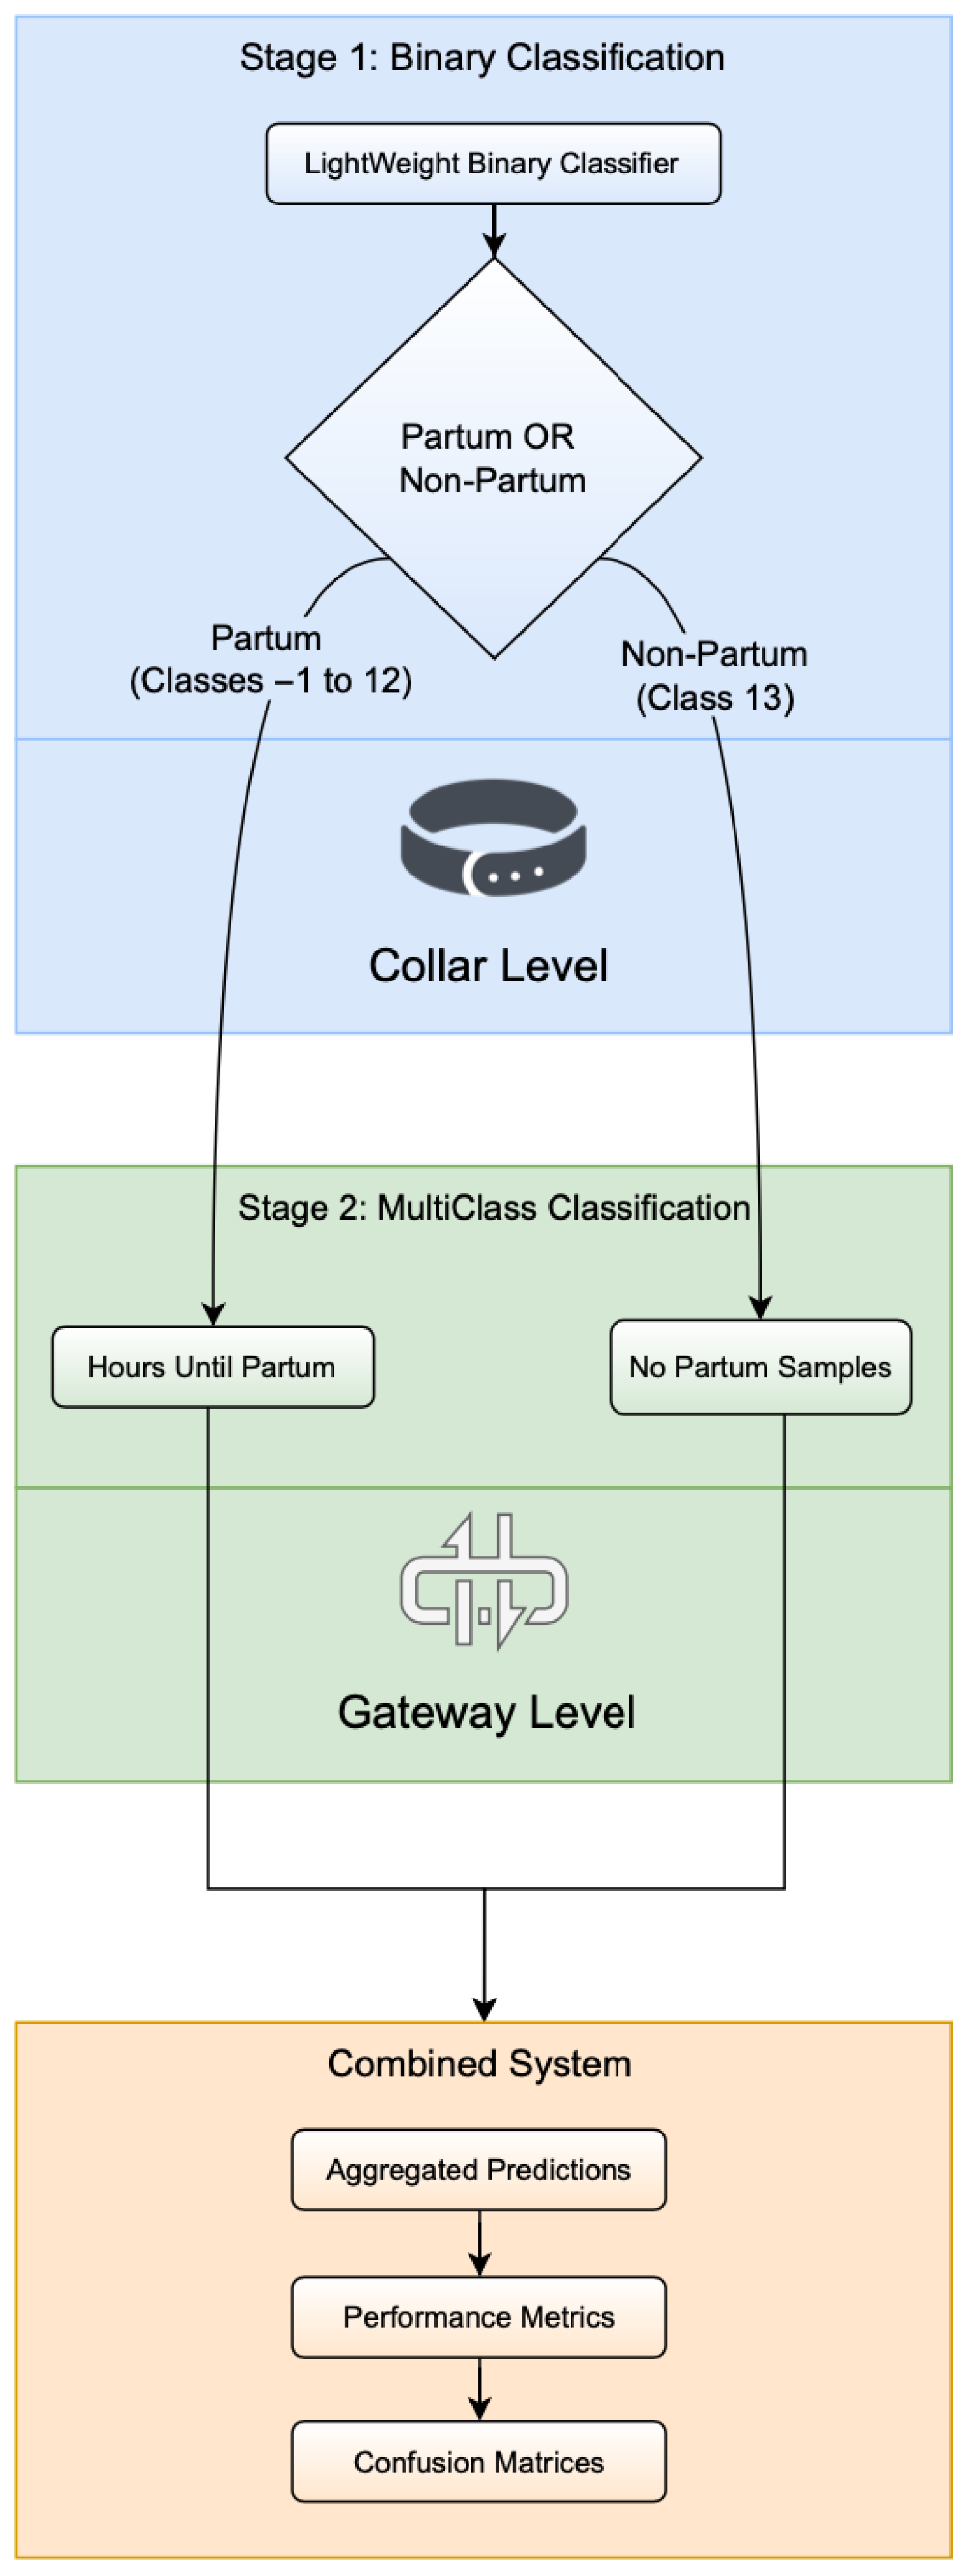
This work proposes a resource-aware and scalable machine learning system tailored to real-time detection and estimation of parturition in goats. The system is designed to function in low-power wearable environments while maintaining high prediction performance. It is structured into a two-stage classification pipeline that allows for early detection of kidding and a precise estimation of the moment of parturition. The architecture strategically distributes the computational load between the wearable collar and the gateway, optimizing energy use, bandwidth, and deployment feasibility. A low-level workflow diagram is presented in Figure 6.
Figure 6.
Two-Stage System Architecture Overview.
The proposed system consists of two interconnected stages: a binary classification stage and a multiclass classification stage. The first stage is responsible for quickly and efficiently filtering relevant data segments that potentially indicate parturition. The second stage, activated only for triggered samples, provides a fine-grained estimate of the time until kidding.
The first stage of the proposed system is designed as a lightweight binary classifier that determines whether a given time-series window corresponds to parturition-related behavior (class P) or non-parturition activity (class~P). This model is intentionally optimized for low computational complexity to enable execution directly on the animal-mounted collar, which is subject to strict constraints in terms of processing capability and battery life. By performing this initial classification locally, the system avoids continuous data transmission to the gateway, thereby substantially reducing energy consumption and communication overhead. Only data windows identified as potential parturition events are forwarded to the subsequent processing stage [1].
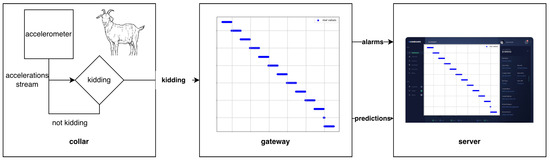
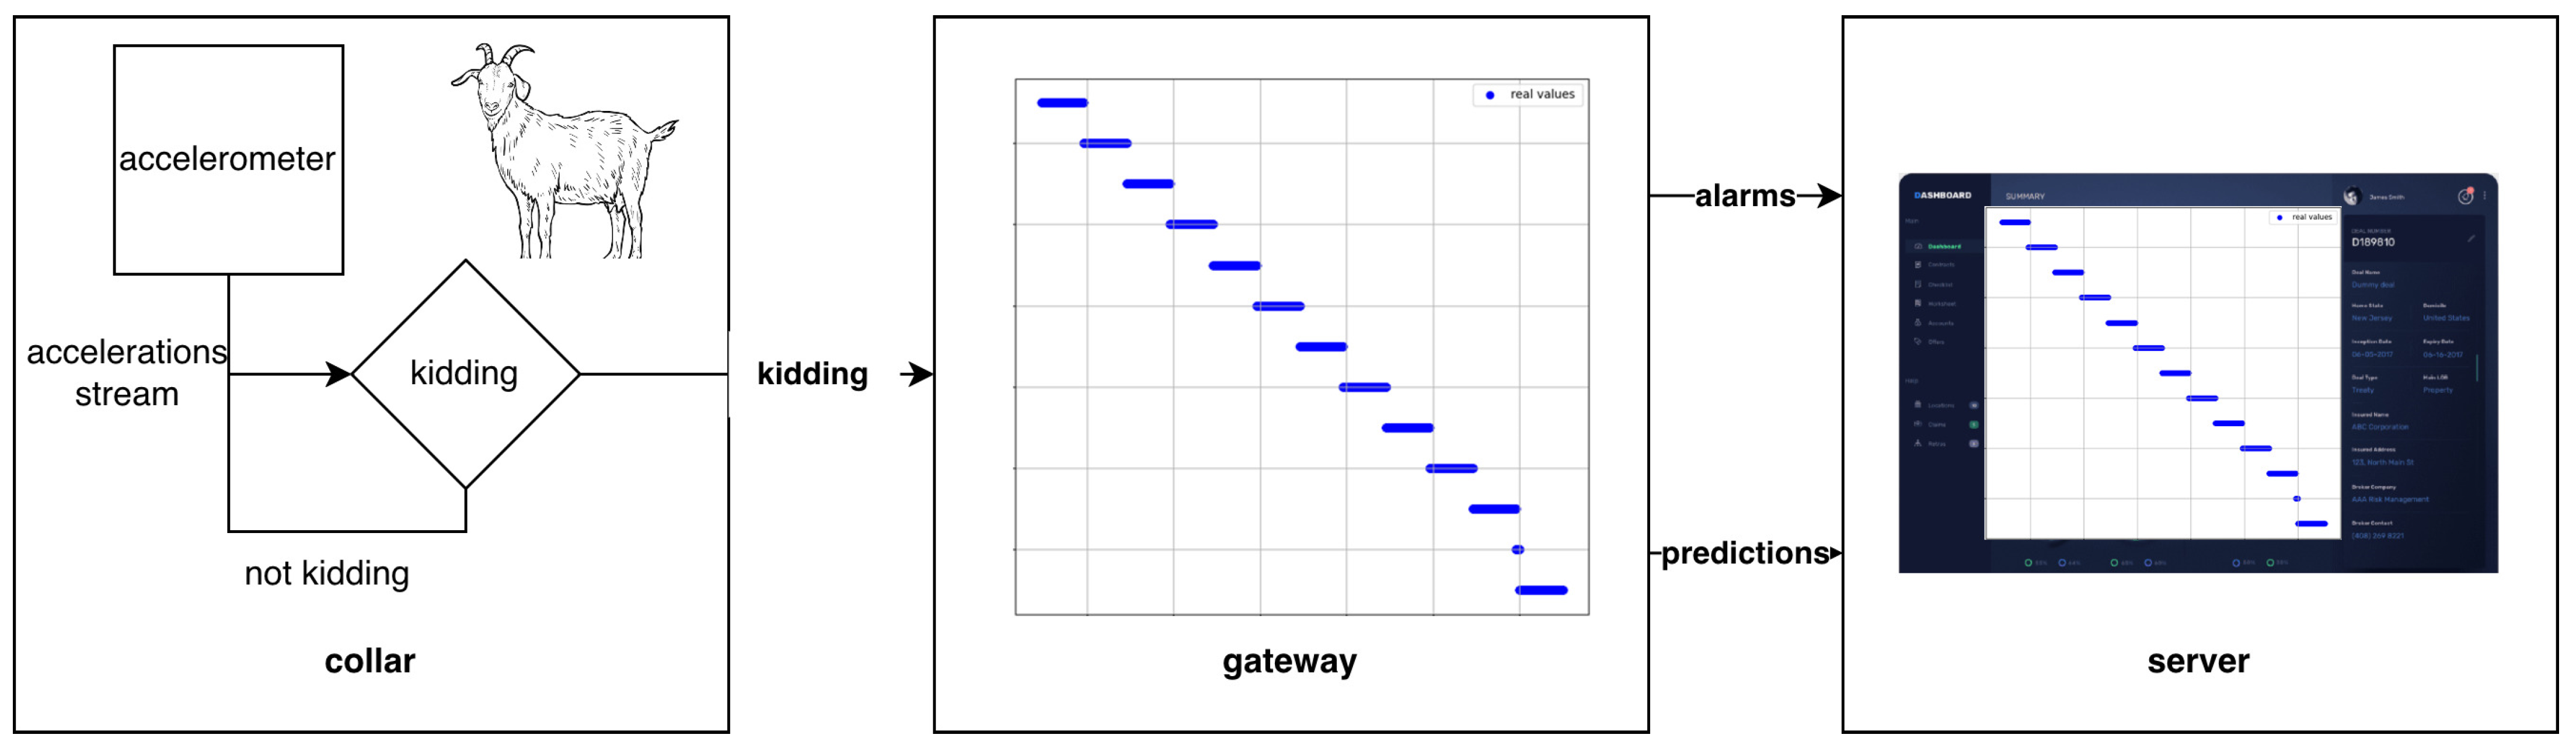
In the second stage, a more detailed classification task is performed. Data segments flagged by the first-stage classifier are transmitted to a gateway device equipped with greater computational resources. At this level, a multiclass classifier estimates the remaining time to kidding. The model is trained on 14 discrete classes, ranging from 12 (12 h before birth) to −1 (1 h after birth), with class 0 corresponding to the exact time of kidding. Because only a subset of the data is processed at this stage, overall resource consumption is minimized while maintaining high predictive accuracy. The overall system architecture, integrating the outputs of both stages, is illustrated in Figure 7.
Figure 7.
Detailed two-stage system architecture.
In the proposed architecture, continuous communication between the collar and the gateway via Bluetooth is not required. The first stage—referred to as the filtering stage—is responsible for identifying data windows associated with kidding-related behavior. Only when a data segment is classified as relevant is the corresponding raw data transmitted to the gateway, where it supports alert generation and the estimation of the remaining time until parturition. When both stages are integrated, the system produces final predictions supported by aggregated performance metrics and confusion matrices, which are analyzed separately for the binary and multiclass classification tasks to identify potential sources of misclassification.
This two-stage architecture enhances system scalability by decomposing the kidding detection problem into complementary subtasks, thereby enabling efficient optimization and timely behavioral predictions within a 14 h prediction window. The lightweight nature of the first-stage classifier makes it suitable for real-time deployment on resource-constrained collars. For both stages, multiple machine learning algorithms were trained and evaluated, with the best-performing model selected for each task. Specifically, the binary classification stage evaluated Decision Trees, k-Nearest Neighbors (KNN) [26], and Logistic Regression, while the multiclass stage considered Random Forests, Decision Trees, KNN, Logistic Regression, Extra Trees [27], and Bagging classifiers [28]. These algorithms were selected for their balance between interpretability, robustness, and low computational cost, making them appropriate for deployment in wearable sensing environments. This methodological choice is consistent with prior work, such as Ramos et al. [2], which demonstrated the effectiveness of tree-based and ensemble approaches for parturition detection in small ruminants using accelerometer data.
Given the chunk-based data processing strategy, predictions generated for individual chunks were aggregated into a unified evaluation pipeline. Performance metrics were computed using class-weighted training strategies to address class imbalance. In particular, the class_weight = ‘balanced’ option in scikit-learn was employed during model training, assigning weights inversely proportional to class frequencies in the training data. The dataset was partitioned using random stratified sampling at the window level, such that samples in the test set may originate from animals also represented in the training set. As a result, the reported performance metrics reflect discriminative capability under controlled experimental conditions rather than generalization to unseen animals or herds. While class weighting was applied during training to mitigate imbalance effects, test-set metrics were computed using the original class distributions to provide realistic performance estimates.
For each stage (binary and multiclass), as well as for the combined system outputs, detailed confusion matrices were generated, and the best-performing models were retained. All predictions were produced exclusively on the held-out test set, which remained completely isolated throughout model selection and hyperparameter optimization. Confusion matrices were row-normalized, with rows corresponding to true classes and columns to predicted classes, enabling clear visualization of correct classifications and misclassification patterns.
Upon completion of each sampling-rate and window-size configuration, the best-performing model across all chunks was stored in pickle (*.pkl*) format [29]. Test-set predictions were generated solely using this pre-selected model, with no further model selection or hyperparameter adjustment based on test performance. In addition, configuration metadata and aggregated results were stored to facilitate systematic comparison across different sampling frequencies and window sizes, while maintaining memory efficiency through batch-based processing. All evaluated model configurations were assessed using standard machine learning metrics, including Accuracy, Precision, Recall, F1-score, and MCC. For the results presented in the following section, each confusion matrix includes a title indicating the corresponding MCC value, sampling rate, and window-size configuration. A detailed presentation of the results is provided in Section 4.
Hyperparameter optimization was performed using the Optuna framework [25], independently for the binary and multiclass classifiers. Model selection based on MCC and complementary evaluation metrics was conducted exclusively on the validation set, ensuring strict isolation of the test data throughout the optimization process. Final performance evaluation was carried out on the held-out test set using confusion matrices and the full set of performance metrics, providing unbiased estimates of model performance within the constraints of the available dataset.
3. Results
This experiment evaluated the performance of a Decision Tree Classifier for binary task, and, for the multiclass task, evaluated additional ensemble models, Random Forest, Extra Trees, and Bagging, selecting the best-performing model among them. It also explored the impact of a binary model, Random Forest, and a multi-class classifier. The results showed that the binary model was most penalized when there were more historic data and a higher sampling rate. The combination of both classifiers resulted in a two-stage system.
Frequency and Time Window Analysis
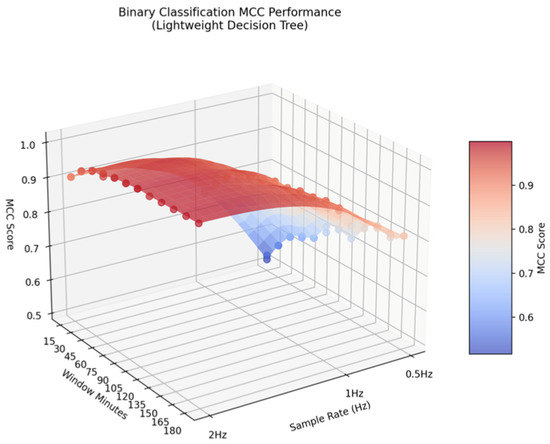
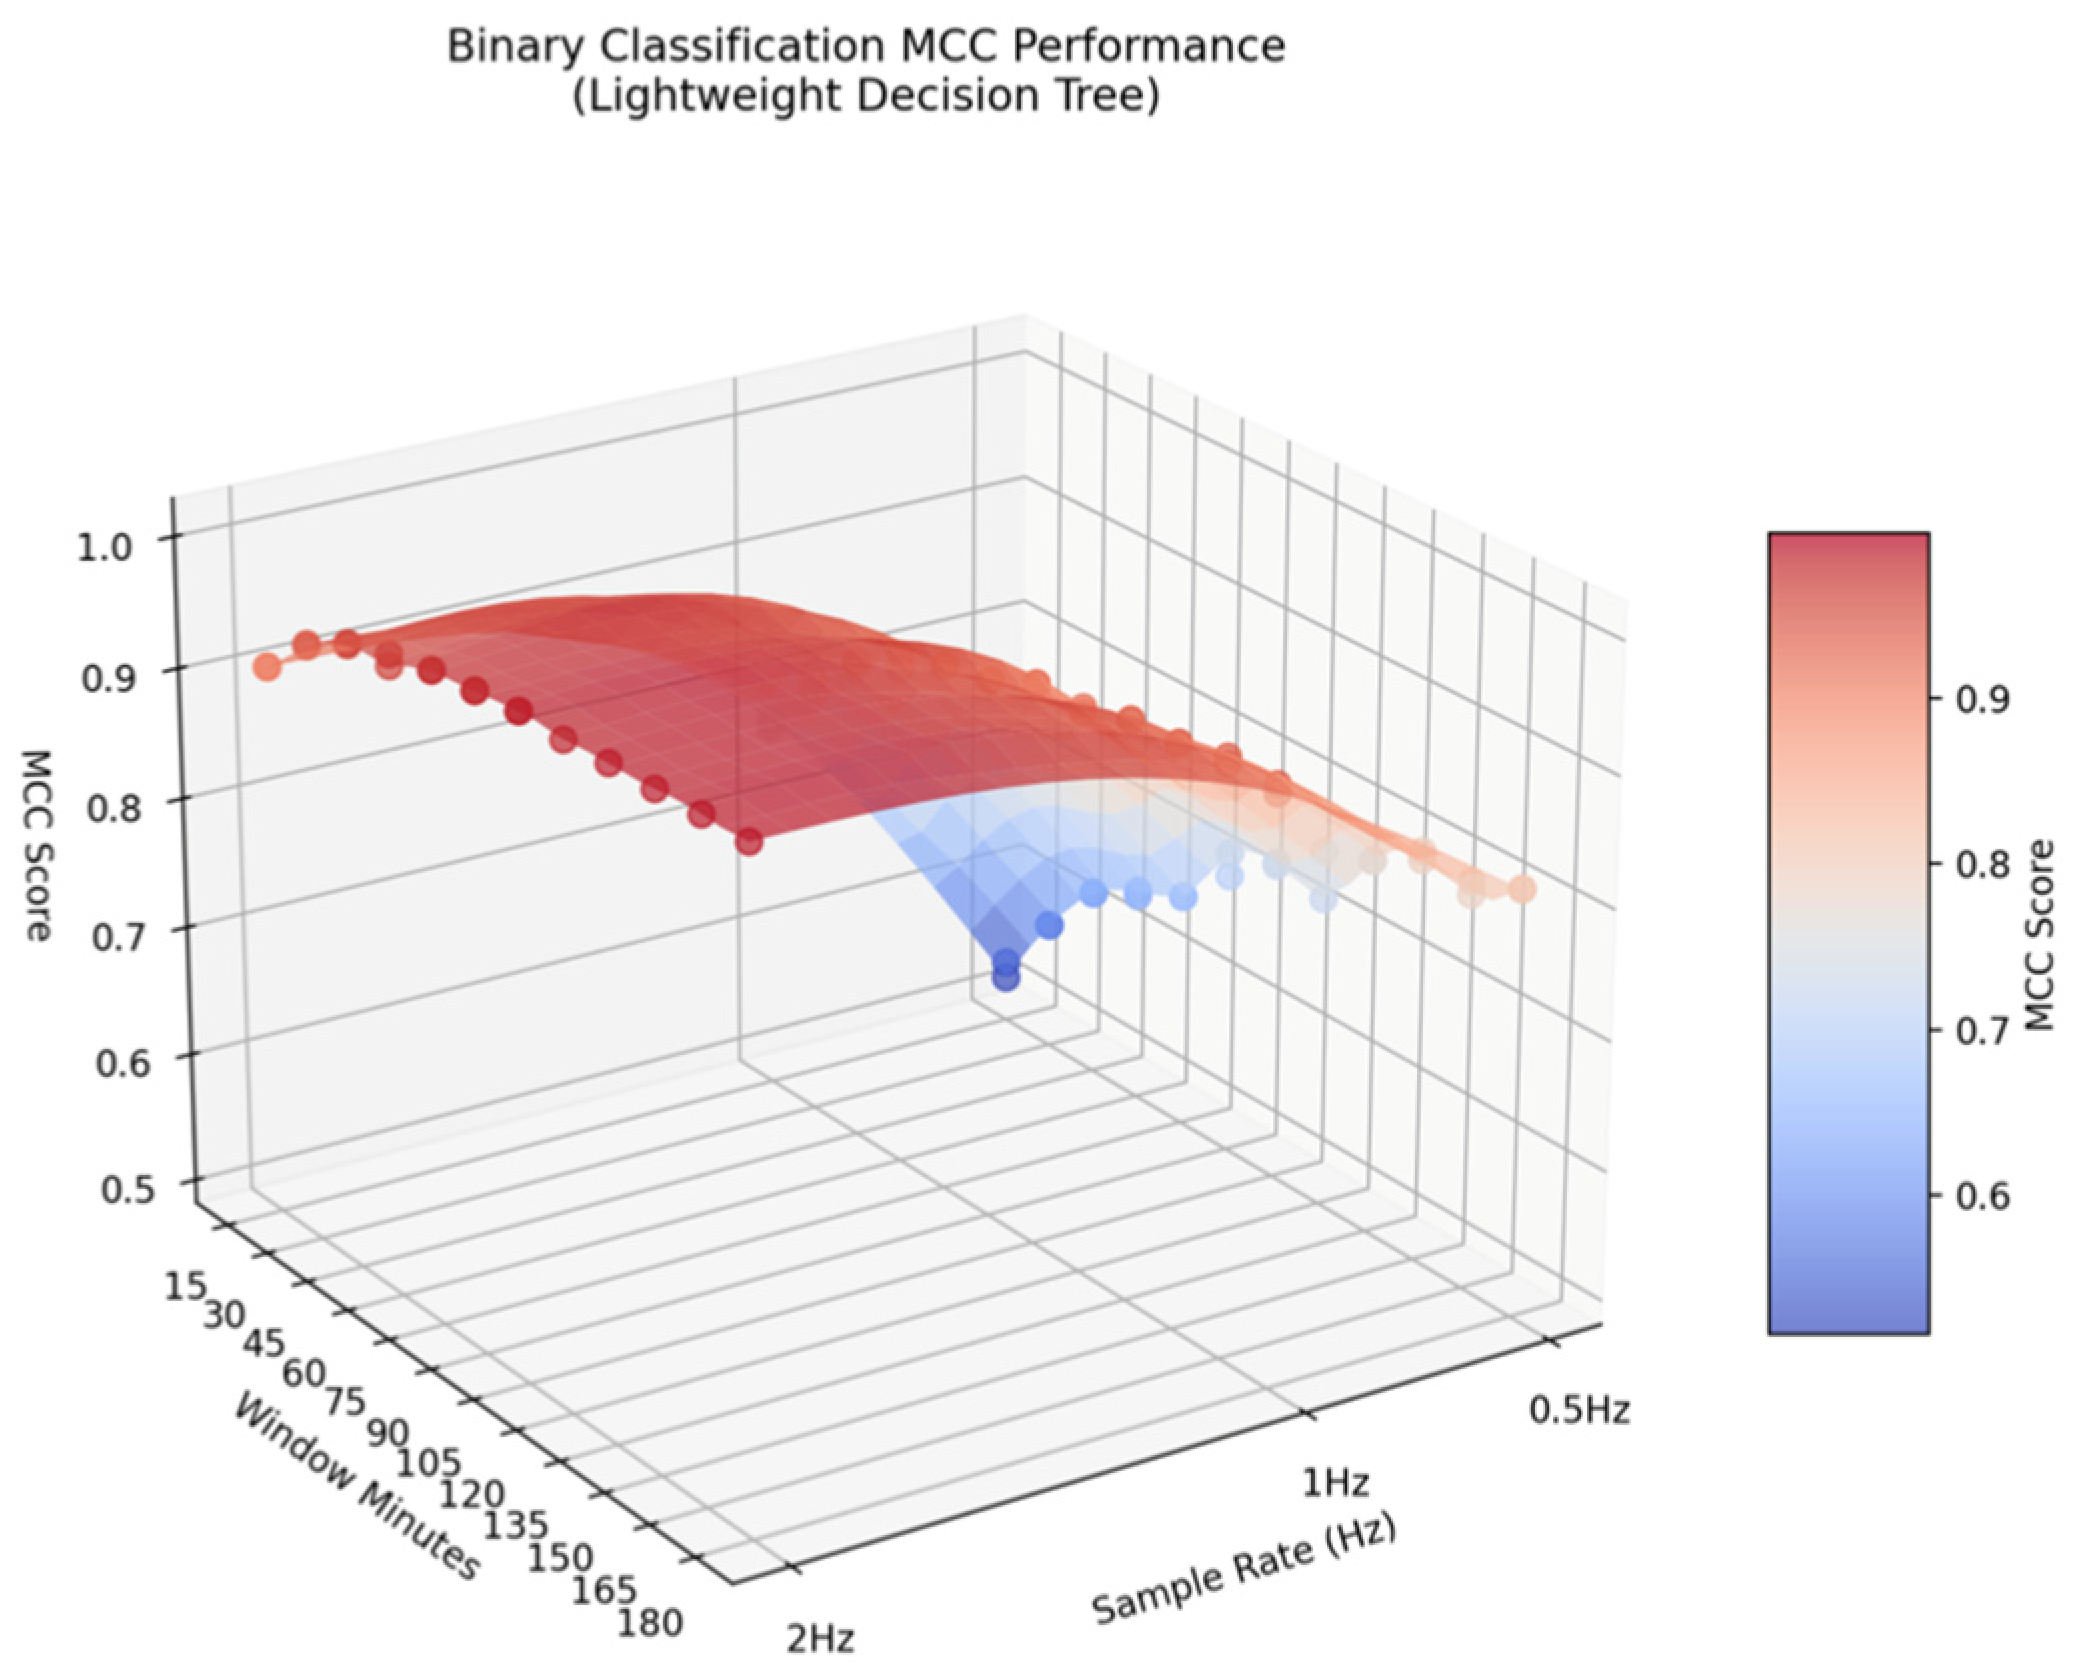
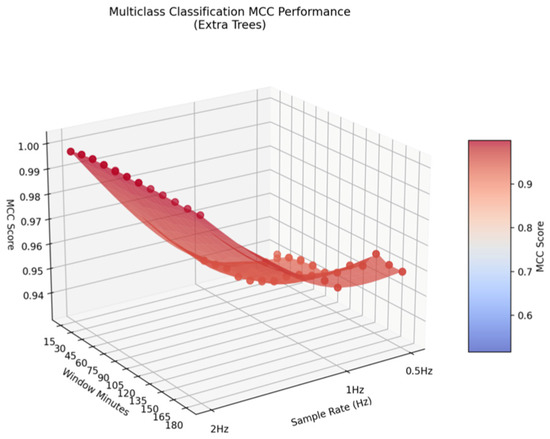
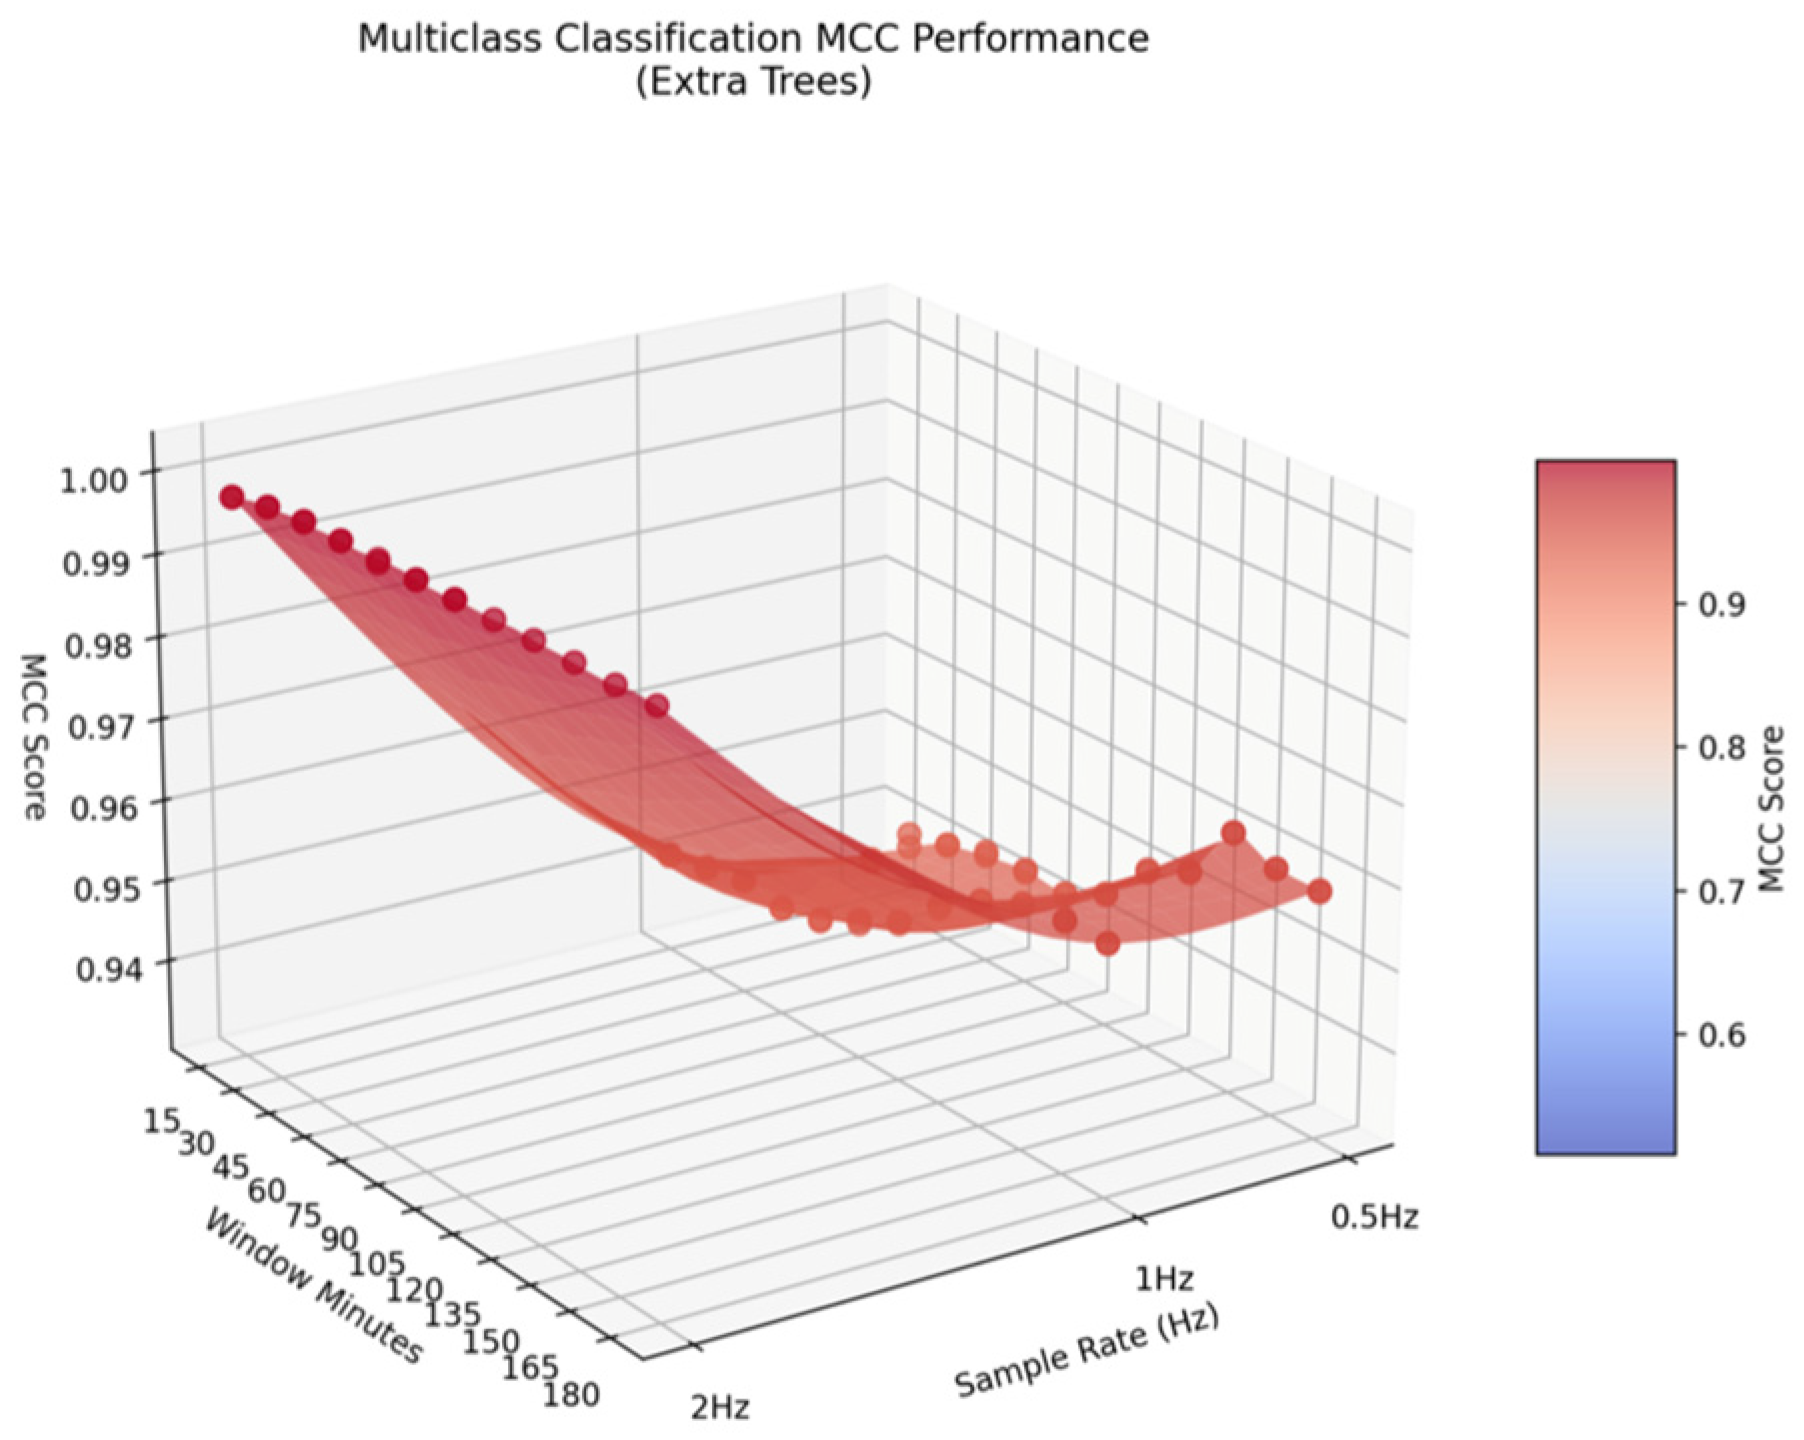
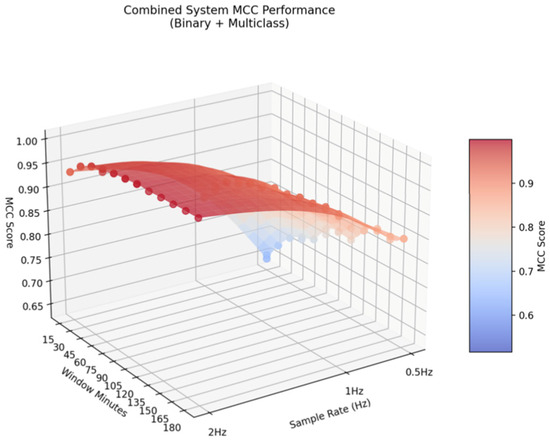
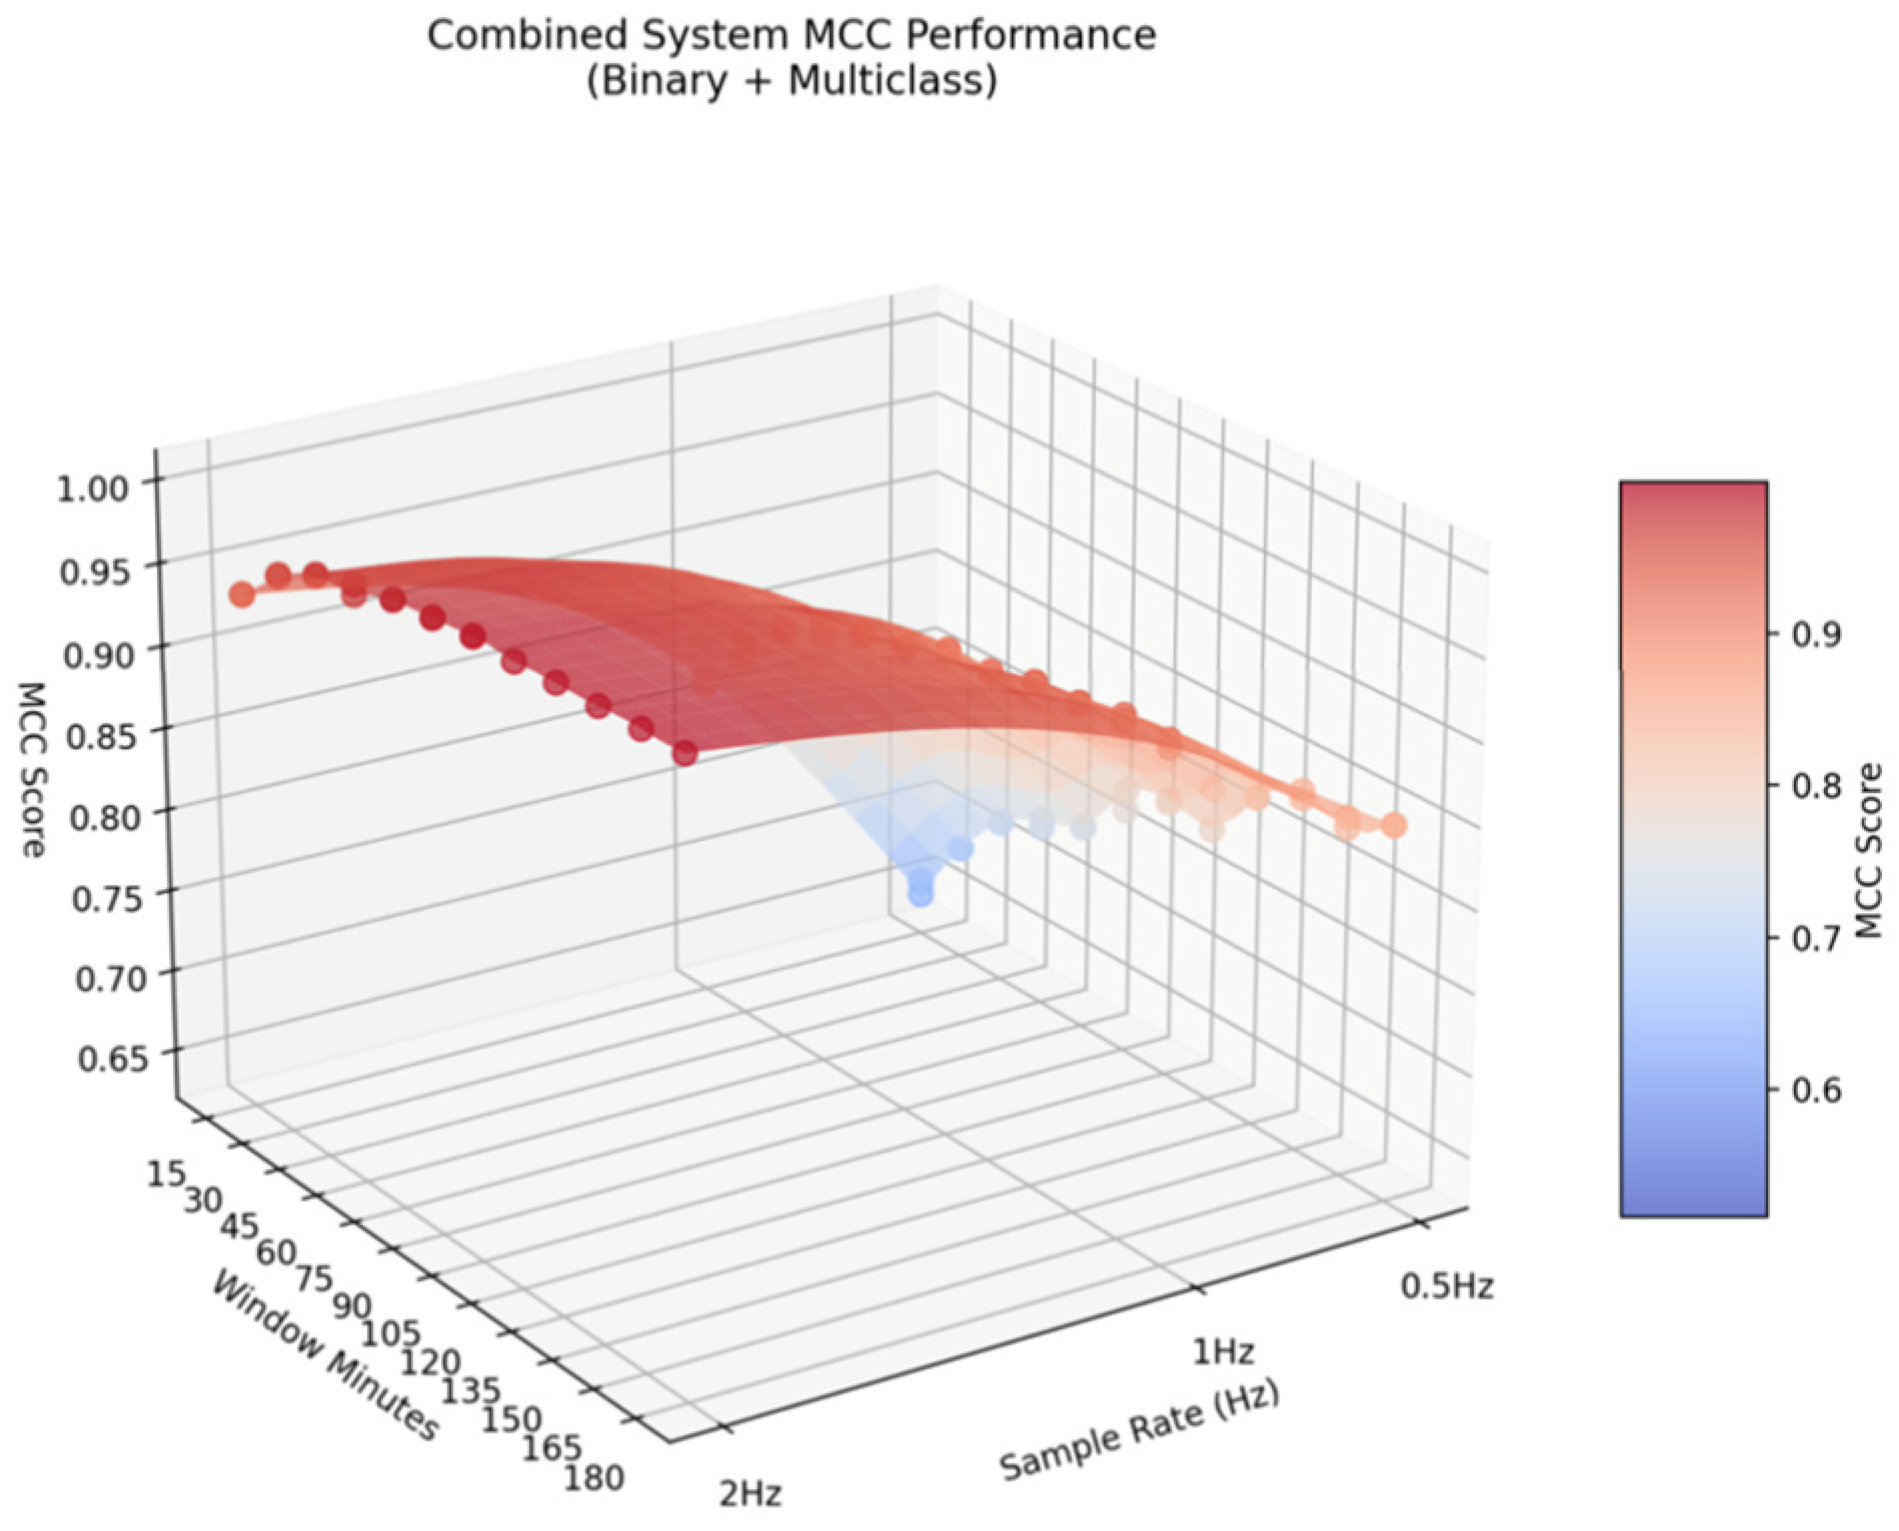
The study aimed to find the best combination of models for accurate and strong predictions on goat kidding. The lowest sample rate (0.5 Hz) resulted in poorer predictive performance compared to 1 Hz and 2 Hz results as presented in each surface plot (Figure 8).
Figure 8.
Surface plot of the Lightweight Decision Tree model across all combinations.
After compiling the model results, the next step was to identify the best configuration for accurate and robust predictions. The combined model surface plot (Figure 9 and Figure 10) shows that the lowest sample rate (0.5 Hz) consistently yielded weaker performance than 1 Hz and 2 Hz. Accuracy, robustness, and collar input characteristics, derived from the median of sensor readings at the chosen rate and window, were considered. After consultation with the collar team, the optimal setup was set to 1 Hz with a 90 min window, achieving an MCC of 0.9 on the first-stage classifier. This indicates that the original 20 Hz frequency is not essential for strong parturition predictions.
Figure 9.
Surface plot of the Multiclass model across all combinations.
Figure 10.
Surface plot of the Combined model across all combinations.
After discussing the difference between the best and worst combinations, at this point, it is essential to consider and further explore the optimal configuration (1 Hz-90 min).
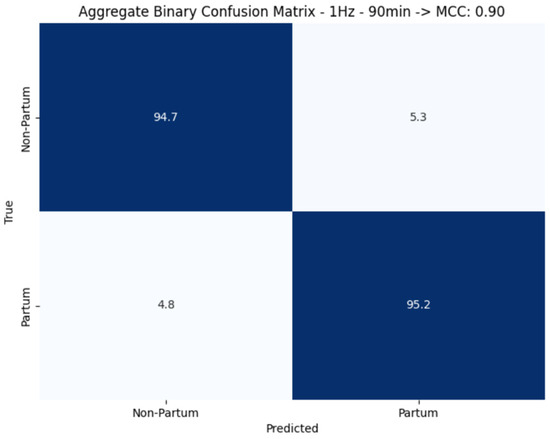
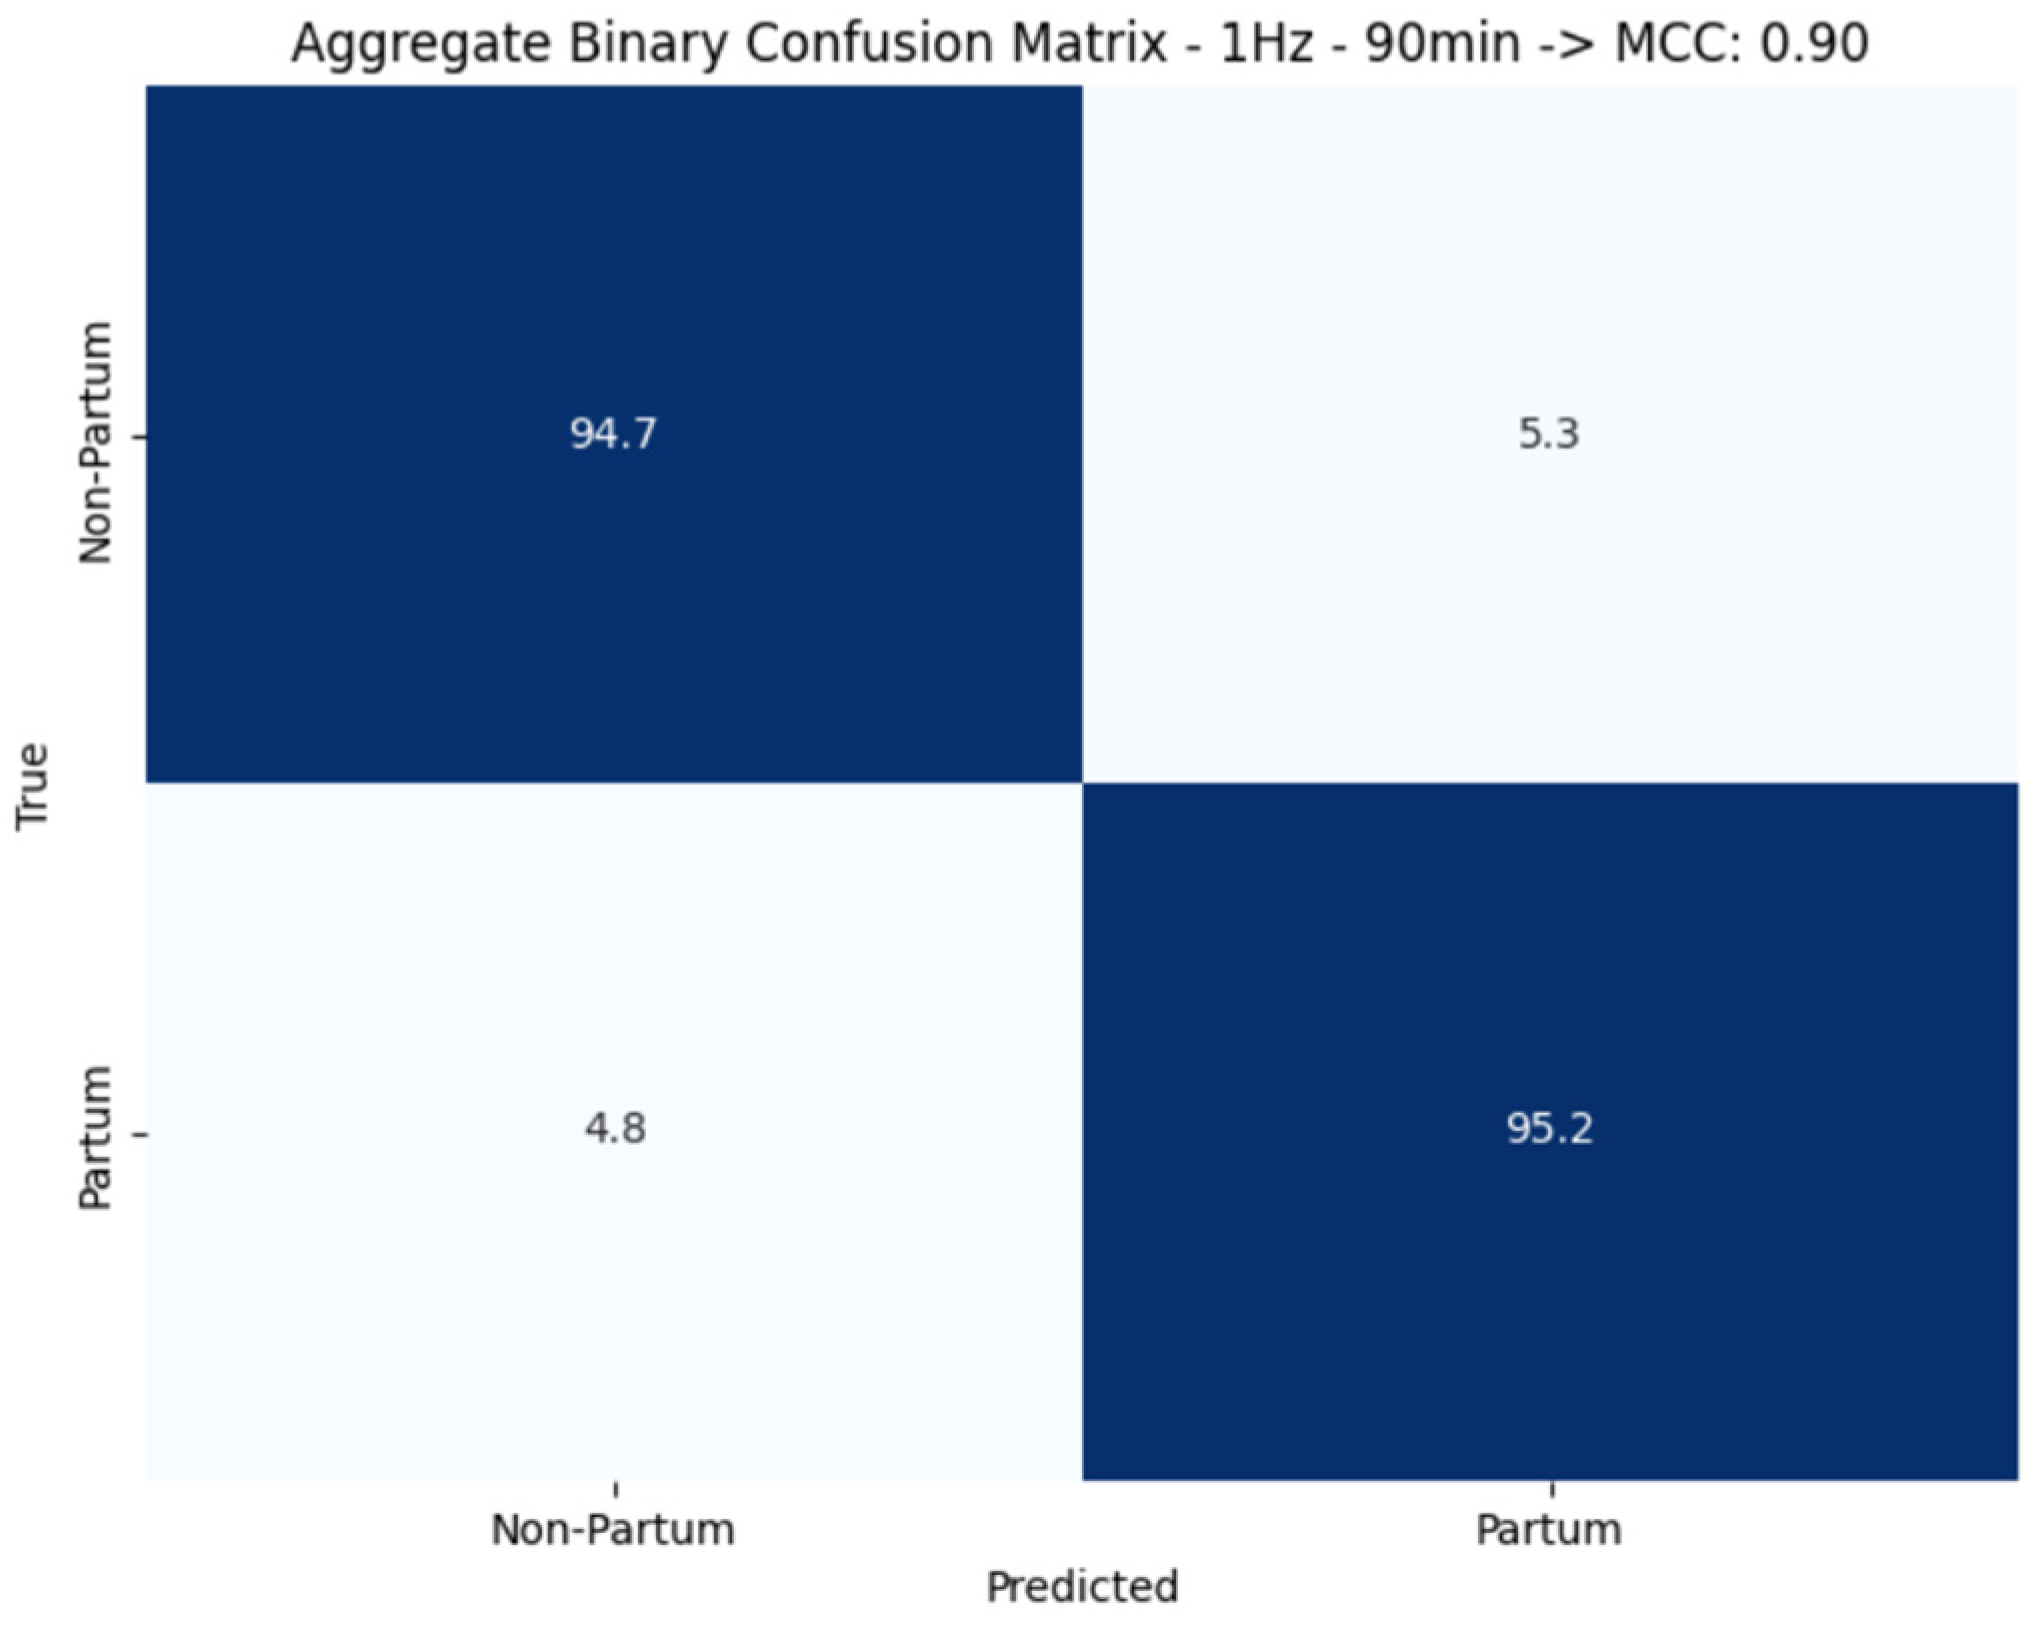
The confusion matrix of the binary classification algorithm presented in Figure 11 shows an MCC of 0.90 for distinguishing between Parturition and Non-Parturition classes. While this indicates strong discriminative capability under the experimental conditions, several factors should be considered when interpreting this result, such as the window-level random split that allows test samples from animals present in training, overlapping sliding windows that create temporal correlation between adjacent samples, and finally the class-weighted training strategy addresses imbalance during optimization. These design choices enable assessment of the two-stage system’s discriminative performance, but it means the reported MCC should not be interpreted as representing animal-independent or farm-independent generalization capability.
Figure 11.
Confusion matrix for optimal Binary Combination (MCC = 0.90).
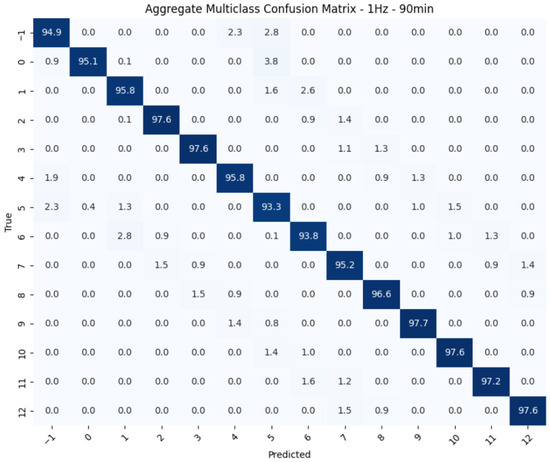
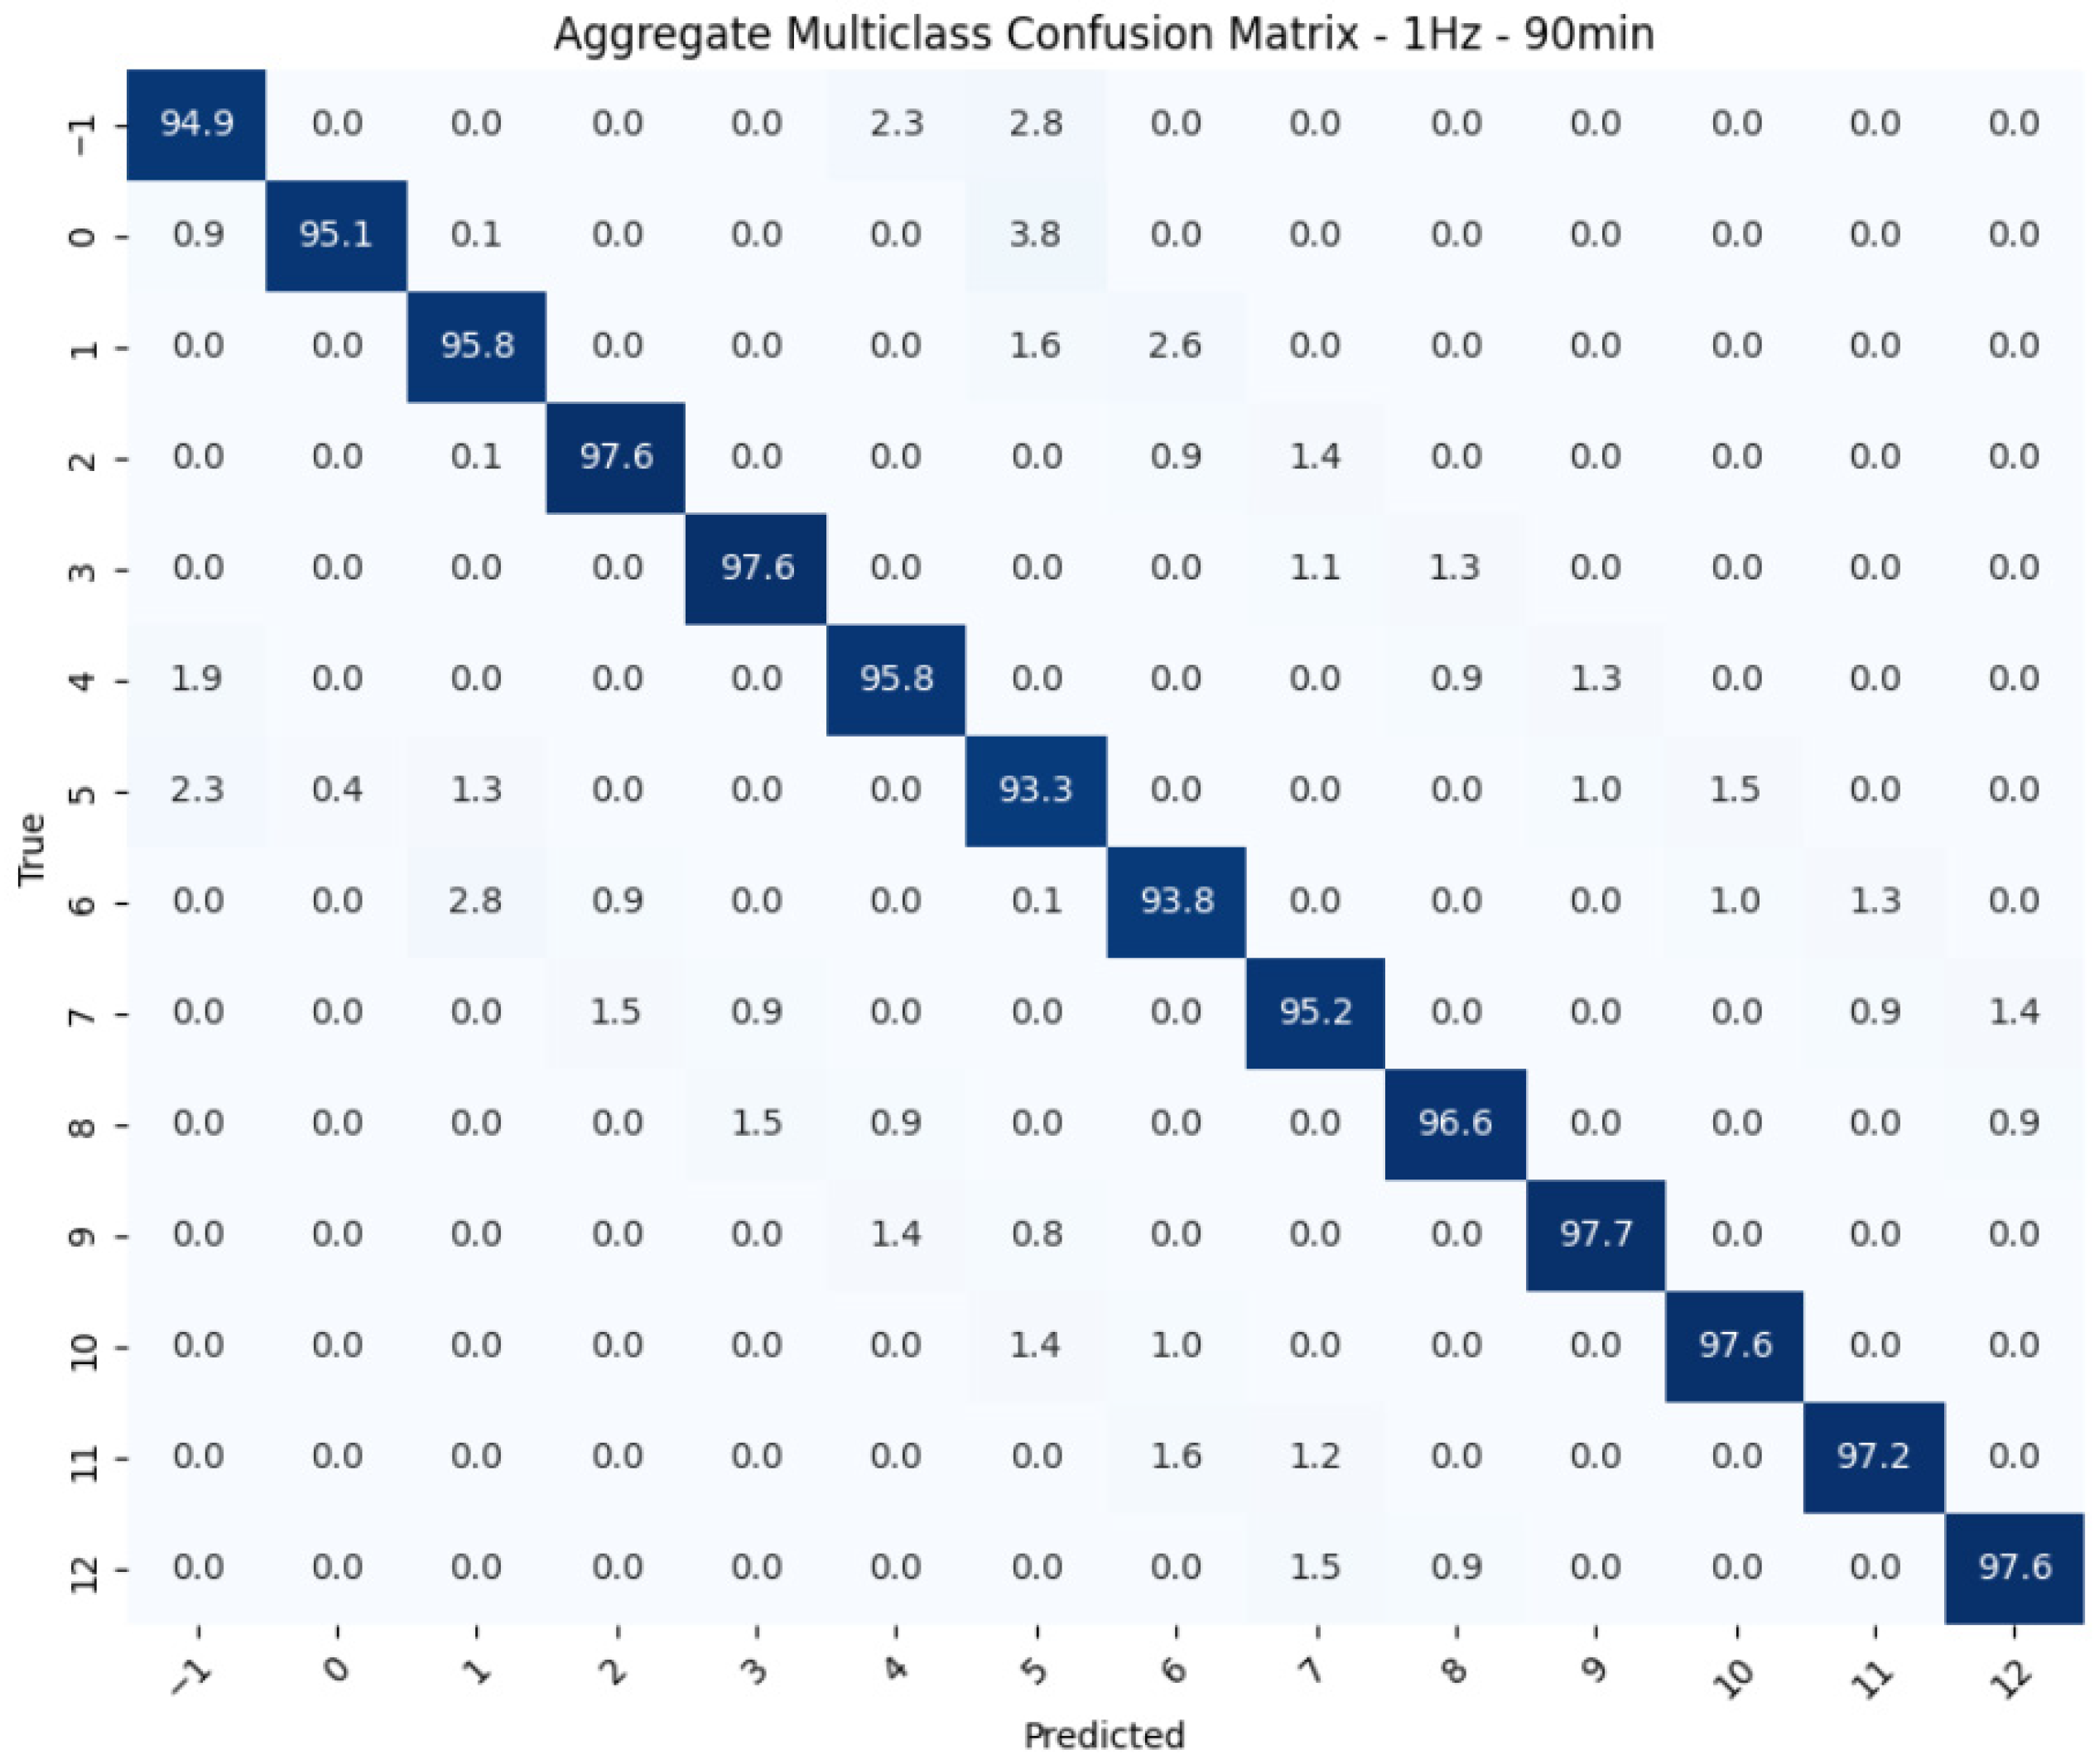
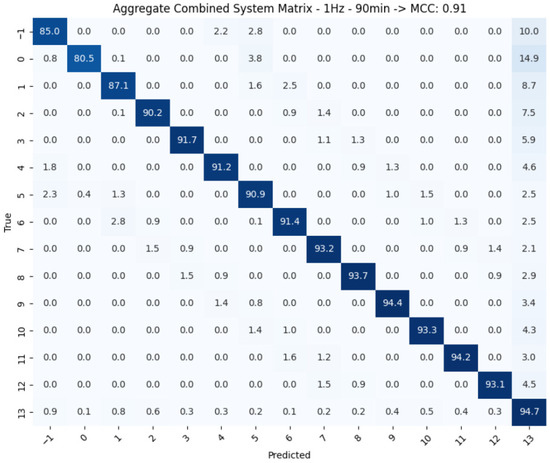
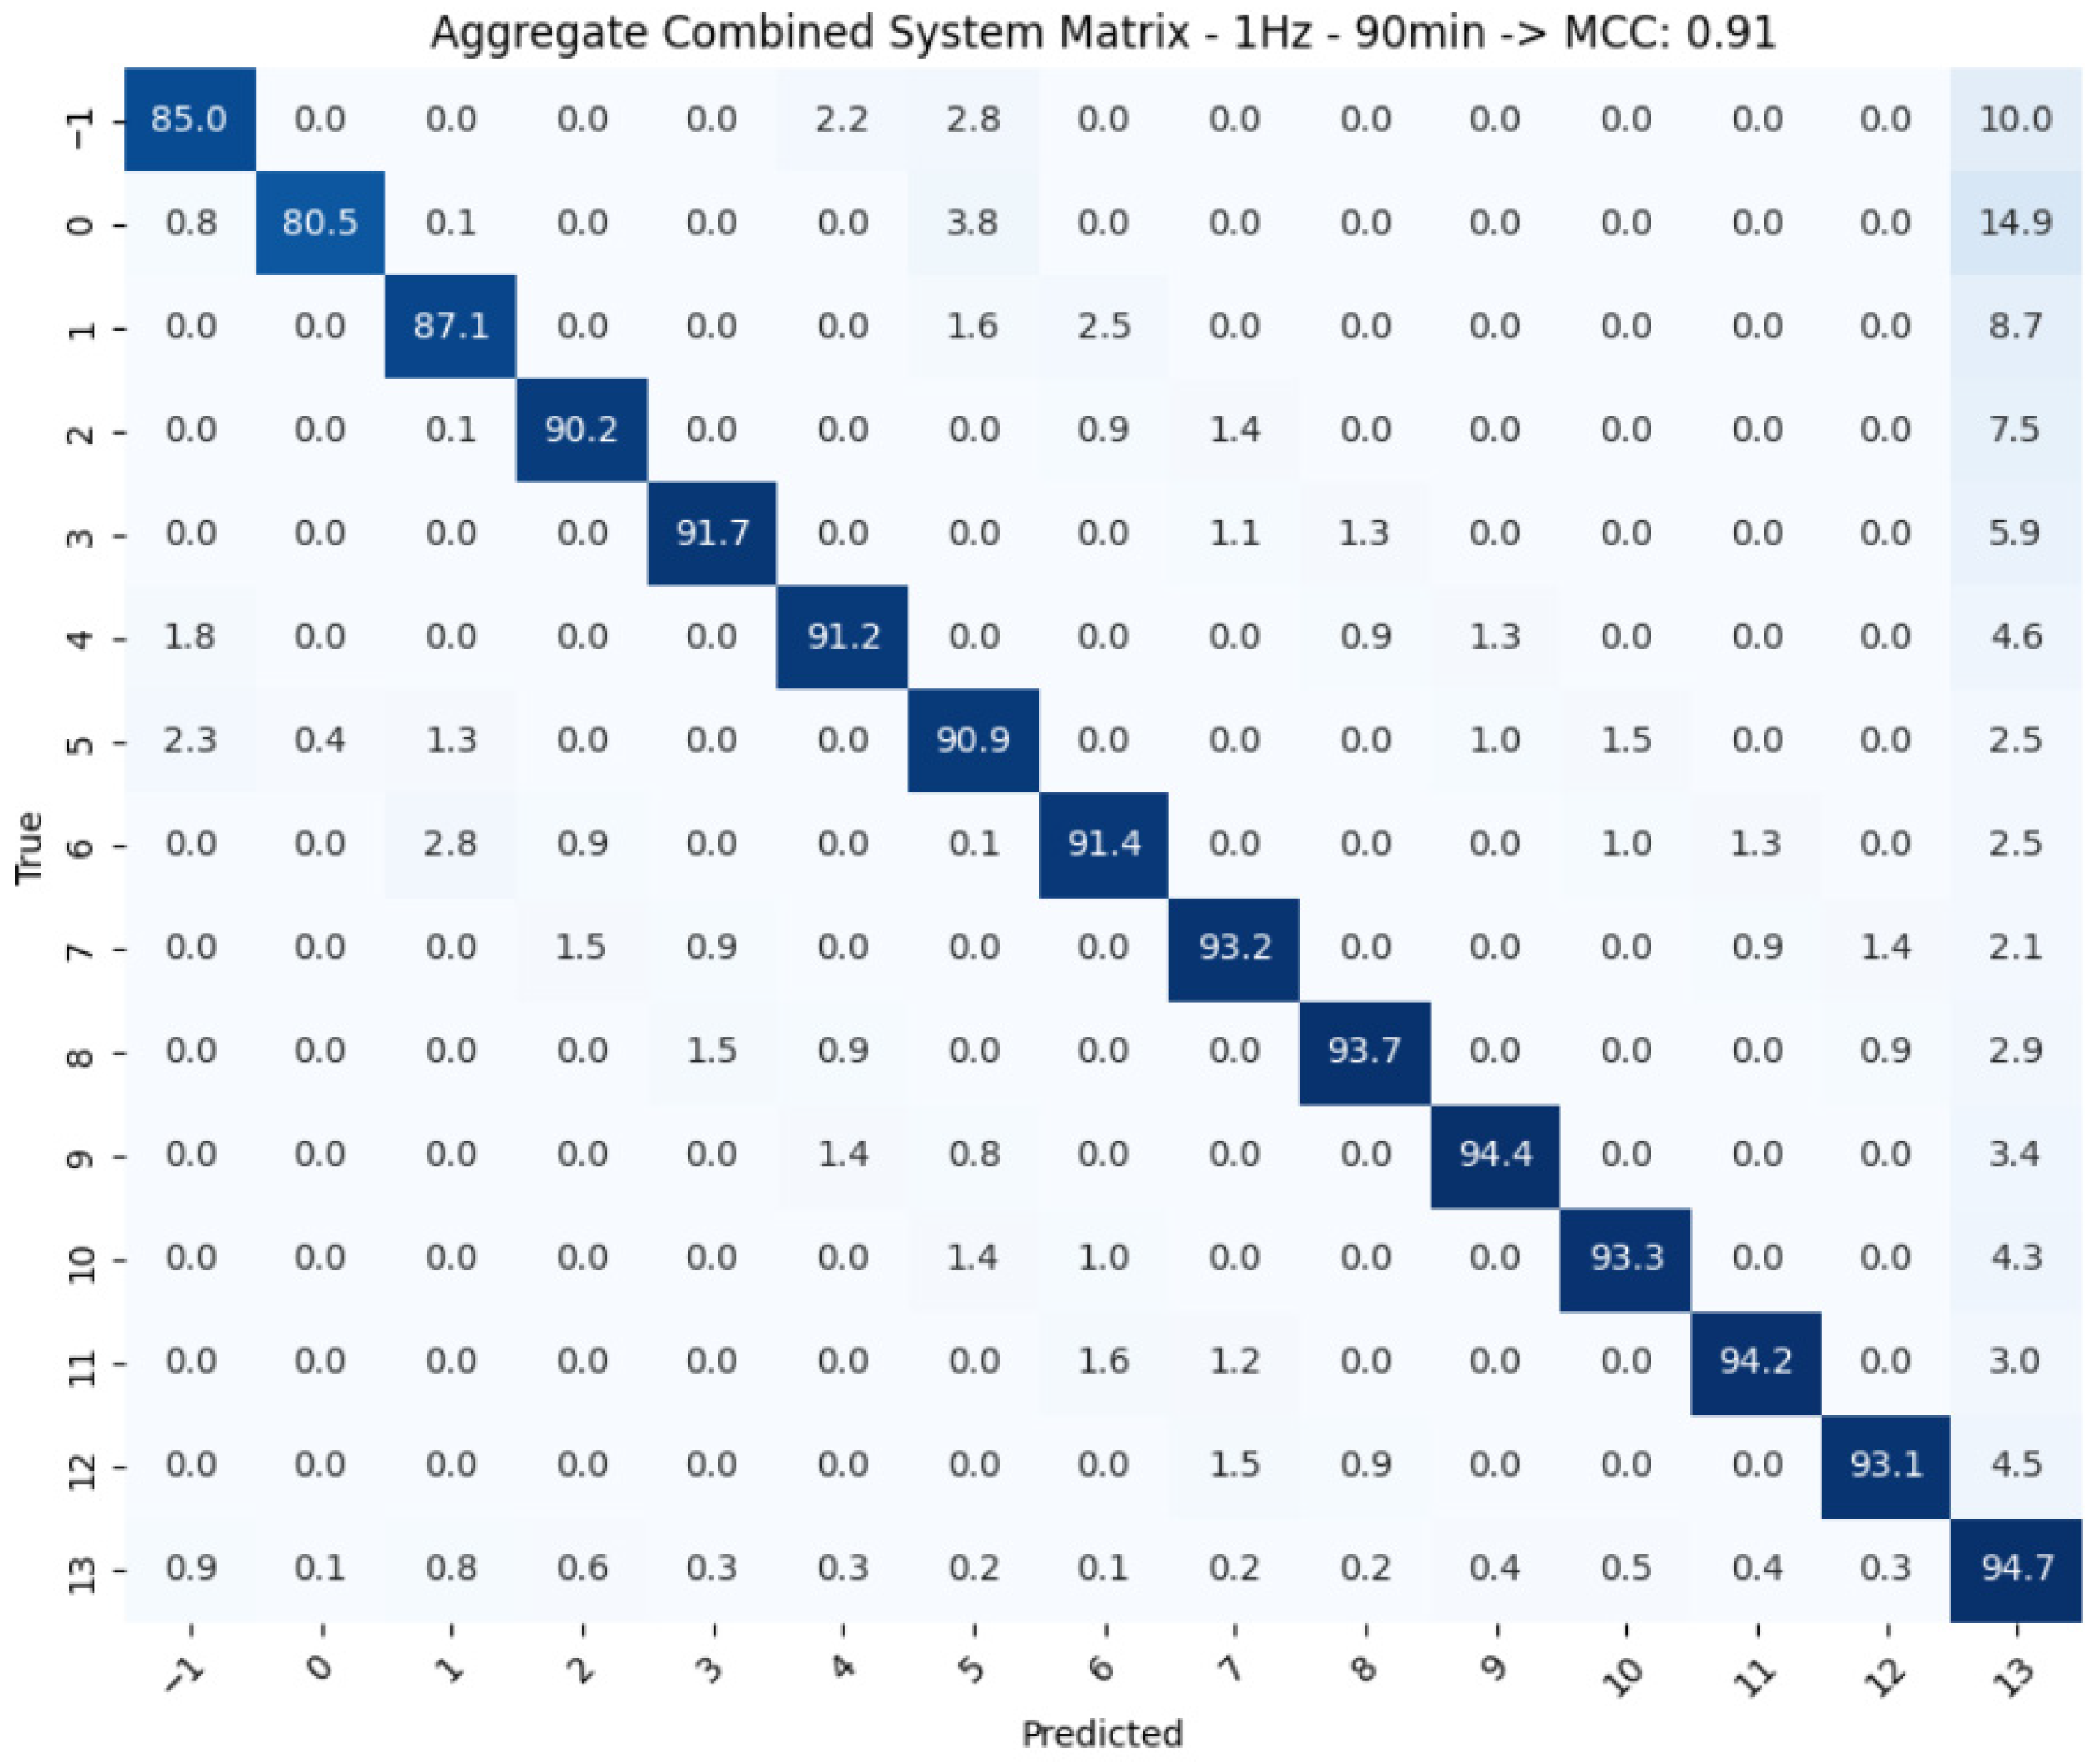
From the confusion matrices results in Figure 12 and Figure 13 the accuracy and robustness of the predictions of the system’s classifier for this combination is revealed, reinforcing the optimal solution to align with the overall system’s requirements. This configuration best models were then integrated into the collar management software for future data collection and predictions. This integration will enable the system to deliver warnings and insights on parturition occurrences straight from collar data, improving proactive animal management in real-world farm contexts.
Figure 12.
Confusion matrix for optimal Multiclass Combination (MCC = 0.95). “Time” and “Predicted” were measured as hours to kidding.
Figure 13.
Confusion matrix for optimal Combined Combination (MCC = 0.91). “Time” and “Predicted” were measured in hours to kidding.
4. Discussion
The effectiveness of an automated birth-detection system depends fundamentally on achieving high detection accuracy. Only with sufficiently reliable performance can such a system be considered useful, efficient, and capable of operating at scale while maintaining low resource consumption and strong energy performance. For this reason, identifying optimal operational parameters—particularly the minimum sampling frequency and the appropriate sliding-window size—is essential for developing a practical and robust solution fit for real-world deployment.
The evaluation of the minimum sampling frequency produced especially meaningful insights. The tests demonstrated that the frequency required to achieve the best performance from the detection algorithms is substantially lower than the 20 Hz acceleration sampling frequency used during data collection. In fact, the three algorithms—the binary classifier, the multiclass classifier, and the combined model—reach their highest performance levels when operating with sampling frequencies between 1 and 2 Hz. Based on these results, a sampling frequency of 1 Hz was selected as optimal, representing a twenty-fold reduction relative to the original rate. This finding aligns with previous work by Ramos et al. [25], who successfully demonstrated parturition detection in sheep using accelerometer data with comparable sampling strategies, emphasizing the feasibility of low-frequency monitoring for behavioral detection in small ruminants.
This dramatic decrease in sampling frequency has important practical implications. Lowering the frequency reduces the number of radio transmissions required, which directly decreases the energy consumption associated with maintaining continuous BLE communication. As a result, the autonomy of the collars can be significantly extended, allowing them to operate for much longer periods without the need for battery replacement or recharging, thus reducing the farmer work and the animal stress that the collar removal and placement process inflicts. Alternatively, this gain in energy efficiency could be leveraged to use smaller-capacity batteries, reducing both the physical weight of the collars and their production costs. Either outcome provides meaningful benefits: increased animal comfort, reduced maintenance demands, and improved economic viability of the system. Similar energy-efficient approaches have been explored in cattle monitoring [10], where tail-mounted accelerometers demonstrated the viability of wearable sensor systems for parturition prediction while maintaining practical battery life.
Regarding the sliding-window size, the results indicate that the performance of the detection algorithms improves progressively as the window length increases. However, this improvement reaches a plateau at around 90 min, which is consistent across all three tested algorithms. Consequently, a window size of 90 min was adopted, offering an effective balance between classification accuracy, computational efficiency, and timely detection. This window duration is consistent with behavioral time scales documented in pre-parturient behavior studies [12,13], which identified distinct behavioral patterns emerging in the hours preceding parturition that can be captured effectively within such temporal windows.
Further validation was obtained through the analysis of the confusion matrices generated for each algorithm. These matrices reveal strongly defined main diagonals, indicating that most predictions correspond to the correct class. The minimal dispersion outside the diagonal confirms that misclassifications are rare and that the algorithms possess strong discriminative capability. These observations are reinforced quantitatively by the MCC results: 0.90 for the binary algorithm, 0.95 for the multiclass algorithm, and 0.91 for the optimized combined model. Such values reflect a high degree of agreement between predicted and actual classes and confirm the robustness and reliability of the detection methods. The use of MCC as the primary evaluation metric is particularly appropriate given the class imbalance inherent in parturition detection datasets [16], as it provides a balanced assessment across all classes regardless of their frequency.
However, it is critical to contextualize these performance indicators within the experimental methodology used. Several factors may contribute to overly optimistic performance estimations, which should be considered when interpreting these findings. First, using overlapping sliding windows with overlap results in a temporal correlation between neighboring samples, which means that consecutive windows share half of their data points. This temporal autocorrelation might inflate performance measurements because the model can use patterns from a temporary window [15]. Second, the window-level random splitting technique allows test samples to come from animals that are also in the training set, so the presented metrics represent within-animal discriminative performance rather than generalization to previously unseen species. Third, the small dataset size of 28 goats, while indicating a significant data gathering effort [4], limits the variety of behavioral patterns and environmental circumstances captured. As a result, the provided MCC values should be taken as being the best possible performance under controlled experimental conditions with this flock. Future research should involve cross-farm validation and testing entirely separate animal populations to determine genuine generalization capabilities and more cautious performance estimations for a variety of deployment scenarios [15].
Beyond technical performance, the system’s practical feasibility is determined by economic considerations that vary according to farm size. The initial costs include collar hardware, gateway infrastructure, and software. For small farms with fewer than 50 animals, the per-animal cost may be prohibitively high, especially as kidding occurs only once or twice a year. Larger operations benefit from economies of scale, which allow savings in labor, veterinary care, and newborn mortality to justify the investment within one or two production cycles. Cost-effectiveness is determined by parameters such as kid value, labor costs, and current mortality rates. Farms with high newborn losses or high labor costs may find the technique economically viable even on lower scales, whereas farms with low complication rates may require larger herds to justify adoption.
Equally important are system usability and farmer interpretation. While the two-stage architecture reduces false alarms by filtering non-parturition behavior at the collar level, farmers must still assess time-to-parturition estimates and determine whether intervention is required. User interfaces must convert model outputs into understandable, actionable notifications. System maintenance functions such as battery monitoring, connectivity diagnostics, and collar displacement alarms must be simple.
Taken together, these findings highlight the maturity and effectiveness of the proposed birth-detection solution. By optimizing sampling frequency and window duration, the system achieves high accuracy while remaining energy-efficient, scalable, and well-suited for deployment in real production environments.
5. Conclusions
This study demonstrated that lightweight models, such as Decision Trees, can deliver competitive performance on the detection of kidding, with the combined system achieving an MCC of 0.91. This makes them viable for deployment on resource-constrained devices like animal collars. Moreover, the optimal configuration, 1 Hz sampling and a 90 min window, was found to provide a strong balance between predictive accuracy and computational efficiency. By filtering and transmitting only relevant data, the proposed system reduces data volume by up to 95% and thus reduces energy consumption, enabling practical, scalable, real-time livestock monitoring.
Despite the encouraging results, the goat parturition experiment faced several limitations affecting system design, evaluation, and potential deployment. Dataset constraints and class imbalance—particularly the relatively small sample size for the parturition class and limited behavioral diversity—may have reduced model generalization and could lead to underperformance in real-world herding conditions. Key environmental and management factors (weather, group composition, pasture layout, and farming practices) were not explicitly encoded, introducing potential noise into model training. Full deployment on collar devices remains challenging because of hardware constraints, including energy consumption, memory limits, and limited on-board computation. Algorithmic scope was also restricted: the study relied mainly on classical RF, DT, KNN, LogReg, Extra Trees and Bagging, which may prove insufficient if the dataset expands substantially or if more complex behavioral patterns need modeling.
Future work should focus on expanding the dataset by collecting data from a broader range of farms, seasons, and environmental conditions. This will improve model generalization and robustness. Further improvements can be explored by integrating advanced ML techniques such as CNN or LSTM or transfer learning approaches. Finally, a complete deployment of the two-stage system in embedded collar hardware is a key next step. This will involve optimizing models further for low-power environments while maintaining real-time responsiveness.
Author Contributions
Conceptualization, P.G., A.T.B. and M.R.M.; methodology, J.F., P.G., M.A., A.T.B. and M.R.M.; software, J.F., P.G. and M.A.; validation, J.F., P.G. and M.A.; formal analysis, J.F., P.G., M.A., A.T.B. and M.R.M.; investigation, J.F., P.G., M.A., A.T.B. and M.R.M.; resources, P.G., M.A., A.T.B. and M.R.M.; data curation, J.F., P.G., M.A., A.T.B. and M.R.M.; writing—original draft preparation, J.F., P.G. and M.A.; writing—review and editing, J.F., P.G., M.A., A.T.B. and M.R.M.; visualization, P.G., A.T.B. and M.R.M.; supervision, P.G. and M.A.; project administration, P.G. and M.R.M.; funding acquisition, P.G. All authors have read and agreed to the published version of the manuscript.
Funding
This work is funded by national funds through FCT—Fundação para a Ciência e a Tecnologia, I.P., and, when eligible, co-funded by EU funds under project/support UID/50008/2025—Instituto de Telecomunicações, with DOI identifier—https://doi.org/10.54499/UID/50008/2025.
Institutional Review Board Statement
Not applicable.
Informed Consent Statement
Not applicable.
Data Availability Statement
The original data presented in the study are openly available in https://zenodo.org/records/17743794. accessed on 1 December 2025.
Conflicts of Interest
The authors declare no conflicts of interest.
References
- Gonçalves, P.; Marques, M.R.; Nyamuryekung’e, S.; Jorgensen, G.H.M. Small Ruminant Parturition Detection Based on Inertial Sensors—A Review. Animals 2024, 14, 2885. [Google Scholar] [CrossRef] [Scilit]
- Henrique Ferreira Ramos Wearable Ovine Parturition Detector; Universidade de Aveiro: Aveiro, Portugal, 2024.
- Gonçalves, P.; do Marques, M.R.; Belo, A.T.; Monteiro, A.; Morais, J.; Riegel, I.; Braz, F. Exploring the Potential of Machine Learning Algorithms Associated with the Use of Inertial Sensors for Goat Kidding Detection. Animals 2024, 14, 938. [Google Scholar] [CrossRef] [Scilit]
- Johanson, J.M.; Berger, P.J. Birth Weight as a Predictor of Calving Ease and Perinatal Mortality in Holstein Cattle. J. Dairy Sci. 2003, 86, 3745–3755. [Google Scholar] [CrossRef] [Scilit]
- Linden, T.C.; Bicalho, R.C.; Nydam, D.V. Calf Birth Weight and Its Association with Calf and Cow Survivability, Disease Incidence, Reproductive Performance, and Milk Production. J. Dairy Sci. 2009, 92, 2580–2588. [Google Scholar] [CrossRef] [Scilit] [PubMed]
- Pembe, A.B.; Urassa, D.P.; Darj, E.; Carlsted, A.; Olsson, P. Qualitative study on maternal referrals in rural Tanzania: Decision making and acceptance of referral advice. Afr. J. Reprod. Health 2008, 12, 120–131. [Google Scholar]
- Kim, H.; Kim, H.; Kim, W.H.; Min, W.; Kim, G.; Chang, H. Development of a Parturition Detection System for Korean Native Black Goats. Animals 2024, 14, 634. [Google Scholar] [CrossRef] [Scilit] [PubMed]
- Fogarty, E.S.; Swain, D.L.; Cronin, G.M.; Moraes, L.E.; Trotter, M. Can Accelerometer Ear Tags Identify Behavioural Changes in Sheep Associated with Parturition? Anim. Reprod. Sci. 2020, 216, 106345. [Google Scholar] [CrossRef] [Scilit]
- Krieger, S.; Sattlecker, G.; Kickinger, F.; Auer, W.; Drillich, M.; Iwersen, M. Prediction of Calving in Dairy Cows Using a Tail-Mounted Tri-Axial Accelerometer: A Pilot Study. Biosyst. Eng. 2018, 173, 79–84. [Google Scholar] [CrossRef] [Scilit]
- Arnold, G.W.; Morgan, P.D. Behaviour of the Ewe and Lamb at Lambing and Its Relationship to Lamb Mortality. Appl. Anim. Ethol. 1975, 2, 25–46. [Google Scholar] [CrossRef] [Scilit]
- Echeverri, A.C.; Gonyou, H.W.; Ghent, A.W. Preparturient Behavior of Confined Ewes: Time Budgets, Frequencies, Spatial Distribution and Sequential Analysis. Appl. Anim. Behav. Sci. 1992, 34, 329–344. [Google Scholar] [CrossRef] [Scilit]
- Nanfack, G.; Temple, P.; Frénay, B. Learning Customised Decision Trees for Domain-Knowledge Constraints. Pattern Recognit. 2023, 142, 109610. [Google Scholar] [CrossRef] [Scilit]
- Dickinson, E.R.; Twining, J.P.; Wilson, R.; Stephens, P.A.; Westander, J.; Marks, N.; Scantlebury, D.M. Limitations of Using Surrogates for Behaviour Classification of Accelerometer Data: Refining Methods Using Random Forest Models in Caprids. Mov. Ecol. 2021, 9, 28. [Google Scholar] [CrossRef] [Scilit] [PubMed]
- Graves, A. Long Short-Term Memory. In Supervised Sequence Labelling with Recurrent Neural Networks; Springer: Berlin/Heidelberg, Germany, 2012; pp. 37–45. [Google Scholar] [CrossRef] [Scilit]
- Ferreira, J.; Gonçalves, P.; Antunes, M. A Two-Stage Approach for Lambing Detection. Smart Agric. Technol. 2025, 12, 101438. [Google Scholar] [CrossRef] [Scilit]
- Turner, K.E.; Sohel, F.; Harris, I.; Ferguson, M.; Thompson, A. Lambing Event Detection Using Deep Learning from Accelerometer Data. Comput. Electron. Agric. 2023, 208, 107787. [Google Scholar] [CrossRef] [Scilit]
- Zhu, Q. On the Performance of Matthews Correlation Coefficient (MCC) for Imbalanced Dataset. Pattern Recognit. Lett. 2020, 136, 71–80. [Google Scholar] [CrossRef] [Scilit]
- Stoica, P.; Babu, P. Pearson–Matthews Correlation Coefficients for Binary and Multinary Classification. Signal Process. 2024, 222, 109511. [Google Scholar] [CrossRef] [Scilit]
- Coskun, V.; Ozdenizci, B.; Ok, K. The Survey on Near Field Communication. Sensors 2015, 15, 13348–13405. [Google Scholar] [CrossRef] [Scilit] [PubMed]
- Tosi, J.; Taffoni, F.; Santacatterina, M.; Sannino, R.; Formica, D. Performance Evaluation of Bluetooth Low Energy: A Systematic Review. Sensors 2017, 17, 2898. [Google Scholar] [CrossRef] [Scilit]
- Mills, D.L. Network Time Protocol (NTP). 1985. Available online: https://www.rfc-editor.org/info/rfc0958 (accessed on 1 December 2025). [CrossRef] [Scilit]
- Asok, A. Generalized Approach to Linear Data Transformation. In Proceedings of the 2016 International Conference on Data Science and Engineering, ICDSE, Cochin, India, 23–25 August 2016. [Google Scholar] [CrossRef] [Scilit]
- GitHub—Pola-Rs/Polars: Extremely Fast Query Engine for DataFrames, Written in Rust. Available online: https://github.com/pola-rs/polars (accessed on 5 October 2025).
- Konečný, J.; McMahan, H.B.; Yu, F.X.; Richtárik, P.; Suresh, A.T.; Bacon, D. Scalable Machine Learning Algorithms for Big Data Analytics: Challenges and Opportunities. J. Artif. Intell. Res. 2022, 2, 124–141. [Google Scholar]
- Optuna—A Hyperparameter Optimization Framework. Available online: https://optuna.org/ (accessed on 5 October 2025).
- Zhang, S. Challenges in KNN Classification. IEEE Trans. Knowl. Data Eng. 2022, 34, 4663–4675. [Google Scholar] [CrossRef] [Scilit]
- Alfian, G.; Syafrudin, M.; Fahrurrozi, I.; Fitriyani, N.L.; Atmaji, F.T.D.; Widodo, T.; Bahiyah, N.; Benes, F.; Rhee, J. Predicting Breast Cancer from Risk Factors Using SVM and Extra-Trees-Based Feature Selection Method. Computers 2022, 11, 136. [Google Scholar] [CrossRef] [Scilit]
- Bauer, E.; Kohavi, R. Empirical Comparison of Voting Classification Algorithms: Bagging, Boosting, and Variants. Mach. Learn. 1999, 36, 105–139. [Google Scholar] [CrossRef] [Scilit]
- Pickle—Python Object Serialization—Python 3.13.7 Documentation. Available online: https://docs.python.org/3/library/pickle.html (accessed on 5 October 2025).

Disclaimer/Publisher’s Note: The statements, opinions and data contained in all publications are solely those of the individual author(s) and contributor(s) and not of MDPI and/or the editor(s). MDPI and/or the editor(s) disclaim responsibility for any injury to people or property resulting from any ideas, methods, instructions or products referred to in the content. |
© 2026 by the authors. Licensee MDPI, Basel, Switzerland. This article is an open access article distributed under the terms and conditions of the Creative Commons Attribution (CC BY) license.