


Abstract
To support the design of low-damage harvesting and transportation equipment, clarify the damage-formation mechanism under drop impact, and quantitatively predict impact-induced damage volume, this study investigated the cucumber cultivar “Zhongnong Cuiyu No. 3”. Mechanical and creep tests were conducted to determine the biomechanical parameters of the peel, flesh, and core. Based on the distinct internal tissue structure of the cucumber, a three-layer viscoelastic finite element (FE) model was developed. Tissue-specific damage thresholds were applied to calculate the dynamic damage volume throughout the entire impact process. Using a Box–Behnken design, a quadratic response surface model was established to analyze the effects of drop angle, drop height, and logarithmic contact stiffness on the log-transformed damage volume. The framework was subsequently validated through physical drop tests, tissue staining, and sliced-image analysis. Simulation results indicated that as drop height increased from 0.10 to 1.00 m, the maximum von Mises equivalent stress increased from 1.19–1.57 MPa to 2.49–3.30 MPa, with high-stress regions expanding significantly along the longitudinal axis of the fruit. The fitted response surface model yielded an R2, adjusted R2, and predicted R2 of 0.9934, 0.9849, and 0.8943, respectively. Drop height showed the largest contribution to damage-volume variation, followed by a pronounced quadratic effect of drop angle, whereas contact stiffness showed a weaker influence within the tested range. Physical validation showed that the experimental damage volume generally increased with drop height and that the horizontal orientation (0° impact angle) produced lower damage than the inclined postures at medium and high drop heights. The numerical predictions reproduced the overall damage trend and approximate magnitude under several tested conditions, although condition-dependent deviations remained. Larger relative deviations at low damage levels were associated with the small absolute damage volume, biological variability, background micro-damage, staining response, and image-quantification uncertainty. The proposed framework effectively links tissue viscoelasticity, whole-fruit impact response, and three-dimensional damage volume, providing a robust theoretical basis for drop-risk assessment and the optimization of low-damage vegetable mechanization systems.
1. Introduction
Cucumber is an important fresh-market horticultural crop whose commercial quality depends strongly on surface integrity, firmness, crispness, and freshness [1,2,3,4]. With the increasing use of mechanized handling and robotic selective harvesting, cucumbers may be subjected to various mechanical loads during gripping, detachment, release, transfer, conveying, grading, and packaging [5,6]. These loads may originate from end-effector contact, transportation vibration, and accidental impacts associated with fruit release or transfer between handling units [7,8]. Although free-fall events are not necessarily frequent during routine commercial handling, accidental drops and collisions can impose short-duration dynamic loads on the fruit and produce localized tissue deformation and internal damage [8,9]. Controlled impact studies on cucumber have further shown that impact intensity affects bruising and subsequent quality changes during storage [9]. Because cucumber tissue is soft and highly hydrated [2], such transient loading can cause mechanical damage, including subsurface bruising that may develop before clear external symptoms appear, thereby increasing the difficulty of damage detection and quality grading [10,11,12]. Therefore, controlled drop impact was adopted in the present study as a representative transient mechanical-loading condition associated with accidental release and transfer events, rather than as the predominant or sole source of cucumber damage during commercial handling. Quantifying the relationship between external impact conditions, tissue-scale mechanical response, and damage formation can provide a mechanistic basis for evaluating impact risk and supporting the design and parameter selection of low-damage harvesting and postharvest handling systems.
Drop impact is a short-duration dynamic process, and tissue damage may form beneath the peel before visible symptoms appear. X-ray computed tomography and other nondestructive techniques have been used to identify internal quality attributes and hidden damage in agricultural products [11,13,14,15,16]. Controlled drop tests, pendulum impact tests, and transient collision tests have also been widely used to evaluate impact damage in cucumbers and other horticultural products under different loading conditions [9,17,18,19]. These methods provide important information on the final post-impact damage state, but they cannot directly reveal the dynamic evolution of internal stress, strain, load transfer, or energy dissipation during impact. Consequently, experimental measurements alone are insufficient to explain when and where tissue responses exceed damage thresholds, or why different drop conditions produce different internal damage distributions. This limits their ability to provide mechanistic guidance for low-damage mechanized harvesting and the selection of appropriate operating parameters.
Finite element (FE) modeling provides an effective way to reconstruct dynamic mechanical responses that are difficult to observe directly in experiments [20,21]. Reviews have shown that the reliability of an FE model depends on appropriate representation of geometry, material parameters, contact settings, and damage criteria [20,21]. Layered fruit models further indicate that tissue heterogeneity and tissue interfaces can affect stress transfer and deformation under impact or gripping loads [22,23]. FE methods have also been applied to analyze harvesting damage in kiwifruit and bruise susceptibility in white radish [24,25]. This layered representation is particularly important for cucumber because the peel, flesh, and core differ in structure, stiffness, strength, and deformation behavior. A homogeneous model may not adequately describe local peel contact response, flesh deformation, or load transfer inside the fruit. Although previous cucumber studies have addressed impact-induced quality deterioration, subsurface bruise detection, and differences in physical and mechanical properties among cultivars [2,7,9,10], the representation of layered tissue heterogeneity in cucumber drop-impact modeling remains limited. The time-dependent behavior of soft biological tissues must also be considered in material modeling. Fruit and vegetable tissues commonly show viscoelastic deformation, and rheological models have been used to characterize creep and mechanical behavior using identifiable parameters [23,26]. During transient collision, viscoelastic or viscoelastic-plastic contact parameters may affect contact duration, deformation recovery, and energy dissipation [26,27]. Layered fruit models have shown that introducing viscoelastic parameters can improve the description of the dynamic response of internal soft tissues under impact or gripping loads [22,23]. A mechanically meaningful cucumber model should therefore combine the three-layer spatial structure of peel, flesh, and core with tissue-specific constitutive descriptions, and should account for the time-dependent response of internal tissues rather than assigning a single material model to the whole fruit.
Bruise area, contact force, maximum stress, maximum strain, and deformation are common evaluation indices in studies of mechanical damage [17,18,19,27,28,29,30,31,32]. However, surface measurements do not fully describe hidden internal damage, and a peak response only reflects the mechanical state at one location and one instant during impact. Studies on strawberry, kiwifruit, and plum have shown that tissue failure and internal damage caused by mechanical loading have clear spatial distributions [27,28,29,30,31,33,34]. Bruise volume has been directly quantified in studies of apple bruise and mechanical damage [15,35], and FE analysis has been combined with near-infrared hyperspectral imaging to grade blueberry bruising [33,36]. These studies suggest that volume-based indices can represent the severity of internal damage more comprehensively than surface bruise area or a single peak response. For threshold-based FE analysis, a whole-process damage index should include all tissue elements that exceed the corresponding threshold at any output time during impact while avoiding repeated counting of the same element at different time steps. A full-factor explicit dynamic simulation campaign, however, would be computationally expensive. Response surface methodology (RSM) can use systematically designed FE cases to establish a surrogate relationship between impact factors and damage volume within a predefined design space, and previous FE-RSM studies have demonstrated the feasibility of this strategy [25,37,38]. In principle, tissue energy response may also serve as a common mechanical descriptor for comparing drop impact with dynamic gripping [26,27,34,39,40,41]. Because the two loading modes differ in contact area, loading duration, and load-transfer path, loading-mode-specific calibration is still required before applying such descriptors to gripping-damage analysis. Overall, a cucumber damage-volume prediction framework that combines measured tissue parameters, layered FE modeling, whole-process damage identification, RSM prediction, and physical drop-test evaluation still needs further development.
To address these gaps, this study used “Zhongnong Cuiyu No. 3” cucumber as the test cultivar and established a tissue-specific three-layer FE model composed of peel, flesh, and core, with the measured viscoelastic behavior of the internal tissues included in the model. Damage was quantified using a unique damage volume, defined as the spatial union of elements that exceeded the corresponding tissue damage threshold at any output time during the whole impact process, thereby avoiding repeated counting of the same element at different time steps. The objectives were to: (1) characterize the mechanical and creep behavior of the different cucumber tissues and develop a three-layer FE model for cucumber drop impact; (2) determine the effects of drop angle, drop height, and contact stiffness on mechanical response and damage volume; interpret damage formation using tissue energy response; and establish an RSM-based surrogate prediction model within the tested design space; and (3) obtain damage volume from physical drop tests using tissue staining and sliced-image analysis, and evaluate the model predictions in terms of damage trend and order of magnitude. This framework links tissue-scale mechanical characterization, whole-fruit impact response, and three-dimensional damage-volume prediction, and can support drop-damage risk assessment and selection of low-damage handling conditions for cucumber. By quantifying tissue energy response and damage volume under controlled drop impacts, it also provides a mechanistic reference for the subsequent development of energy-based damage models under dynamic gripping loads.
2. Materials and Methods
2.1. Cucumber Samples and Physical Characterization
Cucumbers of the cultivar “Zhongnong Cuiyu No. 3” were used as the experimental material. The samples were harvested at commercial maturity in March 2026 from a commercial greenhouse operated by Shandong Yimudigua Agricultural Technology Co., Ltd. (Jinan, China).
After harvest, the cucumber samples were transported to the laboratory using the SF Express cold-chain logistics service (Shenzhen, China) and arrived within 36 h of harvest. Upon arrival, the samples were held for 12 h at 15 ± 3 °C and an ambient relative humidity of approximately 46% before testing. Thus, the harvest-to-test interval was approximately 48 h, and the same handling protocol was applied to all experimental groups. Al-Hadrami et al. [9] reported that the firmness of impact-damaged cucumbers fluctuated during the first 8 d of storage and declined rapidly by day 12. Zhang et al. [7] further showed that transport vibration and cold-chain disruption accelerated water redistribution, shriveling, and firmness loss; firmness loss accompanied by shriveling was first observed on day 6 in vibrated samples and on day 12 in control samples. Under the respective experimental conditions of these studies, the reported time scales were substantially longer than the approximately 48-h harvest-to-test interval used in the present study. Therefore, under the standardized cold-chain transportation and pre-test holding conditions, storage-related changes in cucumber tissue mechanical properties during this interval were expected to be limited. This handling protocol was adopted to reduce storage-related variability among samples and maintain their comparability in the subsequent tensile, compression, and creep tests.
Samples exhibiting visible mechanical damage, disease symptoms, severe curvature, abnormal morphology, or marked size differences were excluded. Only samples with comparable maturity, color, dimensions, and external appearance were selected for testing. A total of 87 cucumber samples were used in this study. Among them, 77 cucumbers were subjected to non-destructive whole-fruit characterization before subsequent destructive testing, including measurements of fruit mass, length, and mean diameter. Of these 77 cucumbers, 30 were used for mid-length transverse sectioning to characterize the internal tissue geometry, including geometric outer-layer thickness, flesh thickness, and core diameter, for subsequent three-layer FE geometry construction; 5 were used to prepare peel tensile specimens; 15 were used to prepare flesh and core compression specimens; 6 were used for creep testing; and 21 were reserved for physical drop validation and background-control tests. The remaining 10 cucumbers were allocated directly to destructive basic-property measurements without prior whole-fruit geometric characterization: 5 were used to prepare specimens for peel puncture testing, and 5 were used for moisture-content determination. Fruit mass was measured using an electronic balance with a resolution of 0.1 g. Fruit length was measured along the longitudinal axis using a digital caliper with a resolution of 0.01 mm. Transverse diameters were measured separately at the stem end, middle, and blossom end, and the arithmetic mean of the three measurements was defined as the mean fruit diameter (D). To illustrate the definitions and spatial distribution of the three tissue regions, the cucumber outer boundary, peel–flesh interface, and flesh–core interface were delineated on a representative longitudinal section based on visible differences in tissue color and texture (Figure 1). This longitudinal section was used solely to illustrate the tissue-region definitions; the dimensional data reported in Table 1 were obtained independently from mid-length transverse sections. The 30 samples allocated to tissue-dimension measurements were sectioned transversely at their mid-length positions. The geometric outer-layer thickness, flesh thickness, and core diameter were measured directly from the exposed transverse sections to provide geometric inputs for subsequent FE modeling. The measured physical and geometric characteristics are summarized in Table 1. The geometric outer-layer thickness reported in Table 1 was used to define the outer region of the three-layer FE geometry and was measured independently of the actual thickness of each isolated peel tensile specimen. The actual specimen thickness was used only to calculate tensile stress; the two thickness measurements were not used interchangeably.
Figure 1.
Representative longitudinal section and tissue-region boundaries of “Zhongnong Cuiyu No. 3” cucumber. The red, light-green, and dark-blue contours indicate the fruit body’s outer boundary, geometric outer-layer–flesh interface, and flesh–core interface, respectively. The peduncle is shown in the image but was not included in the fruit-body boundary.
Table 1.
Physical characteristics of “Zhongnong Cuiyu No. 3” cucumber samples.
In addition to fruit mass and geometric dimensions, moisture content and peel puncture force were measured to characterize the physical state of the cucumber samples. Moisture content was expressed on a wet basis and measured from five independent fruits, yielding a mean value of 96.1 ± 2.5%. Peel puncture force was measured using a TA.XTplus (Stable Micro Systems, Godalming, UK) texture analyzer equipped with a 2 mm needle probe. Outer-layer specimens with a nominal thickness of 2.5 mm were prepared from five independent fruits and punctured at a test speed of 1 mm/s. Three puncture positions were tested for each fruit as within-fruit technical replicates. The maximum force recorded during penetration was defined as the peel puncture force. The three measurements were first averaged for each fruit, and the fruit-level mean was treated as one independent observation. The final peel puncture force was 8.2 ± 0.4 N, reported as the mean ± SD of the five independent fruits.
2.2. Mechanical Testing of the Three Cucumber Tissue Layers
Based on the tissue structure of cucumber and the main loading modes during drop impact, the fruit was treated as a three-layer structure consisting of peel, flesh, and core. Longitudinal tensile tests were conducted on the peel to determine its elastic modulus, tensile strength, and fracture strain. The elastic modulus was used to characterize the initial elastic response of the peel, whereas the tensile strength was used to define the peel stress-based damage threshold. Because the flesh and core are mainly subjected to compressive loading during drop impact and exhibit time-dependent deformation, uniaxial compression tests were used to determine their compressive modulus, peak stress, and peak strain, and to provide reference values for internal tissue stress-based working thresholds. Creep tests were then used to characterize the viscoelastic behavior of the flesh and core. To characterize the time-dependent responses of the flesh and core, both the classical Burgers model and the fractional-order Burgers model were fitted to the creep curves [23,26], as detailed in Section 2.3. The classical Burgers model was used as a reference model to compare the ability of the two formulations to describe tissue creep behavior. The fractional-order Burgers model was used as the primary model for identifying the viscoelastic behavior of the flesh and core. To obtain FE-compatible material inputs, the time-dependent responses reconstructed from the fitted fractional-order Burgers parameters were numerically approximated using equivalent Prony-series representations supported by the FE solver.
All mechanical tests were performed using a TA.XTplus texture analyzer (Stable Micro Systems, Godalming, UK). The tests included peel tensile tests, flesh and core compression tests, and flesh and core creep tests. Together, these tissue-level tests provided the tissue-specific mechanical properties, material parameters, and damage thresholds required for constructing the subsequent three-layer FE model. The texture analyzer had a maximum force capacity of 50 kgf (approximately 490 N), a displacement resolution of 0.001 mm, a data acquisition rate of 2000 points/s, and a speed range of 0.01–40 mm/s. The force and displacement measurement systems were calibrated before testing. All mechanical tests were initiated after the conditioning procedure described in Section 2.1. All measurements performed with the texture analyzer were completed within the subsequent 8 h; therefore, the interval from harvest to completion of mechanical testing did not exceed approximately 56 h. Each tissue specimen was prepared immediately before testing and tested without additional storage to minimize dehydration-related changes in its mechanical response. In addition to the mechanical tests, tissue density was calculated from specimen mass and volume, with specimen volume determined using the water-displacement method. Ten specimens from each tissue layer were measured. These specimens were excised from cucumbers already allocated to the mechanical tests and therefore did not require additional fruit samples. The mechanical curves presented in this section were selected as representative examples to illustrate typical tissue responses, testing procedures, and parameter-extraction methods. The statistical results obtained from all valid specimens, which provided the experimental basis for the subsequent FE modeling and damage-identification analyses, are summarized at the end of this section.
2.2.1. Peel Tensile Test
Peel tensile tests were used to determine the tensile strength, fracture strain, and tensile modulus of the peel layer. Specimens were cut longitudinally from the stem-end, middle, and blossom-end regions of the cucumbers allocated to peel testing. Specimens with edge damage, markedly nonuniform width or thickness, or excessive adhering flesh tissue were excluded. Before testing, the width and actual thickness of each specimen were measured with a digital caliper, and the initial cross-sectional area was calculated from these measurements. The initial effective gauge length was set to 30 ± 3 mm. Each specimen was mounted in a TA-96 tensile grip (Stable Micro Systems, Godalming, UK), as shown in Figure 2a. The gripping surfaces were lined with a compliant material to reduce local compression damage, stress concentration, and slippage. The specimen was stretched longitudinally at 1 mm/s until rupture, and the force-displacement response was recorded continuously. Engineering stress and engineering strain were calculated from tensile force, initial cross-sectional area, grip displacement, and effective gauge length. For each valid peel specimen, the tensile modulus was obtained from the linear portion of the engineering stress–strain response, and the peak tensile stress was extracted as the tensile strength. Poisson’s ratio was calculated from the axial and transverse strains obtained by image-based deformation measurements according to .
Figure 2.
Peel tensile test of “Zhongnong Cuiyu No. 3” cucumber: (a) experimental setup; (b) representative engineering stress–strain response. In (b), the black solid curve shows the measured stress–strain response, and the oblique dashed line shows the linear fit used to determine the tensile modulus.
For the representative specimen shown in Figure 2b, the maximum engineering stress, corresponding engineering strain, and tensile modulus were 0.665 MPa, 0.095, and 8.12 MPa, respectively, with R2 = 0.99 for the linear fit.
2.2.2. Flesh and Core Compression Tests
Flesh and core compression tests were used to characterize the compressive mechanical response of internal cucumber tissues and to provide reference data for damage-threshold calibration in the FE model. Flesh and core specimens were prepared from the 15 cucumbers allocated to compression testing. After each fruit was cut transversely at its mid-length position, cylindrical or near-cylindrical tissue specimens were taken from the flesh and core regions. Specimens with obvious cutting defects, damaged edges, or nonuniform geometry were excluded. Each specimen was placed at the center of the texture-analyzer platform and compressed using a TA70 probe (Stable Micro Systems, Godalming, UK). Before testing, the initial specimen height and compressed cross-sectional dimensions were measured. The probe moved downward at 1 mm/s until clear compressive failure occurred, and force-displacement data were recorded continuously.
Figure 3 shows representative engineering stress–strain curves for the flesh and core tissues. For both tissues, engineering stress increased with strain during the early compression stage, followed by a peak and a post-peak decline or fluctuation, indicating the onset of local tissue failure. The peak point on each curve was defined as the compressive failure point and was used to extract the peak engineering stress and its corresponding engineering strain. The compressive modulus was obtained by linear regression over the 20–60% peak-stress interval of the ascending portion of the engineering stress–strain curve. This interval was selected to avoid the initial seating region and the nonlinear response close to failure. For the representative curves shown in Figure 3, the peak engineering stress and corresponding engineering strain were 1.041 MPa and 0.551 for the flesh, and 0.498 MPa and 0.387 for the core, respectively. The fitted linear segment was used to determine the apparent initial compressive modulus E0, which was later used to define the instantaneous elastic response in the viscoelastic parameter conversion. Poisson’s ratio was calculated from the axial and transverse strains obtained by image-based deformation measurements. For each valid flesh and core specimen, the fitted line used to determine the compressive modulus was extended toward the higher-strain region. The first intersection between the extrapolated fitted line and the original stress–strain curve beyond the fitted interval was defined as the characteristic transition point, and the corresponding stress was taken as the characteristic transition stress of that specimen.
Figure 3.
Representative engineering stress–strain responses of internal cucumber tissues under uniaxial compression: (a) flesh; (b) core. The black solid point indicates the compressive failure point; horizontal and vertical dashed lines indicate peak engineering stress and the corresponding engineering strain, respectively; the gray oblique dashed line indicates the linear fitting trend over the 20–60% peak-stress interval of the ascending portion. The black solid curves represent the measured engineering stress–strain responses.
2.2.3. Flesh and Core Creep Tests
Compression creep tests were conducted to characterize the time-dependent deformation behavior of the flesh and core tissues under a constant load. Creep specimens were prepared using the same procedure as the compression specimens. The initial height and compressed cross-sectional dimensions of each specimen were measured before testing. Each specimen was placed at the center of the TA.XTplus compression platform. Based on the compressive failure loads identified from the compression tests in Section 2.2.2, a target load of 10 N was selected to induce measurable creep deformation while avoiding immediate structural failure. The probe was loaded to this target force at 1 mm/s, held for approximately 80 s, and then unloaded. Force, displacement, and time were recorded synchronously during the test.
Figure 4 shows representative force-time and displacement-time curves for the creep test. The force-time curve was used to identify the loading, holding, and unloading stages and to check load stability during the holding stage. The displacement-time curve described the instantaneous compression and subsequent creep deformation under the constant load. The loading stage mainly reflected specimen-probe contact, load buildup, and initial compression; the holding stage, during which displacement continued to increase with time, was used for viscoelastic model identification. The unloading stage was used only to confirm load release and was not included in model fitting. During data processing, the time at which the load first reached 90% of the target load and then entered the stable holding stage was defined as t = 0, and the compression displacement at that time was denoted as u0. The incremental creep displacement during holding was calculated as . The instantaneous compression formed during the loading stage was not included in the Burgers-curve fitting; instead, it was later incorporated into the target compliance through the instantaneous compliance corresponding to the apparent initial compressive modulus.
Figure 4.
Representative time-history curves of compression creep tests of cucumber flesh and core tissues: (a) force-time curve; (b) displacement-time curve. The solid curves show the measured responses, the vertical dashed lines mark the start and end of the holding stage, and the double-headed arrows indicate its duration.
The holding-stage creep data of the flesh and core were used for viscoelastic model identification in Section 2.3. The classical Burgers model was used as a reference model, whereas the fractional-order Burgers model was used as the primary model for identifying the viscoelastic behavior of the flesh and core. The time-dependent response reconstructed from the fractional-order Burgers model was then converted into an equivalent Prony-series representation supported by the FE solver and used as the viscoelastic material input for the flesh and core in the three-layer FE model.
To link the representative curves and parameter-extraction procedures described above with the values assigned in the FE model, the specimen-level tissue parameters were statistically summarized (Table 2). The mean values of density, elastic or compressive modulus, and Poisson’s ratio were adopted as the corresponding FE material inputs. For damage identification, the mean peak tensile stress of the peel and the mean characteristic transition stresses of the flesh and core were adopted as the tissue-specific working stress thresholds.
Table 2.
Statistical results of tissue mechanical parameters used in FE modeling and damage identification.
2.3. Identification of Cucumber Tissue Viscoelastic Models and FE Parameter Conversion
The flesh and core tissues showed clear time-dependent deformation during the holding stage. To compare the ability of different rheological formulations to describe this response, both a classical Burgers-type model and a fractional-order Burgers-type model were fitted to the holding-stage incremental creep displacement data.
where and are the incremental creep displacements predicted by the classical Burgers-type model and the fractional-order Burgers-type model, respectively, relative to the start of the holding stage, in mm; is the fitting intercept of the incremental displacement curve and does not represent the instantaneous compression generated during the loading stage; is the creep-rate-related fitting coefficient, with units of mm/s in the classical Burgers-type model and mm s−α in the fractional-order Burgers-type model; t is the holding time, in s; α is a dimensionless fractional-order parameter with 0 < α ≤ 1; is the delayed deformation amplitude, in mm; and is the retardation-rate coefficient, in s−1.
Figure 5 shows the incremental creep displacement and model-fitting results for the core and flesh tissues under the 10 N target holding load. In both tissues, the creep displacement increased rapidly at the beginning of holding and then increased more slowly. The fractional-order Burgers-type model described this response more accurately than the classical Burgers-type model. For the flesh, the R2 and RMSE of the fractional-order model were 0.9953 and 0.00253 mm, respectively. For the core, the corresponding values were 0.9934 and 0.01354 mm. These values were better than those obtained from the classical Burgers-type model (Table 3), supporting the use of the fractional-order model as the main viscoelastic identification model for the internal tissues.
Figure 5.
Incremental creep displacement response and model-fitting results during the holding stage of cucumber core and flesh tissues: (a) core tissues; (b) flesh tissues.
Table 3.
Burgers-type model parameters and fitting performance for cucumber flesh and core tissues.
Because the FE solver cannot directly accept the fractional-order Burgers-type equation, the incremental creep displacement reconstructed from the fitted fractional-order model was first converted into the target axial creep compliance.
where is the incremental compliance response reconstructed from the fractional-order Burgers-type model, in MPa−1; is the incremental creep displacement predicted by the fractional-order Burgers-type model, in mm; h0 is the initial specimen height, in mm; and σ0 is the engineering compressive stress during the holding stage, in MPa, calculated from the average holding load and the initial compressed area.
The target axial creep compliance was obtained by adding the apparent instantaneous compliance derived from the compression tests:
where is the target axial creep compliance, in MPa−1; t is the holding time, in s; E0 is the apparent initial compressive modulus obtained from the compression tests, in MPa; and is the incremental compliance response reconstructed from the fractional-order Burgers-type model, in MPa−1.
In the FE model, the flesh and core were described as isotropic linear viscoelastic materials. The instantaneous shear modulus and bulk modulus were calculated from the apparent initial compressive modulus and Poisson’s ratio:
where G0 is the instantaneous shear modulus, in MPa; E0 is the apparent initial compressive modulus, in MPa; ν is Poisson’s ratio; and K0 is the instantaneous bulk modulus, in MPa.
During parameter conversion, the bulk modulus K0 was assumed to be time-independent, and the time-dependent response was described by the shear Prony series:
where G(t) is the time-dependent shear modulus, in MPa; G0 is the instantaneous shear modulus, in MPa; i is the Prony-term index; n is the number of Prony terms; gi is the dimensionless relative shear modulus of the i-th Prony term; t is time, in s; and τi is the relaxation time of the i-th Prony term, in s. For each candidate set of Prony parameters, the axial creep compliance under uniaxial step stress was calculated analytically from isotropic linear viscoelastic relations. The equivalent Prony parameters were identified by minimizing the difference between and over the experimental holding-time range. The optimization was constrained by ≥ 0, < 1, and > 0. The number of terms was selected according to fitting error, parameter stability, and model parsimony.
Table 4 lists the equivalent Prony parameters finally used in the FE model. Both flesh and core were represented using three Prony terms. Before these parameters were used in the FE material definition, the target compliance and the equivalent Prony compliance were compared over the complete calibration time range. The values for the flesh and core were 0.9936 and 0.9943; the RMSEJ values were 0.00517 and 0.01580 MPa−1, and the maximum relative errors were 1.73% and 2.81%, respectively. These results indicate that the equivalent Prony representation reproduced the target axial creep compliance within the holding-time range used for calibration. Because the fractional-order Burgers-type response and a finite-term generalized Maxwell model have different long-term asymptotic behavior, the Prony parameters were not used for creep extrapolation beyond the calibrated time range.
Table 4.
Elastic and equivalent Prony viscoelastic parameters of cucumber flesh and core tissues.
2.4. Three-Layer Cucumber Finite Element Drop Model
2.4.1. Geometric Model and Tissue Interfaces
To describe the spatial distribution of different cucumber tissue regions, the whole fruit was simplified as a three-layer nested FE geometry composed of peel, flesh, and core. The longitudinal outer contour and tissue-interface morphology were extracted and smoothed from a representative longitudinal section image, while the overall dimensions were constrained by the measured mean values of fruit length, mean diameter, geometric outer-layer thickness, flesh thickness, and core diameter listed in Table 1. Under an axisymmetric approximation, the smoothed half-longitudinal contours were rotated 360° around the fruit’s longitudinal axis to generate the nested three-dimensional tissue regions. The resulting longitudinal section of the geometry is shown in Figure 6. The peduncle was not included in the geometric model; only the fruit body was retained. The peel layer was defined as the geometric outer layer covering the fruit surface, the flesh layer was located between the peel and core layers, and the core layer was located at the center of the fruit body. The peel-layer thickness in the model corresponded to the geometric outer-layer thickness in Table 1 and was independent of the actual thickness of the peel tensile specimens. The three tissue regions had no gaps or geometric overlap. Adjacent layers were constructed with continuous coincident interfaces, and interlayer delamination was not considered. The three-layer geometry was imported into ANSYS Workbench 2025 R1 (Ansys Inc., Canonsburg, PA, USA) and used in the Explicit Dynamics analysis system for meshing, tissue material assignment, drop posture and contact-boundary settings, and extraction of unique damage volume over the whole impact process. The material models and parameters for each tissue layer are described in the following section.
Figure 6.
Longitudinal section of the three-layer finite element geometric model of cucumber.
2.4.2. Material Models and Parameter Assignment
Independent material properties were assigned to each tissue layer according to the experimentally determined tissue parameters summarized in Table 2 and the input forms accepted by the FE solver. The peel layer was described using an isotropic linear elastic model, with density, elastic modulus, and Poisson’s ratio set to 1070 kg m−3, 12 MPa, and 0.27, respectively. The flesh and core layers were described using isotropic linear viscoelastic models, with densities of 950 and 960 kg m−3, respectively. For each internal tissue, the apparent initial compressive modulus E0 and Poisson’s ratio were determined experimentally as described in Section 2.2, and their mean values were used as the corresponding FE inputs. These values were used to calculate the instantaneous shear modulus G0 and bulk modulus K0. The time-dependent responses of the flesh and core were not entered into the FE model as fractional-order Burgers-type equations; instead, the creep responses identified in Section 2.3 were converted into the Prony-series parameters supported by the solver. Therefore, the viscoelastic inputs for the flesh and core layers used the gi and τi values listed in Table 4.
The contact plate was modeled as an isotropic linear elastic material, with material parameters taken from ANSYS Engineering Data(Ansys Inc. 2025R1, Canonsburg, PA, USA). PVC Foam, Plastic PS, and Aluminum Alloy were selected as low-, intermediate-, and high-stiffness anchor materials, respectively, to span an elastic-modulus-based contact-stiffness range from soft cushioning surfaces to rigid metallic surfaces. Their Young’s moduli were used to calculate the contact stiffness factor , where Ep is the Young’s modulus of the contact plate. The characteristic strength obtained from peel tensile testing and the tissue-specific damage thresholds derived from mechanical tests were not used for material degradation, failure initiation, plastic failure, or element deletion during the explicit dynamic simulation. These thresholds were applied only during post-processing to identify damaged elements according to tissue-specific von Mises equivalent-stress criteria and to calculate the unique damage volume over the whole impact process, as described in Section 2.5.2.
2.4.3. Element Type, Mesh Discretization, and Mesh-Independence Analysis
Considering the irregular outer shape of the cucumber and the irregular interfaces among the peel, flesh, and core tissues, the three-layer cucumber FE model was discretized using an unstructured mesh. The peel, flesh, and core layers were all meshed with four-node tetrahedral solid elements (Tet4 ANP). This element type can accommodate complex tissue boundaries and uses the average nodal pressure (ANP) algorithm to calculate element pressure, which helps reduce volumetric locking during large-deformation analysis of soft tissues. The geometrically regular contact plate was discretized using eight-node hexahedral solid elements (Hex8) to provide stable contact searching and load transfer in the contact region. Figure 7 shows the mesh discretization of the cucumber FE model and contact plate at three representative drop angles, corresponding to A = 30°, A = 0°, and A = −30°. The fruit-body surface was continuously discretized with a tetrahedral mesh, and the contact plate was meshed with a regular hexahedral grid. The global mesh size of the cucumber model was set to 3 mm. Because stress concentration during drop impact mainly occurred near the initial collision region between the cucumber and contact plate, a spherical influence region was used to locally refine the mesh in this area. For different drop-angle cases, only the initial posture of the cucumber relative to the contact plate was changed. The material parameters, contact settings, boundary conditions, and mesh-control principles were kept the same to ensure comparability among simulations.
Figure 7.
Mesh discretization of the cucumber FE model and contact plate at three representative drop angles: (a) A = 30°; (b) A = 0°; (c) A = −30°. The cucumber fruit body was discretized using an unstructured tetrahedral mesh, and the contact plate was discretized using a regular hexahedral mesh. The dashed line indicates the longitudinal reference axis of the cucumber used to define the drop angle relative to the contact plate surface.
To determine an appropriate local mesh size, a mesh-independence analysis was conducted under a representative drop condition. The spherical influence region covered the expected collision site, and local mesh sizes of 2.0, 1.5, 1.0, 0.8, 0.5, and 0.3 mm were evaluated. Except for the local mesh size, all schemes used the same geometry, material parameters, contact relationships, initial conditions, boundary conditions, and solver settings. Mesh independence was evaluated using the time-history response and peak stability of the maximum von Mises equivalent stress during drop impact. Because was the main threshold-based response variable of this study, its variation with mesh refinement was also evaluated as an additional convergence indicator. The maximum equivalent stress reflects local stress concentration in the contact region and its sensitivity to mesh refinement, making it suitable as the primary convergence indicator for the explicit dynamic model. The relative change in peak equivalent stress between two adjacent mesh levels was calculated as follows:
where is the relative change rate of peak von Mises equivalent stress between the j-th mesh level and the adjacent finer mesh level, expressed as a percentage; is the peak von Mises equivalent stress obtained from the j-th mesh level, in MPa; and is the peak von Mises equivalent stress obtained from the adjacent finer mesh level, in MPa.
Figure 8 shows that the main peaks of the maximum equivalent-stress time histories appeared in the early stage of impact for all local mesh sizes, and the post-peak oscillation-decay trends were similar. This indicates that local mesh refinement did not change the overall impact response of the model. For local mesh sizes of 2.0, 1.5, 1.0, 0.8, 0.5, and 0.3 mm, the peak equivalent stresses were 1.024, 1.133, 1.112, 1.186, 1.212, and 1.251 MPa, respectively. Although the peak stress did not change monotonically with mesh refinement, which is common in explicit contact calculations because of changes in local contact-element distribution and stress-concentration position, the peak changes from 0.8 to 0.5 mm and from 0.5 to 0.3 mm were 2.16% and 3.17%, respectively. These values indicate that the local stress response had become stable. Figure 8b,c further show the mesh dependence of . For local mesh sizes of 2.0, 1.5, 1.0, 0.8, 0.5, and 0.3 mm, was 0.00, 1.72, 10.55, 28.70, 29.58, and 30.18 mm3, respectively. The low values obtained with the coarse meshes indicate that these meshes were insufficient to resolve the threshold-crossing damage region. After the local mesh size was refined to 0.8 mm, the damage-volume response became substantially less sensitive to further refinement. Relative to the 0.3 mm reference mesh, the difference in was 4.93% at 0.8 mm and 2.00% at 0.5 mm, while the adjacent relative change decreased to 2.99% between 0.8 and 0.5 mm and 2.00% between 0.5 and 0.3 mm. Considering both the equivalent-stress response and convergence, the 0.8 mm local mesh was selected as a compromise between numerical accuracy and computational cost. Therefore, all subsequent response surface simulations used a 3 mm global mesh and a 0.8 mm local mesh in the collision region. The final computational model contained 45,690 nodes and 212,093 elements.
Figure 8.
Mesh-independence analysis under the representative drop condition: (a) time-history response of the maximum von Mises equivalent stress under different local mesh sizes; (b) whole-process unique damage volume under different local mesh sizes; and (c) relative difference in with respect to the 0.3 mm reference mesh and adjacent relative change between successive mesh levels. The global mesh size of the cucumber model was 3 mm, and the local mesh sizes in the collision region were 2.0, 1.5, 1.0, 0.8, 0.5, and 0.3 mm.
2.4.4. Contact Relationships, Boundary Conditions, and Initial Conditions
The core-flesh and flesh-peel interfaces were set as bonded contacts to ensure continuous load transfer between adjacent tissue layers, with no relative sliding or separation allowed at the interfaces. The contact between the cucumber peel surface and the contact plate was defined as frictional contact, with a friction coefficient of 0.15. The contact plate was fully constrained during the simulation. Gravity was applied in the vertical direction, and the drop height was represented by the corresponding initial impact velocity calculated from the principle of energy equivalence. The drop angle was set by changing the initial orientation of the cucumber relative to the contact plate. This strategy avoided explicit simulation of the free-fall stage and focused the calculation on the contact-impact response after the fruit reached the plate.
2.5. Damage-Volume Quantification and Response Surface Design
2.5.1. Simulation Factors and Levels for Response Surface Design
To establish a prediction database for cucumber drop-impact damage, a three-factor, three-level Box–Behnken design was generated using Design-Expert 8.0.6 (Stat-Ease, Inc., Minneapolis, MN, USA). Drop angle (A), drop height (B), and contact stiffness factor (C) were selected as the factors, representing the initial impact posture of the fruit, the impact-energy level, and the mechanical properties of the contact surface, respectively. Recent cucumber-harvesting studies have demonstrated the importance of fruit–end-effector interaction, manipulation, and damage reduction during robotic harvesting [8,42], while cucumber-specific postharvest studies have demonstrated sensitivity to impact loading and transportation-induced mechanical disturbance [7,9]. Recent reviews of fresh-fruit handling and packaging have also identified impact loading, contact conditions, and cushioning as important determinants of mechanical damage during postharvest handling [43,44]. The factors and levels are listed in Table 5. Drop angle A was set to −30°, 0°, and 30° to describe the initial posture of the cucumber relative to the contact plate. Here, A = 0° corresponded to the fruit’s longitudinal axis being parallel to the contact surface, while −30° and 30° were selected as symmetric moderate inclined design conditions around this horizontal reference posture to examine changes in initial contact location and load-transfer path. Drop height B was set to 0.10, 0.55, and 1.00 m to represent different impact-energy input levels. The selected drop-height levels were defined as an engineering design range for examining the effect of impact-energy input. The lower level of 0.10 m represented a low-impact condition, whereas the upper level of 1.00 m represented a severe accidental-release condition. The intermediate level of 0.55 m was the midpoint of the selected range. Previous controlled cucumber impact studies have also shown that increasing impact intensity aggravates bruise damage and postharvest quality deterioration [9]. In the FE model, drop height was defined as the vertical distance from the lowest point of the cucumber fruit body to the upper surface of the contact plate in the initial state. The corresponding initial impact velocity was calculated from this height and applied to the cucumber model. The contact stiffness factor C was defined as the common logarithm of the contact-plate elastic modulus expressed in MPa. Accordingly, in the response surface model, C was treated as a continuous surrogate factor within the tested elastic-modulus range, rather than as a material-specific categorical factor. Previous studies have shown that contact conditions, cushioning, and contact-related mechanical properties can affect fruit impact response and mechanical damage [27,43,44]. Accordingly, Young’s modulus was selected in the present study as a simplified scalar parameter for representing the stiffness of the idealized linear-elastic contact surface. This factor was used to examine numerical sensitivity to contact stiffness and was not intended to represent the complete material-specific behavior of real handling surfaces. The Box–Behnken design contained 17 FE simulation cases, including 12 edge cases and 5 center-point cases. Because the FE simulations were deterministic, the repeated center points were used mainly to maintain the Box–Behnken design structure and check numerical repeatability rather than to estimate random biological error. All cases used the same geometry, cucumber tissue material parameters, mesh scheme, contact settings, and post-processing procedure described in Section 2.4. Only the three factor levels listed in Table 5 were changed, with the contact-plate material varying according to the level of the contact stiffness factor C. Model interpretation and prediction were limited to the factor-level ranges shown in Table 5, and extrapolation outside these ranges was not performed.
Table 5.
Factors and levels in the Box–Behnken design.
2.5.2. Tissue-Specific Damage Thresholds and Unique Damage Volume over the Whole Process
After each Box–Behnken FE simulation, the maximum von Mises equivalent stress, tissue internal energy, and damage volume were extracted for the three tissue layers. Damage volume was calculated using a custom post-processing script based on tissue-specific von Mises equivalent-stress thresholds. Von Mises equivalent stress was selected as a scalar stress index because the drop-impact response involved a multiaxial stress state, and a common scalar measure was needed to compare over-threshold regions among tissue layers within the same FE framework. The use of this scalar index does not imply that all tissues shared the same threshold value or the same loading-mode assumption. The peel threshold was derived from the mean peak tensile stress obtained from peel tensile testing, whereas the flesh and core thresholds were derived from the mean characteristic transition stresses obtained from compression testing. Thus, the equivalent-stress measure was common to the three tissue layers, but the threshold values remained tissue-specific and retained the experimentally defined basis of each tissue. The thresholds for the peel, flesh, and core layers were 1.05, 0.20, and 0.15 MPa, respectively. These thresholds were used as working thresholds under the material-test, FE-model, and post-processing conditions of this study. The Prony-series viscoelastic parameters described the time-dependent deformation of the flesh and core, while the stress thresholds used for damage-volume extraction were kept rate-independent in the present post-processing procedure. They were not treated as universal failure constants for cucumber tissue and were not used for material degradation, failure initiation, or element deletion during explicit dynamic simulation. During post-processing, the equivalent stress of an element was represented by the average von Mises equivalent stress of the nodes associated with that element. For the e-th element in tissue layer k, if its node-averaged equivalent stress exceeded the corresponding tissue-layer threshold at any output time during the impact process, the element was marked as damaged:
where is the damage marker of the e-th element in tissue layer k; t is the output time during the impact process, in s; is the node-averaged von Mises equivalent stress of the e-th element in tissue layer k at time t, in MPa; and is the equivalent-stress threshold of the corresponding tissue layer, in MPa.
The unique damage volume over the whole process was calculated by summing the initial volumes of the damaged elements over the full time history:
where is the unique damage volume over the whole impact process, in mm3; k denotes the tissue layer; is the element set of tissue layer k; e is the element index within ; is the damage marker defined in Equation (7); and is the initial volume of the e-th element in tissue layer k, in mm3. This calculation counted only elements that exceeded the corresponding threshold at least once during the impact process and avoided repeated counting of the same element at multiple output times. All response surface simulations used the same mesh scheme, output-time settings, and post-processing procedure described in Section 2.4.3 to ensure comparability among cases.
Because damage volume varied over a wide range among different conditions, the log-transformed damage volume was used as the main response variable for response surface modeling:
where is the log-transformed response used for response surface fitting; is the unique damage volume obtained by FE post-processing, in mm3; and 1 is added to avoid taking the logarithm of zero.
where is the damage volume predicted by the response surface model after inverse transformation, in mm3; and is the predicted log-transformed damage-volume response obtained from the fitted response surface model.
Each simulation produced a data record containing the factor levels, unique damage volume over the whole process (), log-transformed damage volume (), peak equivalent stress, peak equivalent elastic strain, and tissue energy response. The tissue internal-energy time history was denoted as , and the peak internal energy or energy increment relative to the initial time was extracted when needed to support interpretation of damage-volume changes. A quadratic response surface model was established in Design-Expert 8.0.6 using as the main response variable. Because the FE simulations were deterministic, the response surface model was treated as a surrogate for predicting FE-derived damage volume within the tested design space rather than as a conventional experimental statistical inference model. The software-reported p-values were retained only as descriptive regression diagnostics for the model terms and were not interpreted as population-level significance tests based on random experimental error. Repeated center points were used only to check numerical repeatability; when pure error was zero, the lack-of-fit output was treated only as a software-reported reference. The model interpretation and prediction range were limited to the factor levels listed in Table 5. In addition, five FE conditions within the tested factor ranges but not included in the original Box–Behnken dataset were simulated independently and used only to evaluate the predictive performance of the fitted surrogate model; these points were not used to refit or update the RSM.
2.6. Physical Drop Validation Test and Experimental Damage-Volume Measurement
To evaluate the FE damage-volume extraction method and the response surface model against physical drop damage, physical drop validation tests were conducted on Zhongnong Cuiyu No. 3 cucumbers, and experimental damage volume was calculated from stained slice images. The workflow included drop impact, post-impact holding, continuous longitudinal slicing, tissue staining, fixed-position image acquisition, and probability-based damage segmentation, as shown in Figure 9.
Figure 9.
Workflow of the physical cucumber drop validation test and experimental damage-volume measurement. The dashed line in (a) denotes the reference level for drop height, the arrows indicate the workflow sequence, and the red regions in (f) denote the segmented damage regions.
Drop angles were set to −30°, 0°, and 30°, and drop heights were set to 0.10, 0.55, and 1.00 m. During testing, the cucumber was adjusted to the target angle and released freely from the specified height onto an aluminum alloy contact plate, as shown in Figure 9a. Before the formal validation tests, preliminary drop tests were conducted to quantify possible changes in fruit orientation during free fall. Three initial angles were tested, with five repeated drops at each angle. The contact angle was determined from the recorded frame immediately before first contact with the plate, based on the angle between the cucumber’s longitudinal axis and the plate surface. Across the 15 preliminary drops, the mean absolute angular change between the preset initial angle and the contact angle was 2.2 ± 0.5°. Because this variation was small relative to the 30° interval between the nominal angle levels, the preset angle was retained as the nominal drop angle for the physical validation and corresponding FE comparison. Drop height was defined as the vertical distance from the lowest point of the fruit body before release to the upper surface of the contact plate. The contact stiffness factor of the aluminum alloy plate was , where is the elastic modulus of the contact plate. This condition corresponded to the high contact-stiffness level in the response surface design. A total of 21 cucumbers were used in the validation test: 18 were used for the 9 drop conditions, with 2 cucumbers per condition, and the remaining 3 were used as non-dropped controls to evaluate background response from staining and image processing. After dropping, the samples were held for 12 h under unified environmental conditions, as shown in Figure 9b. The holding time was determined from preliminary tests to obtain a stable damage-staining response. The cucumbers were then continuously sliced along a plane passing through the impact point and parallel to the fruit’s longitudinal axis. The slice thickness was 2 mm, which allowed the damage distribution along the longitudinal and depth directions of the impact region to be characterized (Figure 9c). Damaged tissue was visualized using guaiacol-hydrogen peroxide staining. The slices were immersed for 10 min in a staining solution composed of 2.5 mmol/L guaiacol, 0.05% H2O2, and phosphate buffer used to maintain a stable pH for the color reaction, as shown in Figure 9d. After staining, slice images were acquired using an iPhone 15 on a fixed imaging platform. The camera lens was kept perpendicular to the slice plane, the imaging distance was 0.5 m, and a 415 mm × 260 mm calibration board was used to establish the conversion between pixel size and physical size. Lighting, camera position, and slice arrangement were kept consistent for all samples, as shown in Figure 9e.
Before damage segmentation, the stained images were subjected to lens-distortion correction and orientation correction. They were then processed sequentially for tissue-region extraction, regional division, and probability-based damage segmentation. Based on tissue color and spatial position, each slice was divided into center and non-center regions, and edge pixels were further identified. RGB images were converted to the CIELAB color space for subsequent color-feature extraction. A brown-staining index was constructed from the decrease in L* and the increase in a* and b* associated with damaged tissue, and a standardized brown-enhancement value z was obtained using robust local background correction. Low and high thresholds, and were determined separately for the center and non-center regions based on the background distribution of the control samples and threshold-sensitivity analysis. The pixel damage probability was defined as follows:
where is the damage probability of the i-th pixel in the j-th slice; is the standardized brown-enhancement value of the i-th pixel in the j-th slice; denotes the main region to which the pixel belongs, either the center or non-center region; and are the corresponding low and high thresholds for that region. For edge pixels, the effect of slicing disturbance, local dehydration, and shadowing on damage identification was reduced using the edge weight after thresholding in the corresponding region. The probability-based damage-segmentation result is shown in Figure 9f, where the translucent red regions indicate damaged areas identified using the probability-weighted method.
Experimental damage volume was calculated by integrating the pixel damage probabilities over all slices:
where Vexp is the experimental damage volume after background correction, in mm3; Ns is the number of slices for a sample; Nj is the number of valid tissue pixels in the j-th slice; is the damage probability of the i-th pixel in the j-th slice; is the corresponding edge weight; s is the image scale factor, in mm pixel−1; h is the slice thickness, equal to 2 mm; and is the mean background false-positive volume obtained from the three non-dropped control samples using the same slicing, staining, and image-processing procedure. was used for comparison with the FE-extracted damage volume and the response surface-predicted damage volume . For each drop condition, the experimental damage volumes obtained from the two cucumbers were summarized as the mean ± SD, and the condition-level mean was used to calculate the relative errors of the FE and RSM predictions. Because only two cucumbers were tested per condition, the SD was used only to describe within-condition variability and was not interpreted as an inferential estimate of population variability.
3. Results
3.1. Stress Response Characteristics During Drop Impact
Figure 10 shows the time histories of the maximum von Mises equivalent stress and the peak-time stress contours under different drop angles and drop heights at C = 3.27. The left column gives the maximum equivalent stress of the whole cucumber model as a function of time, and the right column shows the spatial distribution at the peak-stress moment. The horizontal dashed line represents the peel-layer von Mises equivalent-stress working threshold (= 1.05 MPa), which was used as a reference for assessing local peel stress exceedance. The peak-time contour reflects only a representative instant of stress concentration; the final damage volume was still calculated from the spatial union of elements that exceeded the corresponding threshold over the whole impact process. For the conditions shown in Figure 10, drop height had a clear effect on the maximum equivalent stress. At B = 0.10 m, the peak stresses for A = −30° and A = 30° were both approximately 1.57 MPa, but the peak times were 20.00 and 2.50 ms, respectively. When drop height increased to B = 1.00 m, the peak stresses for A = −30° and A = 30° increased to 3.30 and 3.05 MPa, respectively. The center condition (A = 0°, B = 0.55 m, C = 3.27) had a peak stress of 2.13 MPa, which was between the low- and high-height cases. These results indicate that increasing drop height substantially intensified the impact-stress response and increased the risk that local tissue stress would exceed the corresponding threshold. Drop angle mainly affected the peak time, contact sequence, and location of the high-stress region. At the low drop height, the global peak under A = −30° occurred at a later stage, whereas the A = 30° case reached its peak during the early impact stage. A similar difference was observed at the high drop height: the peak time was 7.50 ms for A = −30° and 1.50 ms for A = 30°. Some cases showed secondary stress peaks during the later impact stage, which may be associated with local re-contact after rebound or redistribution of the load. Because this interpretation is based mainly on stress histories and contour observations, it should be further examined together with contact-force, displacement, and energy histories.
Figure 10.
Equivalent-stress response of cucumber during drop impact at a contact stiffness factor of C = 3.27: (a) A = −30°, B = 0.10 m; (b) A = 30°, B = 0.10 m; (c) A = −30°, B = 1.00 m; (d) A = 30°, B = 1.00 m; and (e) A = 0°, B = 0.55 m. A and B denote the drop angle and drop height, respectively. The left column shows the maximum von Mises equivalent-stress time histories, and the right column shows the equivalent-stress contours at the peak-stress moment.
Figure 11 further shows the evolution of equivalent stress under B = 1.00 m and C = 3.27 for different drop angles, with Figure 11a–c corresponding to A = 0°, A = 30°, and A = −30°, respectively. Figure 11 illustrates the temporal evolution of high-stress regions, including their formation, expansion, and transfer throughout the impact process. Under the 0° posture, contact between the cucumber and plate was relatively concentrated, and the high-stress region mainly developed along the compressed side near the middle of the fruit body. Under the 30° and −30° postures, the initial contact region shifted toward one side of the fruit; high stress first formed near the local contact end and then expanded in the longitudinal and transverse directions. This indicates that drop angle affects not only peak-response characteristics but also the location where load enters the fruit and the stress-transfer path.
Figure 11.
Evolution of von Mises equivalent stress in cucumber during a 1.00 m drop impact under different drop angles at C = 3.27. Rows correspond to (a) A = 0°, (b) A = 30°, and (c) A = −30°. Four representative moments are shown for each angle, and the event stage and corresponding simulation time are labelled above each contour. For A = 0°, the frames represent before collision, collision, maximum-stress stage, and after collision. For A = 30° and A = −30°, the frames represent before collision, first collision, second collision, and after collision.
The stress contours and their evolution show that high drop-height cases produced more continuous high-stress regions that expanded along the cucumber’s longitudinal direction. This suggests that higher impact energy not only increased the instantaneous peak stress but also enlarged the potential over-threshold region. The three-layer FE model captured differences among local peel contact, flesh deformation buffering, and internal load transfer, but this section focuses on the overall equivalent-stress response. Damage identification in different tissue layers and calculation of unique damage volume over the whole process are further examined in the subsequent damage-volume extraction and response surface analyses. Overall, the FE stress results indicate that drop height was the main factor controlling cucumber impact-stress level, while drop angle mainly changed contact timing and stress-concentration location. These results provide a mechanical basis for the subsequent analyses of damage volume, energy response, and the response surface model.
3.2. RSM Model Development and Factor-Effect Analysis
Table 6 lists the 17 Box–Behnken FE simulation conditions and response results. The unique damage volume over the whole process () ranged from 49.01 to 20,939.10 mm3, and the corresponding ranged from 3.91229 to 9.94942, indicating large differences in damage magnitude among drop conditions. Damage volume was small at low drop height but increased markedly at high drop height; the maximum of 20,939.10 mm3 occurred at A = 30°, B = 1.00 m, and C = 3.27. The peak equivalent stress () and peak internal energy (Eint,peak) also generally increased with drop height, indicating consistency among damage volume, impact-stress level, and tissue energy input.
Table 6.
Box–Behnken FE simulation conditions and response results.
Table 7 gives the analysis of variance results for the quadratic response surface models of the damage-related response variables. For , the R2, adjusted R2, and predicted R2 values were 0.9934, 0.9849, and 0.8943, respectively, and the RMSE was 0.2484, indicating a close fit to the FE design data. Because the FE simulations were deterministic, the software-reported p-values were retained only as descriptive regression diagnostics for the model terms, rather than as conventional significance tests based on replicated random experimental observations. Within the fitted surrogate model, drop height (B) showed the largest contribution to the variation in , as indicated by its substantially larger sum of squares and the response-surface trends. The quadratic effects of drop angle (A2) and drop height (B2) also showed comparatively large contributions. In contrast, A, C, and the interaction terms AB, AC, and BC contributed less to damage volume than drop height within the tested range. Repeated center points were used only to check numerical repeatability, and the lack-of-fit result under zero pure error was treated only as a software-reported reference.
Table 7.
Response surface analysis results for the quadratic surrogate models of damage-related response variables.
Using as the response variable, a quadratic response surface model was established from the 17 simulation results in Table 6. The coded-factor equation was as follows:
where is the predicted log-transformed damage-volume response, and A, B, and C are the coded values of drop angle, drop height, and contact stiffness factor, respectively. The coded levels of −1, 0, and +1 correspond to the actual factor levels listed in Table 5. The predicted damage volume was then obtained from using the inverse transformation described in Section 2.5.2.
Figure 12 shows the response surfaces for as a function of two factors, with the remaining factor fixed at its center level. In the A–B factor plane (Figure 12a), the response increased mainly along the drop-height direction, confirming that drop height was the main source of damage-volume variation. The curvature along the drop-angle direction was also consistent with the comparatively large contribution of the A2 term in Table 7. In the A–C factor plane (Figure 12b), with drop height fixed at the center level, the surface was relatively flat, indicating that the contact stiffness factor had limited influence on at the medium drop height. The B–C plane (Figure 12c) again showed a height-dominated response, whereas variation along C was weak. This further indicates that the contact stiffness factor contributed less to total damage volume than drop height within the tested range.
Figure 12.
Response surfaces of the log-transformed damage volume predicted by the quadratic response surface model. The response variable is , where is the unique damage volume extracted from the FE simulations over the whole impact process: (a) A–B factor plane, with C fixed at the center level; (b) A–C factor plane, with B fixed at the center level; (c) B–C factor plane, with A fixed at the center level. Red markers indicate Box–Behnken design points, and the color scale and vertical-axis values indicate the model-predicted .
The mean response at each factor level further supports these patterns. When B increased from 0.10 to 0.55 and 1.00 m, the mean increased from 95.36 to 4211.29 and 17,504.13 mm3, respectively. The effect of drop angle was nonlinear: the mean values at A = −30°, 0°, and 30° were 7489.50, 4866.67, and 8635.37 mm3, respectively, with the center posture producing the lowest damage volume. The main effect of the contact stiffness factor was weaker. At C = 1.70, 3.27, and 4.84, the mean values were 6871.29, 6200.88, and 6251.61 mm3, respectively, with no clear monotonic trend. The ANOVA results for were broadly consistent with the damage-volume trend. In Table 7, drop height (B) showed the largest contribution to , consistent with its dominant role in impact-energy input. The terms A, A2, B2, and C2 also contributed to the energy-response model, suggesting that posture variation and the nonlinear effect of contact stiffness influenced the energy response during impact, although their contributions were lower than those of drop height. Figure 12 shows that drop height was the dominant factor controlling cucumber drop damage volume within the tested range; drop angle affected damage accumulation mainly by changing contact state and stress-transfer path; and contact stiffness factor had a relatively limited effect on total damage volume.
3.3. Experimental Validation and Model Applicability Analysis
To validate the FE damage-volume extraction method and the response surface model, physical drop tests were conducted under the same drop angles and heights as the A–B factor plane. Figure 13 shows the image-processing results of the stained slice images under different drop conditions. The damage volume obtained from these stained slice images was then compared with the FE-extracted damage volume and the response surface-predicted damage volume, as listed in Table 8.
Figure 13.
Image-processing results for cucumber drop damage under different drop angles (A) and drop heights (B): (a) A = −30°, B = 0.10 m; (b) A = −30°, B = 0.55 m; (c) A = −30°, B = 1.00 m; (d) A = 0°, B = 0.10 m; (e) A = 0°, B = 0.55 m; (f) A = 0°, B = 1.00 m; (g) A = 30°, B = 0.10 m; (h) A = 30°, B = 0.55 m; and (i) A = 30°, B = 1.00 m. Red regions indicate damaged tissue identified from stained slice images. V denotes the experimentally measured damage volume calculated by image processing, expressed in mm3.
Table 8.
Comparison of physical drop experiments and model-predicted damage volumes.
Figure 13 shows that damage regions in cucumber tissue expanded as drop height increased. At B = 0.10 m, the stained damage regions were small and mostly localized near the impact area. When B increased to 0.55 m and 1.00 m, the damage regions expanded along the longitudinal direction and in the depth direction, and some slices showed connected damage zones. This trend agrees with the FE results in Section 3.1, where higher drop height produced higher equivalent stress and more continuous high-stress regions. At the same drop height, the effect of drop angle on experimental damage volume was nonlinear. At the low height, differences among drop angles were small, indicating that the lower impact energy mainly caused localized mild damage. As drop height increased, the A = 0° condition produced lower damage volume than the two inclined conditions. For example, at B = 0.55 m, the damage volume at A = 0° was 2970 mm3, whereas the values at A = −30° and A = 30° were 6320 and 10,680 mm3, respectively. At B = 1.00 m, the damage volume at A = 0° was 16,120 mm3, also lower than those under the inclined postures. Together with the stress evolution in Figure 11, this result indicates that inclined drops changed the initial contact position and load-transfer path, allowing local high-stress regions to form and expand more readily and increasing the risk of damage accumulation.
Additional FE simulations were conducted at C = 4.84 for five validation conditions that were not included in the original 17-run Box–Behnken dataset used for fitting the response surface model. These additional simulations were used only as independent numerical validation points and were not used to refit or update the RSM. The corresponding FE results are marked with an asterisk (*) in Table 8. For the five additional FE conditions, the relative differences between and , calculated as ( − )/ × 100%, were 2.1%, 23.1%, −14.0%, −83.5%, and 9.8%, respectively. Four of the five validation points showed differences between −14.0% and 23.1%, whereas the A = 30°, B = 0.10 m slight-damage condition showed a substantially larger deviation of −83.5%. These additional FE results provide an independent numerical assessment of the predictive performance of the RSM on the C = 4.84 validation plane, while also indicating reduced surrogate accuracy in the slight-damage regime.
For the low-height validation conditions, the FE damage volumes were much lower than the experimental damage volumes. For example, at A = −30° and B = 0.10 m, was 178 mm3 compared with = 520 mm3; at A = 30° and B = 0.10 m, was 105 mm3 compared with = 705 mm3. This deviation should not be interpreted simply as systematic underestimation by the FE model at low drop height. When the newly formed damage volume is small, cucumber-to-cucumber variability, edge disturbance caused by slicing, staining diffusion, uneven background color, uncertainty in regional thresholds, and possible initial microdamage from transportation or pre-treatment can be amplified in the relative error.
The response surface model reproduced the overall increase in damage volume with drop height and the relatively low damage under the center posture, but relatively large point-prediction errors remained for some non-design validation conditions. This was related to the fact that the RSM was established from FE samples and that the Box–Behnken design did not directly cover all A–B validation conditions. The FE damage volume was calculated as the union of over-threshold elements over the full-time history, whereas the experimental damage volume was obtained from post-drop slicing, staining, and probability-weighted image segmentation. The two measures therefore differ in damage definition, spatial discretization, and thresholding. The validation is more appropriate for assessing damage trends and order of magnitude than for expecting exact correspondence at every validation point or in every slice-level damage pattern.
Table 8 indicates that, after matching the RSM prediction to the aluminum alloy contact condition (C = 4.84), the model captured the main validation trend. Damage volume increased with drop height, and the 0° posture generally produced lower damage than the inclined postures at medium and high drop heights. For example, at A = −30° and B = 0.55 m, the FE and RSM errors were −18.2% and 2.6%, respectively. At A = 30° and B = 1.00 m, where the FE result was obtained from an additional independent FE simulation rather than from the original 17-run Box–Behnken dataset, the FE and RSM errors were 0.3% and 10.1%, respectively. Together with Figure 11, these results indicate that inclined drops changed the initial contact position and stress-transfer path, promoting local stress concentration and damage accumulation. Within the tested range, reducing drop height remains the most direct measure for limiting cucumber impact damage. When drops cannot be avoided, reducing local end contact and secondary rolling collision under inclined postures may also help lower the damage volume. Therefore, the model should be used mainly to evaluate damage trends and order of magnitude rather than to provide exact point predictions for every validation condition.
4. Discussion
The FE simulations and response surface analysis showed that drop height, drop angle, and contact stiffness affected cucumber damage through different mechanical pathways. Drop height primarily determined the impact-energy input. At a higher drop height, the initial impact velocity and kinetic energy increased, resulting in higher stress levels, larger deformation, and a broader over-threshold region. The same height- or energy-dependent damage behavior has been reported for pears, white radishes, apples, litchi, and kiwifruit under impact or collision loading [17,18,19,24,34,38,39,40,41]. The drop angle changed the initial contact geometry and contact sequence. Inclined postures caused local end or side contact, which concentrated stress at the contact region and modified the load-transfer path inside the fruit. This explains the nonlinear effect of angle on damage volume and the lower damage observed under the 0° posture in several validation conditions. The contact stiffness factor mainly affected the local contact response in the simplified FE model. Within the tested stiffness range, its contribution to total damage volume was weaker than that of drop height. The response surface results for indicated changes in local energy storage and dissipation associated with the contact-stiffness factor, but this numerical trend was not independently validated across different physical contact surfaces.
Maximum equivalent stress and damage volume describe different aspects of drop-impact response. Peak stress captures the most severe instantaneous mechanical state, but it does not represent the duration of loading or the spatial accumulation of over-threshold tissue. The unique damage volume over the whole process integrates all elements that exceeded the corresponding tissue threshold at least once, and is therefore more suitable for describing distributed internal damage. The log transformation reduced the influence of extremely large damage volumes on the regression and improved the stability of the RSM within the tested design space. However, the RSM should be regarded as a surrogate model valid within the selected factor ranges, rather than as a universal damage model for all cucumber varieties, maturities, or handling conditions.
The FE-extracted damage volume and experimentally measured stained damage volume differ in physical definition. The FE result is based on a continuum model and tissue-specific stress thresholds, and the damage volume is the union of threshold-exceeding elements over the simulated time history. The experimental result is derived from physical slicing, guaiacol-hydrogen peroxide staining, and probability-weighted image segmentation after 12 h of post-impact holding [10,14,15,16,35,37]. It is therefore affected by biological variability among cucumbers, possible initial microdamage, slicing disturbance, staining reaction, spatial sampling by slices, and image thresholds. This difference was especially important at low drop height, where the true added damage volume was small and background response made up a larger fraction of the measured volume. For this reason, the validation results should be interpreted mainly as evidence that the model captured the damage trend and order of magnitude, not as proof of one-to-one correspondence between simulated elements and stained pixels. The physical validation dataset was also limited to two cucumbers per drop condition and three non-dropped controls. Although the replicate measurements provide an indication of within-condition variability, this sample size is insufficient for a strong assessment of quantitative predictive accuracy or broader biological variability. Therefore, the present physical validation should be regarded as an initial evaluation of damage trends and approximate damage magnitude under the tested conditions, and larger independent validation datasets are required to quantify prediction uncertainty more robustly.
From the perspective of postharvest mechanized handling, reducing drop height is the most direct control measure for lowering cucumber impact damage. During transfer, release, conveying, and packaging, limiting free-fall distance and avoiding inclined local contact or rolling collisions can reduce the formation of concentrated stress regions [5,6,8,20]. The present framework also provides a basis for comparing candidate handling conditions before physical tests are conducted. Nevertheless, the model parameters and damage thresholds were obtained for Zhongnong Cuiyu No. 3 cucumbers with similar maturity and under the tested conditioning environment. Moisture content and peel puncture force were measured to characterize the physical state of the tested cucumbers but were not introduced as independent material parameters in the FE simulations. The FE model was parameterized primarily using peel tensile testing and flesh and core compression and creep testing. Therefore, the effects of variation in moisture content and peel puncture force on impact-damage susceptibility were not independently quantified in the present model. Another limitation concerns the loading-rate dependence of the working stress thresholds used for damage identification. The tensile and compression tests used to define the peel, flesh, and core thresholds were performed at 1 mm/s, whereas drop impact occurred over a much shorter time scale. Previous studies have shown that fruit-tissue mechanical and failure responses can vary with loading speed and dynamic loading conditions [27,28,45]. Therefore, the thresholds used in this study should be interpreted as tissue-specific working thresholds for comparative damage-volume extraction under the present calibration and validation conditions, rather than as rate-independent failure constants. The use of von Mises equivalent stress was retained because it provides a consistent scalar index for comparing multiaxial stress states among the peel, flesh, and core in the FE post-processing step, and similar scalar equivalent-stress measures have been used in layered viscoelastic fruit FE analyses under mechanical loading [23]. In the present contact model, the plate was simplified as a flat, isotropic, linear-elastic surface, and the contact stiffness factor was defined from its Young’s modulus. Although the tested range included an intermediate polymeric stiffness level relevant to non-rigid plastic contact conditions, detailed fruit-crate characteristics, such as wall thickness, ribs, openings, corners, local edge contact, and material-specific frictional or nonlinear behavior, were not explicitly represented. Moreover, physical validation was performed only on the aluminum alloy plate corresponding to C = 4.84. Therefore, the effect of contact stiffness should be interpreted as numerical sensitivity within the simplified contact models and tested range, rather than as a physically validated comparison among different contact materials. Accordingly, predictions from the response surface model should be interpreted as interpolation-based estimates within the tested ranges of drop angle, drop height, and contact stiffness factor. Conditions outside these ranges require additional simulation or experimental validation before prediction. For other cultivars, maturity levels, contact materials, or storage states, tissue mechanical parameters and working thresholds should be remeasured before prediction. Future work should include larger independent validation datasets covering multiple cucumber cultivars and broader impact and handling conditions, including different drop orientations, drop heights, contact conditions, maturity levels, and storage states. Such validation should be combined with improved damage criteria and uncertainty analysis to further evaluate the robustness and transferability of the proposed framework.
5. Conclusions
- (1)
- This study established a cucumber drop-damage volume prediction framework that integrates tissue viscoelastic characterization, three-layer FE simulation, and response surface analysis, linking tissue-scale mechanical properties with whole-fruit impact damage. The fractional-order Burgers-type model more accurately described the time-dependent deformation of the flesh and core, and its response was converted into FE-compatible Prony-series parameters. The three-layer FE model preserved the structural differences among the peel, flesh, and core, helping represent local contact at the peel, deformation buffering in the flesh, and internal load transfer during impact. Within the tested conditions, the method can characterize the mechanical response and threshold-based damage-volume evolution of cucumber under drop impact, providing a feasible route for comparative assessment of drop-impact damage during postharvest handling.
- (2)
- The FE simulations and response surface analysis showed that drop height was the main factor controlling cucumber drop damage. Increasing drop height increased tissue stress level and damage volume. Drop angle mainly affected impact contact state, high-stress region distribution, and damage-expansion path. Within the simplified FE contact models and tested stiffness range, the contact stiffness factor showed a weaker influence on total damage volume, particularly compared with drop height, although changes in local contact response were still observed. This effect should be interpreted as numerical sensitivity because physical validation was performed only on the aluminum alloy contact plate.
- (3)
- The physical drop tests provided an initial experimental evaluation of the predicted cucumber damage-volume trends. The experimental damage volume generally increased with drop height, and the FE and RSM results reproduced the main trend and approximate magnitude under several tested conditions, although condition-dependent deviations remained. Given the limited number of physical replicates, together with biological variability and uncertainty associated with staining and image-based damage quantification, the present validation is more appropriate for evaluating damage trends and approximate magnitude than for supporting high-precision point prediction.
- (4)
- Within the parameter ranges of 0.10–1.00 m drop height, −30° to 30° drop angle, and log (contact stiffness) of 1.70–4.84, the proposed framework can be used for comparative numerical assessment of drop-damage risk and screening of candidate handling conditions. The contact-stiffness factor should be regarded as a simplified numerical representation until its effects are independently validated using additional physical contact surfaces with more complete contact-property descriptions. Future studies should expand the independent validation dataset to multiple cucumber cultivars and broader impact and handling conditions to further assess model robustness and transferability, while incorporating improved damage criteria and uncertainty analysis for slight damage and more complex postharvest conditions.
Author Contributions
Conceptualization, S.Z. and Z.Z.; methodology, S.Z. and Z.Z.; software, J.S. and Y.F.; validation, H.P. and Y.F.; investigation, S.Z., J.S., H.P. and Y.F.; resources, Z.Z.; data curation, S.Z. and Y.F.; writing—original draft preparation, S.Z.; writing—review and editing, Z.Z. and S.Z.; visualization, S.Z.; supervision, Z.Z. and H.M.; project administration, Z.Z.; funding acquisition, Z.Z. All authors have read and agreed to the published version of the manuscript.
Funding
This work was supported by the earmarked fund for the China Agriculture Research System (CARS-21-D03) and the Priority Academic Program Development of Jiangsu Higher Education Institutions (Jiangsu Education Department, Grant No. PAPD-2023-87).
Institutional Review Board Statement
Not applicable.
Data Availability Statement
The raw data supporting the conclusions of this article will be made available by the authors on request.
Conflicts of Interest
The authors declare no conflicts of interest.
References
- Liu, F.; Zhang, Y.; Du, C.; Ren, X.; Huang, B.; Chai, X. Design and Experimentation of a Machine Vision-Based Cucumber Quality Grader. Foods 2024, 13, 606. [Google Scholar] [CrossRef] [Scilit] [PubMed]
- Moradi, M.; Balanian, H.; Taherian, A.; Mousavi Khaneghah, A. Physical and mechanical properties of three varieties of cucumber: A mathematical modeling. J. Food Process Eng. 2020, 43, e13323. [Google Scholar] [CrossRef] [Scilit]
- Kaur, P.; Devgan, K.; Kumar, N.; Kaur, A.; Kumar, M.; Sandhu, K. Quality retention and shelf-life prolongation of cucumbers (Cucumis sativus L.) under different cool storage systems with passive modified atmosphere bulk packaging. Packag. Technol. Sci. 2021, 34, 567–578. [Google Scholar] [CrossRef] [Scilit]
- Liu, F.; Zhang, N.; Huang, B.; Chai, X. Nondestructive Evaluation of Soluble Solid Content of Cucumbers Based on VIS–NIR and SWIR Hyperspectral Images. Food Sci. Nutr. 2025, 13, e71055. [Google Scholar] [CrossRef] [Scilit] [PubMed]
- Gao, W.; Liu, J.; Deng, J.; Jiang, Y.; Jin, Y. Research Status and Trends in Universal Robotic Picking End-Effectors for Various Fruits. Agronomy 2025, 15, 2283. [Google Scholar] [CrossRef] [Scilit]
- Ahmed, A.; Zhang, Z.; Manzoor, S.H.; Abdelhamid, M.A.; Gul, N.; Ahmed, R.; Mhamed, M.; Sun, R.; Hao, C.; Huo, W.; et al. Cucumber picking robots: Technological progress, challenges, and future directions. Smart Agric. Technol. 2026, 13, 101813. [Google Scholar] [CrossRef] [Scilit]
- Zhang, L.; Zhang, M.; Law, C.L.; Ma, Y. Effect of vibration and broken cold chain on the evolution of cell wall polysaccharides during fruit cucumber (Cucumis sativus L.) shriveling under simulated transportation. Food Packag. Shelf Life 2023, 38, 101126. [Google Scholar] [CrossRef] [Scilit]
- Jo, Y.; Park, Y.; Son, H.I. A suction cup-based soft robotic gripper for cucumber harvesting: Design and validation. Biosyst. Eng. 2024, 238, 143–156. [Google Scholar] [CrossRef] [Scilit]
- Al-Hadrami, A.; Pathare, P.B.; Al-Dairi, M.; Al-Mahdouri, A. Investigation of Bruise Damage and Storage on Cucumber Quality. AgriEngineering 2023, 5, 855–875. [Google Scholar] [CrossRef] [Scilit]
- Lu, Y.; Lu, R.; Zhang, Z. Detection of subsurface bruising in fresh pickling cucumbers using structured-illumination reflectance imaging. Postharvest Biol. Technol. 2021, 180, 111624. [Google Scholar] [CrossRef] [Scilit]
- Liu, J.; Sun, J.; Wang, Y.; Liu, X.; Zhang, Y.; Fu, H. Non-Destructive Detection of Fruit Quality: Technologies, Applications and Prospects. Foods 2025, 14, 2137. [Google Scholar] [CrossRef] [Scilit] [PubMed]
- Yang, C.; Guo, Z.; Fernandes Barbin, D.; Dai, Z.; Watson, N.; Povey, M.; Zou, X. Hyperspectral Imaging and Deep Learning for Quality and Safety Inspection of Fruits and Vegetables: A Review. J. Agric. Food Chem. 2025, 73, 10019–10035. [Google Scholar] [CrossRef] [Scilit] [PubMed]
- Du, Z.; Hu, Y.; Ali Buttar, N.; Mahmood, A. X-ray computed tomography for quality inspection of agricultural products: A review. Food Sci. Nutr. 2019, 7, 3146–3160. [Google Scholar] [CrossRef] [Scilit] [PubMed]
- Huang, Y.; Liang, Z. Assessment of apple bruise resistance under transient collisions through X-ray computed tomography and image processing. Biosyst. Eng. 2024, 244, 16–25. [Google Scholar] [CrossRef] [Scilit]
- Liang, Z.; Wang, S.; Huang, Y. Predictions of apple mechanical damage volume using micro-CT measurements and support vector regression(SVR). Comput. Electron. Agric. 2024, 226, 109402. [Google Scholar] [CrossRef] [Scilit]
- Sun, C.; Zhang, L.; Zhai, L.; Shen, T.; Cai, J.; Zou, X.; Guo, Z. Automatic early bruise detection in strawberry fruit by hyperspectral imaging and deep learning techniques. Postharvest Biol. Technol. 2026, 232, 113966. [Google Scholar] [CrossRef] [Scilit]
- Yousefi, S.; Farsi, H.; Kheiralipour, K. Drop test of pear fruit: Experimental measurement and finite element modelling. Biosyst. Eng. 2016, 147, 17–25. [Google Scholar] [CrossRef] [Scilit]
- Liang, Z.; Wang, S.; Yang, H. Assessment of bruising susceptibility of Korla fragrant pears under repeated impacts using a pendulum and X-ray computed tomography. Lwt 2026, 239, 118973. [Google Scholar] [CrossRef] [Scilit]
- Fu, H.; Du, W.; Yang, J.; Wang, W.; Wu, Z.; Yang, Z. Bruise measurement of fresh market apples caused by repeated impacts using a pendulum method. Postharvest Biol. Technol. 2023, 195, 112143. [Google Scholar] [CrossRef] [Scilit]
- Zulkifli, N.; Hashim, N.; Harith, H.H.; Mohamad Shukery, M.F. Finite element modelling for fruit stress analysis—A review. Trends Food Sci. Technol. 2020, 97, 29–37. [Google Scholar] [CrossRef] [Scilit]
- Gao, S.; Huang, X.; Li, Z.; Zhang, X.; Yuan, Z.; El-Mesery, H.S.; Shi, J.; Zou, X. Exploring fruit mechanical injury mechanisms: A review of numerical simulation techniques in the whole supply chain. Comput. Electron. Agric. 2025, 239, 110998. [Google Scholar] [CrossRef] [Scilit]
- Ahmadi, E.; Barikloo, H.; Kashfi, M. Viscoelastic finite element analysis of the dynamic behavior of apple under impact loading with regard to its different layers. Comput. Electron. Agric. 2016, 121, 1–11. [Google Scholar] [CrossRef] [Scilit]
- Ji, W.; Qian, Z.; Xu, B.; Chen, G.; Zhao, D. Apple viscoelastic complex model for bruise damage analysis in constant velocity grasping by gripper. Comput. Electron. Agric. 2019, 162, 907–920. [Google Scholar] [CrossRef] [Scilit]
- Li, Z.; He, Z.; Hao, W.; Li, K.; Ding, X.; Cui, Y. Kiwifruit Harvesting Damage Analysis and Verification. Processes 2023, 11, 598. [Google Scholar] [CrossRef] [Scilit]
- Xu, C.; Wang, D.; Xu, F.; Tang, H.; Zhao, J.; Wang, J. Prediction of bruising susceptibility in white radish (Raphanus sativus L.) using FEA-RSM technique. Postharvest Biol. Technol. 2023, 206, 112565. [Google Scholar] [CrossRef] [Scilit]
- Mahiuddin, M.; Godhani, D.; Feng, L.; Liu, F.; Langrish, T.; Karim, M.A. Application of Caputo fractional rheological model to determine the viscoelastic and mechanical properties of fruit and vegetables. Postharvest Biol. Technol. 2020, 163, 111147. [Google Scholar] [CrossRef] [Scilit]
- Liang, Z.; Huang, Y.; Li, D.; Wada, M.E. Parameter determination of a viscoelastic–plastic contact model for potatoes during transient collisions. Biosyst. Eng. 2023, 234, 156–171. [Google Scholar] [CrossRef] [Scilit]
- An, X.; Li, Z.; Zude-Sasse, M.; Tchuenbou-Magaia, F.; Yang, Y. Characterization of textural failure mechanics of strawberry fruit. J. Food Eng. 2020, 282, 110016. [Google Scholar] [CrossRef] [Scilit]
- Hao, C.; Yang, D.; Zhao, L.; Yang, J.; Wang, T.; He, J. Compressive Characteristics and Fracture Simulation of Cerasus Humilis Fruit. Agriculture 2025, 15, 88. [Google Scholar] [CrossRef] [Scilit]
- Ban, Z.; Chen, H.; Fang, C.; Jin, L.; Kitazawa, H.; Chen, C.; Liu, L.; Lu, J. Investigating the damage characteristics of kiwifruits through the integration of compressive load and finite element method. J. Food Eng. 2024, 383, 112247. [Google Scholar] [CrossRef] [Scilit]
- Zhu, Y.; Zhu, L.; Guo, W.; Han, Z.; Wang, R.; Zhang, W.; Yuan, Y.; Gao, J.; Liu, S. Multiscale Static Compressive Damage Characteristics of Kiwifruit Based on the Finite Element Method. Foods 2024, 13, 785. [Google Scholar] [CrossRef] [Scilit] [PubMed]
- Liang, Z.; Zhou, Z.; Huang, Y.; Yang, H. Assessing apple bruise susceptibility using the discrete element method. J. Food Eng. 2025, 394, 112517. [Google Scholar] [CrossRef] [Scilit]
- Hou, J.; Park, B.; Li, C.; Wang, X. A multiscale computation study on bruise susceptibility of blueberries from mechanical impact. Postharvest Biol. Technol. 2024, 208, 112660. [Google Scholar] [CrossRef] [Scilit]
- Guo, J.; Yang, Z.; Karkee, M.; Han, X.; Duan, J.; He, Y. Dynamic finite element simulation of the collision behavior and multi-parameter quantitative characterization of the damage degree of banana fruit in the post-harvest operations. Postharvest Biol. Technol. 2025, 219, 113284. [Google Scholar] [CrossRef] [Scilit]
- Xu, C.; Liu, J.; Wang, D.; Guan, X.; Tang, H.; Li, Y. Evaluation of bruise volume quantification methods using finite element analysis for apple (Malus pumila Mill.). Postharvest Biol. Technol. 2024, 213, 112930. [Google Scholar] [CrossRef] [Scilit]
- Zheng, Z.; An, Z.; Liu, X.; Chen, J.; Wang, Y. Finite Element Analysis and Near-Infrared Hyperspectral Reflectance Imaging for the Determination of Blueberry Bruise Grading. Foods 2022, 11, 1899. [Google Scholar] [CrossRef] [Scilit] [PubMed]
- Guo, J.; Liu, Y.; Karkee, M.; Feng, X.; Huang, Z.; Wang, Y.; Zhang, W.; Li, X.; He, Y. Determination and quantitative evaluation of early postharvest hidden damage in fresh strawberry fruit based on coupling of dynamic finite element method and response surface methodology. Comput. Electron. Agric. 2024, 227, 109588. [Google Scholar] [CrossRef] [Scilit]
- Bao, M.; Xu, Z.; Hui, B.; Zhou, Q. Simulation and Experiment of Optimal Conditions for Apple Harvesting with High Fruit Stalk Retention Rate. Agriculture 2024, 14, 2280. [Google Scholar] [CrossRef] [Scilit]
- Zhang, S.; Wang, W.; Wang, Y.; Fu, H.; Yang, Z. Improved prediction of litchi impact characteristics with an energy dissipation model. Postharvest Biol. Technol. 2021, 176, 111508. [Google Scholar] [CrossRef] [Scilit]
- Xia, X.; Xu, Z.; Yu, C.; Zhou, Q.; Chen, J. Finite Element Analysis and Experiment of the Bruise Behavior of Carrot under Impact Loading. Agriculture 2021, 11, 471. [Google Scholar] [CrossRef] [Scilit]
- Zhu, Y.; Zhu, L.; Wang, W.; Zhao, B.; Han, Z.; Wang, R.; Yuan, Y.; Lu, K.; Feng, X.; Hu, X. Multiscale Modeling and Simulation of Falling Collision Damage Sensitivity of Kiwifruit. Foods 2024, 13, 3523. [Google Scholar] [CrossRef] [Scilit] [PubMed]
- Park, Y.; Seol, J.; Pak, J.; Jo, Y.; Kim, C.; Son, H.I. Human-centered approach for an efficient cucumber harvesting robot system: Harvest ordering, visual servoing, and end-effector. Comput. Electron. Agric. 2023, 212, 108116. [Google Scholar] [CrossRef] [Scilit]
- Lin, M.; Fawole, O.A.; Saeys, W.; Wu, D.; Wang, J.; Opara, U.L.; Nicolai, B.; Chen, K. Mechanical damages and packaging methods along the fresh fruit supply chain: A review. Crit. Rev. Food Sci. Nutr. 2022, 63, 10283–10302. [Google Scholar] [CrossRef] [Scilit] [PubMed]
- Hao, J.; Qiao, P.; Wang, J.; Wang, M.; Li, Z.; Tang, W.; Fauconnier, M.-L. Advanced packaging technology for fresh fruit: From anti-damage and preservation to intelligent monitoring. Trends Food Sci. Technol. 2025, 166, 105369. [Google Scholar] [CrossRef] [Scilit]
- Stropek, Z.; Gołacki, K. Response of Apple Flesh to Compression under the Quasi-Static and Impact Loading Conditions. Materials 2022, 15, 7743. [Google Scholar] [CrossRef] [Scilit] [PubMed]
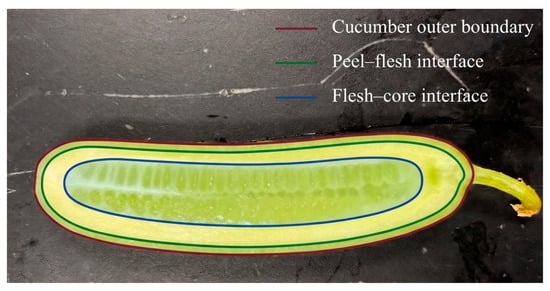
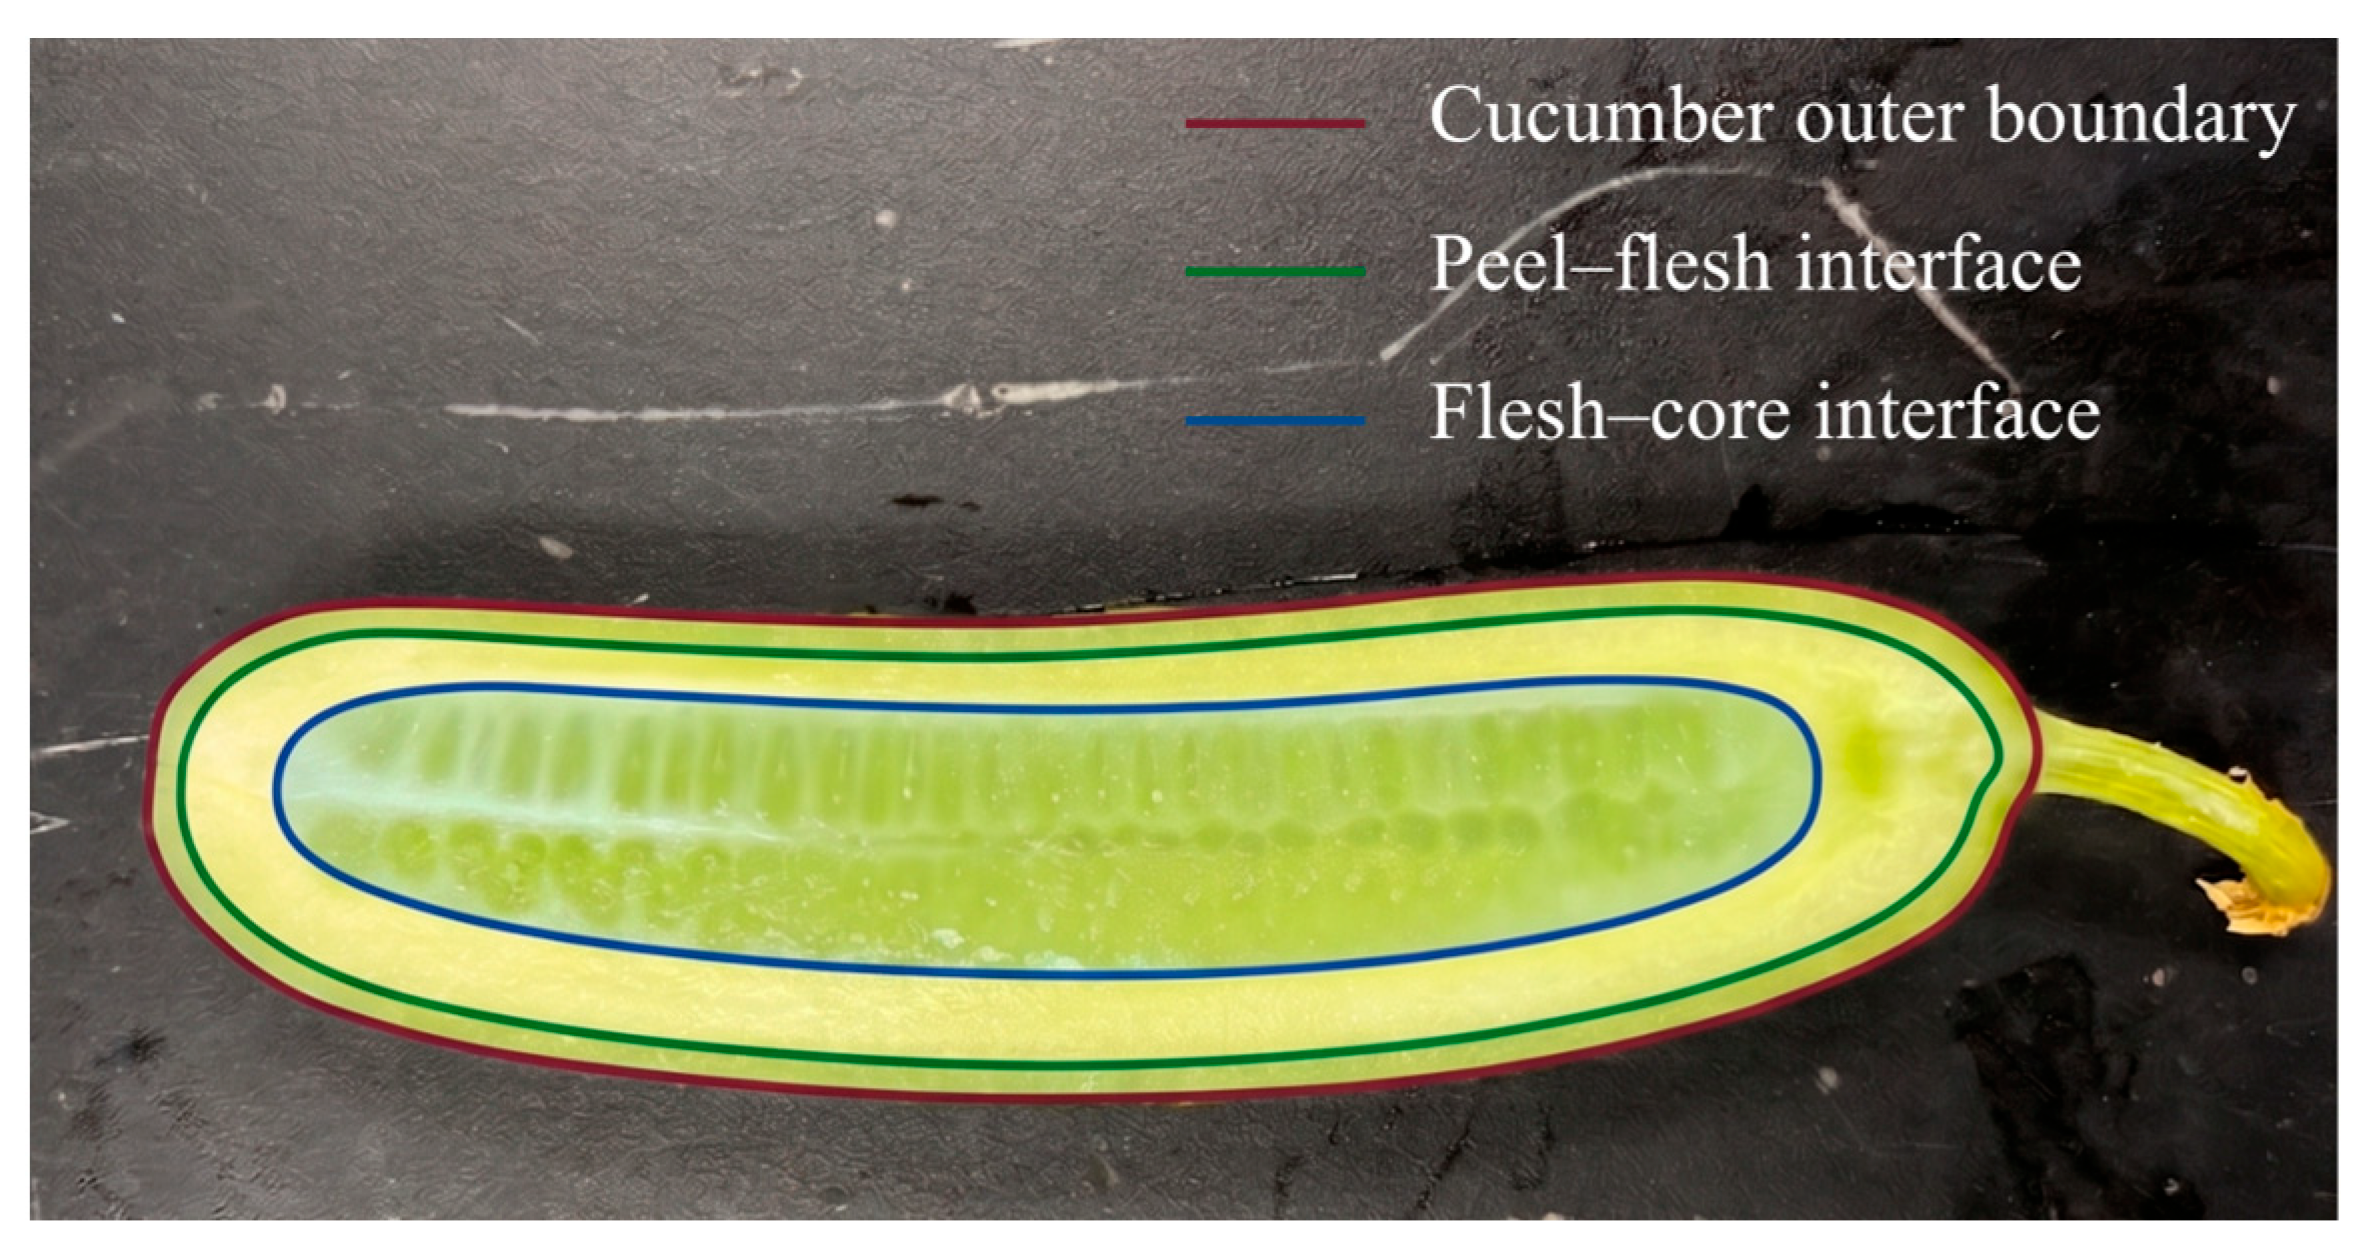
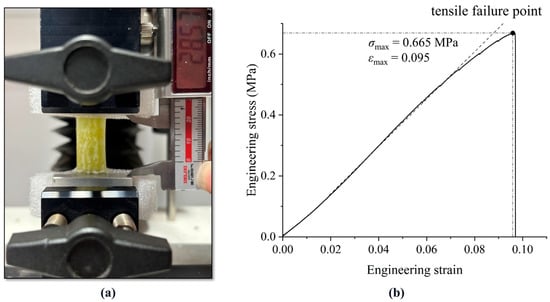
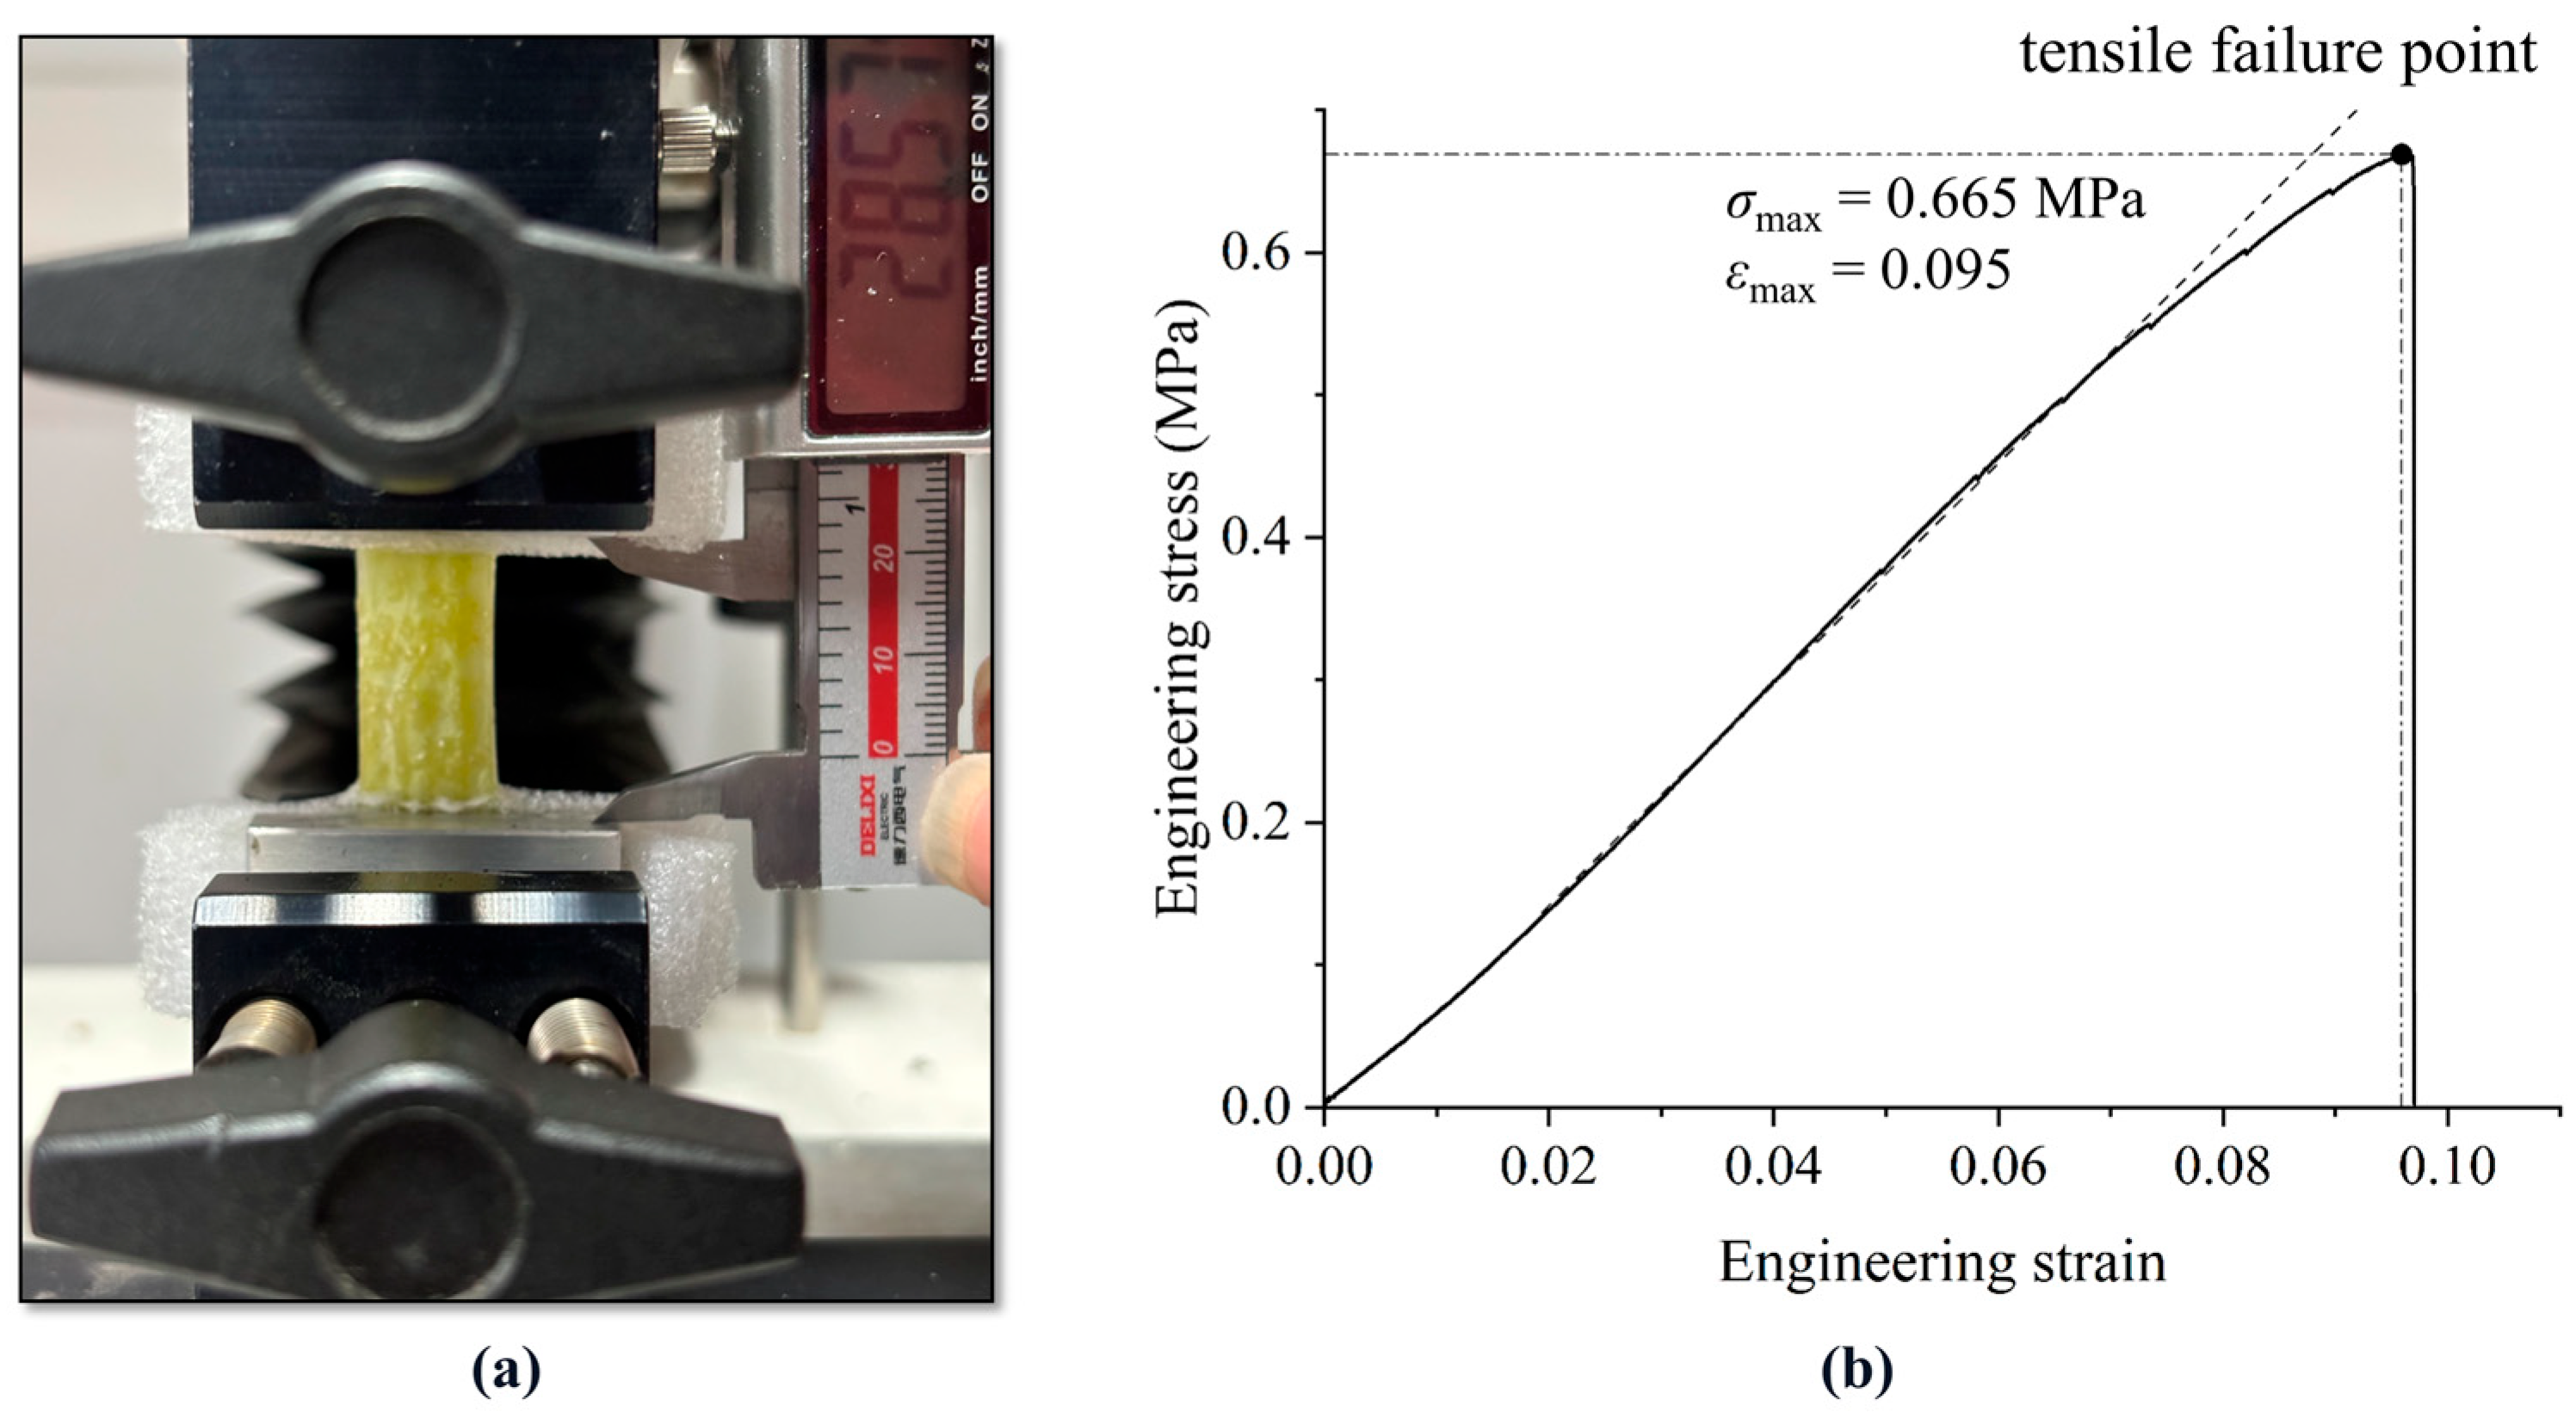
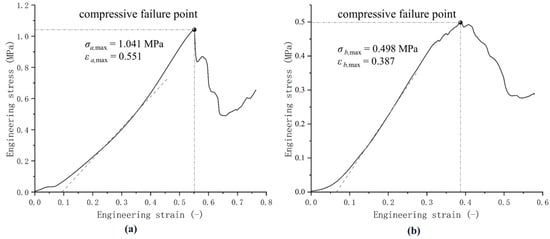
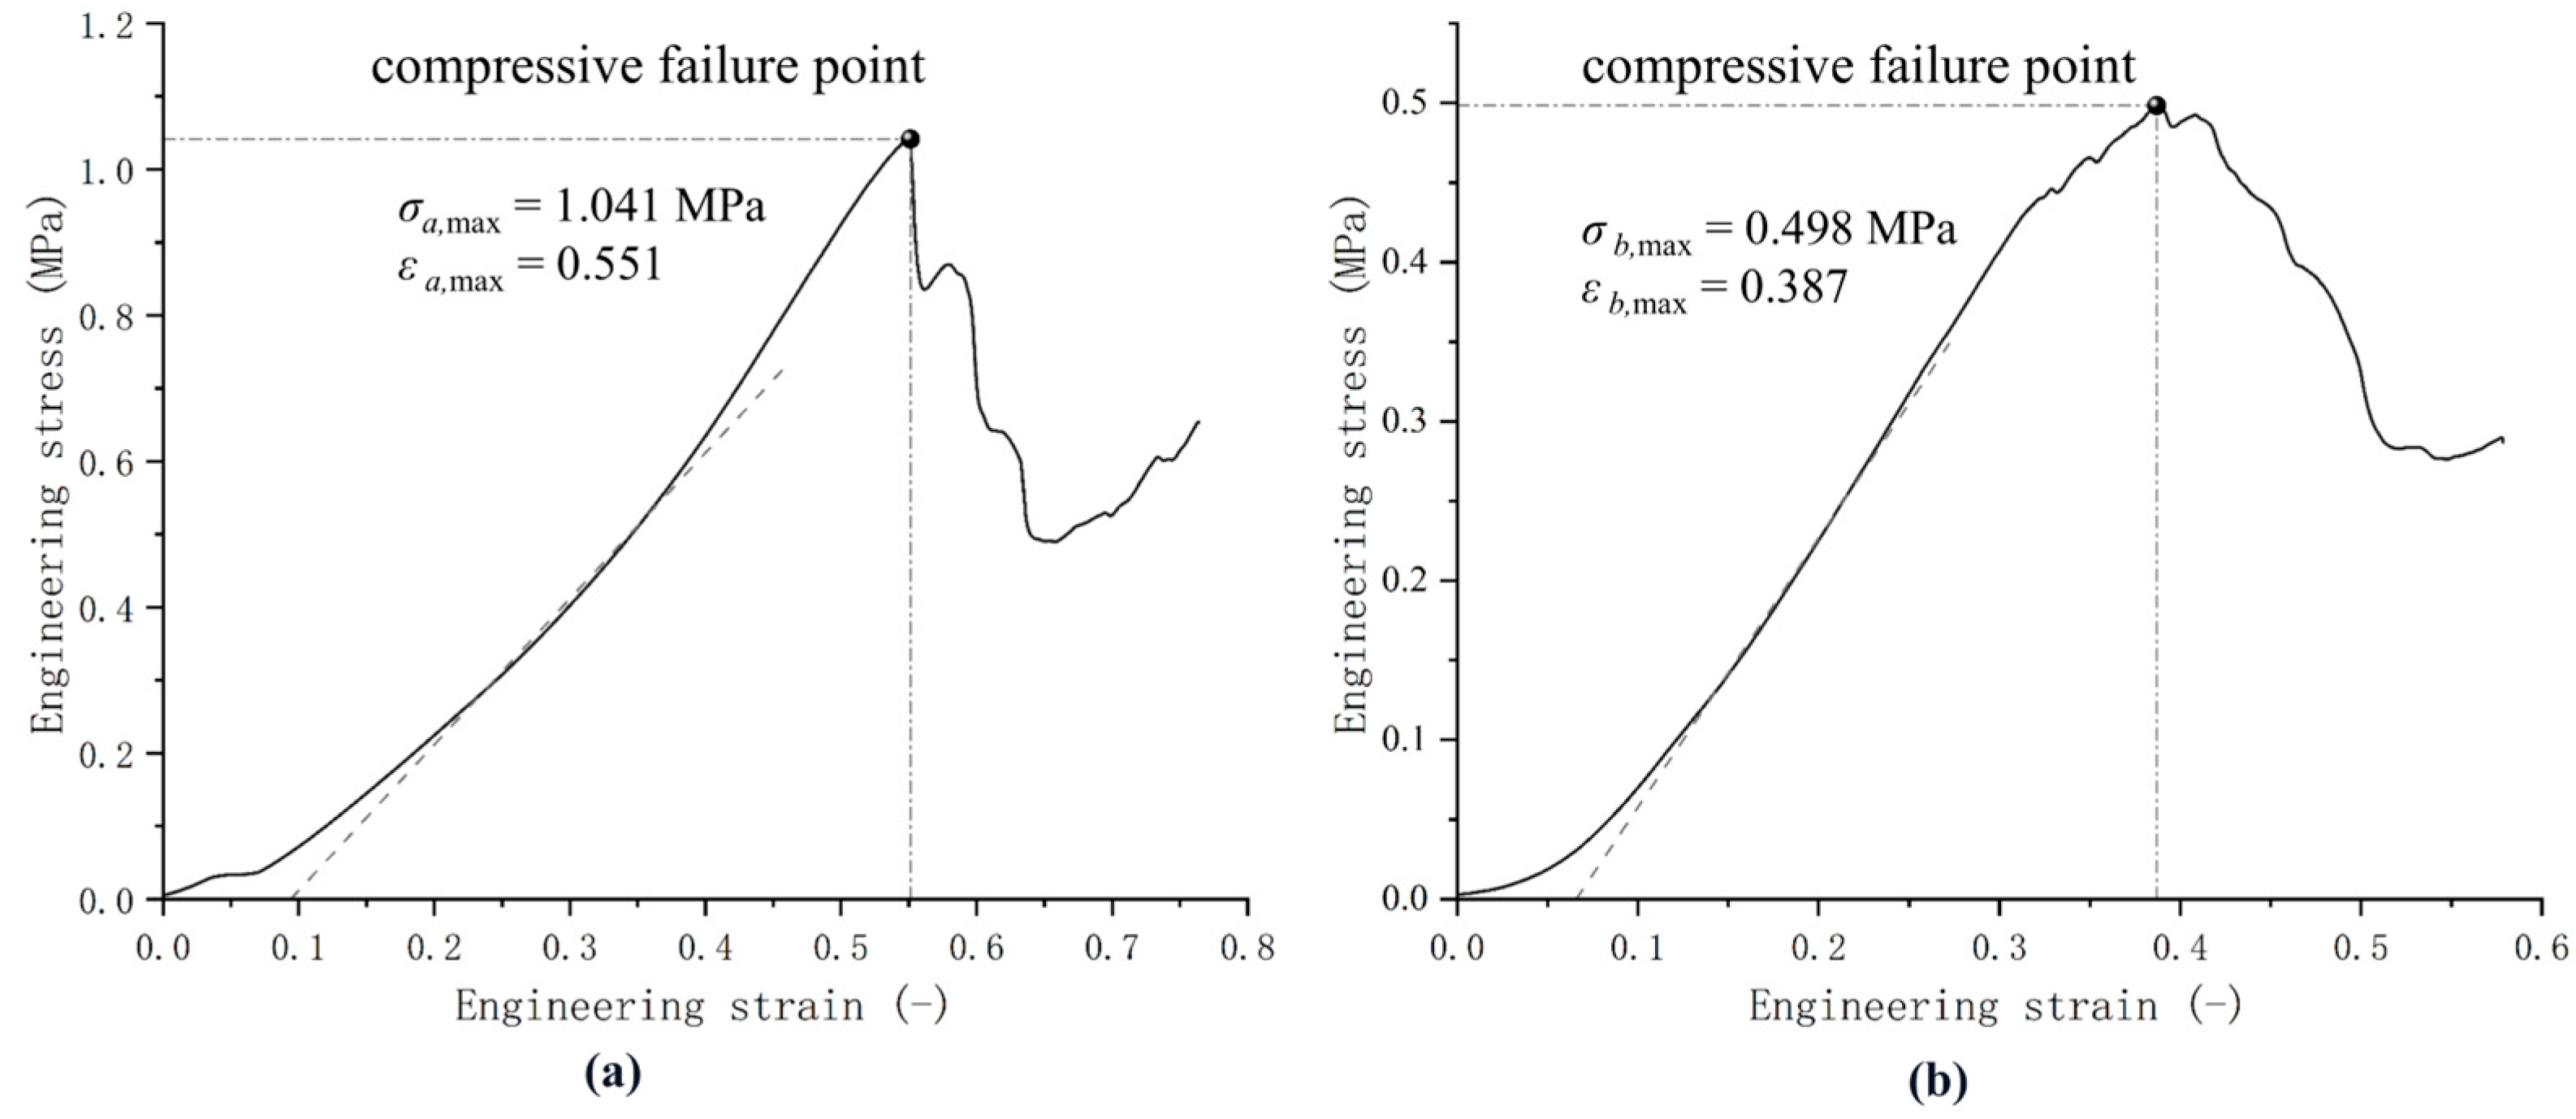
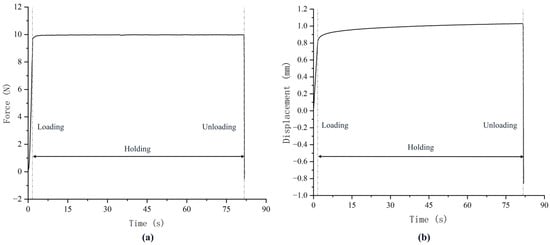
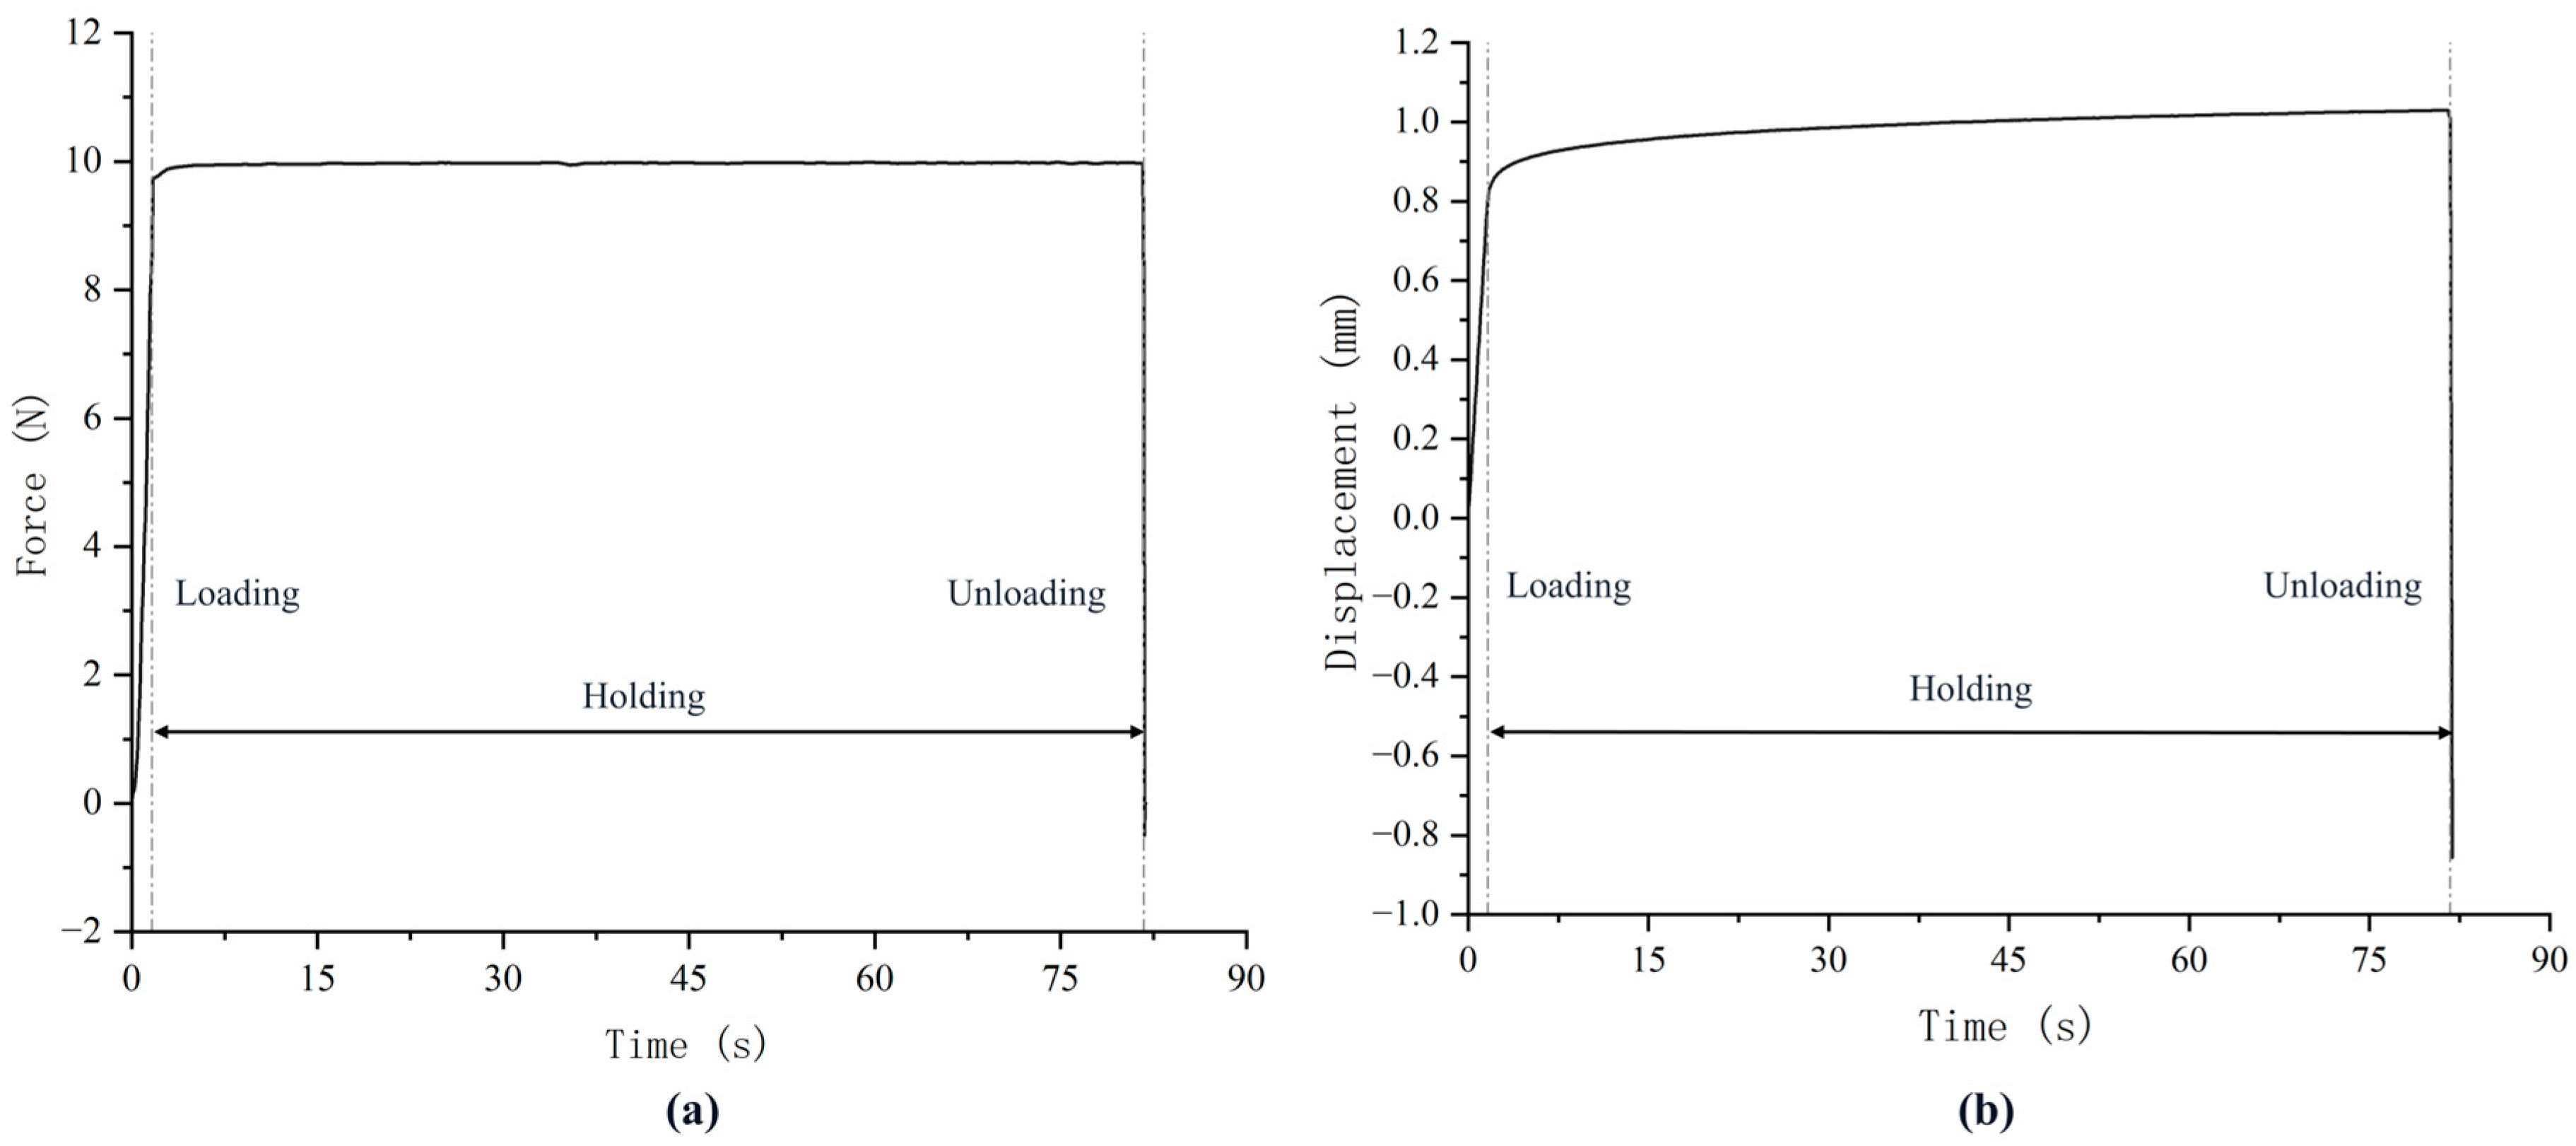
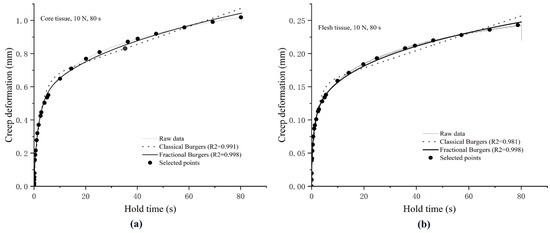
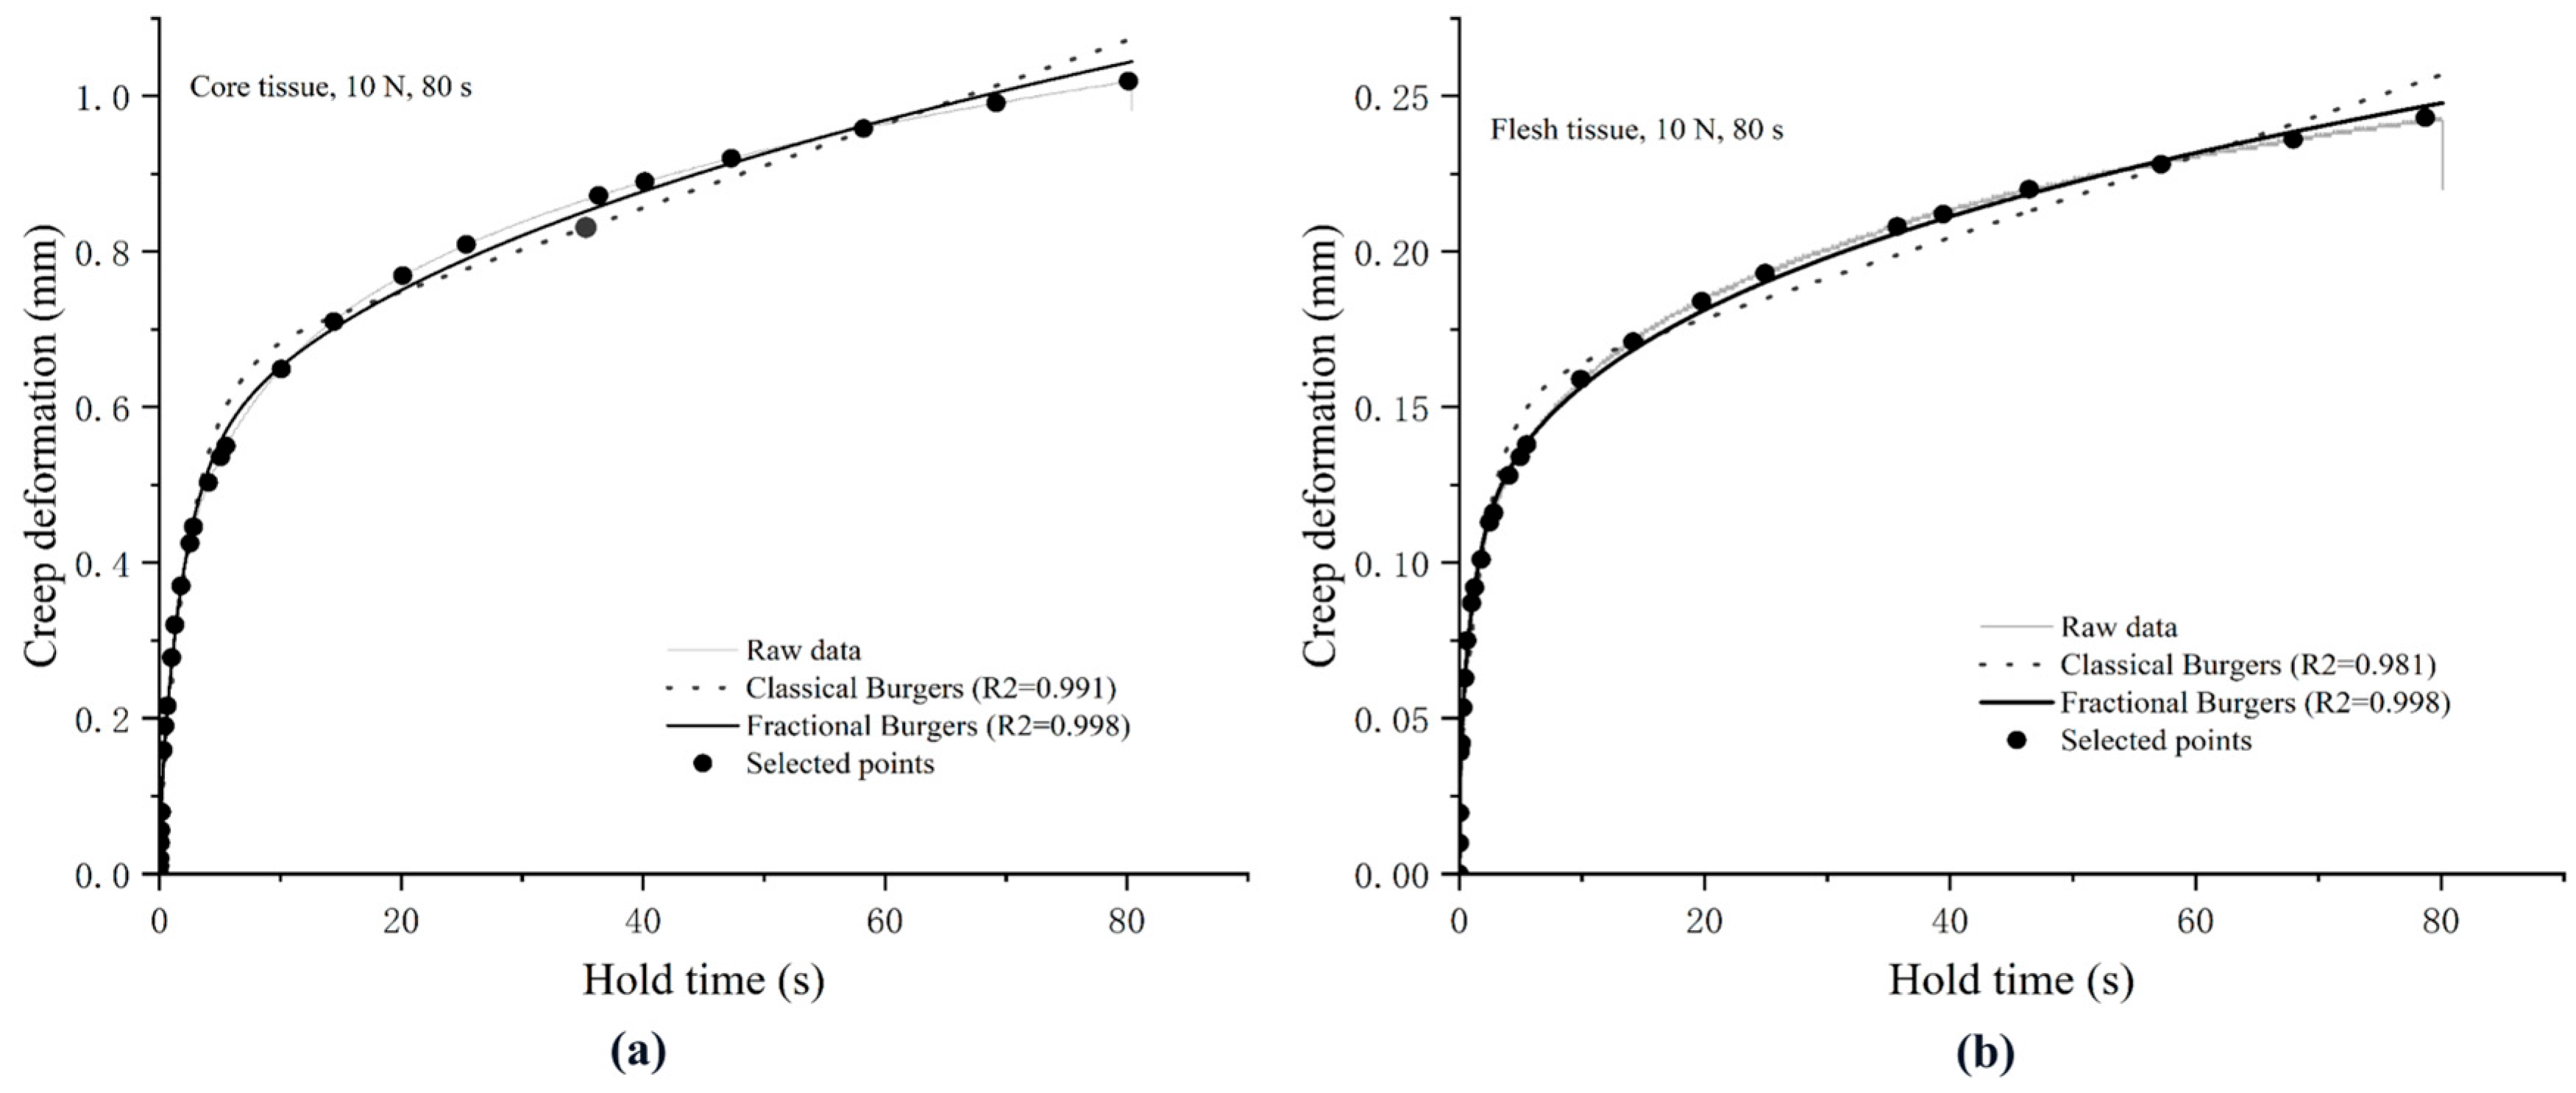
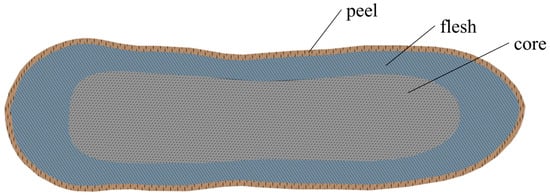
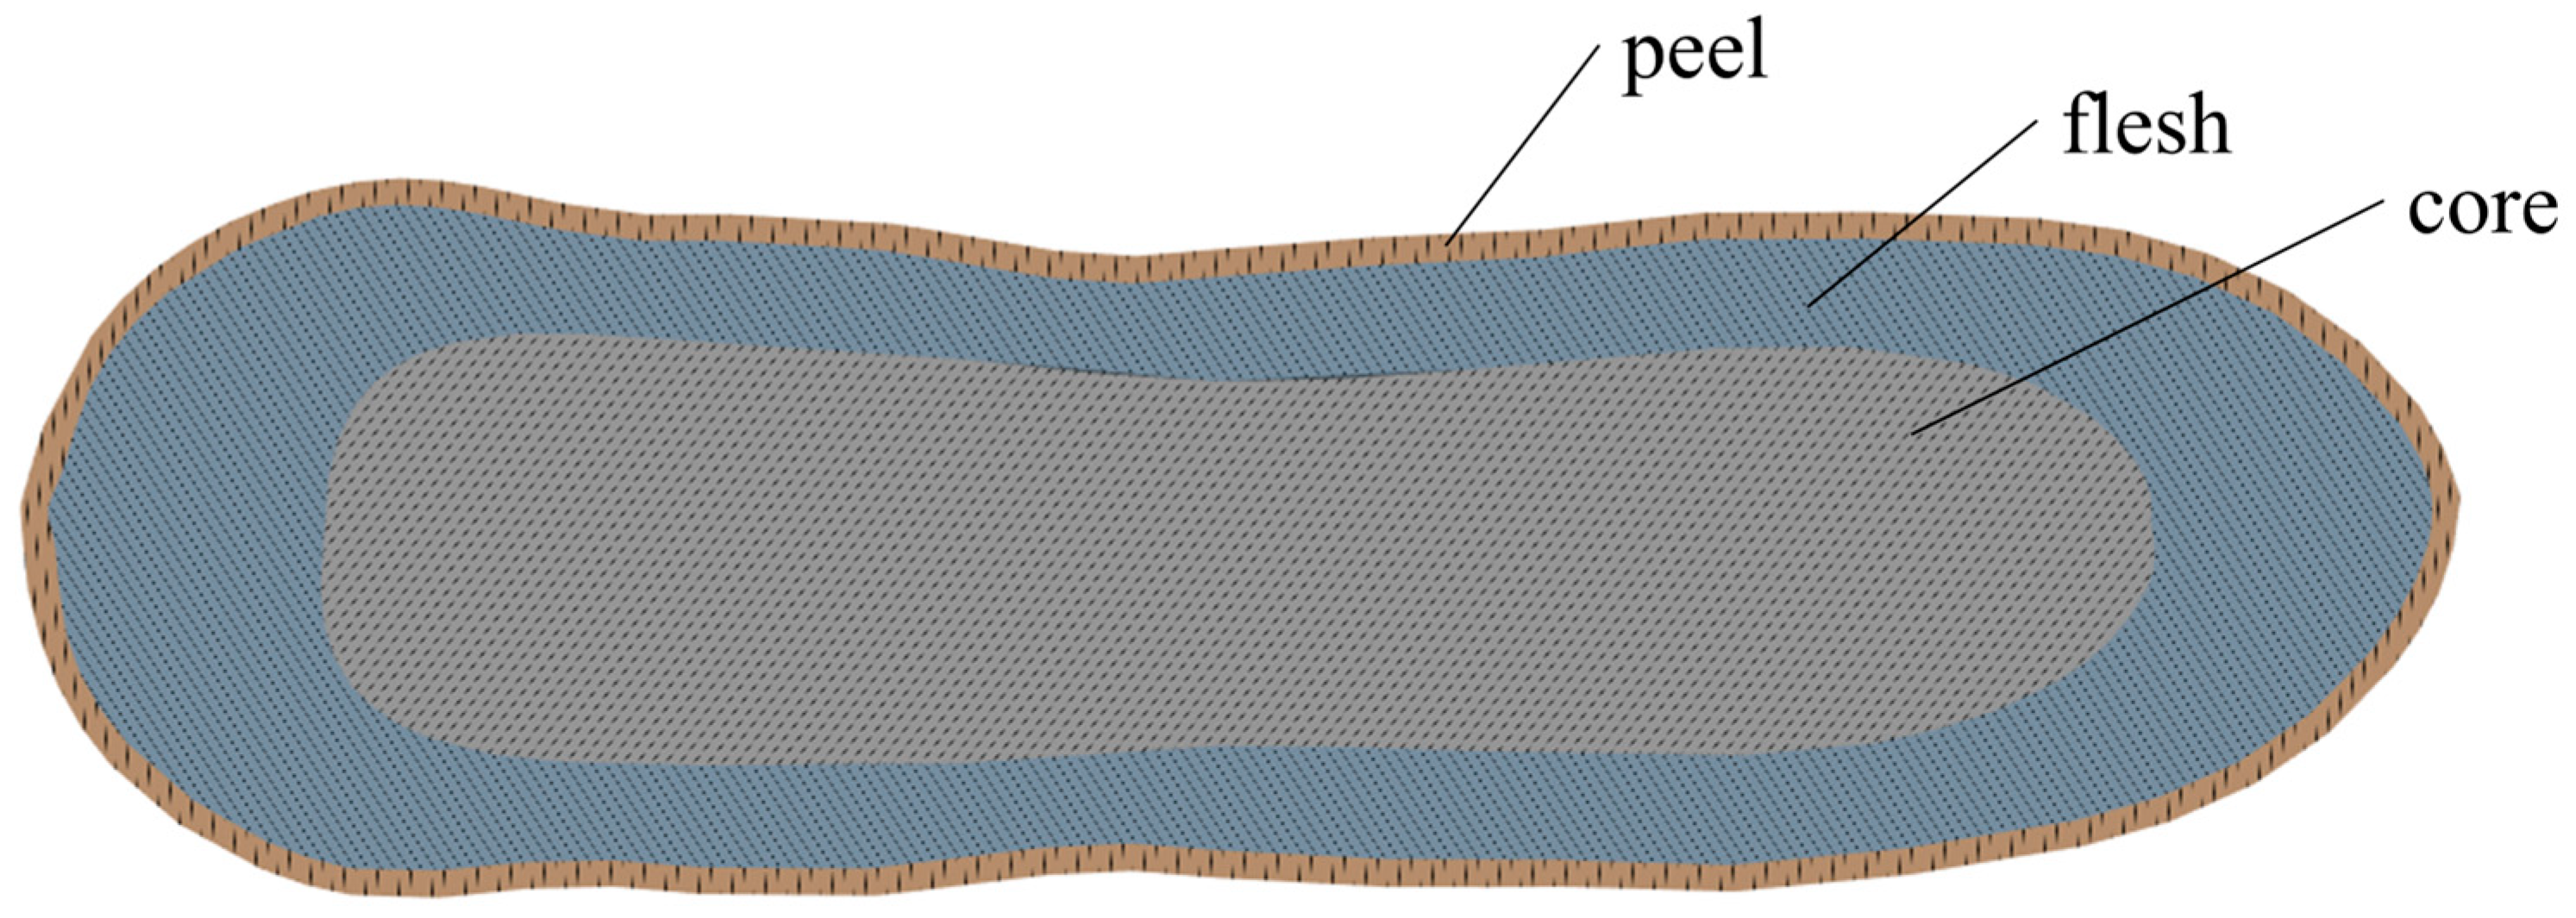
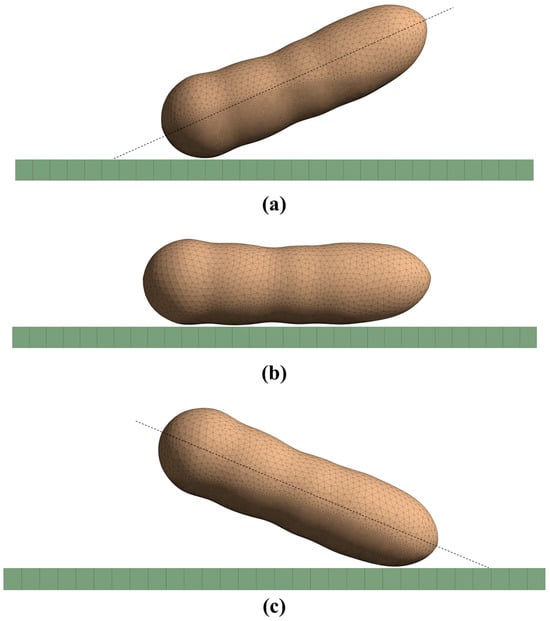
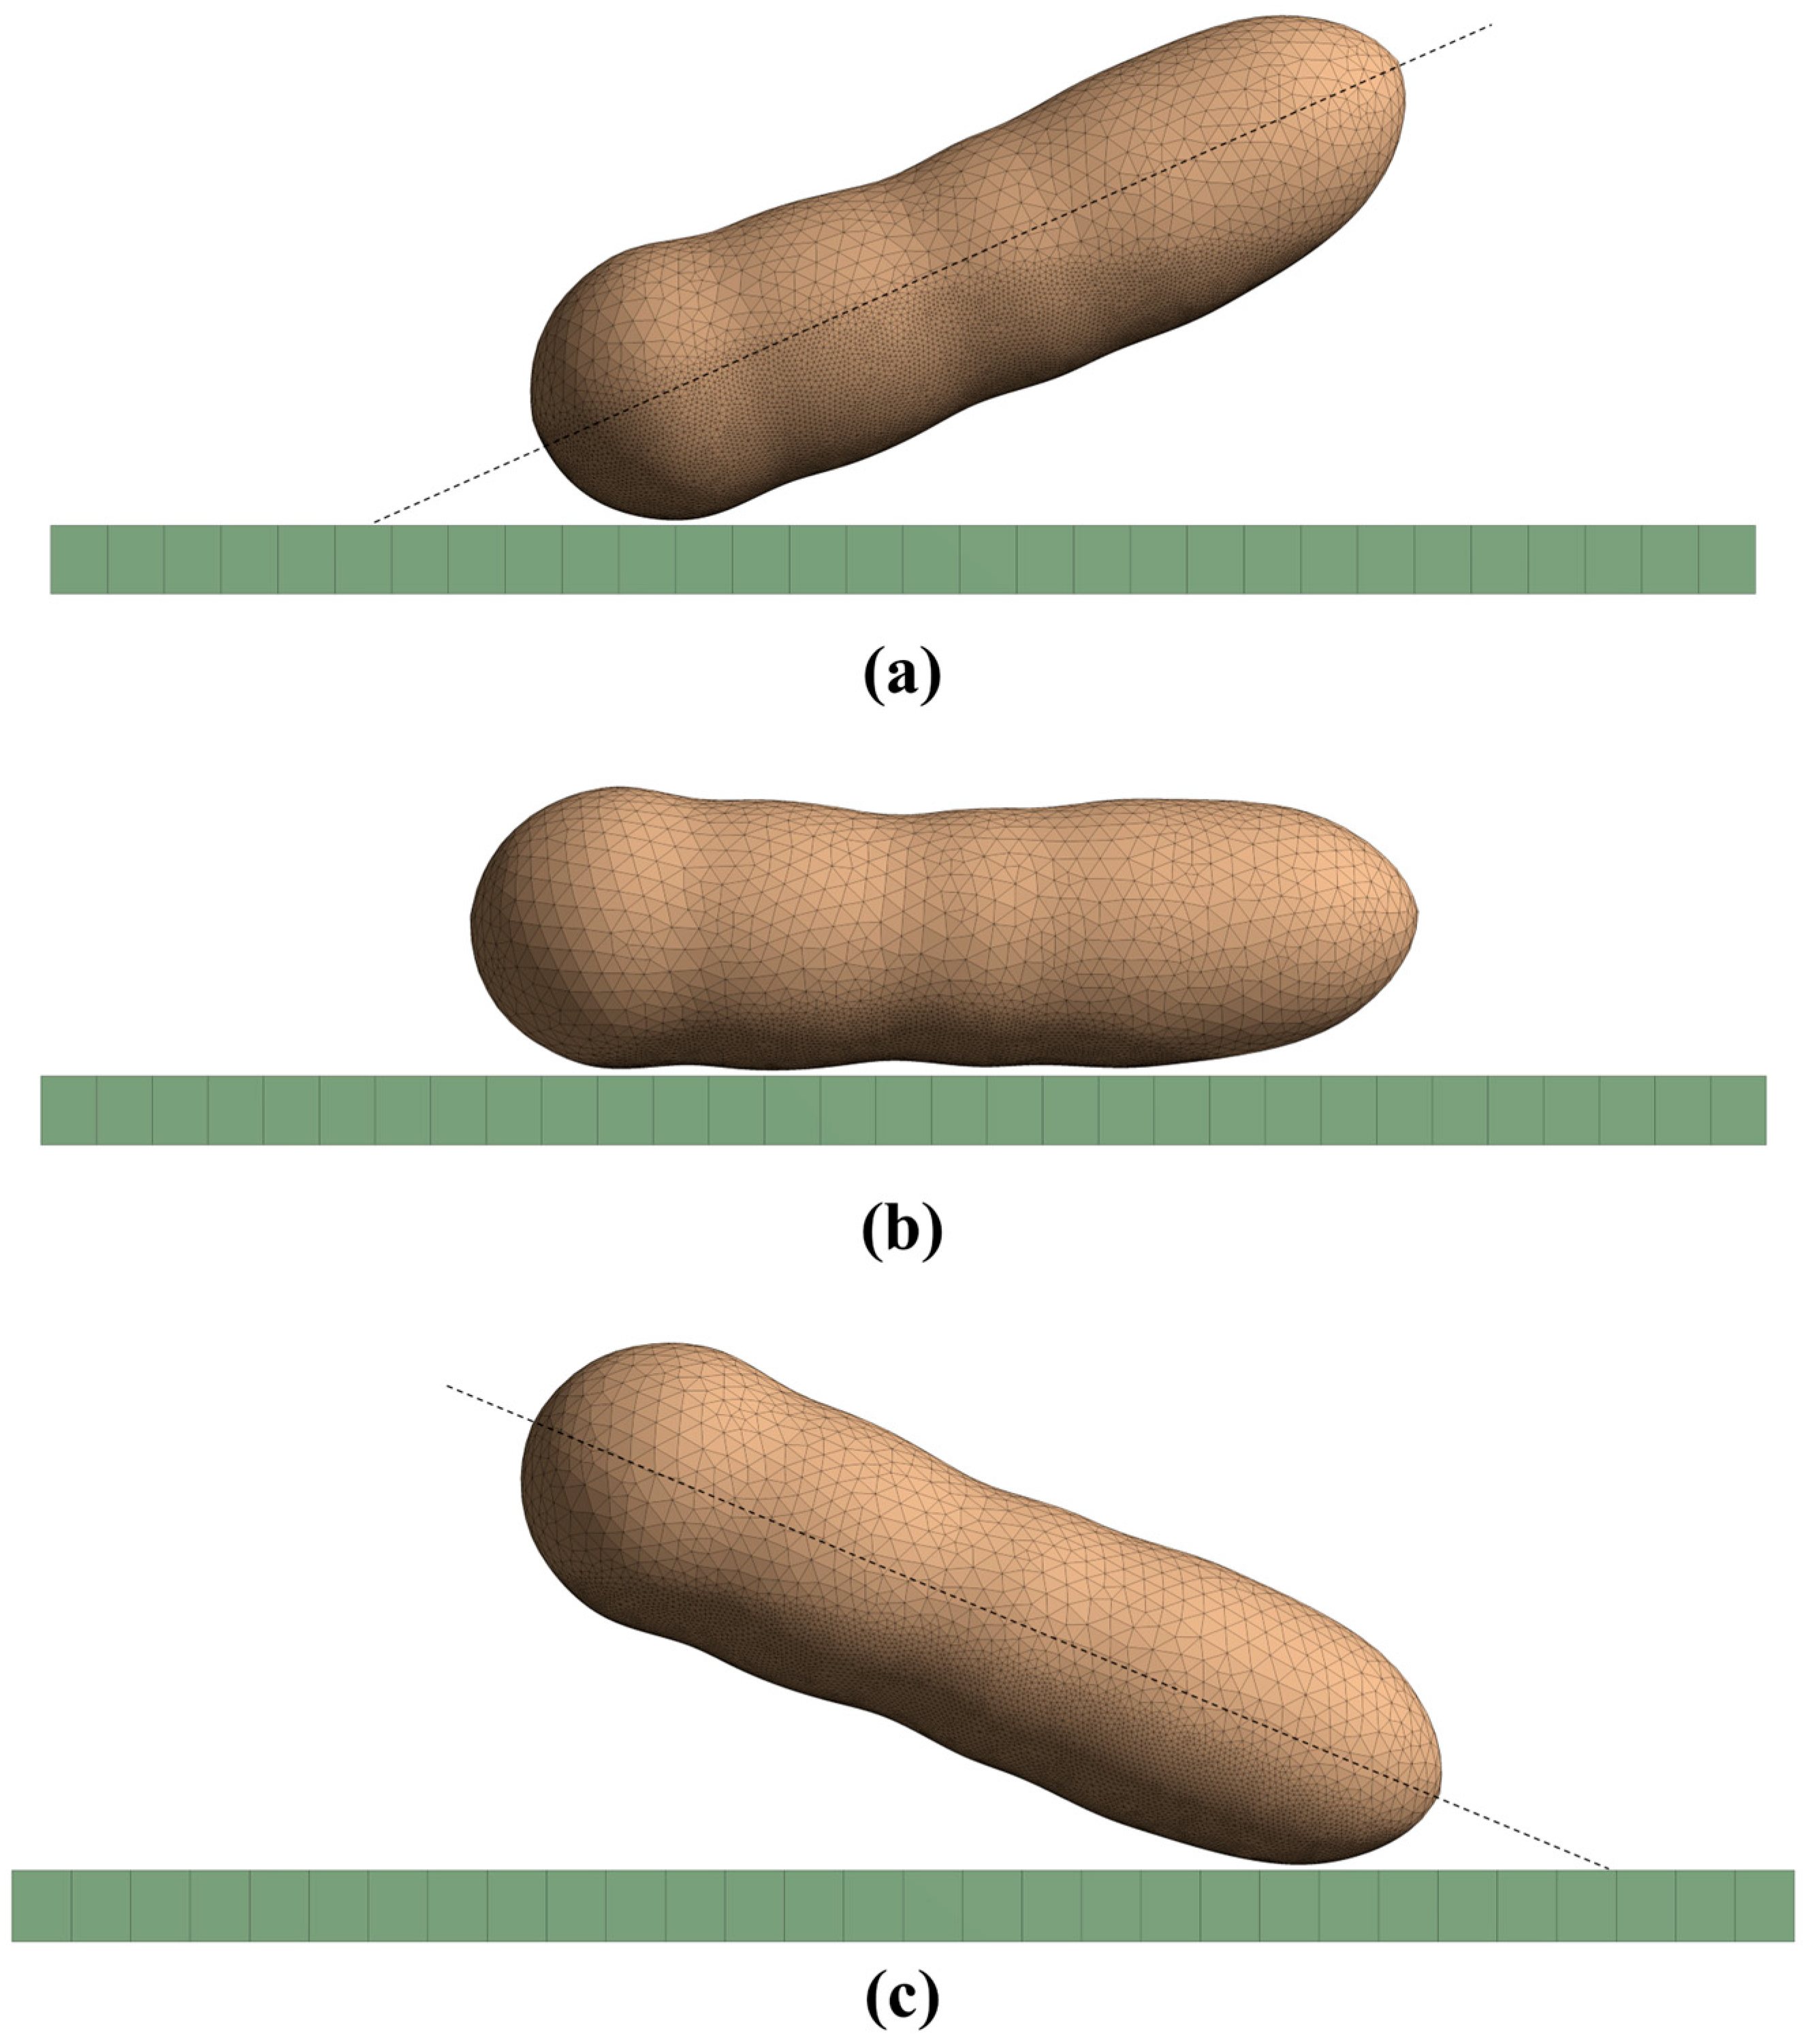
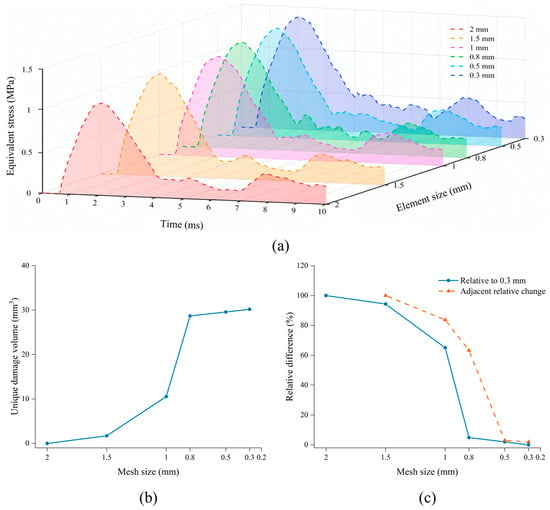
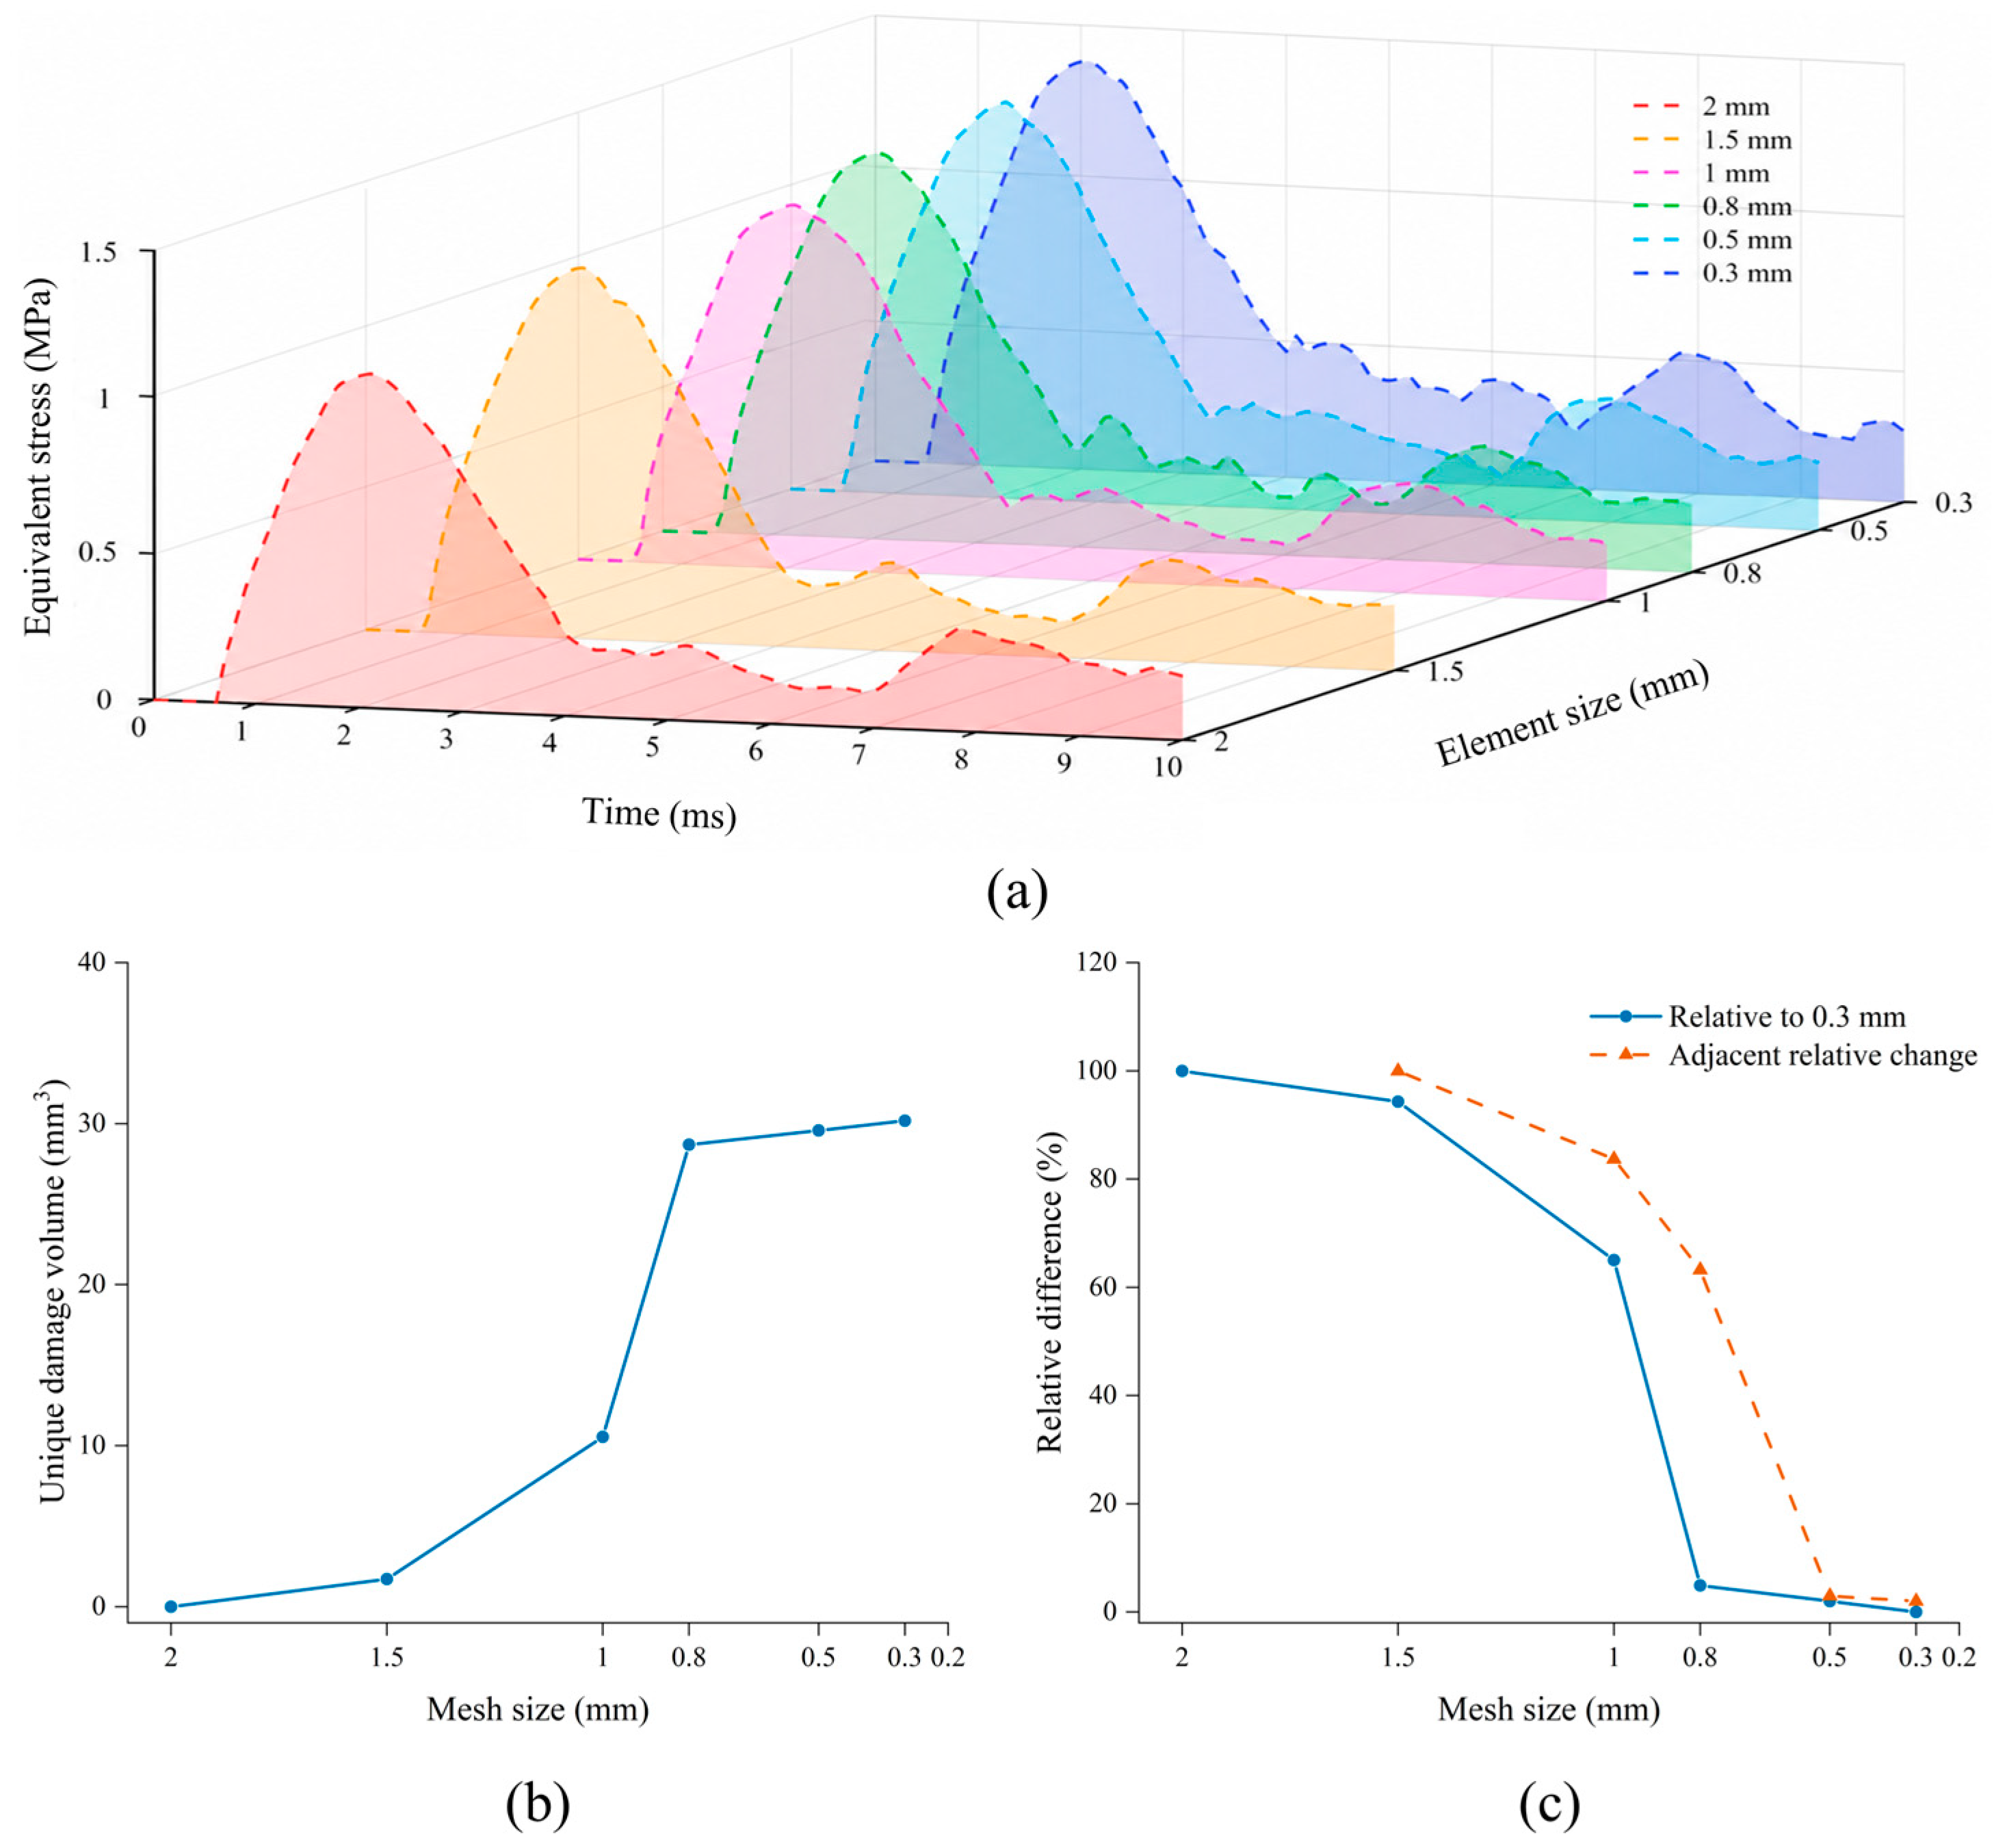
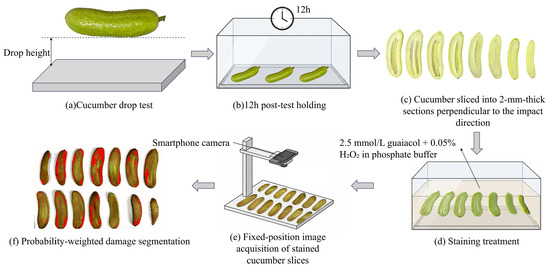
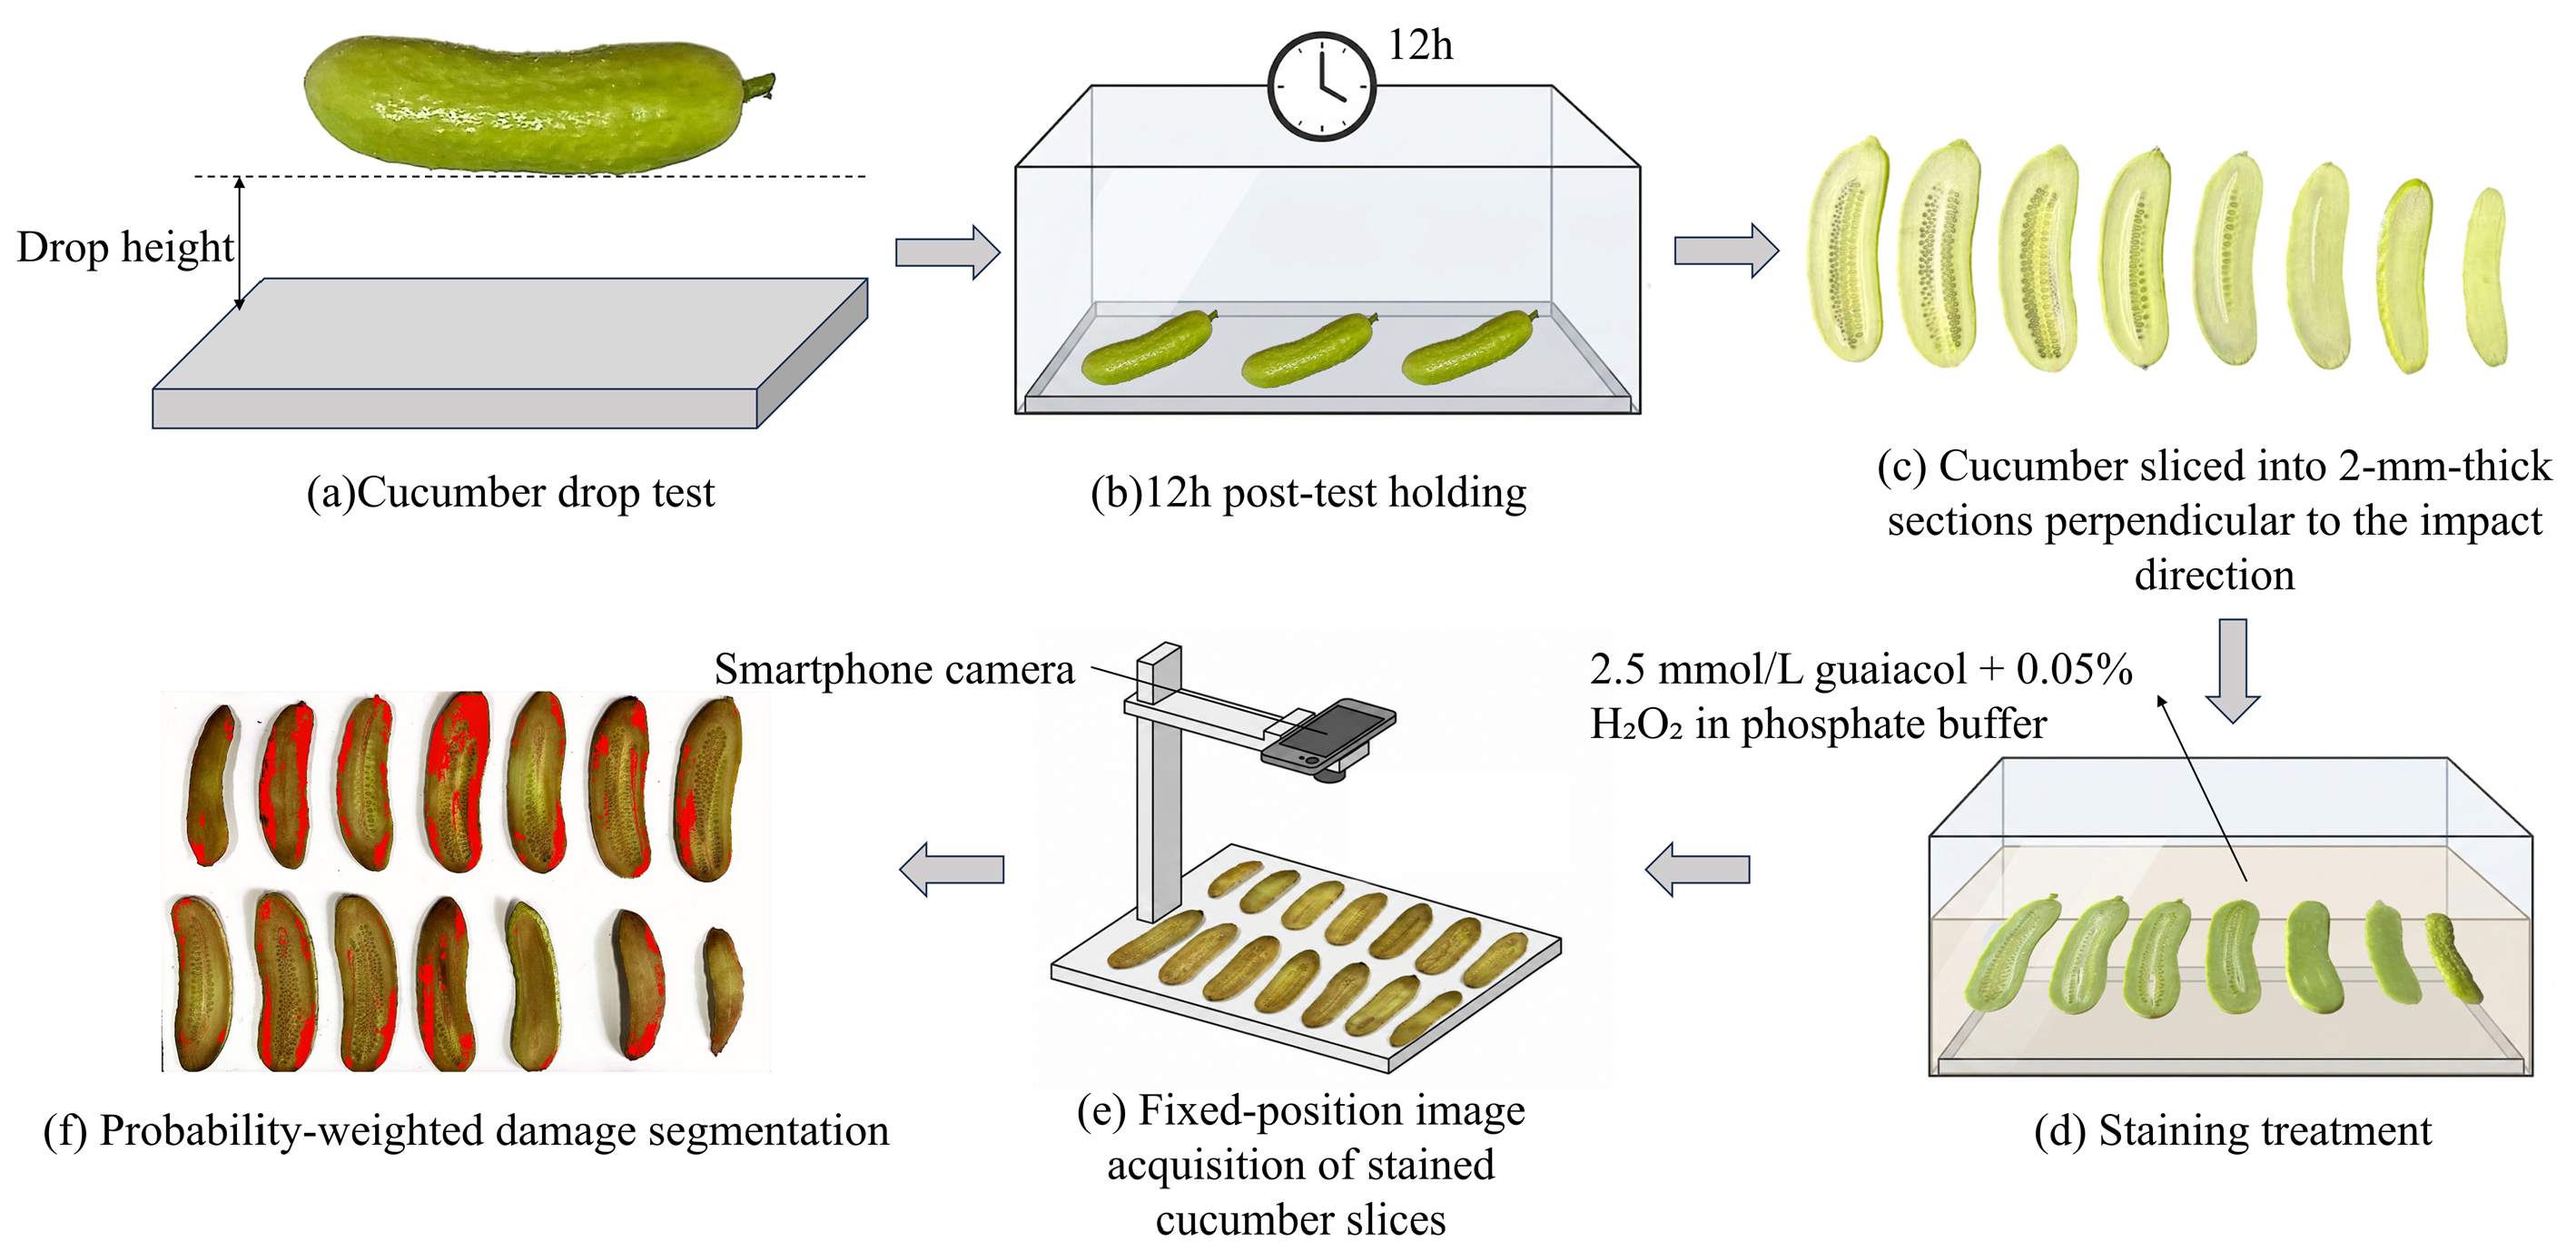
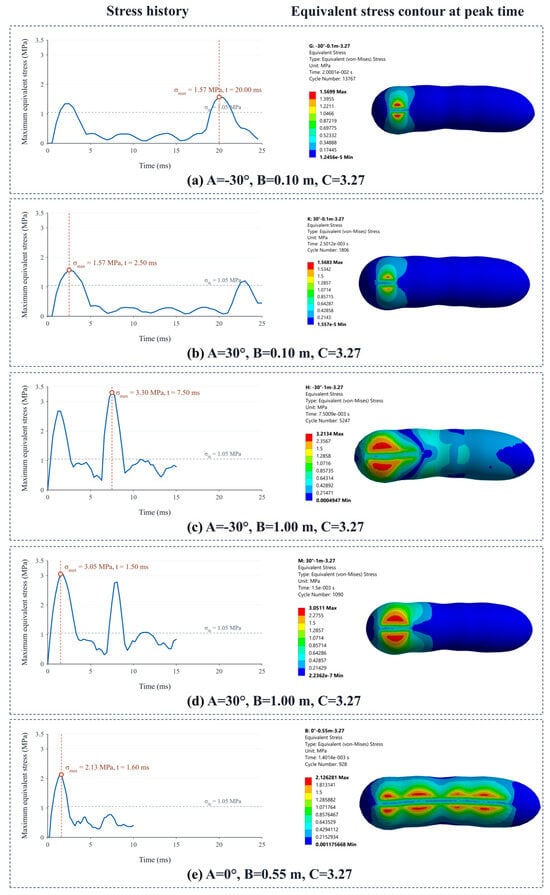
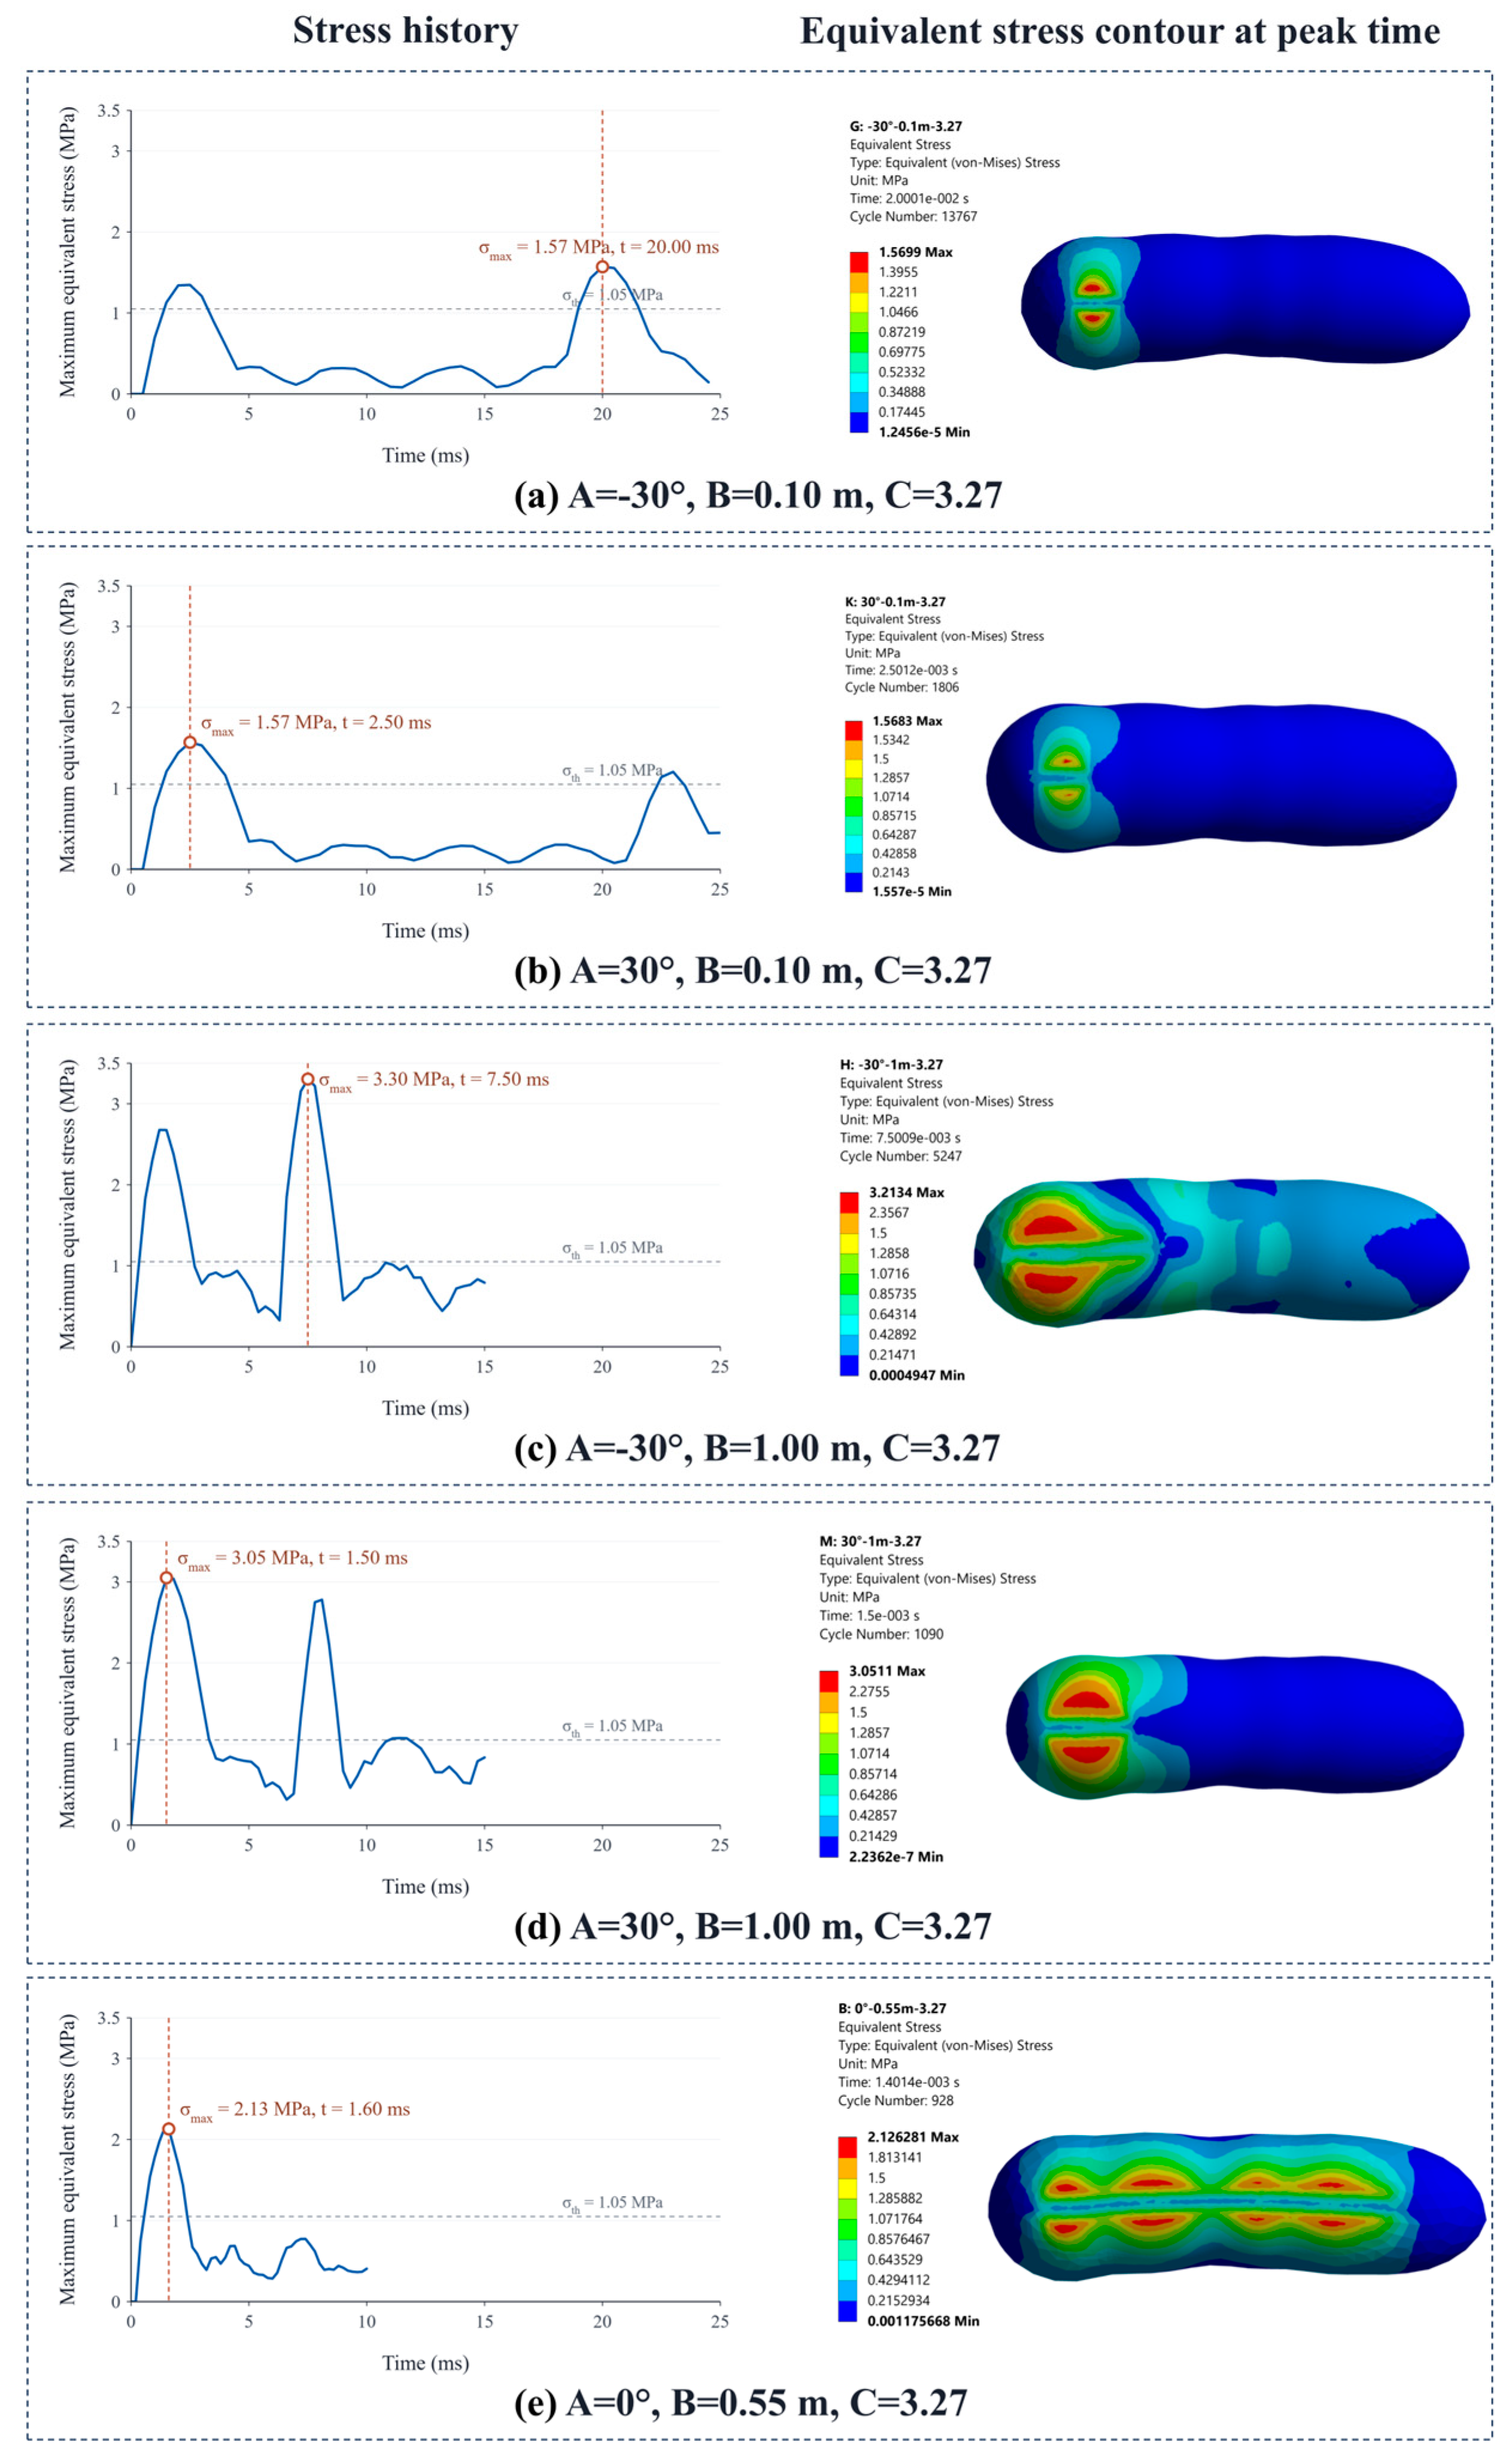
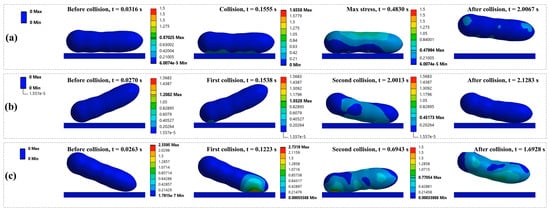
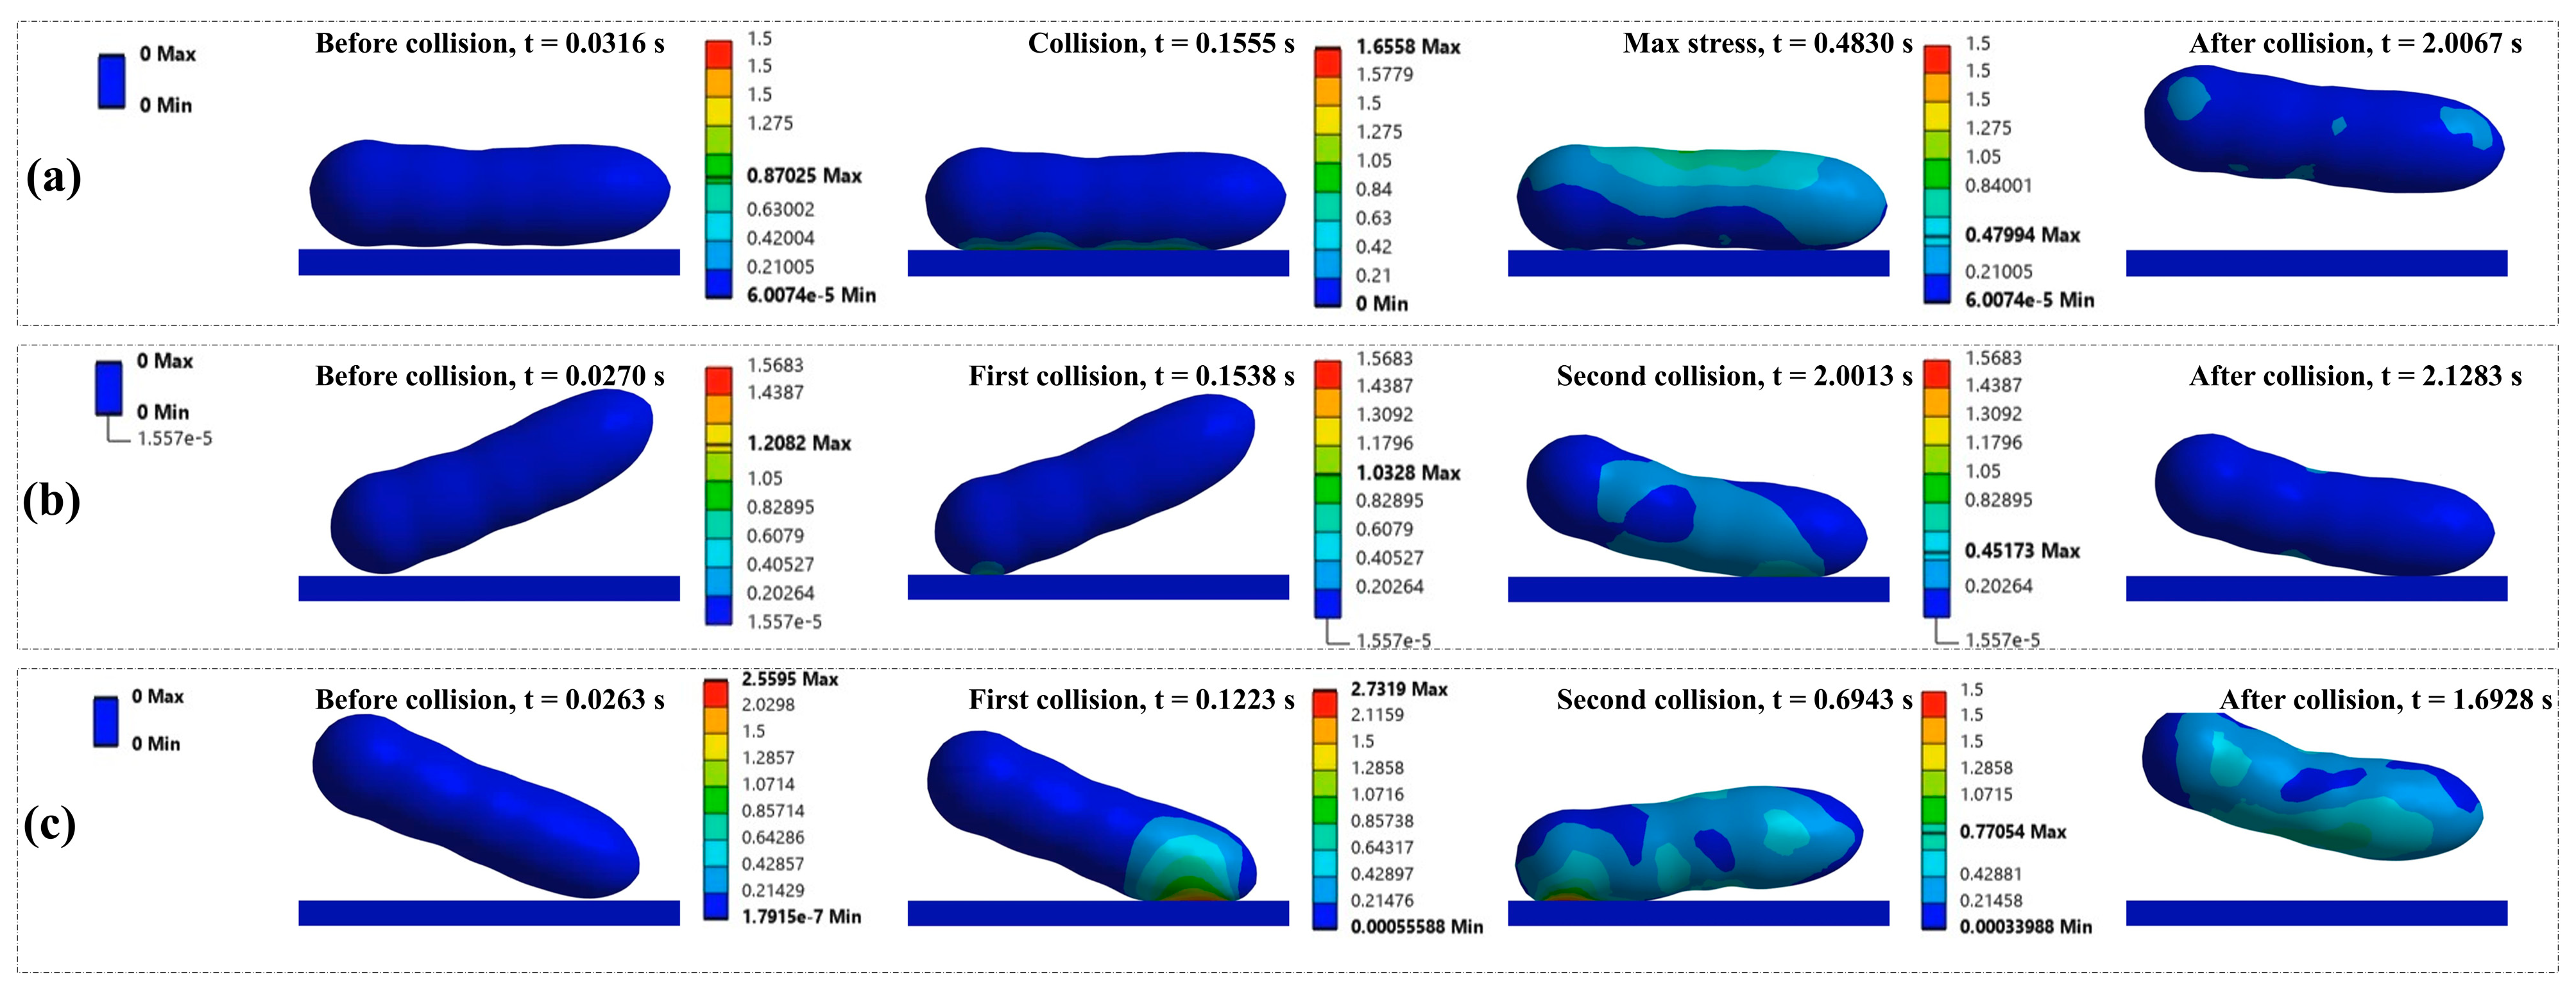
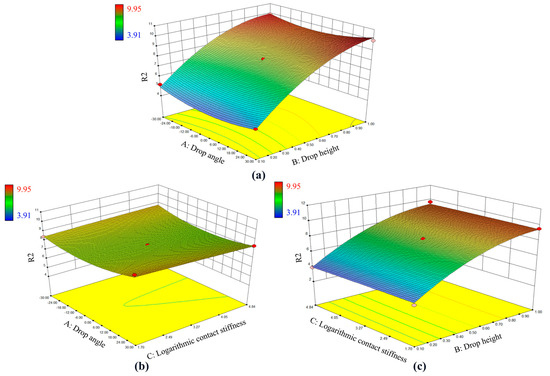
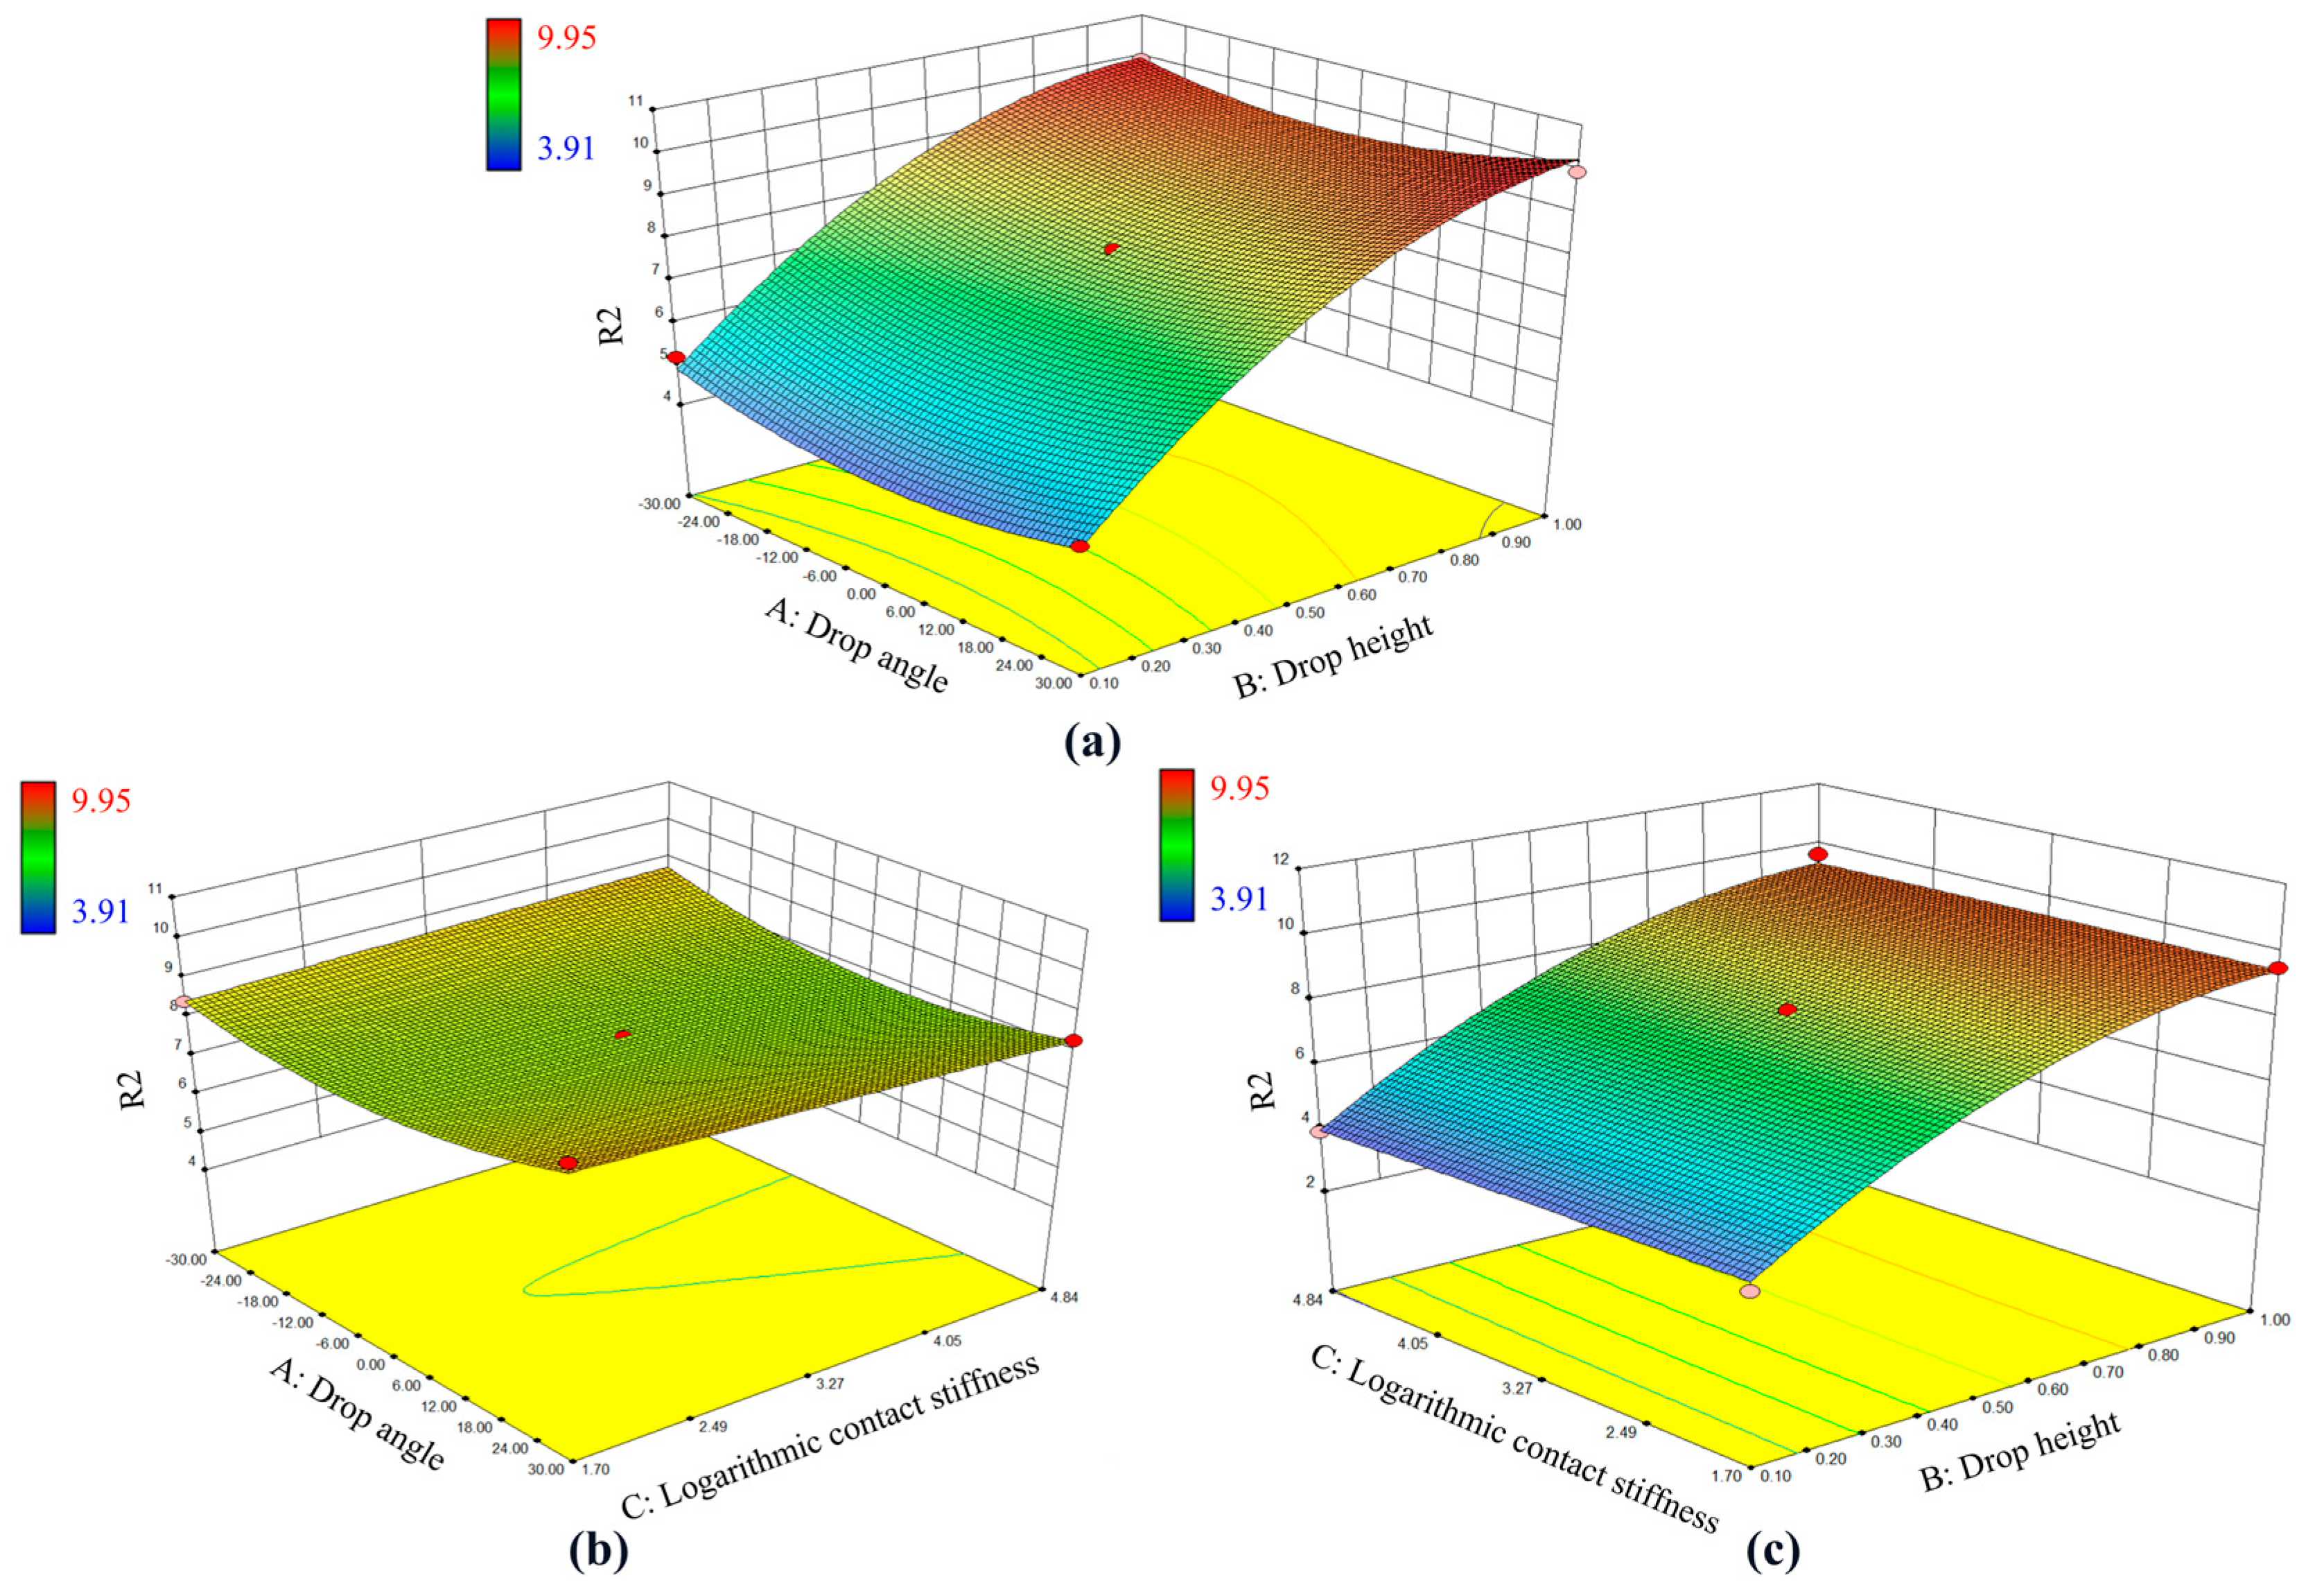
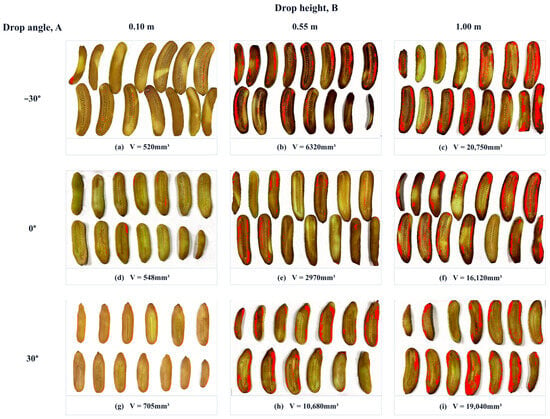
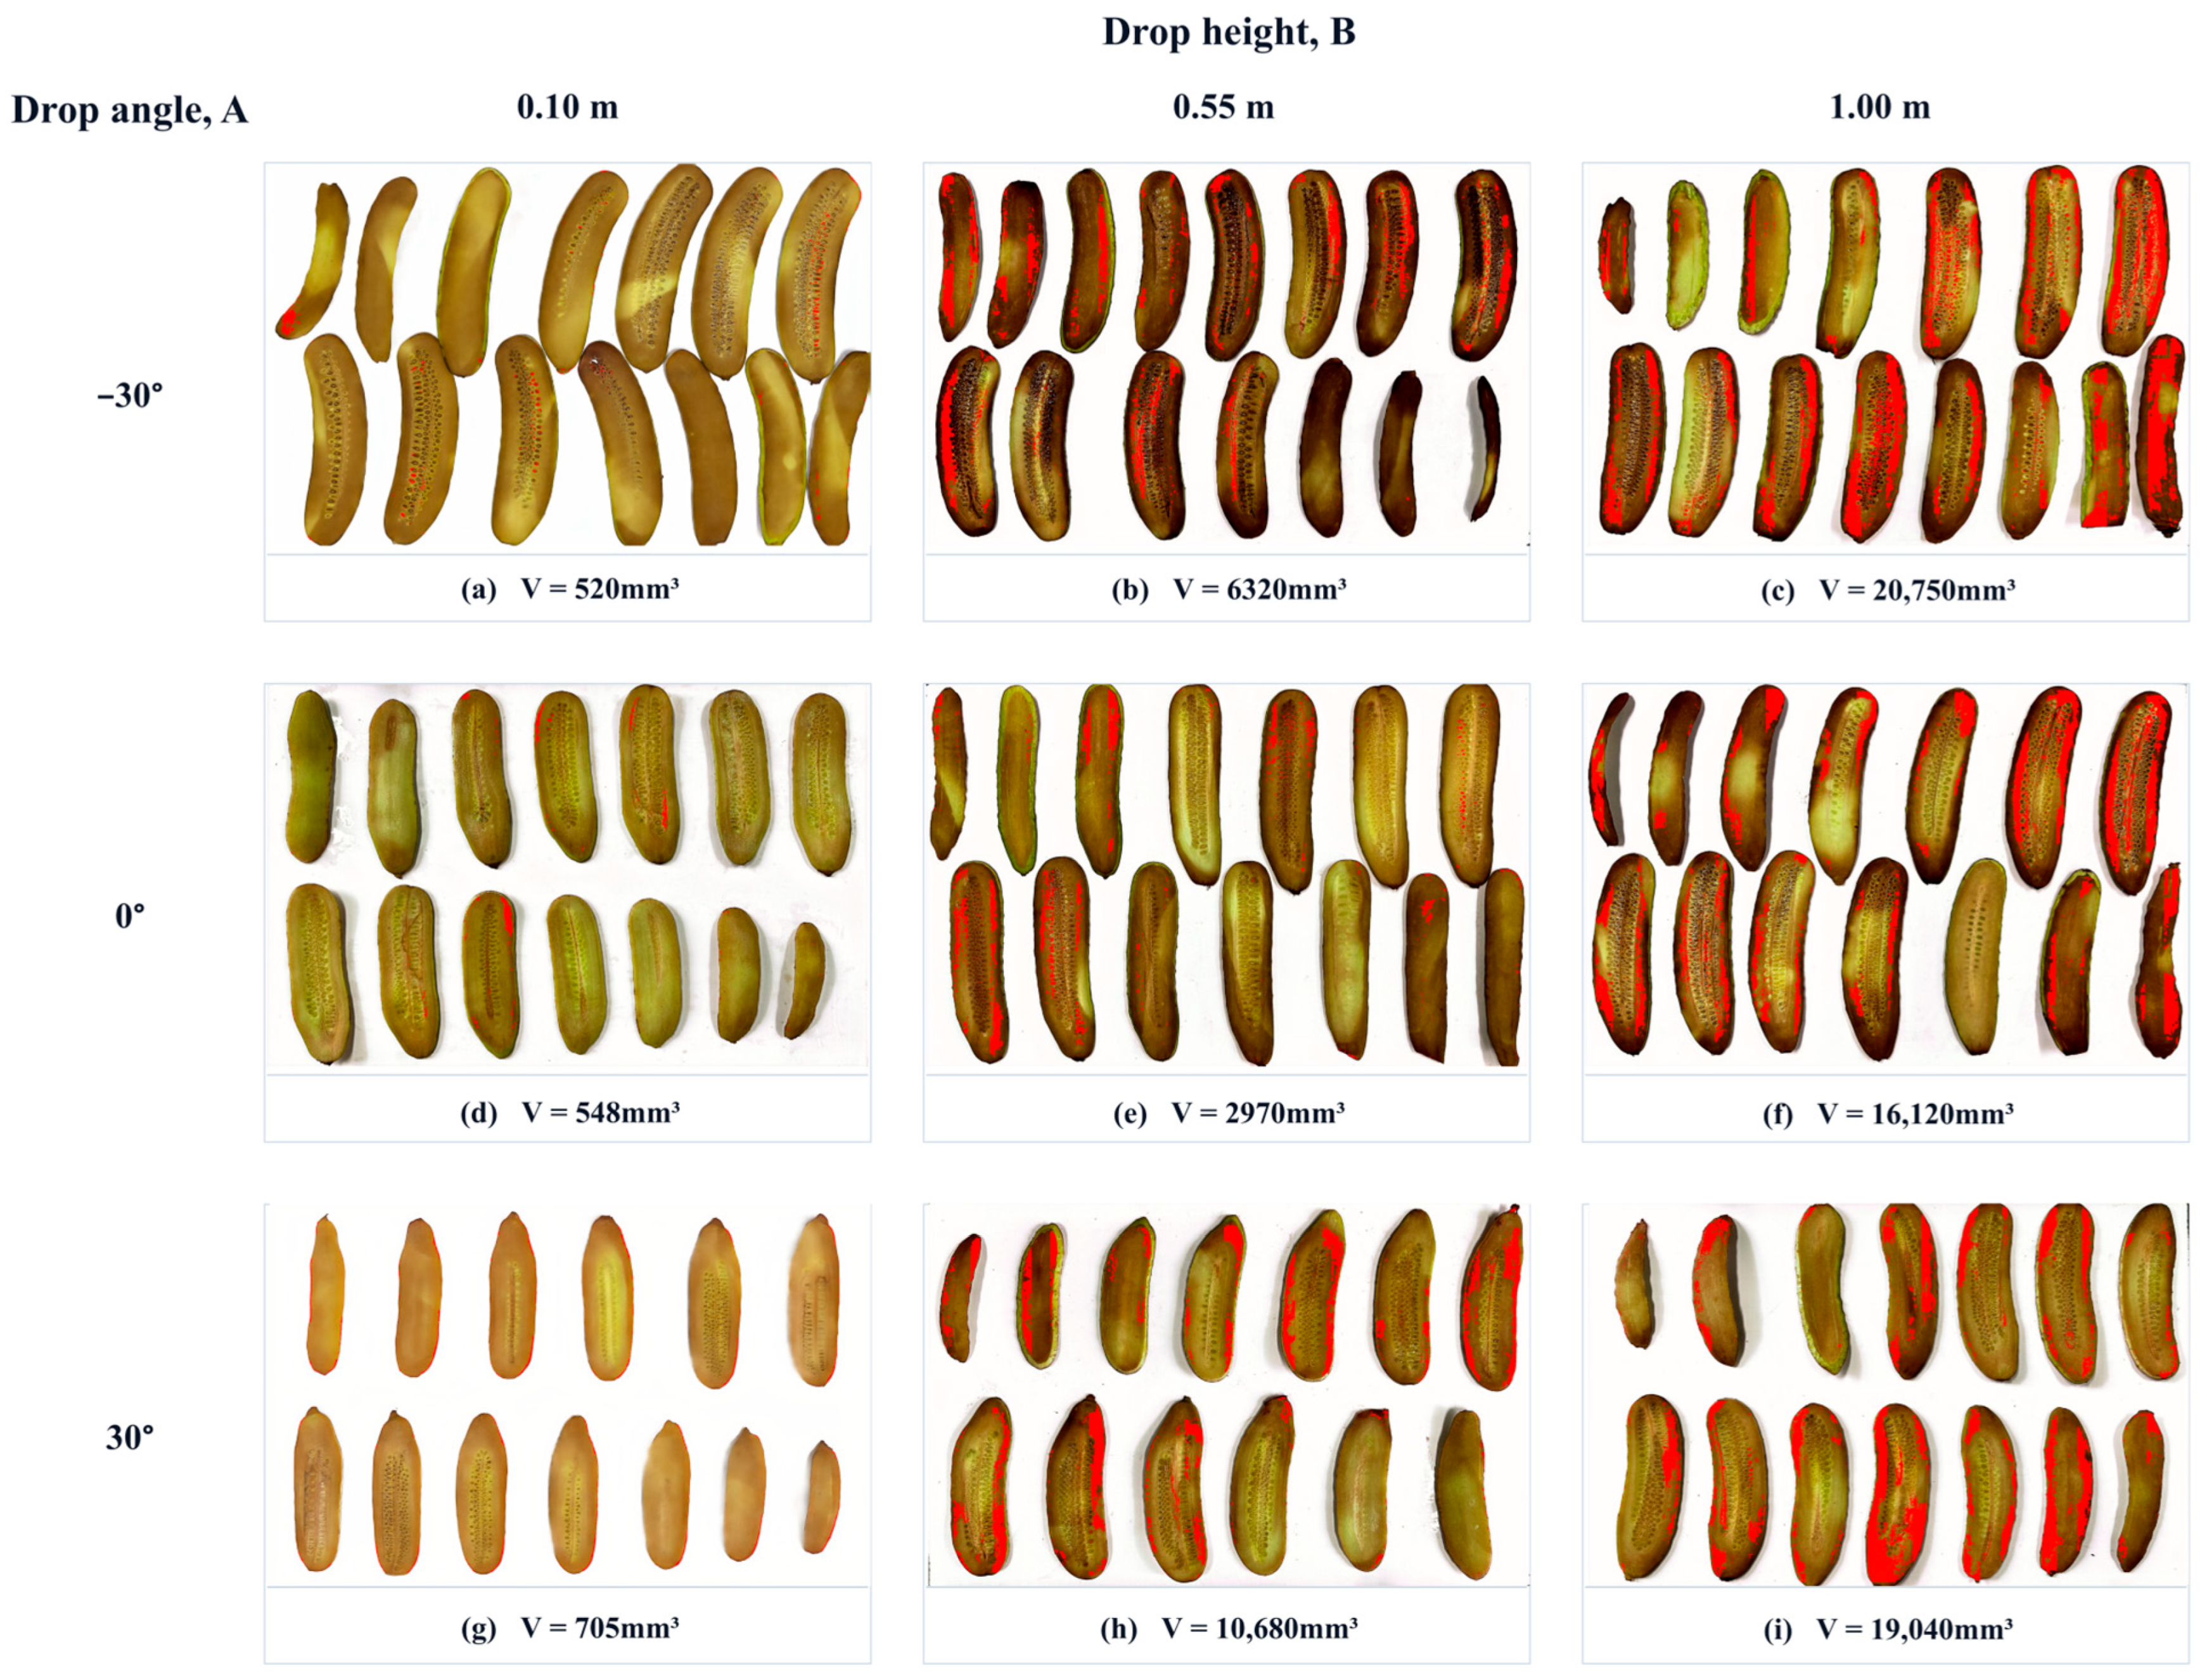

Disclaimer/Publisher’s Note: The statements, opinions and data contained in all publications are solely those of the individual author(s) and contributor(s) and not of MDPI and/or the editor(s). MDPI and/or the editor(s) disclaim responsibility for any injury to people or property resulting from any ideas, methods, instructions or products referred to in the content. |
© 2026 by the authors. Licensee MDPI, Basel, Switzerland. This article is an open access article distributed under the terms and conditions of the Creative Commons Attribution (CC BY) license.