


Abstract
To address single-row feeding and embryo-orientation requirements in rice-seed preprocessing, a two-stage cooperative vibratory conveying and orientation device was developed for one tested batch of the long-grain hybrid indica cultivar ‘Y Liangyou 900’. The circular module fluidizes bulk seeds and forms a single-row stream, and the linear module uses stepped V-shaped grooves for passive posture correction. For 50 individually identified seeds, repeated camera measurements gave a longitudinal embryo-end center-of-mass offset of 0.285 ± 0.040 mm (mean ± sample SD; range 0.215–0.344 mm; CV 14.1%). Five tipping trials per seed at 200 V, 100 Hz, a 6 mm step, and a 9° chute showed a positive but overlapping relationship between Δd and tipping probability; threshold screening placed the effective stabilizing moment Msave,eff on the order of 10−7 N·m. At 100 Hz, PCB M352C68 accelerometer measurements with five 10 s repeats per voltage gave amplitude equivalents of 0.100, 0.137, and 0.176 mm at 160, 180, and 200 V, corresponding to peak accelerations of 4.03, 5.52, and 7.09 g. Five paired physical-simulation calibration tests gave mean absolute relative errors of 0.89% for angle of repose and 0.43% for bulk density. Across 11 conveying conditions, DEM and bench throughputs ranged from 180–208 and 176–204 grains/min, respectively, with a mean absolute percentage error of 1.98%. Orthogonal testing selected a 6 mm step height, 9° chute inclination, 200 V linear-vibrator setpoint, and 100 Hz vibration frequency; ten independent 200-seed verification runs (2000 seeds total) gave mean forward-retention and reverse-correction rates of 92.4% and 88.1%. The archived verification records preserve aggregate means but not the complete run-level values required for dispersion estimates. Integrated optimization selected a conveyor-belt speed of 31.5 mm/s, a 200 V setpoint, and a 5.30 mm transfer drop height; validation means were 91.2% orientation success and 14.5% seed-flow-uniformity CV. In an unreplicated condition-level robustness screen, lower performance values were descriptively observed at high moisture and under dusty or broken-glume conditions. Because each condition was evaluated only once, these observations do not constitute statistical evidence of robustness or factor effects. The findings therefore remain specific to the tested cultivar, conditions, and short-run protocol.
1. Introduction
Rice is one of the most important staple crops worldwide, and the continuous improvement of rice cultivars is essential for food security and sustainable agricultural production [1]. In modern crop improvement, molecular breeding and marker-assisted selection (MAS) have been widely used to improve the efficiency and precision of genotype selection [2,3]. Among different pre-germination genotyping strategies, half-seed sampling allows DNA to be extracted from seed tissue before sowing, thereby enabling early genotype screening while retaining the possibility of subsequent seed germination [4].
For rice breeding, endosperm-based or half-seed DNA extraction methods have been reported as effective approaches for obtaining DNA from rice seeds before planting [5,6]. In such methods, maintaining embryo viability is essential because the selected genotype must still be germinated and grown for subsequent breeding evaluation [7]. Therefore, a prerequisite for automated half-seed sampling is that the embryo ends of rice seeds must be aligned in the same direction before cutting. Only under this condition can the cutting blade remove endosperm tissue while avoiding embryo damage. However, rice seeds are elongated, non-spherical biological particles with glumes and surface trichomes. These morphological characteristics make them prone to interlocking, nesting, and clogging during conveying. As a result, stable single-row conveying and consistent embryo orientation remain key technical challenges in automated rice breeding pre-processing equipment.
To solve the posture regulation problem of non-spherical agricultural particles, existing approaches can be broadly divided into active vision-based systems, mechanical or pneumatic orientation devices, and vibratory passive manipulation systems. Active vision-based systems identify seed posture using cameras and then correct orientation through robotic, pneumatic, or mechanical actuators. Computer vision has been widely used for automated inspection and quality evaluation of agricultural and food products [8], and artificial intelligence-based vision methods have also been increasingly applied to grain crop analysis and precision agriculture [9,10]. However, vision-based orientation systems usually require high-resolution imaging, real-time image processing, precise actuator coordination, and stable lighting conditions. For continuous rice seed conveying, seed overlap, dust, glume reflection, and posture variation can reduce recognition reliability and increase system cost and complexity. Therefore, active vision-based solutions are not always suitable for low-cost, continuous, and high-throughput seed pre-processing.
Mechanical and pneumatic orientation devices use geometric tracks, traps, baffles, guide rails, or air jets to constrain or modify particle posture. In industrial part conveying, passive traps and geometric orienting structures have been widely studied for vibratory bowl feeders [11], while air-jet-based active tools have also been proposed to reduce jamming and improve part reorientation [12]. Their performance may decrease when handling long-grain rice seeds because shape, size, density, friction, and rupture behavior affect handling and processing [13,14], and grain-surface friction directly influences flow and blockage [15]. The embryo-end mass asymmetry provides a plausible basis for posture-dependent passive tipping. In the tested batch, was measured for 50 individually identified seeds by repeated knife-edge balancing and image-based longitudinal localization. A five-trial-per-seed paired test at the selected orientation condition showed that tipping probability generally increased with , although the three offset ranges overlapped substantially. Threshold screening further placed on the order of N·m. These measurements strengthen the physical interpretation.
Vibratory conveying provides another promising approach for handling irregular agricultural particles. Vibratory feeders can loosen bulk materials, reduce local self-locking, and guide particles into ordered streams without direct mechanical gripping; DEM-based studies have also been used to analyze the effects of vibration parameters on seed flow in vibratory feeders [16]. The discrete element method (DEM), originally proposed for simulating granular assemblies [17], has become an important tool for analyzing the contact, collision, and flow behavior of agricultural granular materials [18,19]. For rice seeds, DEM models based on 3D scanning and non-spherical particle reconstruction have been used to study accumulation and flow behavior under different material conditions [20]. Recent studies have further shown that multi-sphere modeling and parameter calibration are important for improving the reliability of DEM simulations of long-grain rice [21]. Because DEM predictions are sensitive to particle shape and contact parameters, systematic calibration is necessary before using DEM results for structural design or parameter optimization [22,23].
Within the scope of the reviewed literature, three engineering questions motivate this study. First, passive orientation of elongated rice seeds at stepped boundaries requires quantitative characterization of mass asymmetry and prospective testing of the resulting tipping criterion. Second, the relationship among seed material properties, V-groove geometry, and stable single-row posture constraint remains insufficiently quantified. Third, the cited vision, mechanical/pneumatic, and vibratory studies generally address detection, part feeding, seed metering, or flow regulation rather than a directly comparable continuous rice-seed embryo-orientation process; this leaves an integration need for a two-stage process linking bulk seed fluidization, ordered single-row conveying, and passive embryo reorientation.
To address these problems, this study developed a two-stage cooperative electromagnetic vibratory device for single-row conveying and passive embryo orientation of rice seeds. The specific objectives were to: (1) analyze the kinematic conveying mechanism of rice seeds in a circular vibratory bowl and formulate a proposed dynamic tipping criterion at the stepped boundary; (2) characterize the material and morphological properties of “Y Liangyou 900” rice seeds and construct a non-spherical DEM model based on 3D scanning and multi-sphere filling; (3) design a two-stage device that combines circular vibratory fluidization and linear stepped V-groove passive orientation; and (4) optimize and validate the conveying module, orientation module, and integrated system using DEM simulation, orthogonal tests, high-speed photography, and response surface methodology based on Box–Behnken design [24,25]. The results provide a preliminary upstream preprocessing approach for rice-seed orientation in molecular-breeding workflows. The contribution claimed here is therefore system-oriented: the application and integration of circular vibratory singulation with stepped V-groove passive orientation for one rice cultivar, supported by DEM-assisted parameter selection and bench validation. Vibratory feeding, passive orienting structures, DEM, orthogonal design, and RSM are established methods and are not claimed as methodological innovations.
2. Materials and Methods
2.1. Kinematic Analysis and Passive Orientation Mechanism
The passive embryo orientation process of rice seeds relies on two successive mechanical actions. First, the circular vibratory bowl converts randomly accumulated seeds into a stable single-row stream through helical conveying. Second, the stepped V-groove channel uses the observed posture dependence of the tested seeds to retain many forward-oriented seeds and promote the rotation of many reverse-oriented seeds toward the target posture. Therefore, the kinematic mechanism of helical conveying and the dynamic tipping criterion at the step edge were analyzed before the structural design of the device. In this study, the end intended for removal is defined as the endosperm end. Seeds are classified as forward-oriented when this end points in the conveying direction and reverse-oriented when it points opposite, thereby defining the target posture required for subsequent half-seed cutting.
2.1.1. Mechanical Foundation of Helical Track Conveying
When the initially discrete seeds climb up the outer involute helical track, the tangential transport characteristics along the track and the centrifugal dynamic equations along the inner wall inclination can be respectively expressed as:
The tangential friction force follows Coulomb’s law of friction: . Where and represent the mass of the seed; is the tangential conveying acceleration; is the centrifugal acceleration; and are the component forces of the excitation force along the tangent and normal directions of the helical track; and are the transient collision forces between adjacent particles; and are the sliding friction resistances; is the inclination angle of the inner wall; and is the centrifugal force satisfying ( being the rotation radius). Additionally, the geometric helix angle maps to the bowl diameter and Helical Pitch according to the topological constraint:
By analyzing Equations (1) and (2), it is evident that operating voltage and helical pitch are the primary operational parameters governing mass delivery efficiency. Increasing the operating voltage enlarges the amplitude of the driving force, thereby accelerating the tangential velocity of the particles. Conversely, expanding the Helical Pitch increases the helix angle, which amplifies the opposing gravitational component force. Therefore, an optimal co-dependent operating window exists between these parameters. The helix angle serves as the core structural index reflecting the conveyance capability of the conveying module, as its value directly alters the gravity distribution and sliding boundaries along the track.
2.1.2. Proposed Dynamic Tipping Criterion at Step Structures
To clarify the passive reorientation mechanism, the sliding and tossing motion equations under linear harmonic excitation were constructed. The harmonic displacement , velocity , and acceleration driven by the linear vibrator follow Equation (3):
where is the amplitude (mm) and is the angular frequency (rad/s).
To promote preferential tipping of reverse-oriented seeds while limiting excessive bouncing of forward-oriented seeds, the required external harmonic excitation force must satisfy the dynamic response equilibrium defined by Equation (4):
where is the linear excitation frequency (Hz), is the single-sided vibration amplitude (mm), is the total equivalent mass of the loaded linear-chute assembly, and is a dimensionless frequency-tuning ratio. The interval = 0.85–0.95 is a sub-resonant design assumption, not an experimentally fitted tuning interval. Mechanical excitation at the V-groove was calibrated with a PCB M352C68 miniature accelerometer (PCB Piezotronics, Inc., Depew, NY, USA) mounted on the same rigid member 20 mm from the step edge, with its primary sensitive axis aligned with the excitation direction used in Equations (3)–(5). The sensor mass was 2 g, sensitivity was 100 mV/g, and measurement range was ±50 g. Signals were sampled at 5 kHz for 10 s, with five repeated acquisitions at each 100 Hz voltage condition. Static residual bias was ≤0.05 g, repeat-measurement CV was ≤3%, and expanded uncertainty was U (k = 2) ≤ 6%. Under the sinusoidal-motion assumption, the single-sided amplitude equivalent was related to measured peak acceleration by = . At 160, 180, and 200 V, the reported amplitude equivalents were 0.100, 0.137, and 0.176 mm and the corresponding peak accelerations were 4.03, 5.52, and 7.09 g, respectively. A descriptive fit to the three voltage-level amplitudes gave = 0.00190U − 0.20433 (R2 = 0.9998), where U is the controller setpoint in volts. These results calibrate voltage against local mechanical excitation for the tested assembly; the stated expanded uncertainty should still be considered when applying the relation outside the measured 160–200 V range.
As the seed flows over the step edge, its asymmetric mass distribution may create different stability states. Let denote the longitudinal offset between the geometric center and center of mass toward the embryo end. For each of 50 individually identified seeds (S01–S50), the longitudinal axis was placed horizontally on a miniature knife edge and the seed was adjusted until no clear clockwise or counterclockwise tendency remained. A high-resolution industrial camera located both longitudinal endpoints; their midpoint defined the geometric center, and the projected knife-edge position defined the center of mass. The embryo-directed separation was recorded as . Each seed was removed, repositioned, and independently measured 3–5 times before its mean value was used. Mean seed length was 9.409 ± 0.229 mm. Mean was 0.285 ± 0.040 mm (95% CI 0.274–0.296 mm; range 0.215–0.344 mm; CV 14.1%), and was 3.030 ± 0.428% (range 2.290–3.781%; CV 14.1%). The weak length-offset correlation (Pearson r = 0.101) indicates that external length is not a reliable surrogate for . For a reverse-oriented seed passing over the step edge, the support boundary may move behind the center of mass, coupling gravitational torque with a transient harmonic inertial moment. This conditional tipping boundary is expressed in Equation (5).
When the overturning moment exceeds the stabilizing moment, the model predicts loss of balance about the step edge; forward-oriented seeds may remain supported and pass without posture reversal. Here, denotes the combined stabilizing moment produced by the remaining support reaction, friction, and transient contacts about the edge. Using the mean single-seed mass implied by the 28.6 g thousand-grain weight and the mean gives a nominal gravitational moment scale of approximately N·m. To test the seed-level association, the same 50 identified seeds were evaluated at 200 V, 100 Hz, a 6 mm step height, and a 9° chute inclination, with five tipping trials per seed. Tipping probability generally increased with : seeds in the 0.215–0.255 mm interval more often showed low-to-moderate probabilities, probabilities increased progressively across 0.255–0.305 mm, and seeds in the 0.305–0.344 mm interval more often showed high probabilities. The intervals nevertheless overlapped substantially, demonstrating that is influential but not sufficient by itself. In a separate threshold screen, a subset spanning small, medium, and large was tested while voltage was increased from 160 to 200 V in 5–10 V increments, with 3–5 repetitions per level. At the transition from stable passage to evident tipping, was approximated as (denotes the effective stabilizing moment back-calculated from the experimentally observed critical tipping condition), and seed mass, , measured critical acceleration, and the geometric projection in Equation (5) were used to back-calculate . The resulting effective stabilizing moments were on the order of N·m, comparable in scale to . Because the experimental record specifies the screened subset only as 15–20 seeds and does not provide seed-level moment estimates or exact tipping counts, no mean, range, confidence interval, regression coefficient, or predictive threshold is claimed. Equation (5) is therefore supported as a quantitative order-of-magnitude mechanism but not as a validated deterministic classifier. Force analysis of rice seeds at the step edge is shown in Figure 1.
Figure 1.
Force analysis of rice seeds at the step edge. (a) Forward-oriented seed: (i) approach to the step edge under combined excitation and contact forces; (ii) transient rotation while the center of mass remains within the supported region; (iii) re-contact with the downstream surface; (iv) stable passage without posture reversal. (b) Reverse-oriented seed: (i) approach to the step edge; (ii) reduction of support as the center of mass advances beyond the step edge; (iii) loss of equilibrium and onset of corrective rotation; (iv) re-contact during the overturning process; (v) completion of the corrective flip toward the forward-oriented posture.
The above kinematic and tipping criteria define the mechanical basis of helical conveying and stepped passive orientation. To further quantify these mechanisms through DEM simulation and bench experiments, the experimental material used in this study is introduced as follows.
2.2. Experimental Material
The physical and morphological characterization of the rice seeds was conducted in October 2025. Hybrid long-grain indica rice seeds (Oryza sativa L., cultivar ‘Y Liangyou 900’) from one tested batch were used. The tested batch had an average moisture content of approximately 11%, a thousand-grain weight of 28.6 g, and mean dimensions of 9.42 mm × 2.32 mm × 2.50 mm.
A center-of-mass characterization experiment was conducted on 50 individually identified seeds (S01–S50) using a miniature knife-edge balance and a high-resolution industrial camera. Each seed was placed with its longitudinal axis horizontal and adjusted until no clear rotational tendency remained. The projected knife-edge location defined the actual center of mass, while the midpoint between the image-determined endpoints defined the geometric center; their embryo-directed longitudinal separation was . Each seed was removed, repositioned, and measured independently 3–5 times. Per-seed mean values were summarized using the batch mean, sample SD, range, CV, and a two-sided 95% Student’s t confidence interval.
A paired -tipping experiment used the same 50 identified seeds at a fixed 6 mm step height, 9° chute inclination, 100 Hz frequency, and 200 V linear-vibrator setpoint. Each seed was tested five times, giving 250 seed-level tipping trials. Individual tipping probability was defined as the proportion of the five trials in which the seed completed the reverse-to-forward flip.
For order-of-magnitude quantification of the effective stabilizing moment, a screening subset selected to span small, medium, and large was tested at a 6 mm step, 9° chute inclination, and 100 Hz while voltage was increased from 160 to 200 V in 5–10 V increments. Each voltage level was repeated 3–5 times, and acceleration was measured near the step. The critical transition from stable passage to evident tipping was approximated by ≈ , and was back-calculated from seed mass, , critical acceleration, and the geometric projection in Equation (5). The record identifies the screened subset only as 15–20 seeds and reports the result only at the order-of-magnitude level; the analysis is therefore used as mechanistic screening rather than as an inferential parameter estimate.
A descriptive robustness experiment was conducted under 12 combinations of moisture content (9%, 11%, 13%, or 15%), storage state (fresh or six-month-stored), and surface state (clean, dusty, broken glume, or aged clean). One condition-level test was performed for each combination, and throughput, orientation success, five-interval flow CV, blockages per 30 min, and observed seed-damage percentage were measured. Cultivar generalization remains unsupported because every condition used ‘Y Liangyou 900’. Representative morphology of a ‘Y Liangyou 900’ hybrid rice seed is shown in Figure 2.
Figure 2.
Representative morphology of a ‘Y Liangyou 900’ hybrid rice seed.
2.3. DEM Modeling and Simulation Design
Based on the measured elongated, non-spherical geometry of the tested seed batch, a non-spherical DEM representation was constructed to simulate collective conveying behavior in the vibratory bowl. The particle model used a uniform-density multi-sphere representation and did not encode the measured distribution of embryo-end center-of-mass offsets.
2.3.1. Non-Spherical Discrete Element Modeling and Parameter Selection
The DEM modeling, parameter selection, and simulation analyses were carried out in December 2025. One seed was scanned with an EinScan Pro 2X 3D white-light laser scanner (SHINING 3D Tech Co., Ltd., Hangzhou, China) and reconstructed as a 24-sphere particle. Its dimensions were approximately 9.87 × 2.78 × 2.39 mm, compared with batch means of 9.42 × 2.32 × 2.50 mm. Before calibration, ‘Y Liangyou 900’ seeds were conditioned to 11.0 ± 0.5% moisture at 20 ± 2 °C and 50 ± 5% relative humidity and sealed for 24 h to equilibrate. For the angle-of-repose test, a hollow cylinder (50 mm internal diameter, 100 mm height) was placed on a horizontal 300 × 300 mm steel plate and lifted vertically at 10 mm/s. Bulk density was measured by freely filling a standard 1000 mL cylinder without tapping. Both tests were repeated five times. Measured and simulated angles of repose were 31.40 ± 0.29° and 31.20 ± 0.16°, respectively, giving a mean absolute relative error of 0.89%; measured and simulated bulk densities were 738.2 ± 2.9 and 741.4 ± 2.1 kg/m3, giving an error of 0.43%.
Parameter searches were centered on the Table 1 values and covered seed-seed static friction 0.41–0.61, rolling friction 0.02–0.06, and restitution 0.36–0.54; seed-steel static friction 0.45–0.67, rolling friction 0.005–0.015, and restitution 0.42–0.62. Seed density was fixed at 1250 kg/m3, and a parameter set was accepted only when relative errors for both angle of repose and bulk density were no greater than 3%. Gravity was 9.81 m/s2; the steel bowl and track were rigid walls; particles were generated once at the bowl bottom in random, non-overlapping positions with zero initial linear and angular velocity; and the outlet was open. Air drag, adhesion, particle breakage, and dynamic moisture changes were neglected. The response-surface domain remained 180–260 V, 3–11° bowl-bottom inclination, 9–25° inner-wall inclination, and 14–42 mm helical pitch.
Table 1.
Physical, mechanical, and interaction contact parameters of rice seeds and steel plates for DEM simulations.
As shown in Figure 3, the reconstructed model represented one scanned seed with dimensions of approximately 9.87 mm × 2.78 mm × 2.39 mm. These dimensions differ from the batch mean (9.42 mm × 2.32 mm × 2.50 mm) because the model was based on one scan rather than a scaled mean geometry. The one-geometry representation and uniform density omit the measured distribution and remain sources of uncertainty in contact orientation and throughput. Compared with a sphere, the 24-sphere representation retains more of the scanned seed’s elongated geometry and orientation-dependent contact behavior, but it should not be interpreted as representing the full dimensional or mass-distribution variability of the batch.
Figure 3.
3D scanning and DEM particle model reconstruction of rice seeds. (a) Actual scene of 3D laser scanning. (b) Reconstructed rice seed model based on multi-sphere filling method.
2.3.2. Response Surface Design for DEM-Based Conveying Module Simulation
After the non-spherical DEM representation and the adopted contact-parameter set were specified, a DEM-based response surface simulation was conducted to evaluate the conveying performance of the circular vibratory module. The simulation was used to quantify factor effects within the modeled design space and to select parameters for subsequent bench verification.
According to the mechanical analysis of seed motion on the bowl bottom and helical track, the conveying process is mainly affected by both operating parameters and structural parameters. Therefore, operating voltage, bowl bottom inclination angle, track inner wall inclination angle, and helical pitch were selected as the main simulation factors. The operating voltage determines the excitation intensity of the circular vibratory bowl, while the bottom inclination angle affects the radial migration of seeds toward the helical track. The inner wall inclination angle and helical pitch further influence the climbing stability and congestion tendency of seeds during helical conveying.
A four-factor, three-level Box–Behnken response surface design was carried out using Rocky DEM software 2025 R2. The seed conveying rate of rice seeds was selected as the response index. Each simulation run was repeated five times, and the average value was used for regression modeling and subsequent analysis. The factor levels are shown in Table 2.
Table 2.
Factors and levels of the DEM response surface simulation for the conveying module.
2.4. Structural Design Basis and Working Principle of the Two-Stage Device
2.4.1. Mechanical Boundary Criteria for V-Groove Channel Optimization
To ensure that rice seeds enter the stepped orientation region in a single-row and center-aligned state, the groove width W and the sidewall angle α of the cascaded V-shaped track must be constrained before the structure of the orientation module is finalized. Transverse wedging or disordered jamming in the channel would directly disturb the center-of-mass position of the seeds and reduce the reliability of subsequent passive tipping. Based on the sliding boundaries of bulk particles on an inclined vibrating plate, the normal force and the lateral friction force acting on a single seed from the V-groove wall are governed by Equations (6) and (7):
Here, is the static friction coefficient between the seed and steel track, using the parameter value reported in Table 1. Considering the mean seed width and the need to limit transverse motion, the groove convergence angle was fixed at = 90° as a design setting and subsequently evaluated in the bench configuration; it was not obtained as a unique analytical optimum from Equations (6) and (7). Groove width W was treated as a qualitative geometric constraint rather than as an independently optimized numerical factor. The V-groove is therefore described as promoting, rather than guaranteeing, single-row centerline alignment before the step edge.
Based on this boundary criterion, the linear orientation module was designed as a cascaded V-groove structure with stepped transitions. The V-groove first constrains the seed posture and transverse position, while the subsequent step structure induces passive tipping only for reverse-oriented seeds. The overall two-stage cooperative device structure is introduced in the following section.
2.4.2. Overall Structure of the Two-Stage Cooperative Device
The developed two-stage cooperative electromagnetic vibratory device consists of two core functional blocks: a circular vibratory fluidization and singulation unit, and a linear vibratory stepped passive orientation unit. The circular conveying module features a stainless-steel conical base encircled by a dual-helix involute climbing track. Under the synchronized excitation of independent digital controllers, randomly bulk-stacked seeds are fluidized to break inter-particle locks and are constrained into a single-row stream.
The linear orientation module comprises cascaded V-shaped grooves separated by steps along the conveying path. As the singulated seed stream enters the V-groove, the channel constrains transverse motion before the step. In the tested image sequences, many forward-oriented seeds remained supported and crossed without posture reversal, whereas many reverse-oriented seeds lost support and underwent a passive flip. This posture-dependent behavior is used to promote predominantly consistent embryo orientation at the outlet.
2.4.3. Working Principle
As shown in Figure 4, the working process of the two-stage cooperative device includes three stages: bulk seed fluidization and singulation, V-groove posture constraint, and stepped passive embryo reorientation.
Figure 4.
Structure of the two-stage cooperative vibratory conveying and orientation device. (a) Overall structure. (b) Circular vibratory bowl. (c) Stepped V-groove orientation module.
In the first stage, bulk rice seeds are loaded into the circular vibratory bowl. Under periodic electromagnetic excitation, the bowl generates coupled vertical and circumferential vibration, which loosens the randomly stacked seeds and reduces inter-particle nesting and self-locking. Driven by the tangential component of vibration, the seeds migrate toward the peripheral helical track and climb along it, gradually forming an ordered single-row stream for the downstream orientation module.
In the second stage, the singulated seed stream enters the linear V-groove orientation channel. According to the mechanical boundary criterion described above, the V-groove convergence angle was set to α = 90°. This structure limits transverse displacement, guides seeds along the groove centerline, and stabilizes the center-of-mass position before the seeds reach the step edge.
In the third stage, seeds pass through the stepped transition region. Forward-oriented seeds, whose embryo ends point rearward relative to the conveying direction, remain supported and pass through the step without posture reversal. In contrast, reverse-oriented seeds, whose embryo ends point forward, lose static equilibrium when their center of mass moves beyond the support boundary. Under gravity, vibration-induced inertial force, and support reaction, they undergo a passive 180° flip and are converted to the same embryo orientation as the forward-oriented seeds.
Through the cooperation of the circular vibratory conveying module and the linear stepped orientation module, the device converts randomly accumulated seeds into a stable single-row stream and promotes predominantly consistent embryo orientation at the outlet. The two modules are independently controlled, allowing the seed conveying rate and orientation effect to be adjusted separately in subsequent bench tests.
2.5. Bench Test Platform and Experimental Design
The bench experiments and associated data collection were conducted from January to March 2026 in the Precision Engineering Laboratory at Hunan Agricultural University. A bench test platform was constructed to verify the passive orientation mechanism and evaluate integrated performance. The platform enabled independent adjustment of the electromagnetic vibrating bowl, orienting device, conveyor belt, transfer drop height, and image acquisition system.
2.5.1. Bench Test Platform and Image Acquisition System
The bench test platform consisted of an electromagnetic vibrating bowl, an orienting device, a conveyor belt, a height adjustment device, a high-speed camera, a laptop, a seed collection box, two SDVC31-S vibration controllers, and a frequency converter, as shown in Figure 5. The bowl and orienting device were independently regulated by the two vibration controllers, while the conveyor-belt speed was adjusted using the frequency converter. An M230 high-speed camera (HF Agile Device Co., Ltd., Hefei, China) was used. Its core rated specifications include a maximum resolution of 1920 × 1080 pixels (Full HD), a full-frame rate of 3200 frames/s (3000 frames/s for the M230M/C variants), a maximum rate of 125,000 frames/s with a reduced region of interest, a minimum exposure time of 100 ns, monochrome and color sensitivities of ISO 25000 and ISO 8000, respectively, and a dynamic range of approximately 60 dB. Thus, the camera is capable of recording several thousand frames per second at Full HD resolution and of resolving very short transients with exposures down to 100 ns. These values describe the instrument’s rated capabilities.
Figure 5.
Bench-test platform for the two-stage vibratory conveying and orientation system. (a) Functional layout. (b) Physical prototype and experimental setup.
The electromagnetic vibrating bowl generated a continuous single-row seed stream for the downstream stepped V-groove orienting device. The oriented seeds were transferred onto the conveyor belt, with the transfer drop height regulated by the height adjustment device and the seeds collected at the belt outlet. The high-speed camera and laptop were used to record, acquire, and store images of seed motion at the step edge and after transfer, which were subsequently analyzed to determine the orientation success rate and the coefficient of variation of seed-flow uniformity.
2.5.2. Evaluation Metrics and Data Processing
The comprehensive performance of the system was evaluated using two indices: the orientation success rate (, %) and the coefficient of variation of seed-flow uniformity (, %). The orientation success rate reflects the proportion of seeds with consistent embryo orientation at the outlet and was calculated as:
where is the number of seeds meeting the required embryo orientation and is the total number of evaluated seeds. During each test, the high-speed camera continuously recorded the seed stream in a fixed detection window, and the embryo posture was manually verified from the image sequence. Posture and passage counts were evaluated manually by two observers using the recorded sequences. A random 20% of the videos was scored again to assess repeatability. Cases with severe overlap, an unidentifiable embryo end, motion blur, or a seed partly outside the detection window were predefined as ambiguous and excluded; the exclusion fraction was no greater than 5%. Overall posture-classification agreement was at least 93%, Cohen’s kappa was at least 0.86, and the relative inter-observer difference in manual flow counts was no greater than 4.6%.
The coefficient of variation of seed-flow uniformity was used to evaluate the temporal stability of the seed stream. A 5 s observation window was divided into five consecutive 1 s intervals, and the number of seeds passing through the detection region during each interval was counted. The coefficient of variation was calculated as:
where and are the standard deviation and mean of the seed counts obtained from the five 1 s intervals, respectively. A smaller Cu indicates a more stable and uniform seed flow.
For replicated center-point runs in the Box–Behnken design, repeatability was summarized using the arithmetic mean, sample standard deviation (SD; denominator n − 1), and a two-sided 95% Student’s t confidence interval, calculated as mean . These statistics were calculated for assessing the repeatability of the replicated center-point runs.
2.5.3. Orthogonal Test Design for the Orientation Module
To determine the optimal structural and operating parameters of the stepped orientation module, a four-factor, three-level orthogonal test was conducted. The selected factors were step height, chute inclination angle, operating voltage, and vibration frequency. These factors were chosen because step height and chute inclination directly affect the mechanical boundary of passive tipping, whereas operating voltage and vibration frequency determine the excitation intensity and transport stability of the linear vibrator.
For each test run, 200 rice seeds were used, including 100 seeds pre-arranged in the forward-oriented posture and 100 seeds pre-arranged in the reverse-oriented posture. The aggregate output posture accuracy was calculated according to the orientation success rate defined in Equation (8). The factor levels are shown in Table 3. Each of the nine L9 factor combinations was evaluated once with 200 seeds; the 200 seeds are observations within one run, not independent replicates. Because the four three-level main effects consume all eight degrees of freedom of the L9 array, no independent residual-error term is available for a defensible significance test. The range analysis is therefore interpreted descriptively, and ANOVA significance is not claimed for this stage. After factor-level selection, the chosen configuration was verified in ten independent bench runs. Each verification run used 200 seeds (100 initially forward and 100 initially reverse), and the two run-level percentages were calculated separately before averaging across runs. Run-level dispersion statistics were reported only when the original individual run-level values were available. Because the archived records for the ten-run verification retain only the aggregate means, SDs, SEs, and confidence intervals were not reconstructed from the aggregate values.
Table 3.
Factors and levels of the orthogonal test for the orientation module.
2.5.4. Response Surface Test Design for the Integrated System
After the structural parameters of the conveying module and orientation module were determined, an integrated system test was conducted to optimize the operating parameters of the complete device. In this stage, the optimized structural dimensions were kept constant, and the conveyor belt speed, operating voltage, and transfer drop height were selected as independent variables. The orientation success rate and the coefficient of variation of seed-flow uniformity were selected as response indices.
Single-factor tests were first conducted to determine the reasonable operating ranges of the three variables. Based on these ranges, a three-factor, three-level Box–Behnken response surface design was then used for integrated system optimization. The factor levels are shown in Table 4.
Table 4.
Factors and levels of the integrated system response surface test.
3. Results
The results are presented according to the functional sequence of the proposed device. First, the DEM simulation results of the circular vibratory conveying module are analyzed to verify seed fluidization, single-row conveying, and conveying parameter optimization. Second, the orthogonal test and high-speed photography results of the stepped V-groove orientation module are discussed to verify the passive reorientation mechanism. Finally, the integrated system performance is evaluated through single-factor tests, response surface analysis, and bench verification under optimized operating parameters.
3.1. DEM Simulation Results and Conveying Module Optimization
3.1.1. Seed Population Fluidization and Single-Row Conveying Behavior
The DEM simulation was first used to reveal the collective migration behavior of rice seeds in the circular vibratory bowl. As shown in Figure 6, the seeds were initially stacked randomly at the bottom of the bowl. Under the coupled vertical and circumferential electromagnetic excitation, the bulk seed population gradually loosened and became fluidized. The inter-particle self-locking and local nesting were weakened, allowing the seeds to migrate radially toward the peripheral helical track.
Figure 6.
Temporal evolution of seed population fluidization and translational velocity field in the vibrating bowl at different time steps. (a) 0 s; (b) 10 s; (c) 20 s; (d) 30 s.
After entering the helical track, the motion state of the seeds changed from random bulk motion to ordered single-row climbing. The velocity field shows that the translational velocity increased rapidly during the initial fluidization stage and then became relatively stable during helical conveying. This result indicates that the circular vibratory conveying module can provide a continuous and ordered seed stream for the downstream stepped orientation module.
The simulated seed motion can be divided into three typical stages. Initially, seeds were loosely distributed at the bowl bottom and their motion directions were disordered. With continued simulated vibration, seeds migrated toward the outer wall and entered the helical track under the modeled vertical and tangential excitation. After approximately 30 s of simulation, most modeled seeds were concentrated along the peripheral track and formed a more stable single-row climbing state. This simulated sequence illustrates the intended dispersion and singulation process.
3.1.2. Single-Factor Effects on Conveying Performance
The single-factor DEM results are shown in Figure 7. Operating voltage had the most direct effect on conveying efficiency. When the voltage increased from 140 V to 220 V, the total conveying time decreased rapidly, indicating that the higher excitation intensity promoted particle loosening and tangential transport. However, when the voltage exceeded 220 V, the improvement became limited, suggesting that excessive excitation no longer effectively increased stable conveying.
Figure 7.
Single-factor effect curves of conveying time for the conveying module. (a) Operating voltage. (b) Bottom surface inclination. (c) Inner wall inclination angle. (d) Helical pitch.
The bottom inclination angle mainly affected the radial migration of seeds from the bowl bottom to the helical track entrance. A moderate bottom inclination promoted seed dispersion and track entry, whereas an excessive inclination tended to cause local crowding at the entrance. The inner wall inclination angle affected the climbing behavior along the helical track. Increasing this angle improved climbing velocity, but the marginal benefit became weak after approximately 17°. The helical pitch also influenced the balance between conveying distance, climbing resistance, and track congestion. Therefore, these four factors were further selected for response surface optimization.
3.1.3. Response Surface Regression, ANOVA and Conveying Parameter Verification
Based on the single-factor results, a Box–Behnken response-surface regression model was established to evaluate the combined effects of circular-vibrator voltage, bowl-bottom inclination, track inner-wall inclination, and helical pitch on modeled conveying performance. Table 5 reports the ANOVA. The model was statistically significant and the lack-of-fit term was not significant for the simulation design; these results support interpolation within that modeled design space.
Table 5.
ANOVA results of the DEM response surface model for seed conveying rate.
The response-surface optimization selected a circular-module setting of 220 V, 7° bowl-bottom inclination, 17° track inner-wall inclination, and 38 mm helical pitch. At this setting, DEM predicted 205 grains/min and the mean bench throughput from ten independent 60 s runs was 204 grains/min, a 1 grain/min difference (0.49% relative to the bench result). To evaluate model performance beyond the selected optimum, validation was conducted under 11 conditions spanning circular-vibrator voltage and the three structural factors. Across these conditions, bench throughput ranged from 176 to 204 grains/min and DEM throughput from 180 to 208 grains/min. DEM predictions had a mean positive bias of 3.82 grains/min, RMSE of 4.05 grains/min, MAPE of 1.98%, maximum absolute relative error of 3.48%, and Pearson r = 0.986 with bench throughput. The ten-run selected-condition measurement documents short-run repeat accounting; each of the other validation conditions contributed one aggregate DEM/bench pair.
Figure 8 compares the simulated and experimental outlet flow states at the selected condition. Both images show a continuous, largely singulated outlet stream; this qualitative comparison supports using the selected setting for the downstream tests.
Figure 8.
Comparison of seed flow state under optimal conveying parameters. (a) Simulation test. (b) Actual test.
3.2. Orientation Module Optimization and Tipping Kinematics Evaluation
After the conveying module provided a continuous and singulated seed stream, the orientation module was further evaluated to determine whether the stepped V-groove could maintain forward-oriented seeds and correct reverse-oriented seeds. In this section, the effects of structural and vibration parameters on orientation performance were first analyzed through orthogonal tests. The optimized configuration was then verified by bench tests, and the seed posture evolution at the step edge was further examined using high-speed photography.
3.2.1. Orthogonal Test Results and Range Analysis
The orthogonal test results of the stepped orientation module are shown in Table 6, and the range analysis is summarized in Table 7. The results indicate that the four tested factors exhibited different degrees of influence on the orientation success rate. The influence order was operating voltage > step height > chute inclination angle > vibration frequency.
Table 6.
Orthogonal test scheme and results of the orientation module.
Table 7.
Range analysis of orthogonal test results.
The operating voltage was the most important factor because it directly determined the excitation intensity of the linear vibrator and the kinetic energy available for seed tipping. Step height and chute inclination angle were the main structural factors controlling the mechanical boundary at the step edge. In contrast, the vibration frequency varied only within a narrow range around the nominal working frequency, and therefore its influence on the final orientation success rate was relatively weak.
In Table 7, K1–K3 represent the sums of the response values at each factor level, while k1–k3 are the corresponding mean values. The range R was used to evaluate the relative influence of each factor.
3.2.2. Optimal Structural Configuration and Bench Verification
According to the orthogonal test and range analysis, the optimal parameter combination of the orientation module was determined as follows: step height of 6 mm, chute inclination angle of 9°, operating voltage of 200 V, and vibration frequency of 100.0 Hz. Under this configuration, the chute provided sufficient geometric discontinuity for reverse-oriented seeds to lose equilibrium at the step edge, while avoiding excessive disturbance to forward-oriented seeds. This correction follows Table 7, in which the highest frequency-level mean is k2 = 78.87 at 100.0 Hz.
Ten independent bench tests were conducted under the selected configuration. Each run used 200 seeds, comprising 100 initially forward-oriented seeds and 100 initially reverse-oriented seeds, giving a total of 2000 evaluated seeds. Forward-retention and reverse-correction percentages were calculated separately for each run and then averaged across the ten runs. The archived experimental records retain aggregate mean forward-retention and reverse-correction rates of 92.4% and 88.1%, respectively. However, the individual run-level values are no longer available. Therefore, exact run-to-run SDs, SEs, and 95% confidence intervals cannot be reliably reconstructed, and only the aggregate mean values are reported. Consequently, the run-to-run repeatability of these two performance indices cannot be quantified further from the retained records.
3.2.3. High-Speed Photographic Observation of Passive Tipping Kinematics
High-speed photography was used to visualize representative posture transitions at the step edge. As shown in Figure 9, four typical seed motion states were observed. In the steady forward-flow state, the forward-oriented seed maintained continuous contact with the V-groove and passed over the step without an obvious posture reversal. This qualitative observation is consistent with the conditional mechanism that the center of mass remains within the stable support region.
Figure 9.
Representative high-speed image sequences at the stepped V-groove edge under the tested orientation-module condition. (a) A forward-oriented seed passes the step without posture reversal; (b) a forward-to-reverse transition; (c) a reverse-to-forward corrective transition; and (d) a reverse-oriented seed that remains incorrectly oriented. Time labels are elapsed times from the first displayed frame.
For reverse-oriented seeds, the center of mass moved beyond the support boundary when the seed reached the step edge. The unsupported center of mass generated a gravitational torque, and the seed completed a 180° corrective flip under the combined action of gravity, support reaction, and vibration-induced inertial force. This process converted the reverse-oriented seed into the desired forward posture. A small number of failures were also observed, mainly caused by seed surface trichome interlocking, local crowding, or transient inter-particle contact forces. The sequences provide qualitative support for posture-dependent tipping and illustrate plausible failure mechanisms.
3.3. Integrated System Performance and Multi-Objective Parameter Optimization
3.3.1. Single-Factor Operational Performance Sweeps
As shown in Figure 10, with the voltage fixed at 200 V and transfer drop height at 9 mm, conveyor speeds were swept from 20 to 40 mm/s. At low speeds (<30 mm/s), seeds aggregated intermittently at the outlet, increasing inter-particle crowding and causing conveying uniformity (Cu) to degrade to 26.2%. When the speed exceeded 30 mm/s, the high horizontal drag force from the belt induced sliding and rolling upon impact, disrupting aligned postures and elevating Cu to 20.1%. A conveyor speed of 30 mm/s was identified as the observed balance point (RT = 91.5%, Cu = 14.8%).
Figure 10.
Single-factor effects of conveyor-belt speed on orientation success rate and the coefficient of variation of seed-flow uniformity, with Ul = 200 V and transfer drop height H = 9 mm.
As shown in Figure 11, varying the voltage from 180 to 220 V (at 30 mm/s belt speed and 9 mm transfer drop height) revealed distinct quadratic behavior. At 180 V, insufficient excitation caused material stagnation, reducing RT to 88.3% and increasing Cu to 23.7%. At 220 V, excessive vibration caused seeds to bounce within the channel, reducing RT to 86.4%. The observed best level in this sweep was 200 V (RT = 92.1%, Cu = 13.9%).
Figure 11.
Single-factor effects of linear-vibrator voltage Ul on orientation success rate and seed-flow uniformity at a conveyor-belt speed of 30 mm/s and transfer drop height H = 9 mm.
As shown in Figure 12, the transfer drop height was the most sensitive operational variable in the tested sweep. At a 3 mm clearance, seeds wedged and scraped against the exit lip, with Cu = 25.6%. At transfer heights exceeding 6 mm, the higher landing energy induced secondary bouncing upon belt impact, reducing RT to 83.4% at 15 mm. The observed favorable transfer-height window was 5–7 mm, with the best measured point at 6 mm (RT = 92.9%, Cu = 13.1%).
Figure 12.
Single-factor effects of transfer drop height H on orientation success rate and seed-flow uniformity at a conveyor-belt speed of 30 mm/s and Ul = 200 V. The source-figure axis label ‘transfer drop height’ denotes the same transfer drop height H.
3.3.2. Response Surface Regression and ANOVA of Integrated Performance
Using the design matrix and experimental results in Table 8, quadratic regression models were fitted for orientation success and seed-flow uniformity. Table 9 reports statistically significant model terms (p < 0.0001) and nonsignificant lack-of-fit terms. Together with the diagnostics reported below, these results support interpolation within the tested Box–Behnken ranges.
Table 8.
Box–Behnken design matrix and experimental results for integrated system optimization.
Table 9.
ANOVA results of regression models for integrated system performance.
Using the coded factors , , and , where is conveyor-belt speed (mm/s), is linear-vibrator voltage (), and H is transfer drop height (), least-squares refitting of the 17 observations in Table 8 gives:
In actual variables, the same models are .
For , = 0.9990, adjusted = 0.9978, predicted (PRESS) = 0.9956, model = 0.15%, and residuals range from −0.20 to 0.20 percentage points. For , = 0.9927, adjusted = 0.9832, predicted (PRESS) = 0.9152, model CV = 3.57%, and residuals range from −0.88 to 0.65 percentage points. Together with the nonsignificant lack-of-fit terms in Table 9 (p = 0.8032 and 0.1571), these diagnostics support interpolation within the tested factor ranges but do not establish robustness outside those ranges.
The five center-point runs in Table 8 (tests 13–17; S = 30 mm/s, = 200 V, and H = 6 mm) provide replicate observations at one design condition. The orientation success rate was 92.90% ± 0.16 percentage points (mean ± sample SD; 95% CI, 92.70–93.10%), and the coefficient of variation of seed-flow uniformity was 12.78% ± 0.53 percentage points (95% CI, 12.13–13.43%; n = 5 for both responses).
The factor influence order differed between the two responses. For orientation success rate, transfer drop height had the strongest effect, followed by operating voltage and conveyor belt speed. For conveying uniformity, conveyor belt speed was the dominant factor, indicating that the final seed-flow stability was more sensitive to the downstream receiving and conveying process.
3.3.3. Interaction Effects and Multi-Objective Optimization
The response surface plots are shown in Figure 13. The interaction effects among conveyor belt speed, operating voltage, and transfer drop height were not significant, indicating that the integrated system performance was mainly affected by the independent effects of these three factors.
Figure 13.
Fitted response surfaces within the tested Box–Behnken design space. (a) Orientation success rate (%) for pairwise factor combinations; (b) coefficient of variation of seed-flow uniformity (%). The third coded factor is held at its center level in each surface; the interaction terms are nonsignificant according to Table 9. The source-graphic labels ‘feeding drop height’ denote transfer drop height H.
For orientation success rate, the fitted surface showed a peak within the middle ranges of operating voltage and transfer drop height. Insufficient excitation was associated with unstable conveying, whereas excessive excitation increased seed bouncing and posture disturbance. A large transfer drop height also increased impact disturbance after orientation, reducing the probability of maintaining the desired embryo orientation. For seed-flow uniformity, the coefficient of variation decreased with a suitable increase in conveyor-belt speed and a reduction in transfer drop height. Multi-objective optimization was therefore used to maximize orientation success and minimize the uniformity coefficient within the tested ranges.
3.3.4. Final Bench Verification Under Optimized Parameters
The multi-objective optimization aimed to maximize the orientation success rate while minimizing the coefficient of variation of seed-flow uniformity. The optimized operating parameters of the integrated system were determined as follows: conveyor belt speed of 31.5 mm/s, operating voltage of 200 V, and transfer drop height of 5.30 mm.
Under this optimized configuration, the regression models predicted an orientation success rate of 93.0% and a conveying uniformity coefficient of variation of 12.3%. Five validation tests were conducted on the physical testbed. The archived experimental record retained only the aggregate mean values of 91.2% for orientation success and 14.5% for the coefficient of variation of seed-flow uniformity. Because the individual run-level values were unavailable, the corresponding run-level SDs and 95% confidence intervals could not be reliably reconstructed; therefore, only the aggregate means are reported. The relative errors between the predicted and measured mean values were 2.0% and 17.6%, respectively.
The 17.6% relative error for the uniformity coefficient is materially larger than the 2.0% error for orientation success and indicates weaker prediction of temporal seed-flow variability. Seed morphology, glume surface variation, manual counting, and sensitivity of the five-interval Cu definition are plausible contributors, but their individual contributions were not quantified. The validation supports the selected integrated setting for the tested batch but does not establish robustness beyond the examined operating window. The evidence streams are complementary but differently limited: 11 aggregate DEM/bench throughput pairs with low MAPE but no replicate uncertainty, a descriptive L9 factor ranking, qualitative tipping sequences, and response-surface interpolation with optimized-condition averages but unavailable run-level dispersion.
4. Discussion
4.1. Mechanistic Interpretation of Passive Stepped Reorientation
The observations are consistent with a conditional mechanism in which support relative to the seed’s longitudinal mass distribution influences posture change at the step. Repeated camera measurements quantified the distribution, 250 paired trials showed a general increase in tipping probability with , and critical-excitation screening placed on the order of N·m. However, the overlap among intervals and the absence of exact seed-level tipping counts and moment estimates prevent a fitted multivariable threshold or prospective classifier. The following interpretation is therefore quantitatively supported at the trend and moment-scale levels but remains subject to prospective validation.
For forward-oriented seeds, the embryo end points rearward relative to the conveying direction. In the proposed model, the center of mass remains within the supported region as the seed crosses the edge, allowing the support reaction to balance the gravitational moment. The absence of an obvious posture reversal in the representative images is consistent with this modeled state, but the displayed event was not linked to a seed-specific measurement or contact-moment measurement.
For reverse-oriented seeds, the embryo end points forward relative to the conveying direction. The model assumes that support decreases as the seed advances beyond the edge, after which gravitational and vibration-induced moments can promote rotation. The reverse-to-forward sequence in Figure 9c is consistent with this interpretation. More importantly, the 250 paired trials on the same 50 identified seeds showed a general increase in tipping probability with , and the threshold screen placed on the order of N·m, comparable to the nominal scale of N·m. The substantial overlap among Δd intervals shows that friction, contact geometry, vibration phase, and crowding also contribute.
The occasional orientation failures can also be explained by this mechanism. When local crowding, surface trichome interlocking, or transient inter-particle contact occurs near the step edge, an additional constraint may suppress the angular motion of reverse-oriented seeds. In this case, the seed may slide through the step without completing the corrective flip, as observed in Figure 9d. Therefore, the passive orientation performance depends not only on the step geometry but also on the upstream seed-flow state and the degree of seed singulation. Schematic comparison of seed motion at the step edge is shown in Figure 14.
Figure 14.
Schematic comparison of seed motion at the step edge. (a) A forward-oriented seed remains within the stable support region and passes through the step without posture reversal; (b) a reverse-oriented seed moves beyond the support boundary and undergoes passive rotation toward the target posture.
4.2. Coupling Among Seed Singulation, V-Groove Constraint, and Integrated Performance
The performance of the proposed device is determined by coupling among upstream seed-flow stability, V-groove posture constraint, and downstream receiving conditions. The circular bowl loosens bulk seeds and guides them toward a single-row stream. Across 11 validation conditions, DEM throughput tracked bench throughput with MAPE = 1.98%, RMSE = 4.05 grains/min, and r = 0.986, while overpredicting by 3.82 grains/min on average. The selected condition gave 205 grains/min in DEM and 204 grains/min on the bench. These results provide broader throughput evidence than a single optimum comparison, although one aggregate pair per condition and the absence of replicate uncertainty limit inferential validation.
After singulation, the V-groove channel further constrains the transverse position and posture of each seed before it reaches the step edge. This constraint is essential because the passive tipping mechanism is sensitive to the position of the center of mass relative to the step boundary. If seeds enter the step region in a disordered or laterally offset state, the expected difference between forward-oriented and reverse-oriented seeds becomes less stable, resulting in incorrect flipping or tipping failure. Therefore, the V-groove structure and the stepped boundary should be regarded as a coupled orientation unit rather than two independent components.
The integrated system results further show that downstream conveying conditions also affect the final orientation performance. Conveyor belt speed mainly influences the continuity and uniformity of the seed stream after orientation, whereas transfer drop height affects the impact state of seeds when they transfer from the orientation outlet to the belt. Excessive drop height can induce secondary bouncing and disturb the oriented posture, while insufficient clearance may increase the risk of scraping or local congestion. Therefore, the final performance of the device cannot be determined solely by the optimal parameters of the conveying module or the orientation module. A separate module-level optimization followed by integrated system optimization is necessary to balance orientation accuracy and conveying uniformity.
4.3. Limitations, Practical Relevance, and Future Work
All characterization, optimization, and robustness experiments in this study used the long-grain hybrid indica cultivar ‘Y Liangyou 900’; therefore, the settings and performance should not be generalized to rice seeds as a whole. Cultivars differ in dimensions, aspect ratio, glume roughness, friction, and center-of-mass distribution, which may alter both V-groove constraint and passive tipping. Tests with additional indica and japonica cultivars remain necessary. The moisture and surface-condition screen expands the material window within this cultivar but does not establish cultivar adaptability.
A further limitation concerns the incomplete retention of run-level experimental records. For the ten-run orientation-module verification, the archived records preserve the aggregate mean forward-retention and reverse-correction rates of 92.4% and 88.1%, respectively, but the individual run-level percentages are no longer available. Similarly, for the five validation tests of the final integrated-system optimum, only the aggregate mean orientation success rate of 91.2% and seed-flow-uniformity CV of 14.5% were retained. Consequently, exact run-to-run SDs, SEs, and confidence intervals cannot be reconstructed for these verification datasets, and their run-to-run repeatability remains incompletely quantified. Future experiments should retain and report all individual replicate-level outcomes together with appropriate dispersion statistics and confidence intervals.
At 204 grains/min, circular-module capacity is nominally 12,240 grains/h. Applying the integrated orientation success of 91.2% gives approximately 186 correctly oriented seeds/min (about 11,160/h) and leaves approximately 18 misoriented seeds/min if no further correction is used. A published high-throughput rice-seed DNA extraction method processes 384 samples in 2 h (about 192 samples/h) [26]; thus, the present upstream module would not be the principal throughput bottleneck in a laboratory workflow of that scale. This is a contextual comparison rather than a direct benchmark because the extraction process and the present orientation process use different performance definitions and no downstream cutter was integrated. When the local seed flow becomes too dense, inter-particle normal forces and temporary interlocking increase in the V-groove channel. These additional contact constraints can suppress the angular motion of reverse-oriented seeds and reduce the probability of successful passive flipping. The 8.8% residual misorientation cannot be assumed acceptable for embryo-preserving cutting. Practical integration should include machine-vision posture verification immediately before cutting, with rejected seeds recirculated; a second passive stage could reduce the load on the rejection system. Future validation should quantify effective correctly oriented throughput, residual orientation error, cutting-position accuracy, embryo survival, germination, seed-sample traceability, and continuous-operation stability.
DEM calibration used a documented cylinder-lift angle-of-repose test and an untapped 1000 mL bulk-density test, each repeated five times after 24 h moisture equilibration at controlled temperature and humidity. Parameter searches were bounded around the Table 1 contact values and accepted only when both target errors were no greater than 3%; gravity, rigid-wall, particle-generation, initial-state, open-outlet, and neglected-force assumptions are now stated explicitly. The final mean absolute relative errors were 0.89% for angle of repose and 0.43% for bulk density. Multi-condition throughput checking across 11 condition pairs gave MAPE = 1.98% and a maximum absolute relative error of 3.48%. These results support use of the model within the documented calibration and response-surface domains without implying validity outside the tested material and operating ranges.
During the same 11-condition validation, conveying time ranged from 28.5 to 36.0 s, outlet velocity from 0.080 to 0.130 m/s, and blockage frequency from 0 to 3 events per 10 min. Because these three variables were not measured as paired DEM and bench endpoints, they are reported only as condition-level operational observations and are not used as independent DEM validation endpoints. Future validation should collect paired simulated and physical distributions, velocities, conveying times, and blockage frequencies with repeated runs.
The unreplicated condition-level screen yielded descriptively lower performance values under higher moisture and adverse surface states. Because each condition was evaluated only once, these observations should not be interpreted as statistically demonstrated factor effects. For clean seeds at 9%, 11%, 13%, and 15% moisture, throughput was 207, 204, 200, and 190 grains/min; orientation success was 90.3%, 91.2%, 89.5%, and 86.8%; flow CV was 15.0%, 14.5%, 16.2%, and 19.5%; and blockages were 0, 0, 1, and 3 per 30 min. At 11% moisture, the observed throughputs under dusty and broken-glume conditions were 198 and 194 grains/min, respectively, while the corresponding orientation success rates were 88.7% and 86.2% respectively; the corresponding flow CV values were 17.8% and 20.1%, blockages were 2 and 3 per 30 min, and observed seed-damage percentages were 0.4% and 1.2%. Six-month-stored clean seeds yielded 200 grains/min, 89.4% orientation success, 16.7% flow CV, one blockage per 30 min, and 0.3% seed damage. The most adverse observed condition (15% moisture, broken glume) yielded 174 grains/min, 80.8% orientation success, 28.2% flow CV, six blockages per 30 min, and 2.1% seed damage. Because each condition was tested once and the conditioning procedure was not documented in sufficient detail, these values are descriptive screening evidence without SD, confidence intervals, or factorial significance tests.
Manual posture and flow evaluation was performed by two observers, with a random 20% of videos rescored. Overall posture-classification agreement was at least 93%, Cohen’s kappa was at least 0.86, the inter-observer relative difference in flow counts was no greater than 4.6%, and predefined ambiguous cases accounted for no more than 5% of reviewed records. These results support repeatable manual classification under the tested protocol. The high-speed sequences nevertheless remain qualitative for kinematic interpretation because the actual spatial and temporal acquisition settings were not documented. Future calibrated analysis should quantify rotation angle, angular velocity, tipping time, contact duration, and failures by cause; automated posture verification could also support practical rejection or recirculation.
The center-of-mass offset was quantified for 50 seeds by a documented miniature high-resolution-camera procedure with 3–5 independent repositioning measurements per seed. The same seeds were then subjected to five paired tipping trials each at 200 V, 100 Hz, a 6 mm step, and a 9° chute; tipping probability increased generally with , but the offset intervals overlapped. Threshold screening placed on the order of 10−7 N·m. Local vibration was measured with a PCB M352C68 accelerometer mounted 20 mm from the step, using 5 kHz sampling, 10-s records, and five repeats per 100-Hz voltage condition; the reported repeat CV was ≤3% and expanded uncertainty was U (k = 2) ≤ 6%. These additions substantially reduce the earlier method and calibration gaps. However, the screened subset was recorded only as 15–20 seeds, exact seed-level tipping counts and moment estimates were not available for regression, and the descriptive Δd intervals overlapped. Equation (5) is therefore supported by a positive seed-level trend and a consistent moment scale, but a multivariable predictive threshold still requires complete run-level data, fixed replicate counts, and prospective validation.
The 12-condition robustness experiment produced one 30-min blockage count and one seed-damage percentage for each screened condition, including 0–6 blockages per 30 min and 0.2–2.1% observed seed damage. It does not provide repeated continuous-operation runs, time-resolved throughput, total seeds processed, repeated-flip counts, a standardized breakage protocol, embryo-specific damage, or post-processing germination. No cutting module, additional cultivar, or breeding-line integration was tested. Replicated long-duration operation and biological viability testing are therefore still required before claims of reliability, embryo preservation, cultivar adaptability, or commercial throughput can be made.
5. Conclusions
This study developed and optimized a two-stage cooperative electromagnetic vibratory device for single-row conveying and passive embryo orientation of one tested ‘Y Liangyou 900’ seed batch. The circular bowl generated an ordered seed stream, and the stepped V-groove promoted posture-dependent correction. For 50 seeds, camera measurements gave an embryo-end center-of-mass offset of 0.285 ± 0.040 mm (range 0.215–0.344 mm; CV 14.1%). In 250 paired trials at 200 V, 100 Hz, a 6 mm step, and a 9° chute, tipping probability generally increased with Δd, but the offset intervals overlapped substantially. The mean mass and offset imply ≈ N·m, while a separate critical-excitation screen placed on the order of N·m. Thus, Equation (5) is supported at the trend and order-of-magnitude levels but is not yet a deterministic seed-level predictor. A PCB M352C68 accelerometer mounted 20 mm from the step was sampled at 5 kHz for five 10-s repeats at each 100-Hz voltage condition. The amplitude equivalents were 0.100, 0.137, and 0.176 mm at 160, 180, and 200 V, respectively, corresponding to peak accelerations of 4.03, 5.52, and 7.09 g; repeat CV was ≤3% and expanded uncertainty was U (k = 2) ≤ 6%.
The circular-module settings selected by DEM-assisted optimization were 220 V, 7° bowl-bottom inclination, 17° track inner-wall inclination, and 38 mm helical pitch. Five paired physical-simulation calibration tests gave mean absolute relative errors of 0.89% for angle of repose and 0.43% for bulk density. Across 11 aggregate validation conditions, throughput MAPE was 1.98%, with a mean positive DEM bias of 3.82 grains/min; the selected condition was 205 grains/min in DEM and a mean of 204 grains/min across ten 60 s bench runs. The linear orientation module was selected by descriptive L9 analysis at a 6 mm step height, 9° chute inclination, 200 V, and 100.0 Hz, and was subsequently evaluated in ten independent 200-seed runs (2000 seeds total). The archived records retain aggregate mean forward-retention and reverse-correction rates of 92.4% and 88.1%, respectively. Because the individual run-level values were not retained, the corresponding run-to-run dispersion statistics could not be reconstructed. Integrated optimization selected a conveyor-belt speed of 31.5 mm/s, 200 V, and a 5.30 mm transfer drop height. Five final validation tests yielded archived aggregate mean values of 91.2% for orientation success and 14.5% for flow CV. Because the individual run-level values from these tests were also unavailable, corresponding SDs and 95% confidence intervals could not be reconstructed, and the repeatability of the final integrated optimum remains incompletely quantified. In the unreplicated condition-level screen, lower throughput, orientation success, and flow-stability values were observed at high moisture and under dusty or broken-glume conditions. Because each condition was evaluated only once, these results are descriptive and do not establish statistically demonstrated robustness or factor effects, with the most adverse observed condition yielding 174 grains/min, 80.8% orientation success, 28.2% flow CV, six blockages per 30 min, and 2.1% seed damage. At the measured integrated success rate, the nominal correctly oriented output is approximately 186 seeds/min, so the device is a preliminary preprocessing module for the tested cultivar and conditions rather than a stand-alone embryo-preserving cutting solution. Because all characterization, optimization, and robustness experiments were conducted using one batch of ‘Y Liangyou 900’, the reported parameter settings and performance should not be generalized to other rice cultivars without further cross-cultivar and cross-batch validation.
Author Contributions
Conceptualization, T.L.; methodology, T.L., H.H. and M.L.; software, J.Y. and M.L.; validation, M.L. and X.S.; formal analysis, J.Y. and M.L.; investigation, T.L., M.L. and D.G.; resources, T.L. and H.H.; data curation, J.Y., M.L. and X.S.; writing—original draft preparation, J.Y. and M.L.; writing—review and editing, T.L.; visualization, J.Y. and M.L.; supervision, T.L. and H.H.; project administration, T.L. and H.H.; funding acquisition, T.L. and D.G. All authors have read and agreed to the published version of the manuscript.
Funding
This research was funded by the Natural Science Foundation of Hunan Province (2025JJ60212), the Scientific Research Foundation of Hunan Provincial Education Department (24B0212) and the Graduate Research and Innovation Projects of Hunan Province (CX20251074).
Data Availability Statement
The original contributions presented in this study are included in the article. Further inquiries can be directed to the corresponding authors.
Conflicts of Interest
The authors declare no conflicts of interest.
References
- He, X.; Batáry, P.; Zou, Y.; Zhou, W.; Wang, G.; Liu, Z.; Bai, Y.; Gong, S.; Zhu, Z.; Settele, J.; et al. Agricultural diversification promotes sustainable and resilient global rice production. Nat. Food 2023, 4, 788–796. [Google Scholar] [CrossRef] [Scilit] [PubMed]
- Hickey, L.T.; Hafeez, A.N.; Robinson, H.; Jackson, S.A.; Leal-Bertioli, S.C.M.; Tester, M.; Gao, C.; Godwin, I.D.; Hayes, B.J.; Wulff, B.B.H. Breeding crops to feed 10 billion. Nat. Biotechnol. 2019, 37, 744–754. [Google Scholar] [CrossRef] [Scilit] [PubMed]
- Varshney, R.K.; Bohra, A.; Yu, J.; Graner, A.; Zhang, Q.; Sorrells, M.E. Designing future crops: Genomics-assisted breeding comes of age. Trends Plant Sci. 2021, 26, 631–649. [Google Scholar] [CrossRef] [Scilit] [PubMed]
- Li, M.; Poonam, A.D.; Cui, Q.; Hsieh, T.; Jagadeesan, S.; Xu, J.; Bruce, W.B.; Vogel, J.T.; Sessions, A.; Cabrera, A.; et al. Non-destructive seed genotyping via microneedle-based DNA extraction. Plant Biotechnol. J. 2025, 23, 2317–2329. [Google Scholar] [CrossRef] [Scilit] [PubMed]
- Arbelaez, J.D.; Tandayu, E.; Reveche, M.Y.; Jarana, A.; van Rogen, P.; Sandager, L.; Stolt, P.; Ng, E.; Varshney, R.K.; Kretzschmar, T.; et al. ssb-MASS: A single seed-based sampling strategy for marker-assisted selection in rice. Plant Methods 2019, 15, 78. [Google Scholar] [CrossRef] [Scilit] [PubMed]
- Lynagh, P.G.; Osuna-Kleist, P.; Wang, B.; Malagon, E.; Anleu Gil, M.X.; Comai, L. Accurate direct PCR with Arabidopsis and rice. Plant Cell Physiol. 2023, 64, 1–3. [Google Scholar] [CrossRef] [Scilit] [PubMed]
- Sano, N.; Lounifi, I.; Cueff, G.; Collet, B.; Clément, G.; Balzergue, S.; Huguet, S.; Valot, B.; Galland, M.; Rajjou, L. Multi-omics approaches unravel specific features of embryo and endosperm in rice seed germination. Front. Plant Sci. 2022, 13, 867263. [Google Scholar] [CrossRef] [Scilit] [PubMed]
- Zhao, Z.; Wang, R.; Liu, M.; Bai, L.; Sun, Y. Application of machine vision in food computing: A review. Food Chem. 2025, 463, 141238. [Google Scholar] [CrossRef] [Scilit] [PubMed]
- Kuan, Y.N.; Goh, K.M.; Lim, L.L. Systematic review on machine learning and computer vision in precision agriculture: Applications, trends, and emerging techniques. Eng. Appl. Artif. Intell. 2025, 148, 110401. [Google Scholar] [CrossRef] [Scilit]
- Lu, Y.; Young, S. A survey of public datasets for computer vision tasks in precision agriculture. Comput. Electron. Agric. 2020, 178, 105760. [Google Scholar] [CrossRef] [Scilit]
- Stocker, C.; Schmid, M.; Reinhart, G. Reinforcement learning-based design of orienting devices for vibratory bowl feeders. Int. J. Adv. Manuf. Technol. 2019, 105, 3631–3642. [Google Scholar] [CrossRef] [Scilit]
- Blankemeyer, S.; Kolditz, T.; Busch, J.; Seitz, M.; Nyhuis, P.; Raatz, A. Adaptive aerodynamic part feeding enabled by genetic algorithm. Prod. Eng. 2022, 16, 1–8. [Google Scholar] [CrossRef] [Scilit]
- Fan, Y.; Yang, L.; Yin, C.; Song, S.; Wang, D.; Zhang, Y.; Liu, X. Tribological properties and damage behavior of brown rice based on milling process. Tribol. Int. 2022, 167, 107353. [Google Scholar] [CrossRef] [Scilit]
- Xiao, X.; Yang, L.; Wang, Z.; Luo, Y.; Cui, B.; Song, S.; Zhang, Y.; Pei, H. Multi-dimensional research on brown rice fracture characteristics and mechanism under quasi-static compression. J. Cereal Sci. 2023, 114, 103803. [Google Scholar] [CrossRef] [Scilit]
- Yang, L.; Fan, Y.; Song, S.; Wang, D.; Zhang, Y.; Cao, M. Frictional behavior of brown rice grain during moderate processing. Tribol. Int. 2021, 162, 107123. [Google Scholar] [CrossRef] [Scilit]
- Yuan, H.; Wang, H.; Huang, J.; Li, L.; Peng, S.; Wang, J. Study on uniformity of linear vibrating rice feeding device with matrix-designed outlets based on discrete element method. J. Food Eng. 2024, 381, 112170. [Google Scholar] [CrossRef] [Scilit]
- Shi, Q.; Sakai, M. Recent progress on the discrete element method simulations for powder transport systems: A review. Adv. Powder Technol. 2022, 33, 103664. [Google Scholar] [CrossRef] [Scilit]
- Chen, Z.; Wassgren, C.; Ambrose, R.P.K.; Du, Y.; Song, Z.; Li, X. Coefficient of restitution considerations in the discrete element method for agricultural materials: A review. Biosyst. Eng. 2026, 262, 104364. [Google Scholar] [CrossRef] [Scilit]
- Maraveas, C.; Tsigkas, N.; Bartzanas, T. Agricultural processes simulation using discrete element method: A review. Comput. Electron. Agric. 2025, 237, 110733. [Google Scholar] [CrossRef] [Scilit]
- Qi, J.; Yang, Y.; Guo, H.; Cheng, P.; Cong, X. DEM modelling methods and contact parameter calibration of germinated hybrid rice seed. Comput. Part. Mech. 2025, 12, 5619–5645. [Google Scholar] [CrossRef] [Scilit]
- Zhang, S.; Cai, Z.; He, H.; Kuang, F.; Xiong, W.; Zhu, D.; Li, Z.; Tekeste, M.Z. DEM contact parameters of rice seed for mechanical seeding performance analysis. Biosyst. Eng. 2025, 260, 104298. [Google Scholar] [CrossRef] [Scilit]
- Coetzee, C.J. Particle upscaling: Calibration and validation of the discrete element method. Powder Technol. 2019, 344, 487–503. [Google Scholar] [CrossRef] [Scilit]
- Richter, C.; Rößler, T.; Kunze, G.; Katterfeld, A.; Will, F. Development of a standard calibration procedure for the DEM parameters of cohesionless bulk materials—Part II: Efficient optimization-based calibration. Powder Technol. 2020, 360, 967–976. [Google Scholar] [CrossRef] [Scilit]
- Qian, C.; Qin, W.; Jiang, Y.; Huang, Z.; Zhang, M.; Wang, Z.; Yang, W.; Zang, Y. Parameter optimization and experiment of the vacuum seed meter with double holes for direct seeding of rice. Int. J. Agric. Biol. Eng. 2025, 18, 89–99. [Google Scholar] [CrossRef] [Scilit]
- Hao, S.; Zhu, C.; Wang, Y.; Liu, C.; You, Y.; Xu, J.; Guo, S.; Huo, J. Design and validation of mechanical-pneumatic metering device for mixed seeding of forage seeds. Biosyst. Eng. 2026, 267, 104485. [Google Scholar] [CrossRef] [Scilit]
- Liang, H.; Deng, Y.; Wang, C.; Xu, X. A high-throughput DNA extraction method from rice seeds. Biotechnol. Biotechnol. Equip. 2016, 30, 32–35. [Google Scholar] [CrossRef] [Scilit]
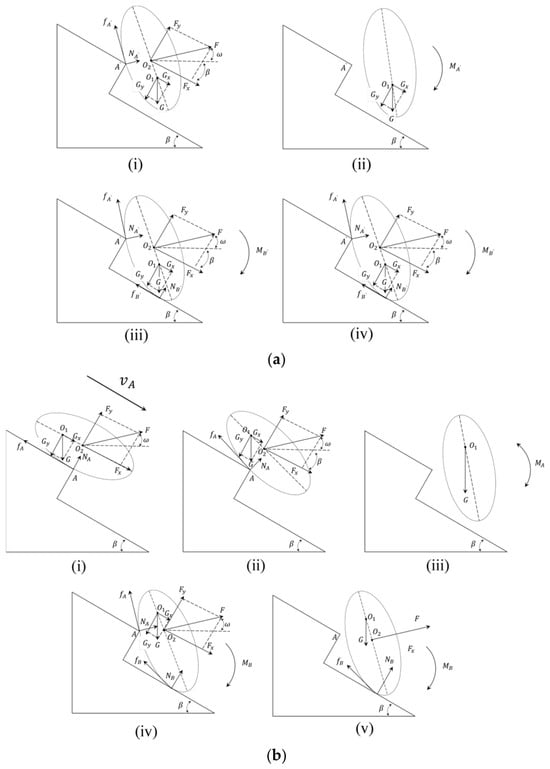
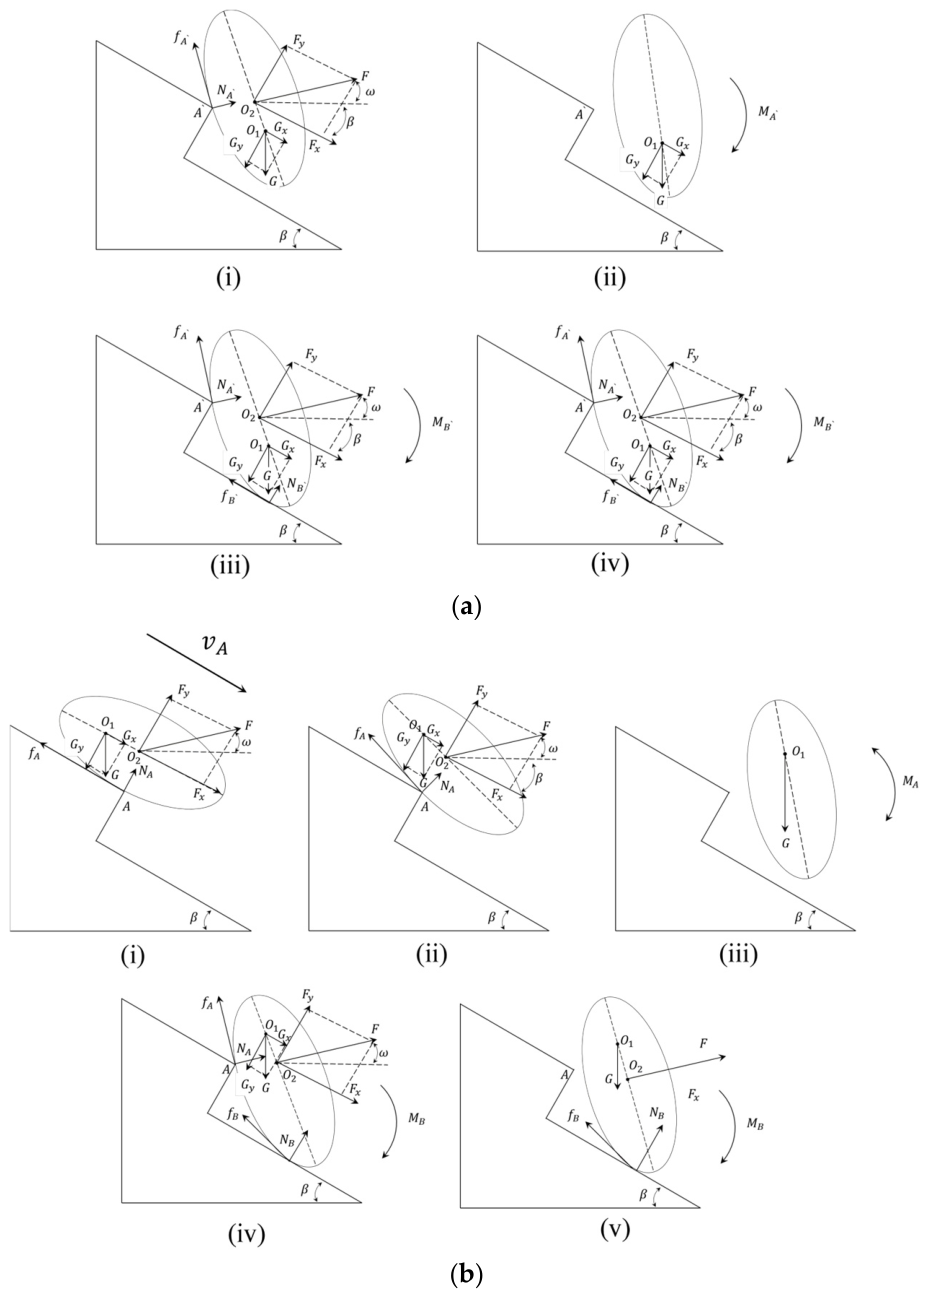
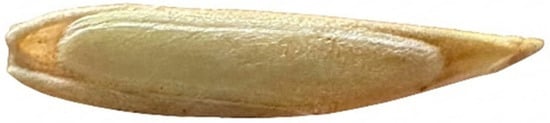
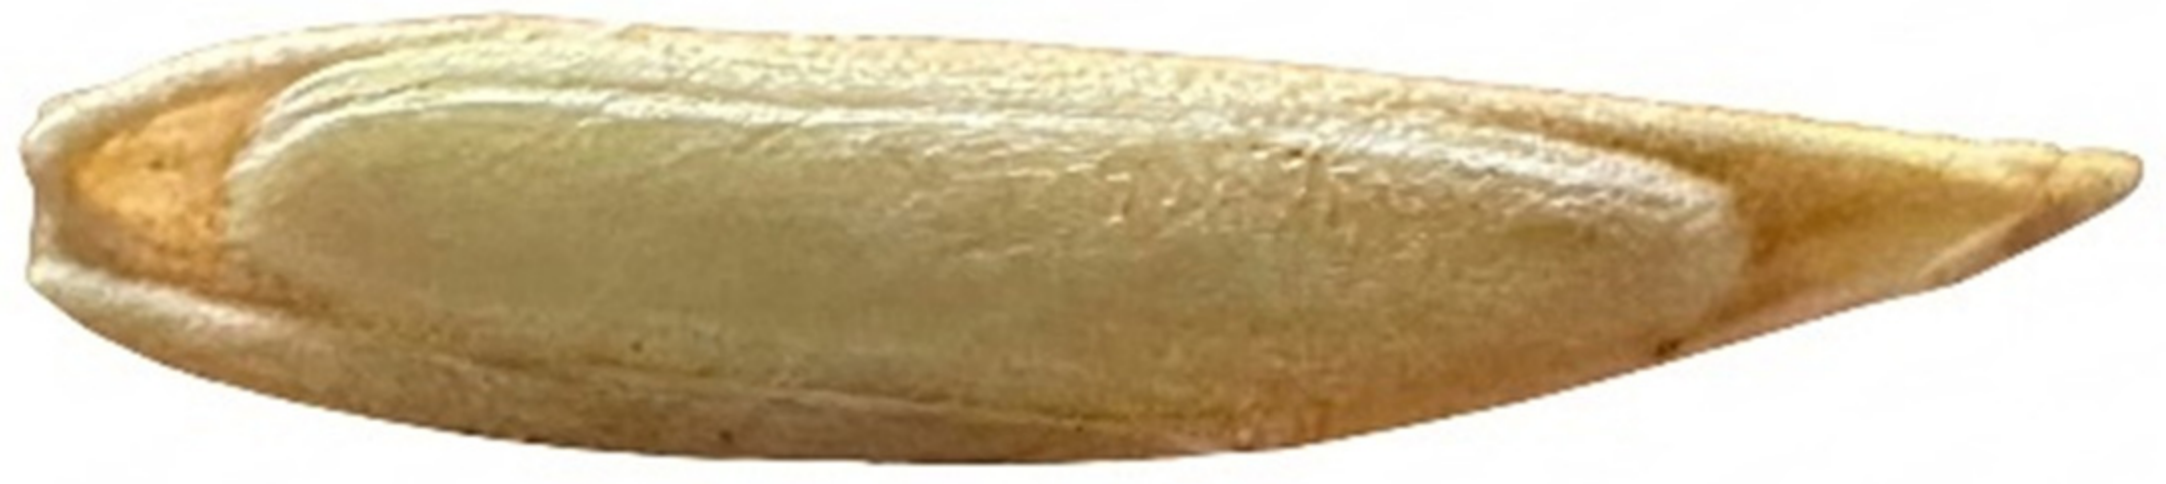
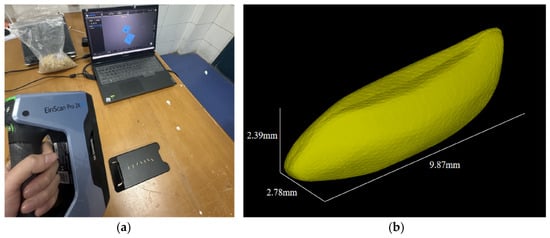
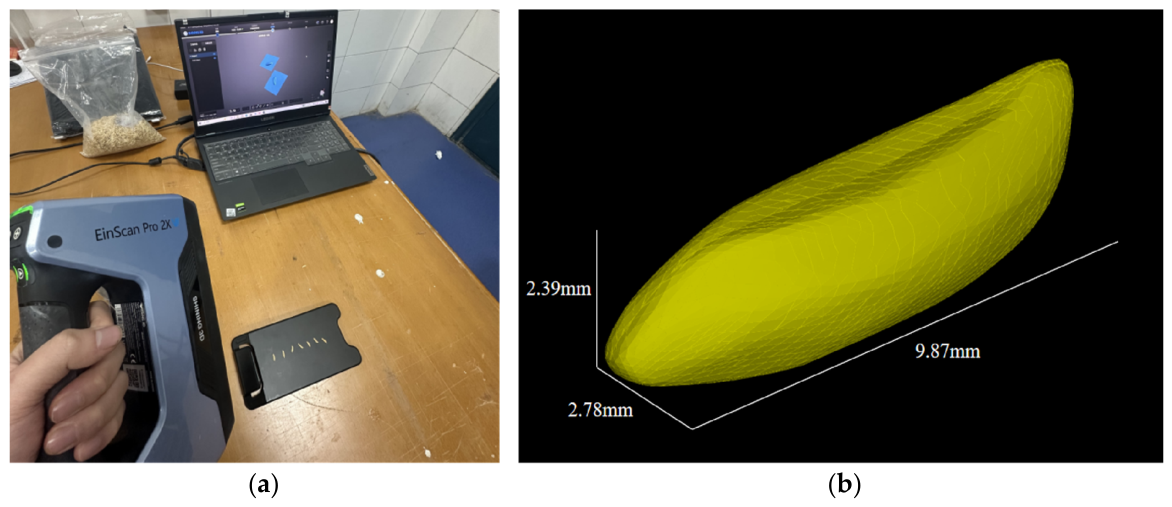
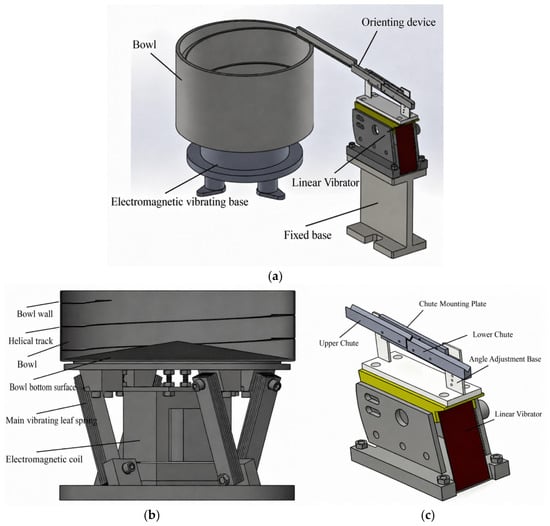
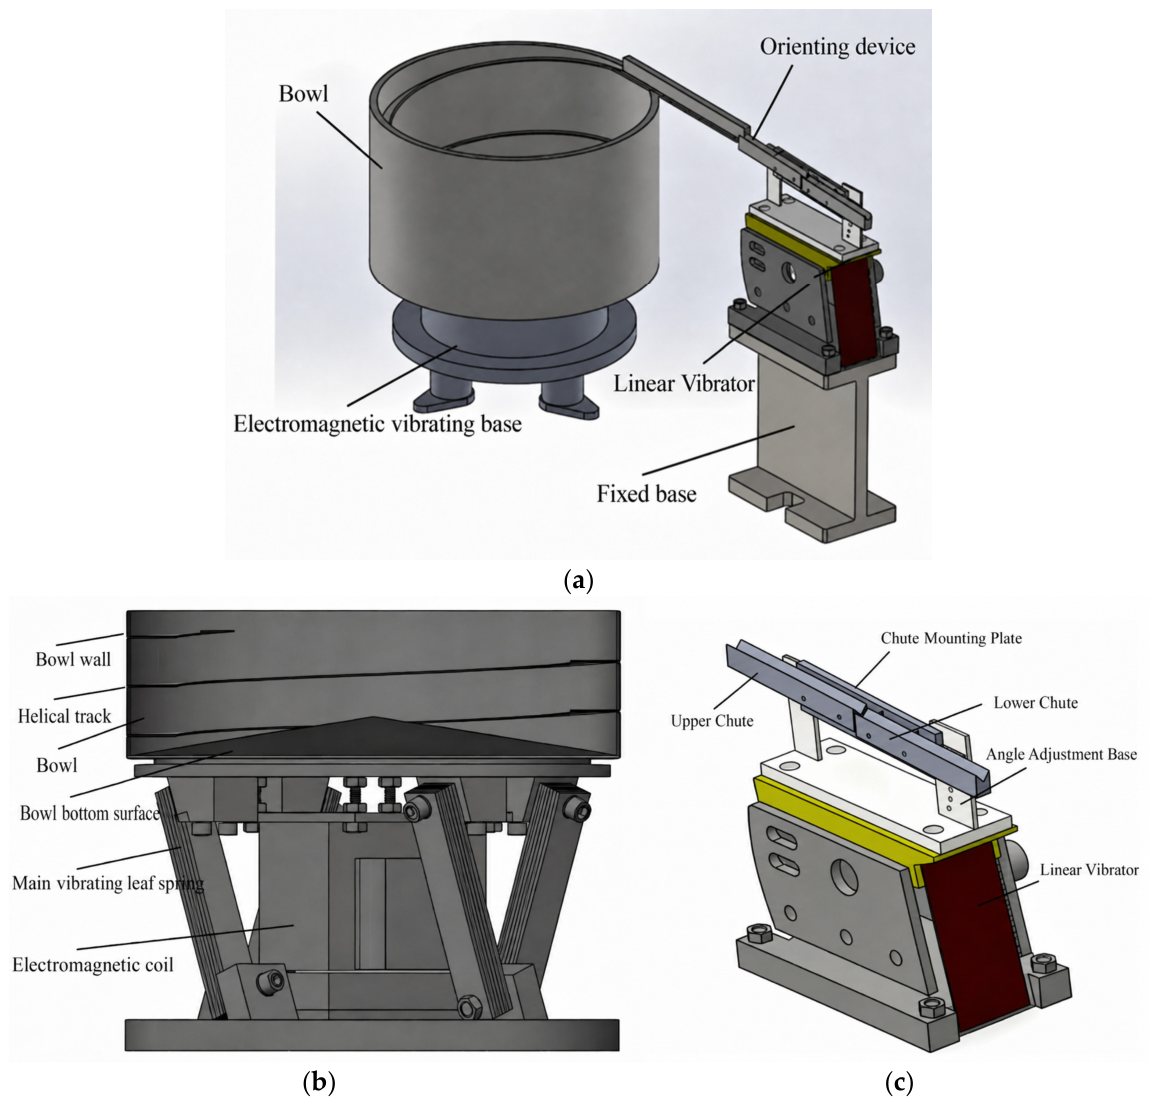
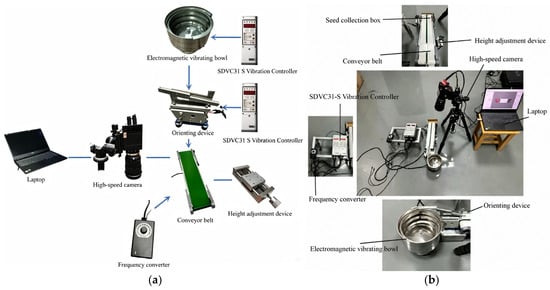
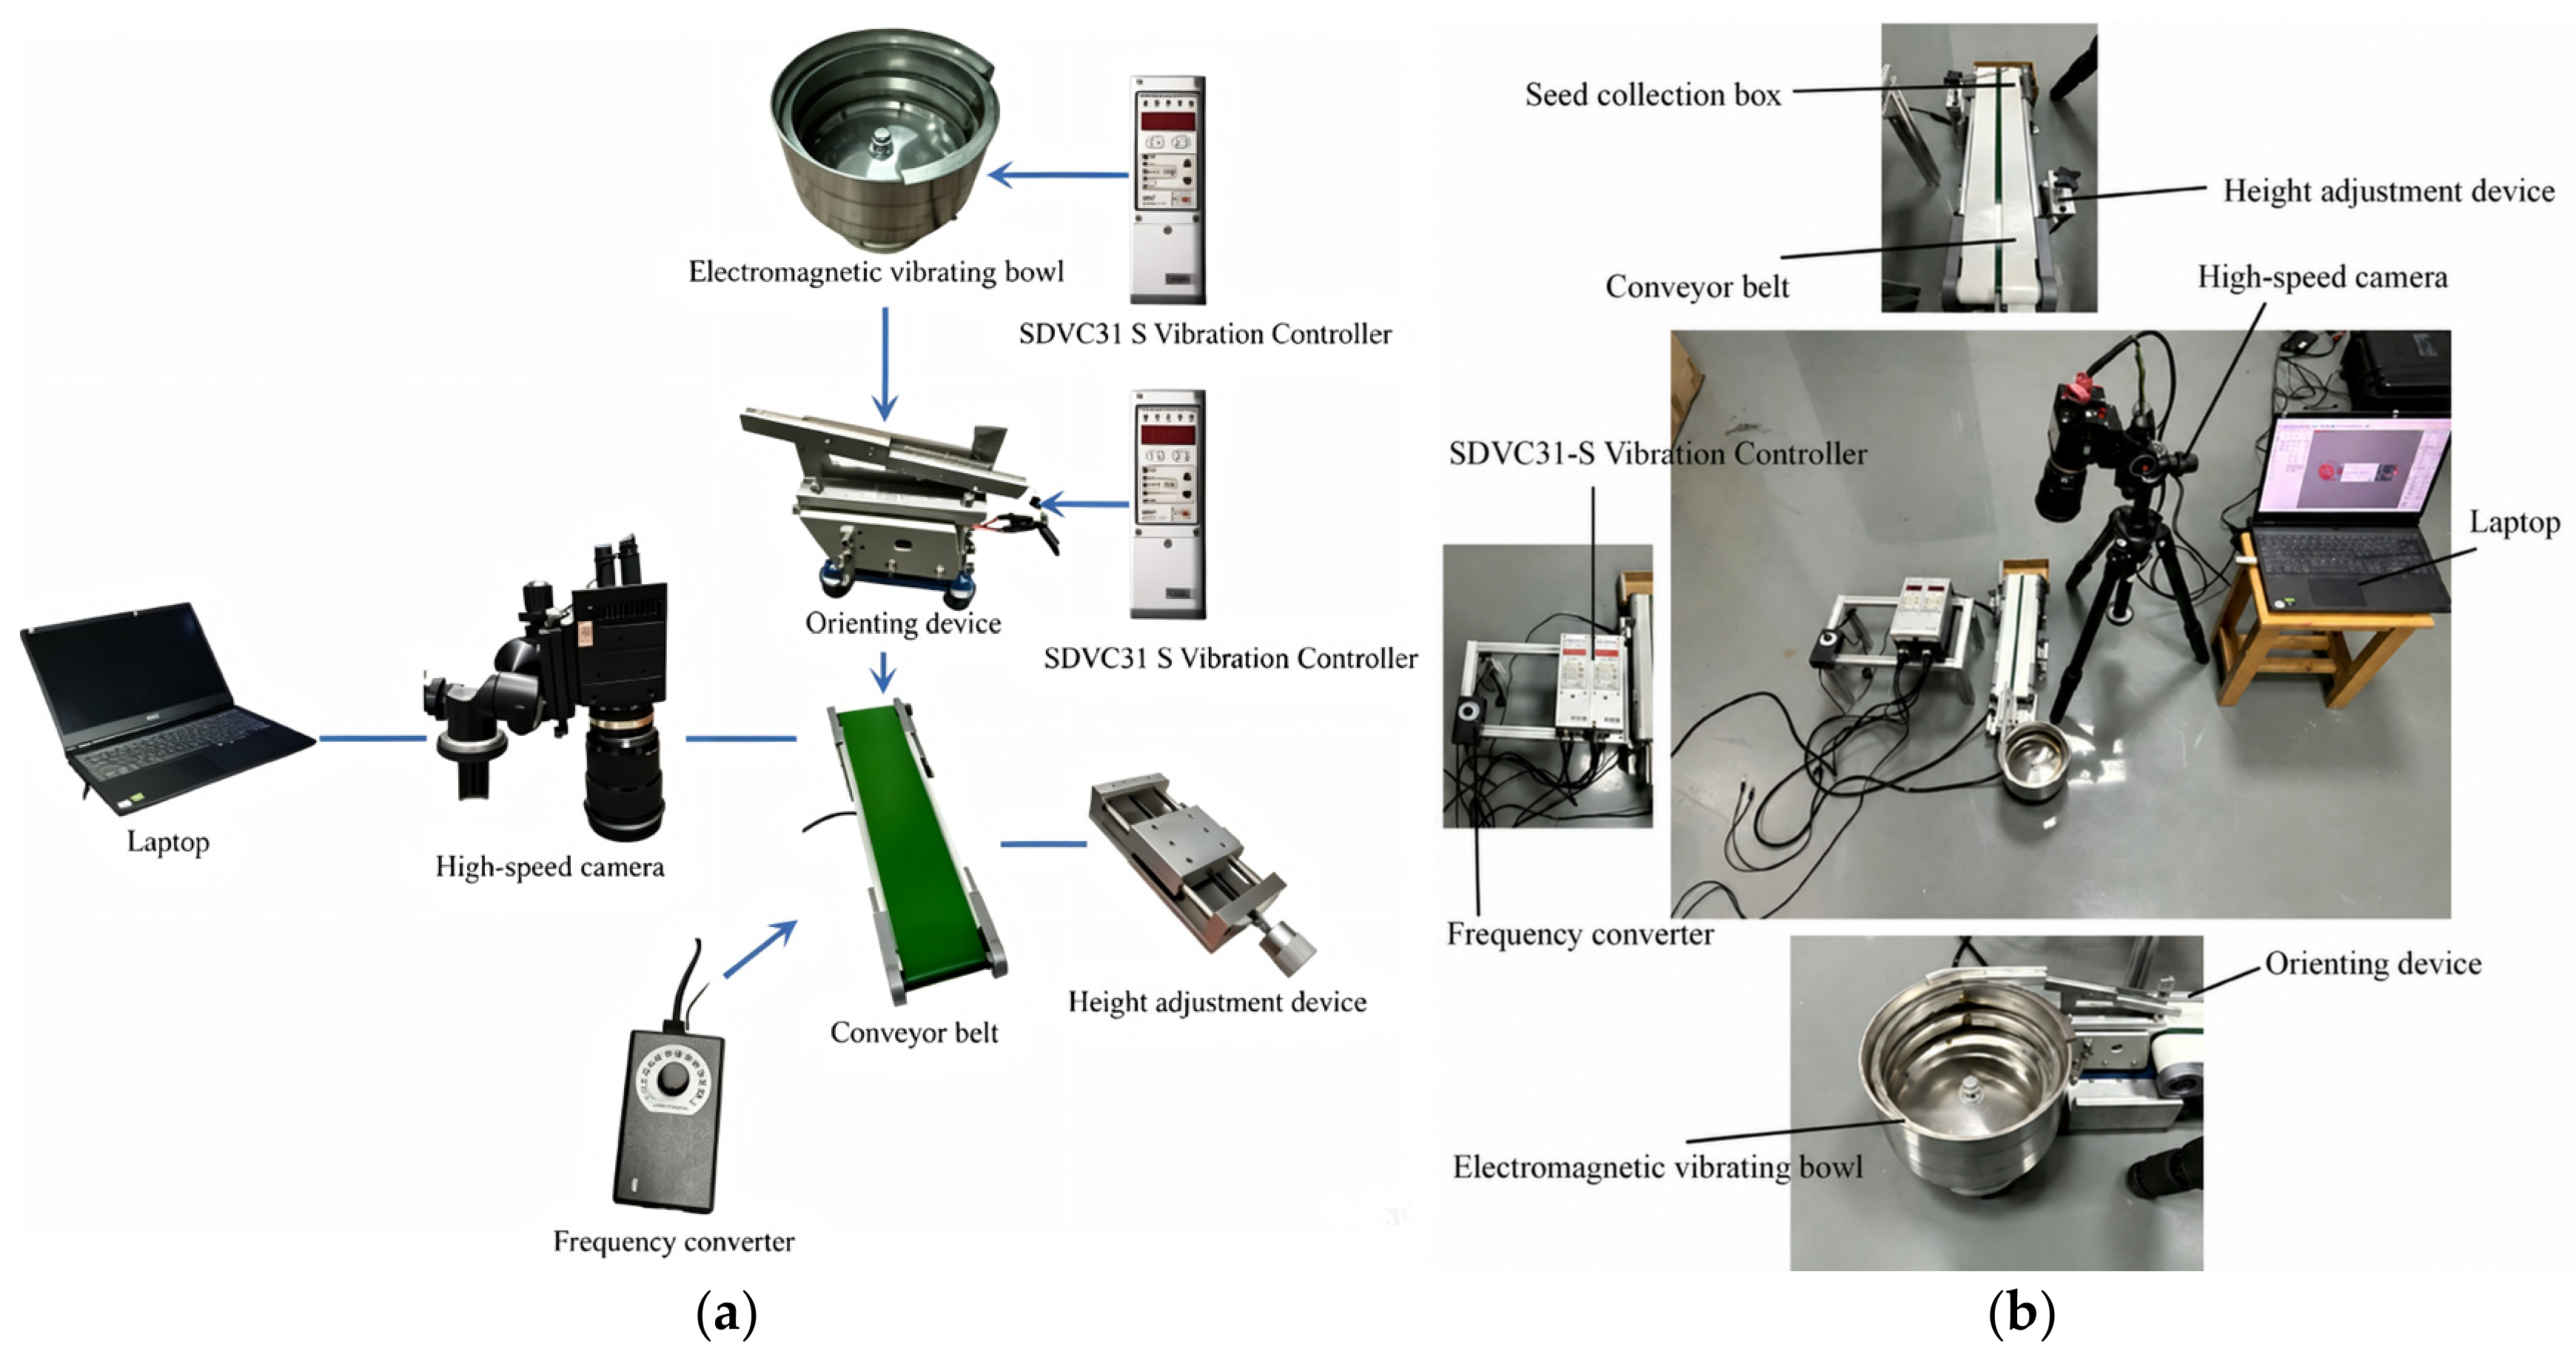
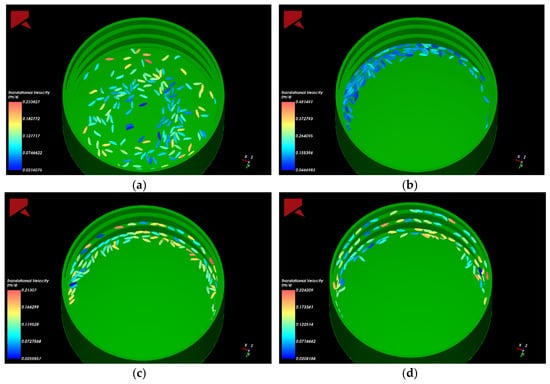
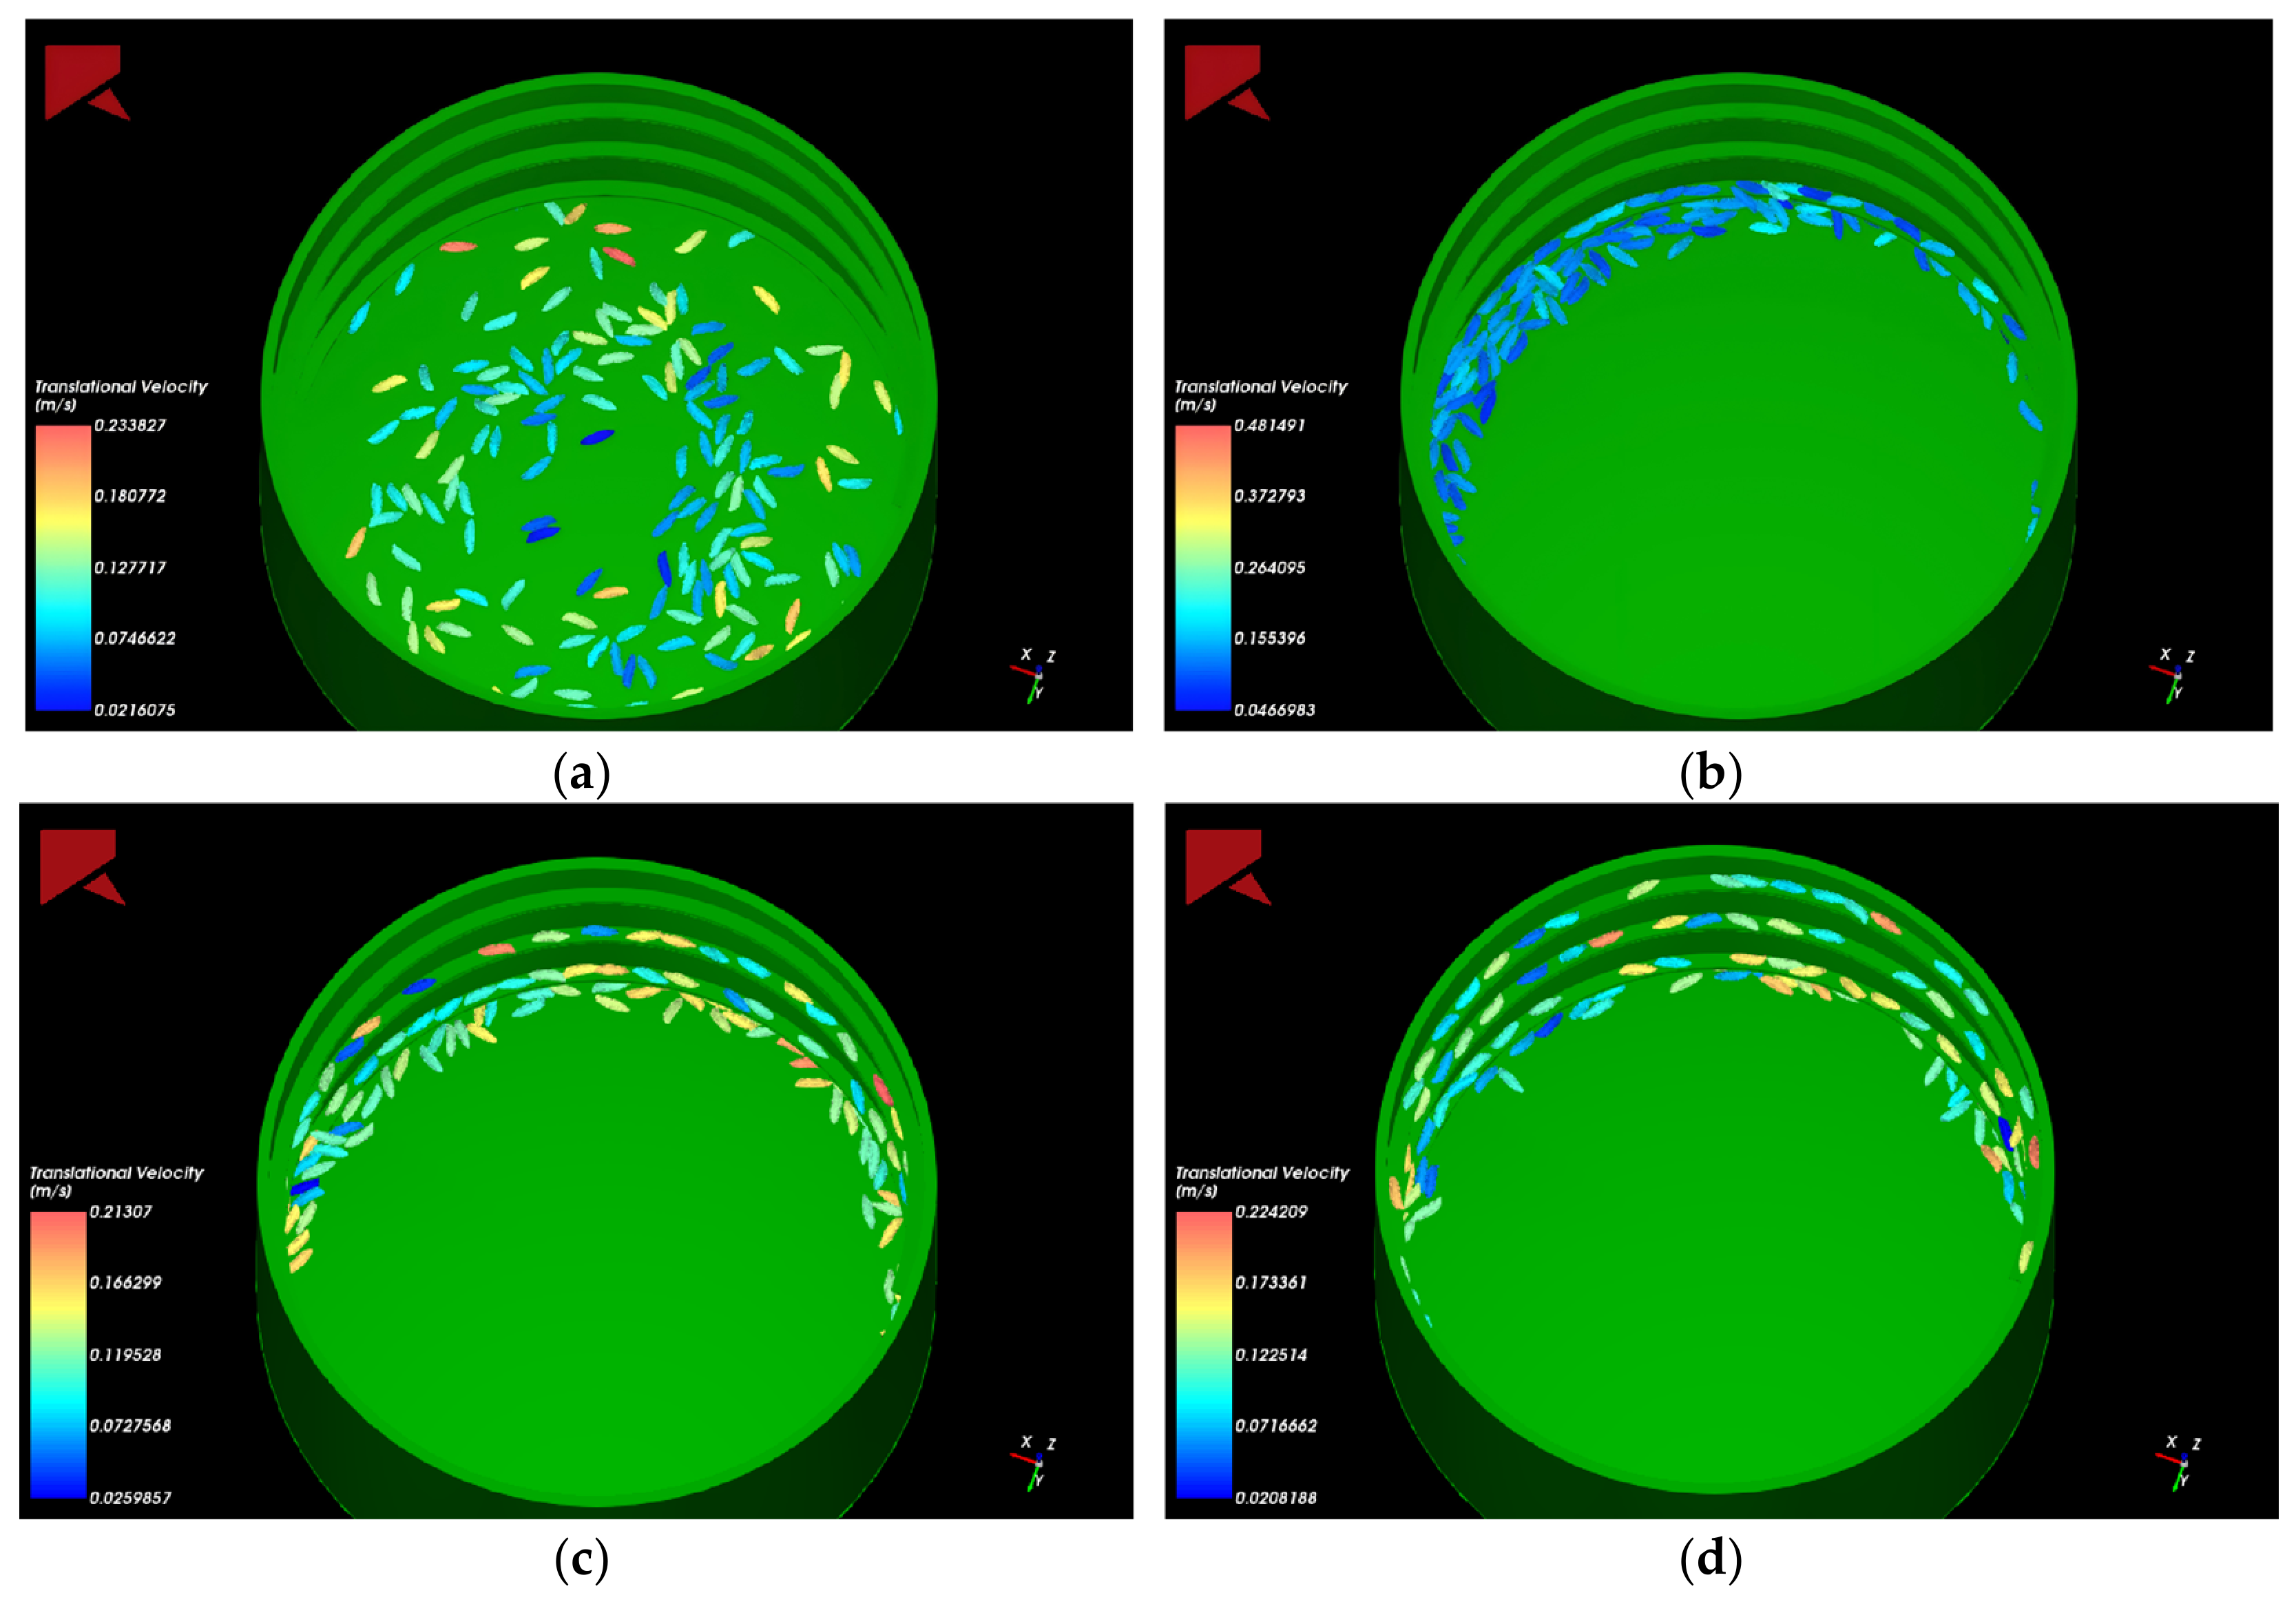
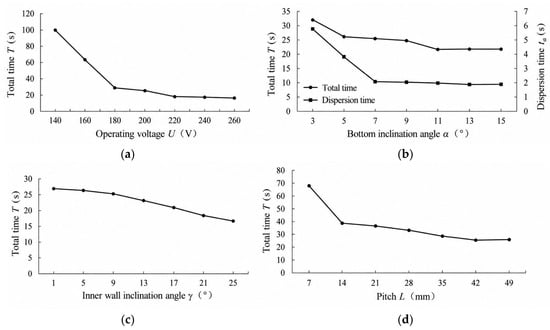
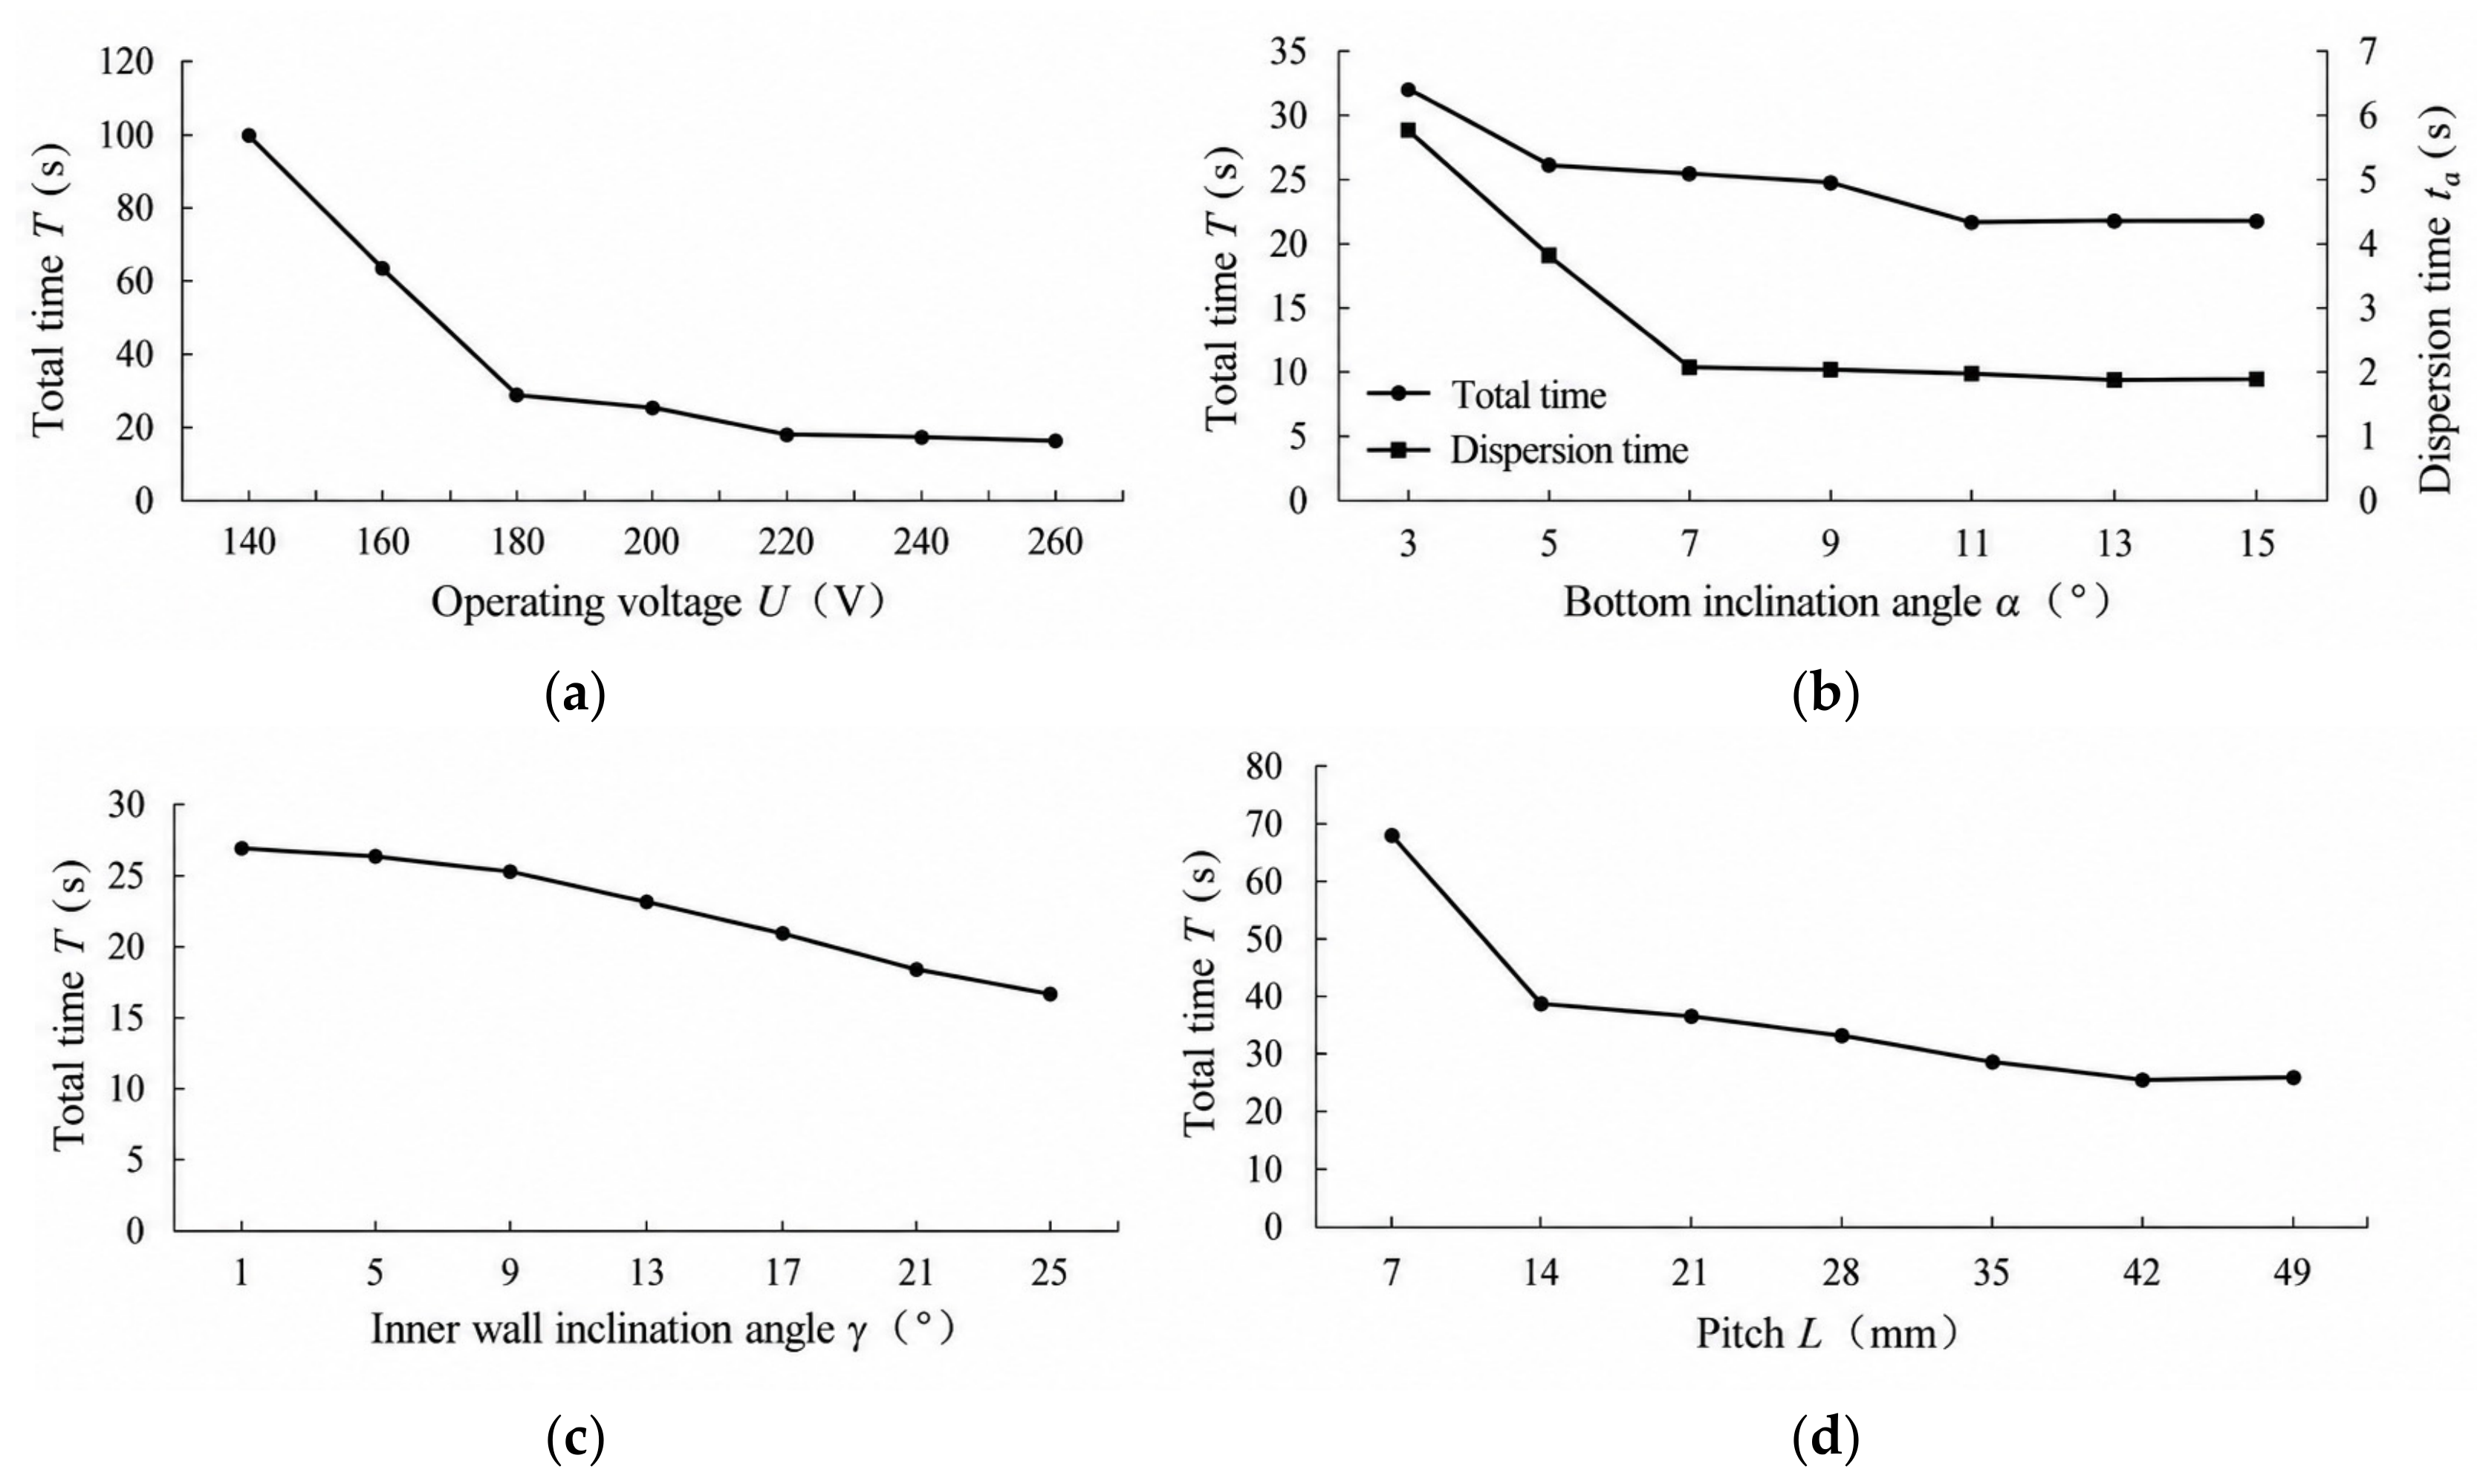
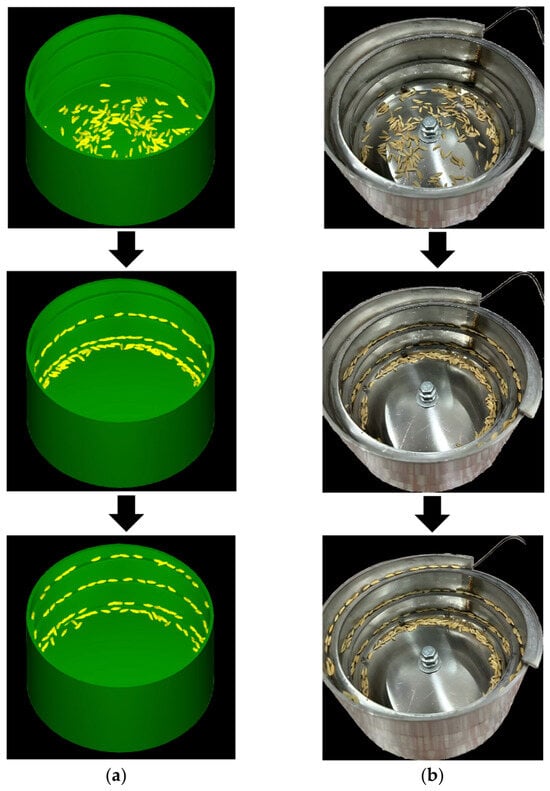
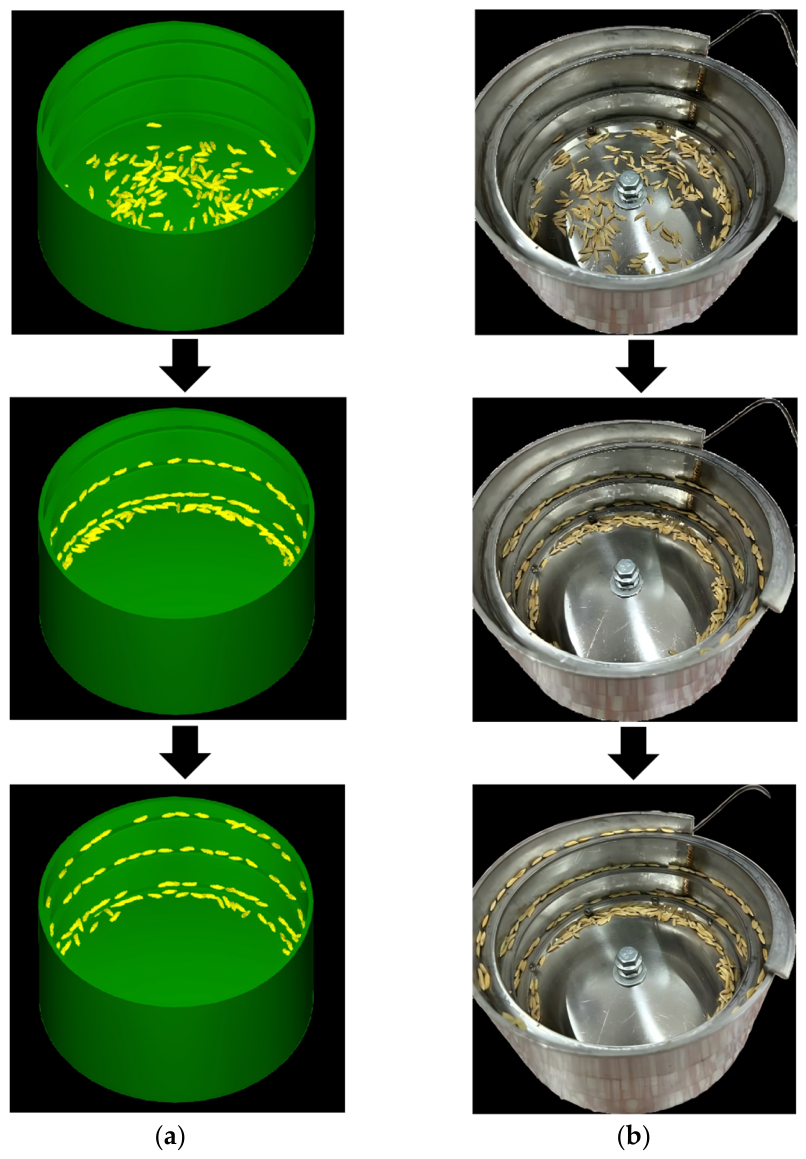
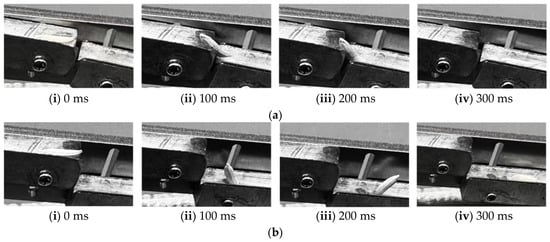
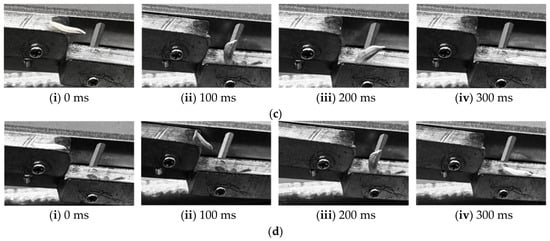
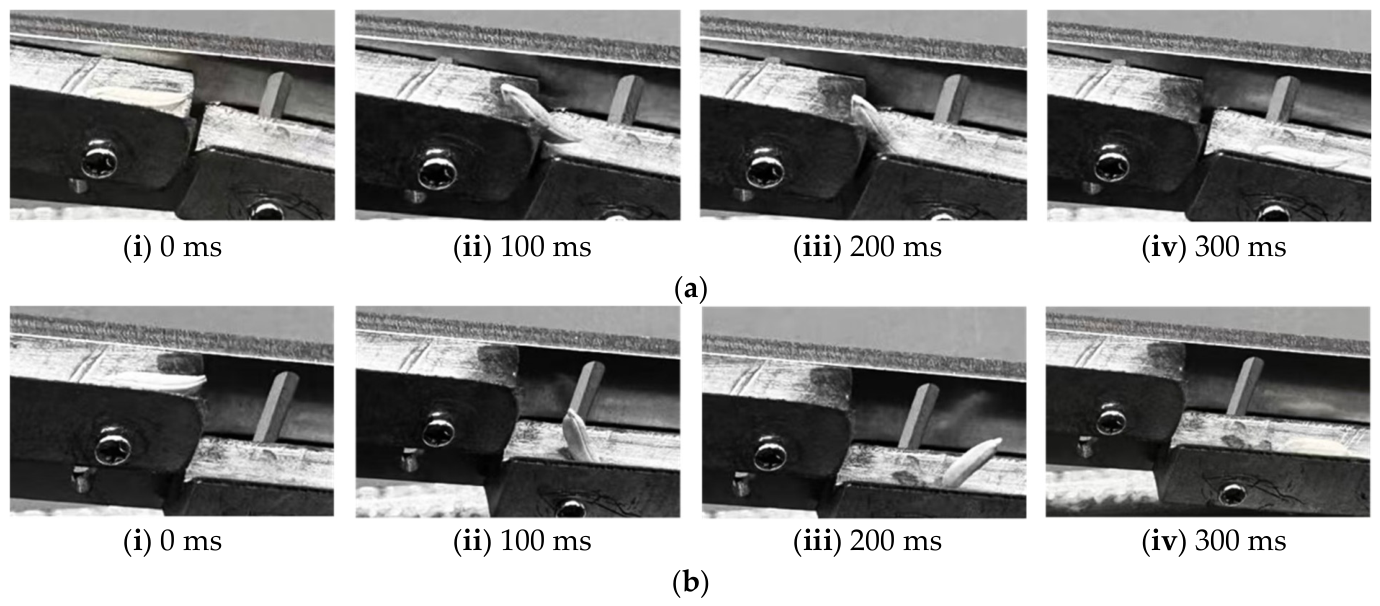
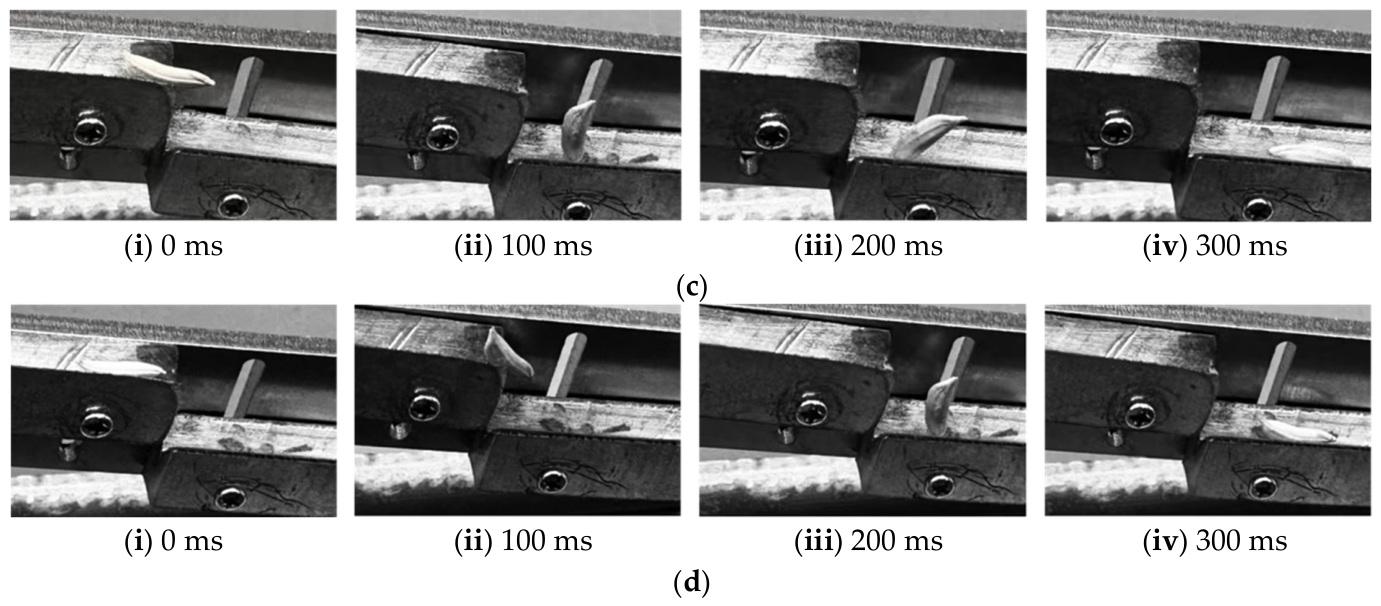
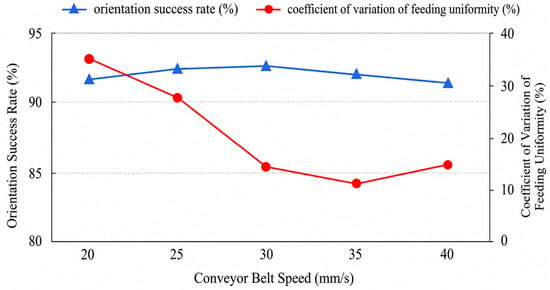
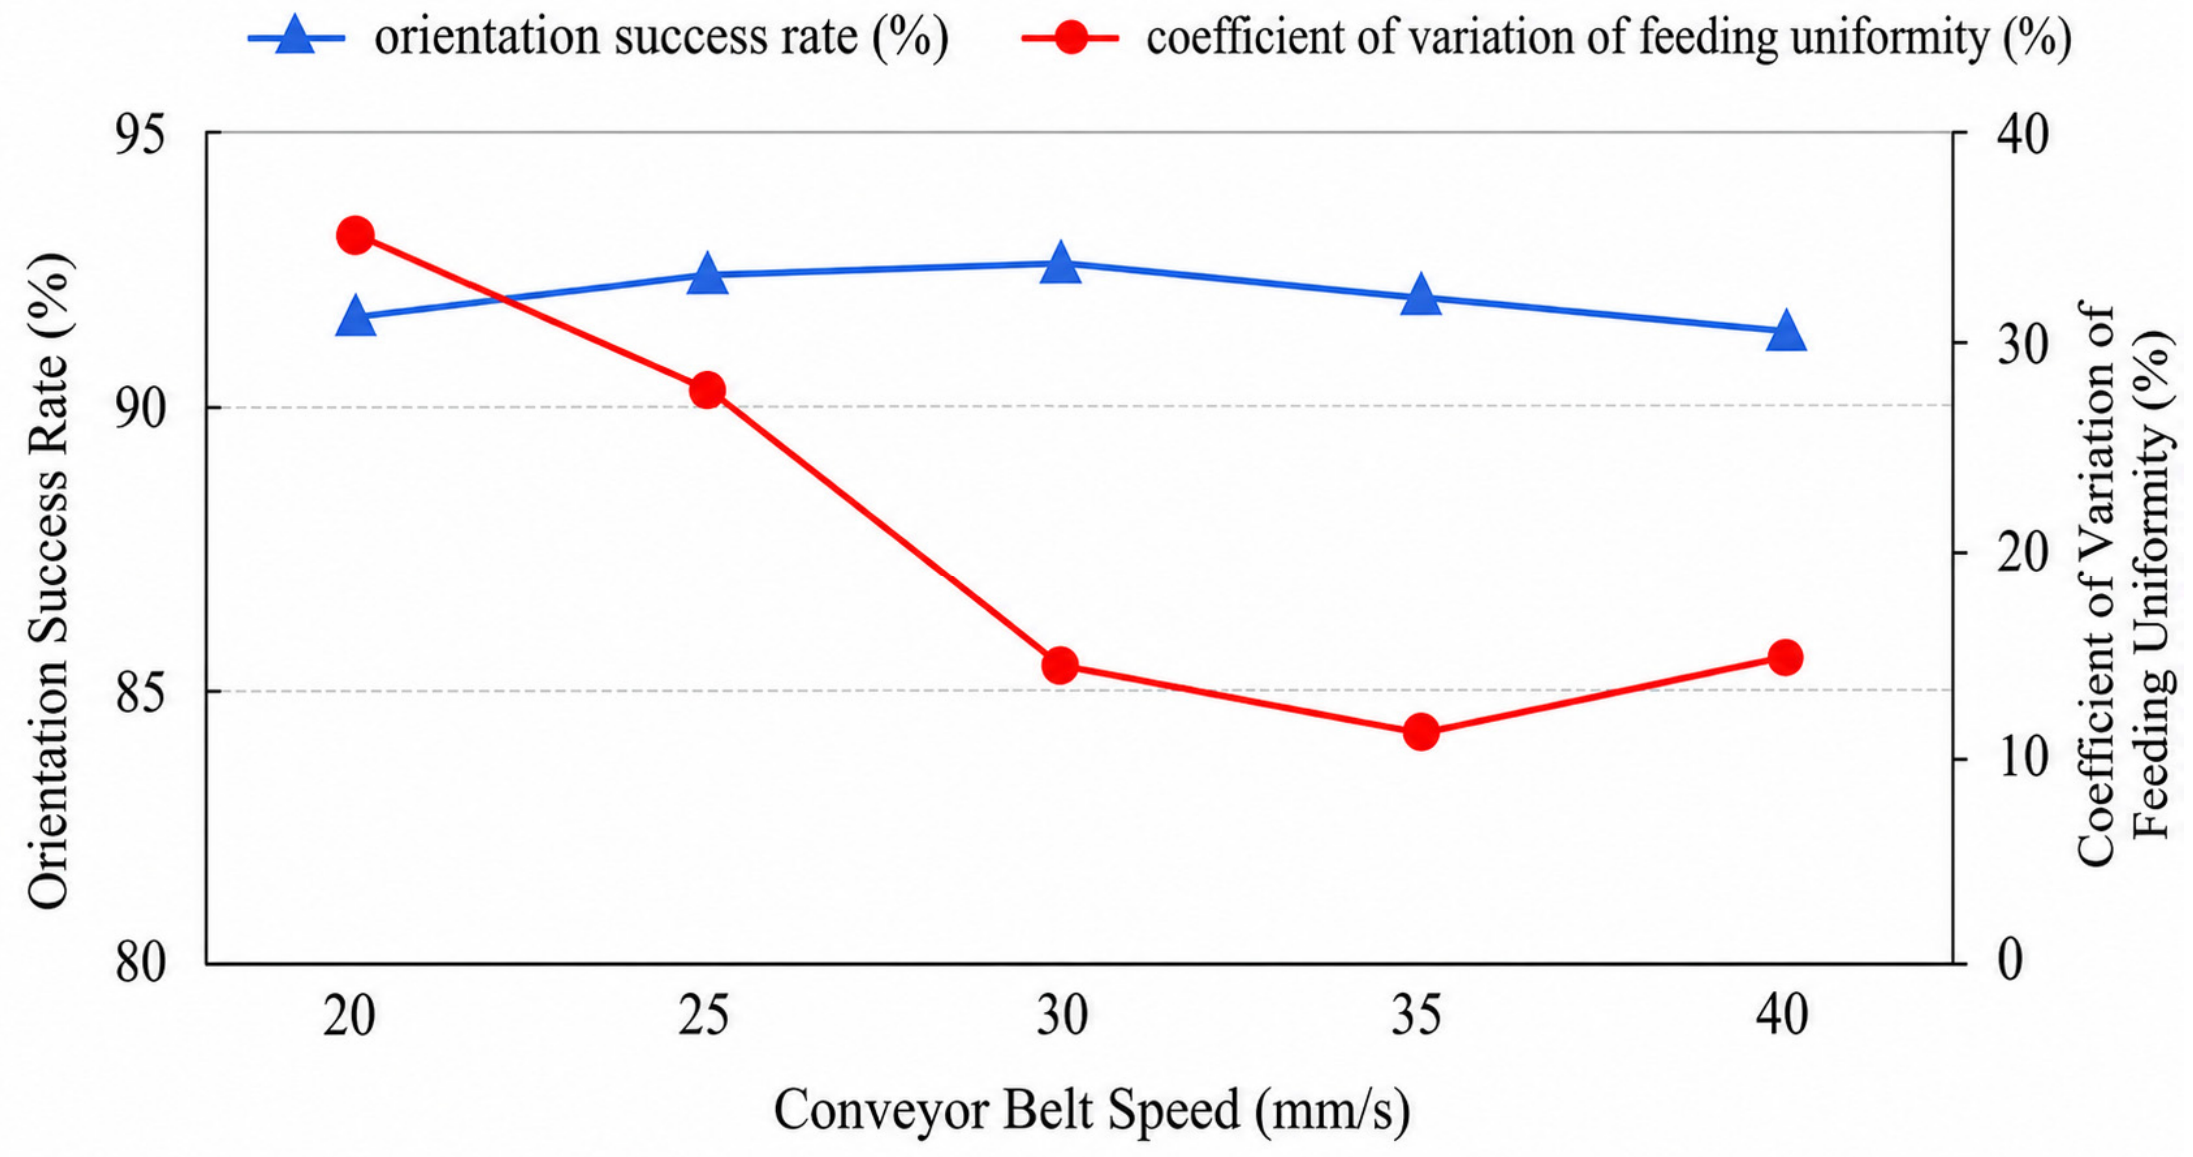
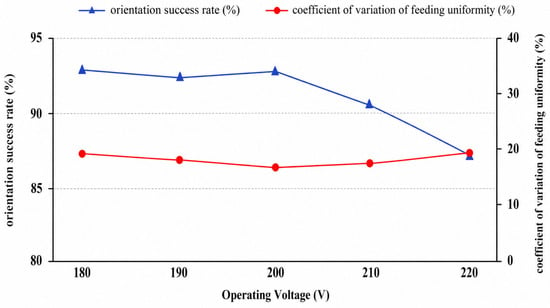
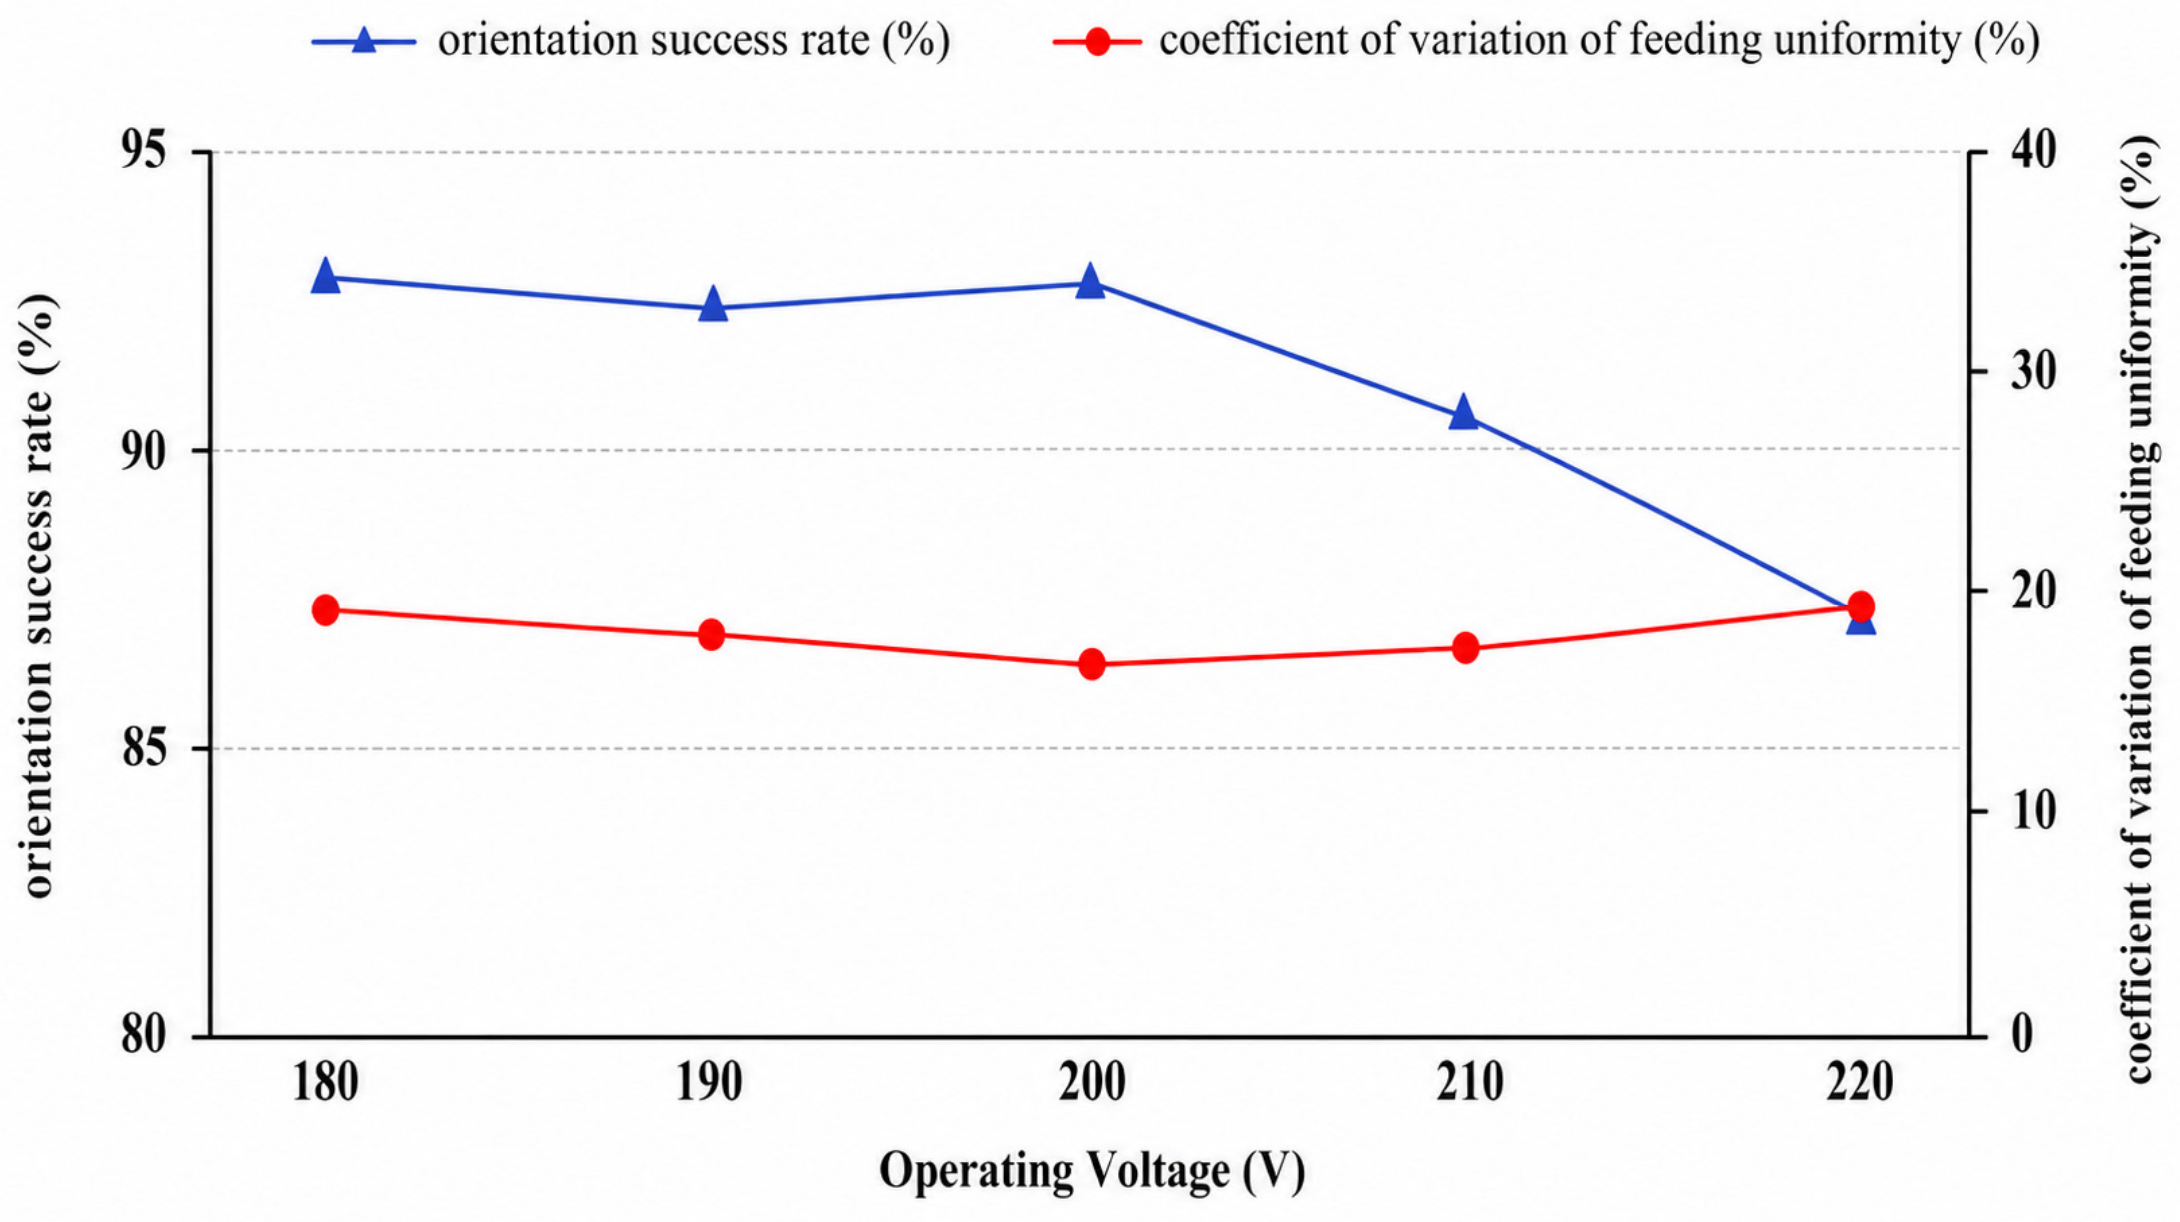
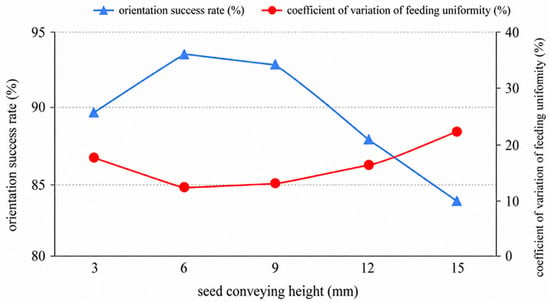
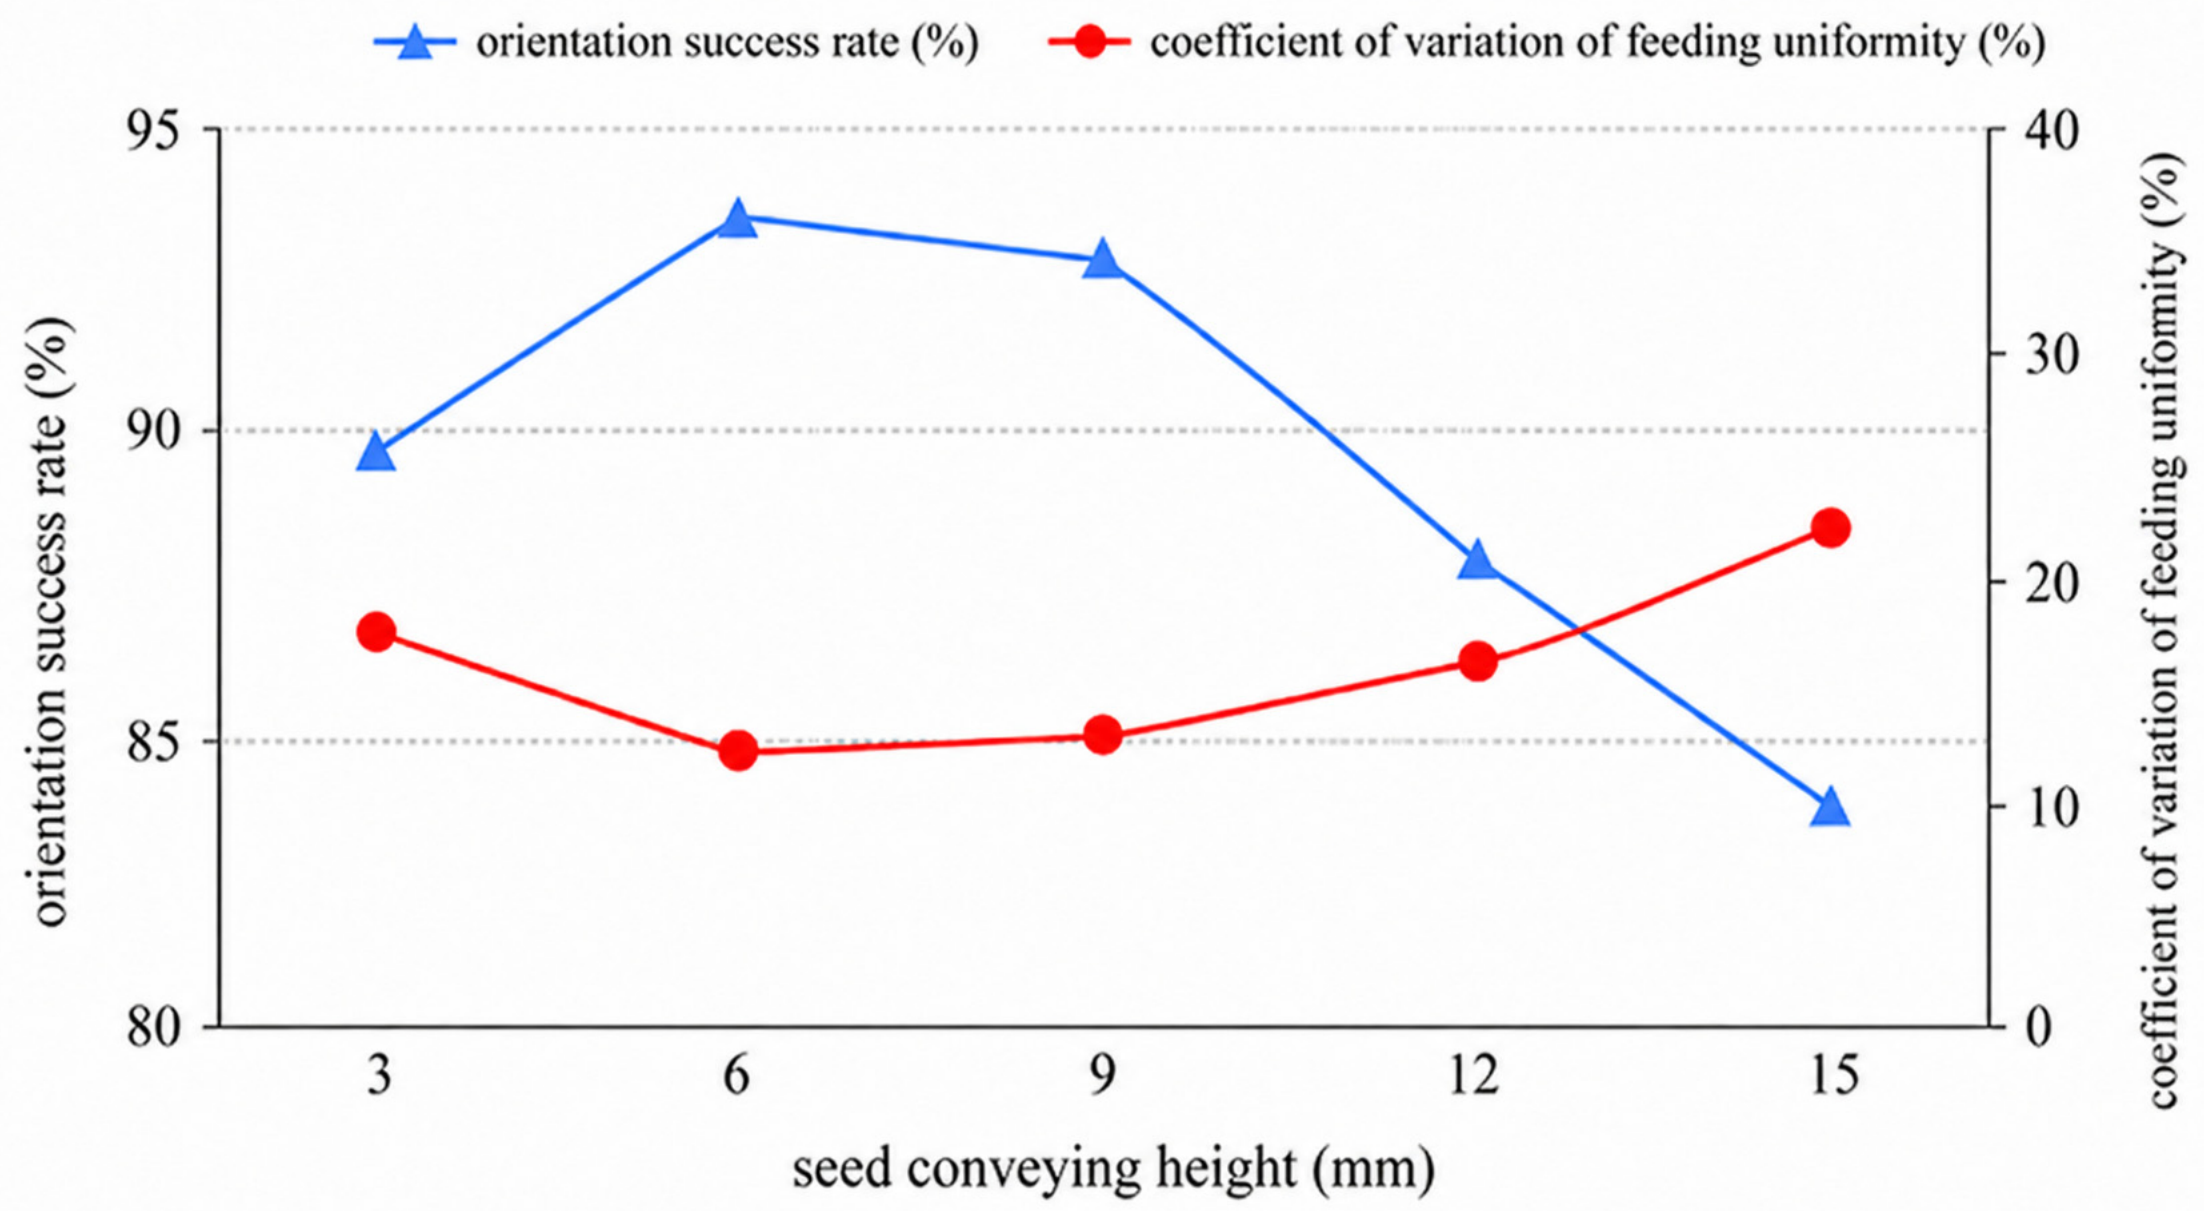
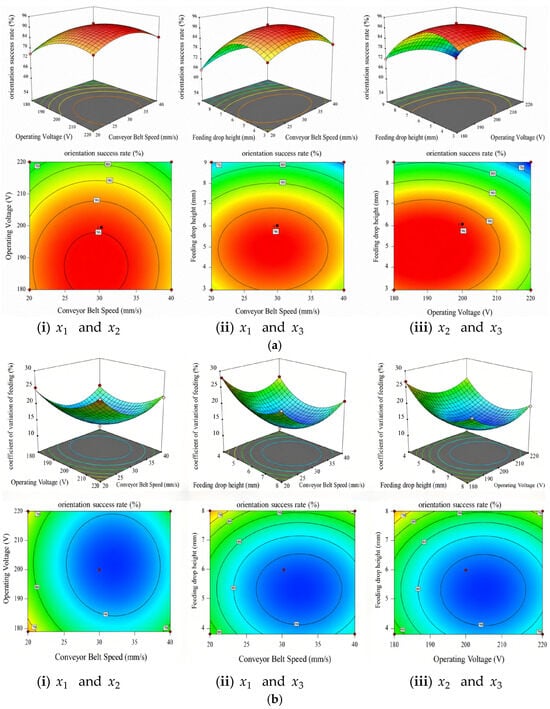
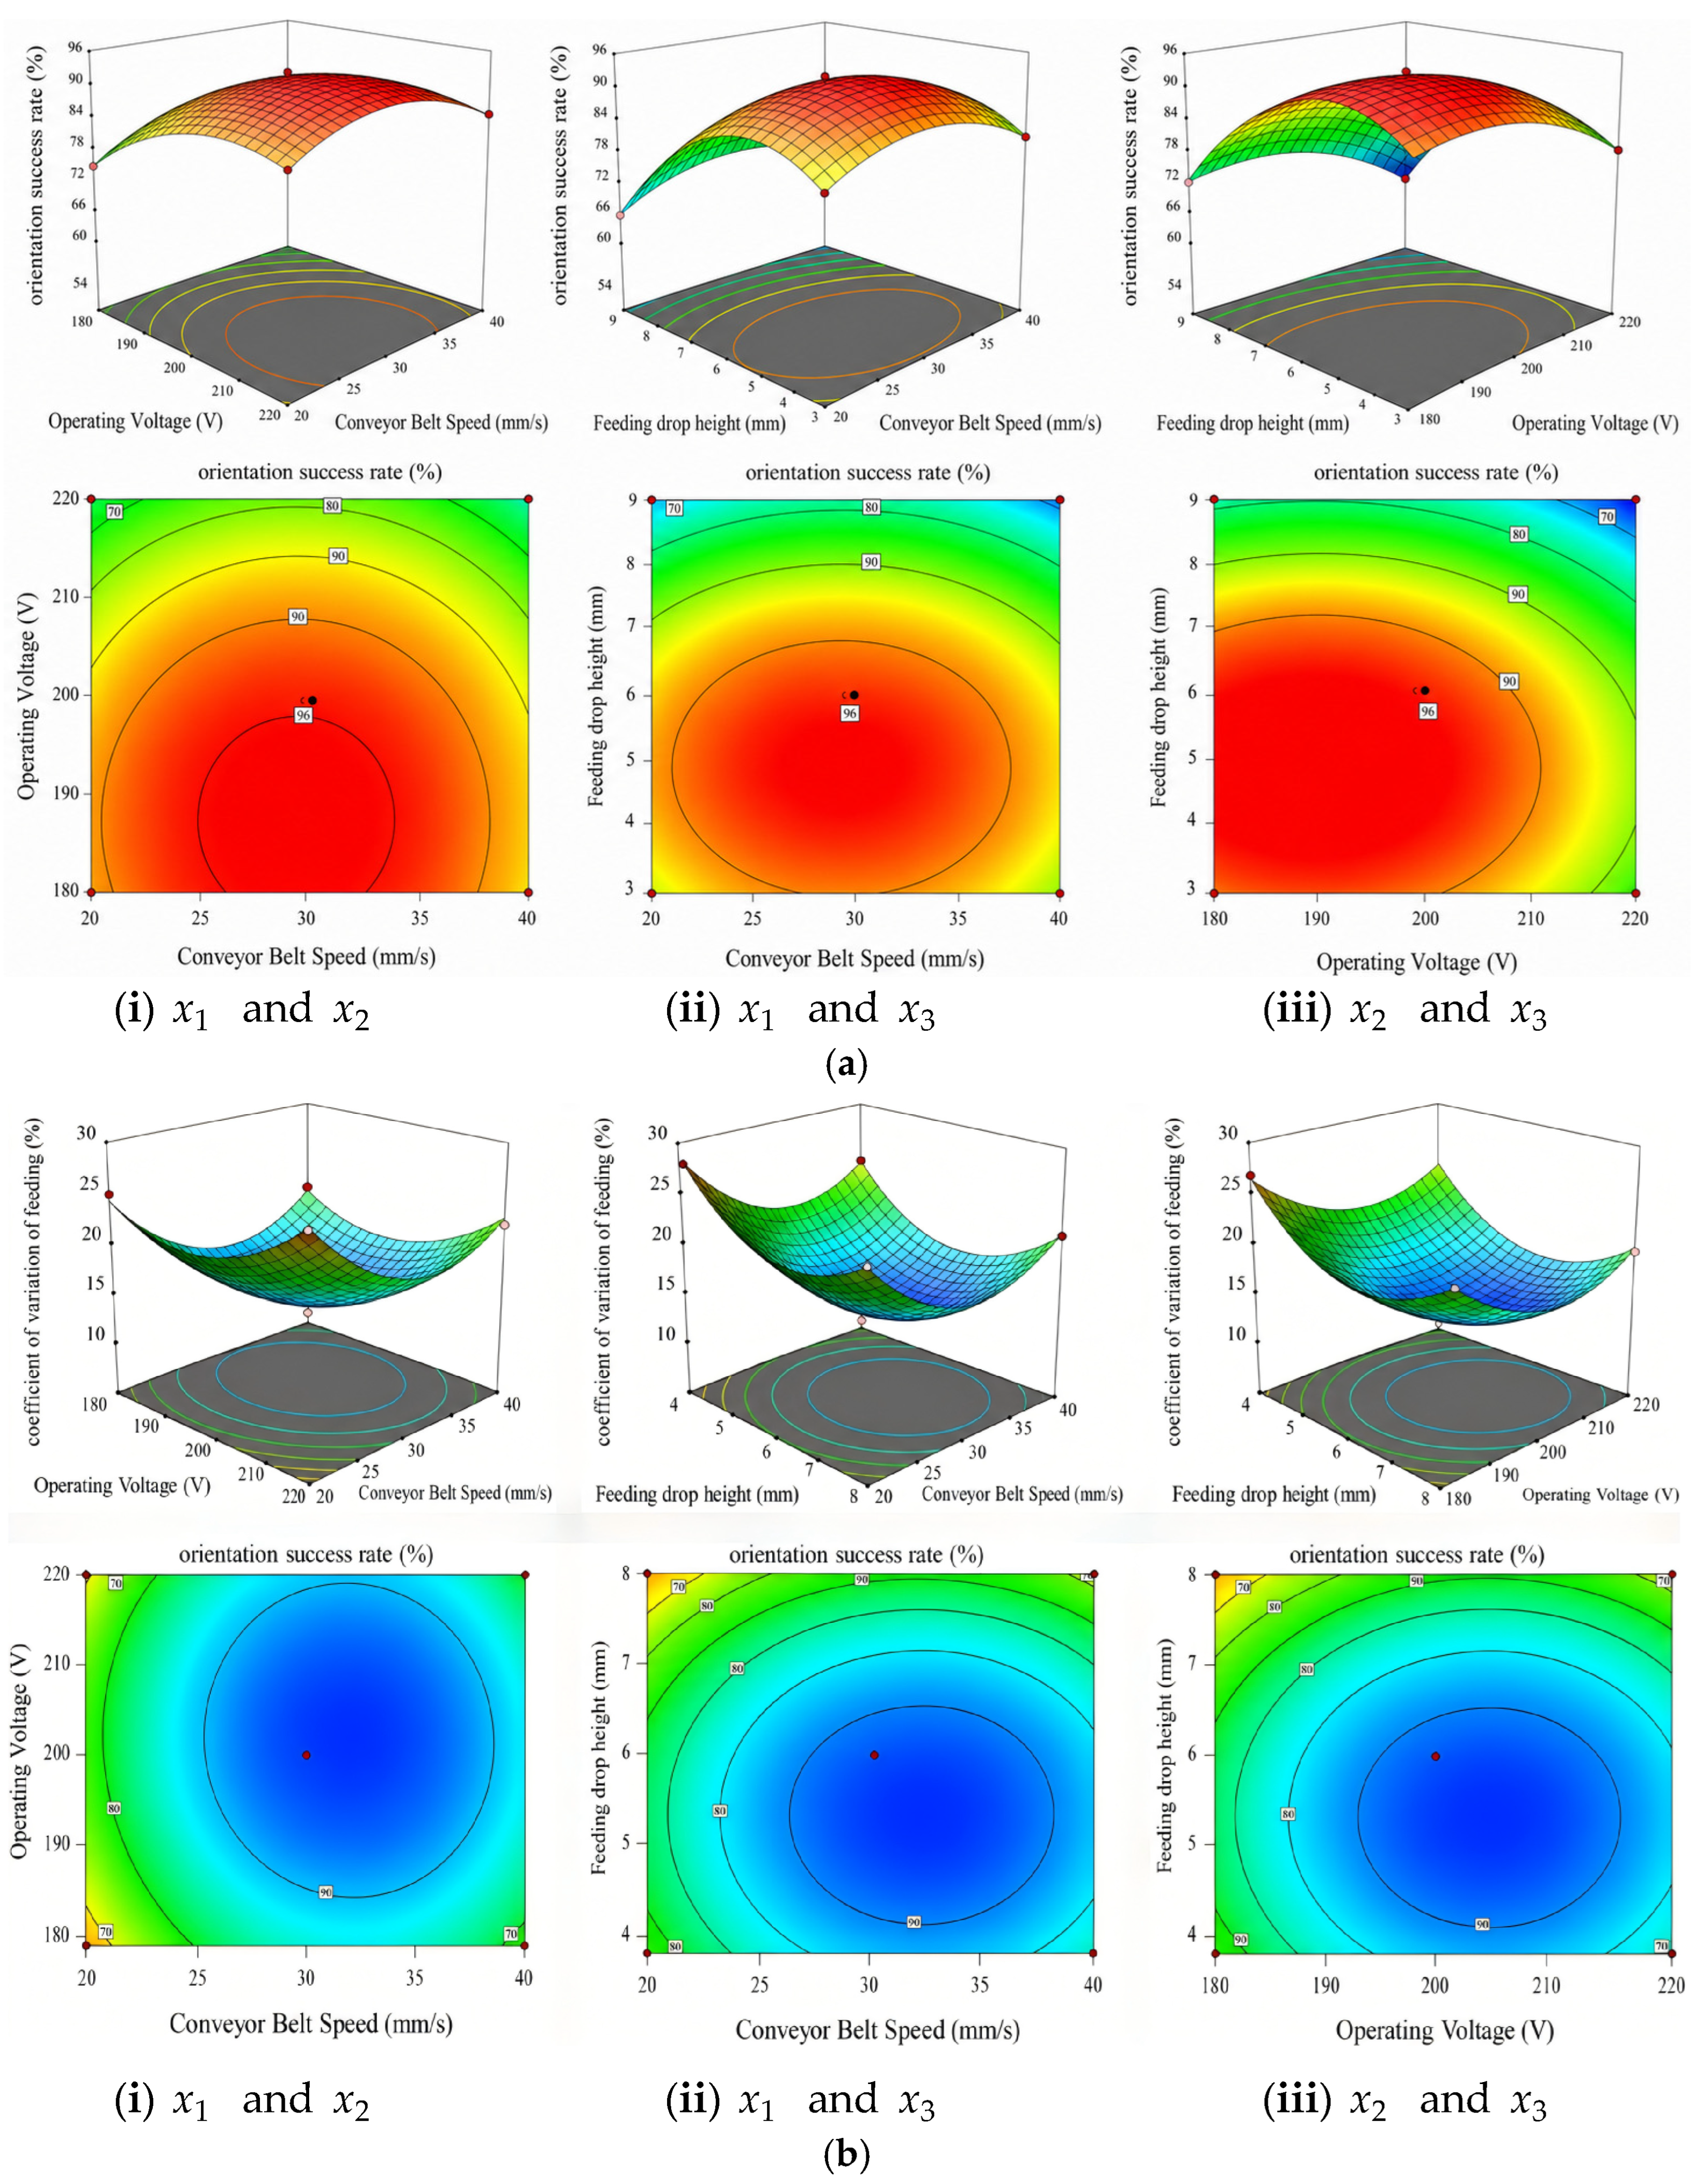
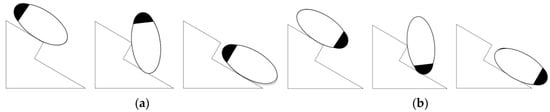

Disclaimer/Publisher’s Note: The statements, opinions and data contained in all publications are solely those of the individual author(s) and contributor(s) and not of MDPI and/or the editor(s). MDPI and/or the editor(s) disclaim responsibility for any injury to people or property resulting from any ideas, methods, instructions or products referred to in the content. |
© 2026 by the authors. Licensee MDPI, Basel, Switzerland. This article is an open access article distributed under the terms and conditions of the Creative Commons Attribution (CC BY) license.