


Abstract
Laser weeding offers significant advantages over conventional weed control methods; however, its practical deployment in maize fields remains challenging due to dynamic target variations, imprecise weed localization, and inefficient laser execution. In this study, a closed-loop laser weeding framework was developed for maize fields by integrating visual perception, multi-target tracking, safety-constrained decision making, and priority-based laser scheduling to achieve accurate and efficient weed treatment under dynamic field conditions. The system consists of visual perception, galvanometer control, and laser emission modules. ByteTrack was introduced to achieve stable ID assignment and continuous position feedback for weed targets, thereby reducing repeated ineffective irradiation and energy consumption. A target scheduling strategy constrained by a maize safety zone was further developed. An adaptive elliptical safety zone was constructed to screen candidate weed targets and optimize their priorities. By incorporating safety-zone modeling, galvanometer transition cost, and target urgency, the proposed strategy optimizes the laser striking sequence while reducing crop-injury risk and improving target-selection efficiency. The method was deployed on the developed platform and evaluated through field experiments under different travel speeds and illumination conditions. The results showed that the average weeding rate, maize seedling injury rate, and weed regrowth rate were 83.67%, 2.23%, and 5.23% under three travel speeds, and 82.57%, 2.63%, and 4.87% under three illumination levels, respectively. These results demonstrate that the proposed method enables stable weed tracking and efficient laser weeding while improving real-time performance, operational safety, and intelligent decision making. This study provides a deployable technical solution for precision laser weeding in field applications.
1. Introduction
Weeds compete with crops for nutrients and light [1], thereby severely affecting crop yield and quality [2,3]. Manual weeding is labor-intensive and inefficient, making it difficult to meet the demands of large-scale maize cultivation [4,5]. Although conventional chemical weeding is highly efficient, its long-term use has led to environmental pollution and herbicide resistance [6,7,8]. Mechanical weeding offers advantages in terms of environmental sustainability, but it is prone to seedling injury and is often constrained by operational efficiency [9,10]. Therefore, the development of green and efficient weeding technologies has become an urgent requirement for sustainable agricultural development.
Laser weeding technology uses high-energy laser beams to burn weed tissues, offering advantages such as non-contact operation, high precision, and environmental friendliness, making it a potential alternative for sustainable agriculture [11]. Early studies by Heise [12] investigated CO2 laser-based weeding, designing laser systems for cutting weeds and establishing energy consumption models based on weed dry mass. Subsequently, Marx et al. [13] evaluated the inhibitory effects of a 10,600 nm CO2 laser on monocotyledonous and dicotyledonous weeds at different growth stages, developed weed thermal injury models, and elucidated the relationship between laser power and exposure time. Rakhmatulin et al. [14] designed a low-cost device for precise laser spot positioning and developed a decision-making model for weeding devices. Mathiassen et al. [15] studied the effect of laser irradiation on the apical meristems of weed seedlings, testing two laser systems and spot distances, and applied different energy doses by varying exposure times, demonstrating that targeting apical meristems significantly slows weed growth. Xiong et al. [16] proposed a static laser weeding robot combined with a fast path-planning algorithm and developed a real-time control platform equipped with machine vision and a gimbal-mounted laser pointer, achieving continuous weeding. These studies collectively indicate that laser energy can effectively disrupt weed apical meristems, providing critical support for mechanistic analyses and the development of laser weeding equipment.
In recent years, with the reduction in laser costs and advancements in control technology, laser weeding equipment has gradually progressed toward field applications. Bloomer et al. [17] highlighted that laser weeding combines high efficiency with environmental benefits in both vegetable and field crops. Xuelei W. [18] proposed a laser weeding robot based on a 3UPS–RPU parallel mechanism, utilizing the thermal effect of lasers to eliminate weeds among crops; the study confirmed that the parallel mechanism controlled by linear actuators moves smoothly without abrupt changes or discontinuities, meeting the stability requirements of the laser beam. Vargas et al. [19] introduced an efficient dynamic weeding method that predicts weed positions while the platform is moving to enhance weeding efficiency, and evaluated multiple deep learning architectures to establish the most effective model for detecting and tracking multiple weeds in RGB images. Zhao et al. [20] developed a strawberry-field laser weeding robot based on DIN–LW–YOLO and conducted field trials, with results showing a weed control rate of 92.6% and a seedling injury rate of 1.2%, meeting agronomic requirements for mechanical weeding in strawberry fields. However, energy control, visual recognition accuracy, and dynamic targeting errors remain constraints for field deployment [21].
To address the challenges of operational continuity and coordinated execution in field applications of laser weeding equipment, previous studies have explored related approaches. Xiong et al. [16] noted that existing laser weeding systems typically require completing image acquisition, target recognition, and localization before performing laser irradiation on weeds; after processing all targets within the current field of view, the platform moves to the next operation location. Du et al. [22] applied an RGB–NIR image fusion method on a laser weeding platform under field conditions, achieving a weed detection accuracy of 82.1% and a laser weeding efficiency of 72.3%. Andreasen et al. [23] reported similar static weeding approaches. These studies demonstrate the feasibility of integrating visual perception with laser weeding. However, under continuous field operation, the system must complete multiple steps—including weed identification, target localization, safety assessment, and laser aiming—within limited time frames. A lack of real-time coordination between perception and laser execution can reduce operational efficiency, cause repeated or missed treatments, and limit effective utilization of operational space. In dynamic field environments, the challenge of laser weeding is not only related to weed recognition accuracy but also to the temporal coordination between perception and execution. During continuous platform movement, weed targets may change their relative positions with respect to the laser actuator due to vehicle motion, vibration, and system latency. If target states cannot be continuously updated, the same weed may be repeatedly selected for irradiation, or the laser may be activated when the target is not optimally aligned. These redundant operations reduce energy utilization efficiency without improving weed control effectiveness. Therefore, the repeat strike rate, which reflects redundant laser operations caused by insufficient target-state coordination, and execution efficiency should be considered important indicators for evaluating dynamic laser weeding systems. Additionally, frequent stopping or prolonged low-speed operation of heavy platforms in the field may increase soil compaction risk and negatively affect crop growth [24]. Therefore, enhancing continuous perception, target retention, safety constraints, and real-time execution capabilities in multi-target field scenarios remains a critical challenge limiting the broader adoption of laser weeding systems.
However, despite these advances, existing laser weeding systems still face several challenges in practical field deployment. Current research on laser weeding has primarily focused on fundamental perception tasks, such as weed recognition, target localization, and laser irradiation performance under relatively static conditions, while limited attention has been paid to dynamic target changes during platform movement. In particular, the integration of continuous weed tracking, crop safety constraints, and intelligent scheduling of multiple weed targets into a unified real-time framework remains insufficiently explored. Although multi-target tracking techniques have achieved substantial progress in computer vision, their application in laser weeding systems for maintaining target continuity, preventing redundant strikes, and improving operational stability remains limited. Regarding crop protection, existing methods often rely on implicit rules or simple exclusion zones, which may struggle to balance crop safety and effective utilization of operational space. Moreover, in multi-target field scenarios, laser target selection is influenced not only by weed spatial positions but also by execution mechanisms, target deviations, and dynamic changes during operation. Therefore, developing a closed-loop framework integrating perception, decision making, and laser execution is essential for improving the adaptability, efficiency, and reliability of laser weeding systems under real field conditions.
To address these challenges, this study developed a field-deployable laser weeding system aimed at high-precision targeted laser weeding. A laser weeding platform was designed and constructed, incorporating algorithms for weed detection and tracking, as well as methods for target scheduling and galvanometer control, replacing static laser operation with dynamic aiming. The main contributions of this work are as follows: (1) construction of a laser weeding platform for maize fields integrating real-time visual perception, target localization, and laser aiming; (2) development of a multi-target weed tracking method based on ByteTrack, providing stable weed IDs and continuous target localization across frames, thereby reducing redundant detection and unnecessary laser strikes; (3) an adaptive elliptical maize safety-zone model developed to exclude high-risk weed targets located close to maize seedlings and to reduce unnecessary protection of non-crop areas.; (4) a priority-based target scheduling method designed to select laser targets dynamically under safety constraints by considering target urgency, galvanometer transition cost, and trajectory stability. Field experiments validate the key performance of the system, offering a reference for the development of laser weeding robots and advancing the application of laser-based weed control technology.
2. Materials and Methods
2.1. Data Collection and Dataset Construction
To construct a dataset suitable for field weed detection and tracking tasks, both static images and continuous video data were collected from June to August 2025 in the standardized experimental fields at Jilin Agricultural University. Data were collected under real field conditions encompassing varying illumination conditions and weed distributions. Approximately 18 min of continuous RGB video was recorded using the using an Intel RealSense D435i depth camera (Intel Corporation, Santa Clara, CA, USA) at 30 frames per second (FPS) to provide temporal information for weed tracking. The recorded videos contained approximately 32,400 raw frames in total. To balance dataset diversity and temporal continuity, video frames were extracted at an interval of approximately 8 frames, resulting in 4000 image samples. In addition, 1712 static field images were manually captured under different crop growth stages and field background conditions. Finally, the dataset consisted of 5712 images, including 4000 video-extracted frames and 1712 static images. All images were annotated using Labelme (version 1.8.6), including bounding boxes for crops and weeds, as illustrated in Figure 1. To ensure annotation consistency, predefined labeling criteria were established before annotation. All labels were manually reviewed after the initial annotation process to correct potential errors, including missed targets and inaccurate bounding boxes. Ambiguous cases caused by target occlusion or unclear boundaries were resolved by referring to adjacent video frames and field conditions. The final annotations were confirmed before model training and evaluation.
Figure 1.
Data collection and processing. (A1–A3) Representative frames extracted from the video sequence.
The dataset includes scenarios involving target occlusion and complex backgrounds, thereby enhancing its representativeness under real field conditions. This dataset provides a reliable foundation for model training and performance evaluation. The dataset was split into training, validation, and test sets at a ratio of 8:1:1.
2.2. Structure of the Laser Weeding Platform
To achieve automatic weed recognition and precise laser weeding, a laser weeding platform based on visual perception and intelligent control was designed. The platform comprises a perception module, an upper-level control module, a lower-level control module, a laser execution module, and a power supply module. The structure of the laser weeding platform is illustrated in Figure 2.
Figure 2.
Structural diagram of the laser weeding platform. (a) Illustrations of each module. (b) Examples of simulation experiments for a laser weeding platform.
The system hardware architecture is shown in Figure 3. The perception module consists of an Intel RealSense D435i depth camera (Intel Corporation, Santa Clara, CA, USA), which is connected to the upper-level computer, a Jetson AGX Orin (NVIDIA Corporation, Santa Clara, CA, USA), via a USB 3.0 interface. The Jetson AGX Orin serves as the core computing and control unit, responsible for running weed detection and target tracking algorithms to achieve weed recognition, spatial localization, and strike target allocation. Subsequently, the system performs coordinate transformation on the three-dimensional coordinates of the weed targets and sends the transformed target position information to the laser execution control module, thereby driving the galvanometer to perform laser aiming and precise point-target strikes.
Figure 3.
System hardware architecture diagram.
The execution control module is centered on the CSG9210V4 controller, primarily responsible for receiving target position information, generating laser execution commands, controlling galvanometer deflection, and managing laser on/off operations. Upon receiving the target coordinates from the edge computing unit, the controller generates control codes for the dual-axis galvanometer based on the target positions and transmits them to the SG7210-B galvanometer controller via a UART communication interface, enabling precise laser spot targeting. Simultaneously, the execution control module performs real-time control of the laser’s on/off state to achieve point-specific irradiation of the target weeds. A 110 W blue laser is employed as the weeding execution unit, equipped with an air-cooling system to enhance stability and safety during continuous operation. The power module uses a DJI mobile power supply, providing regulated DC power to the edge computing unit, execution control module, laser power supply, and galvanometer system. The operation module includes a display screen, mouse, and keyboard for system status monitoring, parameter configuration, and debugging. The control workflow of the laser weeding system is illustrated in Figure 4.
Figure 4.
Control workflow of the intelligent laser weeding system.
After system startup, the depth camera continuously captures RGB images and depth information of the operational area and transmits the data to the Jetson AGX Orin edge computing unit for processing. The edge computing unit runs a weed detection algorithm to identify weed targets and perform pixel-level localization. Simultaneously, a multi-target tracking algorithm associates data across frames, assigning stable IDs to the same weed targets in consecutive frames to maintain temporal continuity during dynamic operations. Subsequently, the system combines the detected weed pixel coordinates with the corresponding depth information to compute the three-dimensional positions of the targets in the camera coordinate system. These positions are then transformed into the galvanometer coordinate system, enabling precise correspondence between weed spatial locations and galvanometer control coordinates.
After coordinate transformation is completed, the edge computing unit calculates the dual-axis galvanometer control codes and laser triggering commands based on the positions of the weed targets in the galvanometer coordinate system. These commands are transmitted via the UART interface to the CSG9210V4 execution control module. Upon receiving the instructions, the CSG9210V4 drives the dual-axis galvanometer according to the communication protocol, enabling the SG7210-B galvanometer to rapidly direct the laser spot to the target location. Once the target is aligned, the CSG9210V4 outputs TTL-level signals to control the laser on/off state, achieving point-specific irradiation of the weed targets. The laser is applied at preset power and exposure time to the weed growth points, inducing thermal damage to the tissue and thereby accomplishing weeding. After processing a single target, the system records the execution status and updates the task queue based on tracking results, proceeding to the subsequent target recognition, scheduling, and laser strike operations.
2.3. Multi-Target Weed Tracking and Safety-Constrained Scheduling
In our previous study, we proposed the YOLO-GFD detection model, which achieved favorable performance in maize and weed recognition tasks under field conditions [25]. However, conventional object detection models primarily provide target category and location information from single-frame images, making it difficult to meet the requirements of laser weeding operations for continuous target tracking, crop safety constraints, and strike sequence optimization. Therefore, based on the YOLO-GFD detection model, this study develops a laser weeding method that integrates maize adaptive elliptical safety-zone constraints, weed target tracking, and strike target scheduling.
By incorporating safety-zone constraints into target strikeability assessment and priority ranking, the proposed method enables a laser weeding strategy in which strikes are prohibited within the safety zone and optimized scheduling is performed outside the safety zone. Compared with our previous work, the focus of this study is further extended from weed centroid position estimation to the implementation and validation of elliptical maize safety-zone delineation, weed target tracking, and strike target scheduling modules.
2.3.1. Multiple Target Tracking of Weeds
During actual field operations, maize fields contain diverse weed species, and some weeds are similar to maize seedlings in morphology and color, which may cause feature interference. Meanwhile, during platform movement, the laser weeding system is affected by vehicle vibration, image jitter, and short-term occlusion of weed targets. As a result, single frame detection may lead to target loss, repeated counting, or abrupt changes in strike targets. If laser strikes are performed solely based on single-frame detection results, the operational continuity of the system may be reduced, and the same weed may be repeatedly identified and irradiated. To avoid repeated recognition in adjacent frames and improve operational continuity, this study introduces the ByteTrack [26] multi-target tracking algorithm based on the previously proposed YOLO-GFD detection model. The proposed YOLO-GFD ByteTrack model associates detected weed targets across frames and assigns each weed a stable and unique trajectory ID, thereby enabling continuous perception and state updating of weed targets.
The overall workflow of the algorithm is shown in Figure 5. After detection in each frame, the model divides the detected bounding boxes into two categories, namely high-confidence and low-confidence detections, according to their confidence scores, and matches them with the tracking trajectories from the previous frame. The matching process adopts a joint metric based on Intersection over Union (IoU) and center distance, with matching and trajectory updating performed preferentially in the high-confidence detection set. If matching is successful, the trajectory state is updated; otherwise, the target is regarded as either a new object or a lost trajectory.
Figure 5.
ByteTrack flowchart.
When a trajectory fails to match any detection result for several consecutive frames and its confidence score falls below the predefined threshold, the trajectory is considered invalid and removed from the target list. For low-confidence detection results, the system adopts a secondary matching strategy. Specifically, these detections are first matched with unmatched trajectories; if the distance is smaller than the predefined threshold, the corresponding trajectory is updated. Otherwise, a new trajectory is created for subsequent verification. Finally, the system assigns a unique ID to each weed target, thereby achieving stable target association across frames.
In each image frame, the YOLO-GFD model first outputs the detection results of maize plants and weeds. The set of detection results is denoted as , where the (i)th detected target is defined in Equation (1).
where denotes the target category, represents the center coordinates, width, and height of the bounding box, and denotes the detection confidence score. According to the class labels, the detection results can be divided into the maize target set and the weed target set . In this study, multiple-target tracking is performed only on weed targets to obtain their identity information and trajectory states across consecutive frames. Through the tracking module, the system can not only acquire continuous position variation information of weed targets but also provide a trajectory basis for subsequent suppression of repeated strikes, estimation of target urgency, and optimization of the strike sequence.
2.3.2. Adaptive Elliptical Maize Safety Zoning
After acquiring the trajectories of target weeds, to prevent laser-induced damage to maize seedlings, this study establishes safety zones based on maize detection results and performs strikeability assessments on the tracked weed targets. During the laser weeding process, methods that rely on fixed thresholds or fixed-shape safety zones struggle to adapt the protection area in real time to the morphological variations of maize seedlings at different growth stages, often resulting in zones that are either excessively large or overly conservative. Furthermore, since detection boxes are typically rectangular, directly using them as maize protection zones encompasses substantial non-crop areas surrounding the plants, causing weeds that should be targeted within the rectangle to be misclassified as protected, thereby reducing weeding efficiency.
To address these limitations, this paper proposes a longitudinally extended adaptive elliptical method for maize safety zoning based on the YOLO-GFD-ByteTrack model. In this approach, the core safety area of maize is modeled using an ellipse inscribed within the rectangular detection box, as illustrated in Figure 6. This design allows for more precise and flexible protection that dynamically accounts for the growth stage and spatial morphology of maize seedlings.
Figure 6.
Schematic diagram of adaptive maize safety-zone construction and weed strikeability screening.
Weeds within the safety zone are not subjected to laser weeding, whereas weeds outside the safety zone are targeted with laser treatment. When the -th maize plant is detected, its bounding box is represented as , where denotes the center of the detection box, and and represent its width and height, respectively. Since maize primarily exhibits vertical growth during the seedling stage, the core safety area is modeled using an elliptical region with a larger vertical semi-axis than the horizontal semi-axis. The adaptive safety zone is defined in the image coordinate system without additional rotation transformation. The -th maize safety zone is defined as shown in Equation (2).
Here, and represent the horizontal and vertical semi-axis lengths of the axis-aligned ellipse, respectively. and , with to reflect the longitudinal extension characteristic. Although the maize detection bounding box can fully cover the target, directly using the rectangular bounding box as the safety zone introduces excessive protection areas at the corners, where weeds can be incorrectly excluded from laser treatment. Therefore, an elliptical safety zone is introduced to reduce unnecessary protection regions while maintaining effective maize protection. Because the elliptical boundary may remove some marginal regions of the original bounding box, a dynamic expansion strategy based on target size is further introduced to compensate for potential protection loss caused by the shape transformation, as shown in Equation (3).
Here, and are the base expansion coefficients, and are adjustment parameters, and and represent the image width and height, respectively. This approach ensures that larger maize targets are assigned proportionally larger protection zones, while smaller targets maintain a compact safety boundary, thereby balancing crop protection with the strikeability of weeds. After modeling the safety zones, weeds that can be targeted are then screened. Let the bounding box of the -th weed target be defined as:
To simplify the laser aiming process, the center point of the weed bounding box, , is selected as the initial laser targeting point. For the weed trajectories output by the target tracking module, if the current strike point satisfies , the weed is classified as a non-strikeable target; otherwise, it is regarded as a candidate strike target: , where indicates that the target is strikeable, whereas indicates that the target is located within the crop protection zone.
To prevent weeds near the maize boundary from being misclassified due to center-point deviation, this study introduces the intersection over union (IoU) as an auxiliary constraint. When the following condition is satisfied: , even if the center point is located outside the safety zone, the weed is still classified as a high-risk target and excluded from laser treatment. This enables effective screening of strikeable targets. The performance of the adaptive elliptical maize safety zoning method based on the YOLO-GFD-ByteTrack model is shown in Figure 7.
Figure 7.
Schematic diagram of the method for adaptive maize safety zone delineation using longitudinally extended ellipses. (a) Original field image. (b) Output results from the YOLO-GFD model. (c) Output results from the YOLO-GFD-ByteTrack model.
For candidate weeds that pass the safety screening, Excess Green (ExG) segmentation is performed within their detection boxes. In this study, ExG was selected as the vegetation segmentation index because it enhances the contrast between green plant tissues and the background by emphasizing the green component while reducing the influence of red and blue components. The ExG value is calculated according to Equation (5), and a binary weed mask is generated by thresholding the ExG response to separate weed pixels from the background. The binary masks are then subjected to connected component analysis to identify individual weed regions. The centroid coordinates of each connected component are calculated using image moments, as defined in Equations (5) and (6), and are used as the final laser targeting points.
Here, , , and represent the zeroth- and first-order image moments, respectively. The centroid calculated from these moments is ultimately used as the precise laser targeting point. After centroid extraction, the final model-generated targeting point was re-evaluated against the adaptive maize safety zone and the IoU-based risk constraint. Targets violating either constraint were removed from the laser execution queue. By combining safety-zone constraints, centroid extraction, and secondary safety verification, the method reduces the risk of unsafe target selection and provides reliable targeting information for subsequent galvanometer control and target scheduling. This provides reliable input for subsequent galvanometer control and target scheduling, thereby enhancing the efficiency of laser weeding.
Figure 8 illustrates the workflow for extracting weed centroids. Based on the combination of detection boxes and the delineation of elliptical safety zones, an elliptical mask region is generated. Subsequently, weed centroids are extracted through the ExG algorithm and connected component analysis, ultimately enabling precise laser targeting.
Figure 8.
Center of mass extraction process. (a) Original image. (b) Maize and weed detection results. (c) Elliptical safety region mask. (d) Weed ExG algorithm. (e) Magnified illustration of weed extraction with ExG. (f) Connected component analysis and centroid calculation.
2.3.3. Galvanometer Scanner Targeting and Laser Strike Scheduling
After the candidate weed targets have been screened, the target positions in the image coordinate system must be mapped to the galvanometer scanner control space to enable precise laser targeting. As shown in Figure 9, because the weed centroid recognition results are output in pixel coordinates, a stepwise coordinate transformation is required: from two-dimensional pixel coordinates to the actual physical space, and then to the galvanometer scanner control coordinates, which are ultimately used for laser output.
Figure 9.
Schematic of the coordinate transformation process used in Stage IV. The 2D pixel coordinates are back-projected to a normalized camera ray using the camera’s intrinsic matrix K. The potential platform attitude variations caused by uneven terrain and vibration are incorporated into the coordinate transformation process. A rotation matrix is introduced to describe the spatial deviation caused by platform tilt and account for the influence of attitude changes on target localization. The 3D coordinates are either derived from depth or by intersecting the back-projected ray with the ground plane. The coordinates are then mapped into the laser frame using the fixed camera–laser extrinsic and transformed into galvanometer control signals (, ) for accurate targeting.
The pixel coordinates of a weed target in the image are , with a corresponding depth . First, the pixel coordinates are back-projected into the camera coordinate system using the camera intrinsic matrix K to obtain the spatial position of the target. During field operation, uneven terrain surfaces and inconsistent soil subsidence may cause attitude variations of the mobile platform, including pitch and roll deviations. These variations can change the relative relationship between the camera coordinate system and the galvanometer coordinate system, resulting in positioning errors of laser targeting. Therefore, a rotation matrix is introduced into the coordinate transformation model to represent the potential coordinate deviation caused by platform attitude changes. In addition, due to a certain delay between perception and execution, platform motion compensation is applied to update the target position during the delay between target detection and laser execution. Because the galvanometer was rigidly mounted on the platform, the spatial relationship between the camera and galvanometer coordinate systems remained fixed during operation. After considering platform attitude variation and motion compensation, the reconstructed target coordinates were transformed into the galvanometer coordinate system using the calibrated camera–galvanometer extrinsic parameters. The mapping relationship between the camera coordinates and the galvanometer control coordinates is expressed in Equation (7). The calibrated camera–galvanometer extrinsic parameters are applied in the final coordinate mapping process to convert the reconstructed target coordinates into galvanometer control coordinates.
In Equation (7), and denote the horizontal and vertical control coordinates of the galvanometer scanner, respectively; is the inverse of the camera intrinsic matrix; represents the pixel coordinates of the weed target in the image; denotes the corresponding depth information; represents the rotation matrix describing spatial deviations caused by platform attitude variation; represents the platform motion velocity; and denotes the system response time.
Through the above transformation, the target position in the image space can be converted into the galvanometer scanner control signals and , thereby enabling precise laser pointing toward the weed target. Combined with a priority-based scheduling strategy, the system can rapidly localize and strike selected targets, improving the overall operational efficiency and stability.
The fixed extrinsic transformation between the camera coordinate system and the galvanometer coordinate system was calibrated before field experiments to establish their spatial relationship. The calibration was performed within the effective laser operating area to ensure that the obtained transformation parameters were applicable to the entire working region. The three-dimensional positions measured by the depth camera were matched with the corresponding galvanometer control coordinates, and the transformation parameters were estimated using least-squares fitting. The calibrated extrinsic transformation was subsequently applied in all coordinate mapping procedures during field experiments to convert reconstructed weed positions into galvanometer control coordinates.
After safety-zone-constrained screening is completed, the model identifies the current priority target from the candidate weed targets. Since a laser weeding platform can typically strike only one target at a time, and the time required for the galvanometer scanner to deflect from its current position to different target locations varies, the candidate targets must be prioritized to optimize the laser strike sequence. To address this issue, this paper proposes a priority-based target scheduling method, termed Priority-based Target Scheduling (PTS), which predicts the priority of candidate targets and enables real-time selection of the optimal target for laser treatment. The set of candidate weed targets obtained after tracking and safety zone screening is defined in Equation (8).
Here, each candidate target contains a target ID, current position, and trajectory information. In this study, both the galvanometer movement cost and the target urgency are incorporated into the priority calculation. The galvanometer movement cost represents the control cost required for the galvanometer to move from its current position to the target position. Let the current galvanometer pointing position be , and the candidate target strike point be . The movement cost for target can then be expressed as shown in Equation (9).
The smaller the movement amplitude, the shorter the time required for the galvanometer scanner to complete the deflection, and the higher the target response efficiency. Target urgency is used to describe the extent to which a candidate weed approaches the boundary of the maize safety zone or is about to enter a high-risk region. Let denote the distance from the target center point to the nearest boundary of a maize safety zone. The target urgency can then be calculated using Equation (10).
Here, is a small constant introduced to prevent division by zero. The closer a target is to the safety zone, the higher the likelihood that it will subsequently enter a hazardous area, and consequently, the higher its urgency. To account for trajectory stability, the trajectory duration , defined as the number of consecutive frames the target has been tracked, is incorporated into the priority evaluation function. The overall priority of a candidate target is expressed in Equation (11). The weighting coefficients , , and represent the relative influence of target urgency, galvanometer movement efficiency, and trajectory stability, respectively, on the scheduling decision. A higher priority indicates that the target should be selected earlier for laser treatment. Accordingly, the optimal strike target at the current time step is determined using Equation (12).
When a target is successfully struck, the system records its corresponding trajectory ID and suppresses repeated assignment of the same trajectory in subsequent frames, thereby preventing the same weed from being struck multiple times and reducing ineffective operations. Under the premise of ensuring maize safety, the proposed scheduling strategy prioritizes weed targets that are more urgent and require lower execution costs, thereby improving the operational efficiency and control stability of laser weeding.
Based on the centroid and motion velocity in each frame, the weed position in the next frame is predicted and used for subsequent treatment. In the proposed method, targets are tracked using the ByteTrack model, and newly detected targets awaiting treatment are placed into a queue. Specifically, when a weed target crosses the decision line at the entrance of the laser treatment area, it is queued for processing. As the platform moves, the position of each target in the queue is updated in real time. When the laser becomes available, the queue is evaluated to select the next appropriate target. Once a target is selected and actively tracked, the laser platform receives updated tracking information for every 1 mm of platform movement. The scheduling workflow is shown in Figure 10.
Figure 10.
Scheduling the general pipeline. Once weeds are detected, they are tracked by the ByteTrack model. Then, laser path trajectories are computed, and the optimal one is chosen.
2.4. Evaluation Metrics
In this study, the performance of the tracking algorithm is evaluated using Multiple Object Tracking Accuracy (MOTA), Multiple Object Tracking Precision (MOTP), Identification F-Score (IDF1), and Higher Order Tracking Accuracy (HOTA). The number of weed ID switches refers to the number of times a weed’s identity changes in the video, with lower values indicating better performance. MOTA measures the algorithm’s ability to maintain consistent tracking trajectories, with higher values indicating better tracking performance. MOTP measures the matching success rate of all tracked targets, with higher precision reflecting better detection performance. The calculation formulas for each evaluation metric are presented in Equations (13)–(16).
In the equations, denotes the number of correctly matched target identities; denotes the number of missed target identities; denotes the number of falsely detected target identities; denotes the number of target ID switches; denotes the total number of target appearances; denotes the overlap between the tracking box and the detection box; denotes the number of successfully matched targets in the current frame; is the current predicted target; is the index of the test video frame sequence; denotes detection accuracy; and denotes association accuracy.
To comprehensively evaluate the performance of the scheduling method, the following metrics are used: average response time, average galvanometer deflection distance, processing success rate, repeat strike rate, and number of targets processed per unit time. These metrics provide a comprehensive assessment of the scheduling performance from three aspects: temporal efficiency, spatial efficiency, and execution stability. The calculation formulas for each evaluation metric are presented in Equations (17)–(21).
In the equations, denotes the processing success rate; denotes the number of targets successfully treated by laser strike; and denotes the total number of candidate targets entering the scheduling queue. denotes the average response time; denotes the response time experienced by the -th target from entering the candidate queue to completing laser treatment; and denotes the number of targets included in the statistical calculation. denotes the average galvanometer deflection distance; denotes the strike-point coordinates of the -th target; and denotes the current pointing position of the galvanometer scanner. denotes the repeat strike rate; denotes the number of targets that are struck repeatedly; and denotes the total number of targets actually subjected to laser strikes. denotes the number of targets processed per unit time, and denotes the total time consumed by the system to complete target processing.
Among these metrics, the average response time is used to evaluate the temporal efficiency of the scheduling method, while the average galvanometer deflection distance characterizes the spatial execution cost. The processing success rate, repeat strike rate, and number of targets processed per unit time are used to assess the execution stability and operational efficiency of the system.
In addition, statistical analysis was conducted to evaluate the significance of differences among different field experimental conditions. All experiments were performed with three independent replicates, and the results are expressed as mean ± standard deviation. One-way analysis of variance (ANOVA) followed by Tukey’s honestly significant difference (HSD) test was used to analyze the effects of operating speed and illumination conditions on laser weeding performance. Differences were considered statistically significant when p < 0.05.
3. Results and Discussion
3.1. Experimental Setup
The training process in this experiment was conducted using the Adam optimizer, with the learning rate set to 0.0001, the number of training epochs set to 200, and the batch size set to 12. Model training was performed on a high-performance server equipped with an Intel® Core™ i7-14700KF processor, 64 GB of memory, and an NVIDIA GeForce RTX 4090D GPU with 24 GB of video memory. The software environment consisted of the Ubuntu 20.04 operating system, PyCharm 2023 for development, Python 3.10 as the programming language, and the PyTorch 2.0.1 deep learning framework.
To evaluate the practical deployment performance of the proposed method in resource-constrained edge computing environments, the method was deployed and tested on an NVIDIA Jetson AGX Orin platform. The Jetson AGX Orin is equipped with an Ampere-architecture GPU with up to 2048 CUDA cores, a multi-core ARM Cortex-A78AE CPU, and up to 32 GB of LPDDR5 memory, providing strong edge computing capability. Its typical power consumption ranges from 15 W to 60 W, and the power mode can be configured according to specific application scenarios. The experimental software environment on this platform consisted of Ubuntu 20.04 LTS, Python 3.8, and PyTorch 1.8.0. Inference performance tests were conducted on this platform to verify the real-time capability and stability of the proposed method in an embedded environment.
3.2. Comparative Trials of Different Tracking Algorithms
The weed targets were tracked by combining the previously proposed YOLO-GFD algorithm with four tracking models: SORT [27], DeepSORT [28], Bot-SORT [29], and ByteTrack [30]. The tracking results are presented in Table 1.
Table 1.
Tracking and counting results of different models.
As shown in Table 1, the combination of YOLO-GFD and ByteTrack demonstrates the best tracking performance. In terms of overall tracking accuracy, YOLO-GFD+ByteTrack achieves a Multiple Object Tracking Accuracy (MOTA) of 85.6%, representing an improvement of 17.5, 12.9, and 5.0 percentage points over SORT, Bot-SORT, and DeepSORT, respectively. Regarding identity preservation, the IDF1 score reaches 86.2%, outperforming the other tracking methods, indicating that the YOLO-GFD+ByteTrack approach effectively maintains target identity consistency in complex scenarios. Meanwhile, the Higher Order Tracking Accuracy (HOTA) reaches 80.1%, further validating that this method achieves a superior balance between detection precision and association performance. Differences in localization precision, measured by MOTP, are relatively small across different tracking algorithms; the proposed method achieves 65.8%, improving over SORT, Bot-SORT, and DeepSORT by 2.6, 2.1, and 0.7 percentage points, respectively. This is because MOTP is primarily influenced by the accuracy of the detection boxes and tracking algorithms have limited impact on improving it.
In addition, compared with methods such as SORT and Bot-SORT, ByteTrack introduces a more effective matching strategy during the target association stage, which substantially reduces identity switches and improves trajectory continuity and stability. This, in turn, reduces the risk of repeated strikes during subsequent laser execution.
In addition to tracking performance, the computational efficiency of different tracking algorithms was further evaluated on the Jetson AGX Orin edge platform. Under the same hardware and software configurations, the average processing time of SORT, DeepSORT, Bot-SORT, and ByteTrack was measured to assess their suitability for real-time laser weeding applications. The results are presented in Table 2.
Table 2.
Runtime performance of tracking algorithms on Jetson AGX Orin.
SORT exhibited the lowest computational latency due to its simple IoU-based association strategy. However, its tracking performance was more susceptible to target occlusion and positional variations under complex field conditions. DeepSORT and Bot-SORT improved tracking robustness by incorporating appearance feature extraction and additional motion estimation mechanisms, but these enhancements inevitably increased computational costs. In comparison, ByteTrack achieved a better trade-off between tracking accuracy and computational efficiency, providing low-latency target association suitable for dynamic weed tracking and subsequent laser targeting. Considering both tracking performance and computational requirements, ByteTrack was selected as the tracking module for the proposed laser weeding system.
Overall, the proposed YOLO-GFD+ByteTrack method achieves significant improvements in tracking accuracy, identity consistency, and overall robustness, fully demonstrating its effectiveness in complex field environments. These results provide reliable temporal information support for subsequent target scheduling and precise laser targeting.
Figure 11 presents a schematic visualization of cross-frame weed tracking and the predicted positions of weeds at different future frames. The YOLO-GFD+ByteTrack model was used for multi-object tracking of weed targets. During the tracking process, the trajectory of each weed target was accurately annotated, and the expected position of each weed target in the subsequent frames was visualized. In the figure, the light-green boxes represent the detection boxes of weed targets. The light-green arrows indicate the predicted weed positions after 10 frames, the grass-green arrows indicate the predicted positions after 20 frames, and the dark-green arrows indicate the predicted positions after 30 frames.
Figure 11.
Model cross-frame tracking performance and predicted positions of weeds.
Through the multi-object tracking algorithm, the model can accurately predict the future trajectories of weed targets in dynamic environments and generate predicted positions corresponding to the current frame. This method improves the operational continuity of the laser weeding system, ensuring that the laser can strike weed targets in a timely and accurate manner without being affected by image jitter or short-term occlusion. During operation, the tracking frame rate of the model reaches 19.3 FPS, ensuring real-time performance while maintaining high target tracking accuracy. These results indicate that the proposed approach demonstrates good practicality and real-time performance in complex field environments, providing reliable support for subsequent laser execution.
3.3. Quantitative Evaluation of Safety-Zone Delineation
To evaluate the effectiveness of the adaptive elliptical safety zone in laser weeding, a field-simulated experiment was conducted to compare two safety-zone delineation methods: the rectangular safety zone directly defined by the maize detection bounding box and the proposed adaptive elliptical safety zone. The two methods were tested using the same maize–weed spatial configurations to ensure a consistent comparison.
The experiment consisted of three independent replicates. Each replicate included 30 maize seedlings and 60 weeds distributed near the maize plants, resulting in a total of 90 maize seedlings and 180 nearby weeds for each safety-zone method. The relative positions of maize seedlings and weeds were kept consistent between the two methods.
Four indicators were used for quantitative evaluation: mean normalized safety-zone area, false-protection rate, strikeable-weed retention rate, and crop-zone violation rate. For the -th maize seedling, the normalized safety-zone area was calculated as follows , where is the safety-zone area generated for the -th maize seedling, and is the area of its corresponding detection bounding box. For the rectangular method, the normalized safety-zone area was 100%. For the adaptive elliptical method, , where and are the adaptive semi-axes of the ellipse. The mean and standard deviation were calculated from the normalized safety-zone areas of all maize seedlings. This normalization reduced the direct influence of differences in maize size and image scale on the comparison.
For evaluation purposes, the visible maize-plant regions in the test images were manually delineated as reference masks. The weed targeting points, however, were generated automatically by the proposed model through ExG segmentation, connected-component analysis, and image-moment-based centroid calculation.
A weed was regarded as falsely protected when its model-generated targeting point was located outside the reference maize-plant region, but the weed was still excluded from laser treatment by the corresponding safety-zone rule. The strikeable-weed retention rate was defined as the proportion of nearby weeds retained as eligible laser targets after safety-zone screening. The crop-zone violation rate was defined as the proportion of model-generated targeting points retained after safety-zone screening that fell within the manually delineated reference maize-plant region.
Figure 12 presents representative results obtained using the two safety-zone delineation methods. In Figure 12A, the rectangular detection-box safety zone covers substantial non-crop regions surrounding the maize seedlings. Consequently, weeds A1 and A2 were excluded from laser treatment, although their model-generated targeting points were located outside the reference maize-plant region. In contrast, the adaptive elliptical safety zone shown in Figure 12B more closely follows the elongated morphology of maize seedlings. Therefore, weeds B1, B2, and B3 were retained as strikeable targets and subjected to laser treatment.
Figure 12.
Representative comparison of the rectangular detection-box safety zone and the adaptive elliptical safety zone. The red circles indicate model-generated weed targeting points retained for laser treatment, whereas weed targets excluded by the corresponding safety-zone rule were not irradiated. (A) Detection results using the rectangular safety zone; (A1–A3) Local enlarged views of weed targets located within the rectangular safety zone; (B) Detection results using the adaptive elliptical safety area; (B1–B3) Local enlarged views of weed targets within the adaptive elliptical safety area.
Table 3 presents the quantitative comparison between the rectangular detection-box safety zone and the proposed adaptive elliptical safety zone.
Table 3.
Quantitative comparison of different maize safety-zone delineation methods.
As shown in Table 3, the adaptive elliptical safety zone occupied an average of 68.5% of the corresponding maize detection-box area, representing a 31.5% reduction relative to the rectangular safety zone. Because the safety-zone area of each maize seedling was normalized by its own detection-box area, differences in maize size and image scale did not directly affect the comparison.
The false-protection rate decreased from 28.3% for the rectangular safety zone to 10.1% for the adaptive elliptical safety zone. Correspondingly, the strikeable-weed retention rate increased from 71.7% to 89.9%, representing an improvement of 18.2 percentage points. These results indicate that the proposed method retained a larger proportion of weeds located near maize seedlings and reduced unnecessary target exclusion caused by the rectangular detection box.
The crop-zone violation rate increased slightly from 0.0% for the rectangular safety zone to 1.1% for the adaptive elliptical safety zone. Although the reduced safety-zone area introduced a small increase in crop-zone violations, this low violation level indicates that only a very small proportion of retained laser targets were located within the maize protection region. Moreover, crop-zone violation does not directly represent crop injury, as the subsequent target scheduling and laser execution process further considers target priority, spatial constraints, and controlled irradiation. Therefore, the observed violation rate was considered to represent an acceptable trade-off under the experimental conditions, while the strike able-weed retention rate improved substantially. The adaptive elliptical safety zone achieved a more favorable balance between crop-risk control and utilization of the available laser treatment area.
It should be noted that this experiment evaluates the target-screening effectiveness of the safety-zone constraint rather than the end-to-end targeting accuracy of the complete laser-weeding system. The actual accuracy of the integrated perception, coordinate-transformation, galvanometer-control, and laser-execution chain should be evaluated separately using the distance between the model-generated targeting point and the actual laser spots.
3.4. Target Scheduling Experiments
3.4.1. Laser Galvanometer Control Strategy
To evaluate the execution efficiency of different target scheduling strategies in laser weeding tasks, this study selected the first-in, first-out strategy (FIFO) [31], the dynamic traveling salesman problem method with time constraints (DTSP) [32], and the receding horizon control method (RHC) [33] as comparative methods, and compared them with the proposed priority-based target scheduling method (PTS). These methods represent three typical categories of scheduling strategies: simple sequential scheduling, global path optimization, and local dynamic optimization, respectively. In the laser weeding scenario, the FIFO method schedules weed targets according to their arrival order in the candidate target queue without considering target location or execution cost. The DTSP method treats detected weeds as nodes in a traveling salesman problem and determines the target execution sequence by minimizing the total galvanometer movement distance. The RHC method adopts a rolling horizon optimization strategy, where future target states are predicted within a limited time window and the target sequence is updated dynamically. The proposed PTS method further incorporates maize safety constraints, galvanometer movement cost, and target urgency to achieve priority-based target scheduling under dynamic field conditions.
The experiment was conducted based on the candidate weed target set obtained using the YOLO-GFD and ByteTrack tracking algorithms. Potential high-risk targets were removed through elliptical safety zone constraints, and the resulting weed target set was used for scheduling. The FIFO, DTSP, RHC, and PTS methods were then applied separately to sort the candidate targets and generate laser strike sequences. To ensure experimental fairness, all scheduling methods were run under the same video sequences, target sets, platform motion speed, and system response time. In the trajectory analysis experiment, 20 weed targets were selected from the same frame as a unified input, and the same initial point was set to eliminate the influence of environmental factors on the scheduling results.
Table 4 presents a comparison of different scheduling methods across various evaluation metrics. The performance of different scheduling strategies varies in terms of laser execution efficiency and weed processing capability. The FIFO method, which executes targets strictly in the order of arrival without considering spatial distribution or execution cost, exhibits the poorest performance: its average response time reaches 185.2 ms, and its average deflection distance is 21.3 mm. Its processing success rate is only 78.3%, indicating that many targets are not processed in a timely manner in dynamic environments. In addition, a repeat strike rate of 18.7% further reduces the overall system efficiency.
Table 4.
Experimental comparison of different scheduling methods.
The DTSP method, through global path optimization, reduces the average deflection distance to 16.8 mm, decreases the response time to 145.2 ms, and increases the processing success rate to 83.6%. However, because it relies on complex combinatorial optimization, it still suffers from local path redundancy and delayed responses in dynamic scenarios.
The RHC method applies a receding horizon strategy to perform local prediction and optimization for future targets, showing better adaptability in dynamic environments. Its average deflection distance is further reduced to 14.2 mm, the response time is 128.7 ms, the processing success rate reaches 87.9%, and the repeat strike rate drops to 10.4%. Overall, its performance surpasses that of FIFO and DTSP. However, this method requires repeated local optimization calculations at each time step, placing higher demands on the system’s real-time capability.
In contrast, the proposed PTS method demonstrates superior performance across all evaluation metrics. Its average response time is reduced to 102.3 ms, the average deflection distance decreases to 11.6 mm, the processing success rate increases to 90.6%, the repeat strike rate decreases to 6.8%, and the number of targets processed per unit time reaches 3.21 targets/s. These results indicate that the PTS method can effectively improve system execution efficiency and stability while maintaining real-time performance.
Figure 13 shows the online output of the strike paths for 20 weed targets using different scheduling methods, visualized with Matplotlib(v3.8.0). The galvanometer movement cost is defined as the spatial displacement required to deflect from its current position to the target position. A smaller movement cost indicates a smaller galvanometer deflection and shorter execution time, thereby improving system response efficiency.
Figure 13.
Simulation experiments on the scheduling order of different strategies, along with bar charts of scheduling paths and times.
The FIFO method incurs a high movement cost due to frequent large-range jumps. Although the DTSP method optimizes the overall path, local backtracking still occurs. The RHC method improves path smoothness through local optimization. In contrast, the PTS method considers target urgency, movement cost, and trajectory stability comprehensively, prioritizing more efficient targets, thereby effectively reducing unnecessary deflections and shortening overall task execution time.
Combined with the quantitative results in Table 4, the PTS method achieves an average galvanometer deflection distance of 11.6 mm, substantially lower than the other methods. This indicates that PTS has a substantial advantage in reducing galvanometer movement cost. Moreover, the reduced deflection distance directly leads to shorter response times, demonstrating that the proposed scheduling method achieves a superior balance between spatial and temporal efficiency. By effectively minimizing unnecessary deflections and redundant scanning, the PTS method enhances system execution time and energy utilization, providing robust support for the engineering implementation of embedded laser weeding systems.
3.4.2. Ablation Experiment
To evaluate the effectiveness of the individual components of the priority function, an ablation study was conducted on the PTS method by selectively removing different factors and analyzing their impact on scheduling performance. In the ablation experiments, all methods were run under the same experimental conditions, and the average processing success rate was calculated based on the number of targets successfully handled across multiple frames. This metric reflects the influence of each factor on the overall execution performance of the system. Under the same conditions as the main experiment, the ablation results are presented in Table 5, where PTS- ignores target urgency, PTS- ignores the galvanometer movement cost, and PTS- ignores trajectory stability.
Table 5.
Performance comparison of different ablation configurations.
The ablation experiments show that removing any of the factors leads to a decline in performance. Specifically, after removing the galvanometer movement cost term , the average deflection distance increases to 16.9 mm, indicating that this term plays a key role in path optimization. After removing the trajectory stability term , the repeat strike rate increases, demonstrating its importance in reducing redundant execution. Removing the urgency term decreases the processing success rate, resulting in some high-risk targets not being processed in a timely manner.
In contrast, the complete PTS method achieves the best results across all evaluation metrics, indicating that the three factors play complementary roles in the scheduling process and jointly improve overall system performance.
3.5. Field Experiment
To comprehensively evaluate the performance of the intelligent laser weeding system, field experiments were conducted in this study. Each field experiment followed a randomized block design with three independent replicates. Each plot was 10 m long and 0.8 m wide. The experiment was carried out in the standardized experimental field of Jilin Agricultural University, where the row spacing of the maize crop was 80 cm.
The laser power was set to 110 W, the laser spot area was 3 mm2, and the laser irradiation time was fixed at 200 ms. The selected laser parameters were determined based on our previous experimental investigations, in which different laser power levels and irradiation durations were evaluated to balance weed control effectiveness and crop safety. The optimized parameters were adopted in this study for field validation. Under these conditions, the delivered energy density was calculated as , where is the energy density (J·mm−2), is the laser power (W), is the laser dwell time (s), and A is the spot area (mm2). The laser energy density in this experiment was approximately 7.33 J·mm−2. This energy density represents the energy delivered during a single laser irradiation event and provides the basis for evaluating the energy utilization of the laser treatment process.
To systematically evaluate the robustness of the weeding system, a single-factor experimental design was adopted, focusing on two key variables that affect field operation: operating speed and illumination condition. Operating speed affects target displacement during system latency, the available treatment window, and the number of targets entering the scheduling queue per unit time, whereas illumination intensity affects the recognition performance of the vision system. These factors can influence both the efficiency and accuracy of the system in practical applications.
As shown in Figure 14, three agronomic indicators were evaluated within fixed evaluation quadrats delineated by yellow reference lines. The quadrats were established within the larger field operation area and were used only for standardized quantitative assessment of weeding rate, seedling damage rate, and weed regrowth rate.
Figure 14.
Field evaluation quadrat (10 m × 0.8 m). All calculations of weed control rates, seedling damage rates and weed regrowth rates were performed within this fixed evaluation quadrat.
Weed regrowth was recorded at 0, 3, and 7 days after treatment to evaluate the immediate effect of irradiation on the treatment day, short-term recovery after 3 days, and long-term regrowth after 7 days. To confirm weed survival status, changes in chlorophyll content were measured using a chlorophyll meter (TYS-3N). In this study, weeds with chlorophyll fluorescence were considered dead. The calculation formulas are shown in Equations (22)–(26).
In the equations, is the difference between the maximum fluorescence and the initial fluorescence , representing the maximum energy that can be utilized by plants during photosynthesis. The ratio indicates the photosynthetic efficiency of plant leaves. denotes the weeding rate (%); represents the total number of weeds in the experimental quadrat; represents the number of remaining weeds after laser weeding; denotes the seedling damage rate (%); represents the total number of maize seedlings in the experimental quadrat; and represents the number of maize seedlings accidentally damaged after laser weeding. denotes the weed regrowth rate (%); represents the number of regrown weeds; and represents the number of weeds struck by the laser.
Figure 15 shows the weed morphology within the quadrat at three time points: (a) immediately after laser treatment (t = 0), (b) 3 days after laser irradiation, and (c) 7 days after laser irradiation. These images illustrate the immediate effect of laser treatment and the subsequent suppression of weed regrowth. These results indicate that laser irradiation effectively caused dehydration and death of the treated weeds, with no observable regrowth during the subsequent observation period.
Figure 15.
Evaluation of representative scenes at three time points after laser treatment: (a) immediate response after laser irradiation; (b) short-term suppression effect; (c) long-term suppression effect. The red circles indicate the locations of treated weed targets.
3.5.1. Weed Control Performance at Different Speeds
In this experiment, we evaluated the performance of the laser weeding system at different operating speeds. Three movement speeds were tested: 0.1 m/s, 0.15 m/s, and 0.2 m/s, and all performance metrics were assessed and compared under each speed condition.
The experimental results are shown in Figure 16. The weeding rate of the laser system showed a decreasing trend as the operating speed increased. At 0.1 m·s−1, the weeding rate was the highest, reaching 86.1%. As the speed increased to 0.15 m·s−1 and 0.2 m·s−1, the weeding rate decreased to 83.7% and 81.2%, respectively. Statistical analysis was conducted to evaluate the significance of differences among different operating speeds. The results showed that operating speed had a significant effect on the weeding rate (p < 0.05). The decrease in weeding efficiency at higher speeds was mainly attributed to the shortened laser irradiation duration and increased difficulty in maintaining accurate laser targeting during high-speed operation. This indicates that lower operating speeds enable higher weeding efficiency, allowing the laser system to remove weeds more precisely.
Figure 16.
The weed control rate decreased and the weed regrowth rate increased with increasing operating speed, whereas the seedling damage rate remained relatively stable. Statistical analysis was performed to evaluate the significance of differences among different operating speeds. (a) Weed control rate; (b) seedling damage rate; (c) regrowth rate.
Regarding seedling damage, the damage rate showed only slight variations under different operating speeds. Statistical analysis indicated that the difference in seedling damage rate among different operating speeds was not significant (p > 0.05). This result suggests that the proposed safety-zone constraint strategy effectively protected crops under different operating conditions.
The regrowth rate exhibited an increasing trend with increasing operating speed. Statistical analysis indicated that operating speed significantly influenced weed regrowth (p < 0.05). Higher operating speeds reduced the effective laser treatment time, resulting in incomplete tissue damage and an increased probability of weed recovery. This suggests that higher speeds may reduce the completeness of weed treatment, thereby increasing the probability of regrowth.
Overall, operating speed significantly influenced the performance of the laser weeding system. Lower speeds improved weeding efficiency and reduced weed regrowth, whereas higher speeds decreased treatment effectiveness due to insufficient laser exposure time.
The reduction in weeding performance at higher operating speeds can be further explained by the limited interaction time between the laser beam and weed tissues. Since the galvanometer scanner requires a certain response time for target positioning and laser emission, faster platform movement increases the displacement of weed targets during this process. Consequently, the actual laser irradiation position may deviate from the optimal treatment area, reducing the completeness of weed destruction. Therefore, an appropriate operating speed is essential to balance field efficiency and laser treatment accuracy.
Figure 17 presents the experimental results at different operating speeds. At 0.1 m·s−1, all five weeds were successfully removed, indicating optimal laser weeding performance at this speed. When the speed increased to 0.15 m·s−1, five out of six weeds were successfully treated, demonstrating a slight reduction in efficiency while still maintaining a high strike rate. At 0.2 m·s−1, only four out of six weeds were removed, indicating that higher speeds reduce the effectiveness of the laser system and result in some weeds not being completely eliminated.
Figure 17.
Examples of images taken before and after laser treatment at three different speeds. The red circles indicate the weeds that were treated with the laser. (a) shows five weeds (the speed is 0.1 m·s−1), all of which were treated by the laser. (b) shows six weeds (the speed is 0.15 m·s−1), five of which were treated by the laser. (c) shows six weeds (the speed is 0.2 m·s−1), four of which were treated by the laser.
3.5.2. Performance Under Different Illumination Conditions
To evaluate the effect of illumination conditions on the performance of the laser weeding system, tests were conducted under three illumination conditions: low illumination, moderate illumination, and high illumination. Under each condition, the effects of different illumination intensities were measured.
The low-illumination condition simulated cloudy or overcast environments, with an illumination intensity range of 0–5000 Lux. The moderate-illumination condition simulated normal outdoor environments, with an illumination intensity range of 5000–20,000 Lux. The high-illumination condition simulated direct sunlight, with an illumination intensity range of 20,000–70,000 Lux. The operating speed was set to 0.1 m·s−1, while all other experimental parameters remained unchanged.
Figure 18 illustrates the effect of different illumination intensities on system performance. The results indicate that illumination intensity significantly influences the weeding rate of the laser system. Under moderate illumination, the weeding rate reached 86.3%, demonstrating the highest efficiency. As illumination intensity varied, the weeding rate decreased to 81.1% under low-light conditions and to 80.3% under high-light conditions. Statistical analysis using one-way ANOVA followed by Tukey’s HSD test showed that illumination intensity had a significant effect on the weeding rate (p < 0.05).
Figure 18.
Effects of illumination intensity on system performance. Statistical analysis was performed to evaluate the significance of differences among different illumination conditions. (a) Weed control rate; (b) seedling damage rate; (c) regrowth rate.
The seedling damage rate slightly increased with higher illumination, rising from 2.3% under moderate illumination to 2.9% under high illumination. However, statistical analysis indicated that illumination intensity did not significantly affect the seedling damage rate (p > 0.05). This result suggests that the safety-zone constraint strategy maintained stable crop protection performance under different illumination conditions. The regrowth rate followed a similar trend, increasing from 4.4% under moderate illumination to 5.3% under high illumination. Statistical analysis showed that illumination intensity significantly affected weed regrowth (p < 0.05). Under low- and high-illumination conditions, reduced detection and localization accuracy may result in incomplete laser treatment, thereby increasing the probability of weed recovery.
Overall, moderate illumination provided optimal operating conditions for the laser weeding system, while insufficient or excessive illumination reduced weed treatment performance due to degraded target perception and localization accuracy.
The decline in performance under high-illumination conditions is mainly associated with the degradation of visual perception quality. Strong sunlight can generate uneven illumination and surface reflections from soil particles and plant leaves, reducing image contrast between weeds and the surrounding background. Since the laser targeting process relies on accurate weed localization, reduced visual robustness may increase target localization errors and consequently affect the success rate of laser treatment. These findings suggest that the laser weeding system is more sensitive to extreme illumination conditions, while appropriate illumination levels can improve target perception and treatment accuracy.
Figure 19 presents the experimental outcomes under different illumination conditions. Under cloudy or overcast conditions, only 3 out of 5 weeds were struck by the laser. Under normal sunny conditions, all 4 weeds were successfully irradiated. Under direct sunlight, 3 out of 4 weeds were struck. These findings indicate that variations in illumination conditions affected system performance. The laser weeding system achieves optimal efficiency under normal sunlight, whereas performance declines under high illumination, primarily due to overexposure reducing target recognition accuracy. These results provide important insights for the optimization and practical application of laser weeding technology.
Figure 19.
Examples of images taken before and after laser treatment under three different ambient light conditions. The red circles indicate the weeds that were treated with the laser. (a) shows five weeds (light intensity 0–5000 Lux), three of which were treated with the laser. (b) shows four weeds (light intensity 5000–20,000 Lux), all of which were treated with the laser. (c) shows four weeds (light intensity 20,000–70,000 Lux), three of which were treated with the laser.
4. Conclusions
This study developed and validated a precision laser weeding system for field operations during the maize seedling stage. A laser weeding method integrating target detection, multi-object tracking, safety constraints, and target scheduling was proposed, enabling a continuous operational workflow from weed recognition and tracking to scheduling and precise laser treatment. The experimental results showed that the combination of YOLO-GFD and ByteTrack achieved favorable weed tracking performance, with MOTA, IDF1, and HOTA reaching 85.6%, 86.2%, and 80.1%, respectively. These results indicate that the method can provide stable information for continuous target localization and suppression of repeated strikes during dynamic field operations.
The proposed PTS target scheduling strategy constructs an adaptive elliptical safety zone for maize and jointly considers the galvanometer movement cost and target urgency, thereby optimizing the laser strike sequence under safety constraints. The strike success rate reached 90.6%, and the average response time was 102.3 ms. Field experiments further verified the practical operational performance of the system. Under different operating speeds, the average weeding rate, seedling damage rate, and weed regrowth rate were 83.67%, 2.23%, and 5.23%, respectively. Under different illumination conditions, the average values of these three indicators were 82.57%, 2.63%, and 4.87%, respectively. These results demonstrate that the proposed method can achieve stable weed tracking and safe laser treatment under dynamic field operation conditions, providing a feasible solution for the practical application of precision laser weeding equipment in maize fields.
Despite the satisfactory performance demonstrated in field experiments, several limitations remain in the current study. First, the current validation was mainly conducted during the maize seedling stage within standardized field evaluation areas. Further investigations involving larger-scale continuous field operations, extended operation periods, and more diverse agricultural environments are required to further verify the scalability and long-term stability of the proposed system. Second, although the proposed multi-object tracking and priority-based scheduling strategies effectively reduced redundant laser strikes, the laser irradiation parameters were fixed during operation. The adaptive optimization of laser energy according to weed characteristics and field conditions requires further investigation. Third, different weed species may exhibit different responses to laser irradiation due to variations in morphology, growth stage, and tissue characteristics. Therefore, systematic evaluations involving diverse weed species and energy-response relationships are necessary.
Future research will focus on expanding field validation across different crop types, weed densities, soil backgrounds, and weather conditions. In addition, a closed-loop compensation mechanism incorporating platform motion states and galvanometer response characteristics will be developed to improve targeting accuracy under dynamic field conditions. Adaptive laser energy control strategies will also be explored to enhance system robustness and energy utilization efficiency during large-scale autonomous operation.
Author Contributions
Conceptualization, Y.Z.; methodology, Y.Z.; software, Y.Z. and X.W.; validation, Y.Z.; formal analysis, Y.Z.; investigation, Y.Z. and X.W.; resources, H.L.; data curation, X.W.; writing—original draft preparation, Y.Z.; writing—review and editing, Y.Z.; visualization, L.F.; supervision, Y.X.; project administration, Y.X.; funding acquisition, Y.X. All authors have read and agreed to the published version of the manuscript.
Funding
This research was funded by Jilin Provincial Scientific and Technological Development Program, [grant number: 20260601061RC].
Institutional Review Board Statement
Not applicable.
Data Availability Statement
The data presented in this study are available on request from the corresponding author.
Acknowledgments
No GenAI tools were used in the preparation of this manuscript.
Conflicts of Interest
The authors declare no conflicts of interest.
References
- Ge, B.; Jia, Z.; Guo, A.; Chen, W.; Wang, J.; Song, S.; Zhou, G. WeedsDetectNet: A green attention and adaptive joint feature fusion network for weed detection in agricultural fields. Crop Prot. 2026, 206, 107646. [Google Scholar] [CrossRef] [Scilit]
- Nath, C.P.; Singh, R.G.; Choudhary, V.K.; Datta, D.; Nandan, R.; Singh, S.S. Challenges and Alternatives of Herbicide-Based Weed Management. Agronomy 2024, 14, 126. [Google Scholar] [CrossRef] [Scilit]
- Qu, X.; Qian, J.; Gao, P.; Zhang, Z.; Hong, A.; Duan, Y.; Sun, G.; Qiang, S. Integrating tactics for weed seed management provides sustainable weed control in organic rice production. Agron. Sustain. Dev. 2026, 46, 26. [Google Scholar] [CrossRef] [Scilit]
- Lacroix, C.; Pierreux, J.; Brostaux, Y.; Vandenberghe, C.; Dumont, B. Assessing the combined effects of mechanical and chemical weeding on weed dynamics in winter wheat. Weed Res. 2025, 65, e12677. [Google Scholar] [CrossRef] [Scilit]
- Zhang, X.; Wang, Q.; Wang, C.; Wang, X.; Xu, Z.; Lu, C. Guidelines for mechanical weeding: Developing weed control lines through point extraction at maize root zones. Biosyst. Eng. 2024, 248, 321–336. [Google Scholar] [CrossRef] [Scilit]
- Baćmaga, M.; Wyszkowska, J.; Kucharski, J. Environmental Implication of Herbicide Use. Molecules 2024, 29, 5965. [Google Scholar] [CrossRef] [Scilit] [PubMed]
- Andreasen, C.; Vlassi, E.; Salehan, N. Laser weeding of common weed species. Front. Plant Sci. 2024, 15, 1375164. [Google Scholar] [CrossRef] [Scilit] [PubMed]
- Li, Y.; Guo, Z.; Shuang, F.; Zhang, M.; Li, X. Key technologies of machine vision for weeding robots: A review and benchmark. Comput. Electron. Agric. 2022, 196, 106880. [Google Scholar] [CrossRef] [Scilit]
- Das, S.; Wiafe, E.K.; Upadhyay, A.; Mettler, J.; Howatt, K.; Sun, X. Design and evaluation of a vision-guided robotic platform with root-zone drilling for targeted weed removal. Comput. Electron. Agric. 2026, 246, 111605. [Google Scholar] [CrossRef] [Scilit]
- Hu, R.; Kong, L.; Su, W.H.; Dong, B.W.; Wang, Y.; Li, X.; Peng, Y. Multifunctional deep learning-based mechanical-laser collaborative adaptive precision weeding system for lettuce. Comput. Electron. Agric. 2026, 242, 111319. [Google Scholar] [CrossRef] [Scilit]
- Hu, R.; Niu, L.-T.; Su, W.-H. A novel mechanical-laser collaborative intra-row weeding prototype: Structural design and optimization, weeding knife simulation and laser weeding experiment. Front. Plant Sci. 2024, 15, 1469098. [Google Scholar] [CrossRef] [Scilit] [PubMed]
- Heisel, T.; Schou, J.; Christensen, S.; Andreasen, C. Cutting weeds with a CO2 laser. Weed Res. 2001, 41, 19–29. [Google Scholar] [CrossRef] [Scilit]
- Marx, C.; Barcikowski, S.; Hustedt, M.; Haferkamp, H.; Rath, T. Design and application of a weed damage model for laser-based weed control. Biosyst. Eng. 2012, 113, 148–157. [Google Scholar] [CrossRef] [Scilit]
- Rakhmatulin, I.; Andreasen, C. A Concept of a Compact and Inexpensive Device for Controlling Weeds with Laser Beams. Agronomy 2020, 10, 1616. [Google Scholar] [CrossRef] [Scilit]
- Mathiassen, S.K.; Bak, T.; Christensen, S.; Kudsk, P. The effect of laser treatment as a weed control method. Biosyst. Eng. 2006, 95, 497–505. [Google Scholar] [CrossRef] [Scilit]
- Xiong, Y.; Ge, Y.; Liang, Y.; Blackmore, S. Development of a prototype robot and fast path-planning algorithm for static laser weeding. Comput. Electron. Agric. 2017, 142, 494–503. [Google Scholar] [CrossRef] [Scilit]
- Bloomer, D.J.; Harrington, K.C.; Ghanizadeh, H.; James, T.K. Robots and shocks: Emerging non-herbicide weed control options for vegetable and arable cropping. N. Z. J. Agric. Res. 2024, 67, 81–103. [Google Scholar] [CrossRef] [Scilit]
- Xuelei, W.; Jie, H.; Dongjie, Z.; Honghong, G.; Chuanjun, L.; Bin, Z. Kinematics and statics analysis of a novle 4-dof parallel mechanism for laser weeding robot. INMATEH-Agric. Eng. 2016, 50, 29–38. [Google Scholar]
- Vargas Fernández, J.I.; Wane, S.; Arevalo-Ramirez, T.; Auat Cheein, F. Dynamic weed control using selective laser application with object tracking and target scheduling. Comput. Electron. Agric. 2025, 239, 111004. [Google Scholar] [CrossRef] [Scilit]
- Zhao, P.; Chen, J.; Li, J.; Ning, J.; Chang, Y.; Yang, S. Design and Testing of an autonomous laser weeding robot for strawberry fields based on DIN-LW-YOLO. Comput. Electron. Agric. 2025, 229, 109808. [Google Scholar] [CrossRef] [Scilit]
- Krupanek, J.; de Santos, P.G.; Emmi, L.; Wollweber, M.; Sandmann, H.; Scholle, K.; Di Minh Tran, D.; Schouteten, J.J.; Andreasen, C. Environmental performance of an autonomous laser weeding robot—A case study. Int. J. Life Cycle Assess. 2024, 29, 1021–1052. [Google Scholar] [CrossRef] [Scilit]
- Du, X.; Li, X.; Duan, F.; Hua, J.; Hu, M. Static laser weeding system based on improved YOLOv8 and image fusion. J. Agric. Eng. 2024, 55. [Google Scholar] [CrossRef] [Scilit]
- Andreasen, C.; Vlassi, E.; Salehan, N. Laser weeding: Opportunities and challenges for couch grass (Elymus repens (L.) Gould) control. Sci. Rep. 2024, 14, 11173. [Google Scholar] [CrossRef] [Scilit] [PubMed]
- Batey, T. Soil compaction and soil management–a review. Soil Use Manag. 2009, 25, 335–345. [Google Scholar] [CrossRef] [Scilit]
- Zhang, Y.; Wang, X.; Zhou, Y.; Fu, L.; Xu, Y. Research on Field Weed Detection Methods for Sweet Corn Seedlings and Laser Weed Control Experiments. Agriculture 2026, 16, 1237. [Google Scholar] [CrossRef] [Scilit]
- Li, Q.; Zhuo, Z.; Gao, R.; Wang, R.; Zhang, N.; Shi, Y.; Wu, T.; Ma, W. A pig behavior-tracking method based on a multi-channel high-efficiency attention mechanism. Agric. Commun. 2024, 2, 100062. [Google Scholar] [CrossRef] [Scilit]
- Wang, Z.; Fei, S.; Shao, K.; Yang, Z.; Wang, R.; Sui, Y.; Ma, Y. Beetroot type classification based on 3D structure constructed with neural radiance fields. Comput. Electron. Agric. 2026, 248, 111790. [Google Scholar] [CrossRef] [Scilit]
- Li, Z.; Zhu, Y.; Sui, S.; Zhao, Y.; Liu, P.; Li, X. Real-time detection and counting of wheat ears based on improved YOLOv7. Comput. Electron. Agric. 2024, 218, 108670. [Google Scholar] [CrossRef] [Scilit]
- Lv, Y.; Guo, Q.; Jia, X. Multi-Target Pedestrian Tracking Method in Complex Environments Based on Improved YOLOv7 and BoT-SORT. IAENG Int. J. Comput. Sci. 2024, 51, 1845–1852. [Google Scholar]
- Wu, N.; Wu, J.; Wang, Z.; Zhao, Y.; Xu, X.; Wang, Y.; Skobelev, P.; Mi, Y. Maturity detection and counting of blueberries in real orchards using a 1novel STF-YOLO model integrated with ByteTrack algorithm. Front. Plant Sci. 2025, 16, 1682024. [Google Scholar] [CrossRef] [Scilit] [PubMed]
- Renfei, C.; Zhongwen, L.; Zeyang, Z. A novel method for surface defect inspection: Unsupervised continual learning for gradually varying domains. Eng. Appl. Artif. Intell. 2025, 155, 111150. [Google Scholar] [CrossRef] [Scilit]
- Wang, C.; Zhu, R.; Jiang, Y.; Liu, W.; Jeon, S.W.; Sun, L.; Wang, H. A Scheme Library-Based Ant Colony Optimization with 2-Opt Local Search for Dynamic Traveling Salesman Problem. Comput. Model. Eng. Sci. 2022, 135, 1209–1228. [Google Scholar] [CrossRef] [Scilit]
- Gao, R.; Xu, J.; Li, W.; Liu, X. A necessary and sufficient RHC stabilizability condition for stochastic control with delayed input. Appl. Math. Comput. 2019, 360, 122–130. [Google Scholar] [CrossRef] [Scilit]
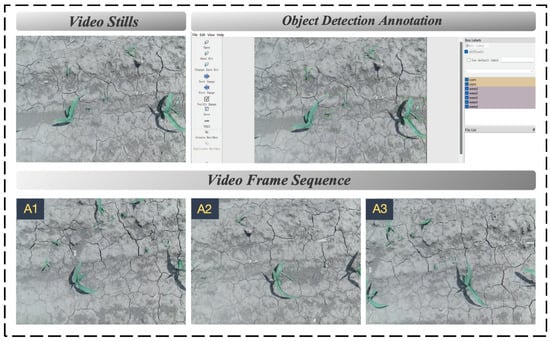
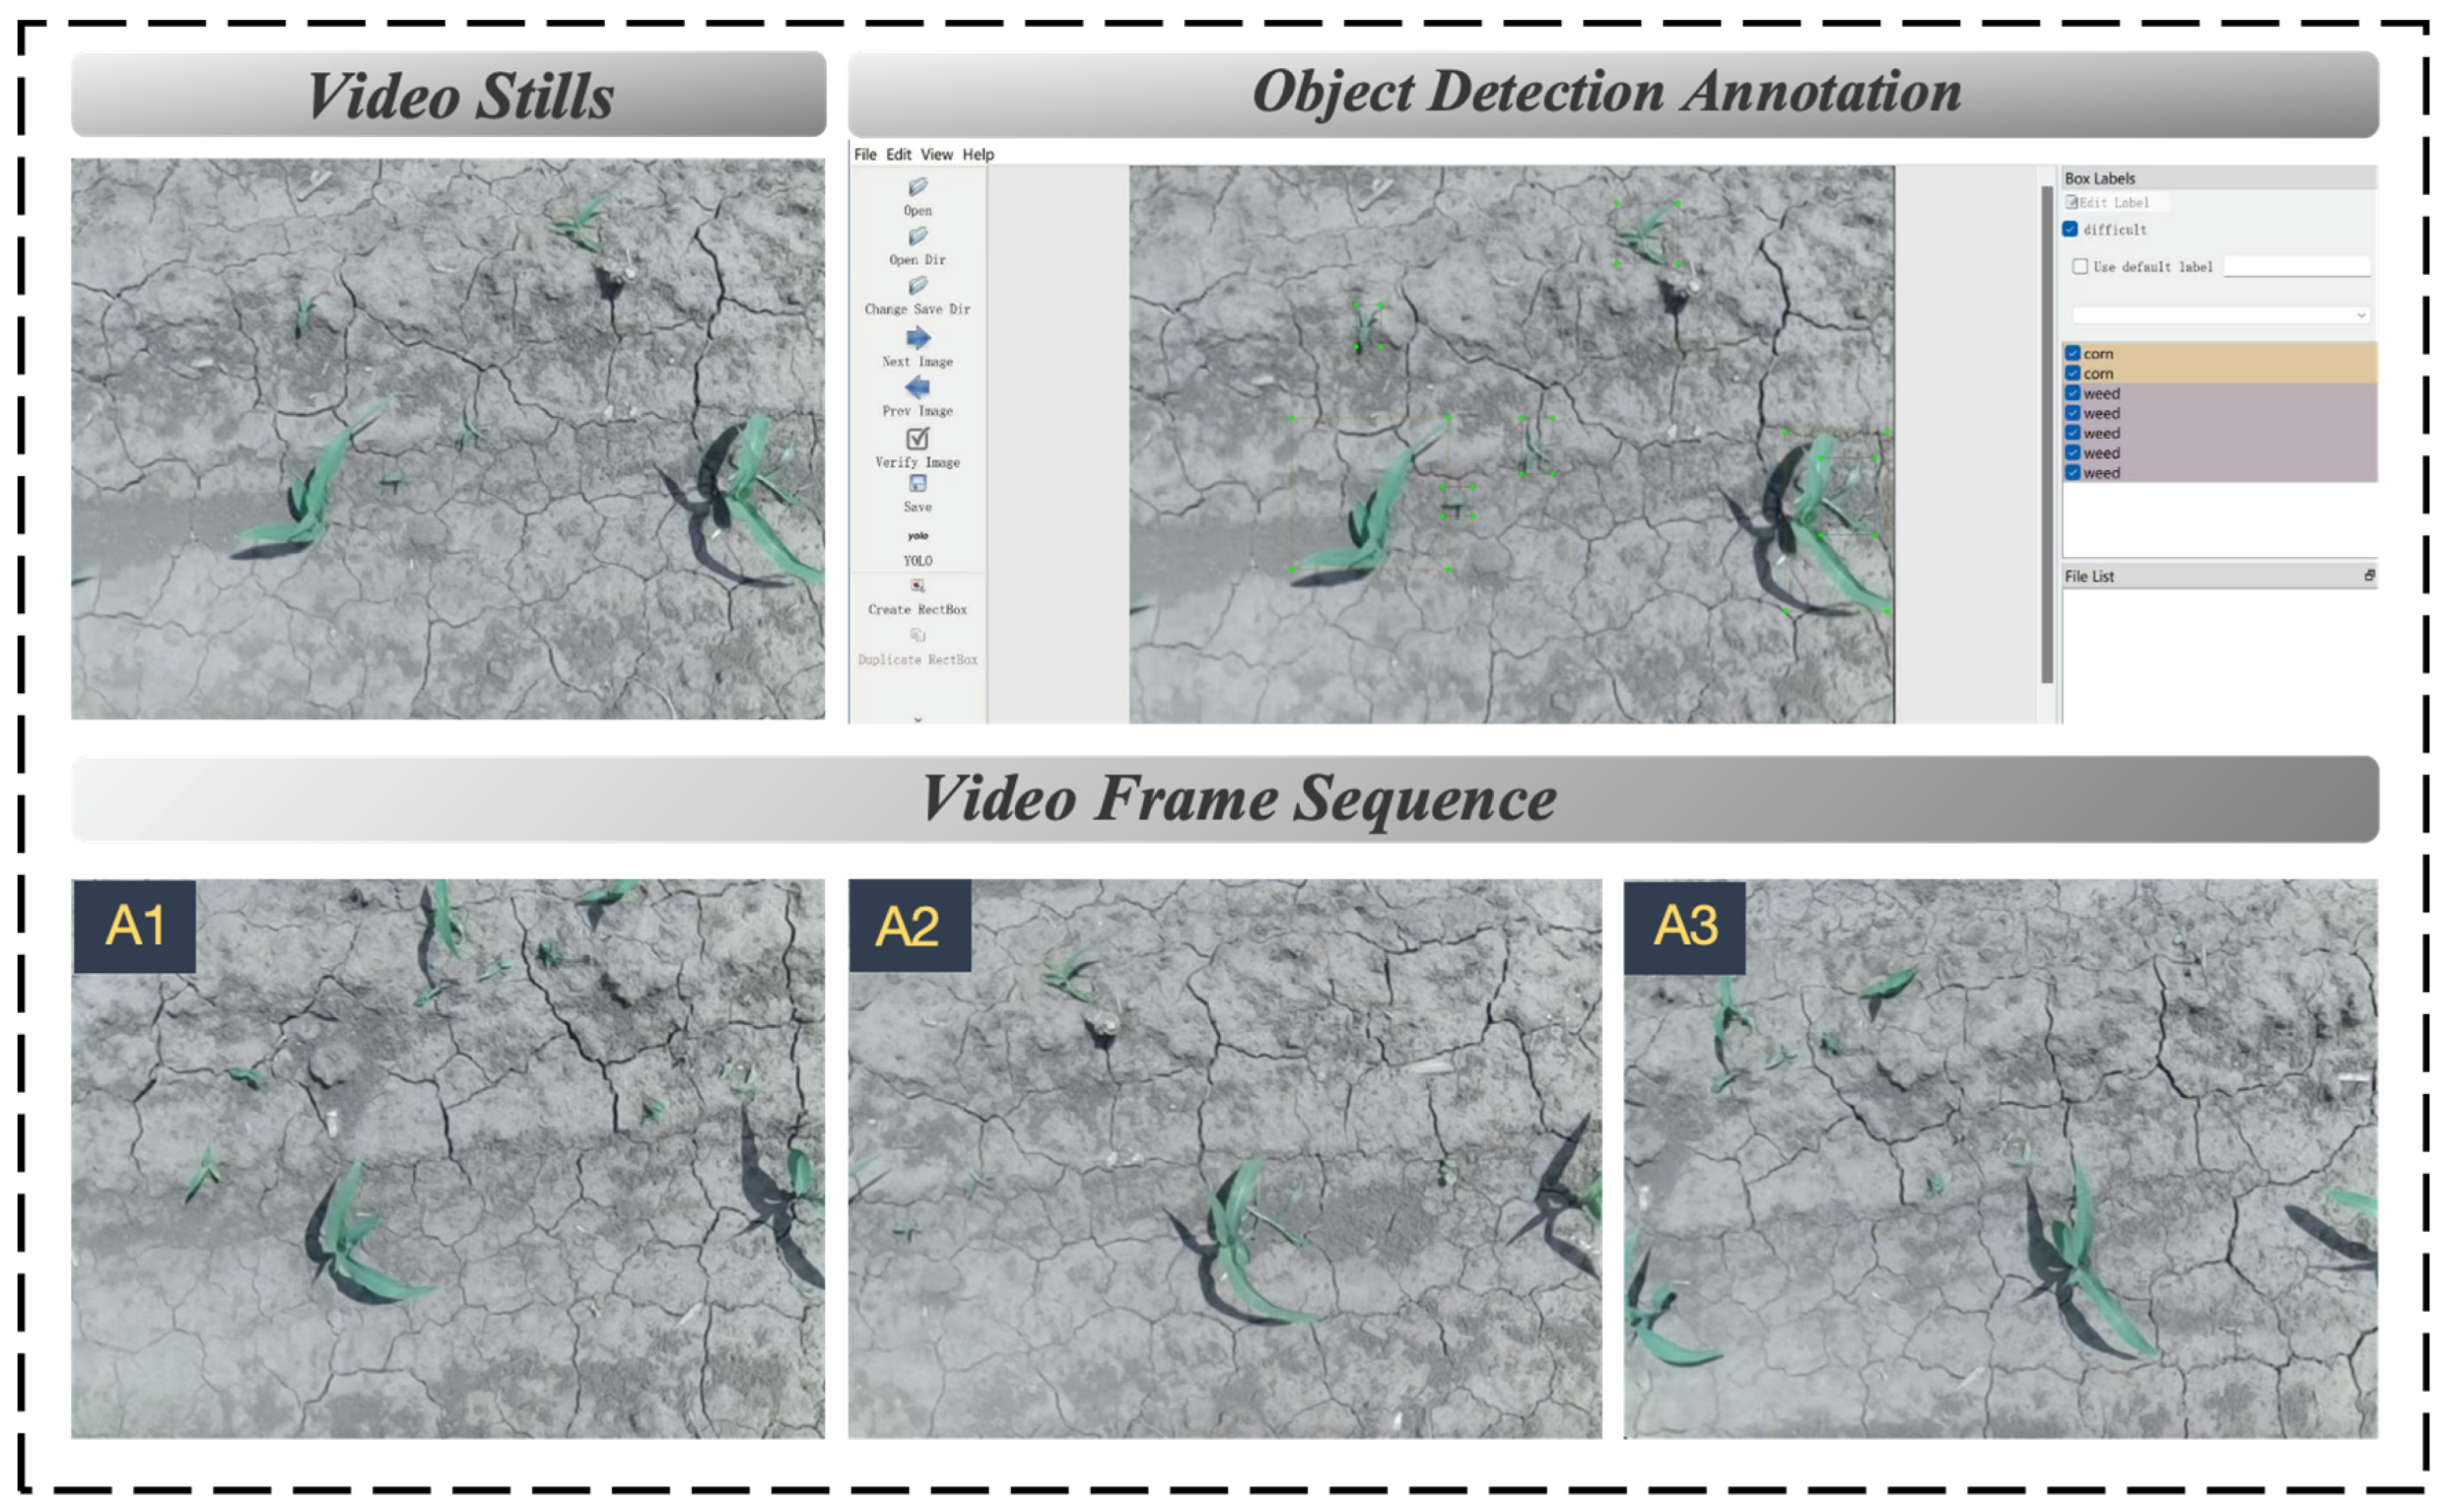
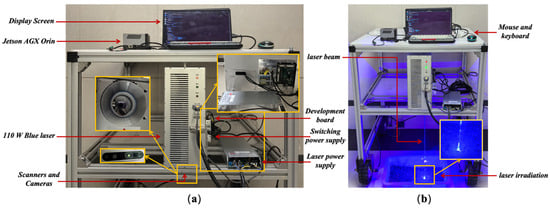
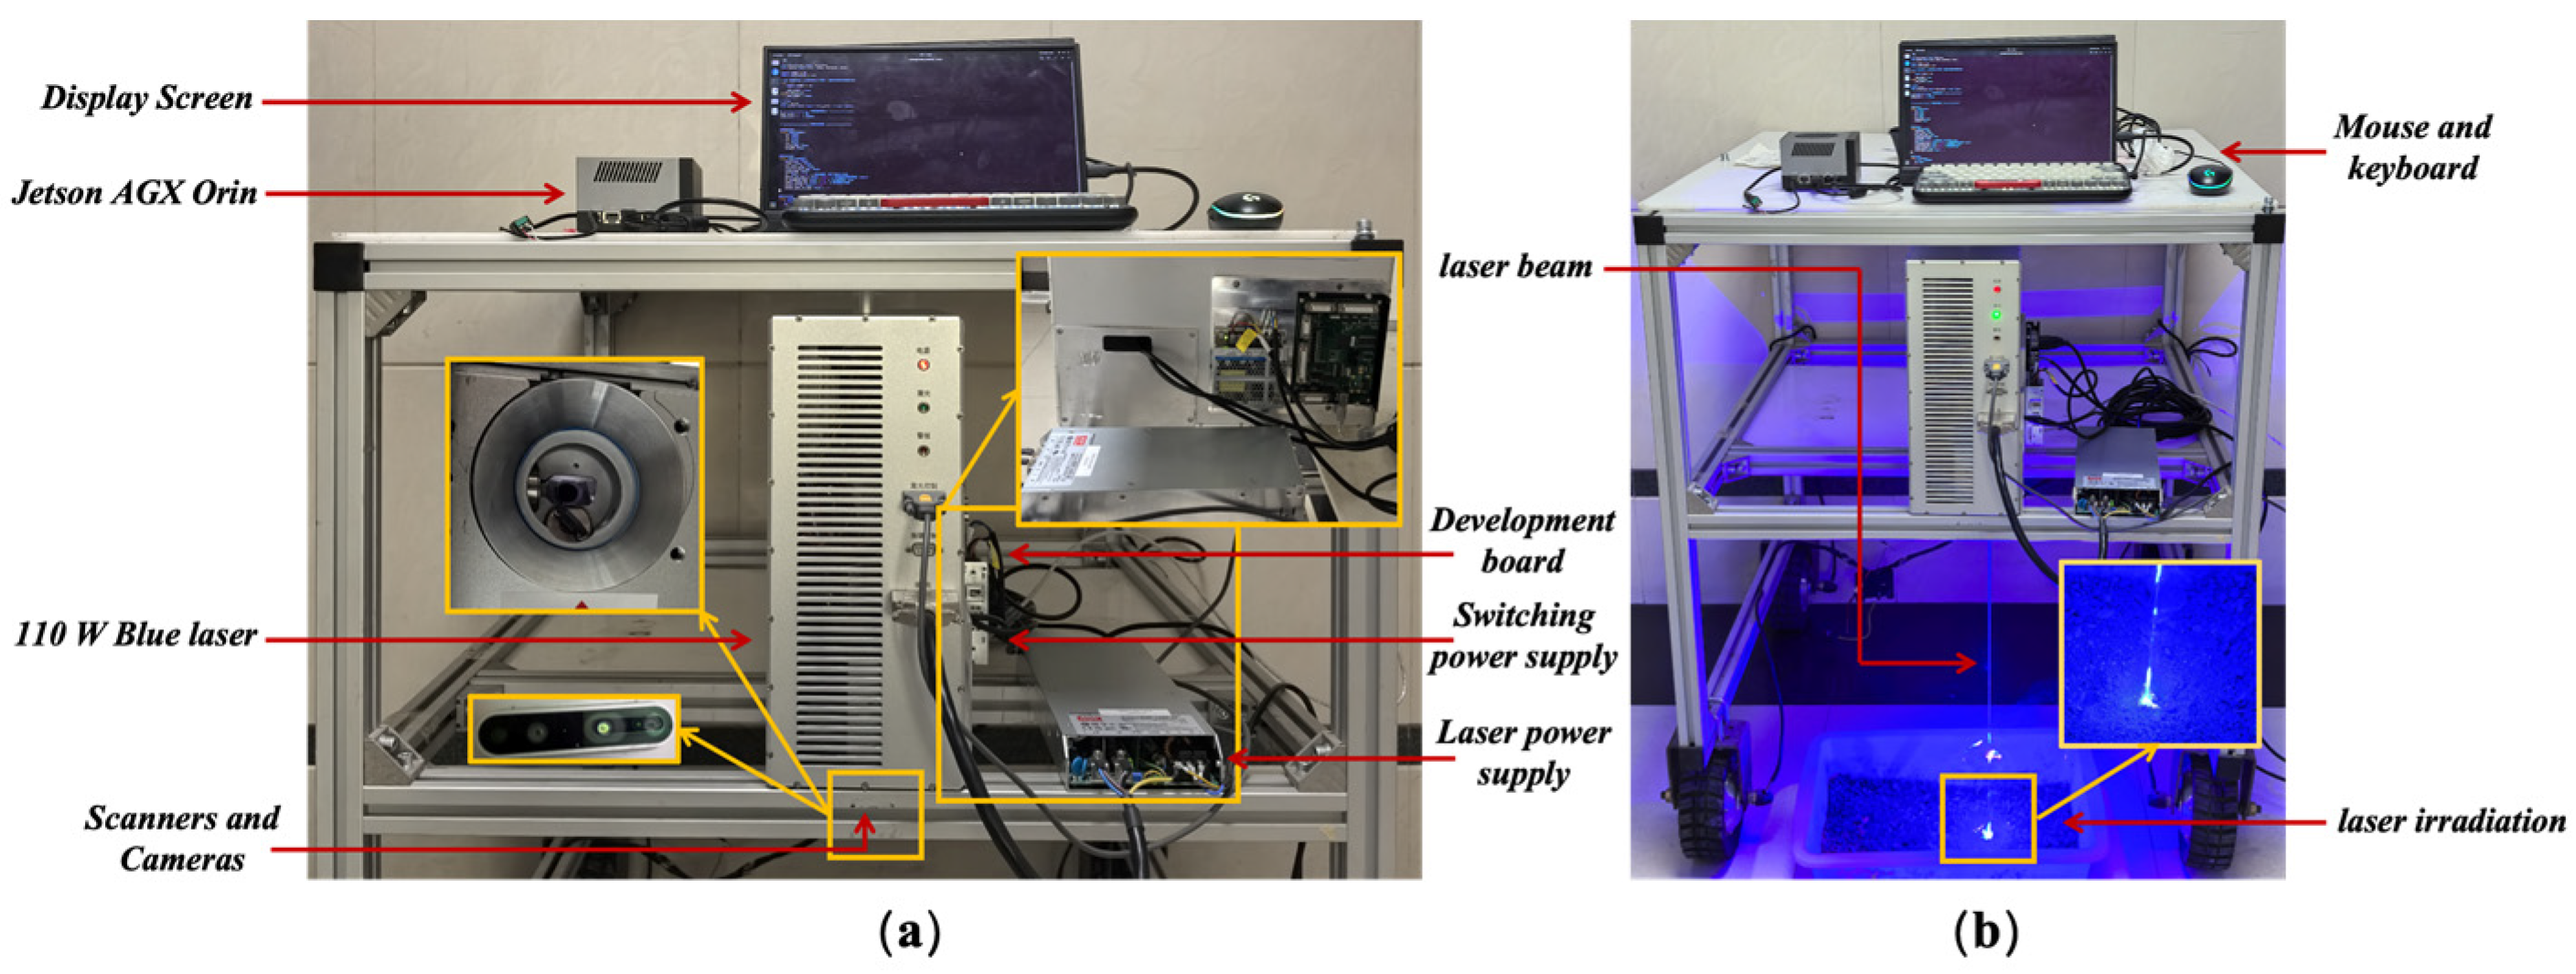
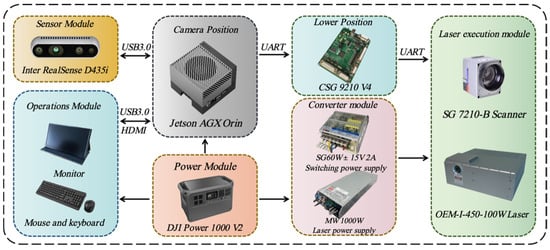
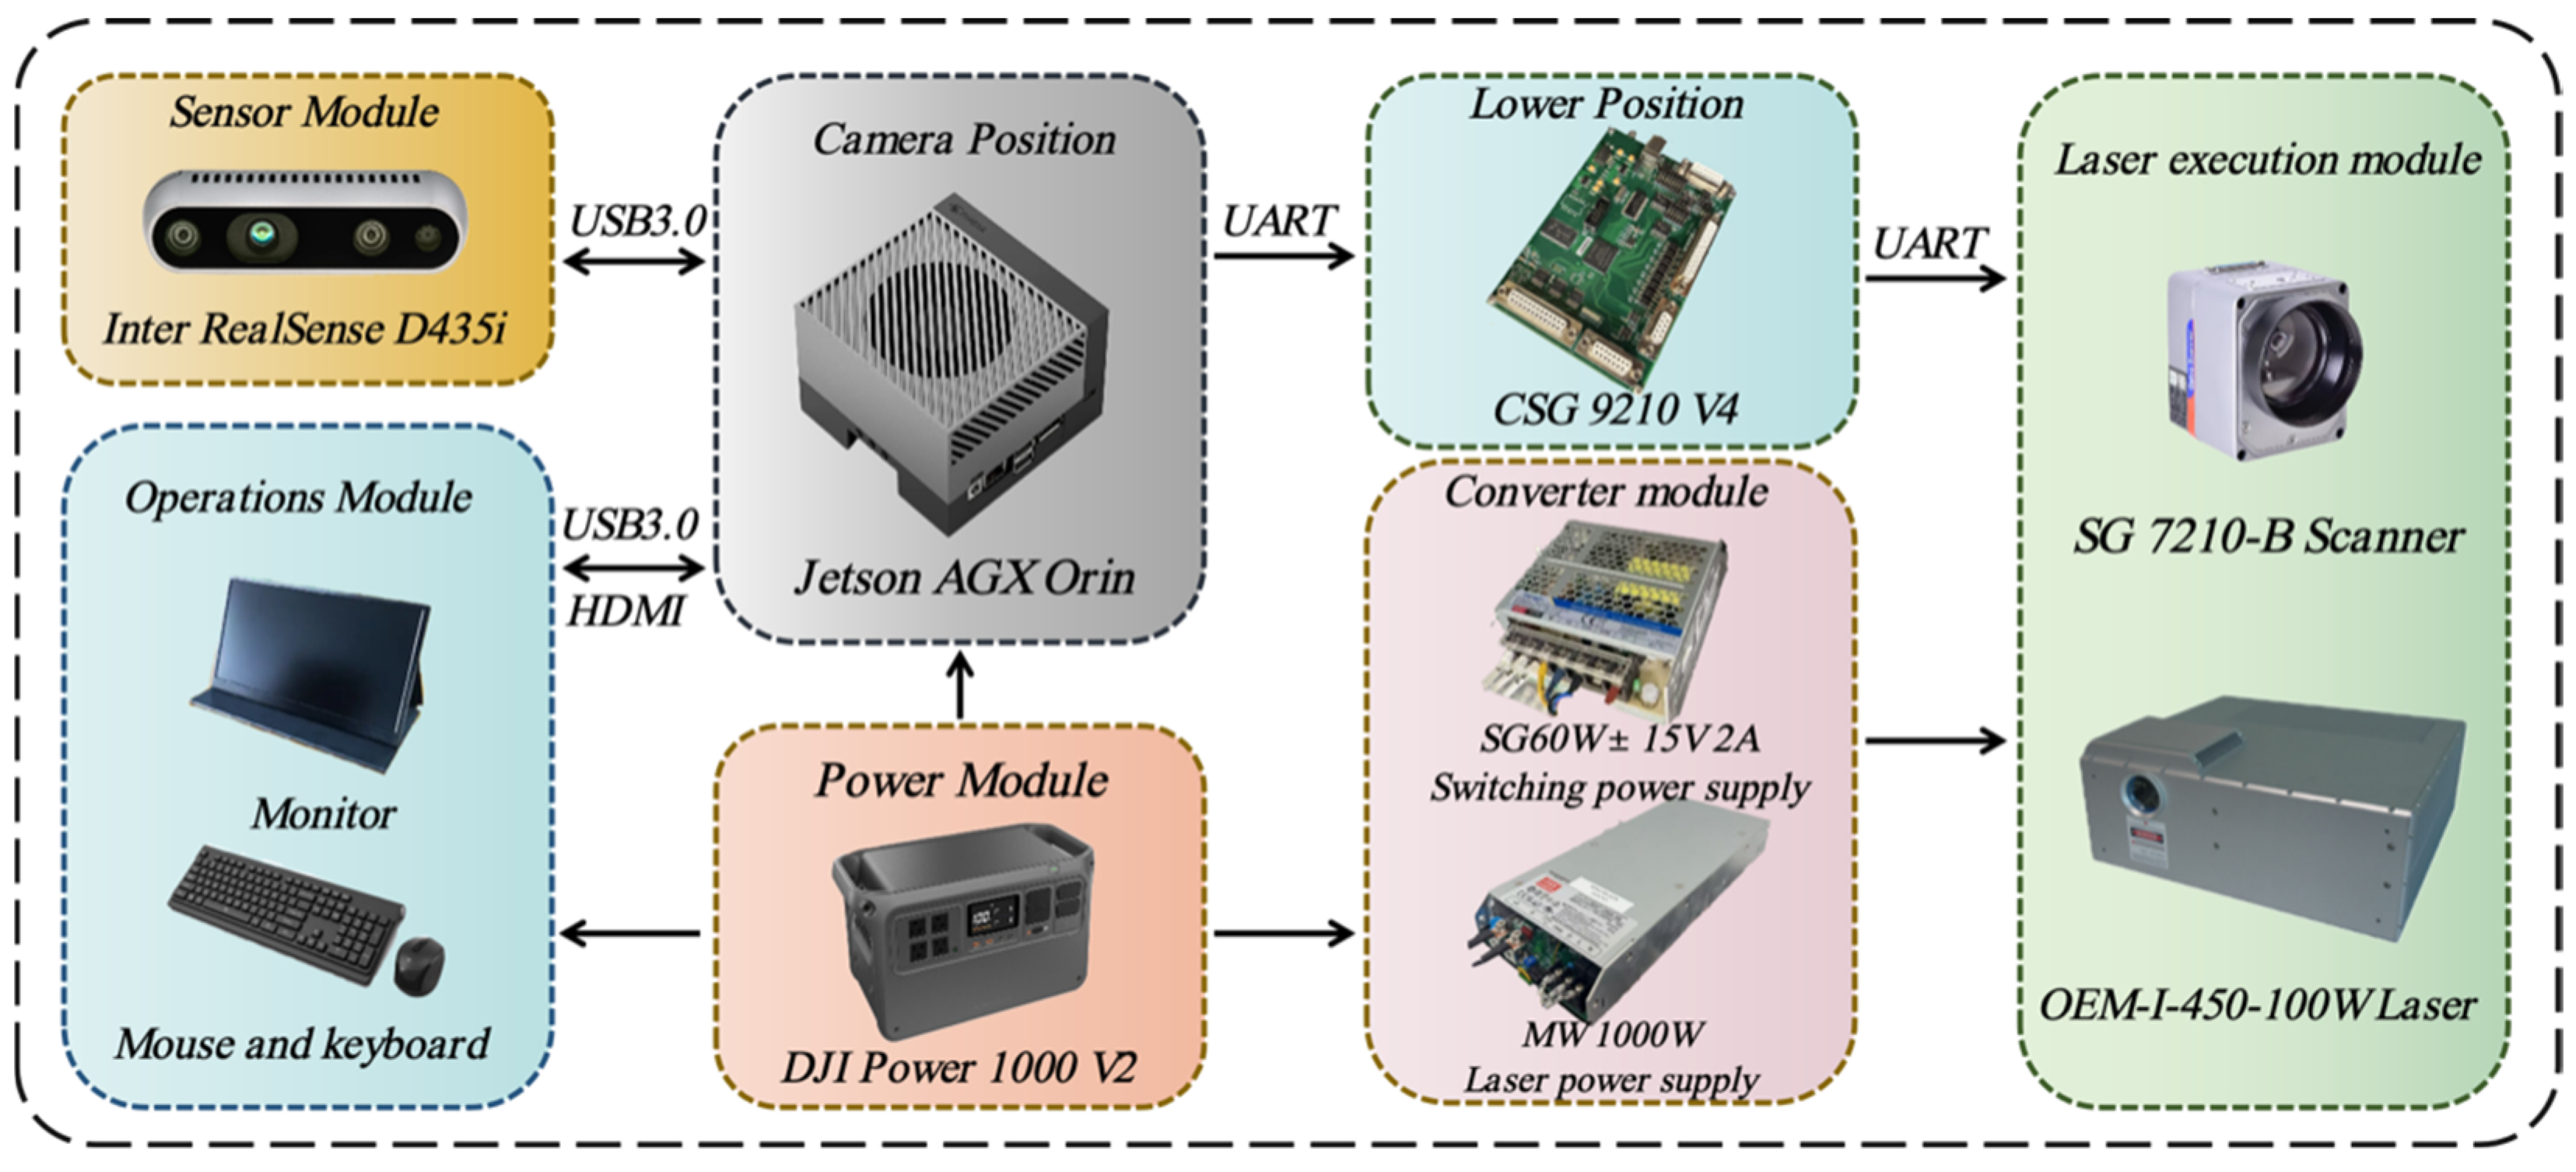
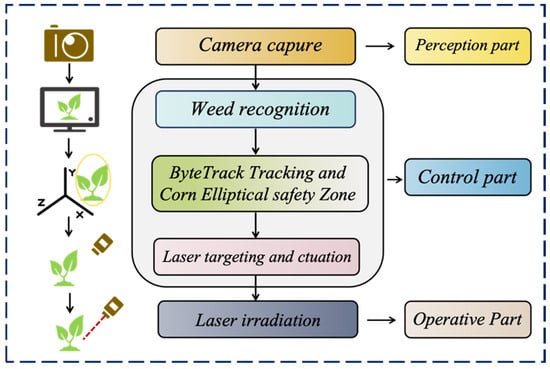
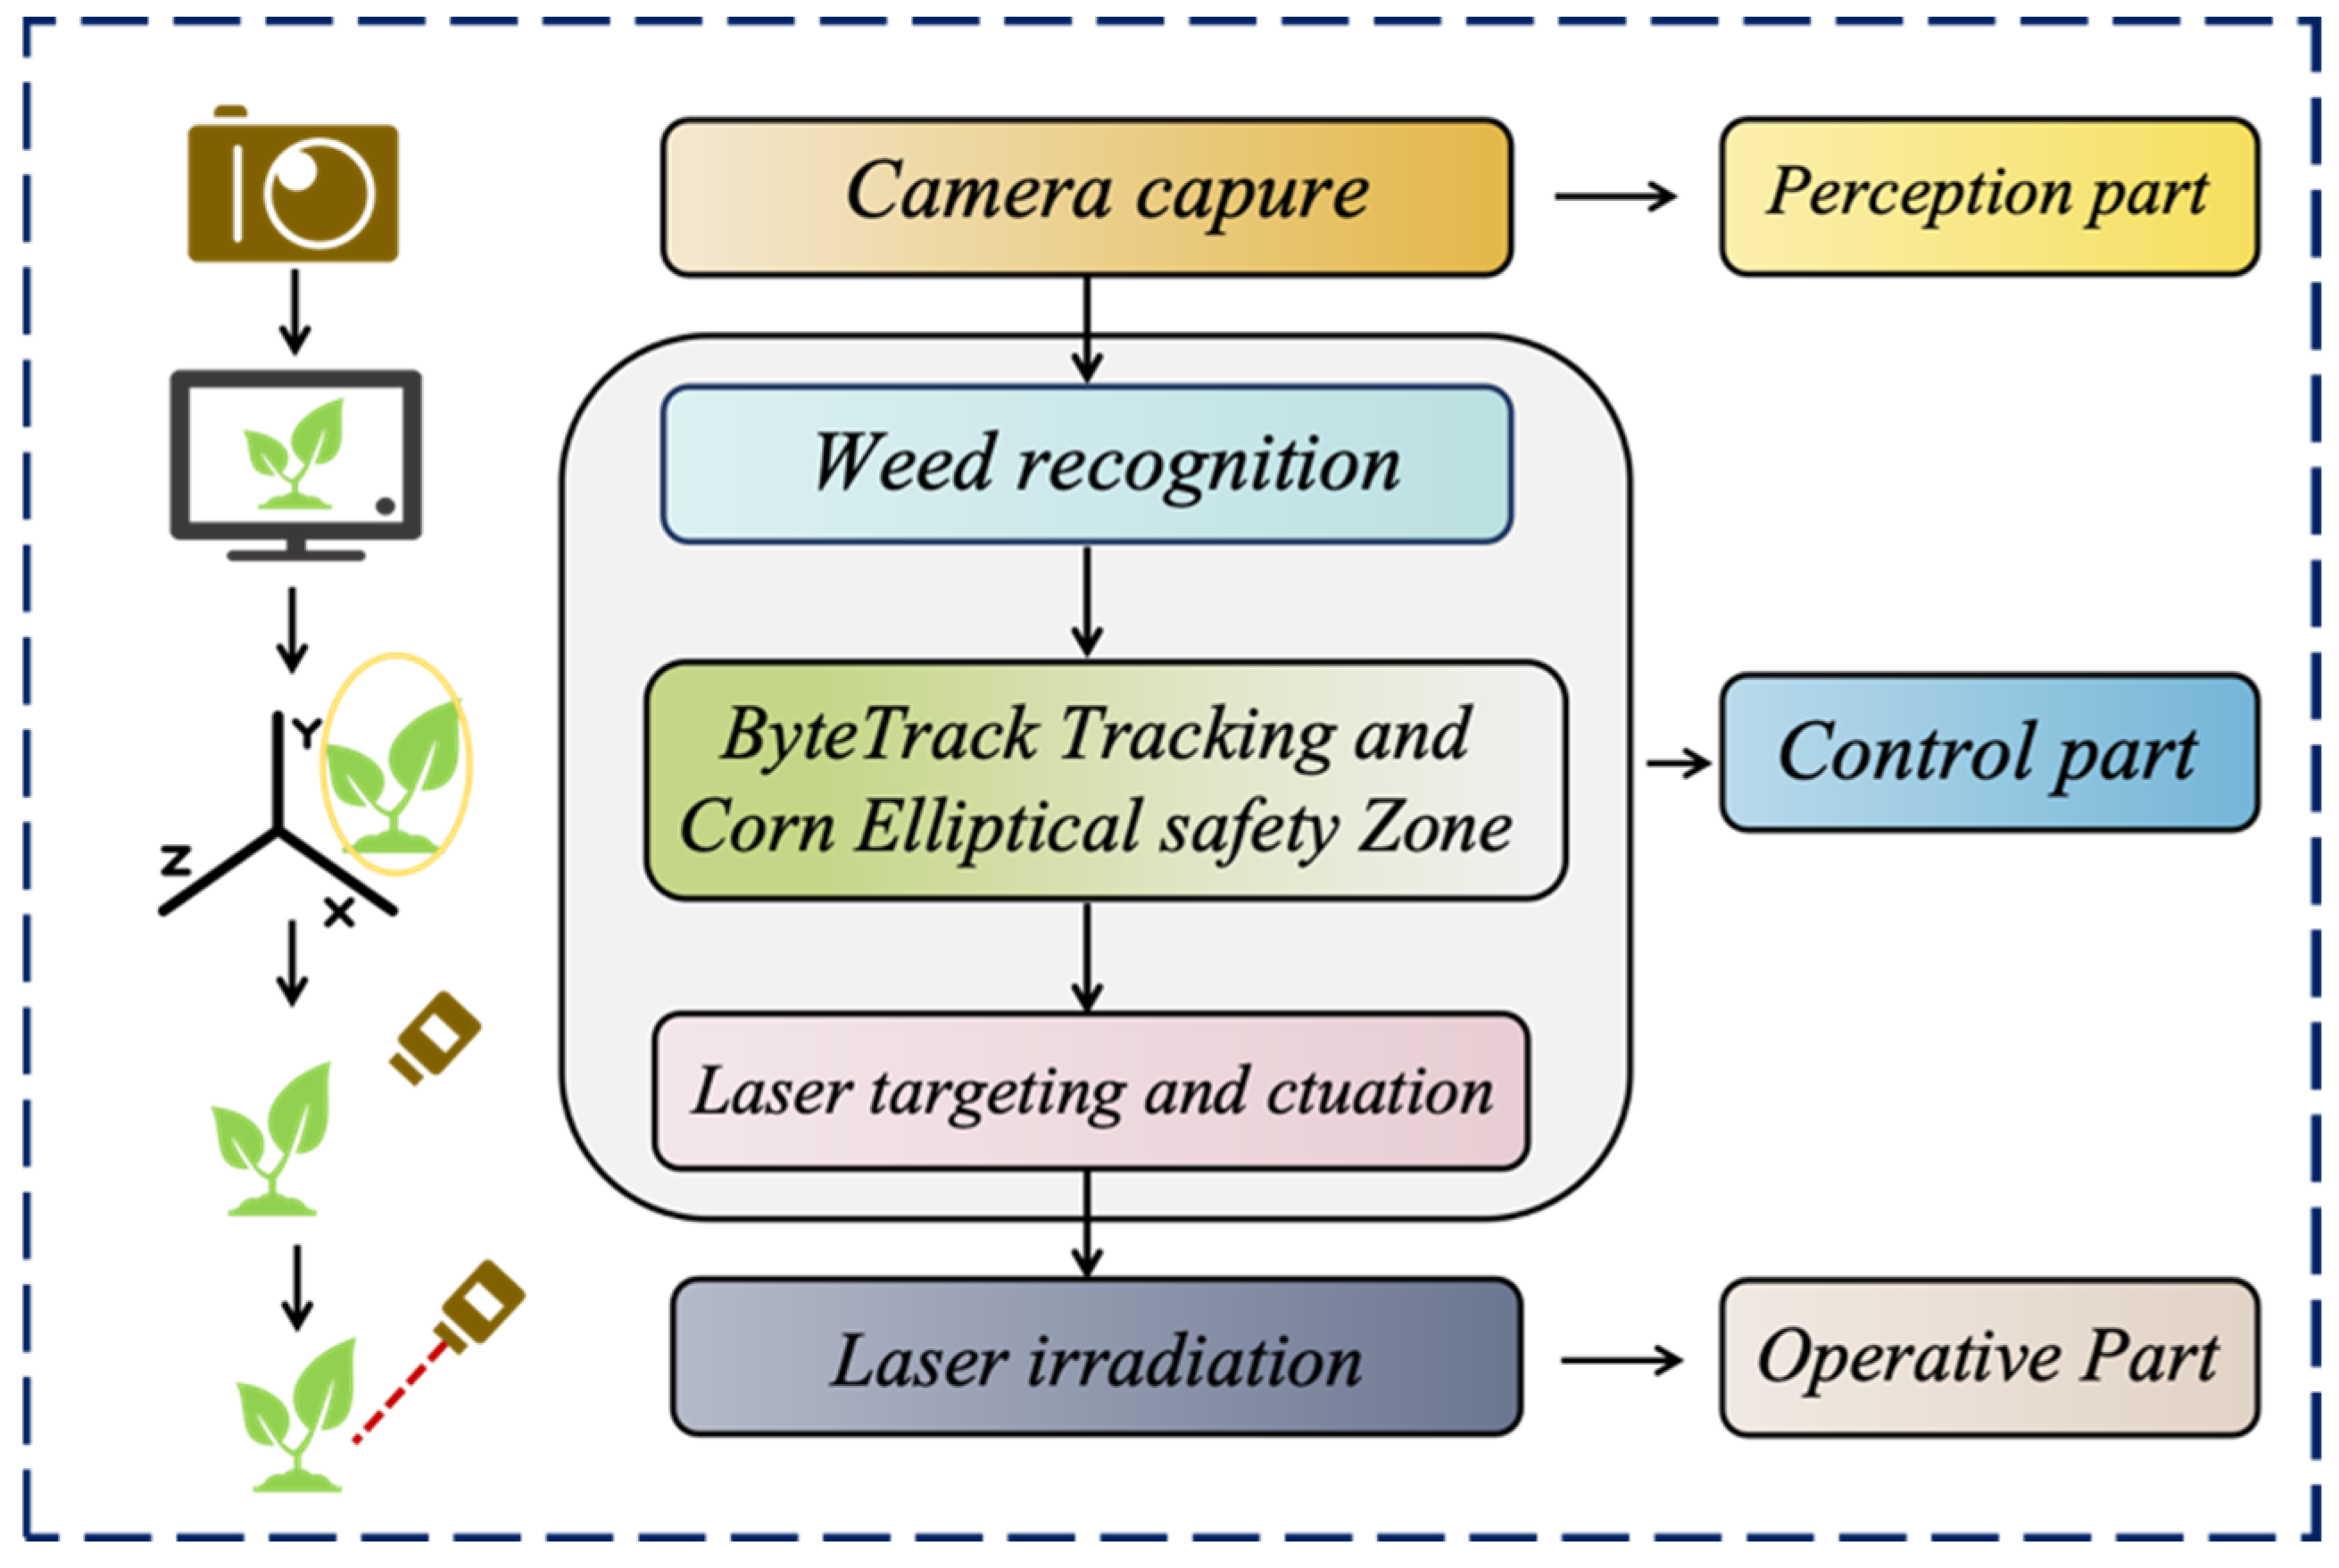
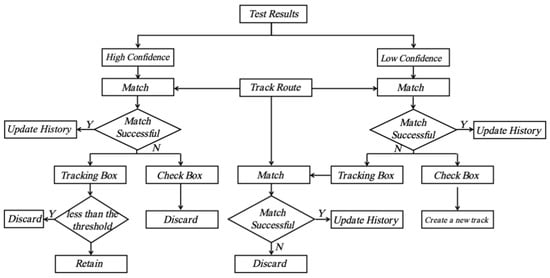
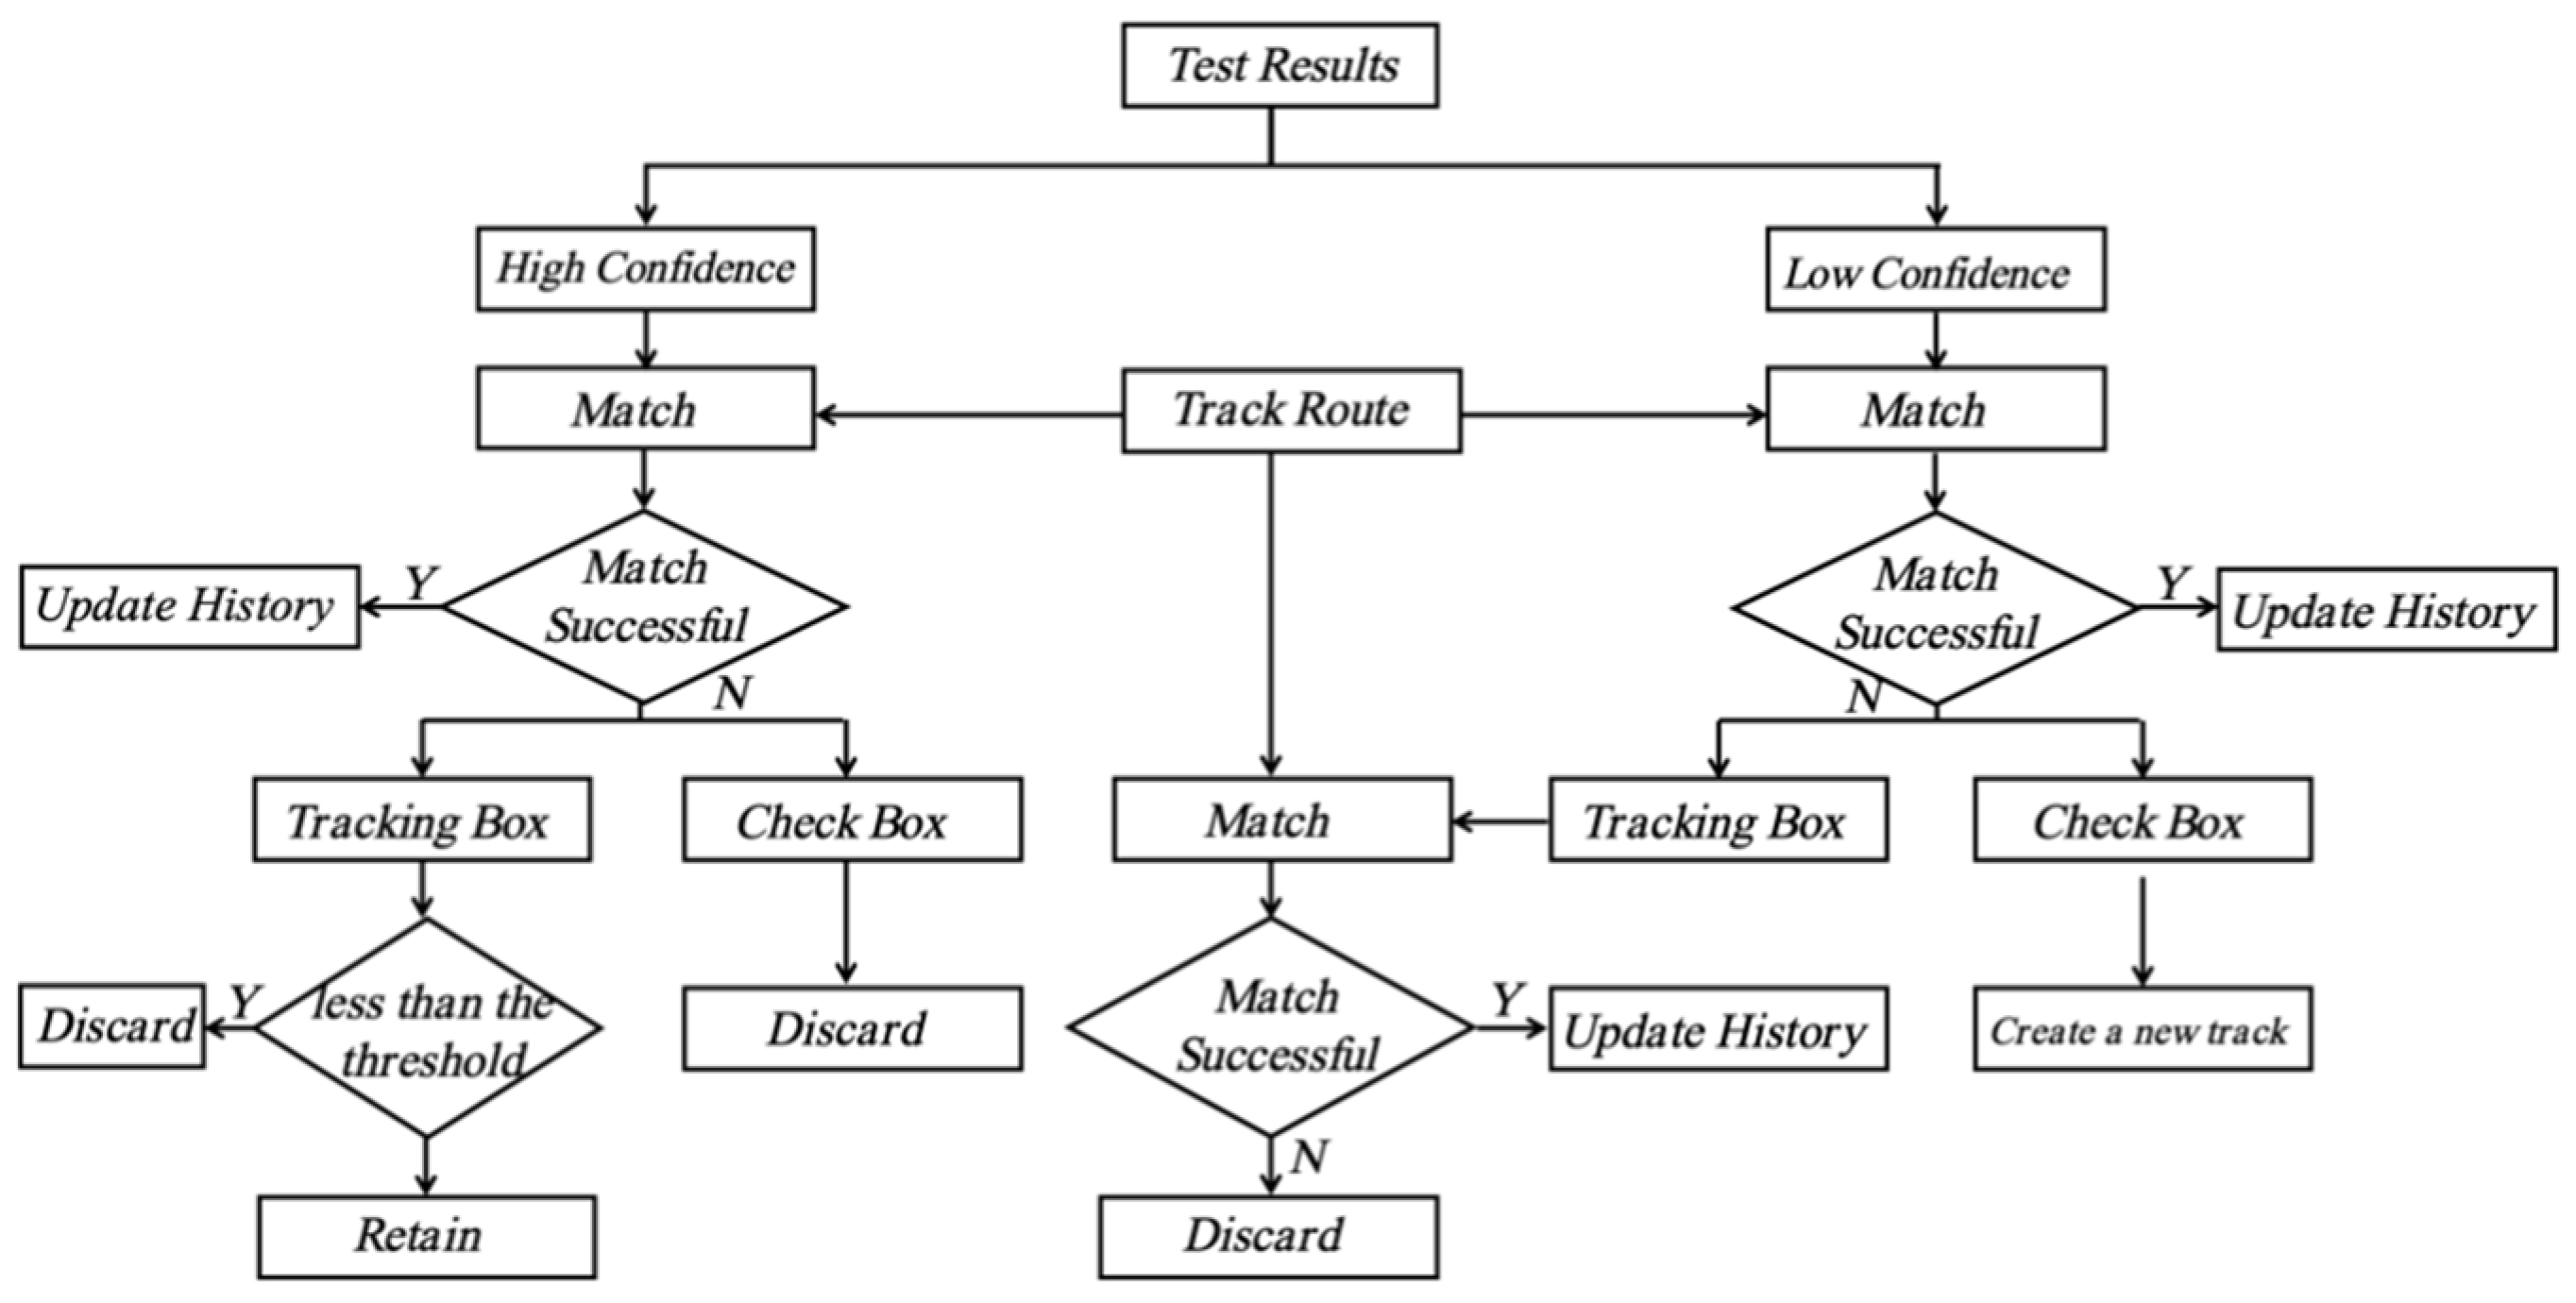
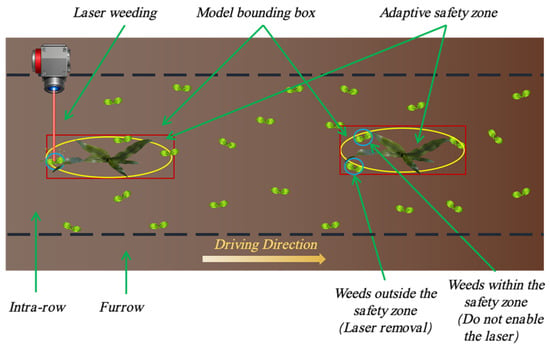
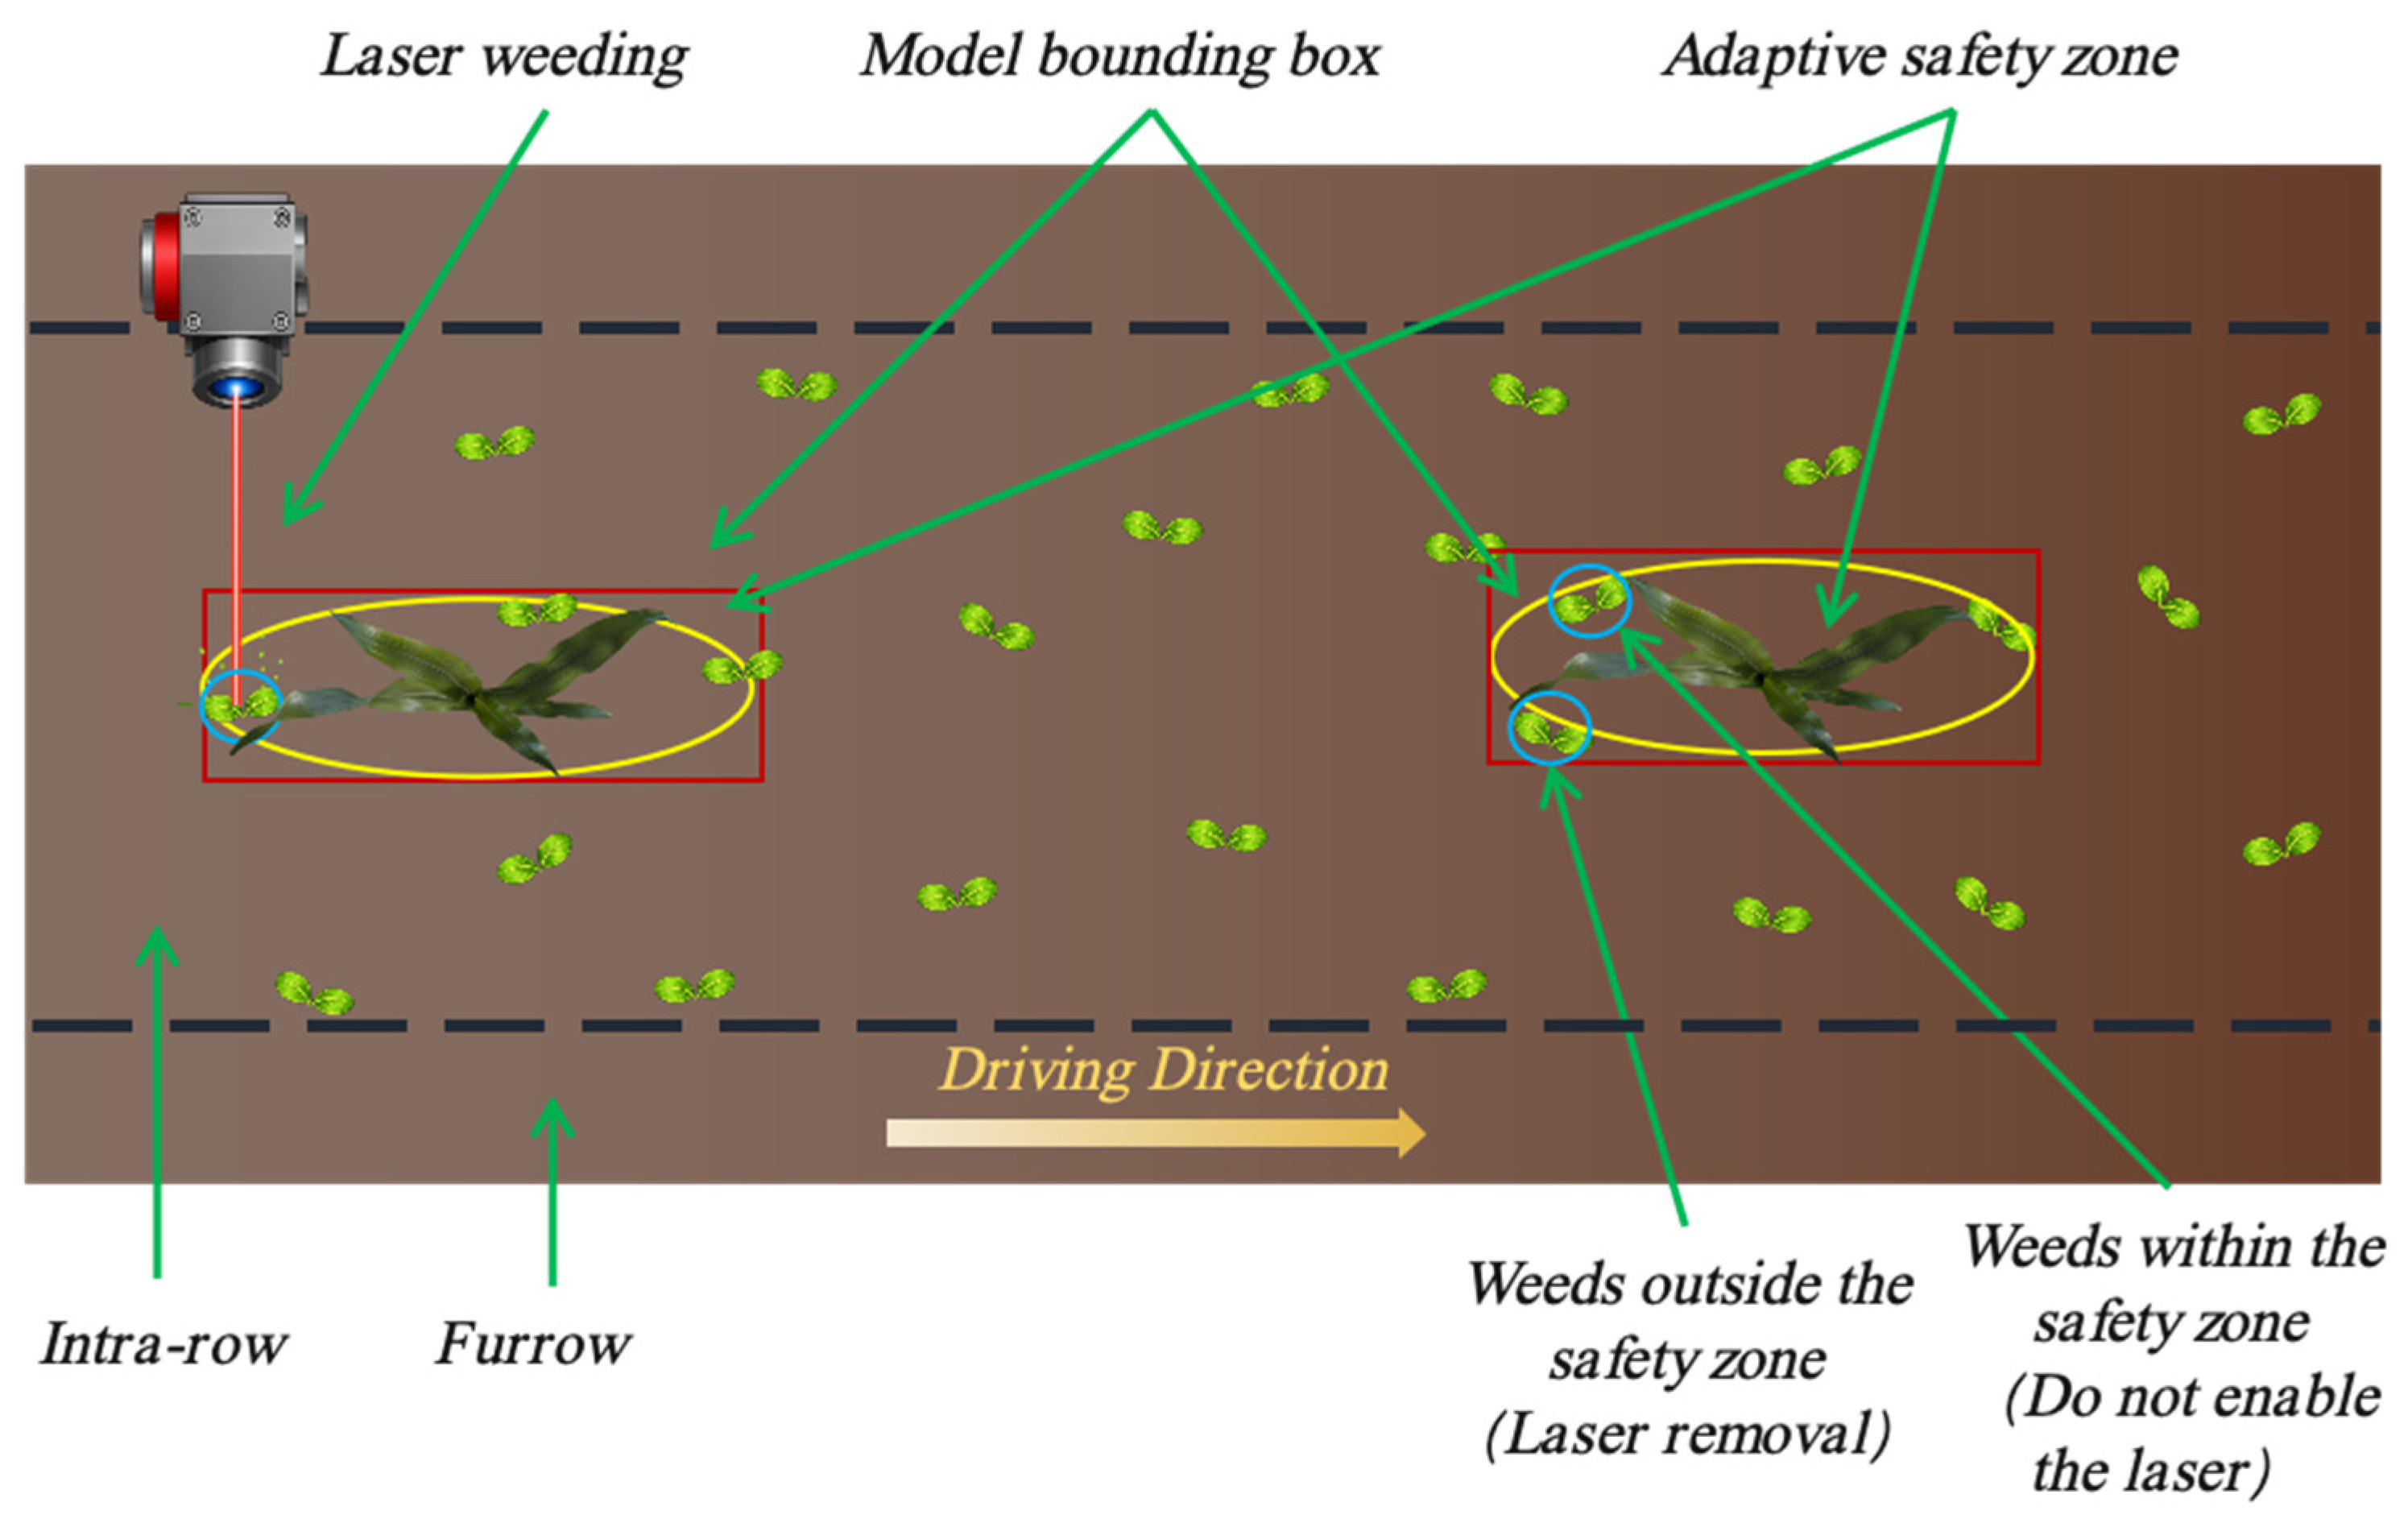
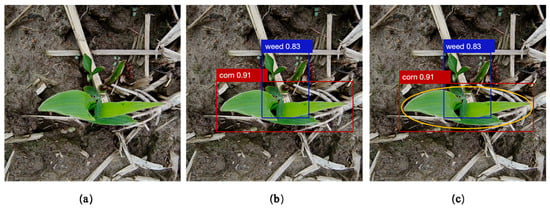
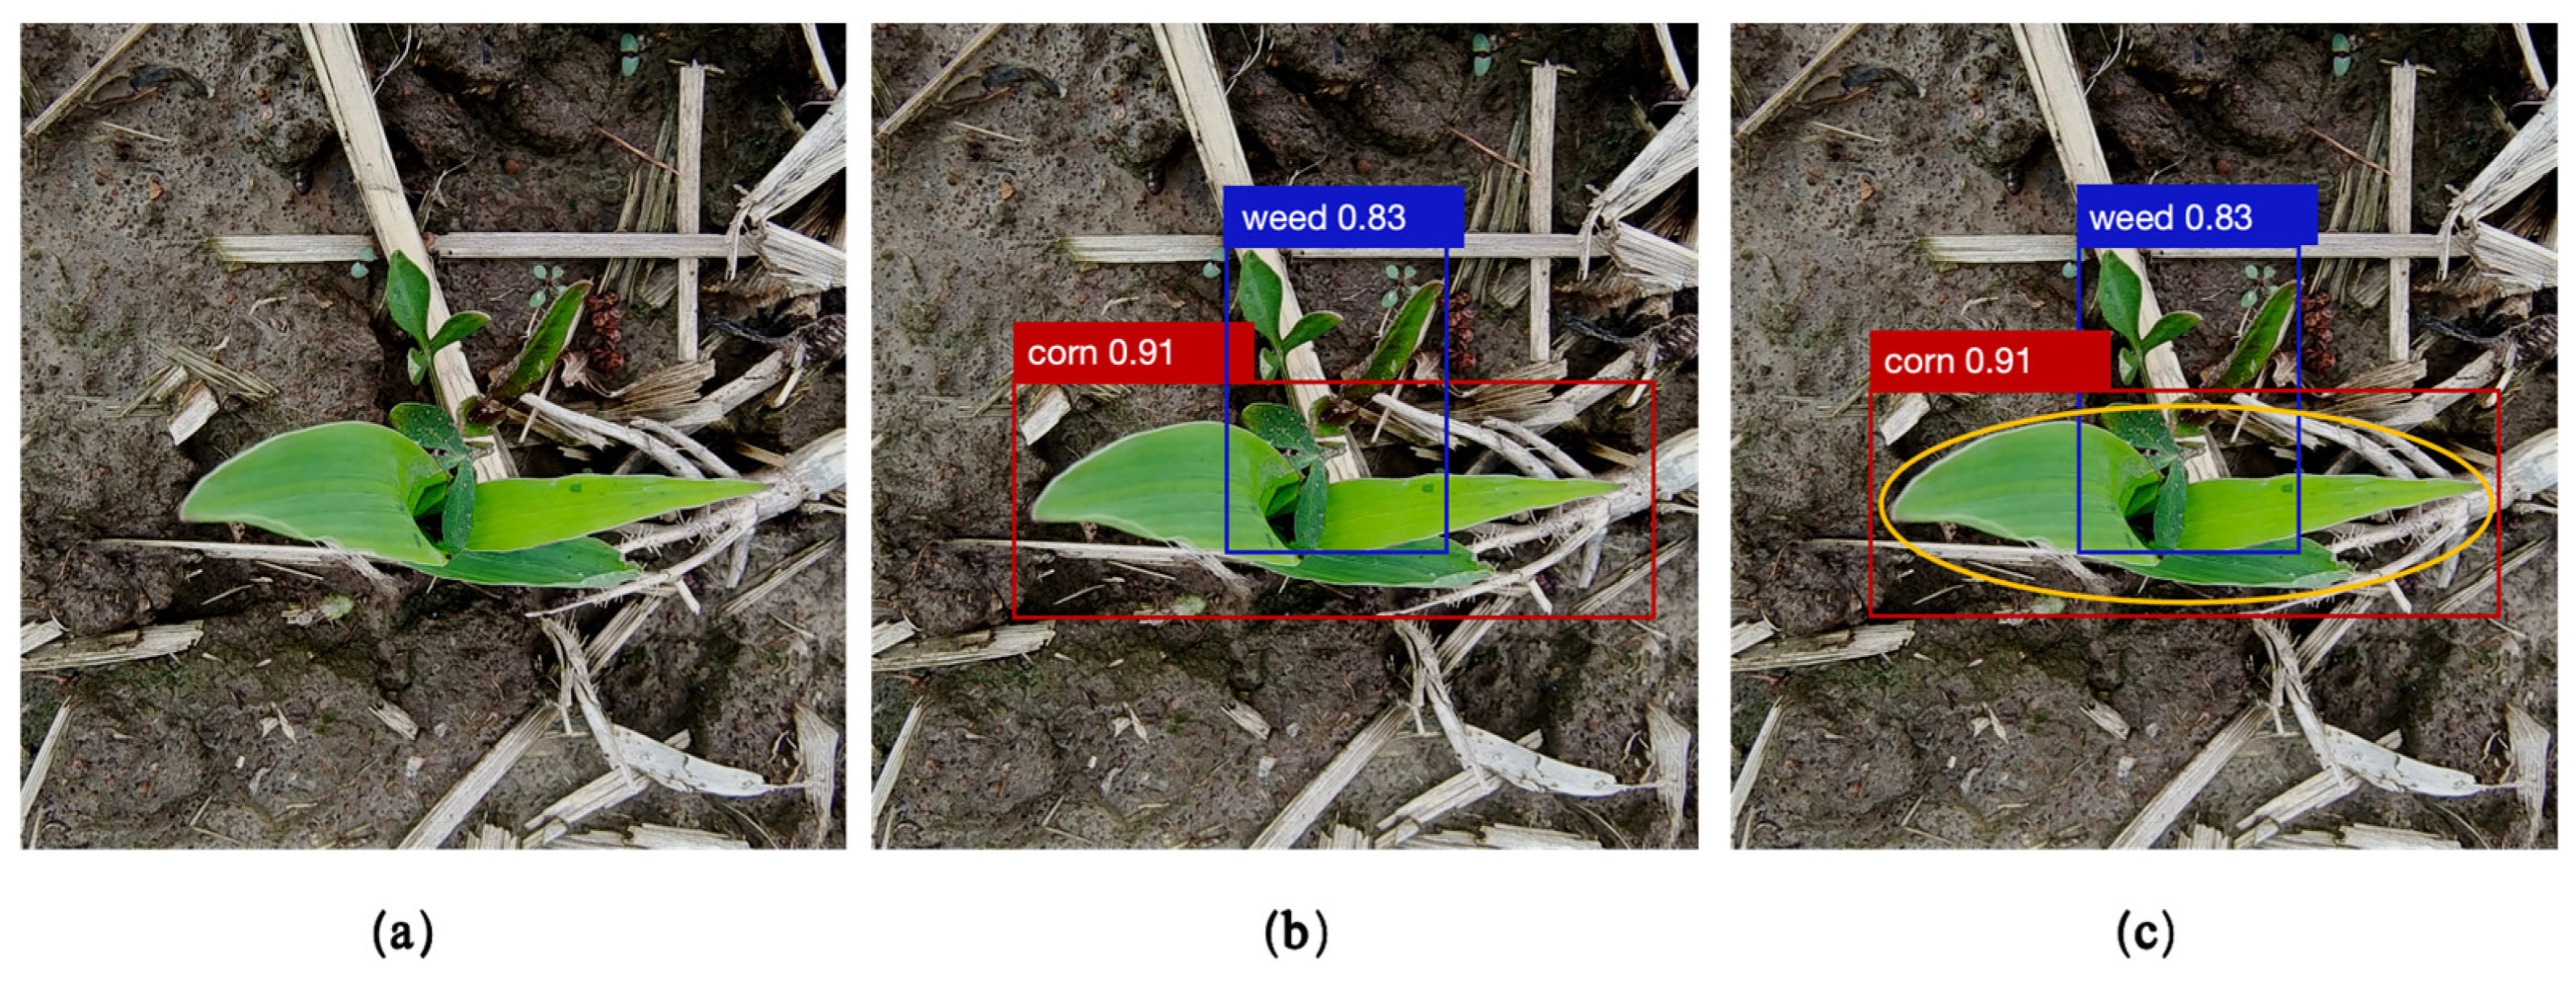
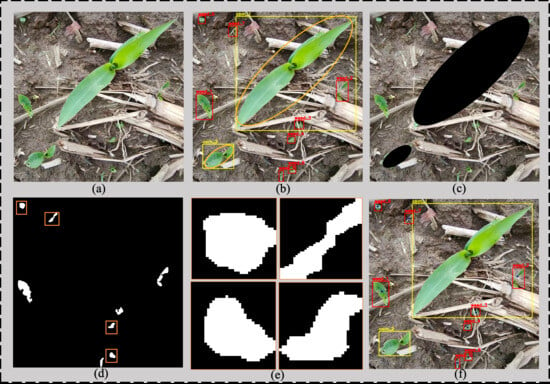
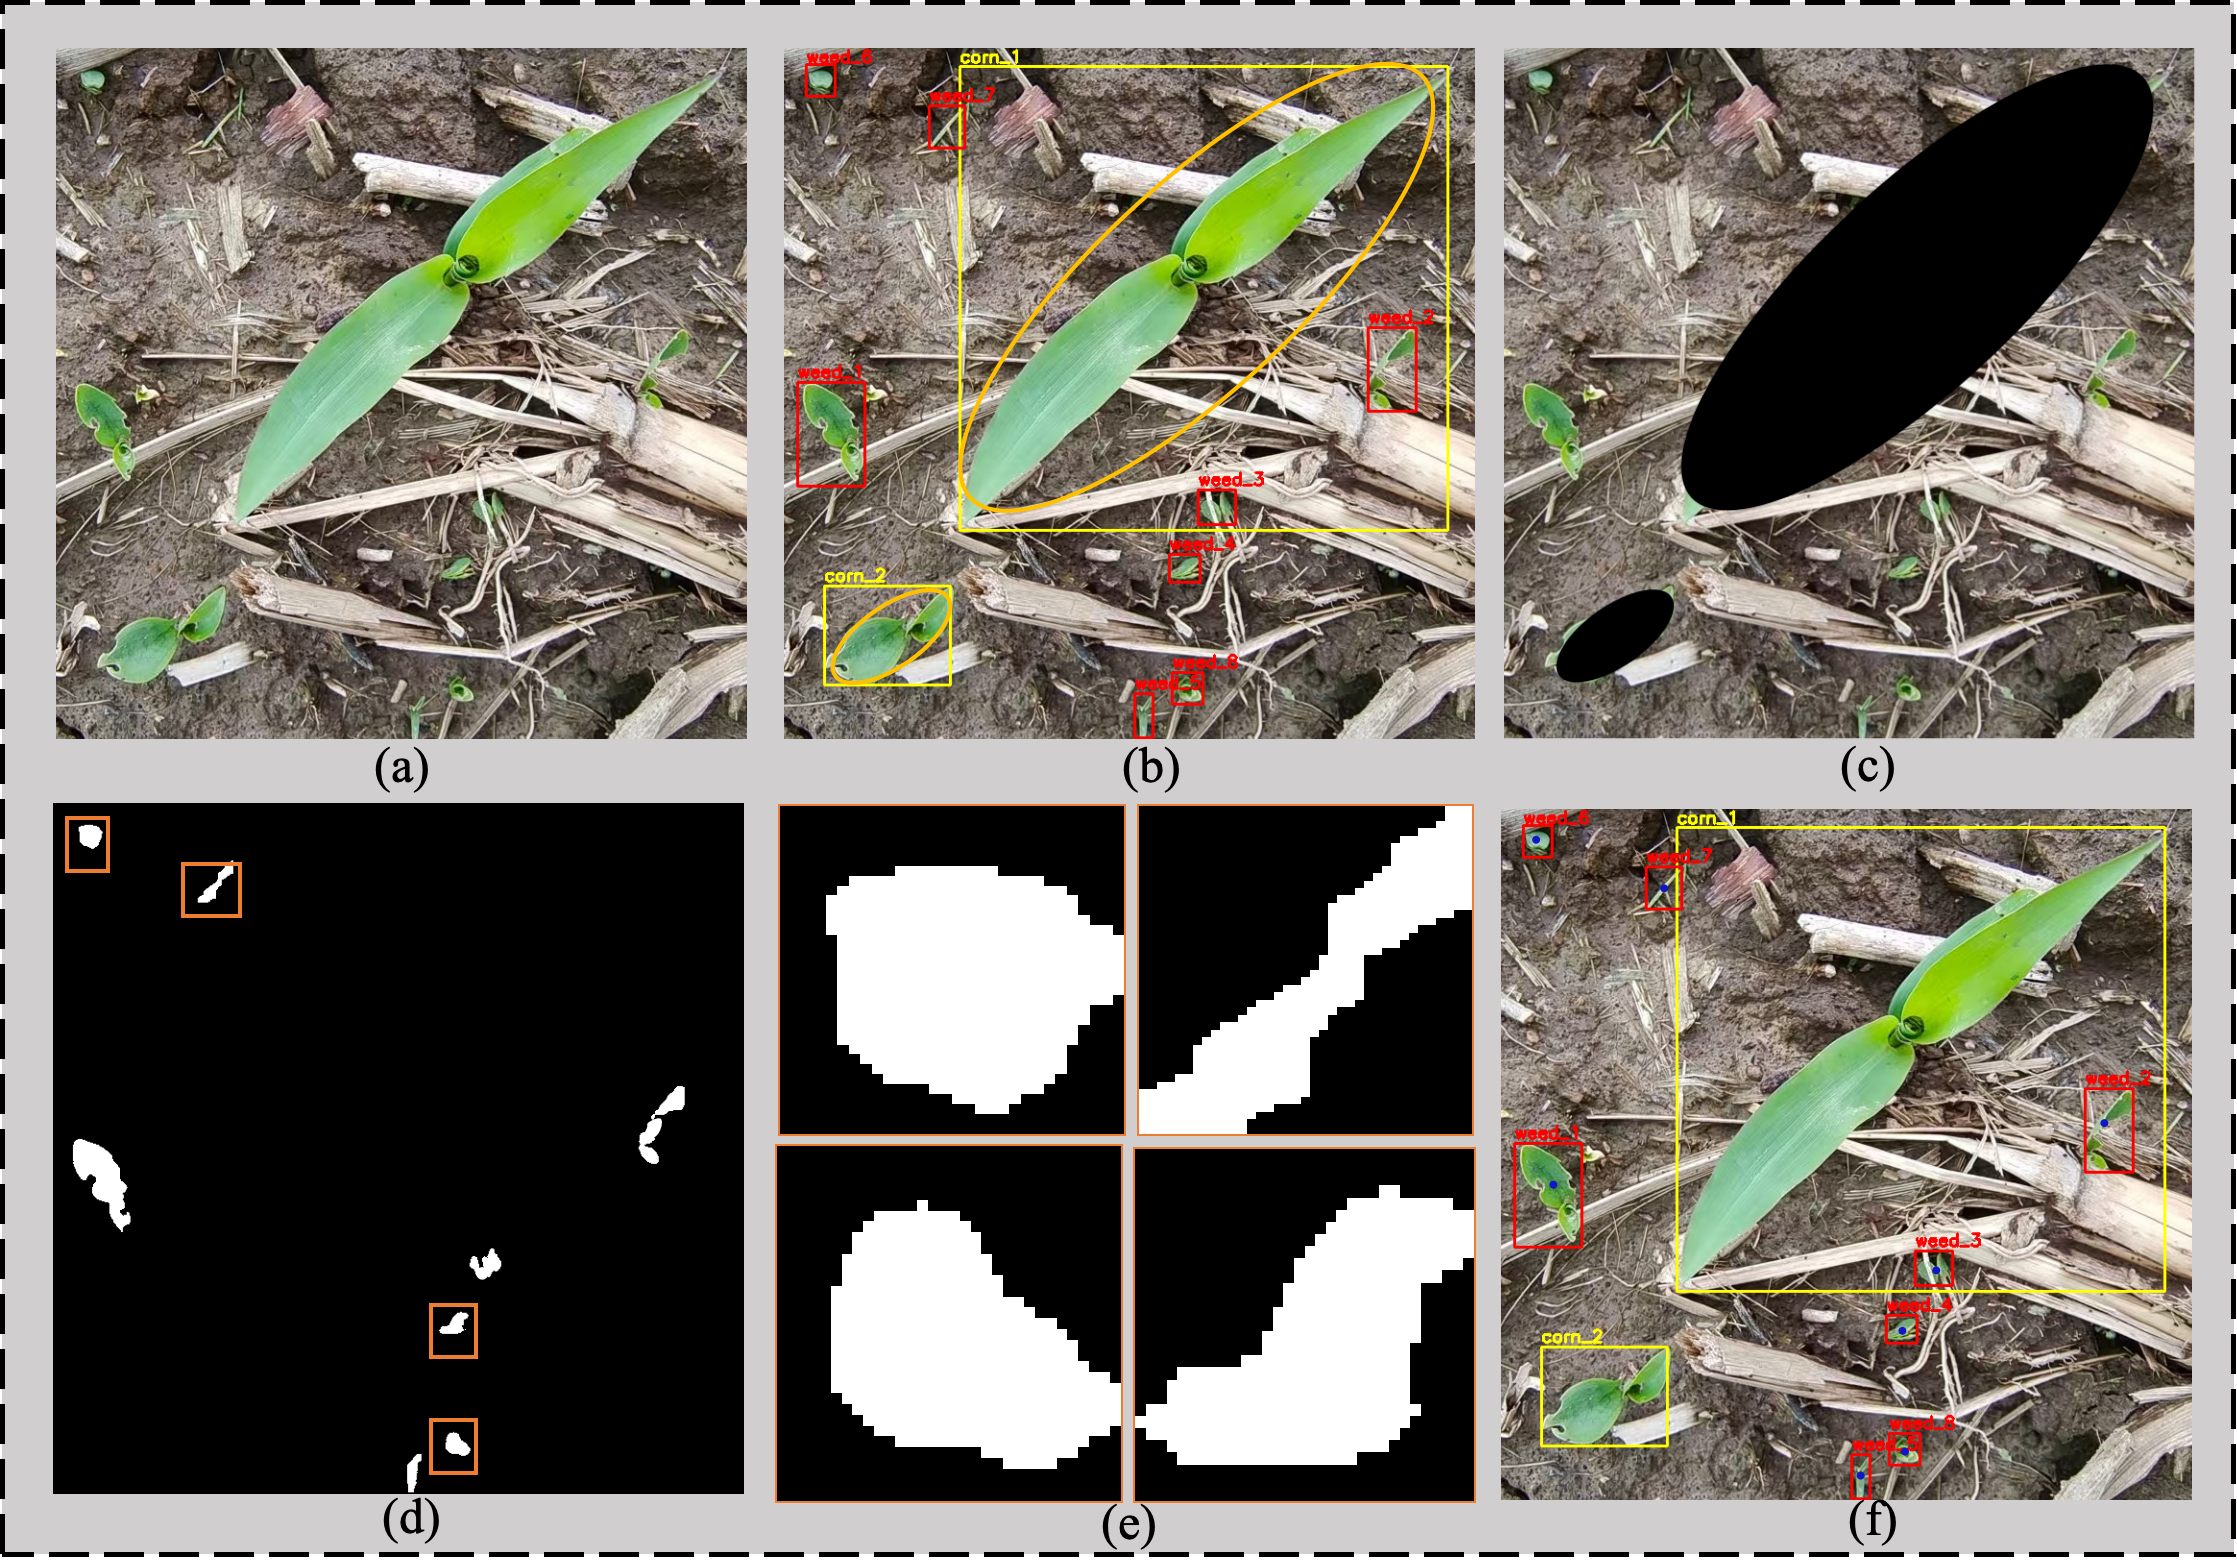
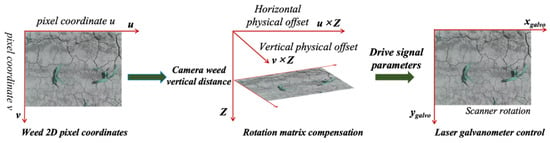
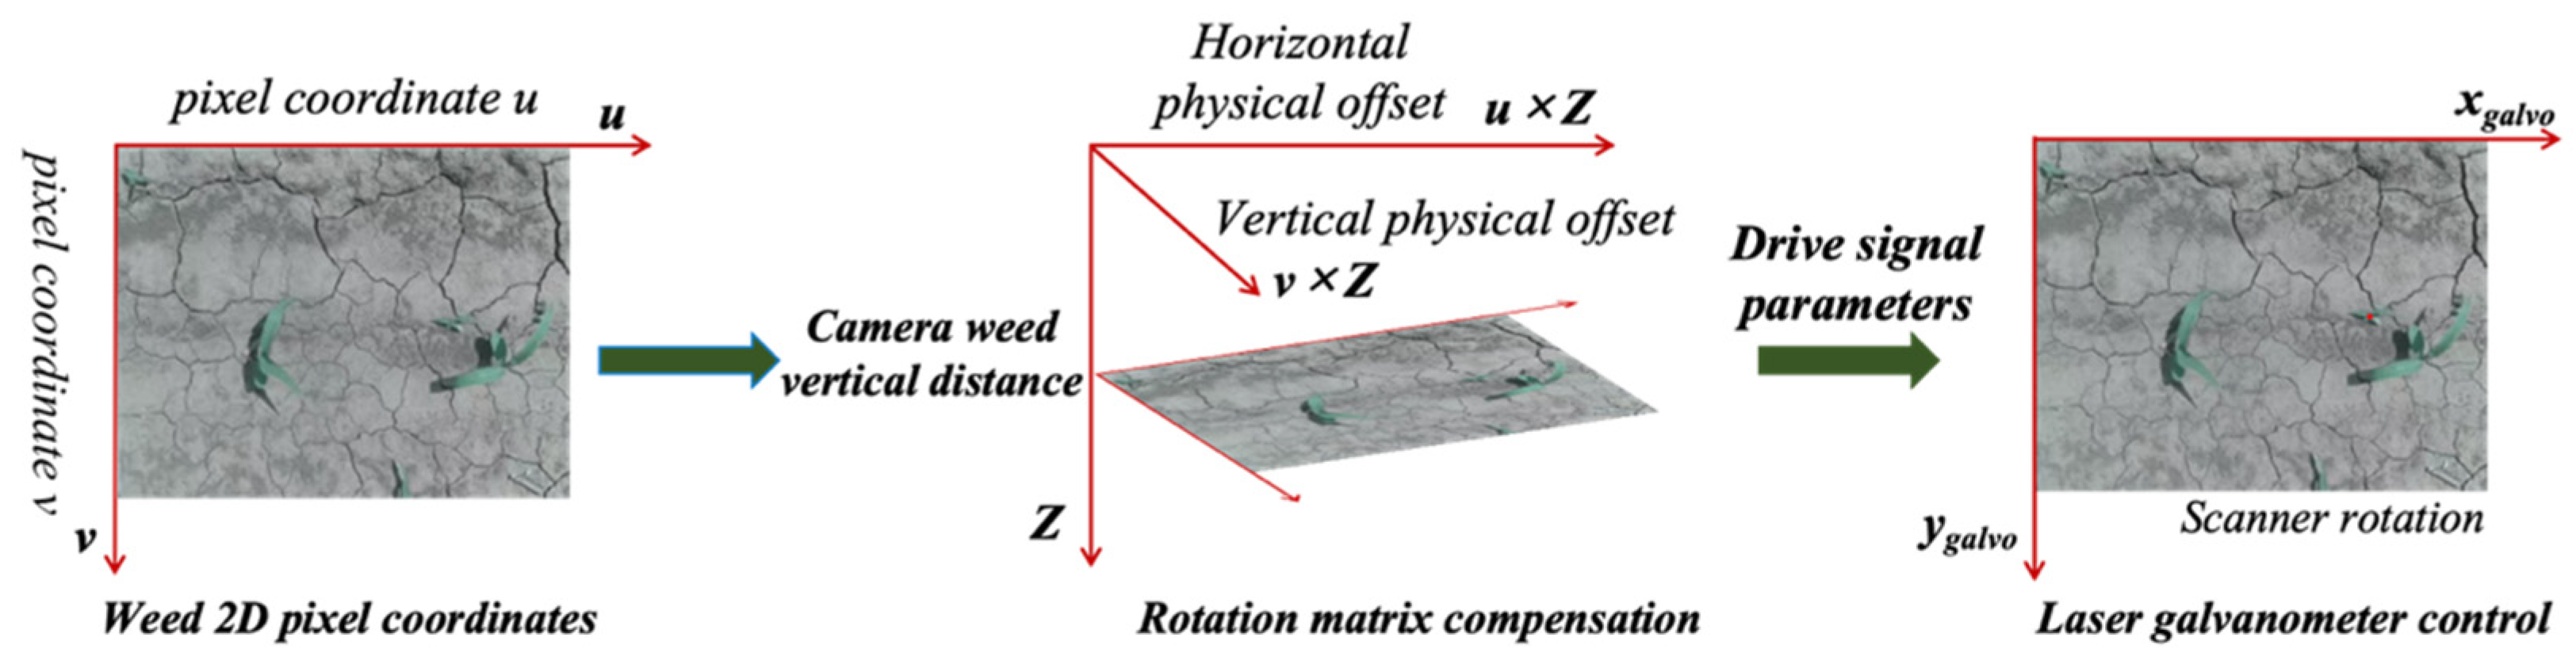
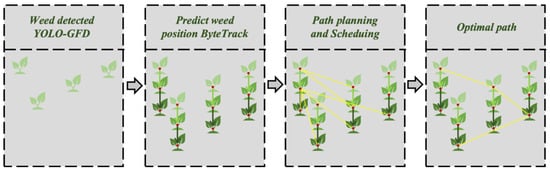
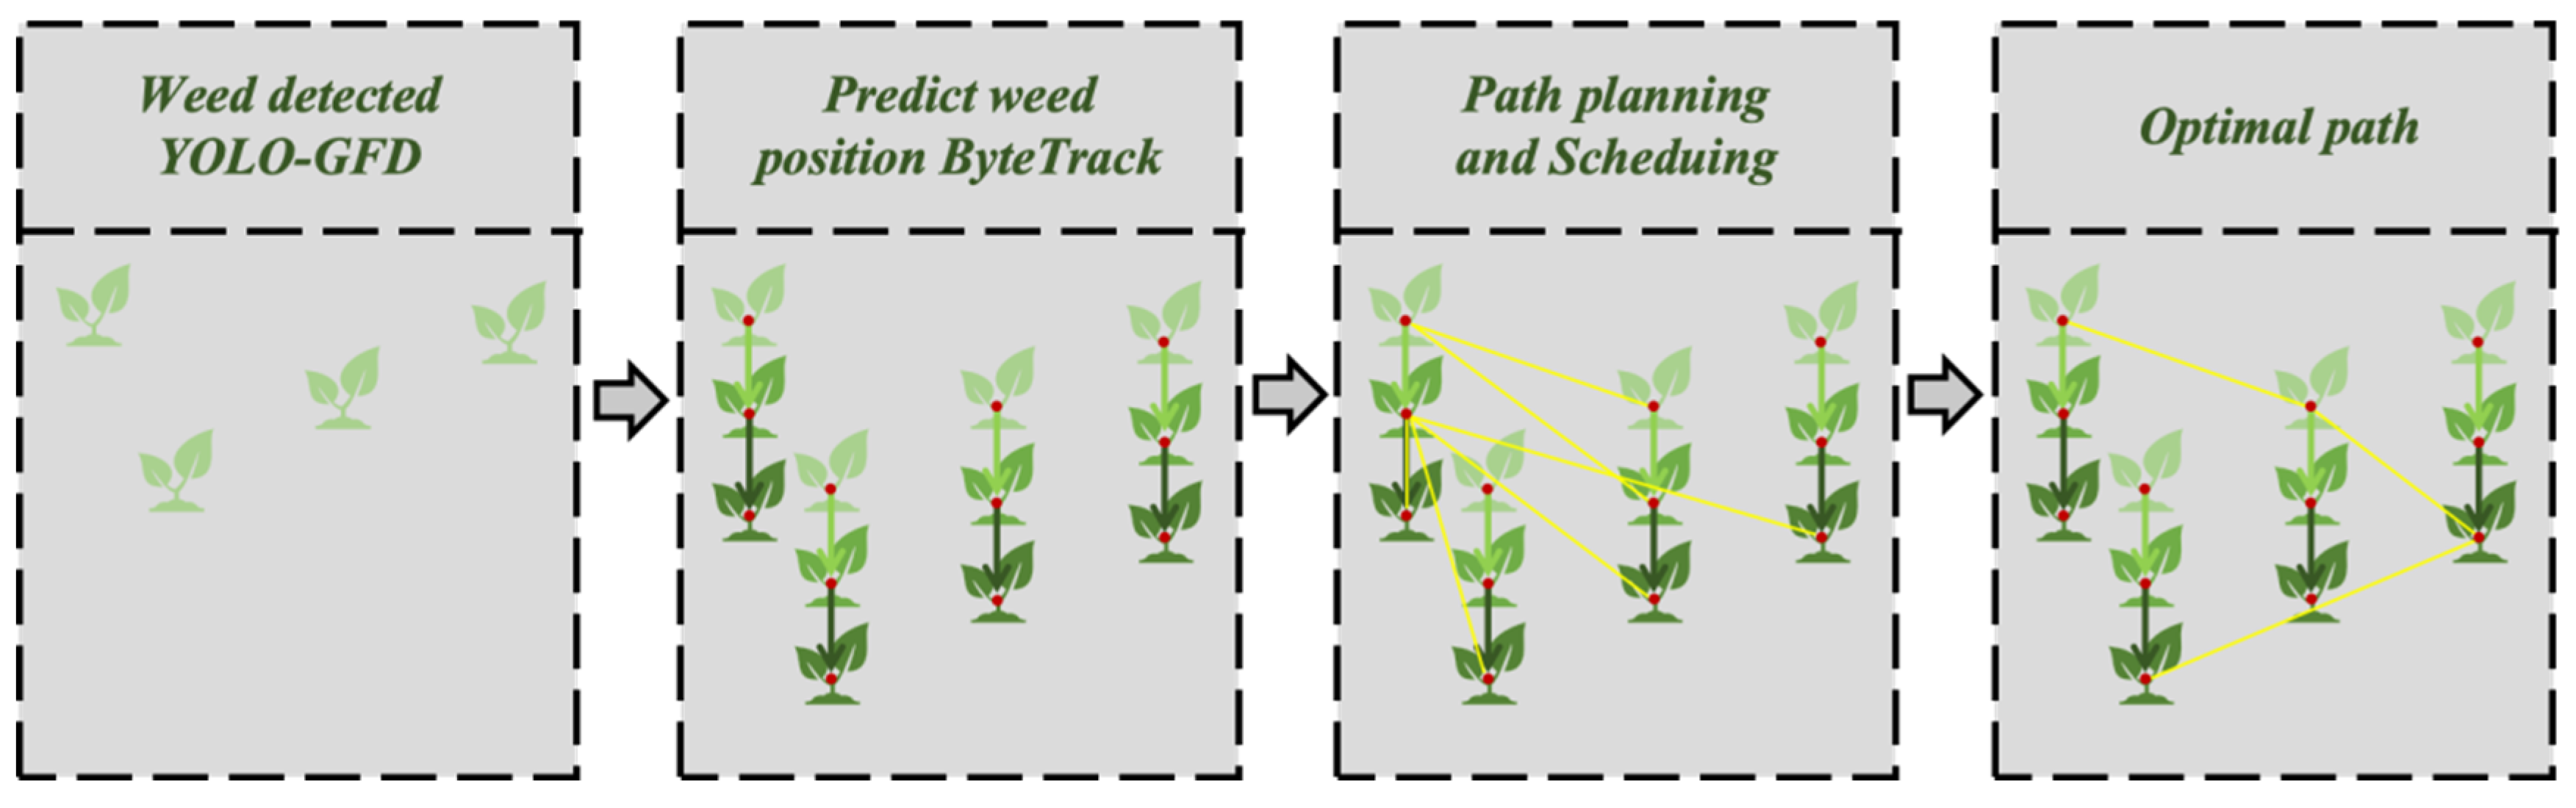
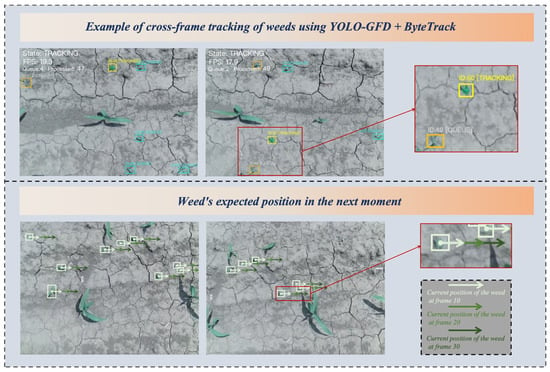
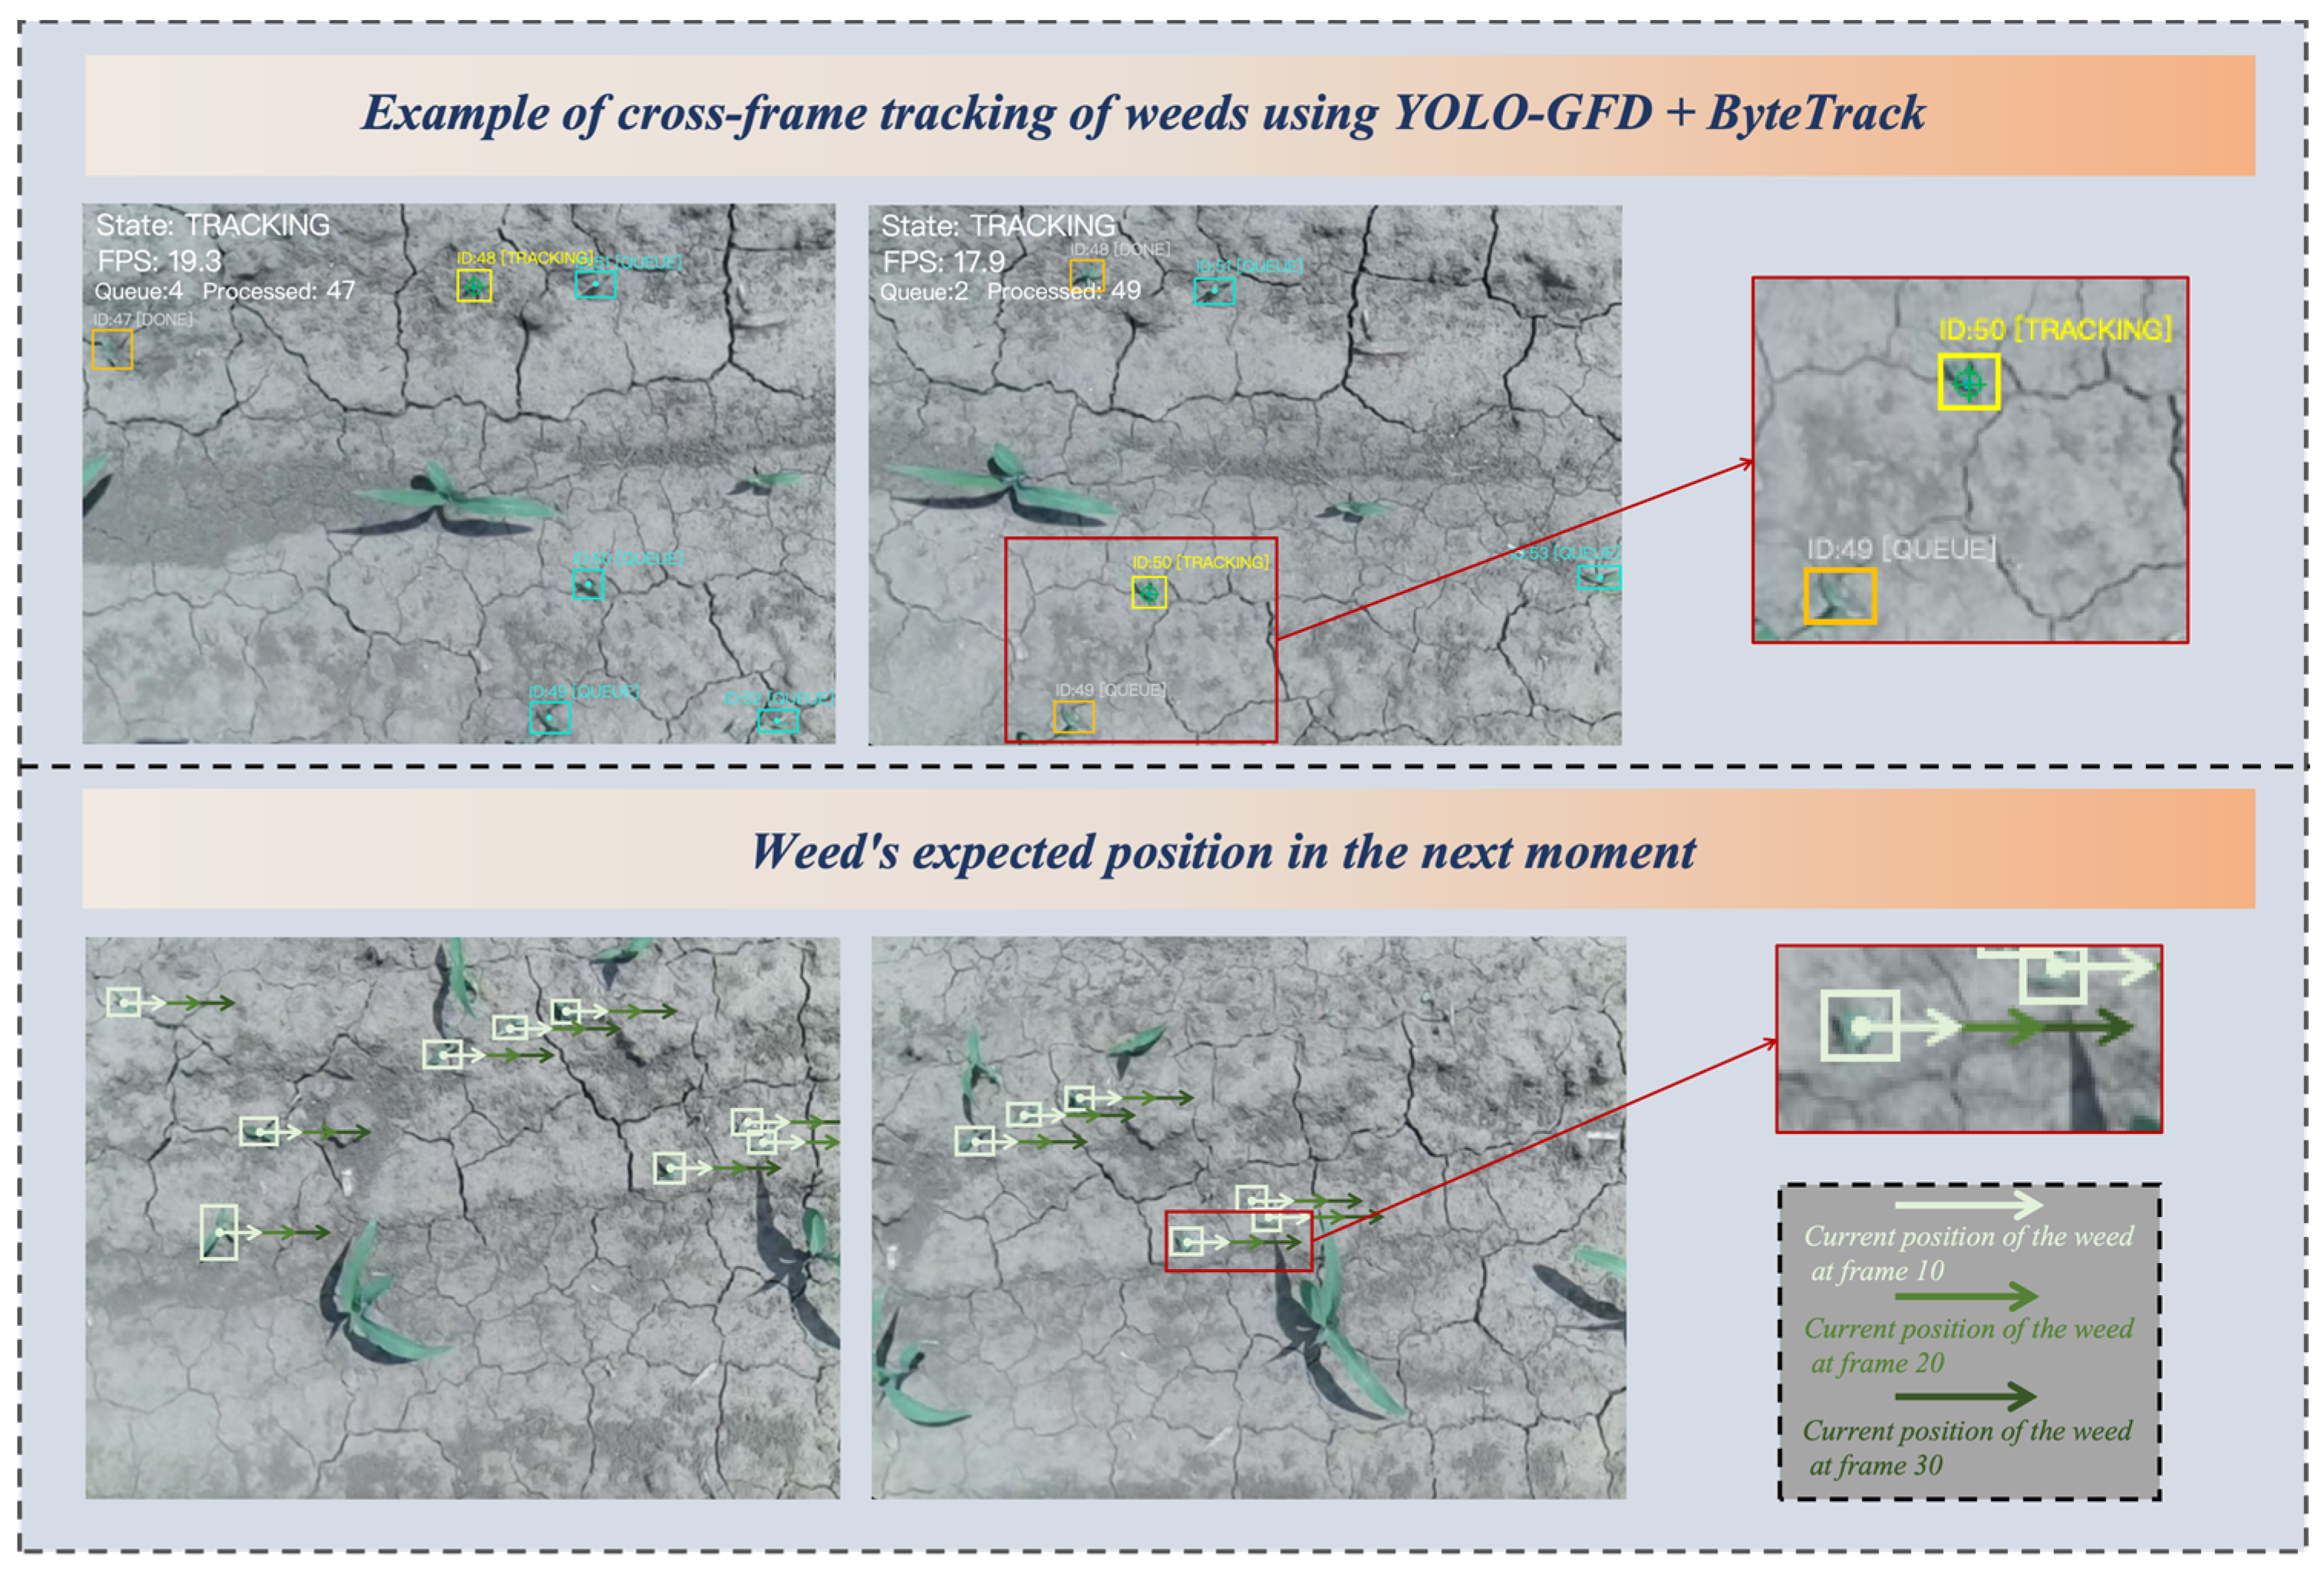
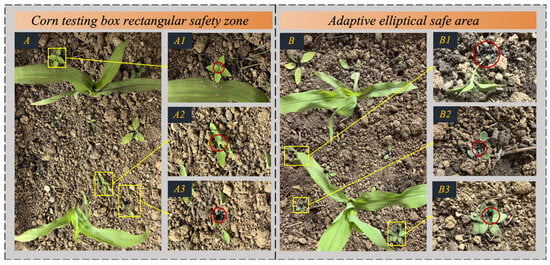
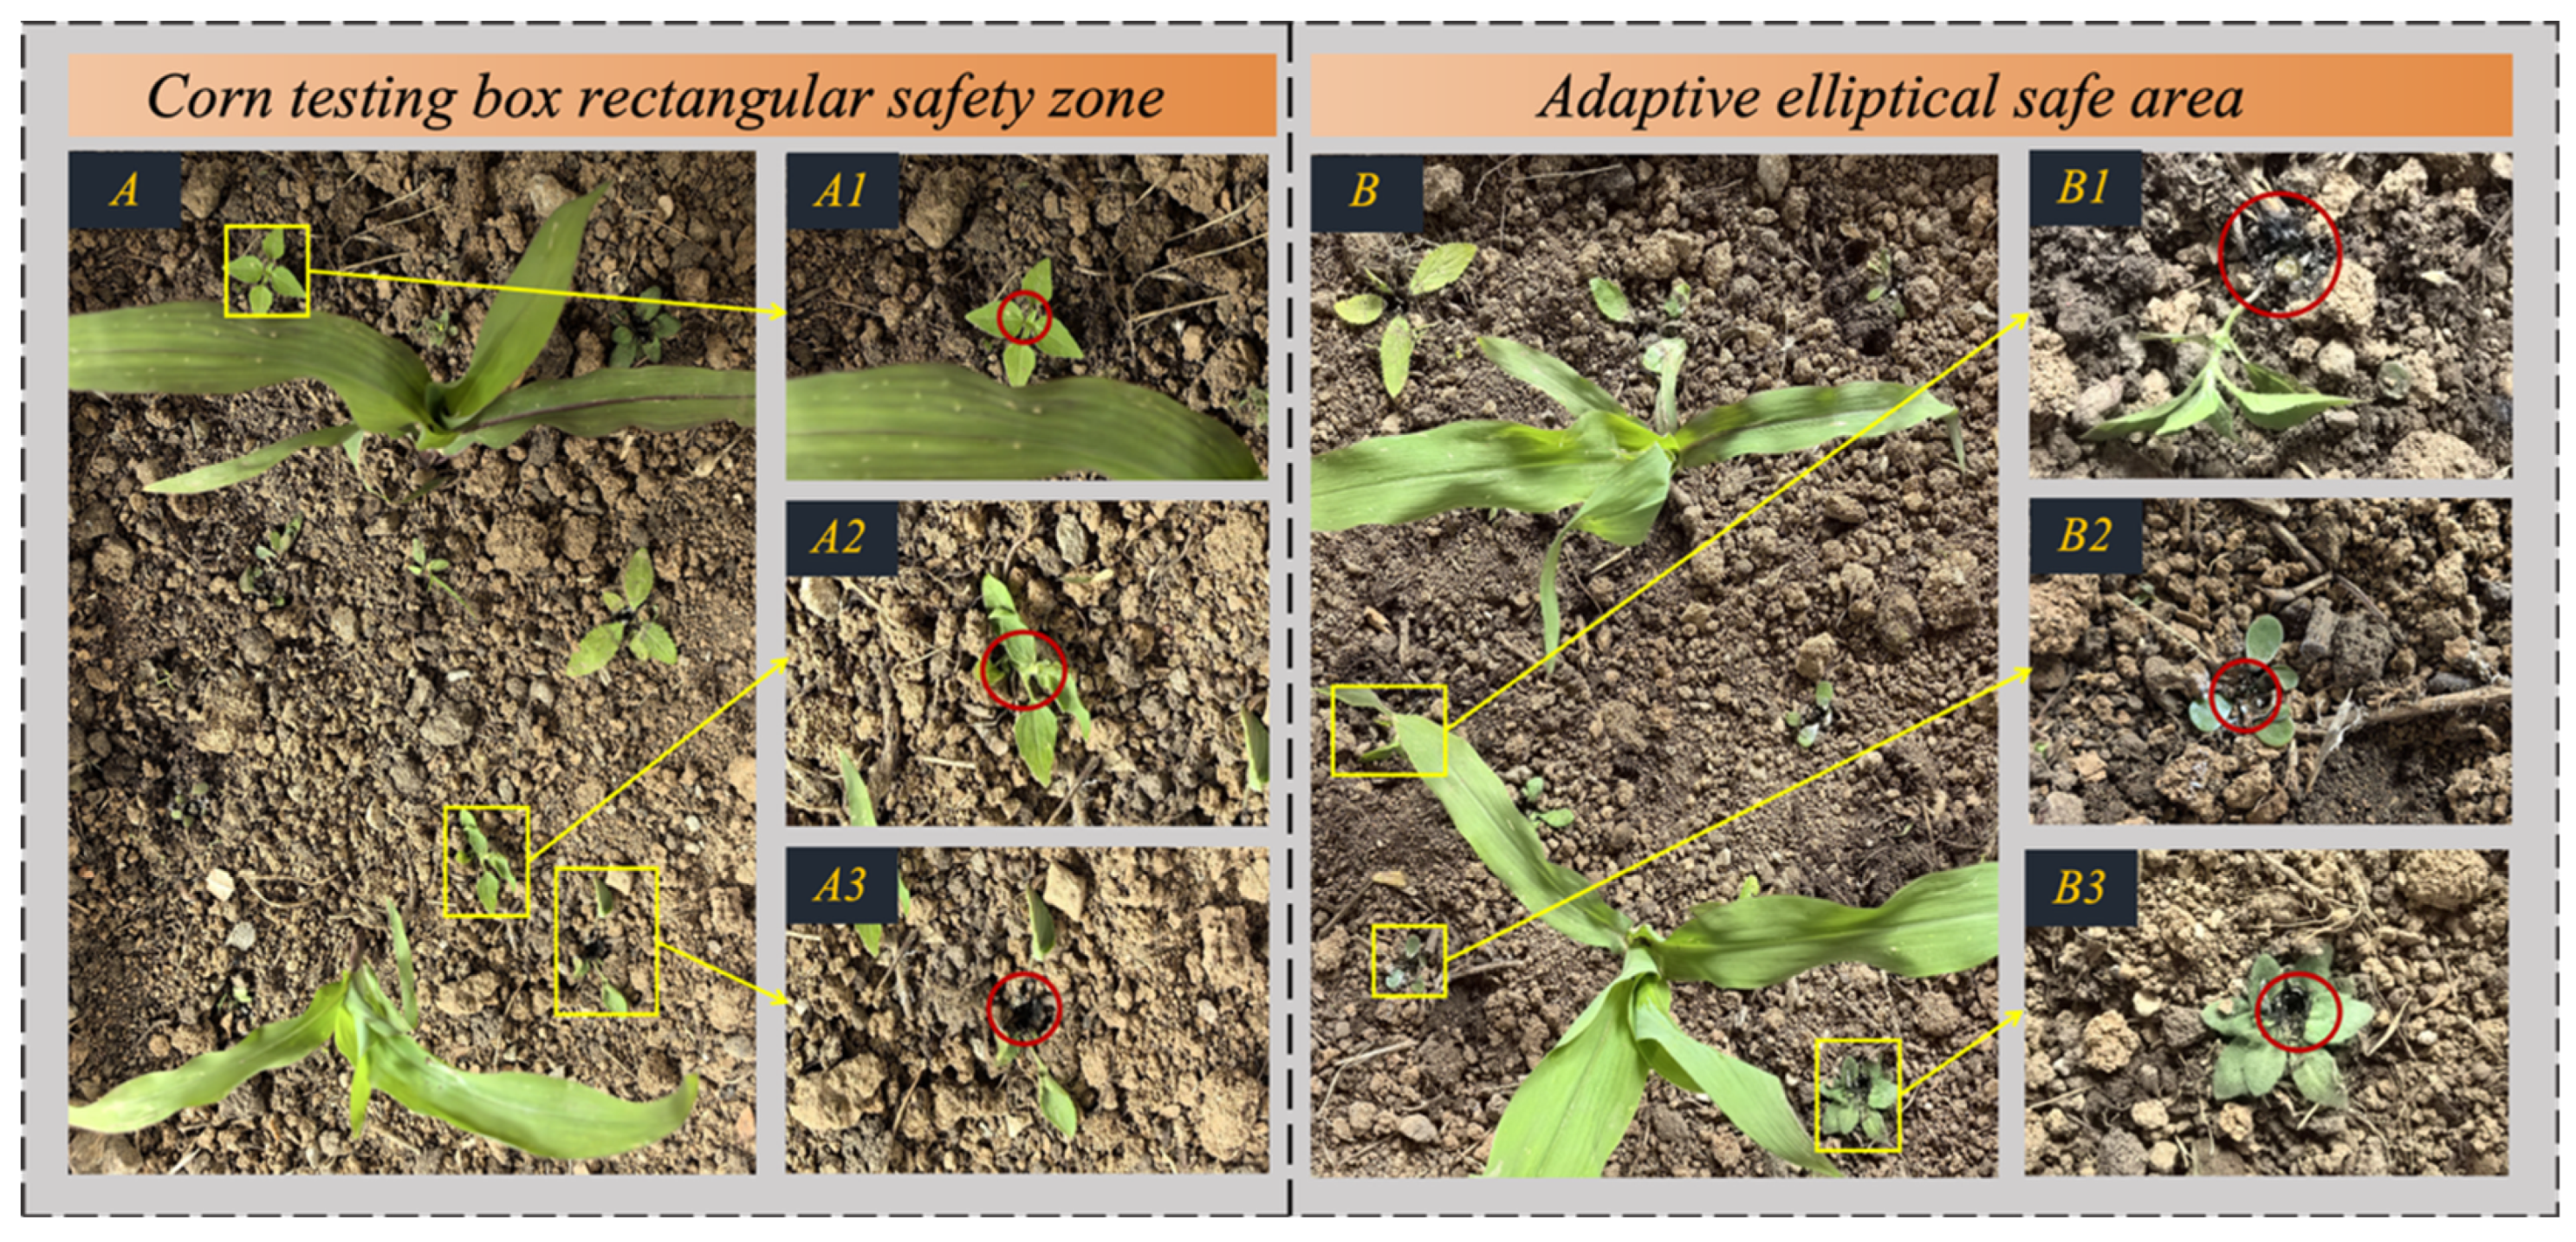
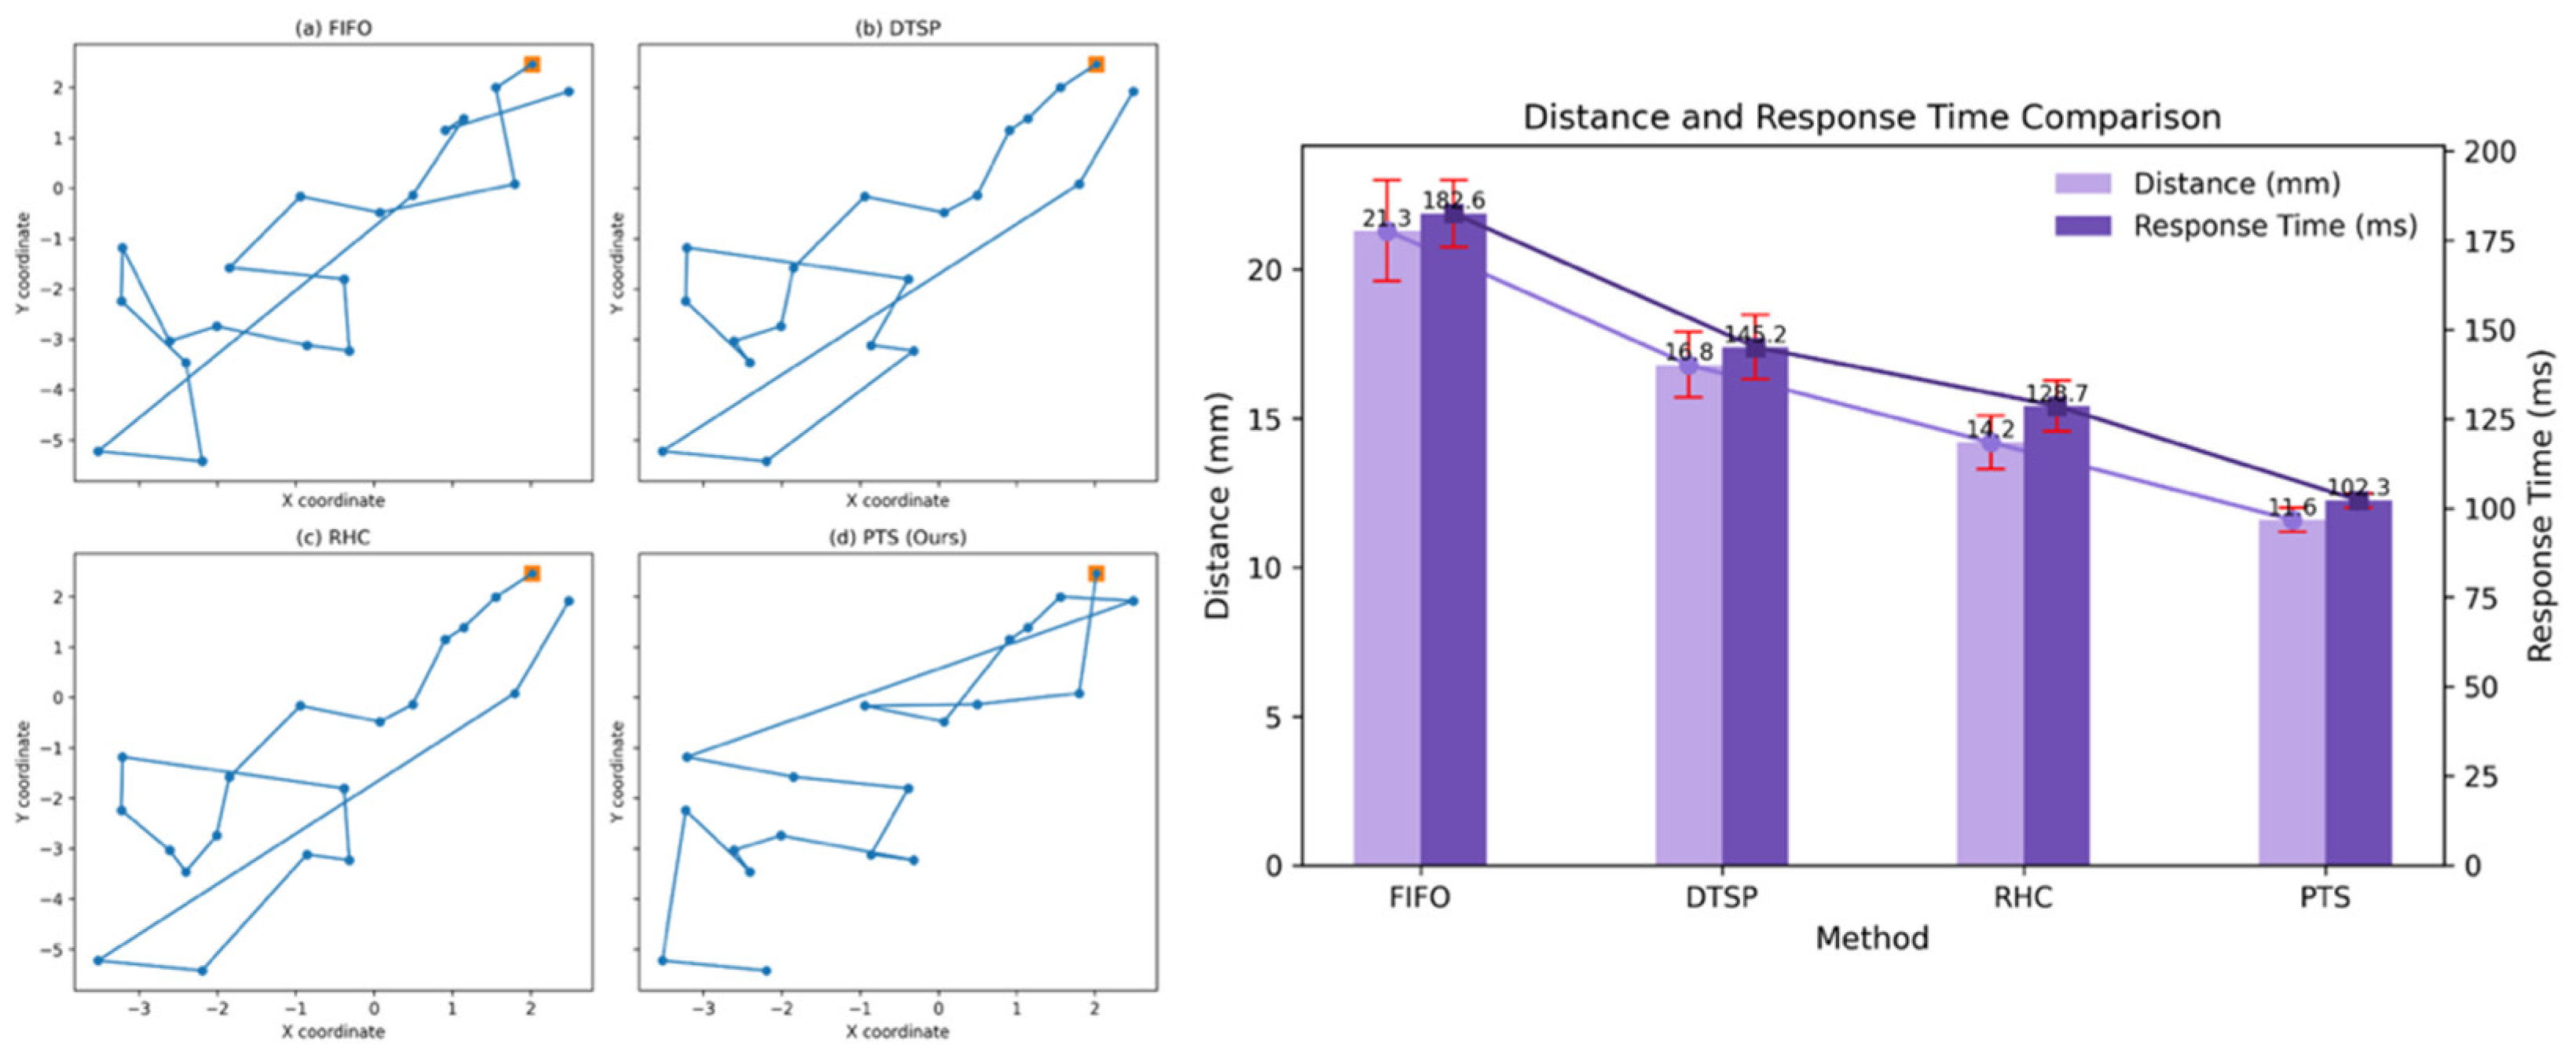
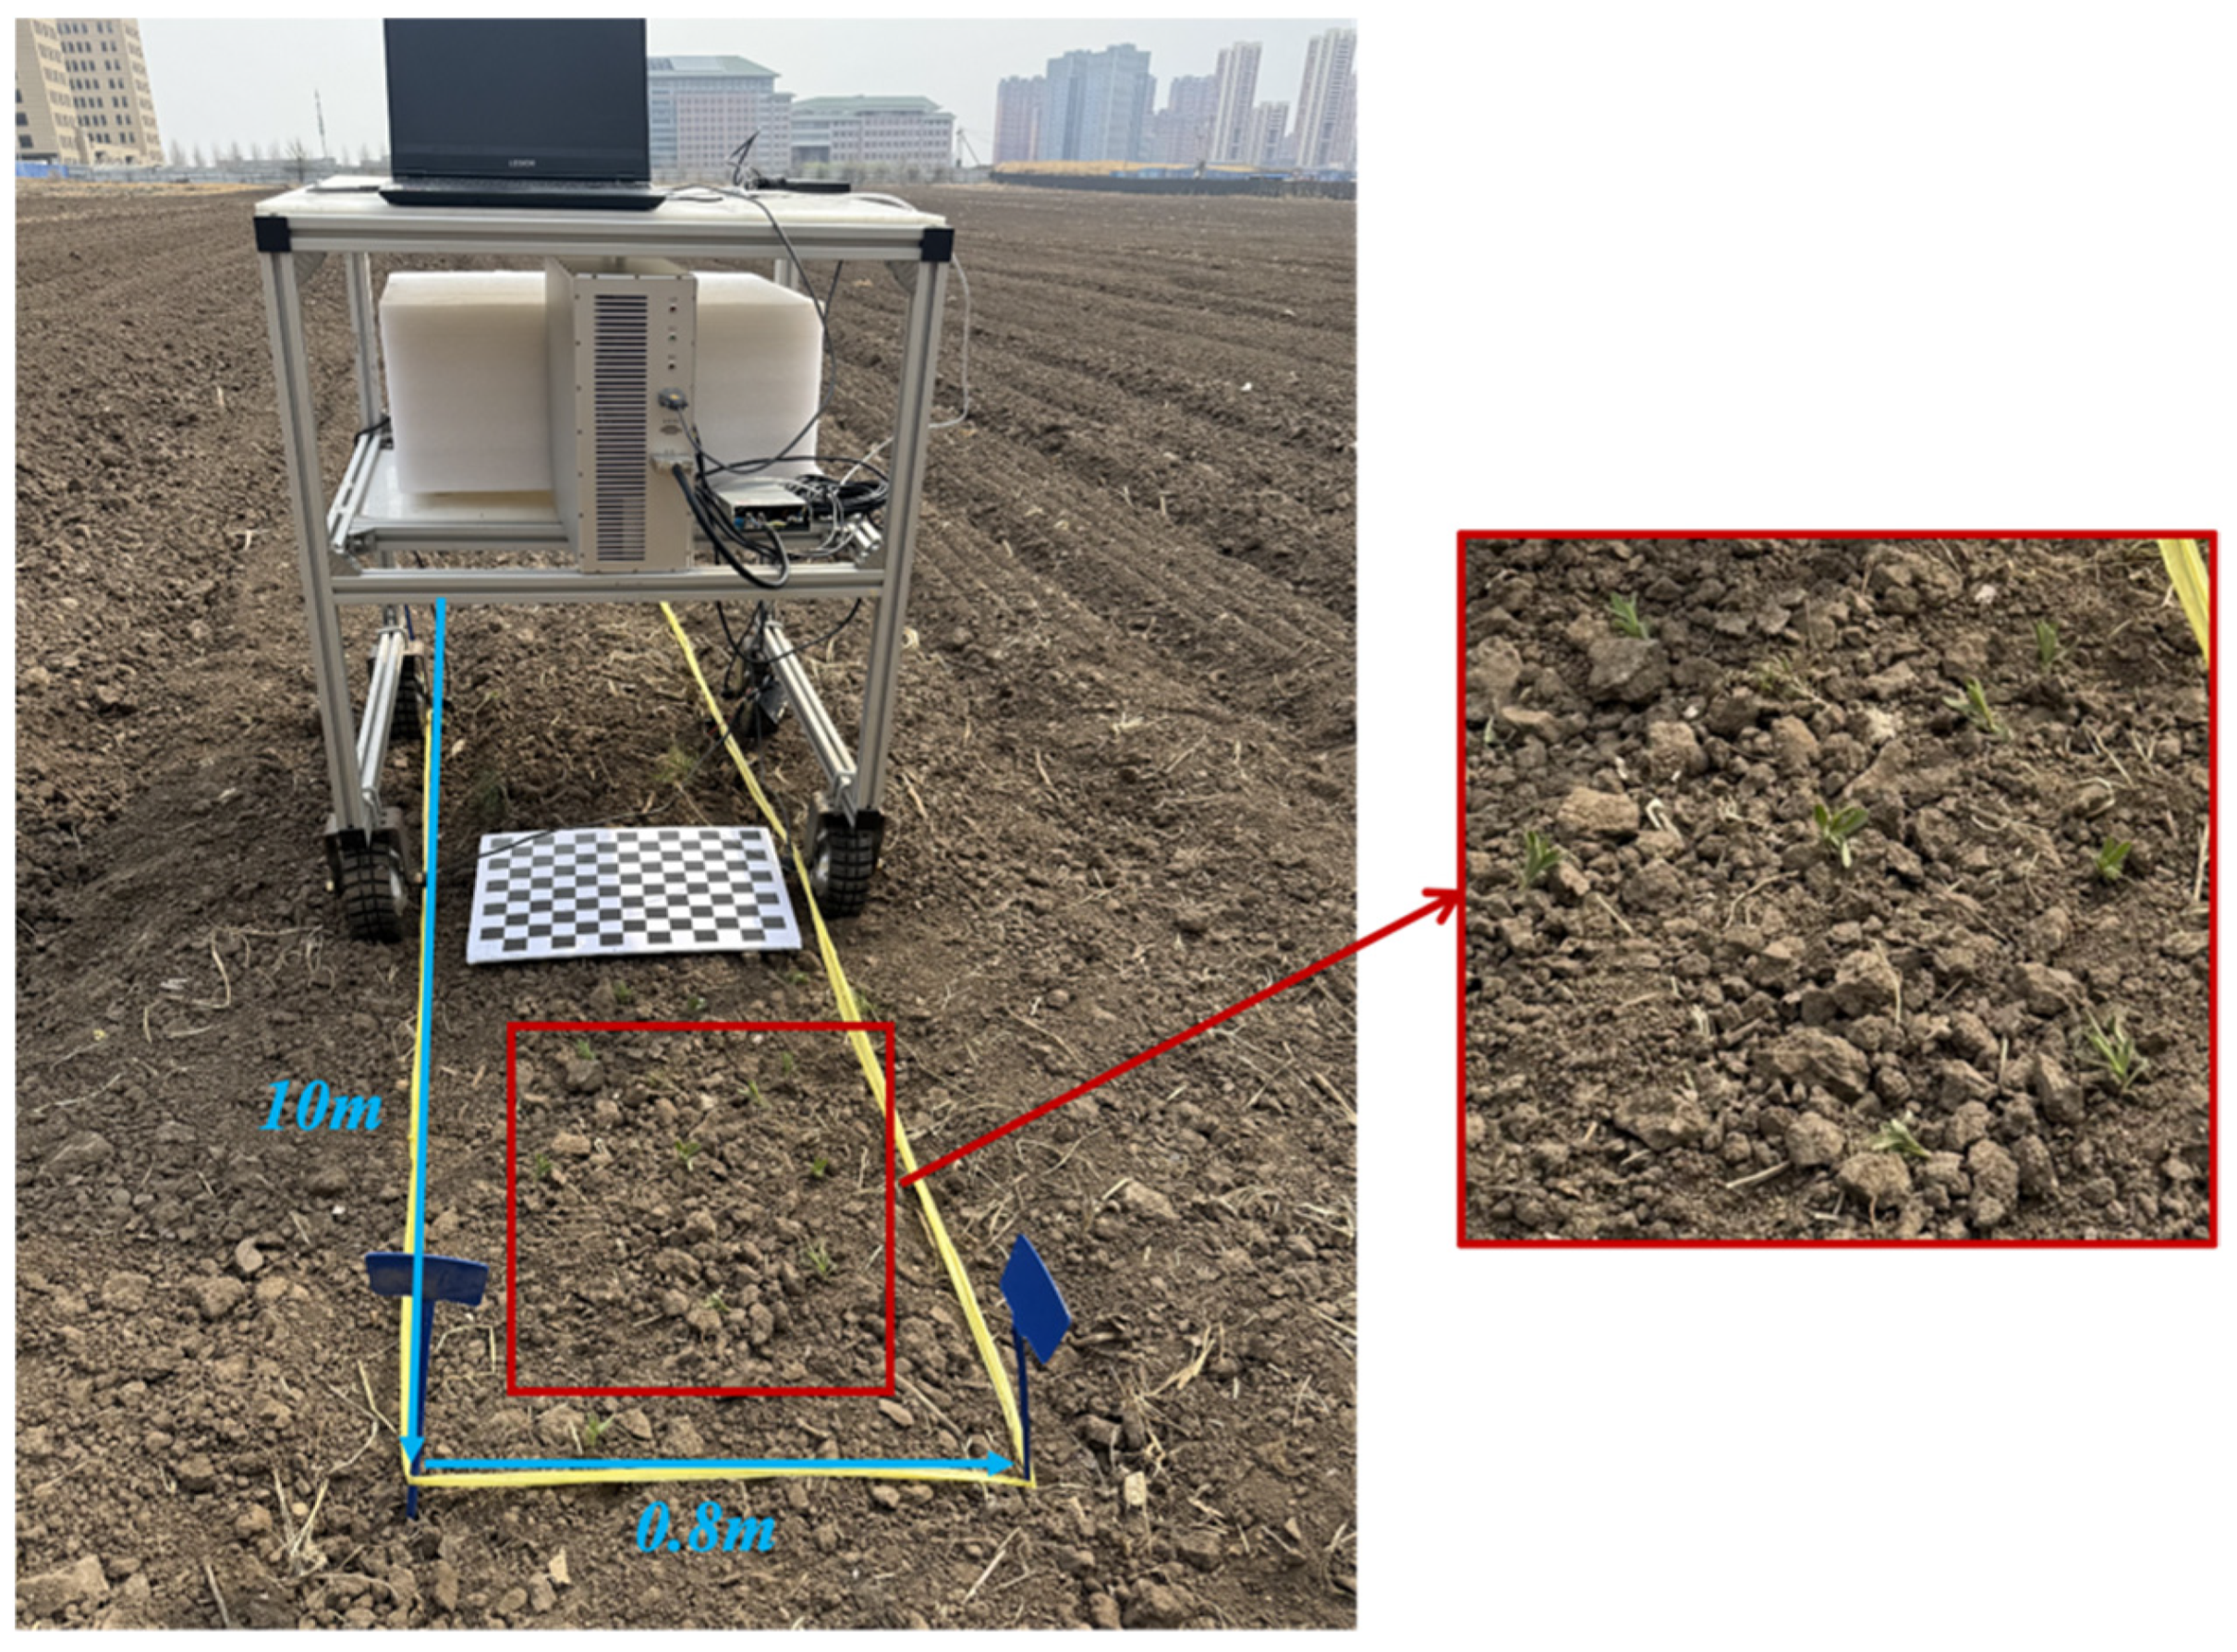
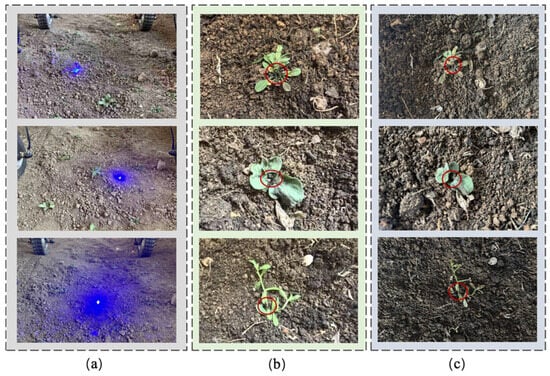
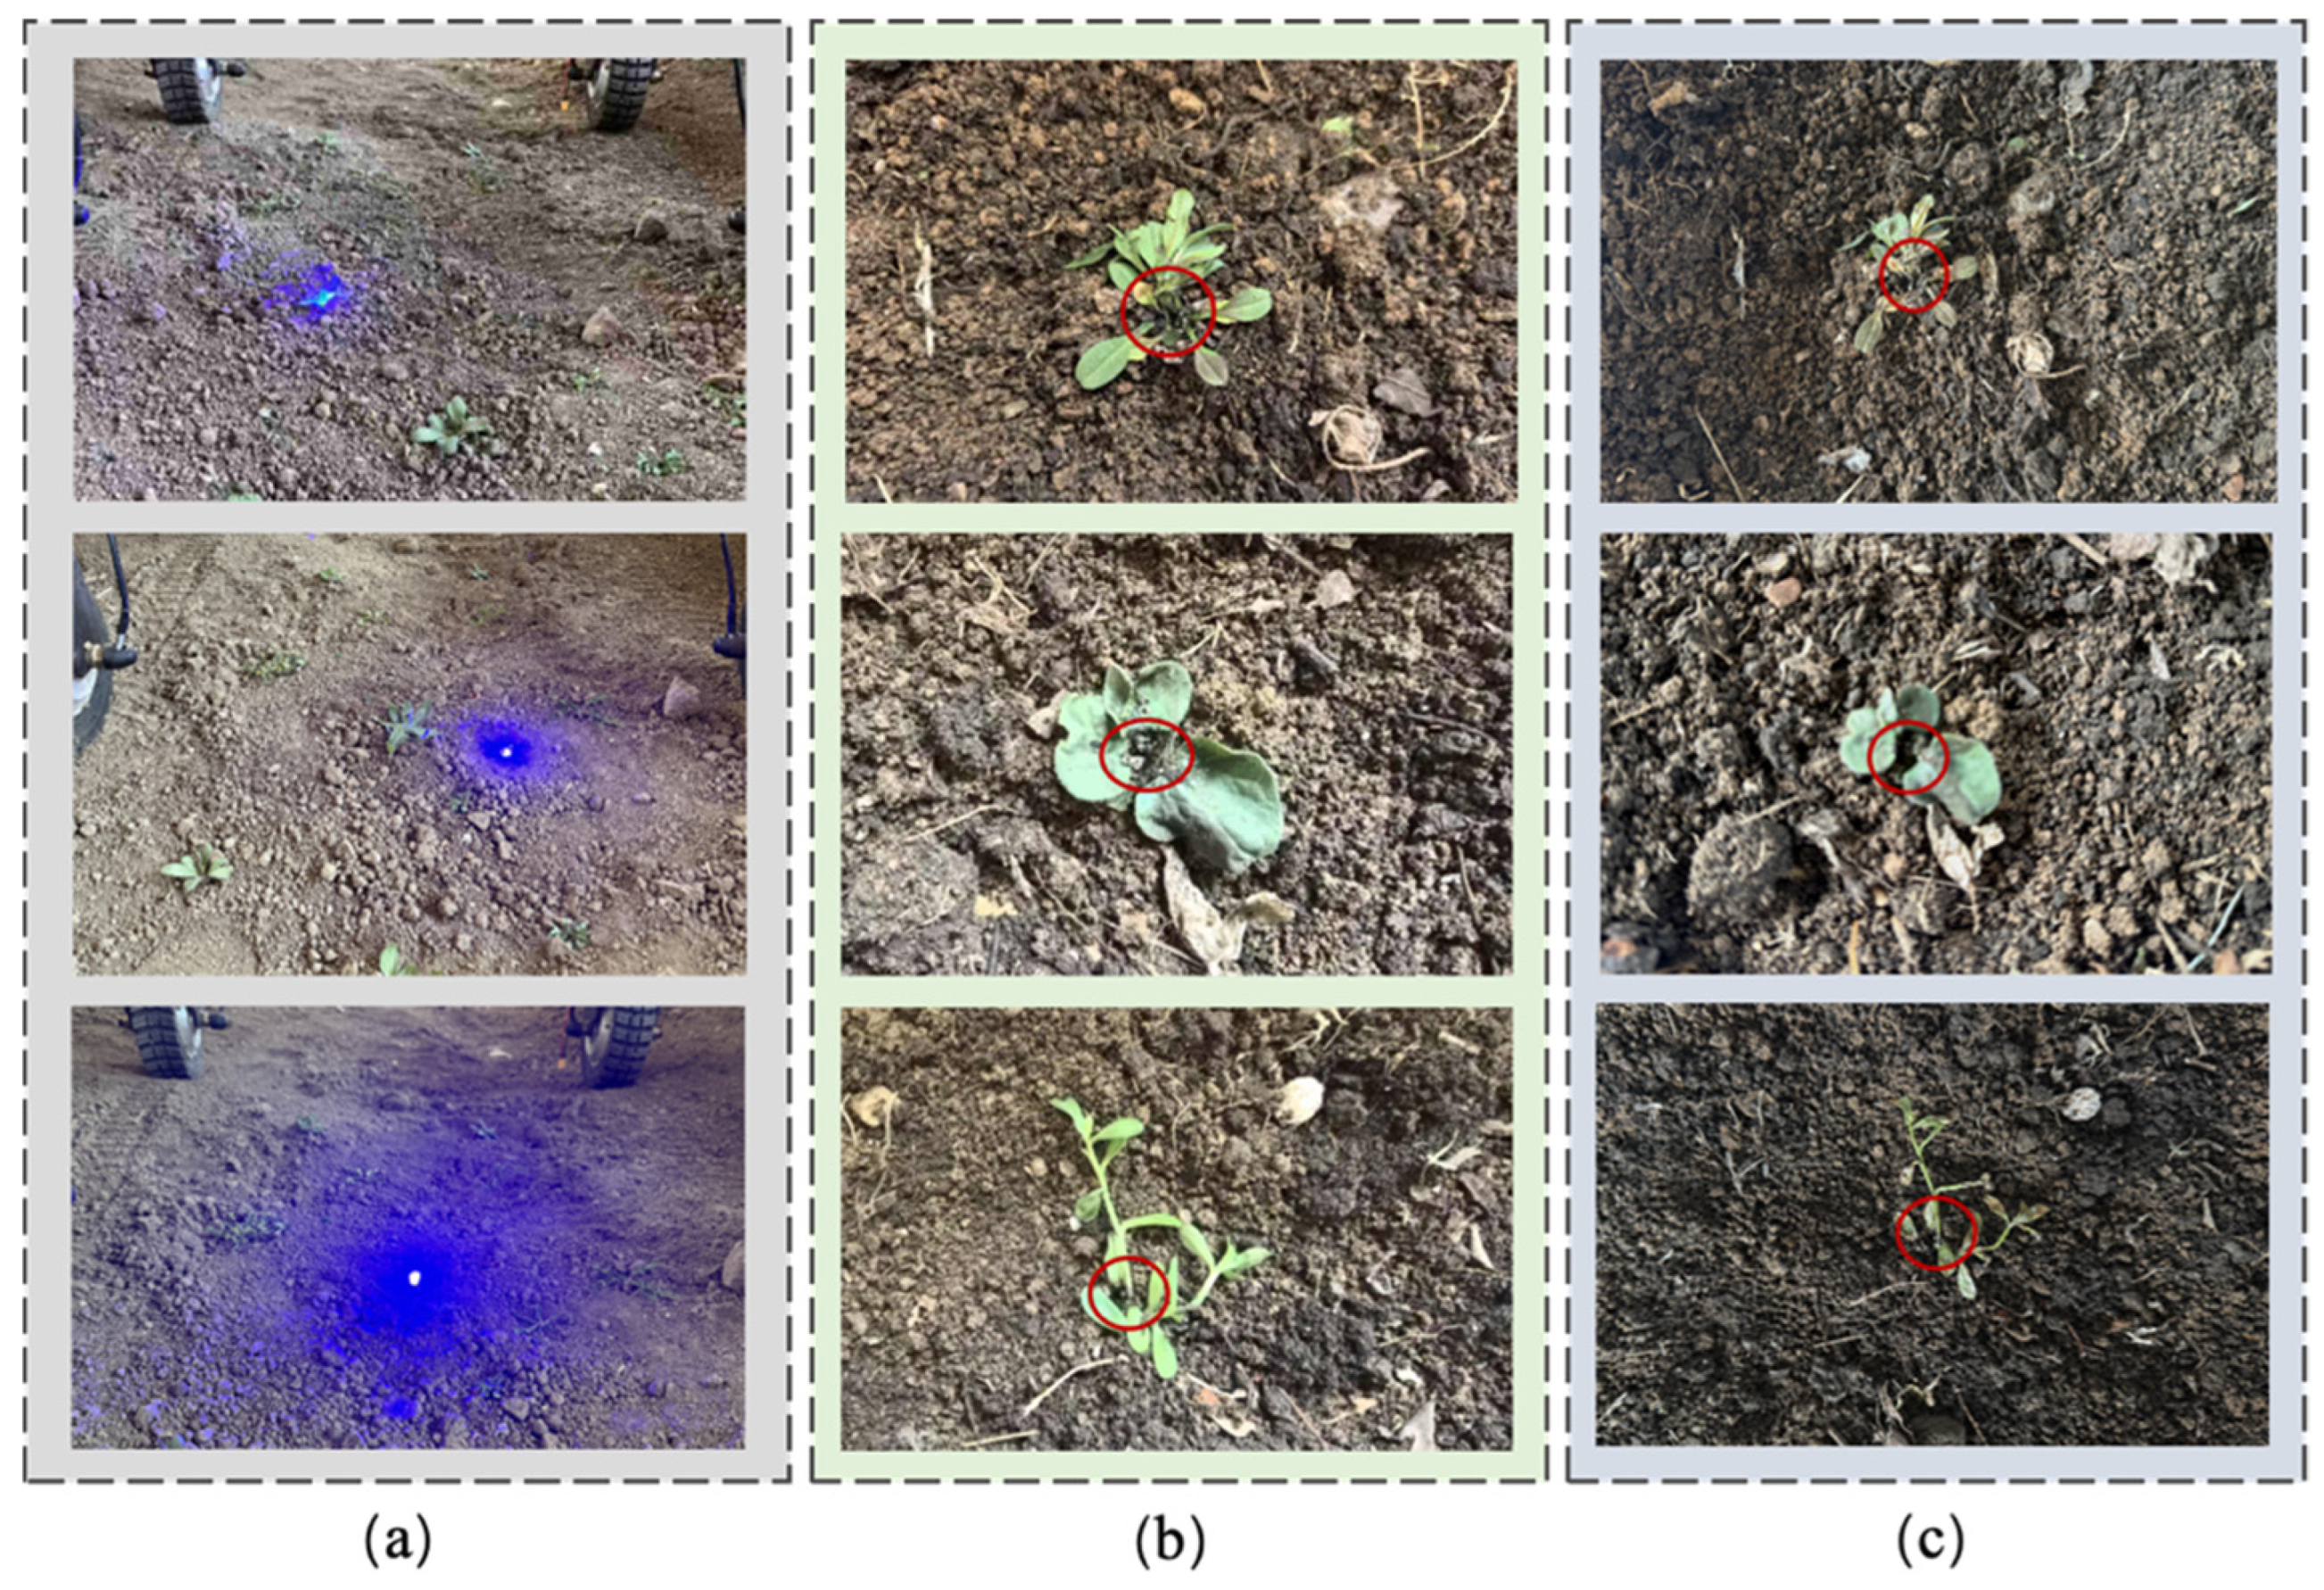
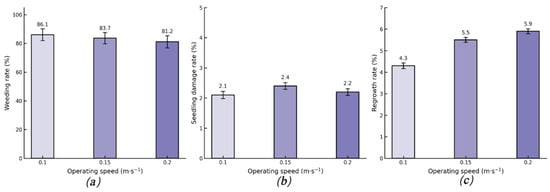
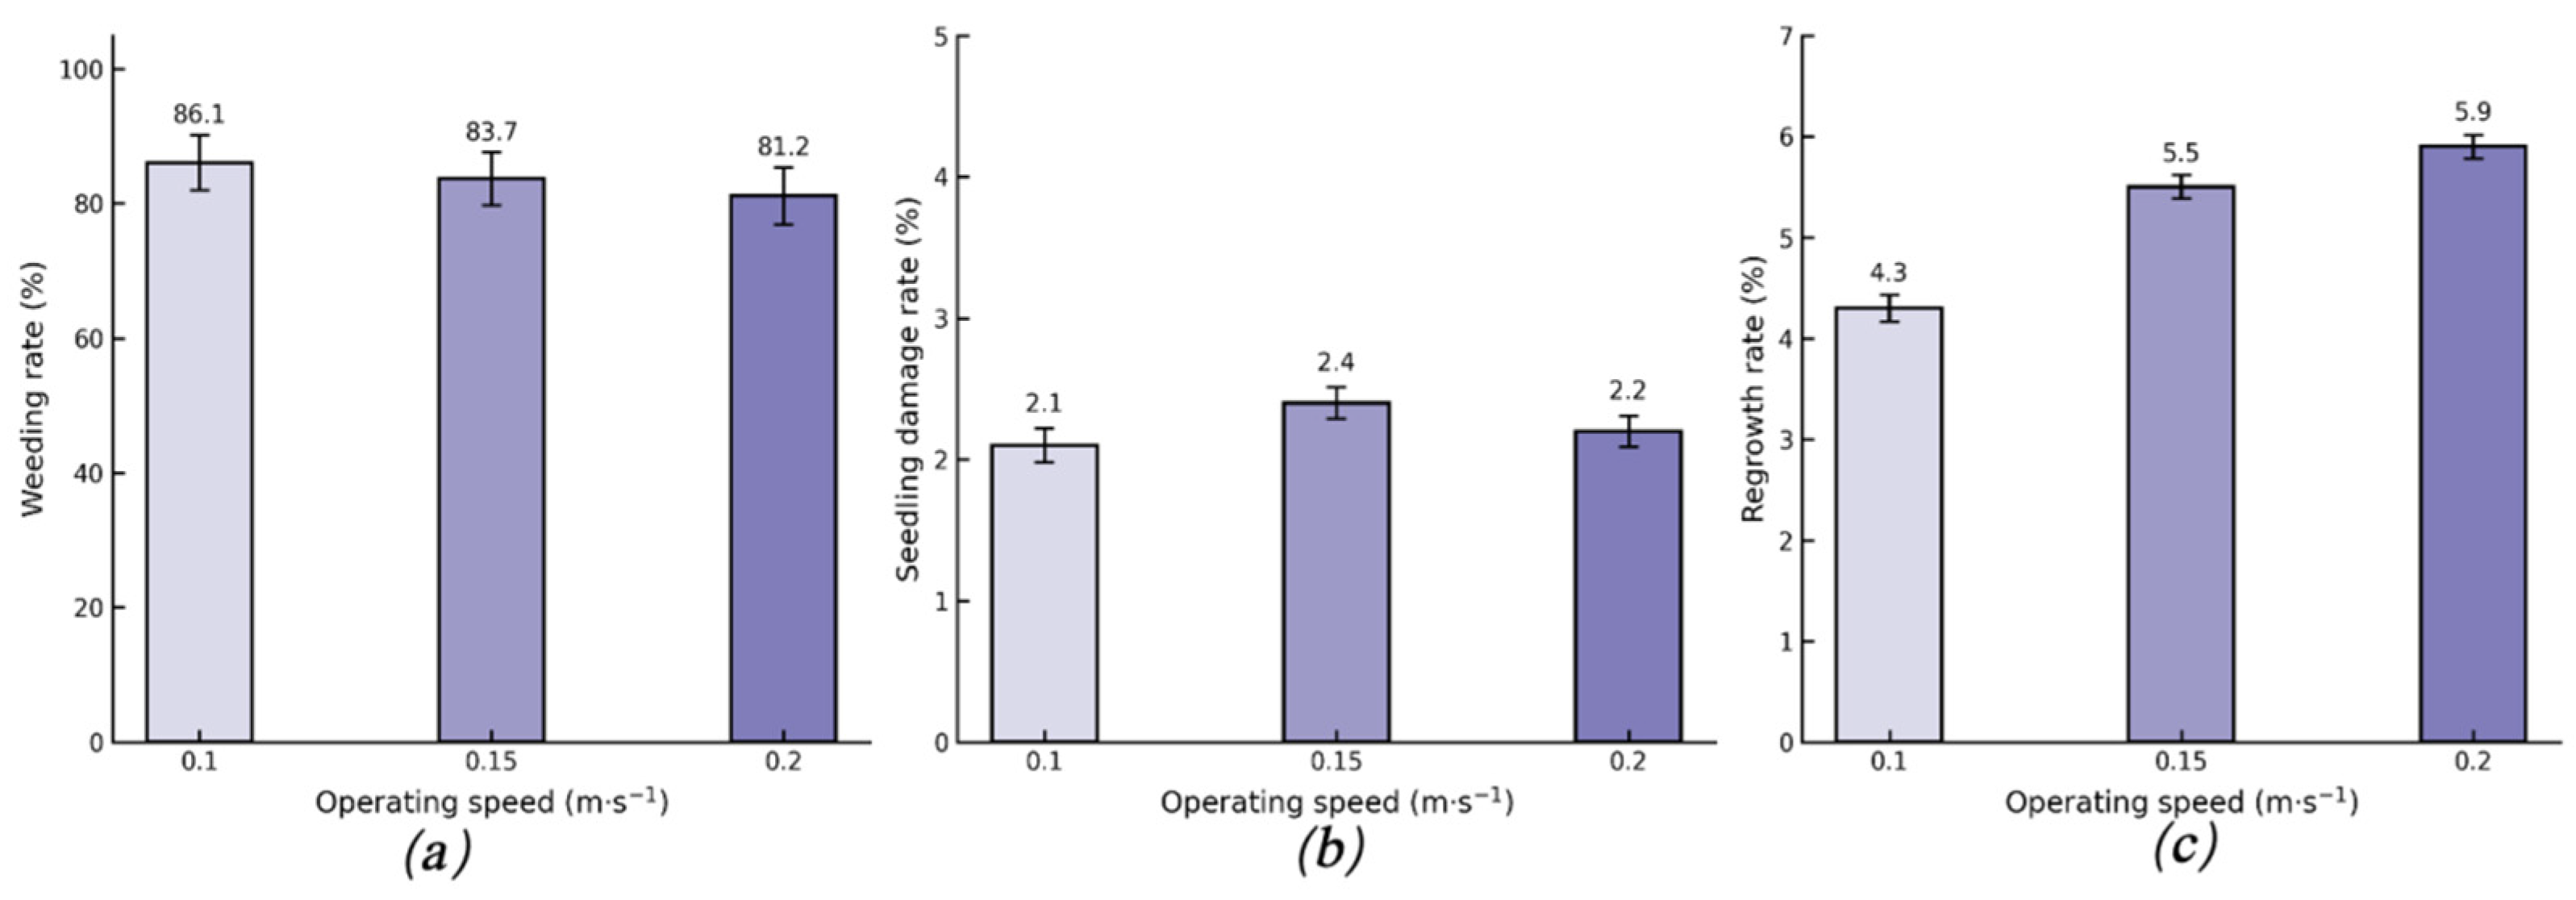
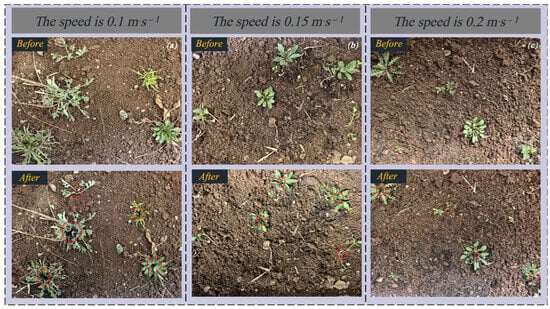
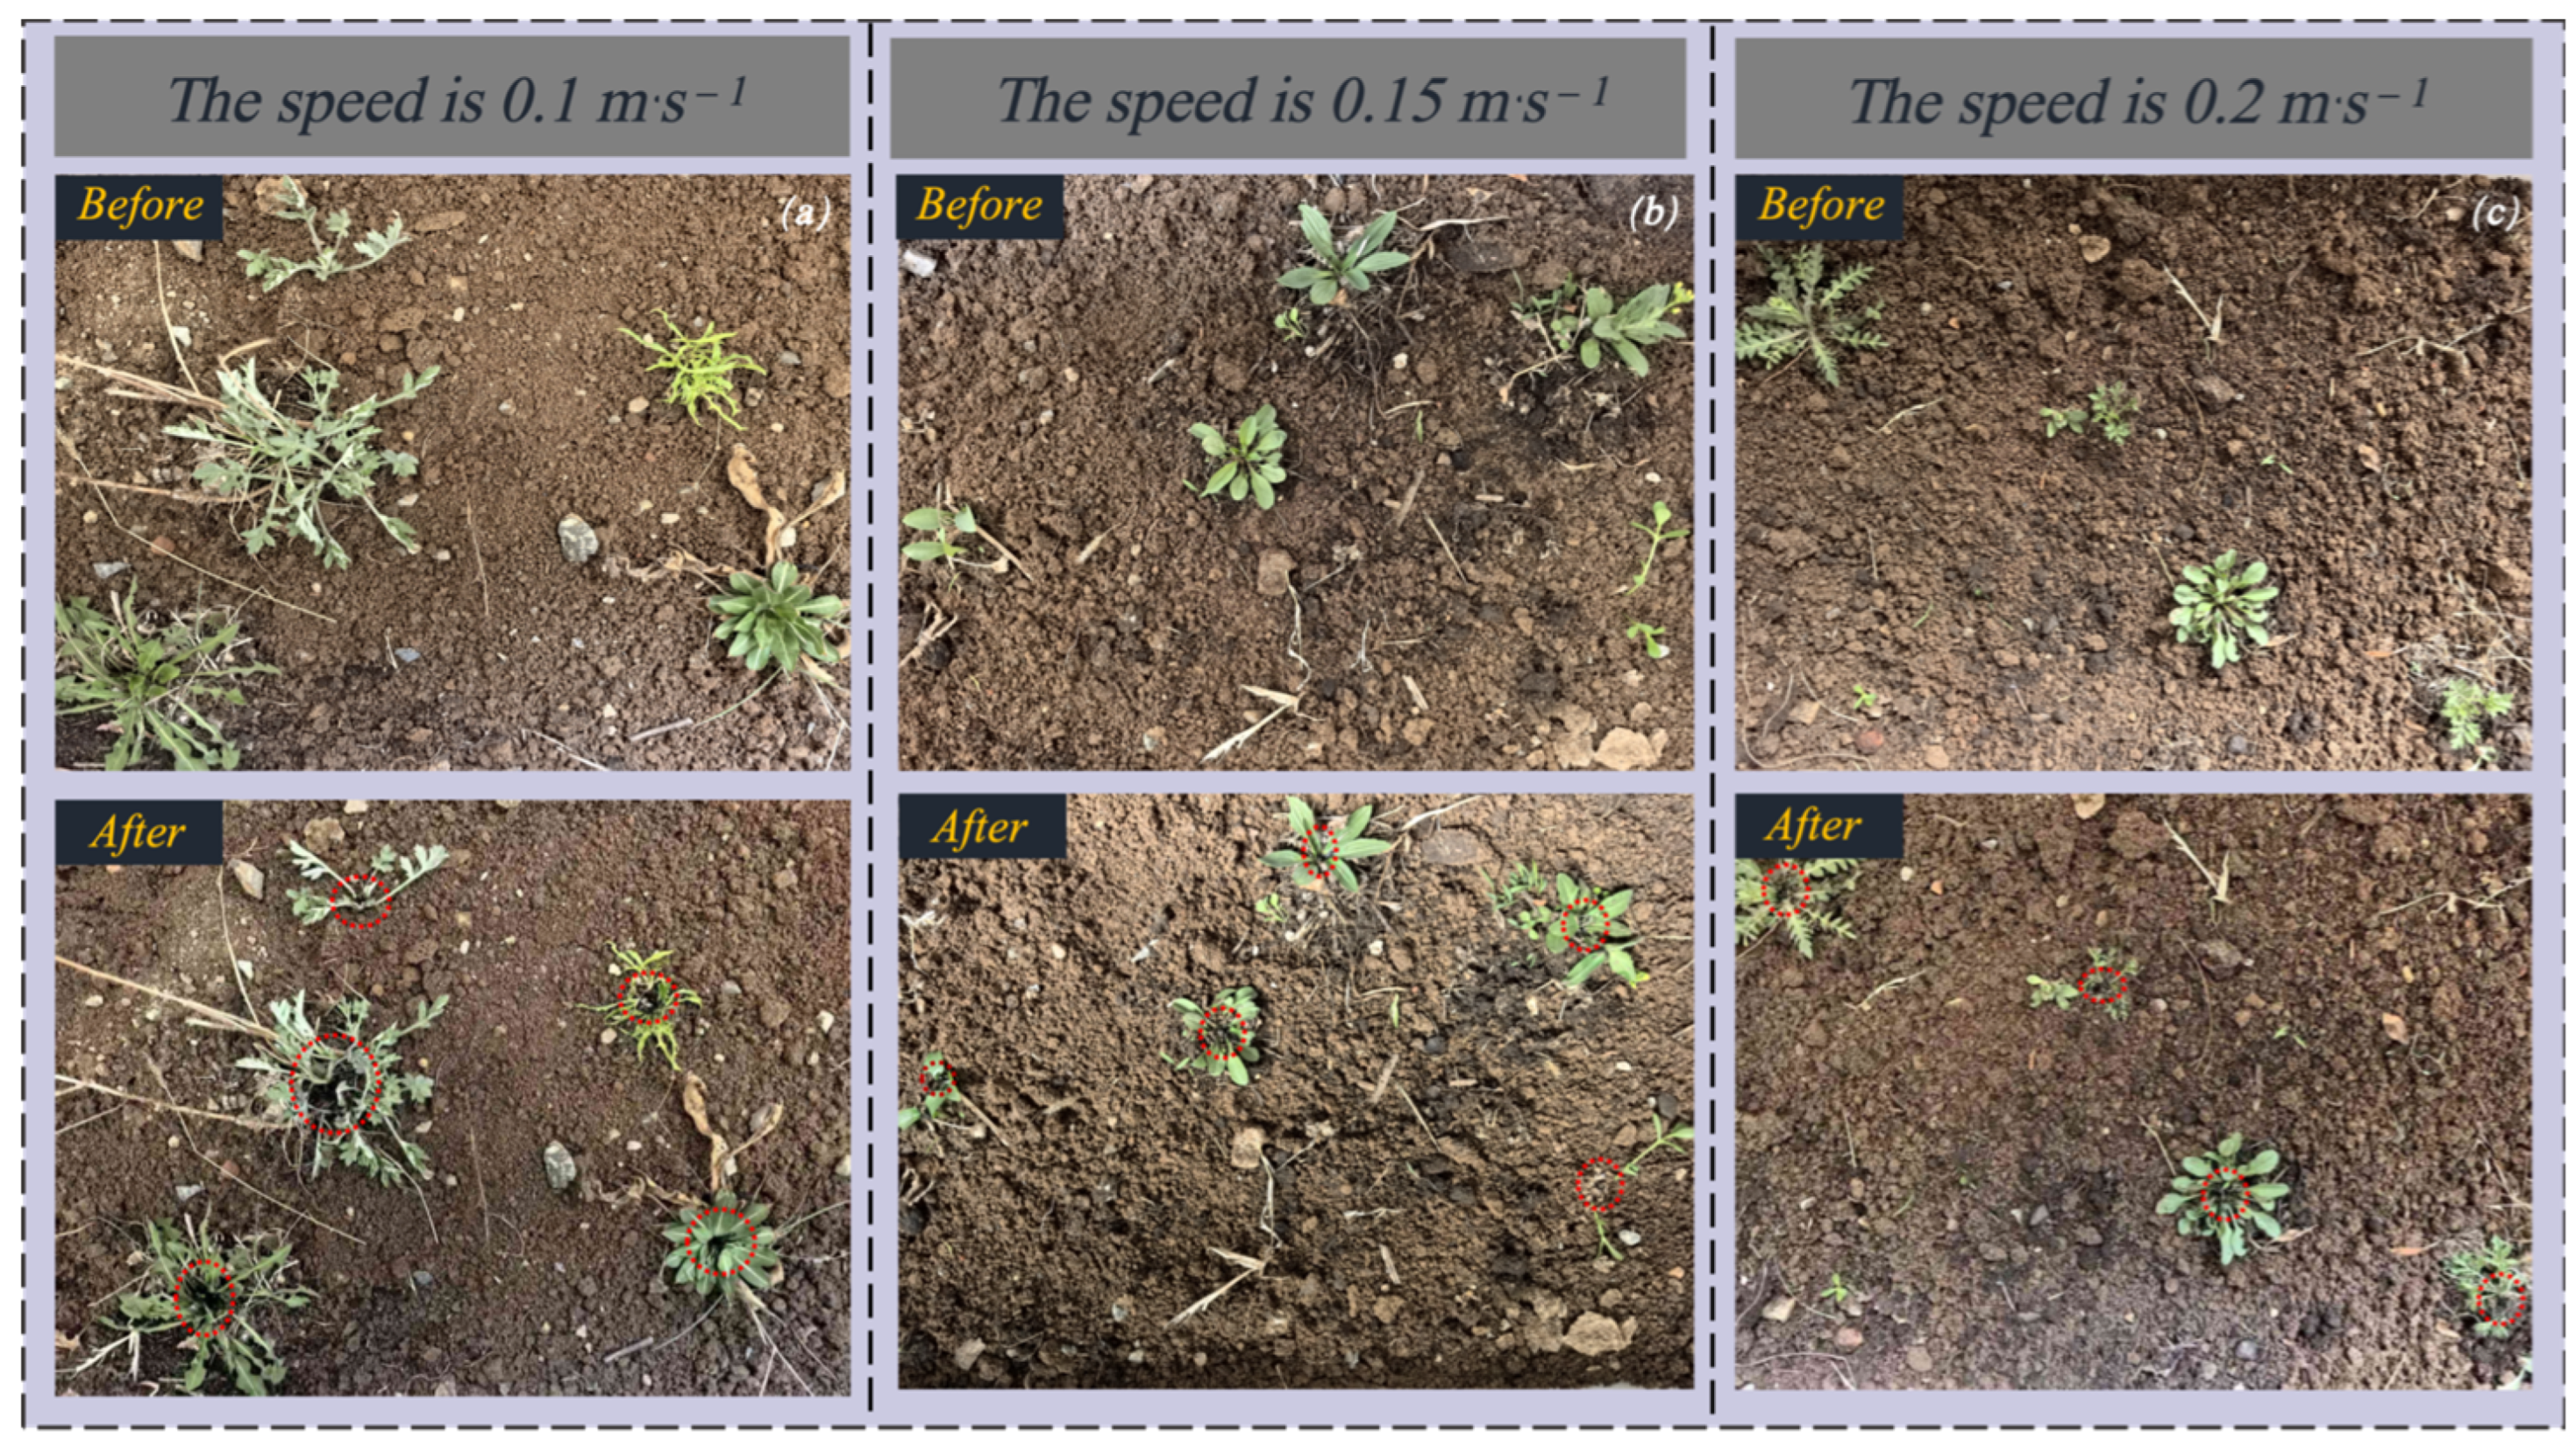
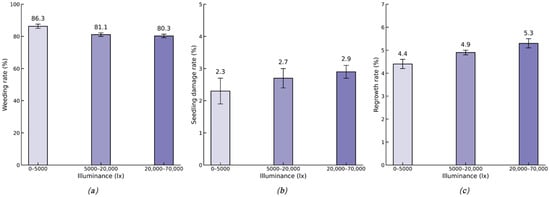
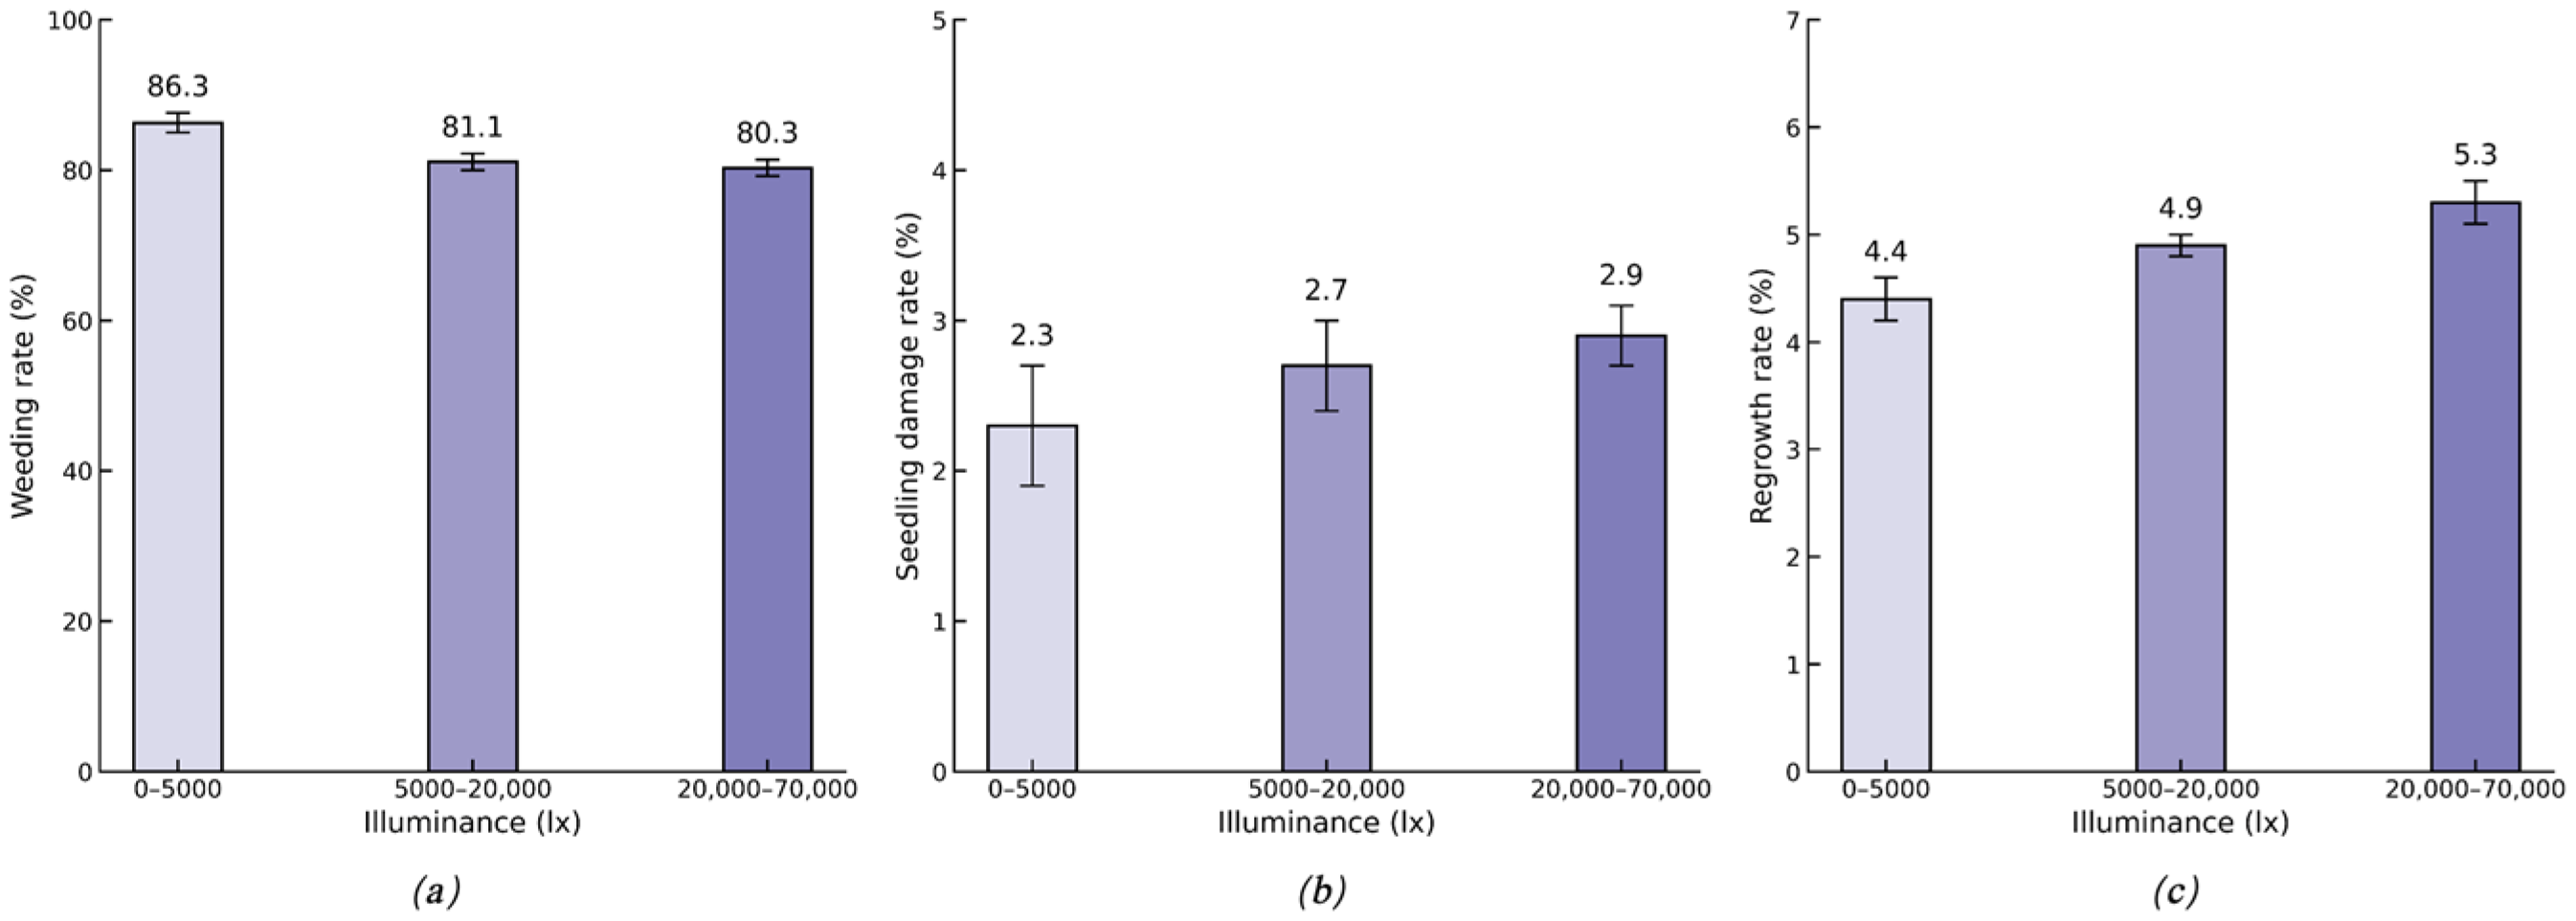
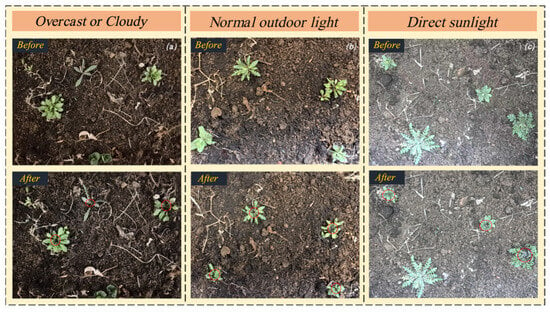
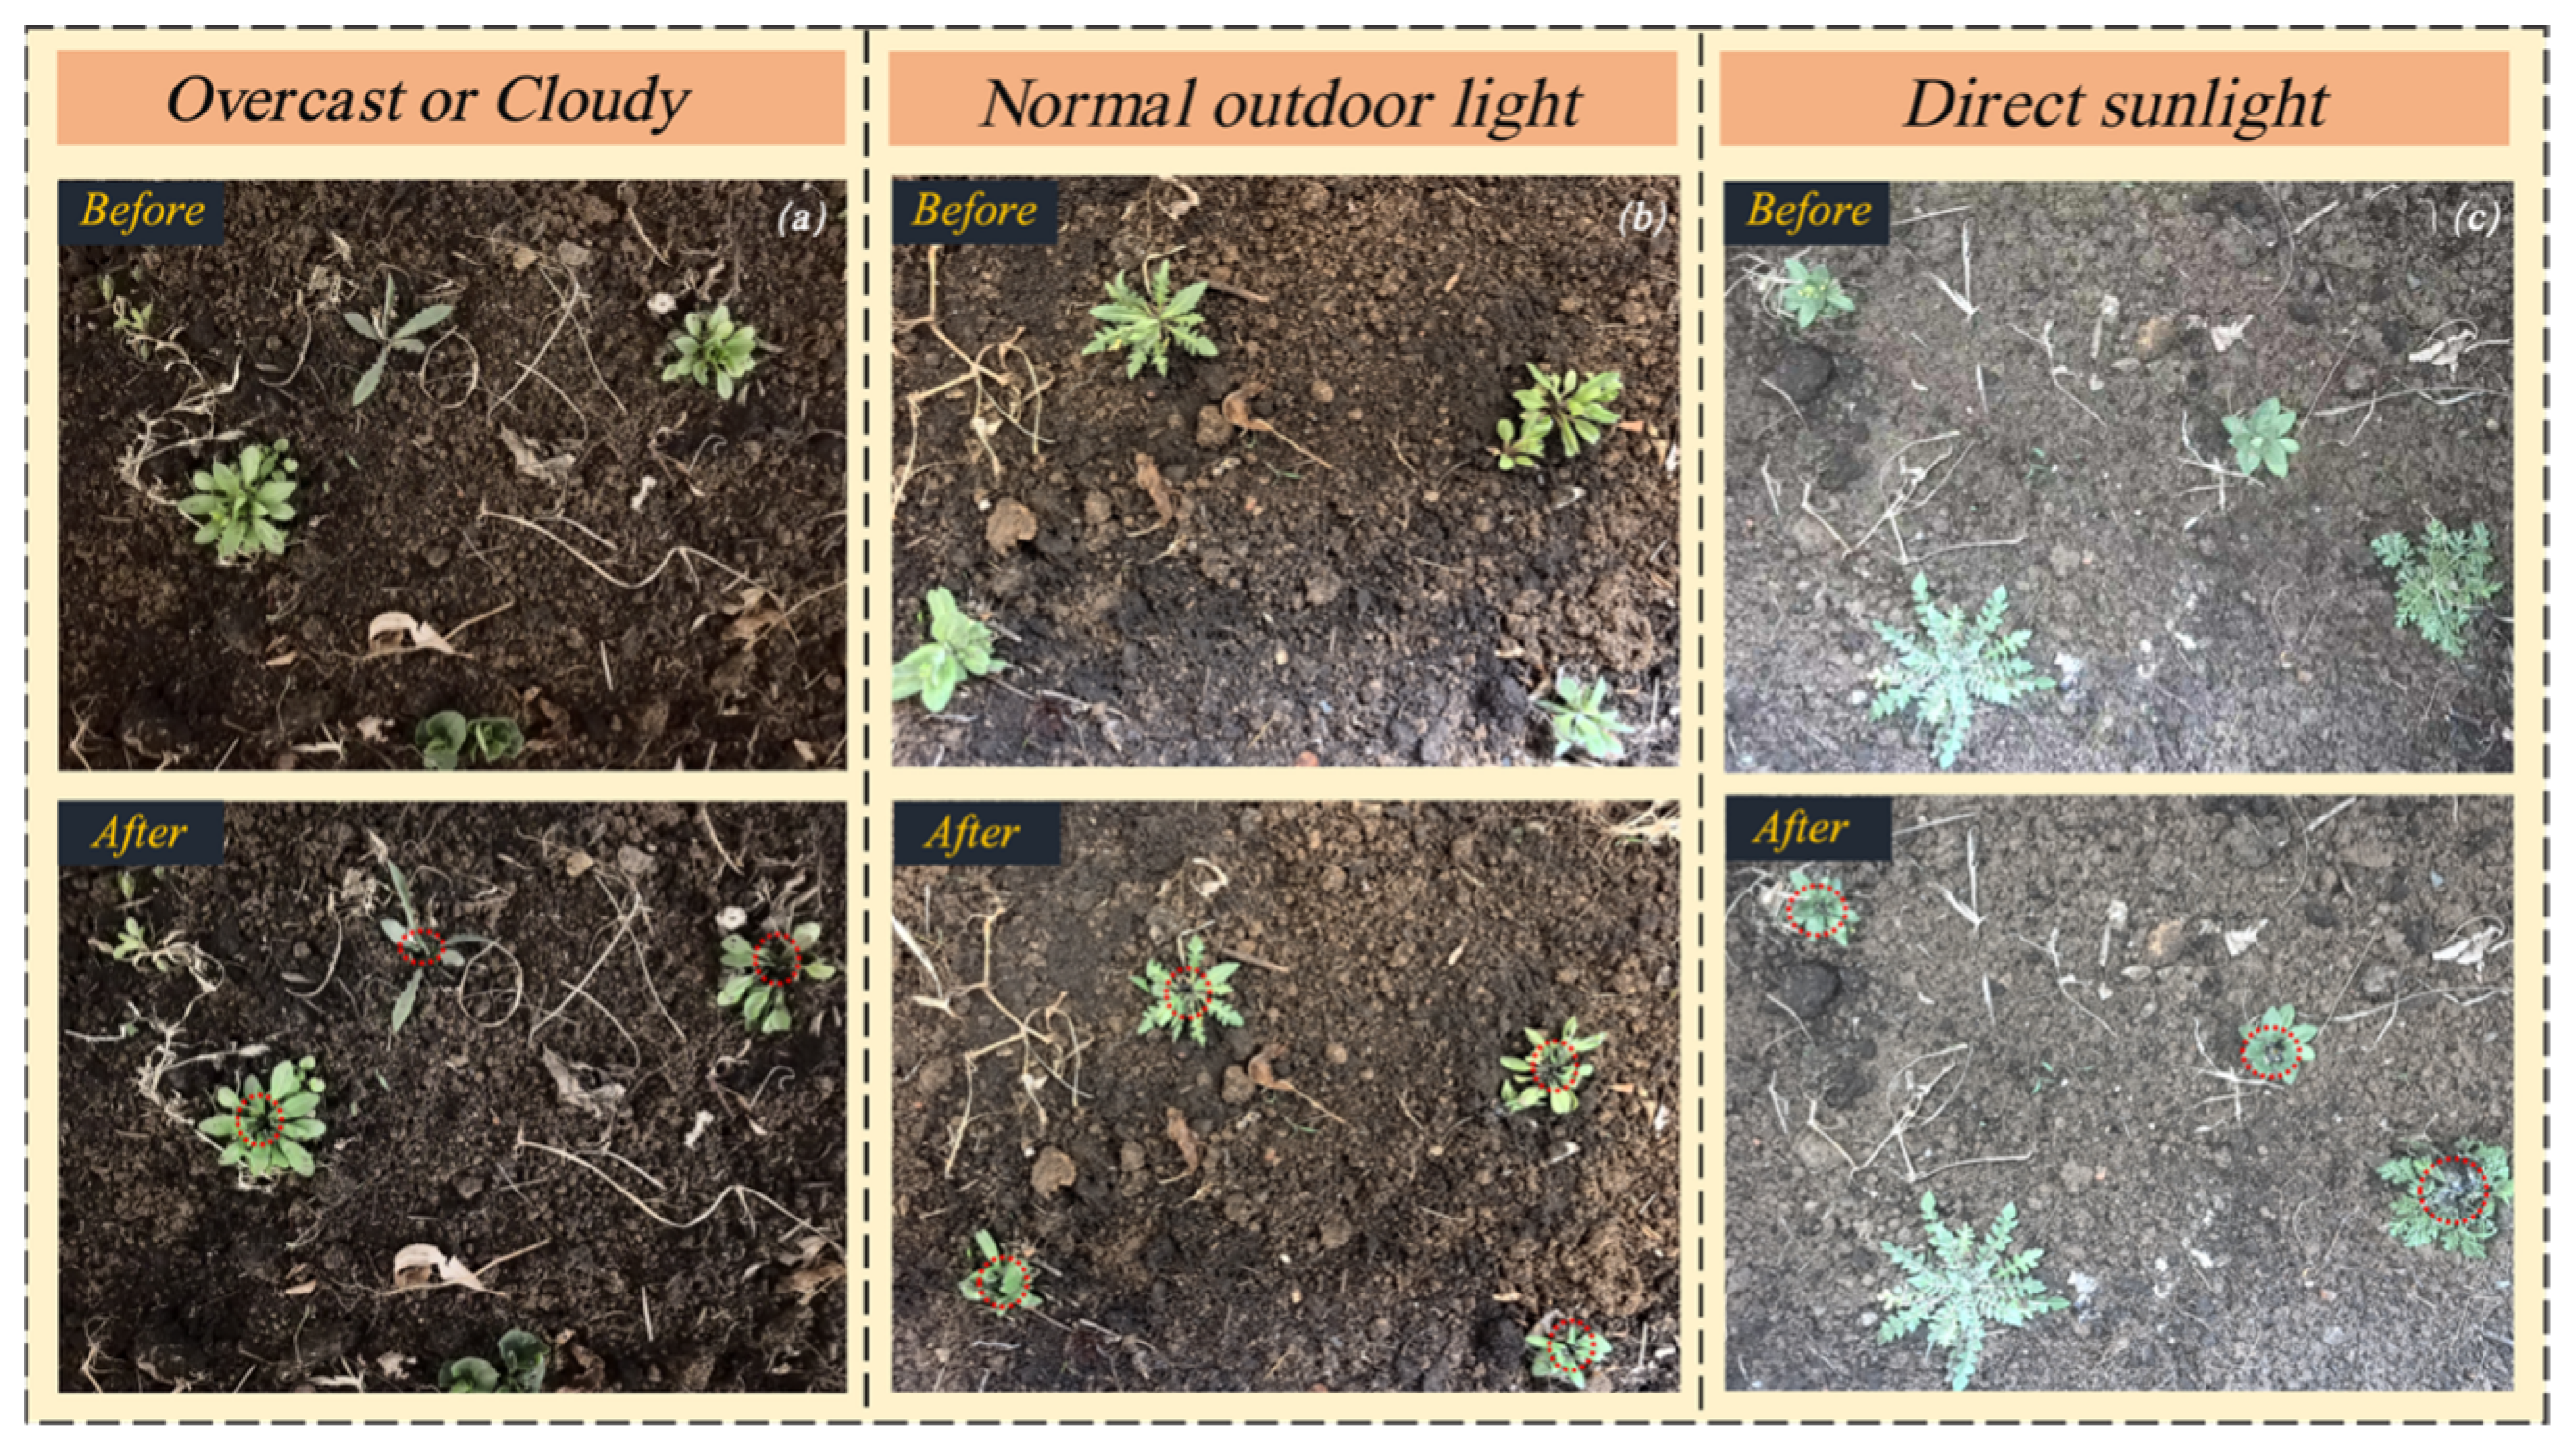

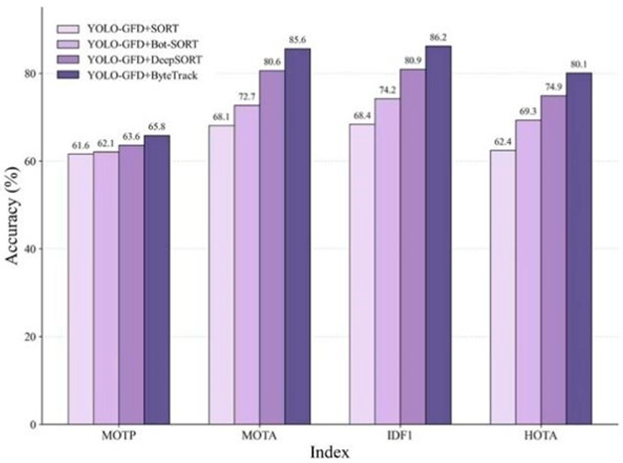
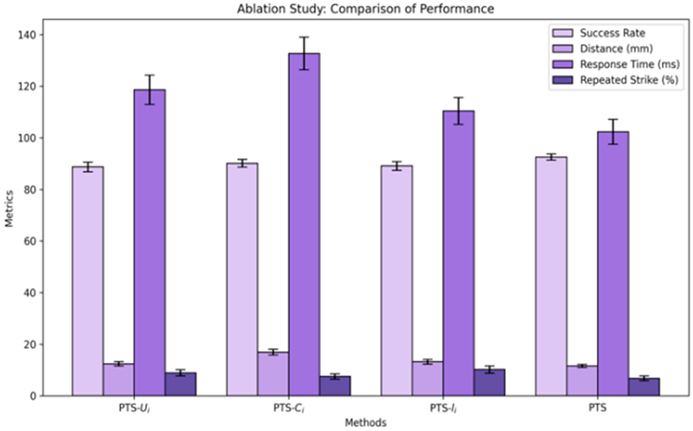
Disclaimer/Publisher’s Note: The statements, opinions and data contained in all publications are solely those of the individual author(s) and contributor(s) and not of MDPI and/or the editor(s). MDPI and/or the editor(s) disclaim responsibility for any injury to people or property resulting from any ideas, methods, instructions or products referred to in the content. |
© 2026 by the authors. Licensee MDPI, Basel, Switzerland. This article is an open access article distributed under the terms and conditions of the Creative Commons Attribution (CC BY) license.