


Abstract
Wheat aphids are the primary pests in wheat-producing areas, posing a serious threat to stable, high wheat yields and regional food security. To detect and count wheat aphids under different complex conditions, this study designed an improved model and developed a mini program. Firstly, we constructed a dual-source dataset containing 542 images collected from indoor and field environments, including 117 indoor images and 425 field images. Secondly, we proposed Aphid Identification and Detection YOLO (AID-YOLO), an enhanced YOLO11n-based method for close-range wheat aphid detection and image-level counting. Specifically, the original downsampling structure was replaced with the ADown module to improve feature extraction efficiency while reducing redundant computation, an IEMA multi-scale attention mechanism integrating IRMB and EMA was introduced to strengthen feature learning under complex background interference, and the dynamic upsampling operator DySample was adopted to enhance cross-scale feature fusion. Finally, AID-YOLO achieved a 19.0% reduction in parameter count (2.09 M vs. 2.58 M) and a 19.0% decrease in computational cost (5.1 vs. 6.3 GFLOPs). Across three random seeds, AID-YOLO achieved an average mAP50 of 95.3 ± 0.10%, compared with 93.0 ± 0.39% for the YOLO11n baseline on the combined indoor–field evaluation set. These results suggest that AID-YOLO achieves a favorable balance between detection accuracy and model lightweighting under the tested indoor and field conditions, providing a useful technical reference for intelligent wheat aphid monitoring.
1. Introduction
Wheat (Triticum aestivum L.) is one of the world’s major staple crops, providing roughly one-fifth of the calories and protein consumed by humans worldwide. However, as planting areas continue to expand and climate change intensifies, wheat production is increasingly exposed to a wide range of diseases and insect pests [1,2]. Among these threats, wheat aphids (Sitobion avenae) are particularly destructive because they persist throughout the crop growth cycle and are widely distributed across major wheat-producing regions of China, including the Huang–Huai–Hai Plain and the northwestern dryland areas. In some regions, the annual infestation area exceeds 30% of the total wheat cultivation area. Under large-scale and contiguous planting systems, aphids are prone to outbreak aggregation, especially during the heading stage, and their population density per hundred wheat spikes may reach 5–10 times that of other pest species [3,4,5]. By sucking plant sap and reproducing rapidly, aphids can form large colonies within a short period, thereby impairing grain filling, causing kernel shriveling, and ultimately reducing yield; under severe infestation, direct damage by Sitobion avenae can reduce winter wheat yield by 10–20% [6,7,8]. Nevertheless, accurate field identification of wheat aphids remains difficult because of their tiny body size, their color similarity to wheat foliage, and the strong variability in their morphology, posture, and spatial distribution under natural backgrounds. Therefore, rapid and accurate aphid detection under complex field conditions, together with effective population monitoring for scientific pest management, has become an urgent need in modern wheat production.
In recent years, precision agriculture has promoted the wider use of spectral information in crop monitoring and pest diagnosis. By measuring reflectance patterns at selected wavelengths, spectral imaging enables the identification of early physiological alterations in plants prior to the appearance of obvious visual symptoms, thereby supporting crop phenotyping and stress diagnosis [9,10,11]. Considerable attention has therefore been given to hyperspectral, near-infrared, and multispectral imaging techniques. For example, Liu et al. developed the PMA-VRNet model for early rice disease classification using UAV-based hyperspectral imagery, combining the RBDI index with texture and canopy coverage features to achieve 94.5% overall accuracy and a Kappa coefficient of 0.9312 under the optimal sensitive band combination [12]. Mustafa et al. employed hyperspectral reflectance data from wheat spikes together with feature selection and machine learning methods to grade Fusarium head blight and predict disease progression, reporting classification accuracies of approximately 67% at the pre-symptomatic stage and 89% at three days post-inoculation, as well as a regression R2 of 0.94 [13]. Halstead et al. integrated UAV hyperspectral imagery with gradient boosting machines for early clubroot detection in oilseed rape, achieving over 90% accuracy at the patch scale and identifying the near-infrared band (758–764 nm) as a key contributor [14]. Although spectral methods have demonstrated clear advantages in early detection and high-precision diagnosis, their practical application is still constrained by high equipment costs, complex operation, massive data volume, and demanding processing workflows, which limit large-scale deployment in routine agricultural production.
Alongside advances in sensing technology, deep learning-based object detection has become an increasingly important approach for field pest monitoring. As agricultural detection systems are expected to operate on mobile terminals and edge devices, recent model development has moved toward lightweight architectures that can maintain stable performance under limited computational resources [15,16,17]. Ma et al. proposed MH-YOLO based on YOLOv5s by integrating Swin-Transformer, CBAM, and ASFF modules with channel pruning, achieving high detection accuracy for orchard pests while retaining only about 6.92 M parameters [18]. Li et al. proposed a modified YOLOv5 framework for passion fruit pest detection that incorporated a point-to-line distance loss, an attention mechanism, and mixup augmentation, achieving an mAP of 96.51% with an average inference time of 7.7 ms per image [19]. Wen et al. designed Pest-YOLO for tiny and dense pest detection and counting, emphasizing scalability and efficiency in high-density, multi-class, and long-term monitoring scenarios [20]. These studies confirm the potential of lightweight detectors in agricultural applications. However, when models are transferred across scenes or exposed to complex environmental interference, maintaining both computational efficiency and robust predictive performance remains challenging.
To further improve pest detection in natural environments, recent studies have focused on enhancing multi-scale representation, attention modeling, and loss optimization to reduce errors caused by tiny targets, high inter-class similarity, and cluttered backgrounds [21,22,23,24]. Zheng et al. proposed Paddy-YOLO based on YOLOv8 for rice pest detection, incorporating an enhanced feature extraction module and a dynamic regression loss. The model improved mAP50 from 45.8% to 54.3% and mAP50:95 from 30.1% to 38.5%, and achieved an mAP50 of 70.2% in rice pest recognition [21]. Zhu et al. developed CBF-YOLO by integrating dedicated feature enhancement modules to improve spatial channel interaction and feature refinement, and reported an mAP of 86.9% for soybean pest detection under challenging field conditions [22]. Tian et al. introduced MD-YOLO by combining DenseNet, adaptive attention, and dense multi-scale fusion, and obtained an mAP50 of 86.2% for small pest detection on sticky plates [23]. Although these methods yield improvements in detection accuracy, they often rely on deeper and more complicated network structures, resulting in increased parameter counts and GFLOPs. In addition, their performance may still fluctuate under heterogeneous illumination, occlusion, and clustered pest distributions, leaving inference efficiency and robustness across heterogeneous scenes insufficient for broader field-oriented applications.
Despite these advances, reliable detection of wheat aphids under real-world conditions remains challenging. Individual aphids are extremely small, often densely clustered, and visually similar to leaf veins, shadows, and other background textures, which can substantially reduce detection accuracy. Moreover, some existing detectors remain computationally demanding, and their performance is often evaluated on relatively limited or homogeneous datasets, constraining edge-oriented use and performance under heterogeneous field conditions. To address these challenges, this study proposes AID-YOLO, a lightweight detection framework based on YOLO11n for close-range wheat aphid detection and image-level count estimation under both natural field and controlled indoor conditions. Specifically, the original downsampling blocks are replaced with ADown to reduce redundant computation and model complexity. An IEMA module integrating IRMB and EMA is introduced to strengthen multi-scale feature interaction and improve feature representation under complex background interference. In addition, DySample is employed to enhance cross-scale feature fusion and reconstruct spatial details during upsampling, thereby improving the representation of small aphid targets. By jointly incorporating lightweight downsampling, attention-enhanced feature interaction, and dynamic upsampling within a compact architecture, AID-YOLO is designed to improve tiny-target detection while maintaining low computational complexity. The proposed framework is evaluated for three related purposes: improving the accuracy–efficiency balance of YOLO11n, supporting detection-based image-level aphid counting, and assessing edge-assisted feasibility for close-range use by non-specialist users such as growers and field extension workers.
2. Materials and Methods
2.1. Study Area and Image Acquisition
Wheat aphid images were collected from two sources: the Institute of Plant Protection, Henan Academy of Agricultural Sciences, and the Modern Agricultural Research and Development Base in Yuanyang County, Henan Province, China (35°01′ N, 113°40′ E). The aphids investigated in this study were identified as the English grain aphid, Sitobion avenae, during image collection and annotation. Field images were acquired from 17 to 28 April 2025 in a conventional wheat field during the heading-to-grain-filling stage. Indoor images were collected from 17 January to 18 February 2025 using potted wheat plants under controlled laboratory conditions.
All images were captured using a vivo X100s smartphone (vivo Mobile Communication Co., Ltd., Dongguan, China) and saved in JPG format with an original resolution of 4096 × 3072 pixels. Images were acquired as close-range, ground-level photographs, with an approximate shooting distance of 0.1–0.8 m depending on plant height, aphid location, and shooting conditions. Field images were taken under natural illumination and complex background conditions, whereas indoor images were acquired under laboratory lighting, with potted wheat plants placed inside an insect-proof mesh cage. After screening and quality control, 542 high-quality images were retained, including 117 indoor images and 425 field images.
2.2. Dataset Annotation and Partitioning
The retained images were annotated using LabelImg (v1.8.1), with each visible aphid manually marked by a rectangular bounding-box. Overlapped or partially occluded aphids were annotated when their visible body contours could be reliably distinguished, whereas highly ambiguous regions were carefully checked to reduce noisy labels. Because the dataset focused on a single aphid species, all annotations were assigned the same class label, “aphid”. Before data augmentation, the 542 original images contained approximately 2012 annotated aphid instances, including approximately 660 instances in the indoor subset and 1352 instances in the field subset. This additional information indicates that the dataset contained multiple aphid targets per image and better reflects the clustered small-target characteristics and annotation complexity of wheat aphid detection. To further characterize the object-size distribution, bounding-box sizes were recalculated at the 640 × 640 input scale using the same resizing strategy as model training. The equivalent bounding-box size, defined as the square root of the bounding-box area, had a mean of 32.9 pixels, a median of 31.3 pixels, and a minimum of 6.3 pixels. In total, 53.08% of the aphid boxes had an equivalent size below 32 pixels, and 97.22% were below 64 pixels, whereas only 2.78% were larger than or equal to 64 pixels. These results indicate that most aphid instances occupied limited spatial regions after resizing, confirming the small-object characteristics of the dataset.
To ensure an independent evaluation and avoid data leakage, the dataset was partitioned before any data augmentation was applied. The 542 annotated images were randomly divided into training, validation, and test sets at a ratio of 8:1:1, resulting in 434, 54, and 54 images, respectively. Stratified splitting was used to keep the indoor–field sample distribution approximately consistent across the three subsets. The validation set was used to monitor model convergence and support model selection, whereas the held-out test set was used only for final performance evaluation. No data augmentation was applied to the validation or test sets.
2.3. Data Augmentation
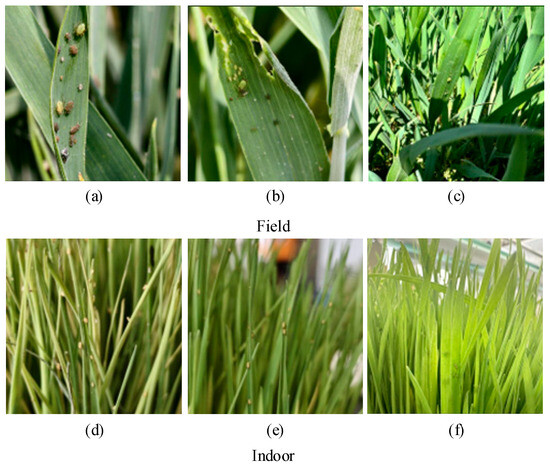
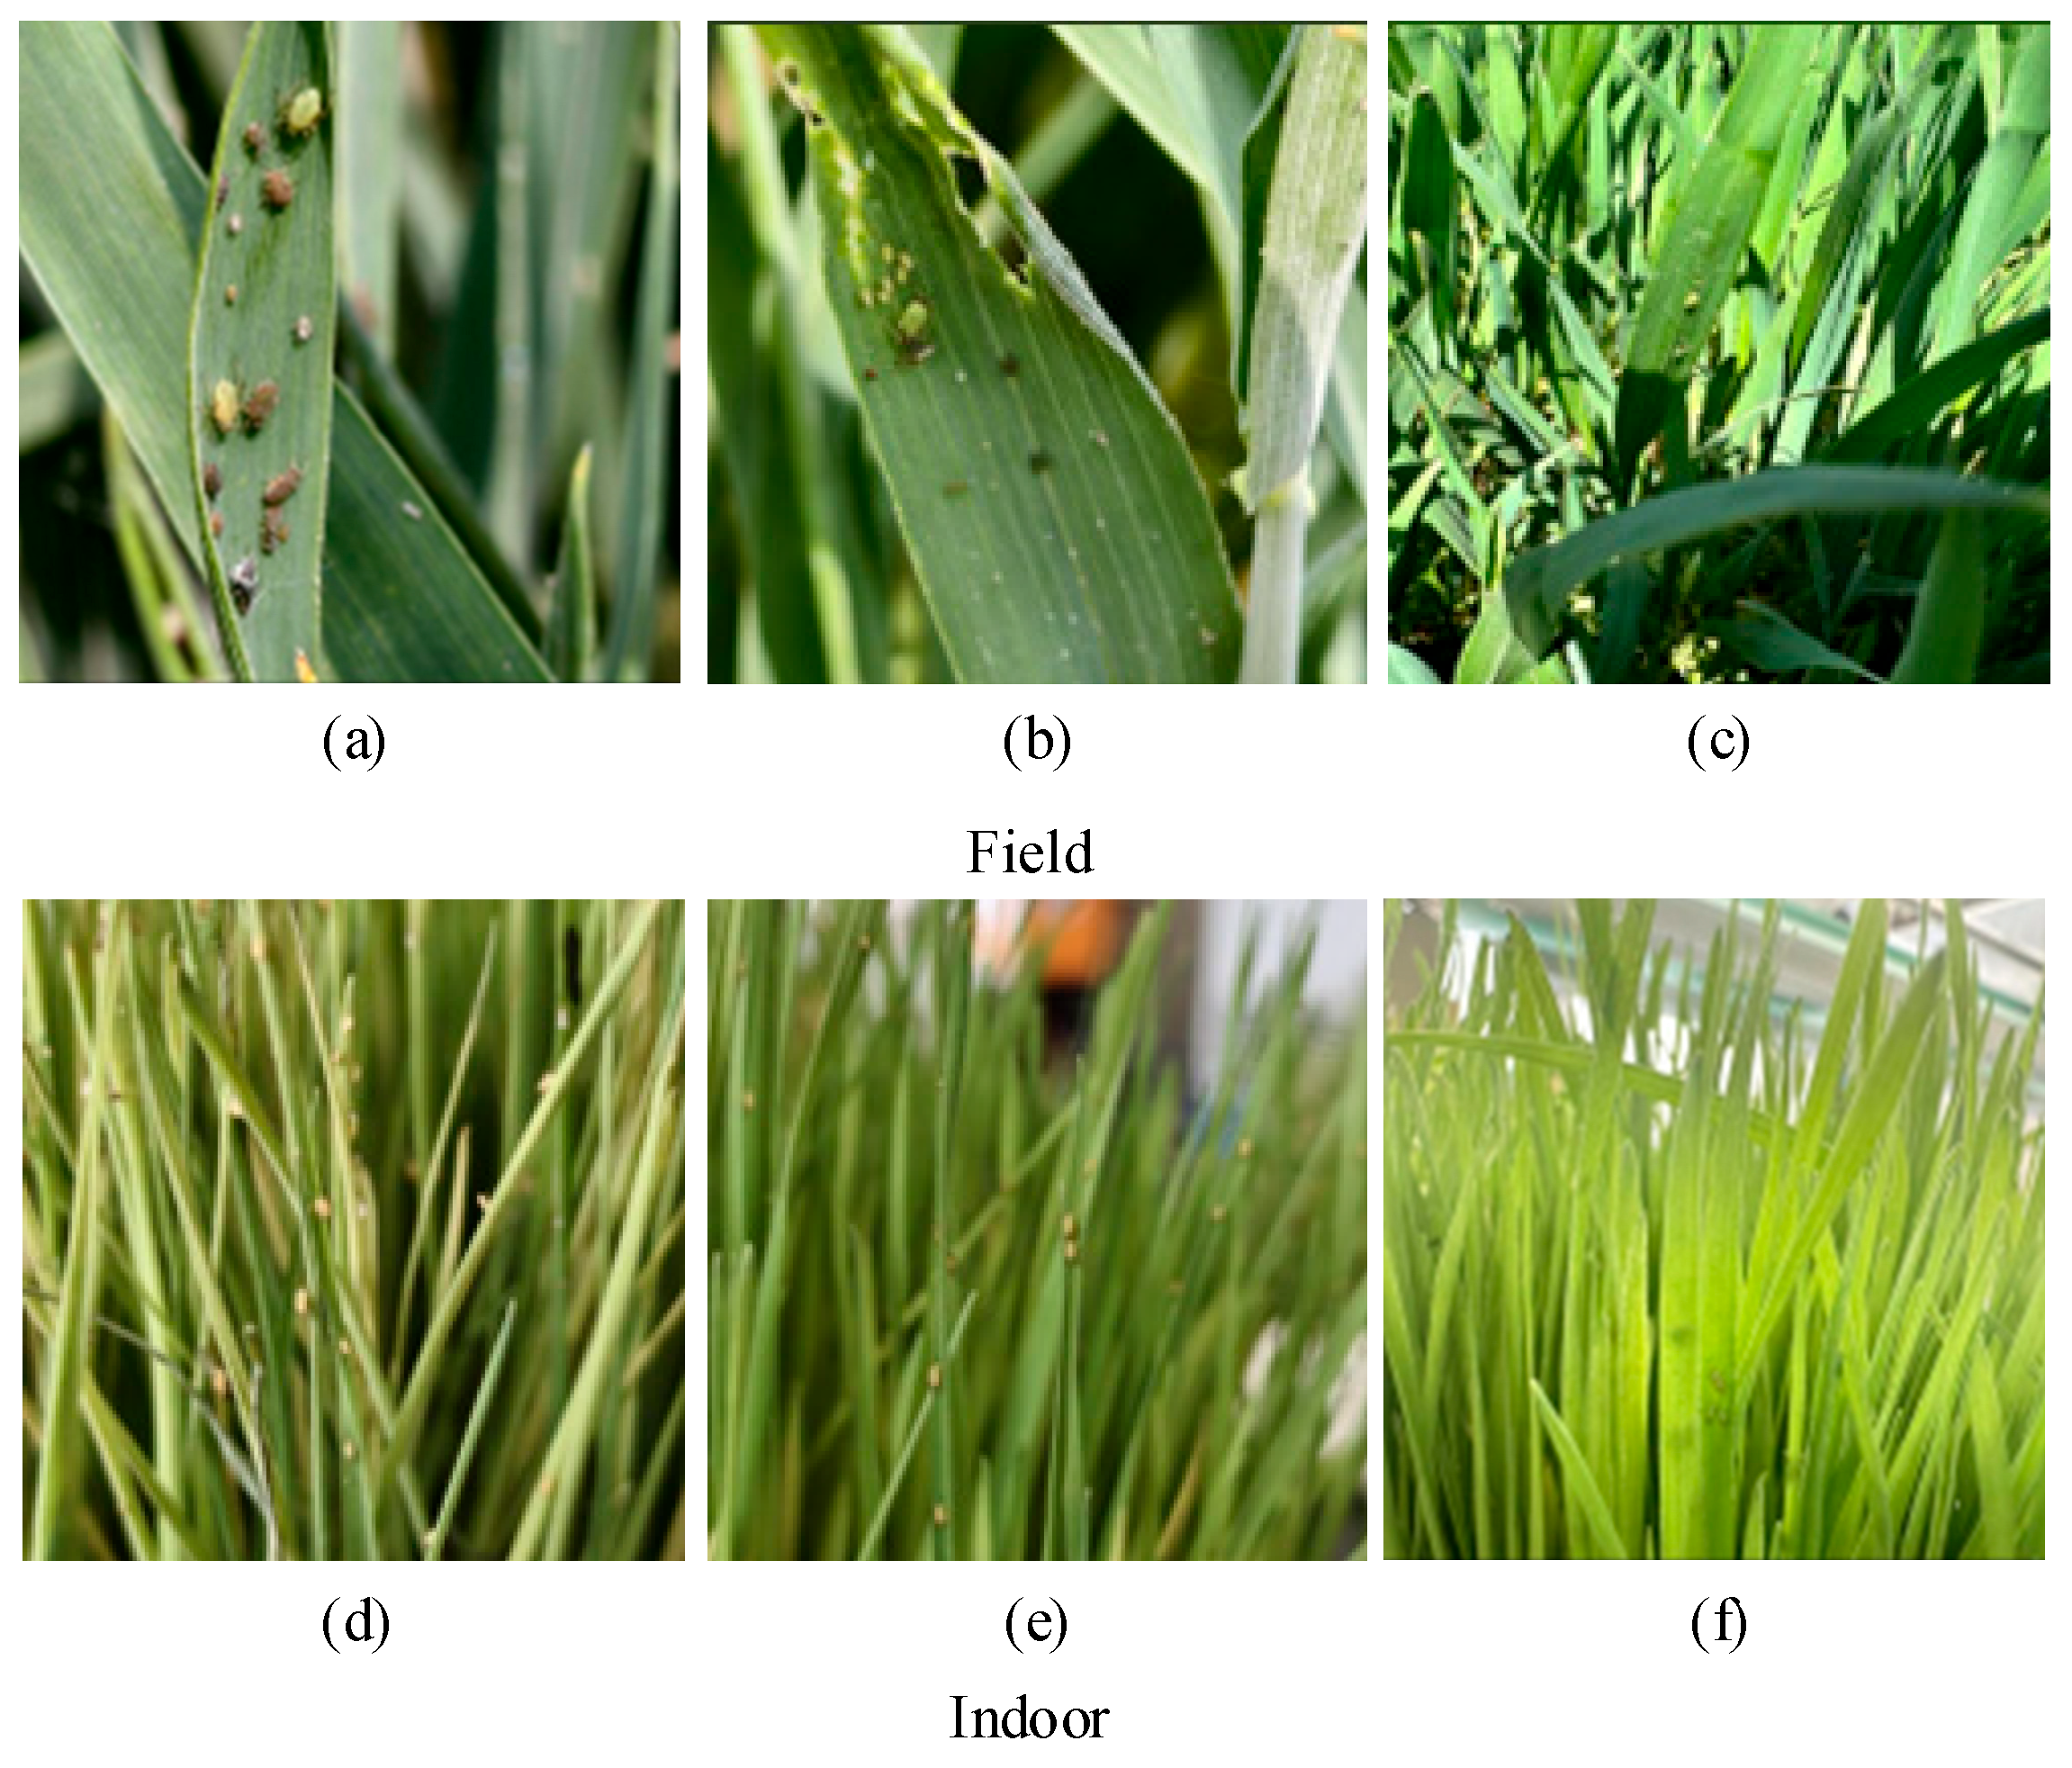
Data augmentation was performed exclusively on the training set to enrich sample variation, improve robustness to orientation and compositional variation, and mitigate overfitting while preserving the independence of the validation and test sets. Given the minute size of wheat aphids and the relative insensitivity of their key morphological and textural features to orientation changes, a targeted geometric rotation strategy was adopted. Each original training image was rotated 90° clockwise and 90° counterclockwise, generating two additional samples. This strategy simulates variations in camera orientation and shooting angle during image acquisition without altering aphid contours or texture details. As a result, the model becomes more robust to target orientation changes and compositional variation. After augmentation, the training set increased from 434 to 1302 images, whereas the validation and test sets remained unchanged at 54 images each. In total, 1410 images were used for model training and evaluation. This design increased training diversity while strictly preserving the independence of the validation and test data. Representative indoor and field samples are shown in Figure 1.
Figure 1.
Representative wheat aphid images under field and indoor conditions: (a) clustered aphids on a wheat leaf in the field; (b) aphids distributed on a field-grown wheat leaf; (c) a wider field scene with a complex wheat canopy; (d) aphids on wheat leaves and stems under indoor conditions; (e) a close-range indoor image with background interference; (f) a wider indoor scene of potted wheat plants in an insect-proof mesh cage.
2.4. Overall Research Framework
Given the small size, clustered distribution, and background-mixing characteristics of wheat aphids in close-range images, existing methods struggle to balance detection accuracy, inference efficiency, and model lightweighting, while reliance on homogeneous data sources often leads to insufficient cross-scenario adaptability. To address these limitations, this study developed an improved YOLO11n model for rapid and accurate detection and image-level counting of wheat aphids under indoor and field conditions while maintaining the advantages of a lightweight architecture. The research consists of three main components:
- (1)
- constructing a dual-source dataset comprising indoor and field images and employing a directional rotation augmentation strategy;
- (2)
- designing and implementing an enhanced YOLO11n network that integrates ADown lightweight convolution, the dynamic upsampling operator DySample, and the multi-scale attention mechanism IEMA;
- (3)
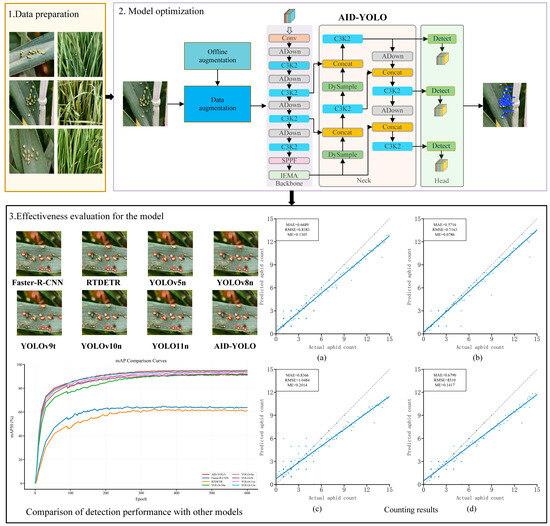
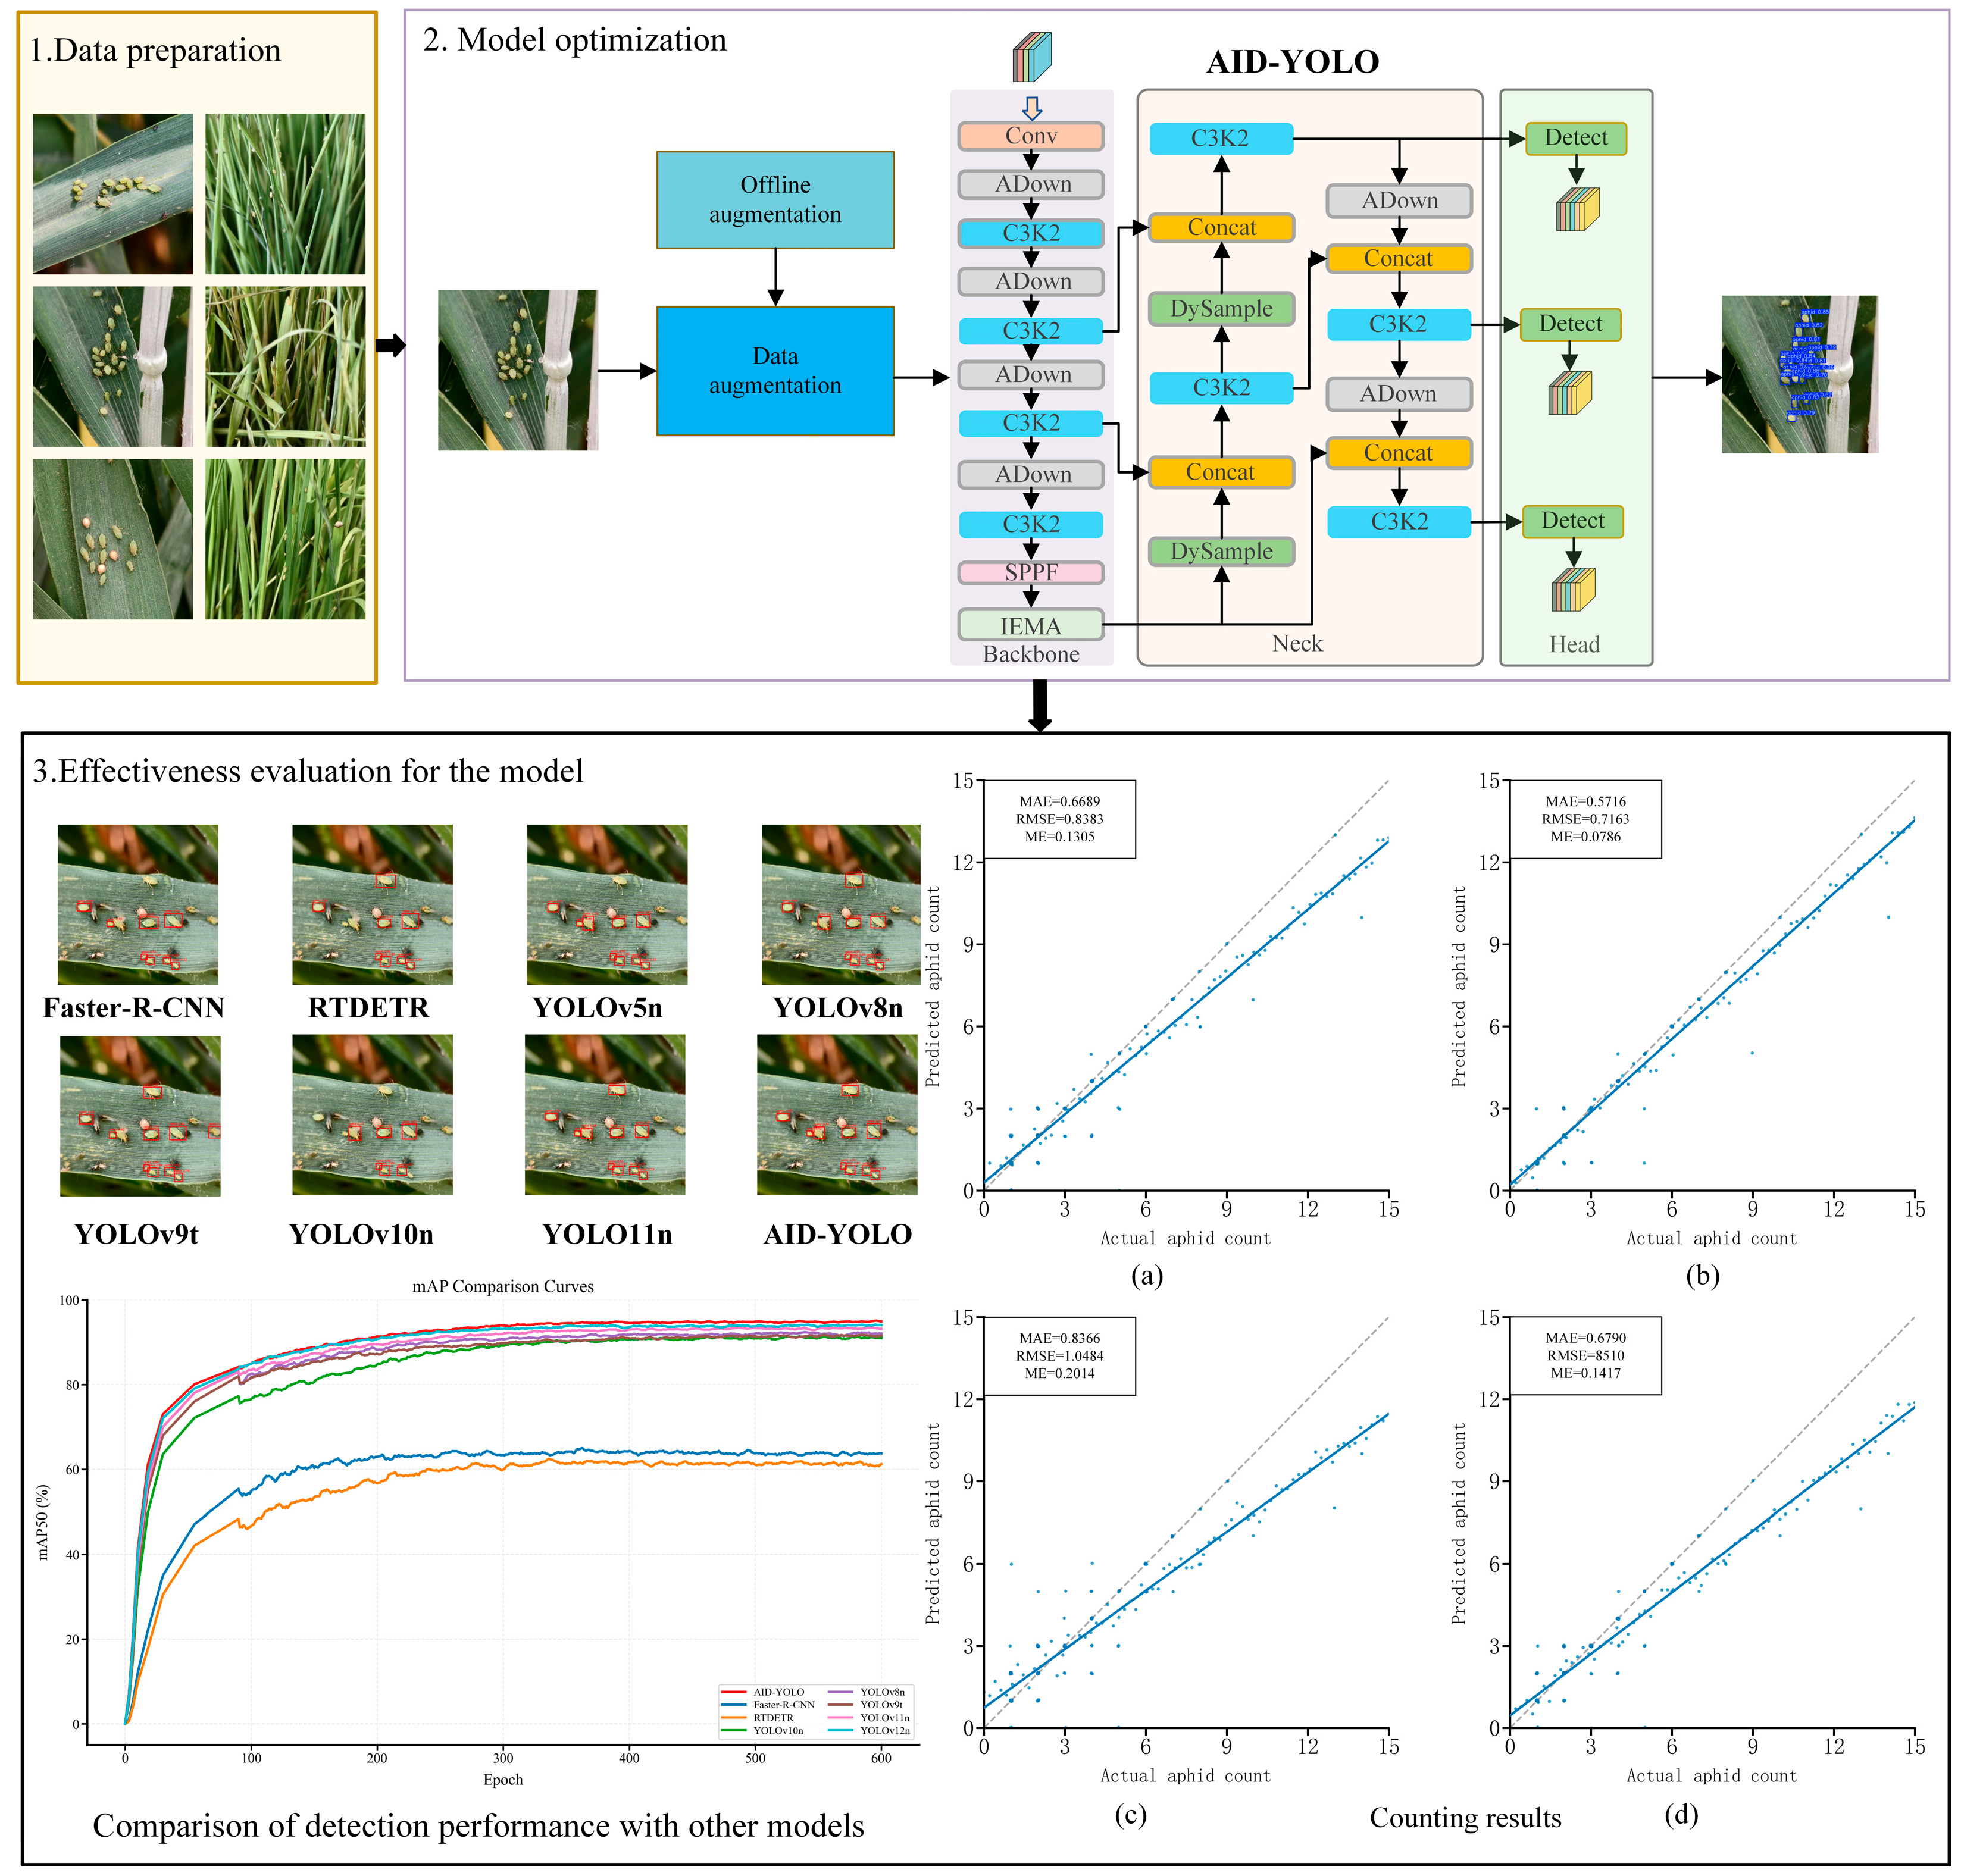
- implementing AID-YOLO in a WeChat mini program and evaluating its edge-assisted feasibility for close-range field-image use, followed by comparative assessment against several lightweight detectors with respect to detection performance, robustness, computational cost, and practical feasibility. The overall framework of the study is shown in Figure 2.Figure 2. Overall research framework of the study, including dataset construction, AID-YOLO model development, performance evaluation, image-level aphid counting, and edge-assisted application. The embedded counting-performance thumbnails show the relationships between manually annotated and model-predicted aphid counts per image: (a) YOLO11n on the field dataset; (b) AID-YOLO on the field dataset; (c) YOLO11n on the indoor dataset; and (d) AID-YOLO on the indoor dataset. The dashed line represents the ideal 1:1 agreement.
2.5. Baseline YOLO11n Model
YOLO11n is a one-stage detector that provides five model scales, from YOLO11n to YOLO11x, for different accuracy–efficiency requirements. The network comprises four main parts: the input module, backbone, neck, and detection head. Considering its lightweight design and favorable balance between accuracy and speed, YOLO11n was adopted as the baseline for wheat aphid detection in this study.
2.6. Proposed AID-YOLO Architecture
To improve wheat aphid detection, we propose AID-YOLO, an enhanced YOLO11n-based model. By incorporating the ADown module, the IEMA mechanism, and the DySample operator, the model improves small-object discriminability, robustness across the evaluated indoor and field scenes, and edge-deployment efficiency. The ADown module reduces backbone computation while enhancing sensitivity to small-target cues. The IEMA mechanism strengthens hierarchical feature modeling and improves responsiveness to targets with varying spatial characteristics. The DySample operator refines feature aggregation and detail preservation, enabling more accurate capture of aphid edge and morphological information.
2.6.1. ADown Lightweight Downsampling Module
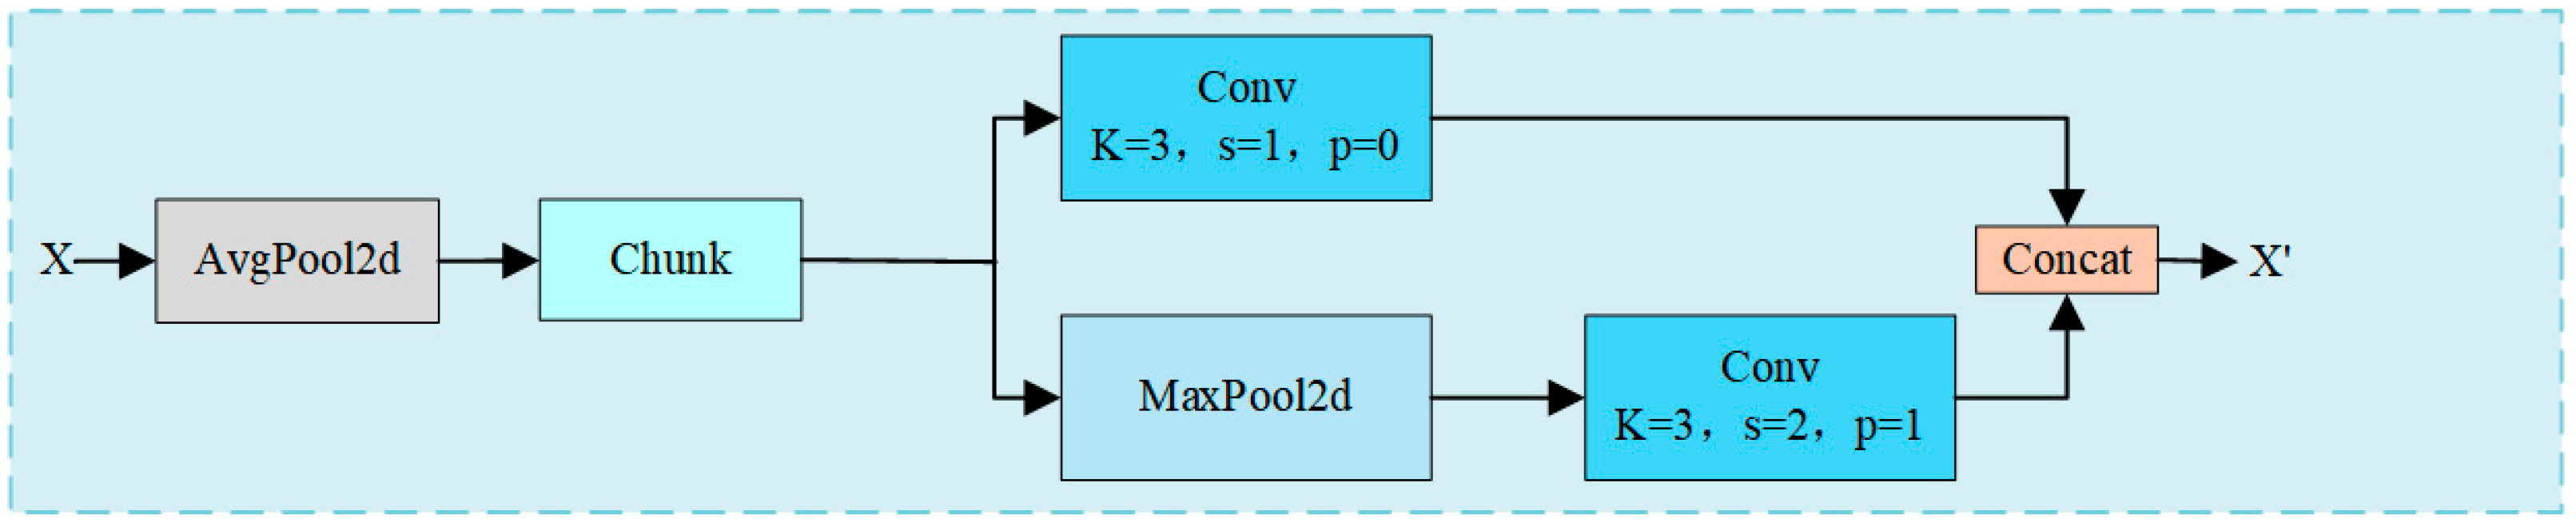
For wheat aphid recognition across varying environmental conditions, lightweight deployability is critical to practical application. Although conventional convolutional architectures offer strong feature extraction capability, their large model scale and substantial computational overhead often constrain deployment feasibility on resource-constrained devices. To alleviate this problem, the ADown lightweight downsampling convolution (ADown) module was introduced by integrating 2D average pooling (AvgPool2d) with channel chunking. This design reduces computational burden and model scale while retaining critical feature representations, thereby facilitating lightweight deployment.
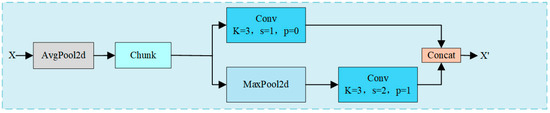
Figure 3 depicts the general architecture of the ADown module, and its processing pipeline can be summarized as follows. Input feature map X first undergoes AvgPool2d for spatial compression, redundancy suppression, and improved feature compactness. The processed features are subsequently separated into two equal channel-wise branches. In the left branch, the features are first processed by 2D max pooling (MaxPool2d) to further reduce spatial resolution and suppress background interference. They are subsequently passed through a convolutional layer (3 × 3, stride = 2, padding = 1) for efficient downsampling and feature abstraction, enabling the model to capture the overall distribution patterns of aphids on wheat leaves. In the right branch, the features are directly fed into a convolutional layer (3 × 3, stride = 1, padding = 0) to preserve local spatial details, thereby emphasizing aphid-specific cues such as edge structure, morphological contours, and fine texture information. Finally, the dual-branch features are integrated through channel-wise concatenation, yielding the module output X’.
Figure 3.
ADownConv convolutional structure.
This dual-branch design supports coordinated modeling of contextual structure and fine-grained cues, allowing the module to maintain informative representation under a compact computational budget. Such a property is particularly beneficial for wheat aphid detection, where targets exhibit low visual prominence and are easily confounded by background clutter. Consequently, the module improves representational efficiency and deployment suitability, making it better aligned with the visual characteristics of aphid images and the practical requirements of efficient edge-assisted monitoring.
2.6.2. IEMA Multi-Scale Attention Module
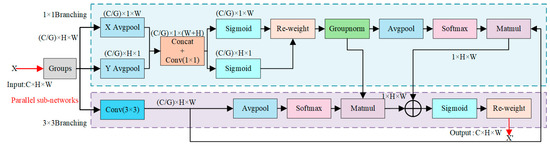
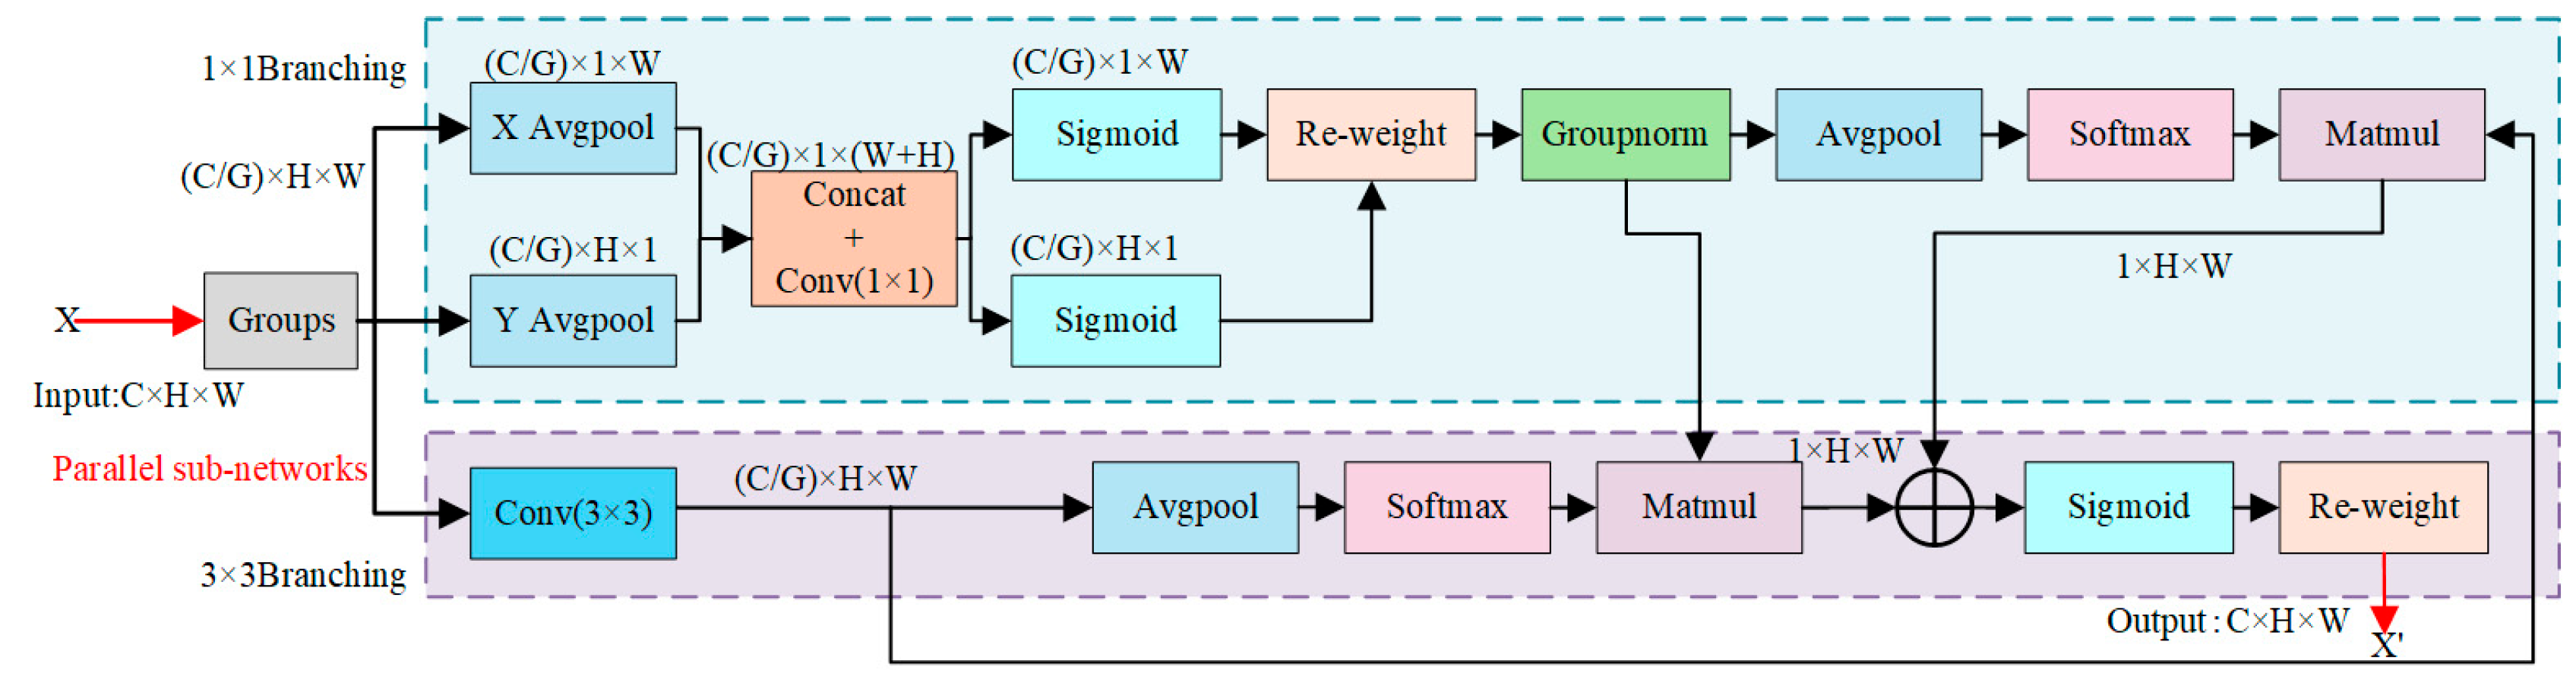
Under complex scenarios, wheat aphids are extremely small and easily confused with leaf-vein textures and background clutter, causing both local details and contextual information to degrade during feature extraction. To compensate for the limitations of conventional convolutions in modeling global dependencies and preserving fine-grained cues, the Interleaved Efficient Multi-scale Attention (IEMA) module is introduced. Through EMA-based global context aggregation [25] and IRMB-driven local detail enhancement with noise suppression, IEMA improves feature representation quality and scenario adaptability under lightweight constraints. As shown in Figure 4, EMA derives attention weights from pooled global features and convolutional transformations. For an input feature map , channels are first partitioned into G groups to strengthen the modeling of diverse semantic patterns, and the grouping process is given by:
Figure 4.
EMA Attention Mechanism.
For each feature group Xg, a global feature descriptor is first obtained via global average pooling for each channel:
Subsequently, the Softmax operation is applied to allocate attention weights across the spatial dimension:
This static weighting scheme ensures smooth representation of the overall distribution patterns of aphids, preventing misalignment caused by local illumination variations or leaf noise. Simultaneously, the EMA module incorporates a dynamic convolutional branch, employing a combination of 1 × 1 and 3 × 3 convolutional kernels to strengthen the representation of fine-grained local patterns. This allows the model to better capture fine-grained aphid cues, including edge structure and texture patterns.
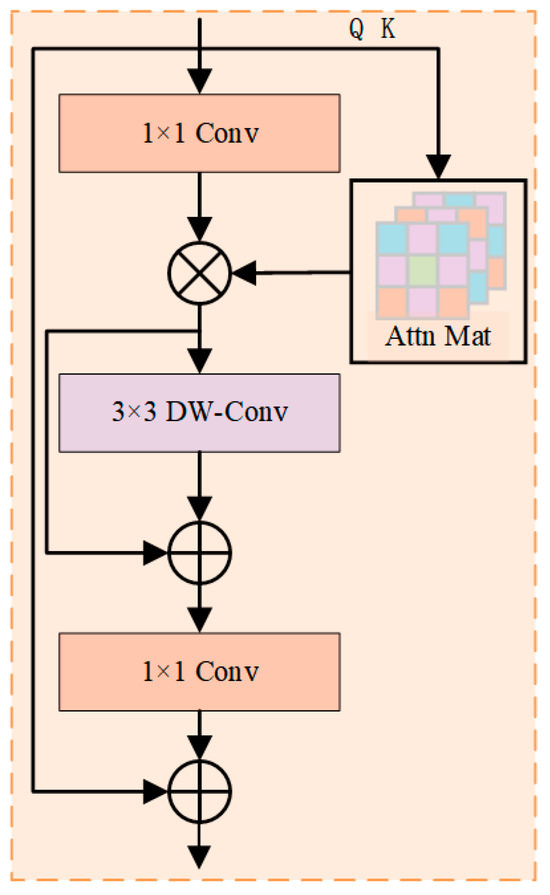
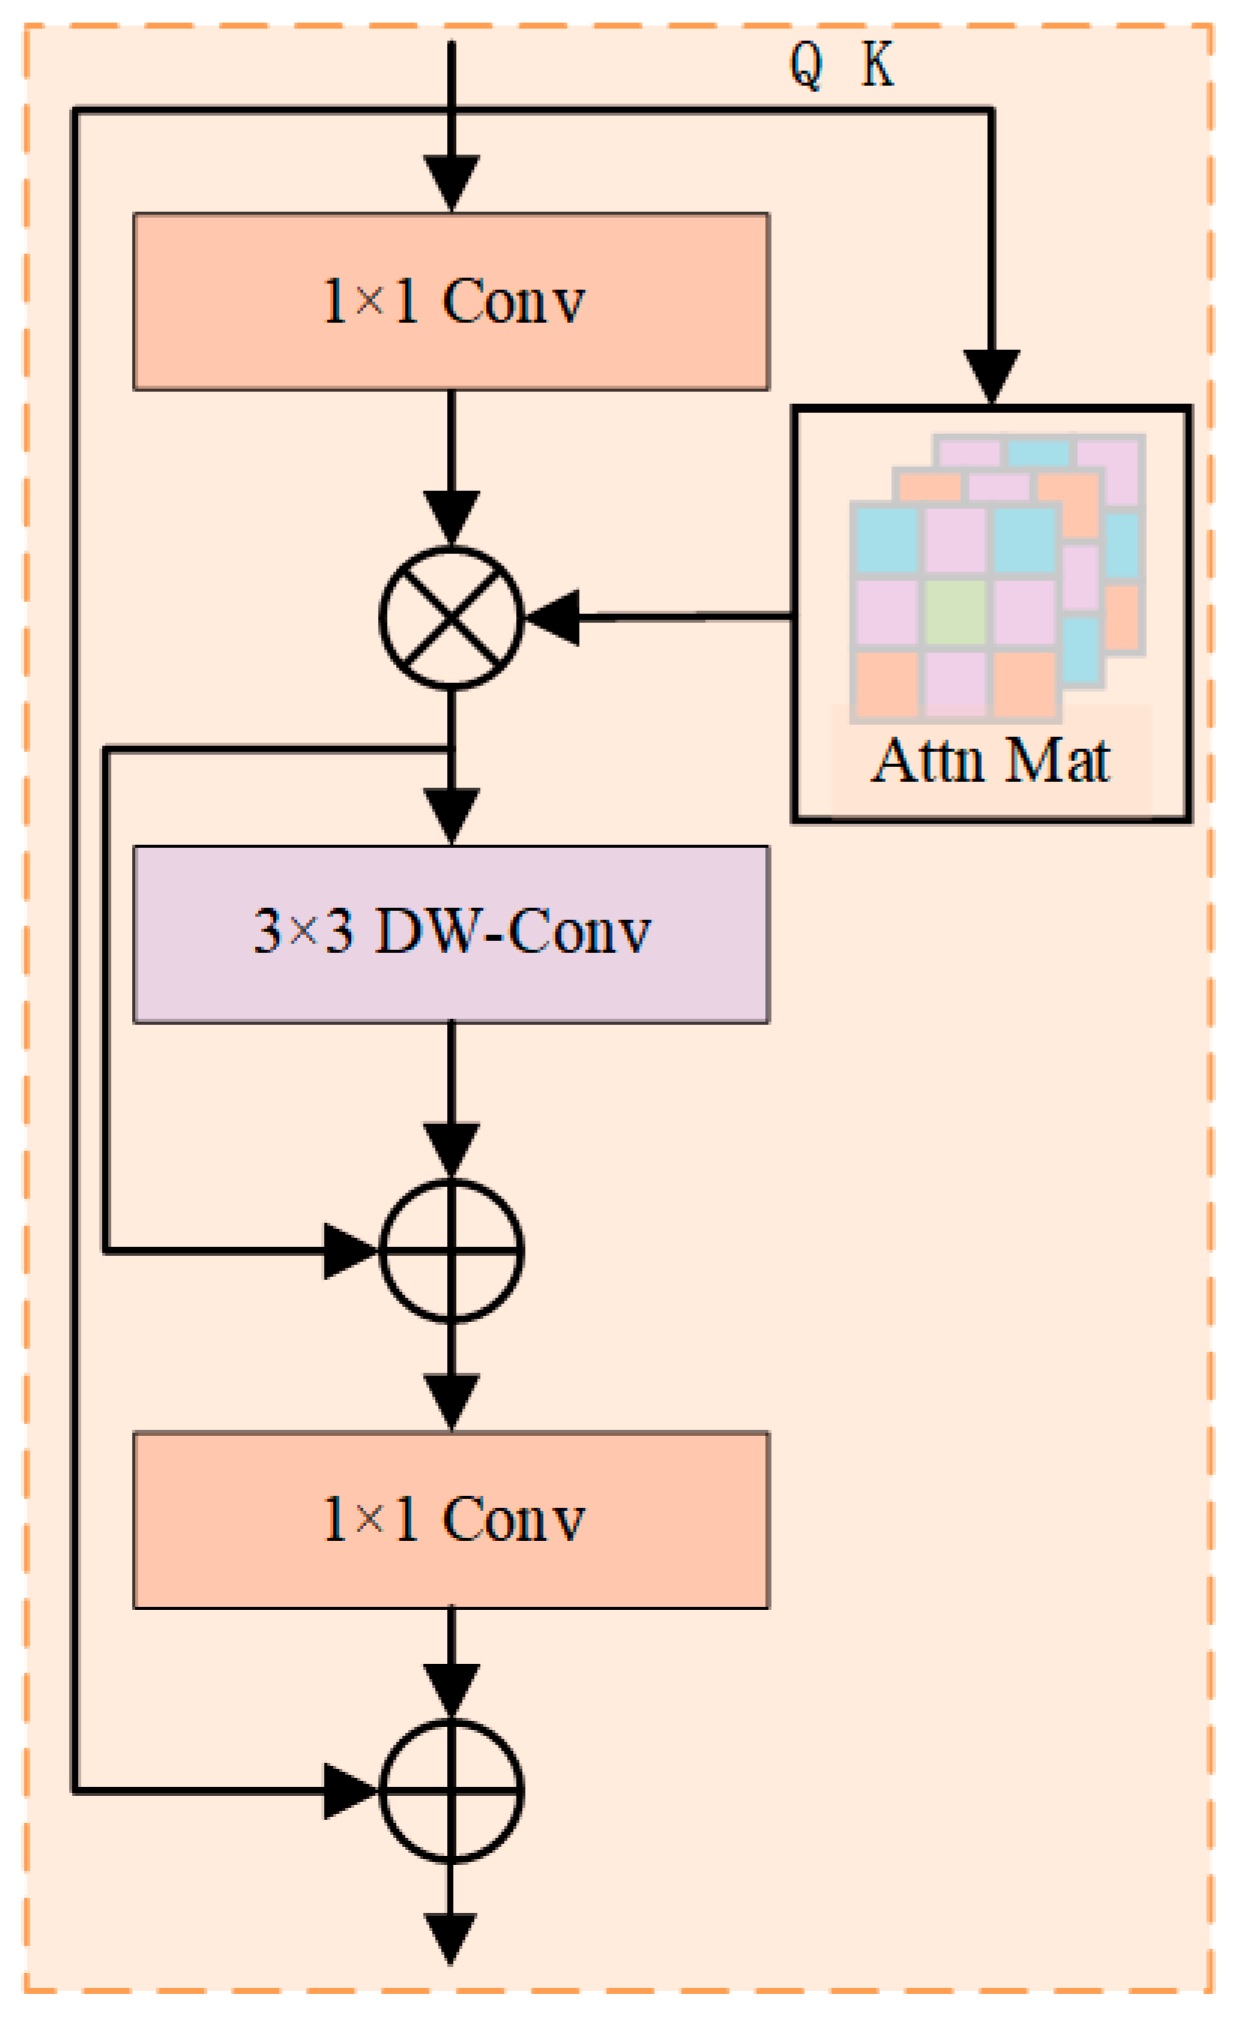
Figure 5 presents the architecture of the Improved Residual Multi-branch Block (IRMB). By leveraging multi-branch residual pathways together with depthwise separable and group convolutions, the IRMB strengthens hierarchical feature modeling while maintaining computational efficiency. The input tensor X′ is passed through three convolutional layers to generate correlated feature representations:
Figure 5.
IRMB residual structure.
Subsequently, the final output is obtained by summing the corresponding responses from the residual branches and the current output:
By incorporating residual pathways, the IRMB ensures the preservation of original features while simultaneously enhancing the extraction of local information through convolutional operations, thereby improving the discriminability of individual aphid targets.
By integrating EMA with IRMB, the IEMA module jointly captures global dependencies and local discriminative cues with little additional computational overhead. This design strengthens feature representation and robustness under the evaluated conditions while preserving lightweight efficiency, thereby providing more reliable support for accurate and robust wheat aphid detection.
2.6.3. DySample Dynamic Upsampling Operator
In the task of wheat aphid identification within complex field environments, traditional upsampling methods exhibit significant limitations when handling complex backgrounds and multi-scale targets. These methods commonly perform feature-map upsampling with static convolutional kernels, which can compromise fine-grained spatial information. This limitation is more detrimental for wheat aphids, which are characterized by their minute size, elongated morphology, and frequent blending with leaf textures. Fixed upsampling kernels struggle to effectively preserve the critical features of such targets, resulting in edge blurring and loss of individual characteristics, thereby degrading detection performance. Consequently, enhancing the model’s capacity to represent small targets is crucial for improving accuracy. The DySample upsampling operator (DySample) [26] was adopted to address this challenge. By incorporating a dynamic kernel generation mechanism and an offset adjustment strategy, the DySample module adaptively aligns with both the global and local distributions of the input features. It not only enhances feature resolution but also maximizes the retention of fine-grained information from small targets. Compared to conventional methods, DySample achieves superior feature representation capability while simultaneously addressing the model’s need for lightweight design.
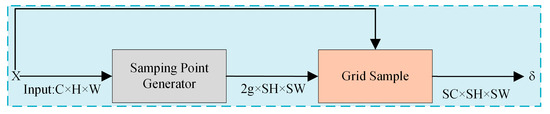
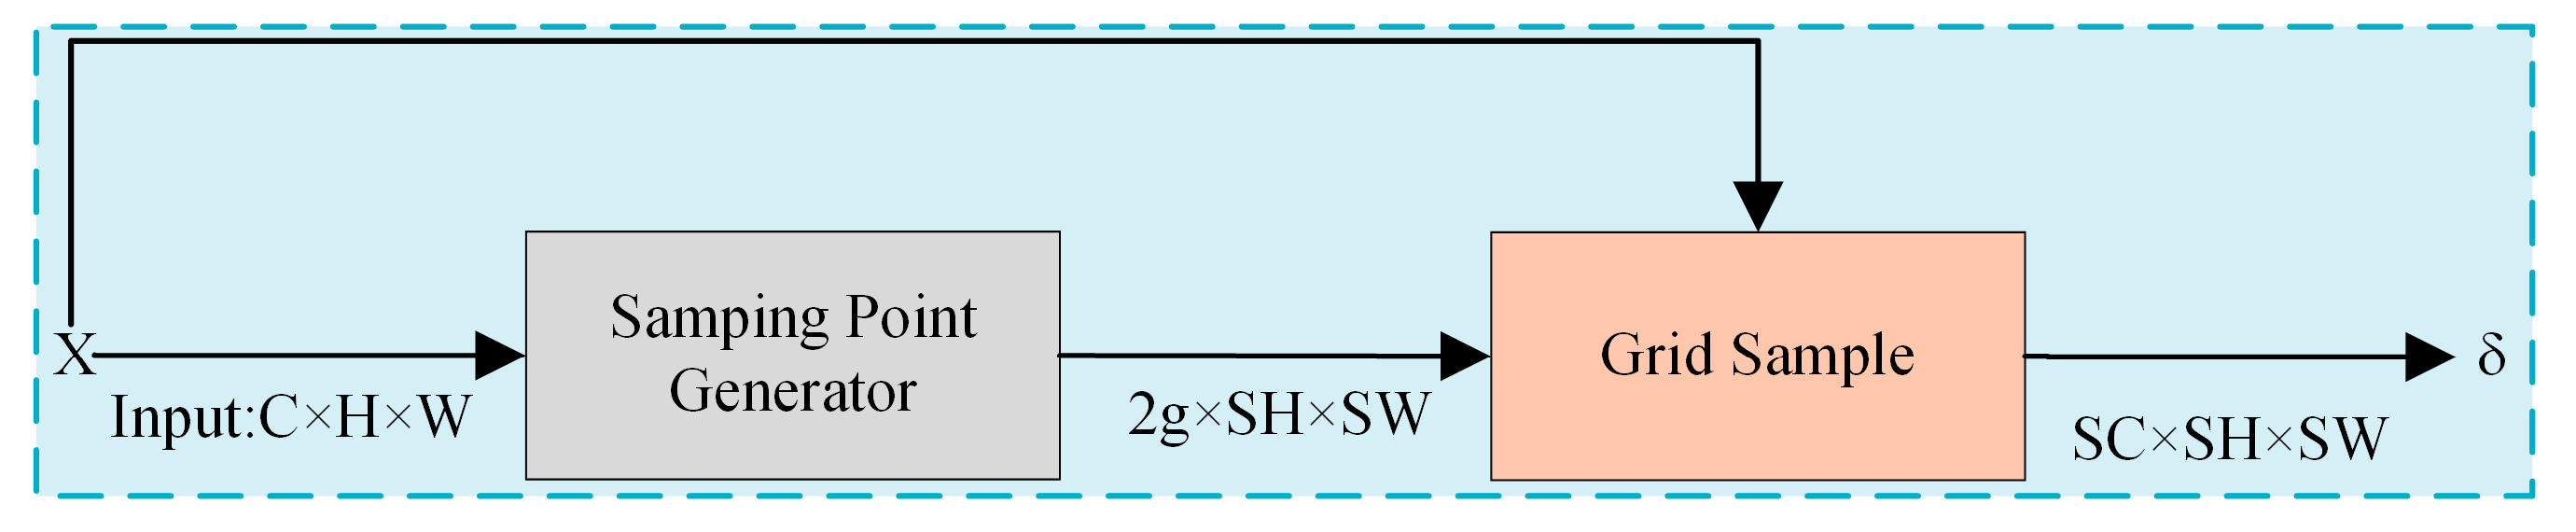
As shown in Figure 6, the DySample module performs upsampling in three stages. Given an input feature map X, a sampling-point generator first predicts initial sampling locations to provide spatial references for upsampling. These locations are then refined by learned offsets, which can be produced by either a static or a dynamic branch according to the required feature adaptation. Finally, the corrected sampling points are processed by Grid Sample to generate the output feature map X′. This process improves feature resolution while preserving aphid distribution patterns and local structural cues.
Figure 6.
DySample Dynamic Upsampling Process.
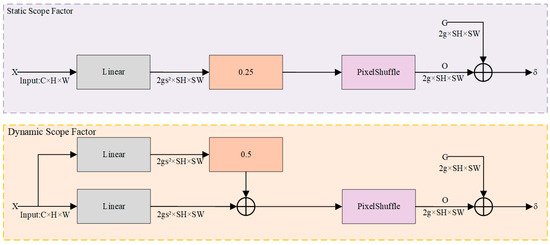
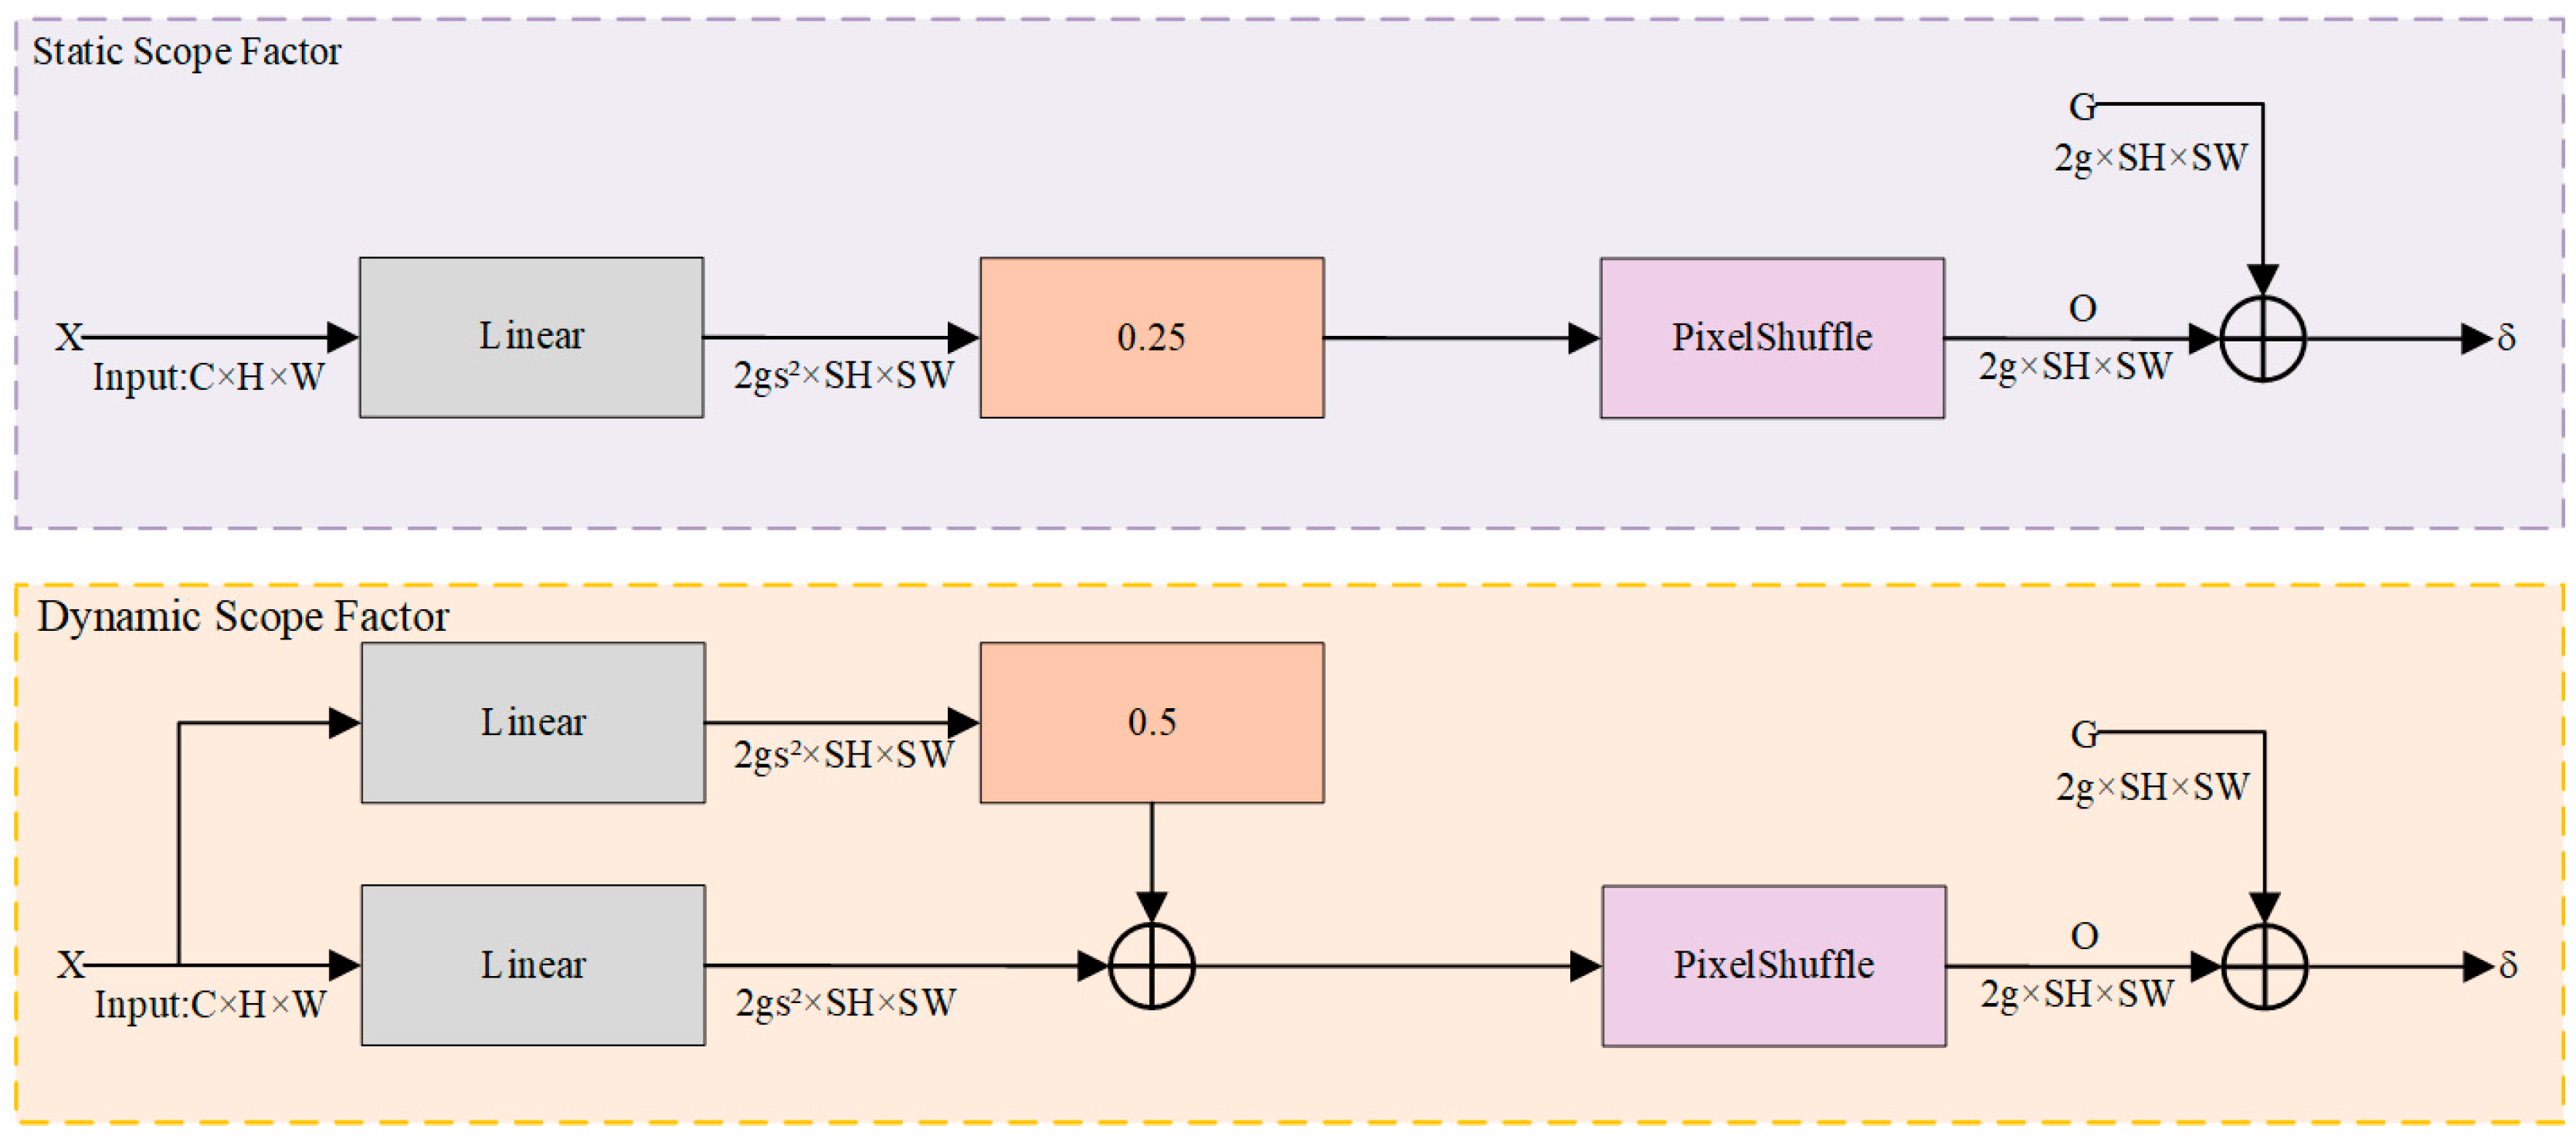
Figure 7 further presents the offset-generation mechanisms of the static and dynamic scope factors. The static branch learns coarse offsets from X through a linear layer, scales them by 0.25, and expands them to the grid dimension via Pixel Shuffle, thereby providing stable global guidance for upsampling. In contrast, the dynamic branch predicts adaptive offsets from X, normalizes them through a linear layer and a Sigmoid function, and scales them by 0.5 to refine sampling positions locally. This branch is more responsive to subtle aphid cues, such as edge structure, morphology, and texture.
Figure 7.
Architecture of the Dynamic Sampler.
Through the cooperation of these two branches, DySample combines stable global adjustment with adaptive local refinement. As a result, it preserves fine-grained information for small targets with little additional parameter or computational overhead, making it well suited to wheat aphid identification in complex scenes.
2.7. Training Environment and Parameter Settings
To improve experimental reproducibility, the training environment and key hyperparameter settings were specified for all compared models. All models were implemented in PyTorch 1.11.0 with CUDA 11.3 acceleration and trained on a cloud-based GPU platform equipped with 25 AMD EPYC vCPUs, 90 GB RAM, and a 32 GB vGPU. The same training, validation, and test subsets were used for all models to ensure a fair comparison. The input image size was set to 640 × 640 pixels, and each model was trained for 600 epochs with a batch size of 64. Stochastic gradient descent (SGD) was adopted as the optimizer, with an initial learning rate of 0.01, momentum of 0.937, and weight decay of 0.0005. For inference and deployment, the confidence threshold and non-maximum suppression IoU threshold were set to 0.25 and 0.7, respectively. Unless otherwise specified, all comparative experiments, ablation experiments, and module-comparison experiments followed the same training strategy and evaluation protocol. To assess run-to-run variability, the ablation experiments, attention-module comparison experiments, and representative detector comparison experiments were repeated using three random seeds: 0, 1, and 2. The same training, validation, and test split was retained across all seed repetitions. The random seeds affected model initialization, data-loader shuffling, and augmentation order, whereas the training epochs, batch size, input size, optimizer, learning rate schedule, confidence threshold, non-maximum suppression setting, and held-out test set were kept unchanged. Detection metrics are reported as mean ± standard deviation over the three seed repetitions.
2.8. Evaluation Metrics
Model performance was evaluated from four aspects: detection accuracy, model complexity, image-level counting performance, and edge-deployment efficiency. For detection accuracy, Precision, Recall, mAP50, and mAP50:95 were used as the primary metrics, where mAP50:95 denotes the mean average precision averaged over IoU thresholds from 0.50 to 0.95. Because only one aphid class was annotated in this study, mAP50 is equivalent to AP50; however, the term mAP50 was retained to remain consistent with common YOLO reporting conventions. The formulas for these widely used object detection metrics were omitted for conciseness. Model complexity was assessed using the number of parameters and GFLOPs.
For image-level counting, the manually annotated aphid number in each image was compared with the model-predicted count. The predicted count was defined as the number of detection boxes retained after confidence thresholding and non-maximum suppression, and no additional counting correction strategy was applied. The counting error for image (i) was defined as the difference between the predicted count and the manually annotated count. Counting performance was evaluated using mean absolute error (MAE), root mean square error (RMSE), and mean error (ME). MAE and RMSE quantify the magnitude of counting errors, whereas ME indicates the direction of counting bias. A positive ME value indicates overestimation, whereas a negative ME value indicates underestimation.
where denotes the model-predicted aphid count for image , denotes the manually annotated aphid count, and denotes the number of test images.
For edge deployment, model size, model loading time, runtime initialization time, image reading latency, preprocessing latency, pure NPU inference latency, post-processing latency, end-to-end latency, pure inference FPS, and end-to-end FPS were recorded to evaluate practical inference efficiency on the NanoPi M6 platform.
3. Results
3.1. Training and Validation Performance
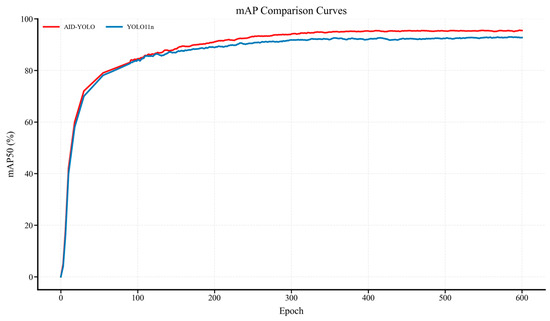
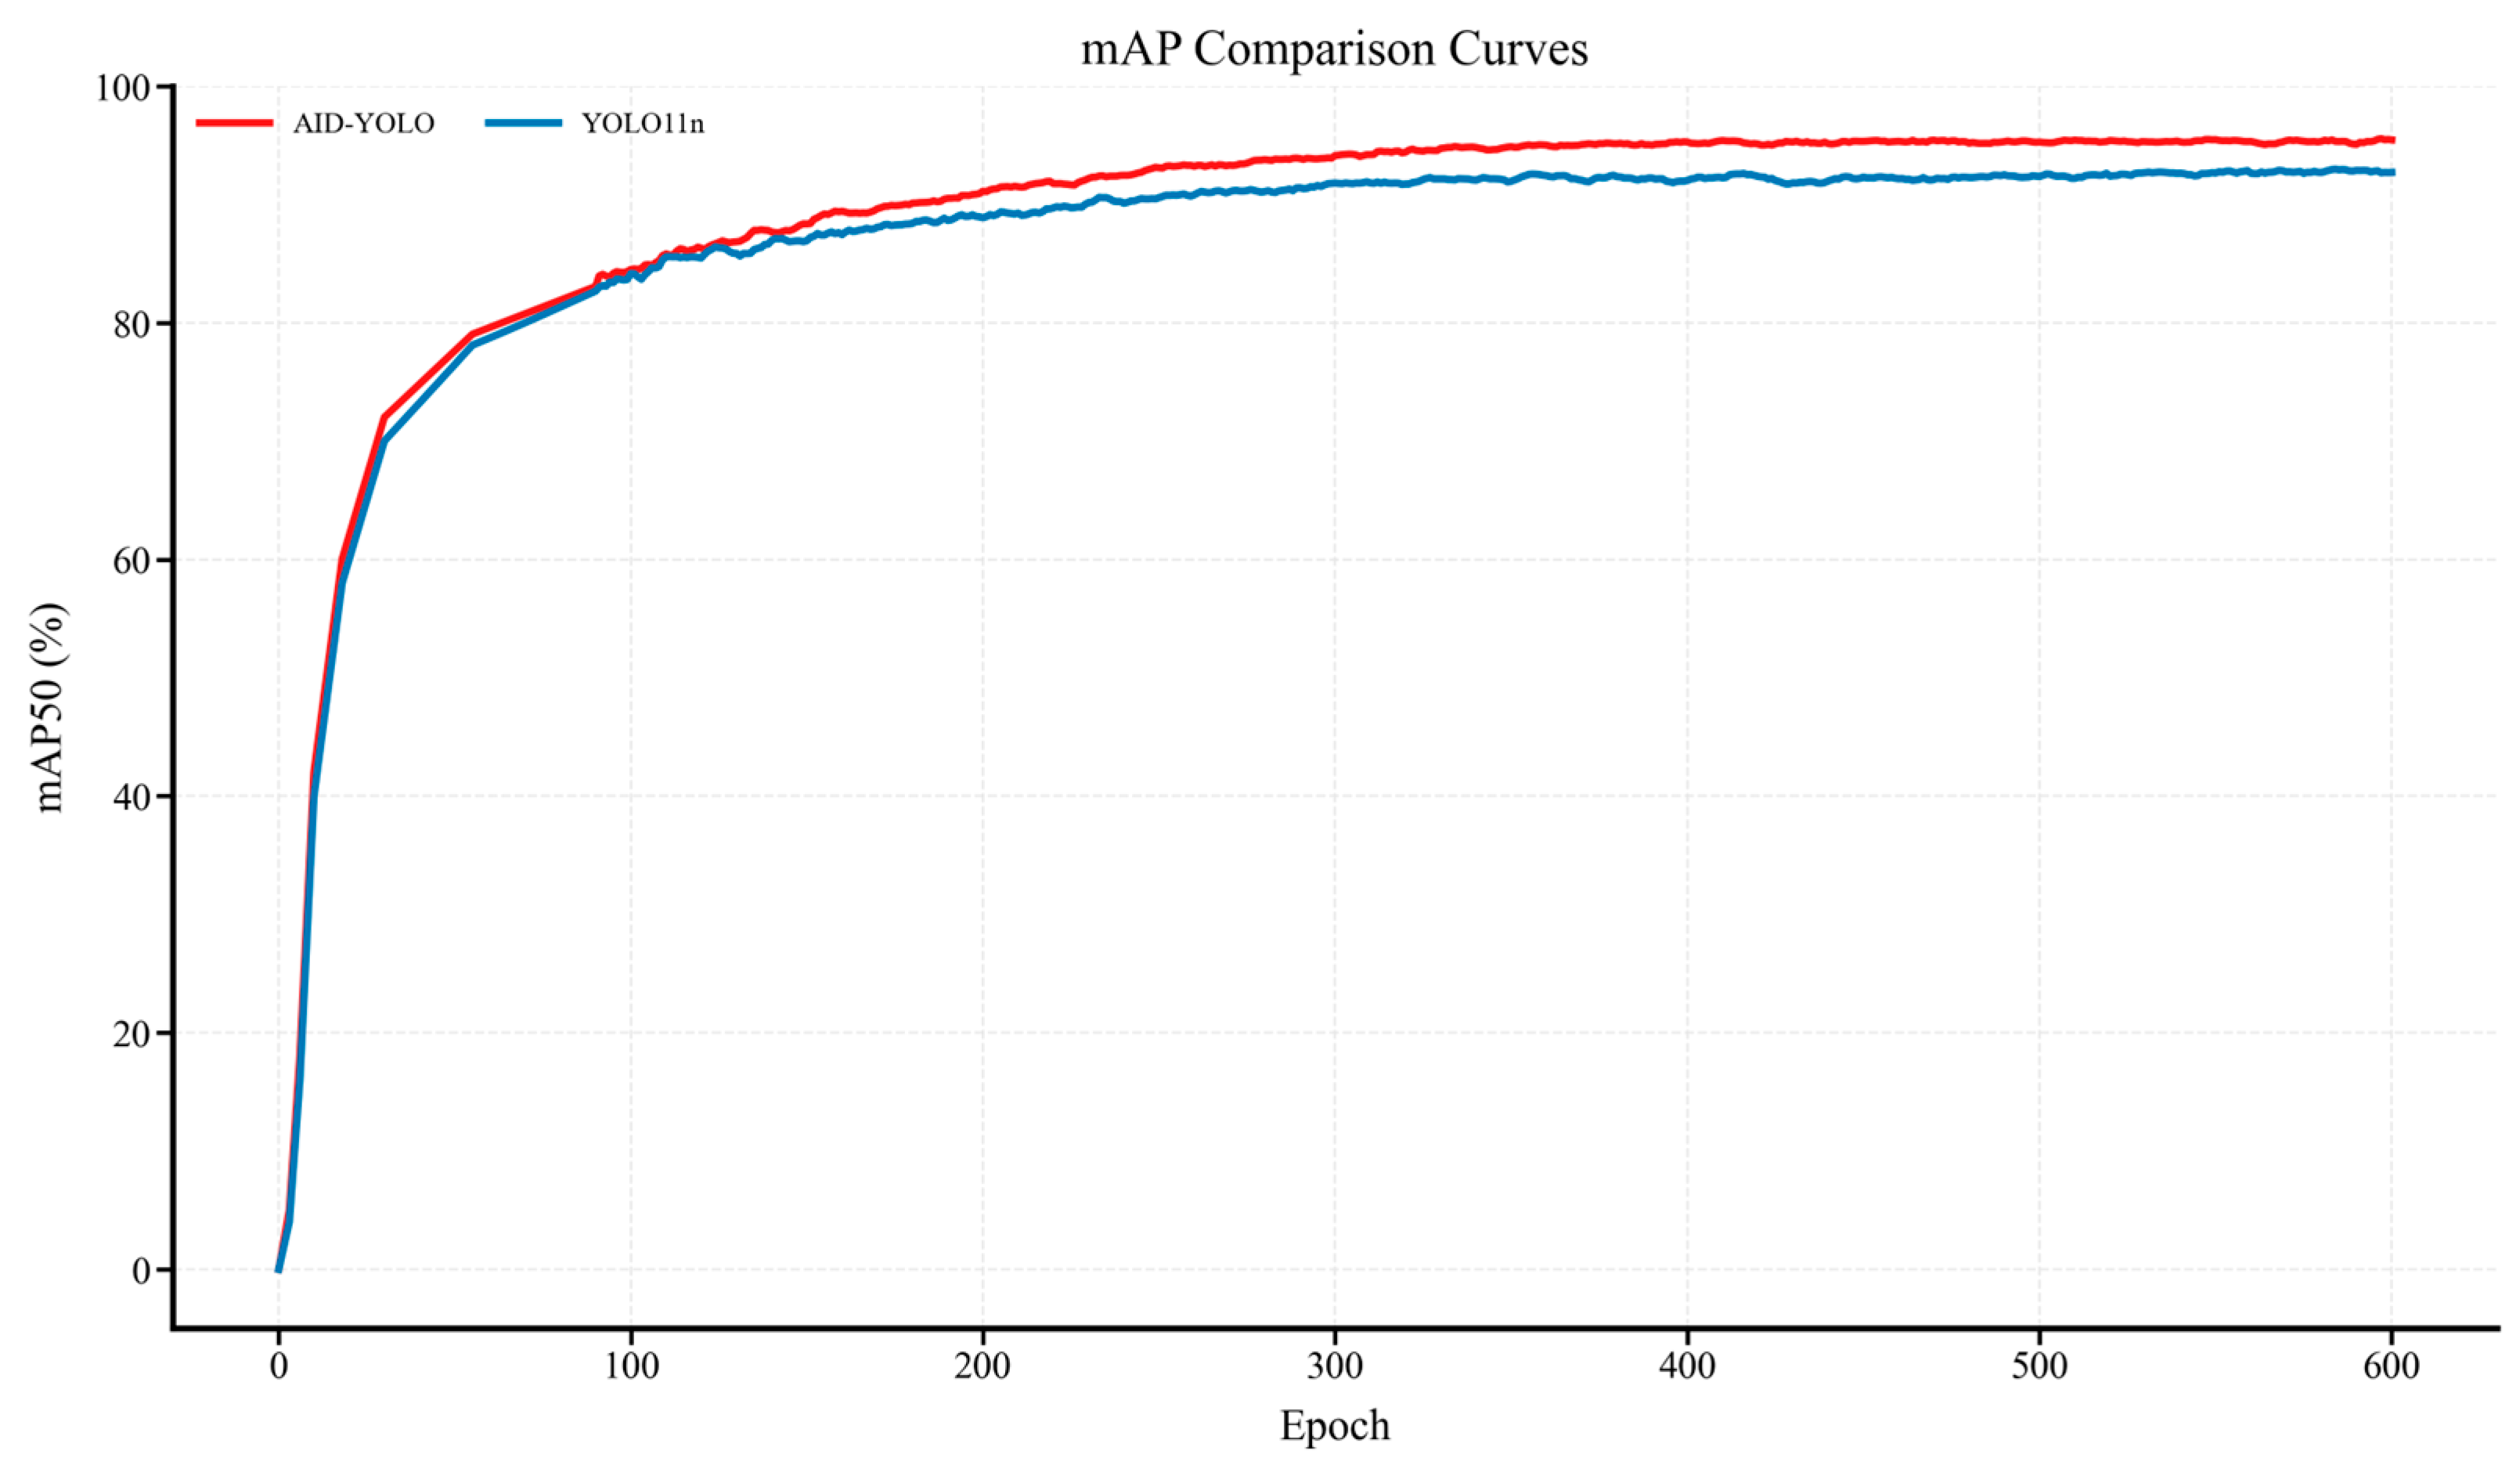
As shown in Figure 8, both YOLO11n and AID-YOLO rapidly acquired effective detection capability during the early training stage, followed by a gradual transition to a stable optimization phase. Notably, although AID-YOLO exhibited a slightly slower initial convergence, it maintained a consistently higher mAP50 after the middle training stage and eventually stabilized at a superior plateau. This trend suggests that the introduced modules do not merely accelerate short-term fitting but improve the quality of feature representation during progressive optimization. Specifically, ADown reduces redundant computation while preserving discriminative small-target cues; IEMA strengthens the model’s ability to suppress background interference and emphasize aphid-relevant responses; and DySample improves cross-scale feature alignment during feature fusion. Their combined effect enables AID-YOLO to achieve more stable and robust feature learning under complex indoor–field conditions. Therefore, the higher final mAP50 reflects an improved accuracy–stability trade-off and supports the effectiveness of the proposed architectural optimization for wheat aphid detection.
Figure 8.
mAP50 comparison curves of AID-YOLO and YOLO11n.
3.2. Ablation Study
To evaluate the individual and combined effects of the proposed modules, ablation experiments were conducted using YOLO11n as the baseline under identical training and evaluation settings. The detection metrics in Table 1 are reported as mean ± standard deviation over three random seeds. Replacing the original downsampling operation with ADown reduced the parameter count from 2.58 M to 2.09 M and decreased the computational cost from 6.3 to 5.1 GFLOPs. The average mAP50 changed slightly from 93.0 ± 0.39% to 92.8 ± 0.08%, indicating that ADown reduced model complexity while largely retaining the detection capability of the baseline model.
Table 1.
Results of the ablation study.
After replacing the original attention component in C2PSA with the IEMA module, the average mAP50 increased to 94.5 ± 0.30%, and field Precision and Recall reached 96.3 ± 0.15% and 95.3 ± 0.30%, respectively. This result indicates that the attention-enhanced feature interaction improved discriminative feature representation under field background interference while keeping the complete network parameter count comparable to that of YOLO11n. In this variant, IEMA was integrated into the C2PSA module by replacing the original attention component rather than being appended as an additional block. The DySample variant achieved an average mAP50 of 93.8 ± 0.22% and improved Recall on both the indoor and field subsets. This pattern suggests that dynamic upsampling contributed to the recovery and fusion of fine-grained spatial information for small aphid targets, although indoor Precision decreased relative to the baseline.
When ADown and DySample were jointly integrated, the model achieved an average mAP50 of 95.0 ± 0.06% while maintaining 5.1 GFLOPs and 2.11 M parameters. The complete AID-YOLO model, which integrates ADown, IEMA, and DySample, achieved an average mAP50 of 95.3 ± 0.10%, an mAP50:95 of 70.4 ± 0.19%, and a parameter count of 2.09 M. Compared with YOLO11n, this corresponds to average increases of 2.3 percentage points in mAP50 and 4.0 percentage points in mAP50:95. Compared with the ADown+DySample variant, the complete model showed a small additional increase in average mAP50 and a higher mAP50:95. These results indicate that the proposed modules provide complementary contributions to lightweight design, feature enhancement, and small-target representation. The final AID-YOLO configuration was selected based on its overall balance among Precision, Recall, mAP50, mAP50:95, parameter count, and computational complexity.
3.3. Feature Visualization
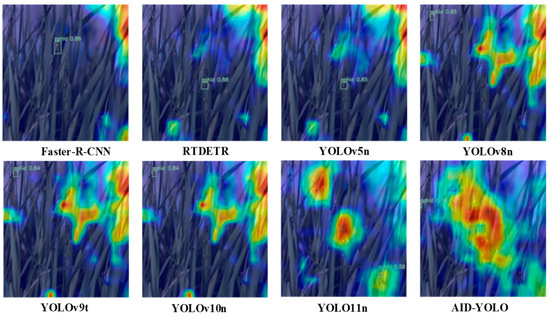
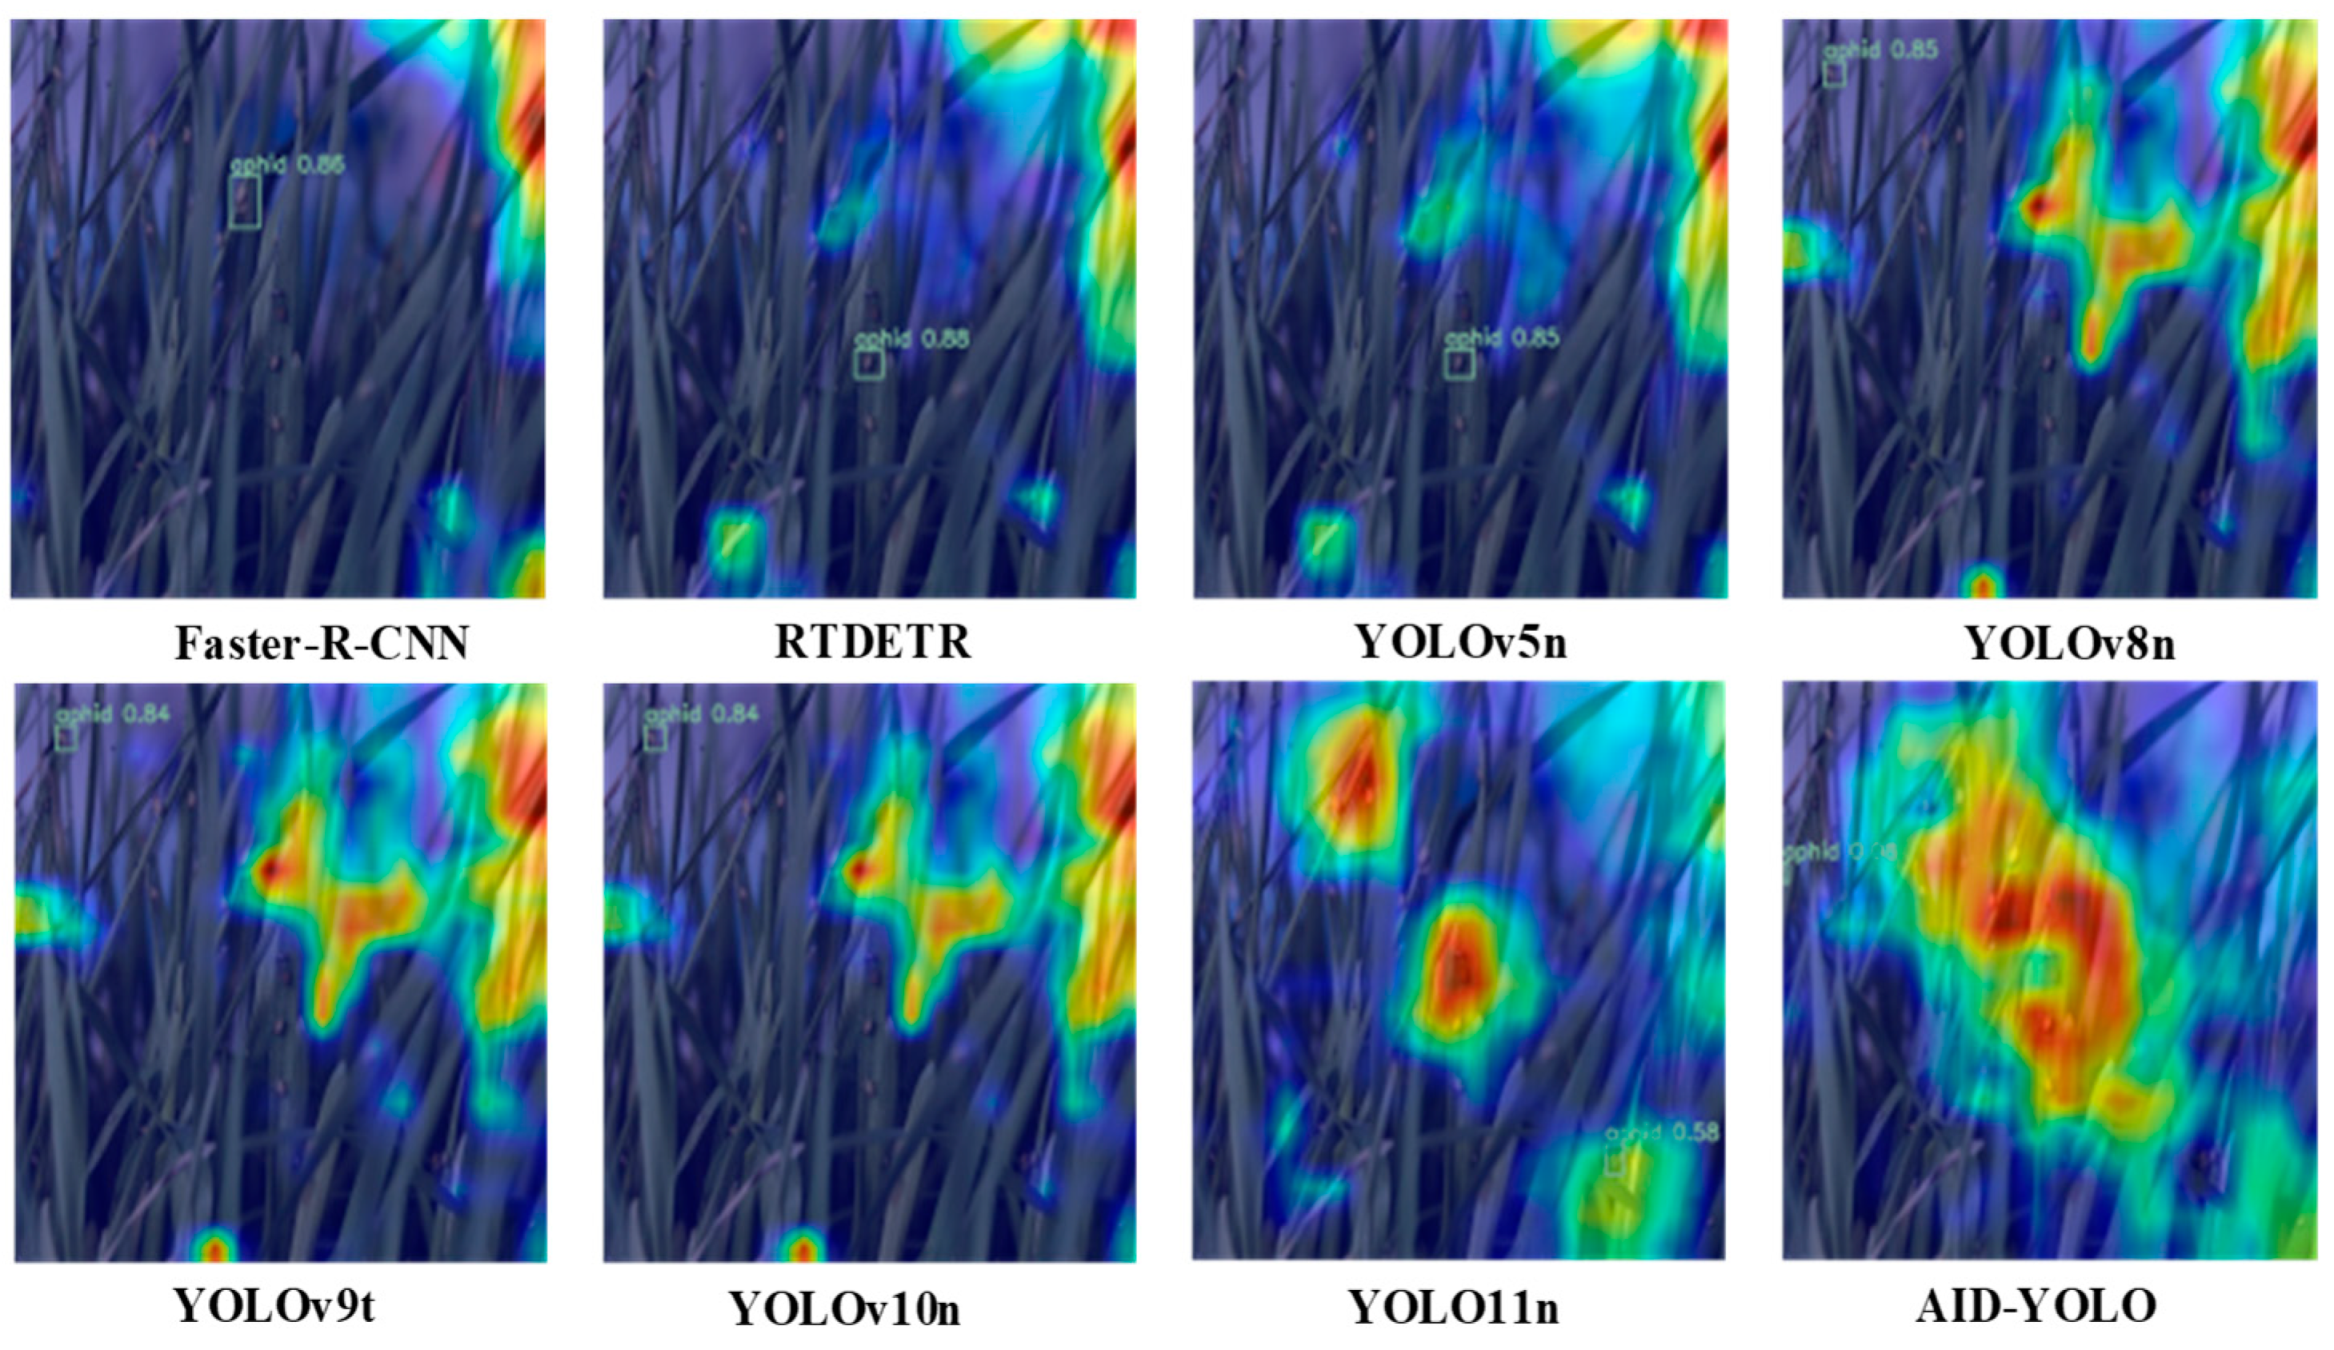
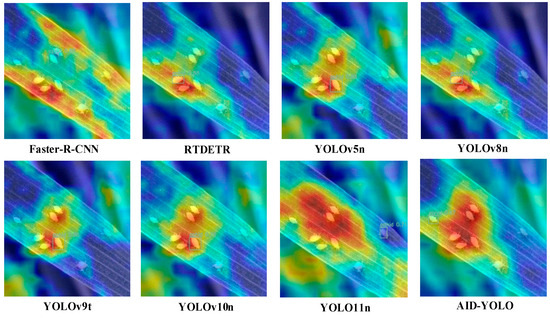
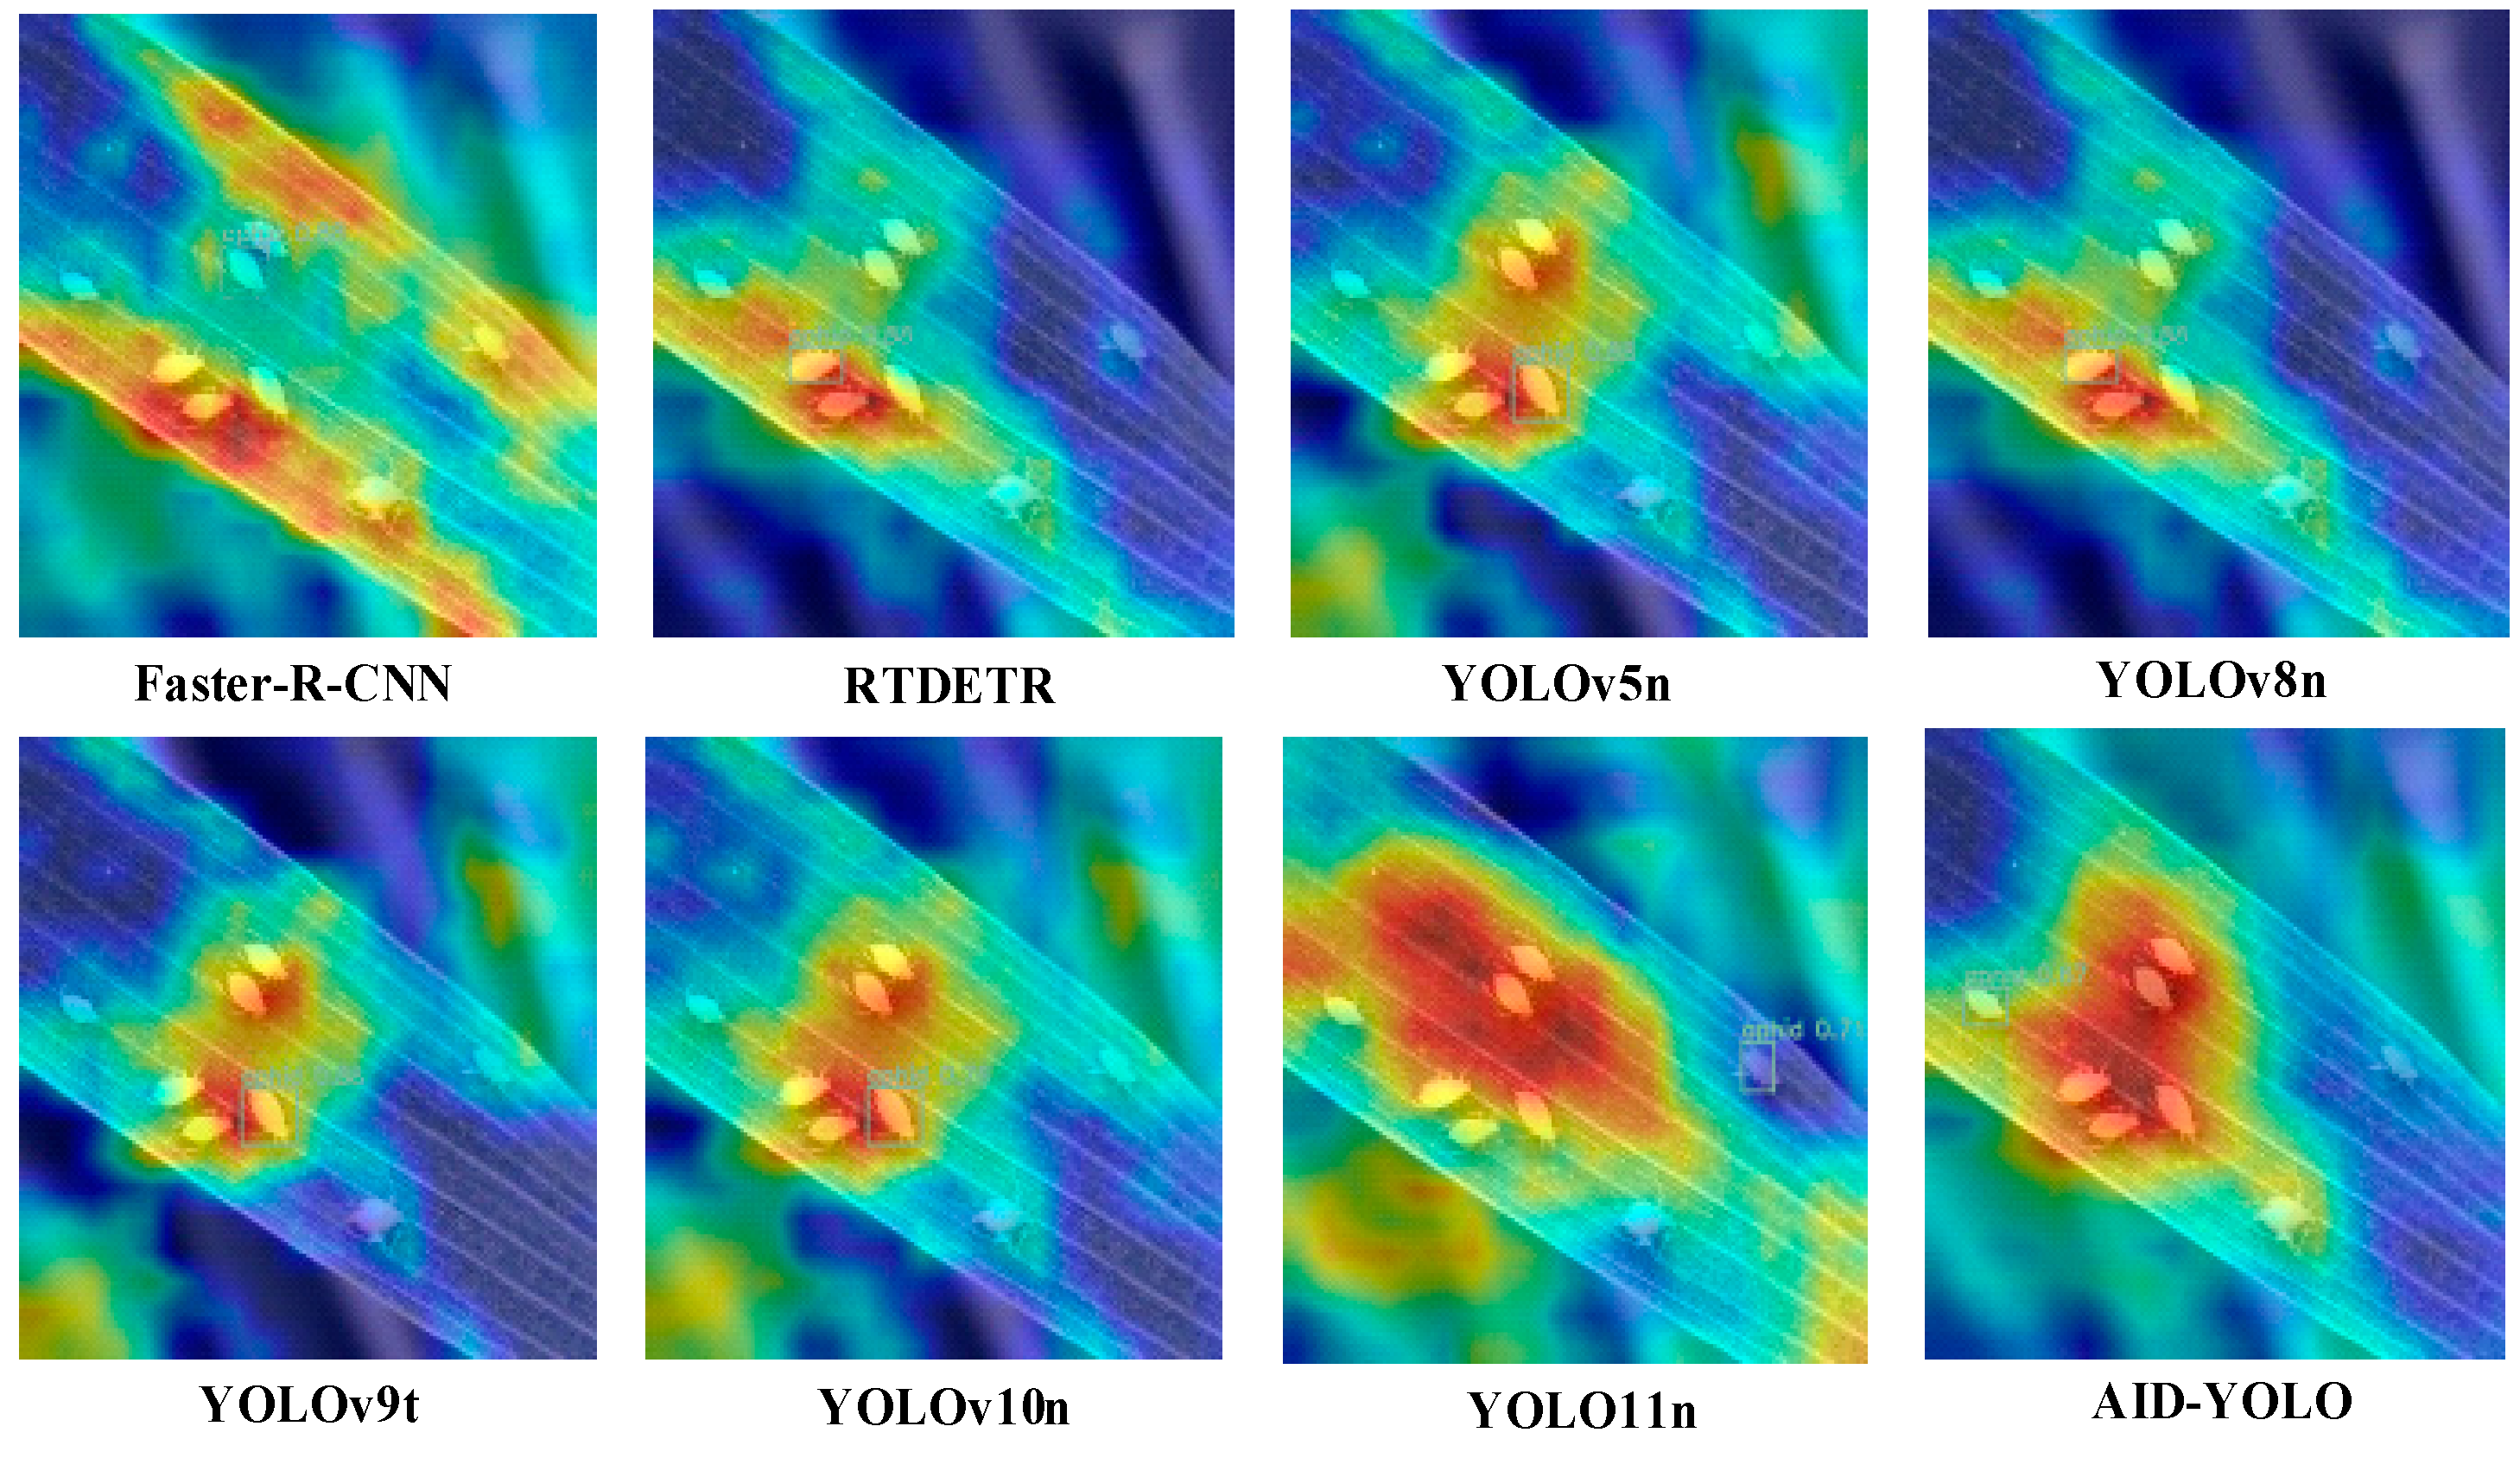
Grad-CAM was used to further visualize the feature responses of AID-YOLO and the comparison models under indoor laboratory and open-field conditions [27]. As shown in Figure 9 and Figure 10, AID-YOLO generates more compact activation regions that are spatially consistent with the actual locations of wheat aphids. In contrast, the comparison models show more dispersed responses and are more easily affected by background textures, including leaf veins and specular reflections. These results suggest that AID-YOLO can better focus on aphid-related contours and texture cues while suppressing background interference, thereby improving small-target saliency, bounding-box localization, and robustness in dense or partially occluded scenes.
Figure 9.
Detection heatmaps on the indoor dataset. The heatmap colors represent Grad-CAM activation intensity, ranging from low activation in blue to high activation in red.
Figure 10.
Detection heatmaps on the field dataset. The heatmap colors represent Grad-CAM activation intensity, ranging from low activation in blue to high activation in red.
3.4. Supplementary Evaluation of Architecture Applicability on a Public Wheat Insect Dataset
To examine performance on external data, we further tested AID-YOLO on the Mendeley Wheat Coccinellid dataset. Collected from experimental farms at Kansas State University, this dataset contains field images captured by multiple mobile devices under natural light across different wheat plots. Although originally developed for beneficial insect detection, it remains challenging because of sensor heterogeneity, cluttered backgrounds, and marked illumination variation. To reduce bias from class and scene imbalance, the samples were randomly divided into training and test sets at an 8:2 ratio. YOLO11n and AID-YOLO were then trained and evaluated under the same settings, using the same test subset. Table 2 shows that AID-YOLO improved Precision, Recall, and mAP50 from 83.8%, 80.5%, and 86.0% to 87.0%, 82.3%, and 88.5%, respectively, while using fewer parameters (2.09 M vs. 2.58 M) and lower GFLOPs (5.1 vs. 6.3). These results suggest that AID-YOLO retains favorable performance on an external wheat-field insect dataset. Therefore, this experiment should be interpreted as supplementary evidence for the applicability of the AID-YOLO architecture to another wheat-field insect dataset, rather than as direct evidence of cross-dataset generalization for wheat aphid detection.
Table 2.
Results on the public dataset.
3.5. Comparison of Lightweight Convolution Modules
To evaluate the contribution of different lightweight convolutional modules to wheat aphid detection, five modules, including Context-Gated [28], PConv [29], LAE [30], Dual [31], and ADown [32], were compared on the combined dataset. The dataset contained both indoor and field images, and a stratified random split was adopted to preserve the sample distribution between the training and test sets. The comparison focused on both detection accuracy and model complexity, thereby assessing the accuracy–efficiency trade-off of different lightweight designs.
As shown in Table 3, ADown-YOLO achieved a Precision of 92.2 ± 0.42% and a Recall of 91.0 ± 0.10%, outperforming Context-Gated [28] and Dual [31] while maintaining competitive performance compared with PConv [29]. Although PConv obtained slightly higher Precision and Recall, it required 2.54 M parameters and 5.9 GFLOPs, whereas ADown-YOLO used only 2.09 M parameters and 5.1 GFLOPs. Similarly, the Dual module introduced a higher computational cost of 6.2 GFLOPs but showed lower overall detection performance than ADown [32]. These results indicate that ADown can effectively reduce redundant computation while preserving discriminative features for small aphid targets.
Table 3.
Performance comparison of different lightweight convolutional modules.
Overall, ADown-YOLO provides a more favorable balance between detection performance and computational efficiency on the combined dataset. Its lower parameter count and reduced GFLOPs make it more suitable for wheat aphid detection in resource-constrained deployment scenarios, such as mobile terminals or field-oriented intelligent monitoring systems.
3.6. Controlled Comparison and Decomposition of Attention-Module Variants
To evaluate the effect of different attention mechanisms on wheat aphid detection, a controlled attention-module comparison was conducted on the field subset. In this experiment, the YOLO11n framework was kept fixed, and only the inserted attention module was replaced. Six representative attention variants, including CGAttention [33], IRMB [34], EMA [25], LSKAttention [35], SENetV1 [36], and SENetV2 [37], were compared under the same training and evaluation protocol. The module names in Table 4 therefore denote attention-module variants rather than complete detector names. IRMB [34] and EMA [25] were also evaluated separately as single-component variants and compared with the complete IEMA module to examine the contribution of the combined IRMB–EMA design. All detection metrics are reported as mean ± standard deviation over three random seeds.
Table 4.
Controlled comparison and decomposition of attention-module variants on the field subset.
As shown in Table 4, CGAttention [33] and LSKAttention [35] achieved mAP50 values of 94.4 ± 0.26% and 94.4 ± 0.29%, respectively. The IRMB-only variant achieved an mAP50 of 94.5 ± 0.08%, indicating that residual multi-branch feature extraction enhanced local representation to some extent. The EMA-only variant achieved a comparable mAP50 of 94.6 ± 0.35%, suggesting that contextual attention also contributed to feature refinement under complex field backgrounds. When used separately, however, IRMB and EMA showed similar performance to several other attention modules.
The complete IEMA module achieved the highest overall performance among the tested attention variants, with Precision, Recall, and mAP50 reaching 96.3 ± 0.15%, 95.3 ± 0.30%, and 97.5 ± 0.17%, respectively. IRMB enhances local contour and texture features of small aphid targets, whereas EMA performs contextual reweighting and helps suppress background interference caused by leaf veins, shadows, and illumination variation. By combining these two components, IEMA preserves fine local target cues while improving feature discrimination under complex field backgrounds.
3.7. Comparison with Representative Detection Models
Table 5 compares AID-YOLO with representative object detectors, including the two-stage detector Faster R-CNN [38], the transformer-based detector RTDETR [39], and several lightweight YOLO variants, namely YOLOv5n [40], YOLOv8n [41], YOLOv9t [32], YOLOv10n [42], YOLO11n [43], and YOLOv12n [44]. These models cover different detection paradigms and lightweight YOLO-series architectures, allowing a complete detector-level comparison of detection accuracy and computational cost under the same training and evaluation settings. Detection metrics are reported as mean ± standard deviation over three random seeds.
Table 5.
Comparative evaluation of representative object detection models.
As shown in Table 5, AID-YOLO achieved the highest mAP50 on both the indoor and field test subsets. On the indoor subset, AID-YOLO obtained an mAP50 of 90.3 ± 0.36%, exceeding Faster R-CNN [38], RTDETR [39], YOLOv5n [40], YOLOv8n [41], YOLOv9t [32], YOLOv10n [42], YOLO11n [43], and YOLOv12n [44], whose mAP50 values were 58.8 ± 0.14%, 66.9 ± 0.02%, 83.7 ± 0.32%, 85.3 ± 0.28%, 81.8 ± 0.17%, 81.4 ± 0.41%, 84.8 ± 0.35%, and 88.3 ± 0.38%, respectively. Its Recall reached 85.0 ± 0.04%, which was higher than that of YOLO11n and YOLOv12n, indicating improved detection completeness for small aphid targets under indoor conditions. On the field subset, AID-YOLO achieved a Precision of 95.5 ± 0.14%, a Recall of 95.1 ± 0.41%, and an mAP50 of 97.0 ± 0.22%, while requiring 2.09 M parameters and 5.1 GFLOPs. Compared with YOLOv12n [44], AID-YOLO improved field mAP50 by 2.3 percentage points and used fewer GFLOPs. These results indicate that AID-YOLO maintained a favorable accuracy–efficiency balance across indoor and field wheat aphid images.
The performance differences are closely related to the structural characteristics of different detectors and the visual properties of wheat aphid images. Faster R-CNN depends on region proposal generation, which is less efficient when aphid targets are extremely small, densely distributed, and visually similar to leaf veins or background textures. RTDETR benefits from global dependency modeling, but transformer-based detection usually requires stronger feature representation and sufficient training samples; for aphids occupying only a few pixels, global attention alone may weaken sensitivity to local details. Although lightweight YOLO variants offer greater potential for low-latency inference, conventional downsampling and feature fusion may still cause the loss of fine aphid cues or merged predictions in clustered regions. In contrast, AID-YOLO combines ADown-based lightweight downsampling, IEMA-based attention enhancement, and DySample-based dynamic feature fusion. These designs help preserve local discriminative features, suppress background interference, and improve cross-scale feature alignment, thereby enhancing the detection of clustered small aphid targets.
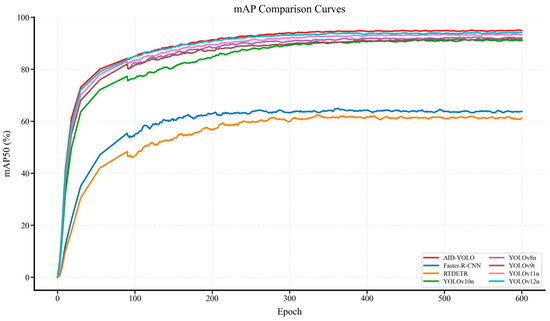
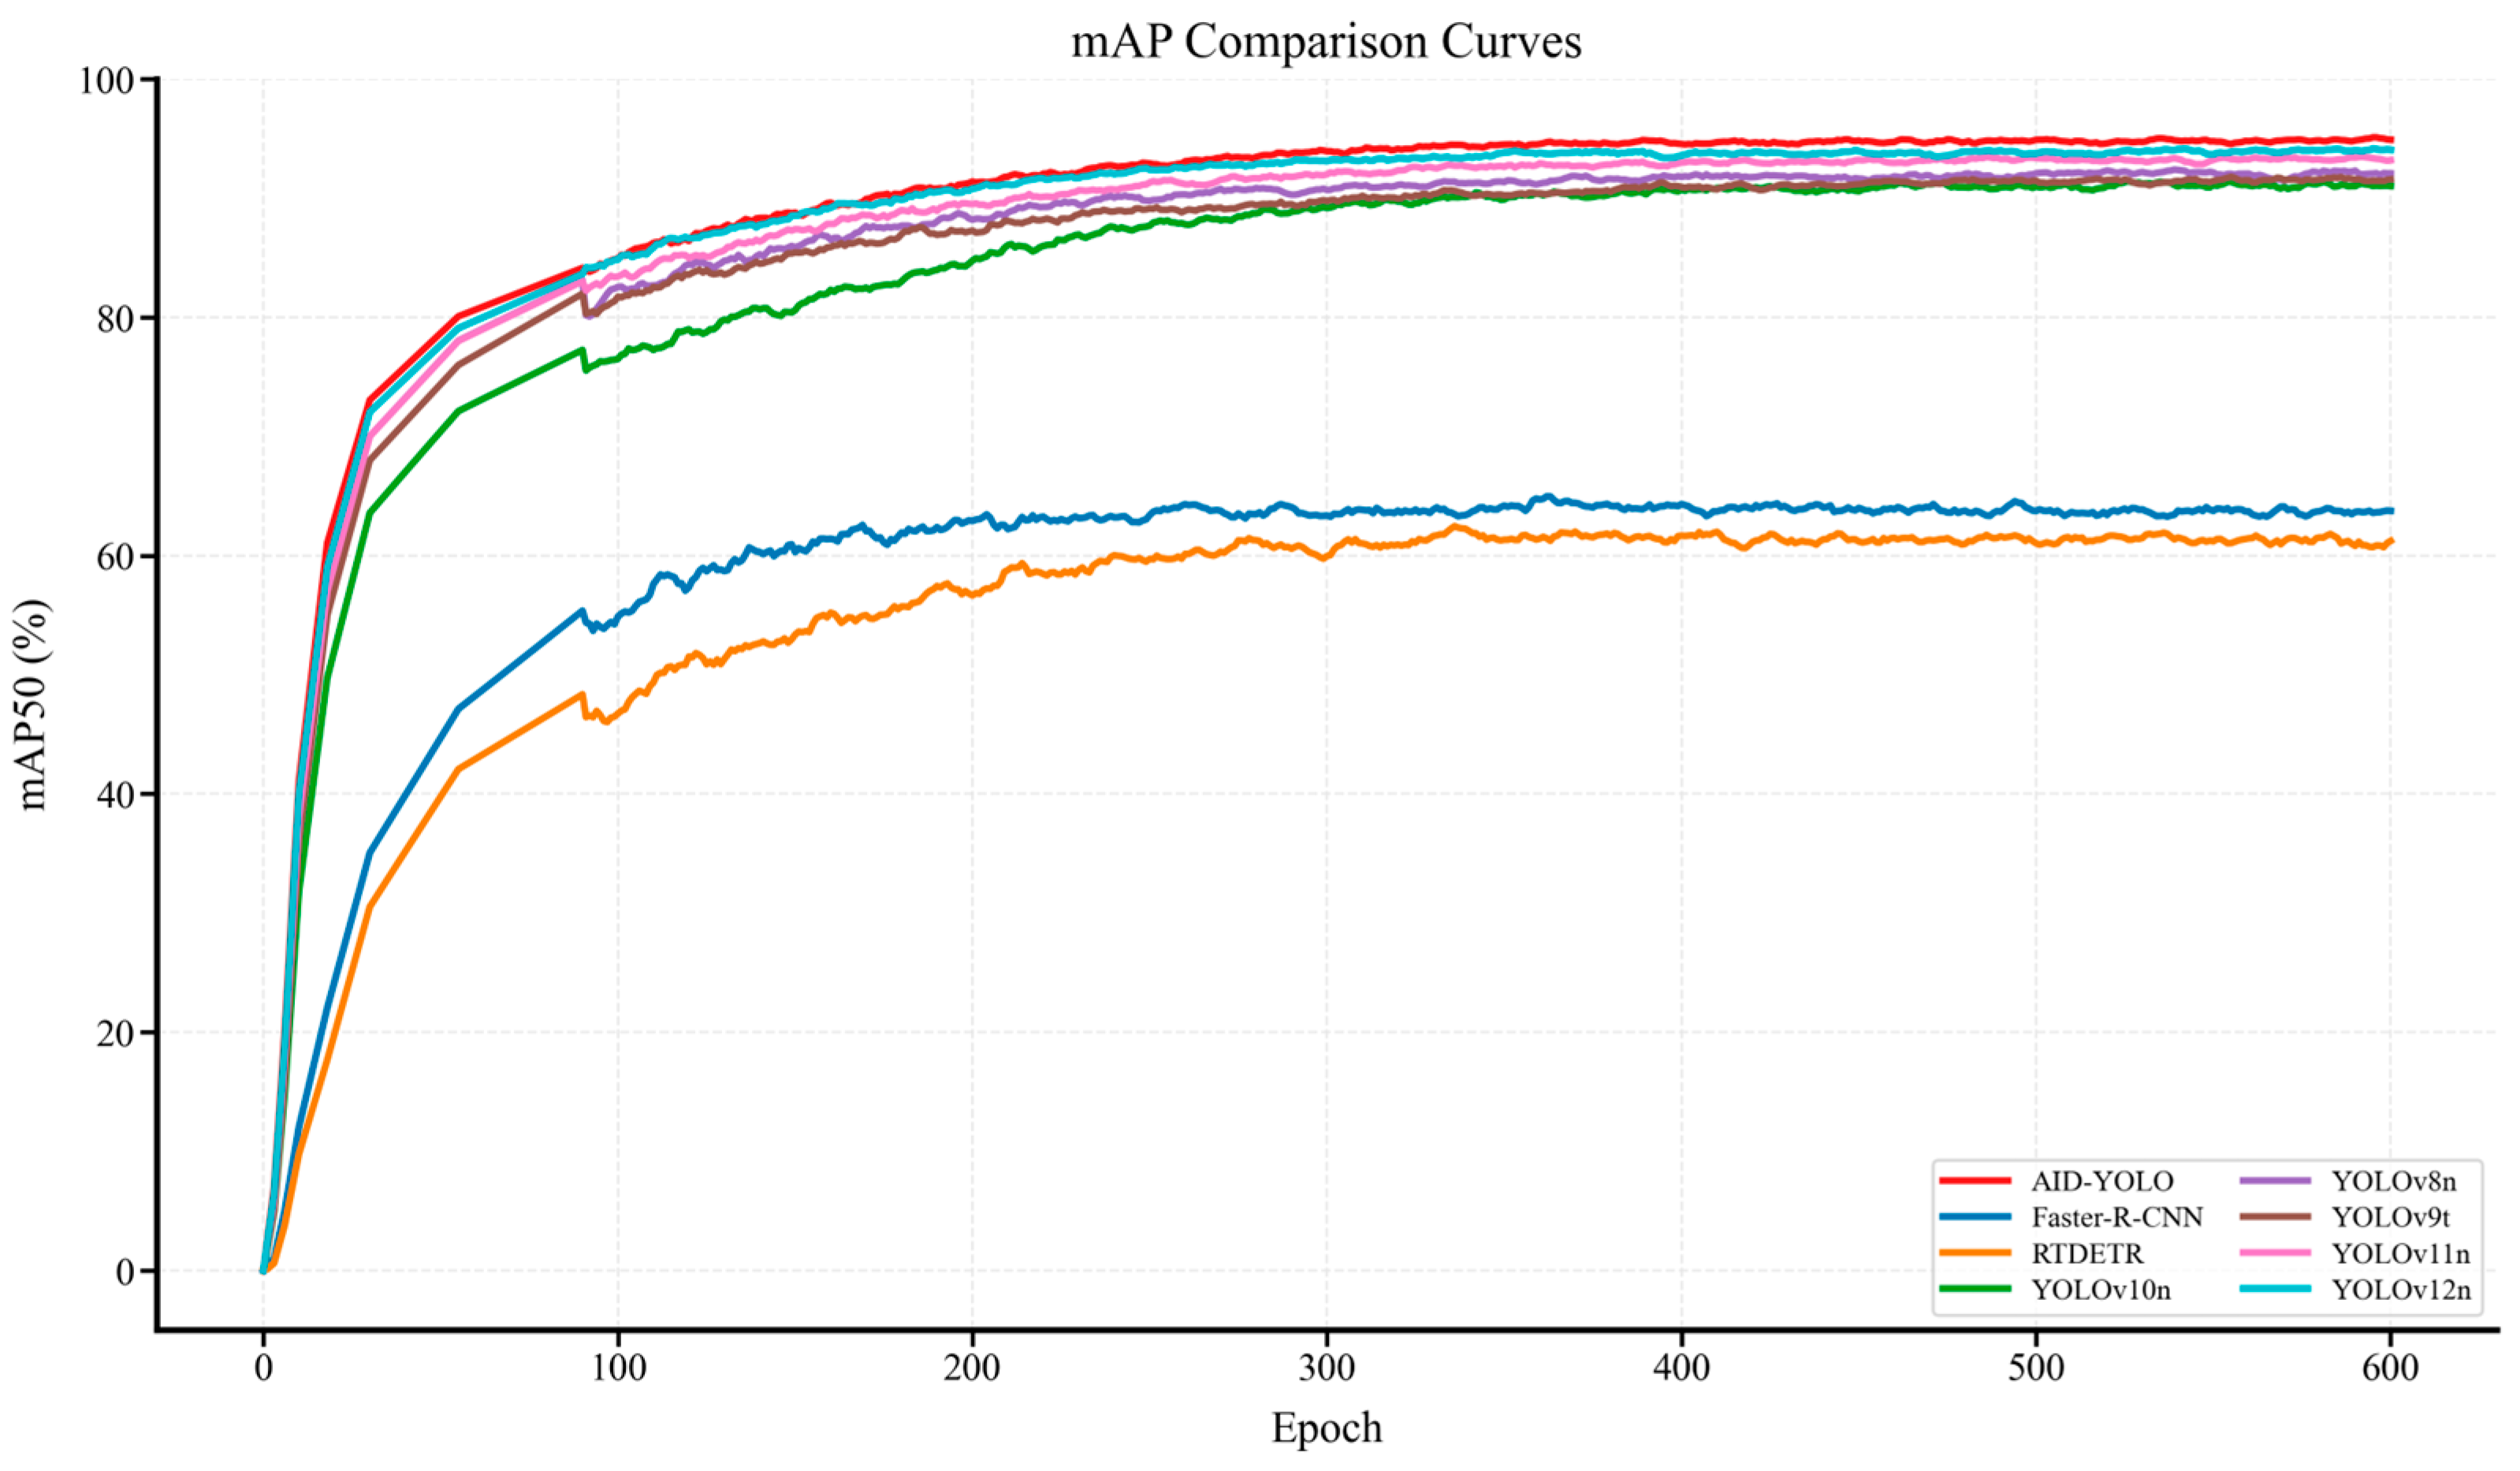
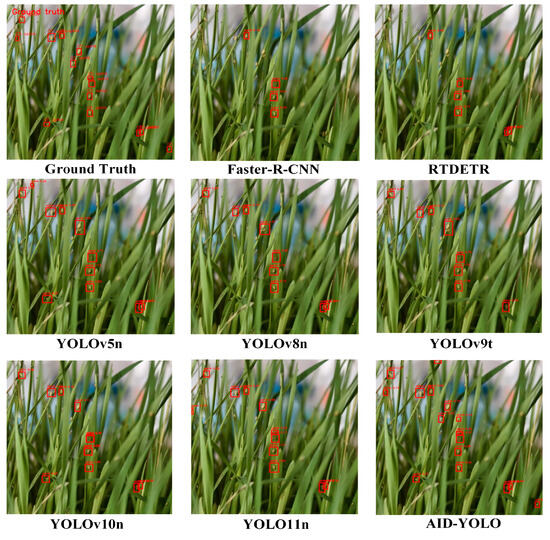
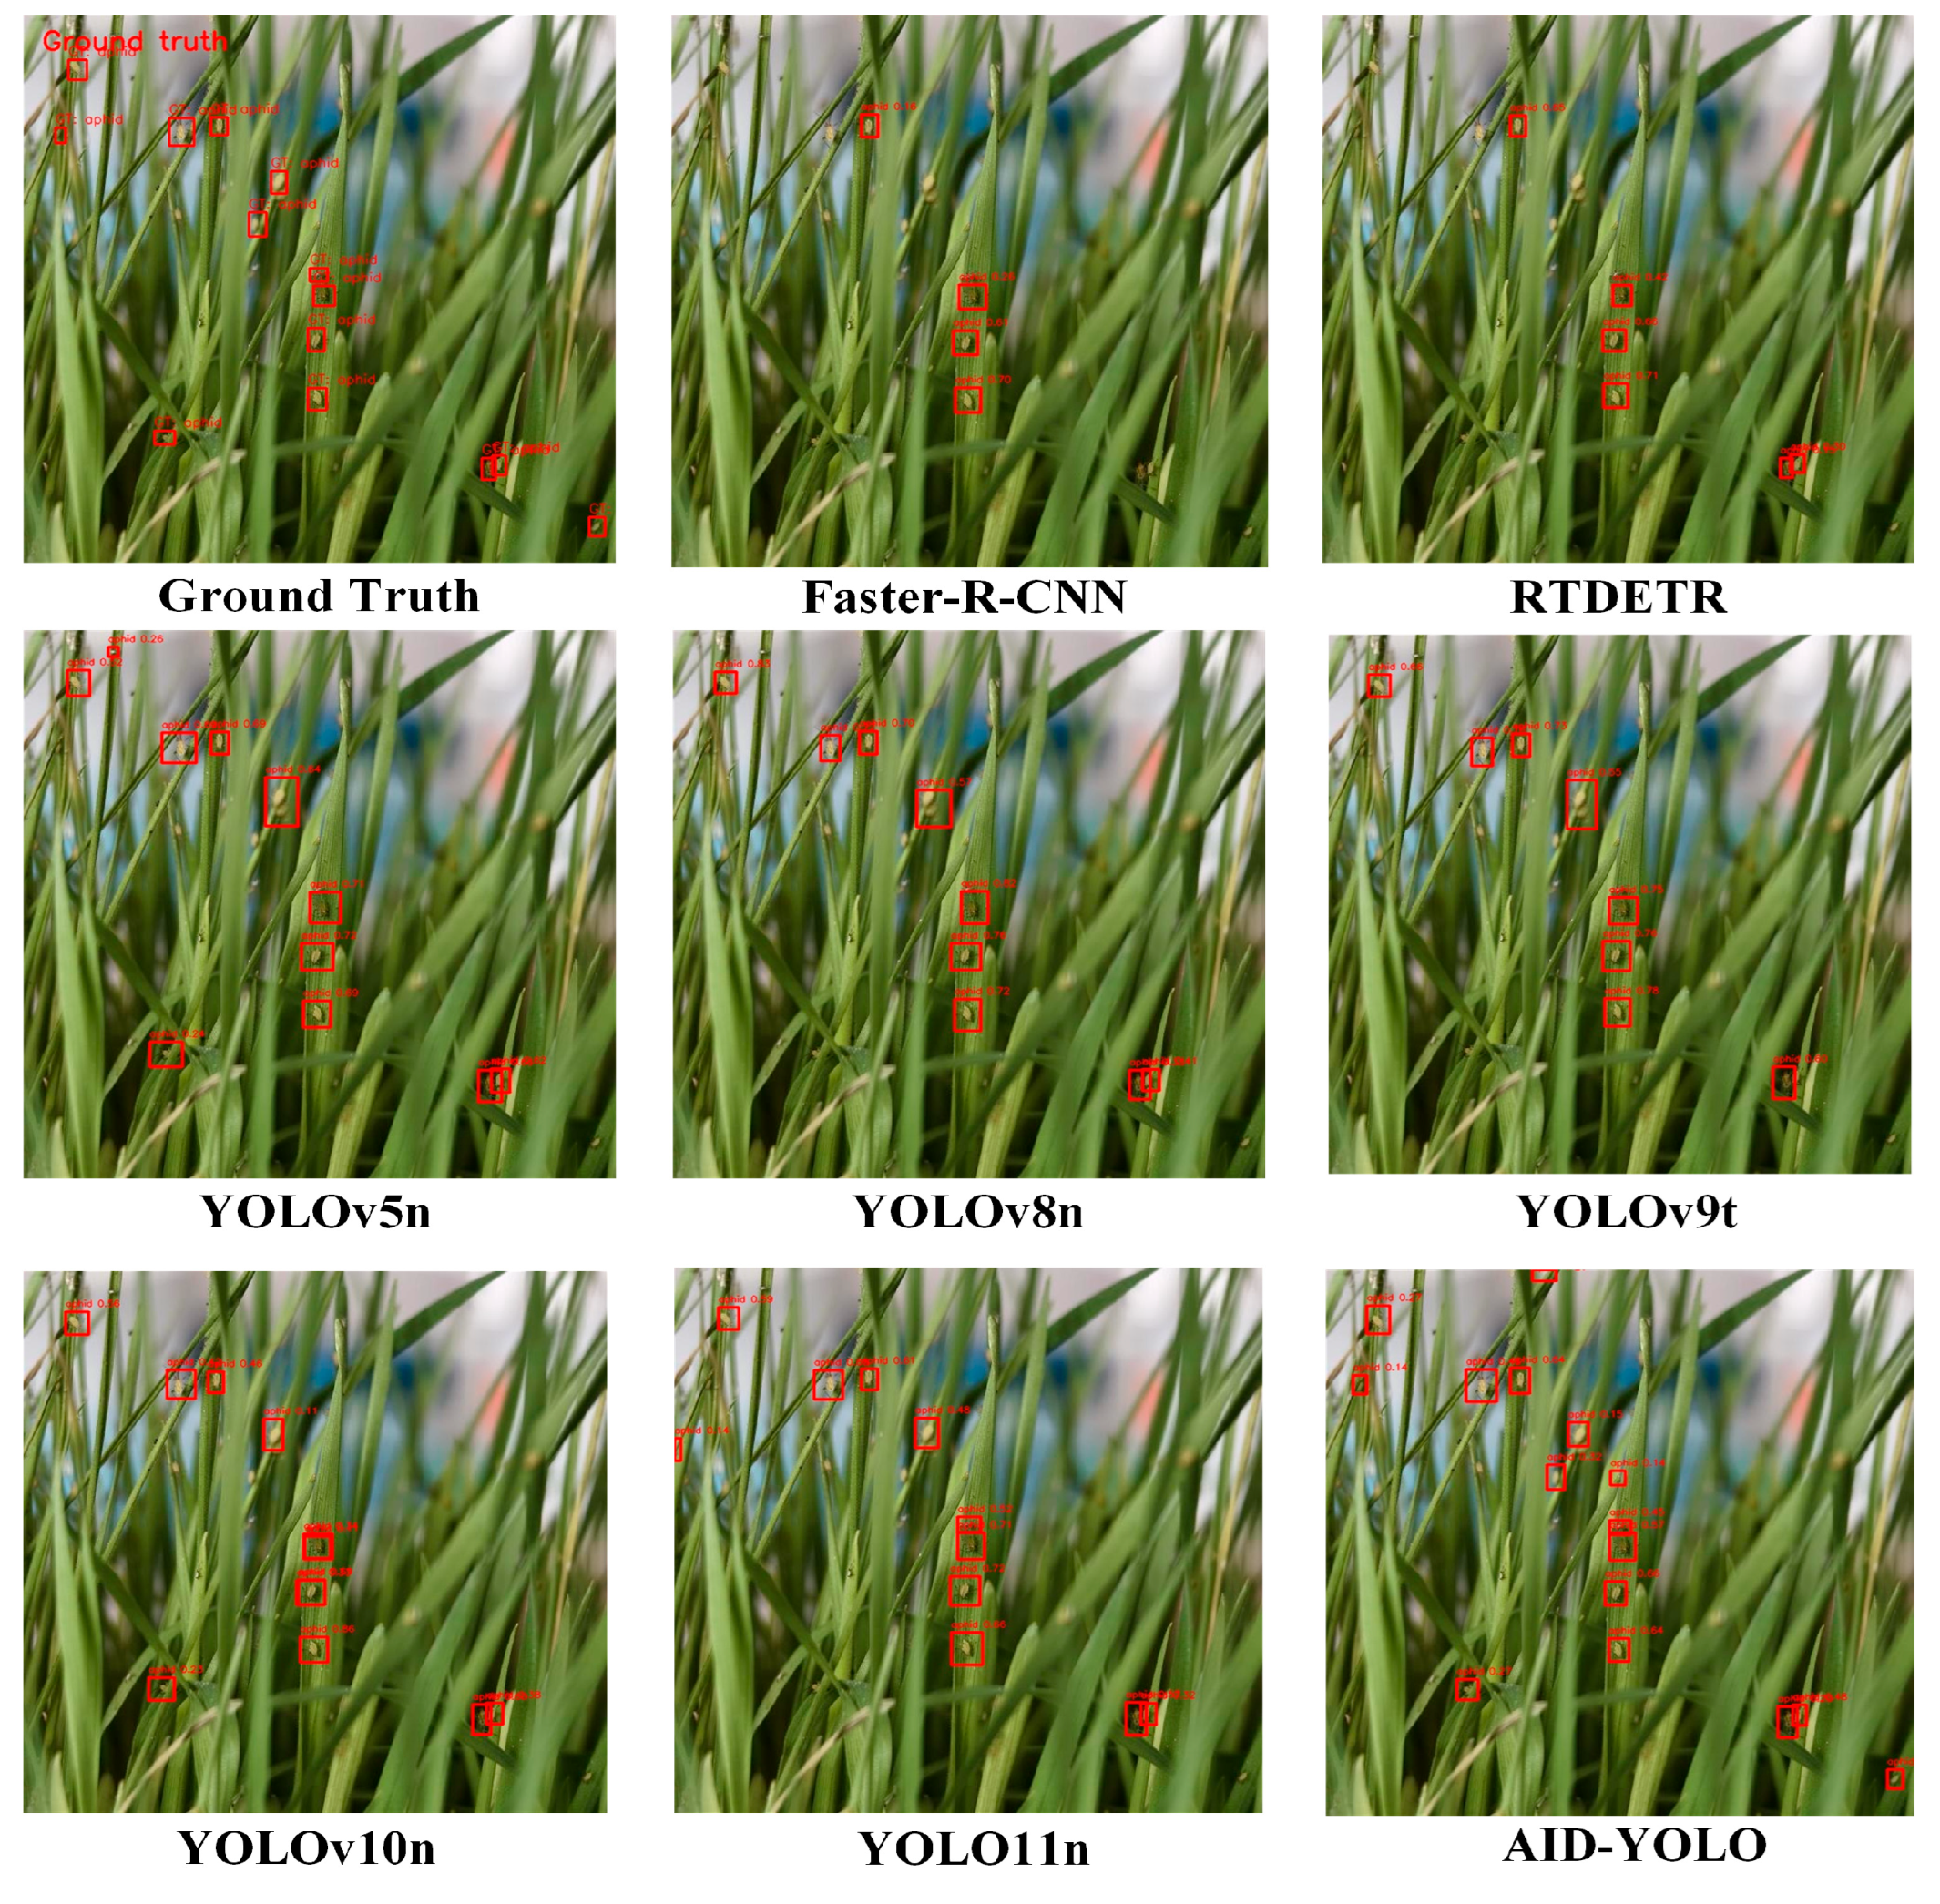
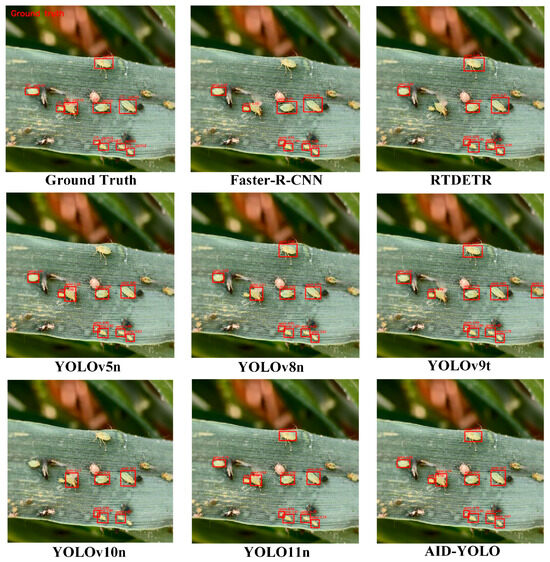
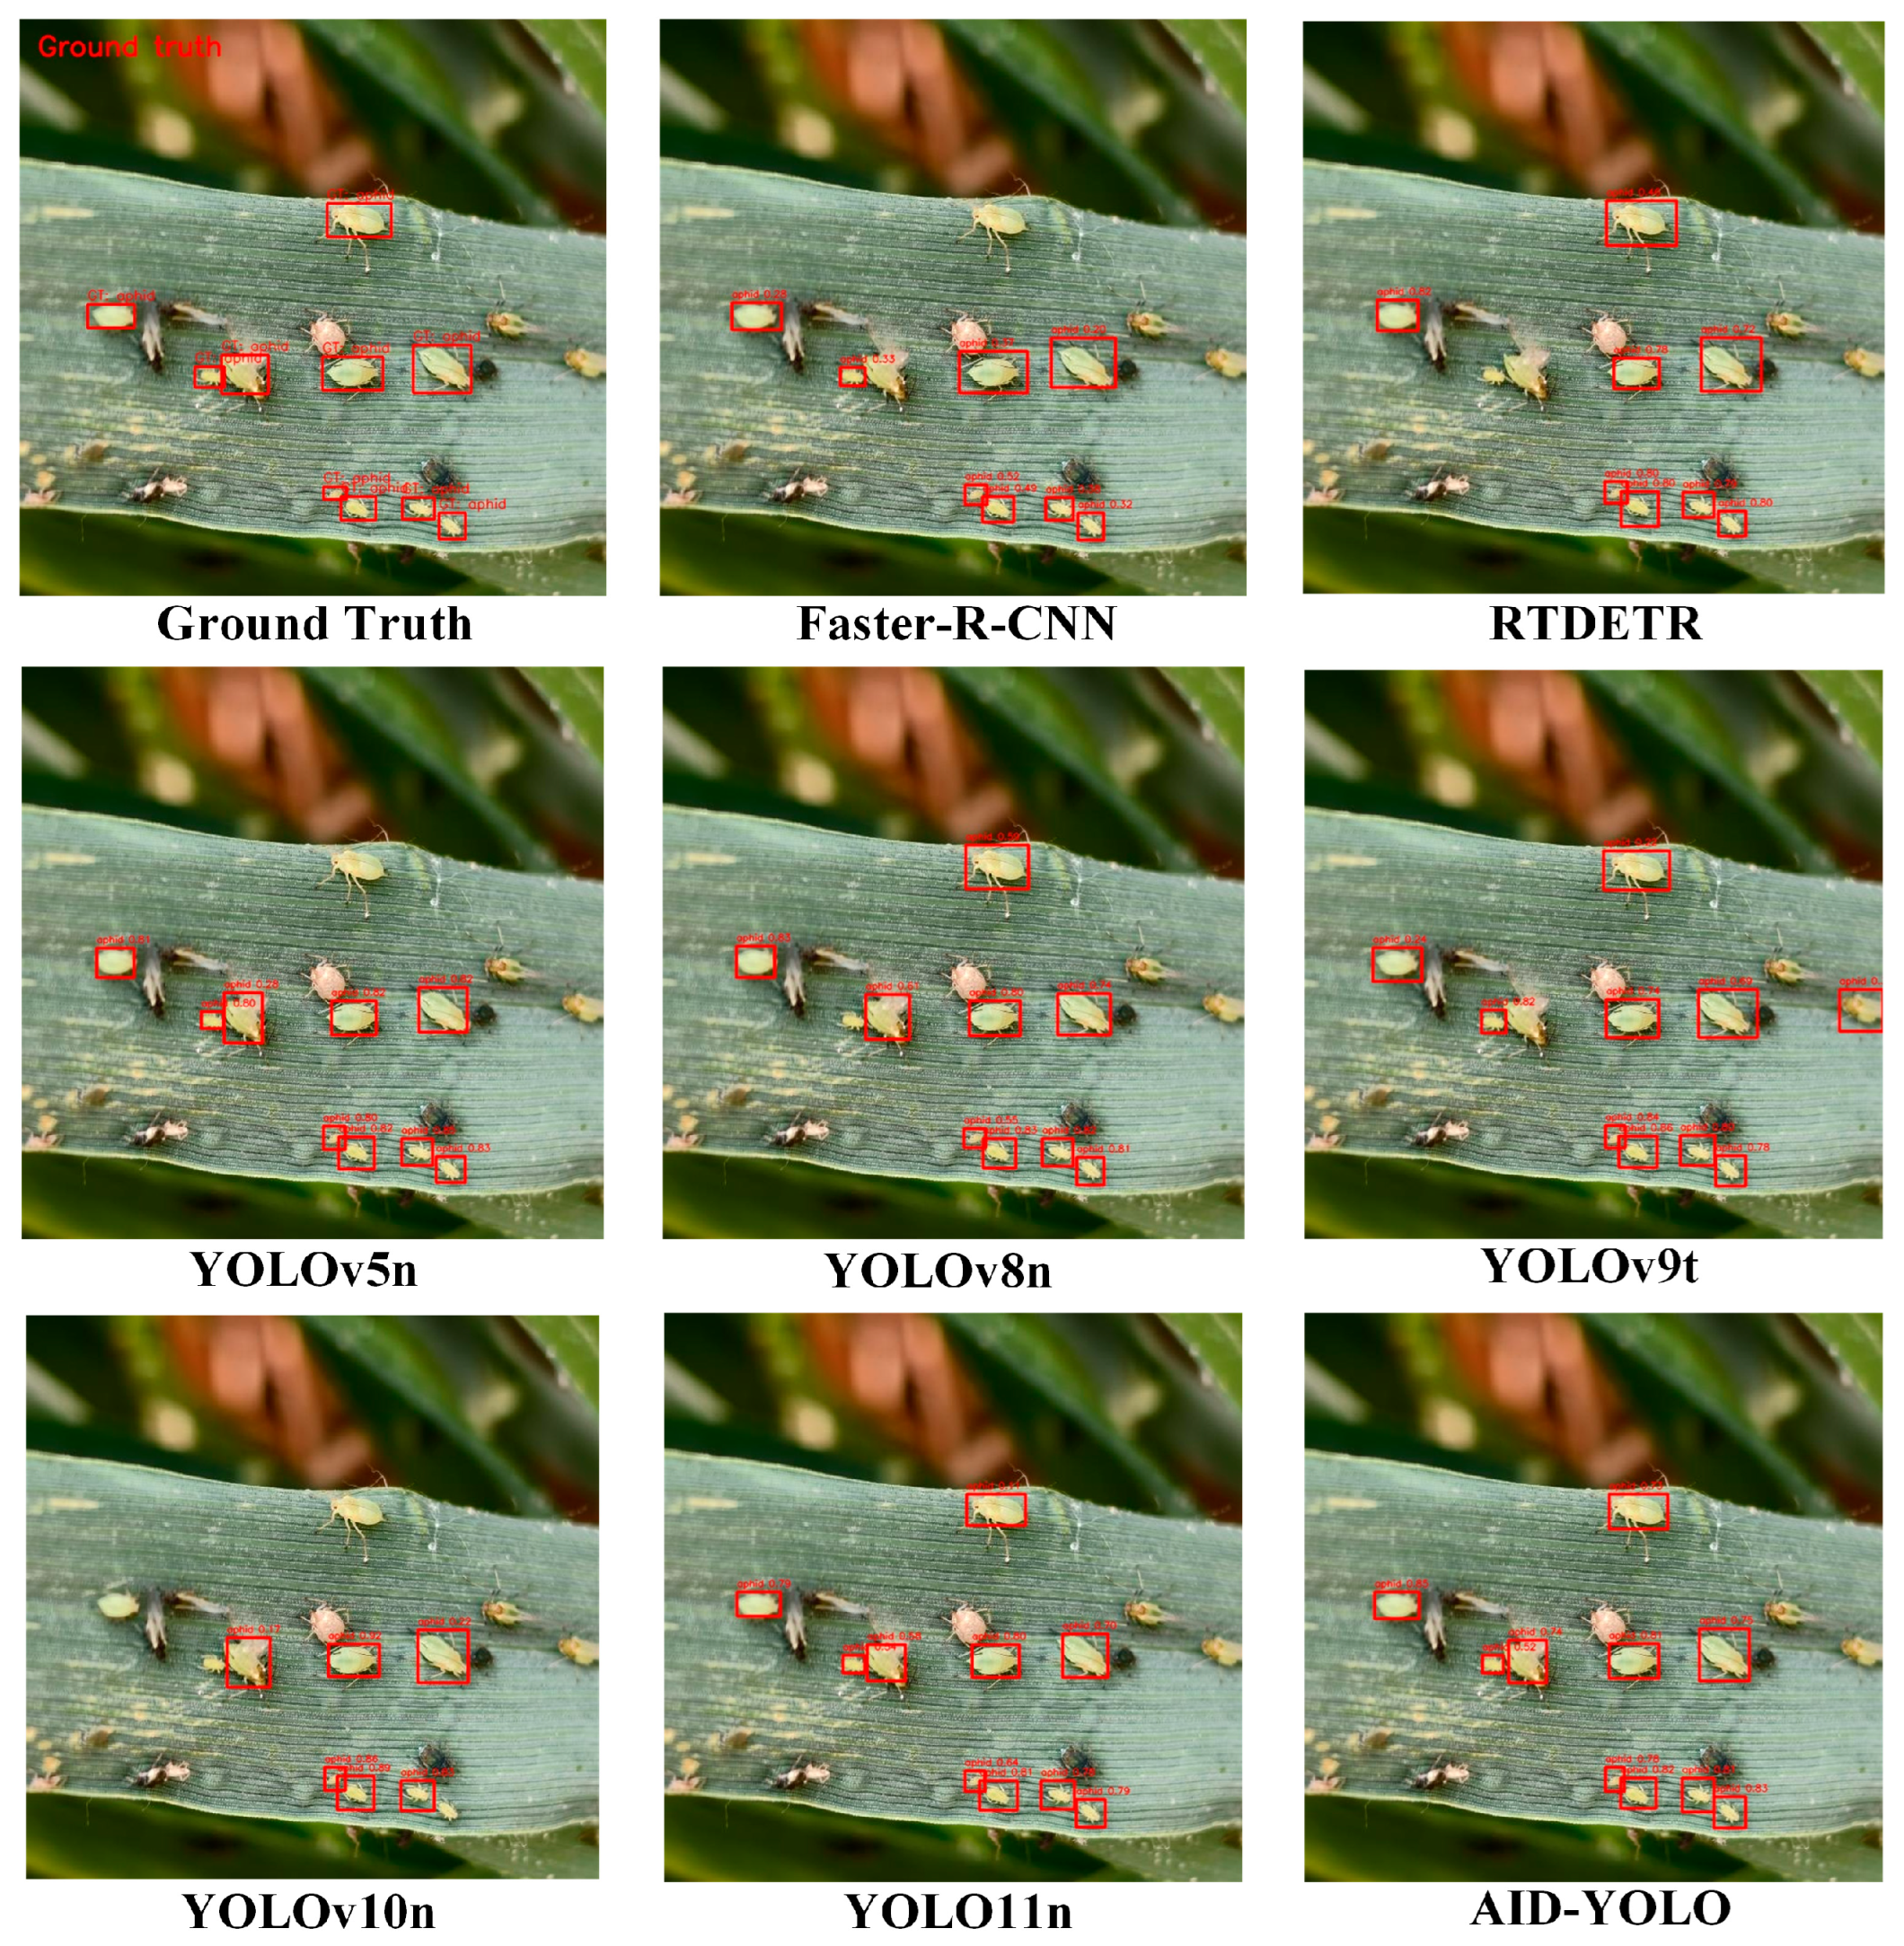
The training curves in Figure 11 further show that AID-YOLO reached a higher final mAP50 level than the compared models under the same training setting, which is consistent with the quantitative results in Table 5. Figure 12 and Figure 13 provide qualitative comparisons by showing the Ground Truth annotations together with the prediction results of representative detectors. The Ground Truth panel provides a visual reference for comparing missed and false detections across models. In the displayed indoor and field examples, AID-YOLO produced more complete detections under partial occlusion, illumination variation, wheat leaf textures, and background clutter. These qualitative examples illustrate the detection patterns observed in the test images and complement the quantitative results in Table 5.
Figure 11.
mAP50 curves of AID-YOLO and representative comparison models.
Figure 12.
Indoor qualitative comparison with ground-truth and detector predictions.
Figure 13.
Field qualitative comparison with ground-truth and detector predictions.
3.8. Wheat Aphid Counting Performance
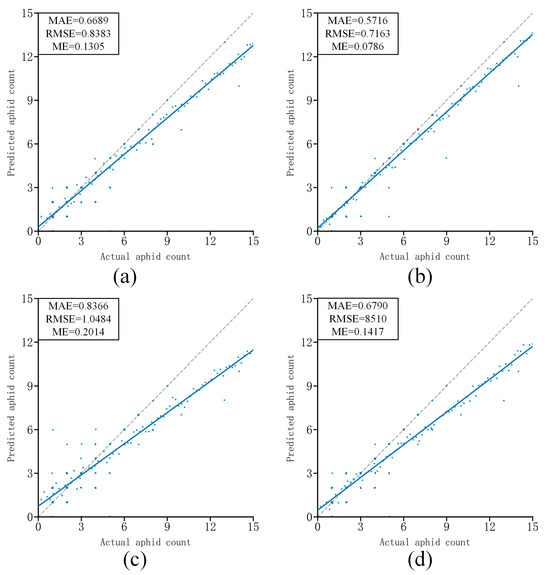
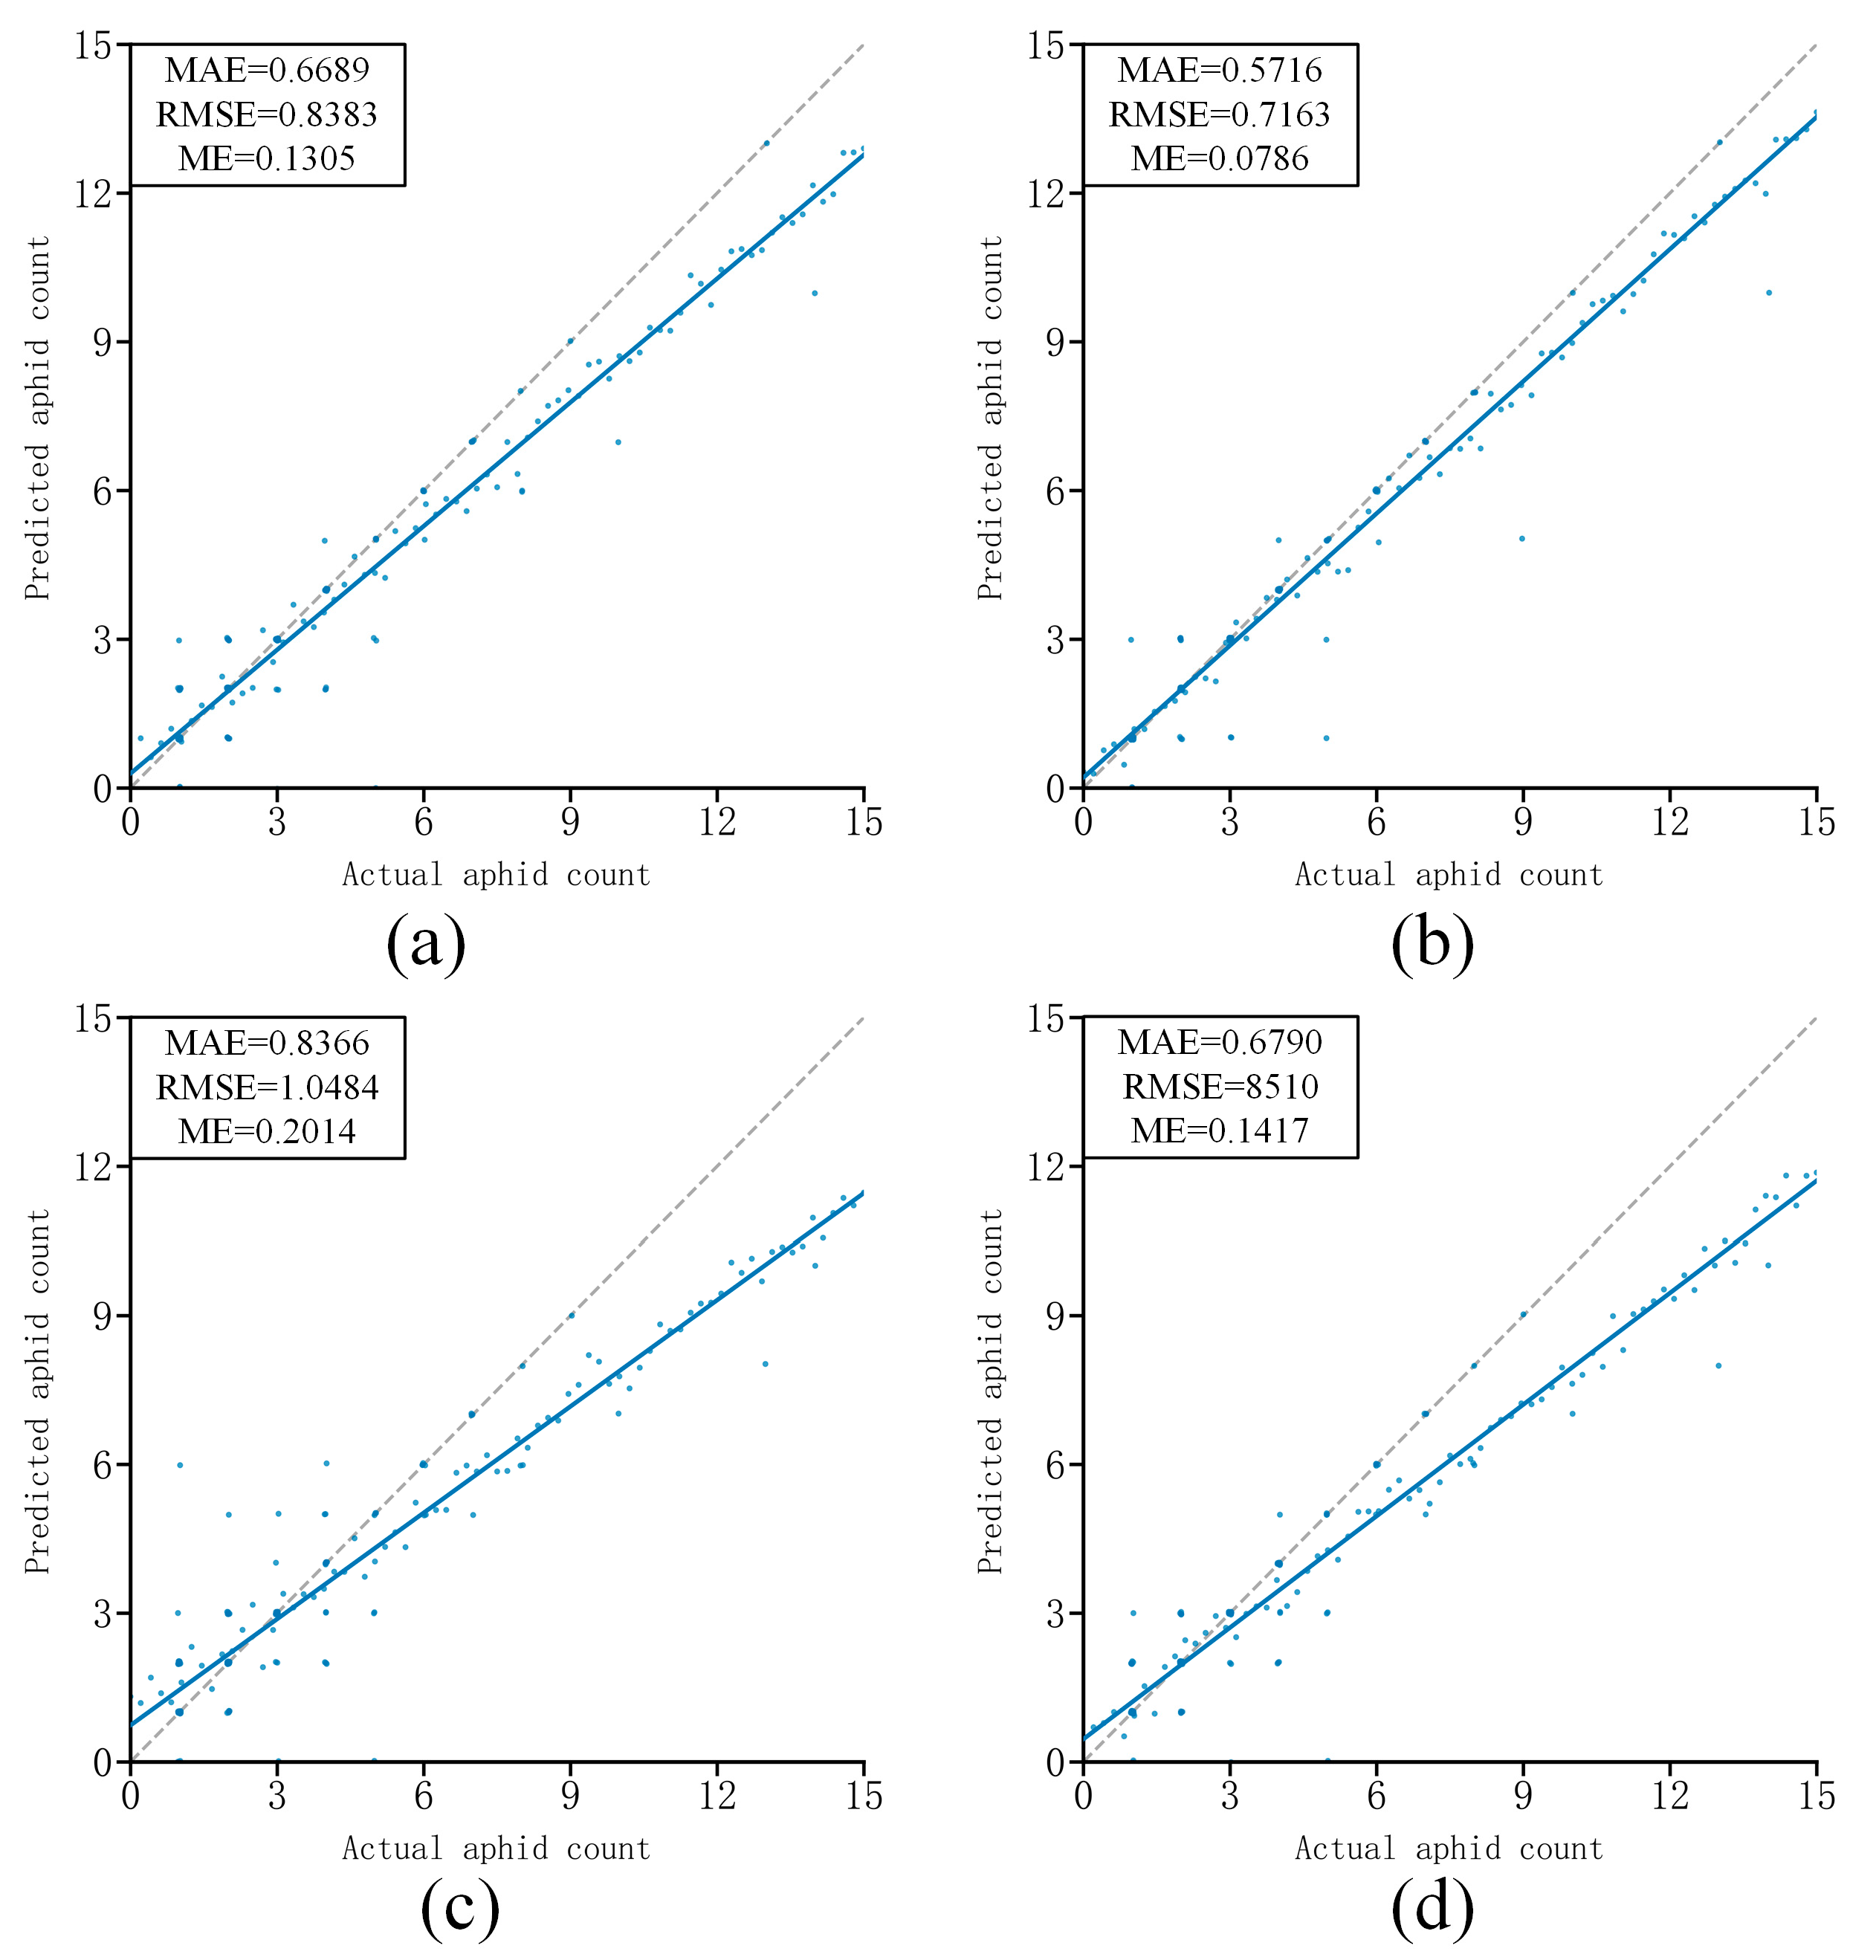
To assess image-level counting accuracy on the held-out test set, AID-YOLO was compared with YOLO11n using MAE, RMSE, and ME (Table 6). This comparison focused on the direct YOLO11n baseline and the proposed AID-YOLO to evaluate the effect of the architectural modifications on detection-based aphid counting. On the indoor dataset, AID-YOLO reduced MAE from 0.8366 to 0.6790 and RMSE from 1.0484 to 0.8510. On the field dataset, AID-YOLO reduced MAE from 0.6689 to 0.5716 and RMSE from 0.8383 to 0.7163. These results indicate that AID-YOLO reduced the magnitude of image-level counting errors under both indoor and field conditions.
Table 6.
Comparison of wheat aphid count predictions.
The ME values further describe the direction of the counting error. All ME values were positive, indicating that both YOLO11n and AID-YOLO showed a slight tendency toward overestimation on the tested images. Compared with YOLO11n, AID-YOLO reduced ME from 0.2014 to 0.1417 on the indoor dataset and from 0.1305 to 0.0786 on the field dataset. This indicates that the proposed model not only reduced the absolute magnitude of counting errors, as reflected by MAE and RMSE, but also decreased the average directional bias of the predicted counts.
The scatter plots in Figure 14 further show the relationship between manually observed and model-predicted aphid counts per image. Although the overall ME values indicate slight overestimation, underestimation was still observed in some high-count images, especially when aphids were clustered or partially occluded. This pattern suggests that dense aggregation, overlapping individuals, leaf occlusion, and small target size after image resizing remain major sources of missed detections. Occasional overestimation in low-count images was mainly associated with confusion between aphids and leaf veins or background textures. Overall, AID-YOLO improved detection-based image-level counting compared with YOLO11n, while clustered and occluded aphid regions remain challenging for further improvement.
Figure 14.
Comparison of wheat aphid counting performance between YOLO11n and AID-YOLO on field and indoor datasets: (a) YOLO11n on the field dataset; (b) AID-YOLO on the field dataset; (c) YOLO11n on the indoor dataset; (d) AID-YOLO on the indoor dataset. The scatter plots show the relationship between manually observed and model-predicted aphid counts per image, and the dashed line represents the ideal 1:1 agreement.
3.9. Edge-Assisted Mini Program Deployment Performance
As shown in Figure 15, the AID-YOLO-based WeChat mini program provides a portable interface for close-range wheat aphid detection and counting using field-acquired images. Users can either capture wheat images directly in the field or select images from a local album. The submitted image is then transmitted to an edge-side inference service, where AID-YOLO performs aphid detection and counting. After inference, the mini program returns the detection result, including the predicted aphid locations and the corresponding aphid count. In addition to the detection function, the mini program also provides an information page introducing wheat aphid infestation symptoms and field monitoring guidance, thereby improving accessibility for growers, field technicians, extension workers, and researchers who require a low-cost tool for close-range image-based aphid detection and counting.
Figure 15.
Interface of the WeChat mini program for wheat aphid detection and pest information: (a) single-image detection page for selecting wheat images from the gallery or camera; (b) detection result page displaying the predicted aphid count after model inference; (c) information page introducing wheat aphid infestation symptoms and application guidance.
To quantitatively evaluate the deployment performance of AID-YOLO, the trained PyTorch model was first exported to ONNX format and then converted to RKNN format for execution on the Rockchip RK3588S RKNPU. The edge-side inference service was implemented using RKNNLite on a NanoPi M6 device (FriendlyElec, Guangzhou, China). The WeChat mini program communicated with the edge-side service for image upload and result return. Before formal timing, 20 warm-up runs were conducted to reduce initialization-related fluctuations, followed by 500 repeated runs for latency evaluation. The deployment environment and quantitative edge-inference results are summarized in Table 7.
Table 7.
Quantitative edge-deployment results of AID-YOLO on the NanoPi M6 platform.
As shown in Table 7, the converted RKNN model size was 3.71 MB, indicating that AID-YOLO can be stored and executed on resource-constrained edge devices. The NPU-only inference latency was 32.71 ms, corresponding to an inference speed of 30.58 FPS. Here, NPU-only inference latency refers exclusively to the time consumed by the RKNNLite inference call on the RKNPU. The end-to-end latency, defined as the edge-side processing time for image reading, preprocessing, NPU inference, and post-processing, was 56.23 ms, corresponding to an end-to-end processing speed of 17.75 FPS. This end-to-end measurement did not include image upload or result return time over the network. Compared with NPU-only inference speed, the end-to-end latency and FPS provide a more representative measure of application-level responsiveness in the tested edge-assisted deployment prototype.
The deployment experiment was designed to verify the practical feasibility of AID-YOLO on an edge device rather than to provide a large-scale field system evaluation. The current timing test was conducted on a single NanoPi M6 device using a representative 640 × 640 input image under a local-area-network environment. The measured latency may be affected by image resolution, NPU frequency, network conditions, concurrent request load, and the implementation of post-processing. Therefore, future work will further evaluate the stability, scalability, and user-perceived response time of the system using more edge devices, more field images, and real multi-user application scenarios.
4. Discussion
Relative to YOLO11n, AID-YOLO achieved a more favorable accuracy–efficiency balance for close-range wheat aphid detection. Across three random seeds, AID-YOLO increased the average mAP50 from 93.0 ± 0.39% to 95.3 ± 0.10% and the average mAP50:95 from 66.4 ± 0.13% to 70.4 ± 0.19%, while reducing the parameter count from 2.58 M to 2.09 M and the computational cost from 6.3 to 5.1 GFLOPs. The observed performance gains were mainly associated with three complementary architectural changes. ADown reduces redundant computation during downsampling while retaining weak small-target cues; IEMA strengthens local–global feature interaction and suppresses interference from leaf veins, illumination variation, and cluttered backgrounds; and DySample improves cross-scale feature fusion and spatial-detail reconstruction during upsampling. Together, these modifications contributed to the improved detection of small and densely distributed aphids. Previous YOLO-based pest detectors have mainly focused on multi-scale representation, attention mechanisms, lightweight architectures, and mobile deployment [45,46,47,48,49,50,51], while aphid monitoring studies have also explored deep-learning- or smartphone-based approaches in other crop systems [52,53,54]. AID-YOLO extends this line of research by specifically addressing close-range individual wheat aphid detection and per-image counting under both indoor and natural field conditions. Because previous studies differ in pest categories, datasets, image-acquisition settings, and evaluation protocols, numerical comparisons should be interpreted cautiously. Nevertheless, the present results support the feasibility of AID-YOLO as a lightweight detector under the evaluated wheat aphid scenarios.
The improvement in detection performance was accompanied by lower image-level aphid counting errors. Compared with YOLO11n, AID-YOLO reduced MAE from 0.6689 to 0.5716 and RMSE from 0.8383 to 0.7163 on the field dataset. On the indoor dataset, MAE decreased from 0.8366 to 0.6790 and RMSE decreased from 1.0484 to 0.8510. The positive ME values indicate a slight tendency toward overestimation on the tested images. Compared with YOLO11n, AID-YOLO reduced ME from 0.2014 to 0.1417 on the indoor dataset and from 0.1305 to 0.0786 on the field dataset, indicating that the model reduced the average overestimation bias under both evaluated conditions. Clustered and occluded aphids remained the major source of counting error because adjacent individuals can be missed or merged during detection. Therefore, although AID-YOLO improved detection-based image-level counting relative to YOLO11n, dense aggregations remain challenging.
The edge-deployment results further support the feasibility of the proposed model. After conversion to RKNN format, AID-YOLO occupied 3.71 MB on the NanoPi M6 platform. The NPU-only inference latency was 32.71 ms, whereas the end-to-end latency was 56.23 ms, corresponding to approximately 30.58 and 17.75 FPS, respectively. These results suggest that the model can support interactive close-range aphid detection under the tested hardware and software configuration. The WeChat mini program can further facilitate access for growers, field technicians, extension workers, and researchers who require a low-cost tool for close-range image-based aphid detection and counting. However, the deployment experiment was conducted on only one edge device and primarily evaluated inference performance. Field-level evaluation of system stability, usability, energy consumption, and long-term operation is still required.
Several limitations should be considered. First, the self-collected dataset comprised 542 images from a limited geographic region, growing period, and imaging device, and the held-out test set was relatively small. Therefore, the current results should be regarded as a feasibility evaluation under the tested indoor and field conditions rather than as evidence of universal robustness. Although mAP50:95 was added as a stricter localization metric, size-stratified AP for different aphid-size groups was not included. Second, the dataset did not deliberately include key biological look-alikes, such as the small planthopper Laodelphax striatellus or rust pustules caused by Puccinia spp.; therefore, model specificity under mixed pest–disease conditions remains to be established. Third, the reported output represents aphid counts per image rather than density per unit area, plant, or wheat spike, and should not be directly interpreted as field-scale aphid density without a standardized sampling protocol. The system is intended to support, rather than replace, expert assessment and field scouting. Future work should prioritize multi-year and multi-location validation, size-stratified detection evaluation, improved dense-target counting, standardized image-sampling procedures, and integration with agronomic severity grades and control thresholds.
5. Conclusions
In this study, a lightweight wheat aphid detection model, AID-YOLO, was developed by integrating ADown, IEMA, and DySample into the YOLO11n framework. Across three random seeds, AID-YOLO increased the average mAP50 from 93.0 ± 0.39% to 95.3 ± 0.10% and the average mAP50:95 from 66.4 ± 0.13% to 70.4 ± 0.19% on the combined indoor–field evaluation set, while reducing the parameter count from 2.58 M to 2.09 M and decreasing the computational cost from 6.3 to 5.1 GFLOPs. The model showed a scene-dependent precision–recall pattern: indoor Precision was lower than that of YOLO11n, whereas indoor Recall and the combined mAP50 improved, indicating improved detection completeness under the tested conditions. For detection-based image-level counting, AID-YOLO reduced MAE from 0.8366 to 0.6790 and RMSE from 1.0484 to 0.8510 on the indoor subset, and reduced MAE from 0.6689 to 0.5716 and RMSE from 0.8383 to 0.7163 on the field subset. The ME results further showed that both models had a slight tendency toward overestimation on the tested images, while AID-YOLO reduced ME from 0.2014 to 0.1417 on the indoor subset and from 0.1305 to 0.0786 on the field subset. The RKNN-based deployment test on the NanoPi M6 showed a compact model size of 3.71 MB and an end-to-end speed of 17.75 FPS. These results indicate that AID-YOLO provides a lightweight solution for wheat aphid detection and image-level counting under the tested indoor and field conditions, offering practical potential for edge-assisted pest monitoring. Future work will focus on expanding multi-region datasets, improving dense-target counting robustness, evaluating size-stratified detection performance, and validating the model across more mobile and embedded deployment platforms.
Author Contributions
Conceptualization, L.S., L.X. and Z.S.; methodology, F.Y., L.S., L.X. and X.M.; software, F.Y., H.L. (Huiling Li) and J.M.; validation, H.L. (Huiling Li), J.Z. and S.Z.; formal analysis, F.Y., H.L. (Huiling Li) and J.M.; investigation, J.Z., X.L. and Z.S.; resources, H.L. (Haiyan Lv), X.L. and X.M.; data curation, J.M., S.Z. and Z.S.; writing—original draft preparation, F.Y., G.H. and Z.S.; writing—review and editing, L.S. and L.X.; visualization, J.Z., S.Z. and X.L.; supervision, G.H., L.X. and X.M.; project administration, G.H., H.L. (Haiyan Lv) and L.X.; funding acquisition, F.Y., H.L. (Haiyan Lv) and L.S. All authors have read and agreed to the published version of the manuscript.
Funding
This research was funded by the National Natural Science Foundation of China (Grant No.31501225, Grant No.31701309); the Natural Science Foundation of Henan Province (Grant No.242301420143, Grant No.252300420901); the Key Scientific and Technological Project of Henan Province (Grant No.252102110268); the National Key Research and Development Program (Grant No.2017YFD0301105); and the Key Research and Development Projects of Henan Province (Grant No.241111110080).
Data Availability Statement
The self-collected wheat aphid image dataset and corresponding annotations supporting the findings of this study are available from the corresponding author upon reasonable request. The publicly available Wheat_Coccinellid dataset used for supplementary external evaluation is available in Mendeley Data, Version 1, https://doi.org/10.17632/j9735xjspw.1. Further inquiries can be directed to the corresponding authors.
Acknowledgments
The authors would like to thank the teachers and graduate students from the Institute of Plant Protection, Henan Academy of Agricultural Sciences, and the Modern Agricultural Research and Development Base in Yuanyang County for their generous assistance and patient guidance during the data collection process. The authors also sincerely thank Bilal for his valuable support during image acquisition and sample collection. During the preparation of this manuscript and the response letter, the authors used ChatGPT (OpenAI, GPT-5.5 Thinking) for the purposes of language polishing and improving the clarity and organization of the revised text. No generative artificial intelligence was used to generate or modify the experimental data, annotations, figures, or quantitative results. The authors have reviewed and edited the output and take full responsibility for the content of this publication.
Conflicts of Interest
The authors declare that they have no known competing financial interests or personal relationships that could have appeared to influence the work reported in this paper.
References
- Shewry, P.R. Wheat. J. Exp. Bot. 2009, 60, 1537–1553. [Google Scholar] [CrossRef] [Scilit] [PubMed]
- Bao, W.; Zhao, J.; Hu, G.; Zhang, D.; Huang, L.; Liang, D. Identification of wheat leaf diseases and their severity based on elliptical-maximum margin criterion metric learning. Sustain. Comput. Inform. Syst. 2021, 30, 100526. [Google Scholar] [CrossRef] [Scilit]
- Savaris, M.; Lampert, S.; Salvadori, J.R.; Pereira, P.R.V.S. Population growth and damage caused by Rhopalosiphum padi (L.) (Hemiptera, Aphididae) on different cultivars and phenological stages of wheat. Neotrop. Entomol. 2013, 42, 539–543. [Google Scholar] [CrossRef] [Scilit] [PubMed]
- Zhang, K.-X.; Li, H.-Y.; Quandahor, P.; Gou, Y.-P.; Li, C.-C.; Zhang, Q.-Y.; Haq, I.U.; Ma, Y.; Liu, C.-Z. Responses of six wheat cultivars (Triticum aestivum) to wheat aphid (Sitobion avenae) infestation. Insects 2022, 13, 508. [Google Scholar] [CrossRef] [Scilit] [PubMed]
- Messina, F.J.; Bloxham, A.J. Plant resistance to the Russian wheat aphid: Effects on a nontarget aphid and the role of induction. Can. Entomol. 2004, 136, 129–137. [Google Scholar] [CrossRef] [Scilit]
- Jankielsohn, A.; Tolmay, L.V.; le Roux, M.S.L.; Mohase, L.; Mafa, M.S.; Nicolis, V.F.; Venter, E.; Burger, N.F.V.; Botha, A.-M. Russian wheat aphid: A model for genomic plasticity and a challenge to breeders. Insect Sci. 2025; in press. [CrossRef] [Scilit] [PubMed]
- Anarbekova, G.; Ruiz, L.G.B.; Akanova, A.; Sharipova, S.; Ospanova, N. Fine-tuning artificial neural networks to predict pest numbers in grain crops: A case study in Kazakhstan. Mach. Learn. Knowl. Extr. 2024, 6, 1154–1169. [Google Scholar] [CrossRef] [Scilit]
- Negi, R.; Sharma, B.; Kaur, S.; Kaur, T.; Khan, S.S.; Kumar, S.; Ramniwas, S.; Rustagi, S.; Singh, S.; Rai, A.K.; et al. Microbial antagonists: Diversity, formulation and applications for management of pest–pathogens. Egypt. J. Biol. Pest Control 2023, 33, 105. [Google Scholar] [CrossRef] [Scilit]
- Peignier, S.; Lacotte, V.; Duport, M.-G.; Baa-Puyoulet, P.; Simon, J.-C.; Calevro, F.; Heddi, A.; da Silva, P. Detection of aphids on hyperspectral images using one-class SVM and Laplacian of Gaussians. Remote Sens. 2023, 15, 2103. [Google Scholar] [CrossRef] [Scilit]
- Skendžić, S.; Novak, H.; Zovko, M.; Pajač Živković, I.; Lešić, V.; Maričević, M.; Lemić, D. Hyperspectral canopy reflectance and machine learning for threshold-based classification of aphid-infested winter wheat. Remote Sens. 2025, 17, 929. [Google Scholar]
- Shafi, U.; Mumtaz, R.; Haq, I.U.; Hafeez, M.; Iqbal, N.; Shaukat, A.; Zaidi, S.M.H.; Mahmood, Z. Wheat yellow rust disease infection type classification using texture features. Sensors 2021, 21, 146. [Google Scholar]
- Liu, T.; Guo, S.; Wu, P.; Qi, Y.; Ma, J.; Yuan, Q.; Xu, T. Detection study of early-stage classification of rice diseases using a hyperspectral multi-feature fusion model (PMA-VRNet) driven by the vegetation index RBDI. Eur. J. Agron. 2026, 173, 127908. [Google Scholar]
- Mustafa, G.; Zheng, H.; Liu, Y.; Yang, S.; Khan, I.H.; Hussain, S.; Liu, J.; Weize, W.; Chen, M.; Cheng, T.; et al. Leveraging machine learning to discriminate wheat scab infection levels through hyperspectral reflectance and feature selection methods. Eur. J. Agron. 2024, 161, 127372. [Google Scholar] [CrossRef] [Scilit]
- Halstead, D.A.; Benmerrouche, L.N.; Gossen, B.D.; McDonald, M.R. Early detection of clubroot in canola using drone-based hyperspectral imaging and machine learning. Eur. J. Agron. 2025, 170, 127727. [Google Scholar] [CrossRef] [Scilit]
- Amarathunga, D.C.K.; Grundy, J.; Parry, H.; Dorin, A. Methods of insect image capture and classification: A systematic literature review. Smart Agric. Technol. 2021, 1, 100023. [Google Scholar] [CrossRef] [Scilit]
- Toscano-Miranda, R.; Toro, M.; Aguilar, J.; Caro, M.; Marulanda, A. Artificial-intelligence and sensing techniques for the management of insect pests and diseases in cotton: A systematic literature review. J. Agric. Sci. 2022, 160, 16–31. [Google Scholar] [CrossRef] [Scilit]
- Lima, M.C.F.; de Almeida Leandro, M.E.D.; Valero, C.; Coronel, L.C.P.; Bazzo, C.O.G. Automatic detection and monitoring of insect pests—A review. Agriculture 2020, 10, 161. [Google Scholar] [CrossRef] [Scilit]
- Ma, B.; Sun, L.; Mu, J.; Ren, Z.; Kang, G.; Liu, R.; Liu, S.; Hu, X.; Zhang, H.; Wang, J. MH-YOLO: Multiple heterogeneous YOLO for apple orchard pest detection. Inf. Process. Agric. 2025, 13, 47–71. [Google Scholar] [CrossRef] [Scilit]
- Li, K.; Wang, J.; Jalil, H.; Wang, H. A fast and lightweight detection algorithm for passion fruit pests based on improved YOLOv5. Comput. Electron. Agric. 2023, 204, 107534. [Google Scholar]
- Wen, C.; Chen, H.; Ma, Z.; Zhang, T.; Yang, C.; Su, H.; Chen, H. Pest-YOLO: A model for large-scale multi-class dense and tiny pest detection and counting. Front. Plant Sci. 2022, 13, 973985. [Google Scholar] [PubMed]
- Zheng, Y.; Zheng, W.; Du, X. Paddy-YOLO: An accurate method for rice pest detection. Comput. Electron. Agric. 2025, 238, 110777. [Google Scholar] [CrossRef] [Scilit]
- Zhu, L.; Li, X.; Sun, H.; Han, Y. Research on CBF-YOLO detection model for common soybean pests in complex environment. Comput. Electron. Agric. 2024, 216, 108515. [Google Scholar]
- Tian, Y.; Wang, S.; Li, E.; Yang, G.; Liang, Z.; Tan, M. MD-YOLO: Multi-scale Dense YOLO for small target pest detection. Comput. Electron. Agric. 2023, 213, 108233. [Google Scholar]
- Chang, X.; Wang, Y.; Zhang, H.; Adamyk, B.; Yan, L. Optimized Adaptive Multi-Scale Architecture for Surface Defect Recognition. Algorithms 2025, 18, 529. [Google Scholar] [CrossRef] [Scilit]
- Ouyang, D.; He, S.; Zhang, G.; Luo, M.; Guo, H.; Zhan, J.; Huang, Z. Efficient Multi-Scale Attention Module with Cross-Spatial Learning. In Proceedings of the ICASSP 2023—2023 IEEE International Conference on Acoustics, Speech and Signal Processing, Rhodes Island, Greece, 4–10 June 2023; pp. 1–5. [Google Scholar]
- Liu, W.; Lu, H.; Fu, H.; Cao, Z. Learning to Upsample by Learning to Sample. In Proceedings of the IEEE/CVF International Conference on Computer Vision (ICCV), Paris, France, 1–6 October 2023; pp. 6027–6037. [Google Scholar]
- Selvaraju, R.R.; Cogswell, M.; Das, A.; Vedantam, R.; Parikh, D.; Batra, D. Grad-CAM: Visual explanations from deep networks via gradient-based localization. In Proceedings of the IEEE International Conference on Computer Vision (ICCV); IEEE: Piscataway, NJ, USA, 2017; pp. 618–626. [Google Scholar]
- Lin, X.; Ma, L.; Liu, W.; Chang, S.-F. Context-gated convolution. In Computer Vision—ECCV 2020; Springer: Cham, Switzerland, 2020; pp. 701–718. [Google Scholar]
- Chen, J.; Kao, S.-H.; He, H.; Zhuo, W.; Wen, S.; Lee, C.-H.; Chan, S.-H.G. Run, don’t walk: Chasing higher FLOPS for faster neural networks. In Proceedings of the IEEE/CVF Conference on Computer Vision and Pattern Recognition (CVPR); IEEE: Piscataway, NJ, USA, 2023; pp. 12021–12031. [Google Scholar]
- Yu, Z.; Guan, Q.; Yang, J.; Yang, Z.; Zhou, Q.; Chen, Y.; Chen, F. LSM-YOLO: A compact and effective ROI detector for medical detection. In Neural Information Processing (ICONIP 2024); Springer: Singapore, 2025; pp. 30–44. [Google Scholar]
- Zhong, J.; Chen, J.; Mian, A. DualConv: Dual convolutional kernels for lightweight deep neural networks. IEEE Trans. Neural Netw. Learn. Syst. 2022, 34, 9528–9535. [Google Scholar] [CrossRef] [Scilit]
- Wang, C.-Y.; Yeh, I.-H.; Mark Liao, H.-Y. YOLOv9: Learning what you want to learn using programmable gradient information. In Computer Vision—ECCV 2024 (LNCS 15089); Springer: Cham, Switzerland, 2025; pp. 1–21. [Google Scholar]
- Liu, X.; Peng, H.; Zheng, N.; Yu, L.; Li, Z.; Sun, J. EfficientViT: Memory efficient vision transformer with cascaded group attention. In Proceedings of the IEEE/CVF Conference on Computer Vision and Pattern Recognition (CVPR); IEEE: Piscataway, NJ, USA, 2023; pp. 14420–14430. [Google Scholar]
- Zhang, J.; Li, X.; Li, J.; Zhang, L.; Li, W. Rethinking mobile block for efficient attention-based models. In Proceedings of the IEEE/CVF International Conference on Computer Vision (ICCV); IEEE: Piscataway, NJ, USA, 2023; pp. 1389–1400. [Google Scholar]
- Lau, K.W.; Po, L.-M.; Rehman, Y.A.U. Large separable kernel attention: Rethinking the large kernel attention design in CNN. Expert Syst. Appl. 2024, 236, 121352. [Google Scholar] [CrossRef] [Scilit]
- Hu, J.; Shen, L.; Sun, G. Squeeze-and-excitation networks. In Proceedings of the IEEE Conference on Computer Vision and Pattern Recognition (CVPR); IEEE: Piscataway, NJ, USA, 2018; pp. 7132–7141. [Google Scholar]
- Narayanan, M. SENetV2: Aggregated dense layer for channelwise and global representations. arXiv 2023, arXiv:2311.10807. [Google Scholar]
- Ren, S.; He, K.; Girshick, R.; Sun, J. Faster R-CNN: Towards real-time object detection with region proposal networks. IEEE Trans. Pattern Anal. Mach. Intell. 2017, 39, 1137–1149. [Google Scholar] [CrossRef] [Scilit] [PubMed]
- Zhao, Y.; Lv, W.; Xu, S.; Wei, J.; Wang, G.; Dang, Q.; Liu, Y.; Chen, J. DETRs beat YOLOs on real-time object detection. In Proceedings of the IEEE/CVF Conference on Computer Vision and Pattern Recognition (CVPR); IEEE: Piscataway, NJ, USA, 2024; pp. 16965–16974. [Google Scholar]
- Khanam, R.; Hussain, M. What is YOLOv5: A deep look into the internal features of the popular object detector. arXiv 2024, arXiv:2407.20892. [Google Scholar]
- Varghese, R.; Sambath, M. YOLOv8: A novel object detection algorithm with enhanced performance and robustness. In Proceedings of the International Conference on Advances in Data Engineering and Intelligent Computing Systems (ADICS); IEEE: Piscataway, NJ, USA, 2024; pp. 1–6. [Google Scholar]
- Wang, A.; Chen, H.; Liu, L.; Chen, K.; Lin, Z.; Han, J.; Ding, G. YOLOv10: Real-time end-to-end object detection. In Advances in Neural Information Processing Systems 37 (NeurIPS 2024); NeurIPS: Red Hook, NY, USA, 2024. [Google Scholar]
- Khanam, R.; Hussain, M. YOLOv11: An overview of the key architectural enhancements. arXiv 2024, arXiv:2410.17725. [Google Scholar]
- Tian, Y.; Ye, Q.; Doermann, D. YOLOv12: Attention-Centric Real-Time Object Detectors. arXiv 2025, arXiv:2502.12524. [Google Scholar]
- Yang, W.; Qiu, X. A Novel Crop Pest Detection Model Based on YOLOv5. Agriculture 2024, 14, 275. [Google Scholar] [CrossRef] [Scilit]
- Dong, Q.; Sun, L.; Han, T.; Cai, M.; Gao, C. PestLite: A Novel YOLO-Based Deep Learning Technique for Crop Pest Detection. Agriculture 2024, 14, 228. [Google Scholar] [CrossRef] [Scilit]
- Yin, J.; Huang, P.; Xiao, D.; Zhang, B. A Lightweight Rice Pest Detection Algorithm Using Improved Attention Mechanism and YOLOv8. Agriculture 2024, 14, 1052. [Google Scholar] [CrossRef] [Scilit]
- Yu, Y.; Zhou, Q.; Wang, H.; Lv, K.; Zhang, L.; Li, J.; Li, D. LP-YOLO: A Lightweight Object Detection Network Regarding Insect Pests for Mobile Terminal Devices Based on Improved YOLOv8. Agriculture 2024, 14, 1420. [Google Scholar] [CrossRef] [Scilit]
- Liu, Y.; Wang, Q.; Zheng, Q.; Liu, Y. YOLO-Wheat: A More Accurate Real-Time Detection Algorithm for Wheat Pests. Agriculture 2024, 14, 2244. [Google Scholar] [CrossRef] [Scilit]
- Wang, Z.; Zhang, S.; Chen, L.; Wu, W.; Wang, H.; Liu, X.; Fan, Z.; Wang, B. Microscopic Insect Pest Detection in Tea Plantations: Improved YOLOv8 Model Based on Deep Learning. Agriculture 2024, 14, 1739. [Google Scholar] [CrossRef] [Scilit]
- Yin, J.; Zhu, J.; Chen, G.; Jiang, L.; Zhan, H.; Deng, H.; Long, Y.; Lan, Y.; Wu, B.; Xu, H. An Intelligent Field Monitoring System Based on Enhanced YOLO-RMD Architecture for Real-Time Rice Pest Detection and Management. Agriculture 2025, 15, 798. [Google Scholar] [CrossRef] [Scilit]
- Huang, Y.; Zhang, Y.; Yan, J.; Zhang, C.; Gao, P.; Lv, X. Automated detection of cotton aphids (Aphis gossypii Glover) using a bi-enhanced attention mechanism and domain-adaptive transfer learning strategy. Artif. Intell. Rev. 2026, 59, 76. [Google Scholar] [CrossRef] [Scilit]
- Zhang, T.; Li, K.; Chen, X.; Zhong, C.; Luo, B.; Grijalva, I.; McCornack, B.; Flippo, D.; Sharda, A.; Wang, G. Aphid cluster recognition and detection in the wild using deep learning models. Sci. Rep. 2023, 13, 13410. [Google Scholar] [CrossRef] [Scilit] [PubMed]
- Xu, X.; Shi, J.; Chen, Y.; He, Q.; Liu, L.; Sun, T.; Ding, R.; Lu, Y.; Xue, C.; Qiao, H. Research on machine vision and deep learning based recognition of cotton seedling aphid infestation level. Front. Plant Sci. 2023, 14, 1200901. [Google Scholar] [CrossRef] [Scilit] [PubMed]



Disclaimer/Publisher’s Note: The statements, opinions and data contained in all publications are solely those of the individual author(s) and contributor(s) and not of MDPI and/or the editor(s). MDPI and/or the editor(s) disclaim responsibility for any injury to people or property resulting from any ideas, methods, instructions or products referred to in the content. |
© 2026 by the authors. Licensee MDPI, Basel, Switzerland. This article is an open access article distributed under the terms and conditions of the Creative Commons Attribution (CC BY) license.