


Abstract
Rural revitalization relies on both industrial upgrading and cultural reinvigoration. Tea-culture–tourism integration has been regarded as a potentially effective route for advancing rural revitalization, yet its interactive relationship and dynamic evolution remain insufficiently understood. Based on provincial-level panel data from 18 major tea-producing provinces in China between 2013 and 2022, this study constructs two comprehensive evaluation index systems for tea–culture–tourism integration and rural revitalization. It employs the entropy weight method, the coupling coordination degree model, the Dagum Gini coefficient decomposition, and spatial econometric models to measure their coupling coordination degree and analyze its spatiotemporal pattern, regional disparities, and driving factors. The main findings are as follows: (1) Both tea–culture–tourism integration and rural revitalization exhibited upward trends, with the latter being consistently higher. (2) The coupling coordination degree transitioned from dissonance to coordination, spatially forming a gradient progression pattern of “coastal-river-inland”. (3) Regional disparities were primarily dominated by transvariation density and inter-regional differences. (4) Results of spatial econometric models indicated that fiscal conditions exerted a significant positive direct effect, while urban–rural social development, employment structure, and human capital generated significant positive direct and indirect effects.
1. Introduction
The issue of imbalanced urban-rural development is becoming increasingly prominent, manifested in phenomena such as rural population outflow [1], and relative poverty [2,3], which have become a critical development challenge in China. In this context, rural revitalization, as a key strategy to address the urban-rural dual structure, has been elevated to a pivotal position in national policy systems [1]. China’s No. 1 Central Document for 2024 particularly emphasizes the need to stimulate rural development momentum by promoting the integration of primary, secondary, and tertiary industries and cultivating new industries, formats, and models [4].
In agricultural areas of China, the development of tea, culture, and tourism aligns closely with the goal of rural revitalization. The tea industry is a pillar of traditional industry in China’s rural revitalization, playing a core role in promoting rural economic development, promoting agricultural industrial structure, and improving regional ecological environment [5]. The tourism industry, due to its strong multiplier effect, can effectively leverage the synergy of multiple industries [6], becoming a new driving force for rural revitalization [7]. Cultural resources contain ecological wisdom of harmonious coexistence and the relationship between people and nature, providing important cultural support for rural revitalization and sustainable development [8]. More importantly, tea, culture, and tourism are closely interconnected, and their organic integration will yield greater effectiveness. The tea industry, with its unique cultural significance and social value, demonstrates tremendous potential for deep integration with the tourism industry [9]. The integration of tea and tourism can not only achieve diversification of industry profits through the development of experience activities related to tea cultivation and processing [10], but also promote the development of related cultural-creative products [11] and the prosperity of the surrounding commercial ecosystem [12], forming a complete industry chain value network. The integration of culture provides an internal driving force for industrial integration. By preserving, protecting, and utilizing intangible cultural heritage, it promotes broader integration and development within the tea–culture–tourism sector. This approach enhances the cultural significance of tea products and tourism products, elevates the cultural value-added of tea products, and enriches the tourism consumption experience [13]. Multiple studies have proposed that the integration of tea, culture, and tourism (hereafter TCT integration) as a new model of the integration of primary, secondary, and tertiary industries plays a crucial role in fostering economic growth, cultural prosperity, and social harmony in rural areas, serving as a critical pathway for rural revitalization [14,15].
Owing to the still-low level of TCT integration [13,16,17], disorderly exploitation of tea and tourism resources, extensive and inefficient industry growth, and over-capacity operation of destinations have become common. Moreover, when tourism is merely treated as a simple development tool, its benefits tend to concentrate among limited groups, with tourism income and employment opportunities failing to widely benefit local communities [18]. In the long run, widening income disparities within communities may create social problems [16], making it fundamentally inadequate for addressing rural revitalization challenges. This situation has somewhat impeded the progress of the rural revitalization strategy. Lagging rural revitalization will further affect rural infrastructure construction and community participation, thereby constraining the sustainable development of TCT integration. Therefore, it is imperative to establish a virtuous interaction mechanism between rural revitalization and TCT integration. Guided by the rural revitalization strategy, we should promote high-quality integration of TCT through scientific planning, ecological protection, and community participation. Simultaneously, by leveraging the economic, ecological, and social benefits generated from this integration, we can feed back into comprehensive rural development. Ultimately, this will achieve a sustainable development pattern featuring prosperous industries, ecological livability, and civilized rural ethos. Such a mutually reinforcing and coordinated relationship represents the effective pathway to overcome current development dilemmas and realize rural revitalization.
Coupling coordination refers to the interaction and mutual influence between two or more systems based on specific connections [19], where the coupling relationship between systems or elements evolves over time, progressing from disharmony to coordination [20]. The coordinated symbiosis between TCT integration and rural revitalization exerts significant impacts on regional comprehensive development. However, extant research has largely centered on defining tea tourism [21], describing its status [22], examining industry interactions [17], and delineating integration mechanisms and pathways [23]. Few scholars have paid attention to quantifying the coupling coordination relationship between TCT integration and rural revitalization. The existing studies have depicted the nexus between tea tourism and rural revitalization. For example, Shen et al. (2022) argued that, during tea tourism activities, sense of place, key leadership, and local talent participation shaped regional cultural and industrial characteristics, thereby revitalizing ancient villages [24]. Xu et al. (2022) thought that the evolution of tea tourism served as a conduit for enhancing residents’ livelihoods and quality of life, turning the situation of rural residents’ outflow to inflow, and achieving various aspects of rural revitalization [25]. Overall, deficiencies in the extant studies on the interaction between TCT integration and rural revitalization lie in two aspects. On one hand, existing discussions predominantly remain at the theoretical level of how TCT integration unidirectionally promotes rural revitalization, lacking in-depth exploration of their bidirectional interaction mechanisms. On the other hand, there is currently a scarcity of quantitative research on the relationship between TCT integration and rural revitalization, as well as insufficient dynamic analysis of their relationship, making it impossible to reveal their evolutionary patterns.
To fill the research gaps, this study first establishes a coupling coordination system between TCT integration and rural revitalization and then analyzes the synergistic relationship between them. Accordingly, this research aims to answer the following research questions (RQs):
RQ1. What is the spatiotemporal evolution pattern of the coupling coordination degree between TCT integration and rural revitalization across 18 major tea-producing provinces in China?
RQ2. What are the characteristics and sources of regional disparities in the coupling coordination degree across the 18 tea-producing provinces?
RQ3. What are the key driving factors influencing the coupling coordination degree, and do these factors exhibit spatial spillover effects?
The primary contributions of our study are as follows: (1) constructing a novel comprehensive indicator system to quantify the coupling coordination relationship between TCT integration and rural revitalization; (2) integrating coupling coordination degree assessment with the Dagum Gini coefficient decomposition to precisely uncover the spatiotemporal evolution and regional disparities of the coupling coordination degree; and (3) employing spatial econometric models to identify key drivers and their spatial spillover effects, thereby informing cross-regional coordinated policies.
2. Coupling Coordination Mechanism
The rural revitalization strategy, as a key initiative for national socioeconomic development, emphasizes the utilization of indigenous resources and adheres to the principle of adapting to local conditions to foster new industries, new business formats, and new models, thereby achieving the development goals of “strong agriculture, beautiful countryside, and prosperous farmers” [26]. The tea industry serves as a traditional pillar for rural economic development, while the cultural industry provides key enabling support for rural revitalization, and the tourism industry acts as a major driving force. The tripartite integration and mutual reinforcement of these sectors play a vital role in advancing both the rural revitalization strategy and regional coordinated development [13].
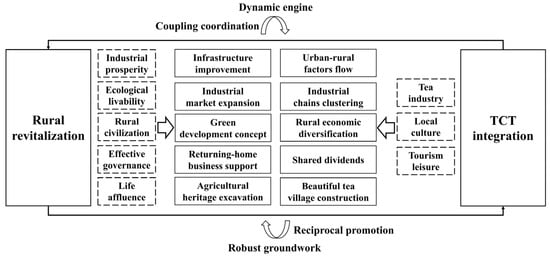
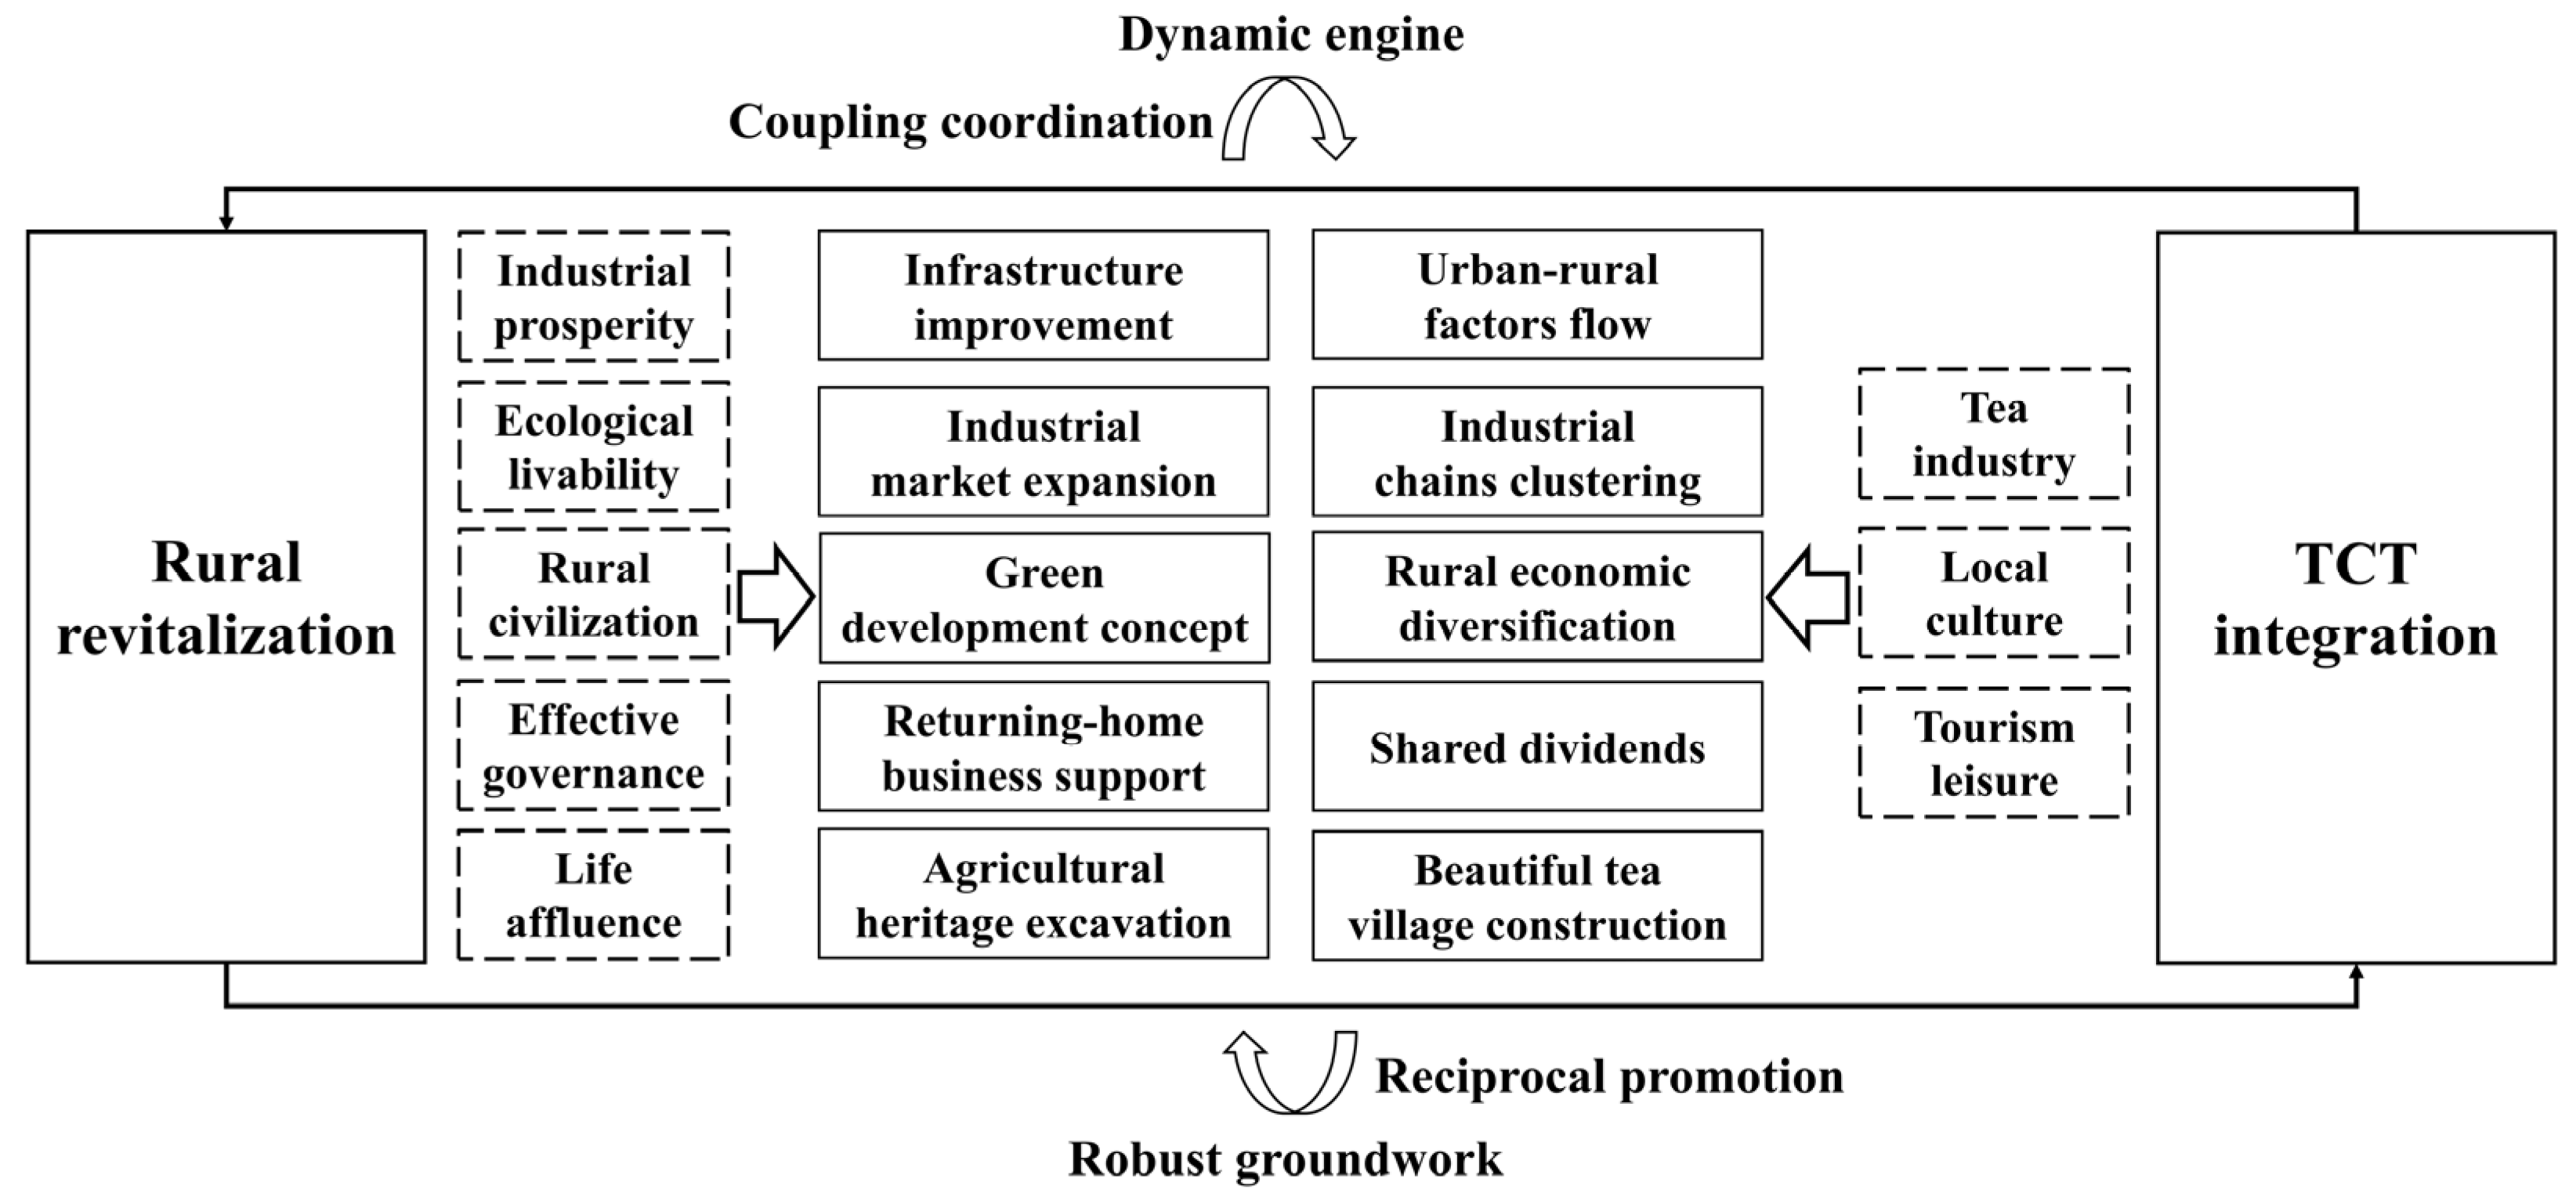
TCT integration breaks down traditional industry barriers through the integration of technology, markets, and resources. By deeply combining tea cultivation, cultural heritage preservation, and rural tourism, it promotes interconnected rural industries, cultural innovation, and increased farmer incomes [15]. Thus, both TCT integration and rural revitalization form a “bidirectional coupling” relationship (Figure 1), where each promotes the other’s progress. Rural revitalization necessitates TCT integration as a catalyst, while TCT integration relies on rural revitalization for foundational support. Their coupling paves the way for modernized agricultural development.
Figure 1.
Coupling coordination mechanism of TCT integration and rural revitalization.
On the one hand, rural revitalization provides multidimensional support for TCT integration. In terms of infrastructure, the improvement of rural transportation networks and digital infrastructure has significantly enhanced the accessibility and smart development level of tea-producing regions, laying a solid material foundation for the development of TCT integration. In terms of policy support, the rural revitalization strategy has fostered a favorable market environment and provided clear industrial development guidance for TCT integration. This enables relevant enterprises to diversify financing channels, reduce operational costs, effectively implement industrial policies, and expand market reach [13]. In terms of development philosophy, the industrial paradigm has shifted from “extensive growth” to “refined governance”, adhering to the “clear waters and lush mountains are invaluable assets” principle to amplify the ecological value-added benefits of rural areas [27], thereby paving the way for green development in the countryside. In terms of socioeconomic benefits, rural revitalization has encouraged migrant workers and university graduates to return home and start businesses, providing quality human resources for tea industry R&D and rural tourism development [24], thereby effectively enhancing the value-added potential of traditional tea production. Furthermore, under the rural revitalization strategy’s dual emphasis on constructing harmonious villages and creating livable, workable communities, the agritourism integration model anchored by agricultural heritage systems has emerged as a pivotal driver for structural transformation and innovation within modern rural industrial systems, establishing a systematic framework for TCT integration [15].
On the other hand, TCT integration effectively drives comprehensive rural revitalization. Firstly, with the support of tourism, it breaks down geographical isolation in rural areas, establishing channels for urban-rural factor flow. This facilitates the movement of talent, social capital, and digital technologies into rural areas, promoting balanced allocation of urban and rural resources [28]. Secondly, TCT integration accelerates the upgrading of rural industrial structures and fosters the development of a TCT cluster. This cluster model leverages synergy effects, strengthens economies of scale and agglomeration, and enhances the overall competitiveness of the rural economy. New business formats—such as tea education, cultural training, tea tourism, tea-themed creative products, and tea trading—have emerged, creating a development paradigm characterized by large-scale plantations, park-based processing, brand-oriented marketing, technology-driven demonstration, and interactive tourism integration, thereby boosting the sustainability of rural development. Thirdly, TCT integration generates diverse employment opportunities through tea-related tourism, creating income streams that forge closer links between tea estates and the travel sector across all participants in the tea industry. Beyond this, it can also benefit local agriculture, culture, arts, and handicrafts, supporting businesses ranging from micro-enterprises to firms that cater specifically to visitors in tea-origin areas [29]. This process opens new spaces of employment and empowerment for women in tea villages, thereby revitalizing households and the wider community, and re-energizing settlements that had been in decline [30,31]. Fourthly, TCT integration facilitates the exploration of innovative pathways for rural revitalization. By centering on the tea industry and synergizing with ecotourism, recreational tourism, cultural experiences, and wellness tourism, it enables the creation of distinctive tea-themed leisure destinations. This approach not only safeguards rural ecological environments but also revitalizes rural consumer markets, enhances regional brand influence, and achieves a dual win of ecological preservation and economic benefits [32].
In conclusion, rural revitalization establishes the groundwork for TCT integration, which in turn serves as a dynamic engine for rural revitalization. Their coupling coordination necessitates focused development of specific TCT projects, deepened revitalization policies, and accelerated agricultural modernization. By fostering industrial synergies, cultural empowerment, and ecological conservation, this approach achieves profound integration and complementary advantages between TCT integration and rural development. Consequently, it enhances industrial upgrading and efficiency, facilitates innovative preservation of traditional culture, ensures continuous ecological improvement, and ultimately drives comprehensive rural revitalization and sustainable development.
3. Materials and Methods
3.1. Study Area
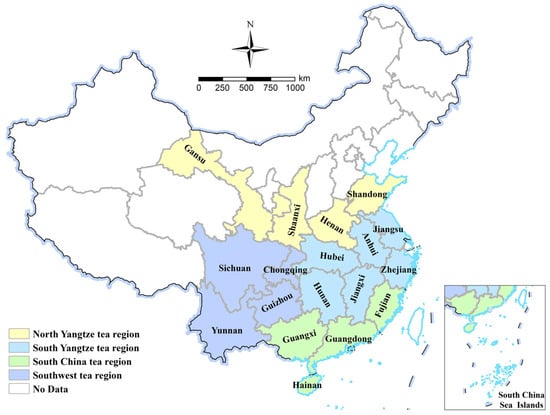
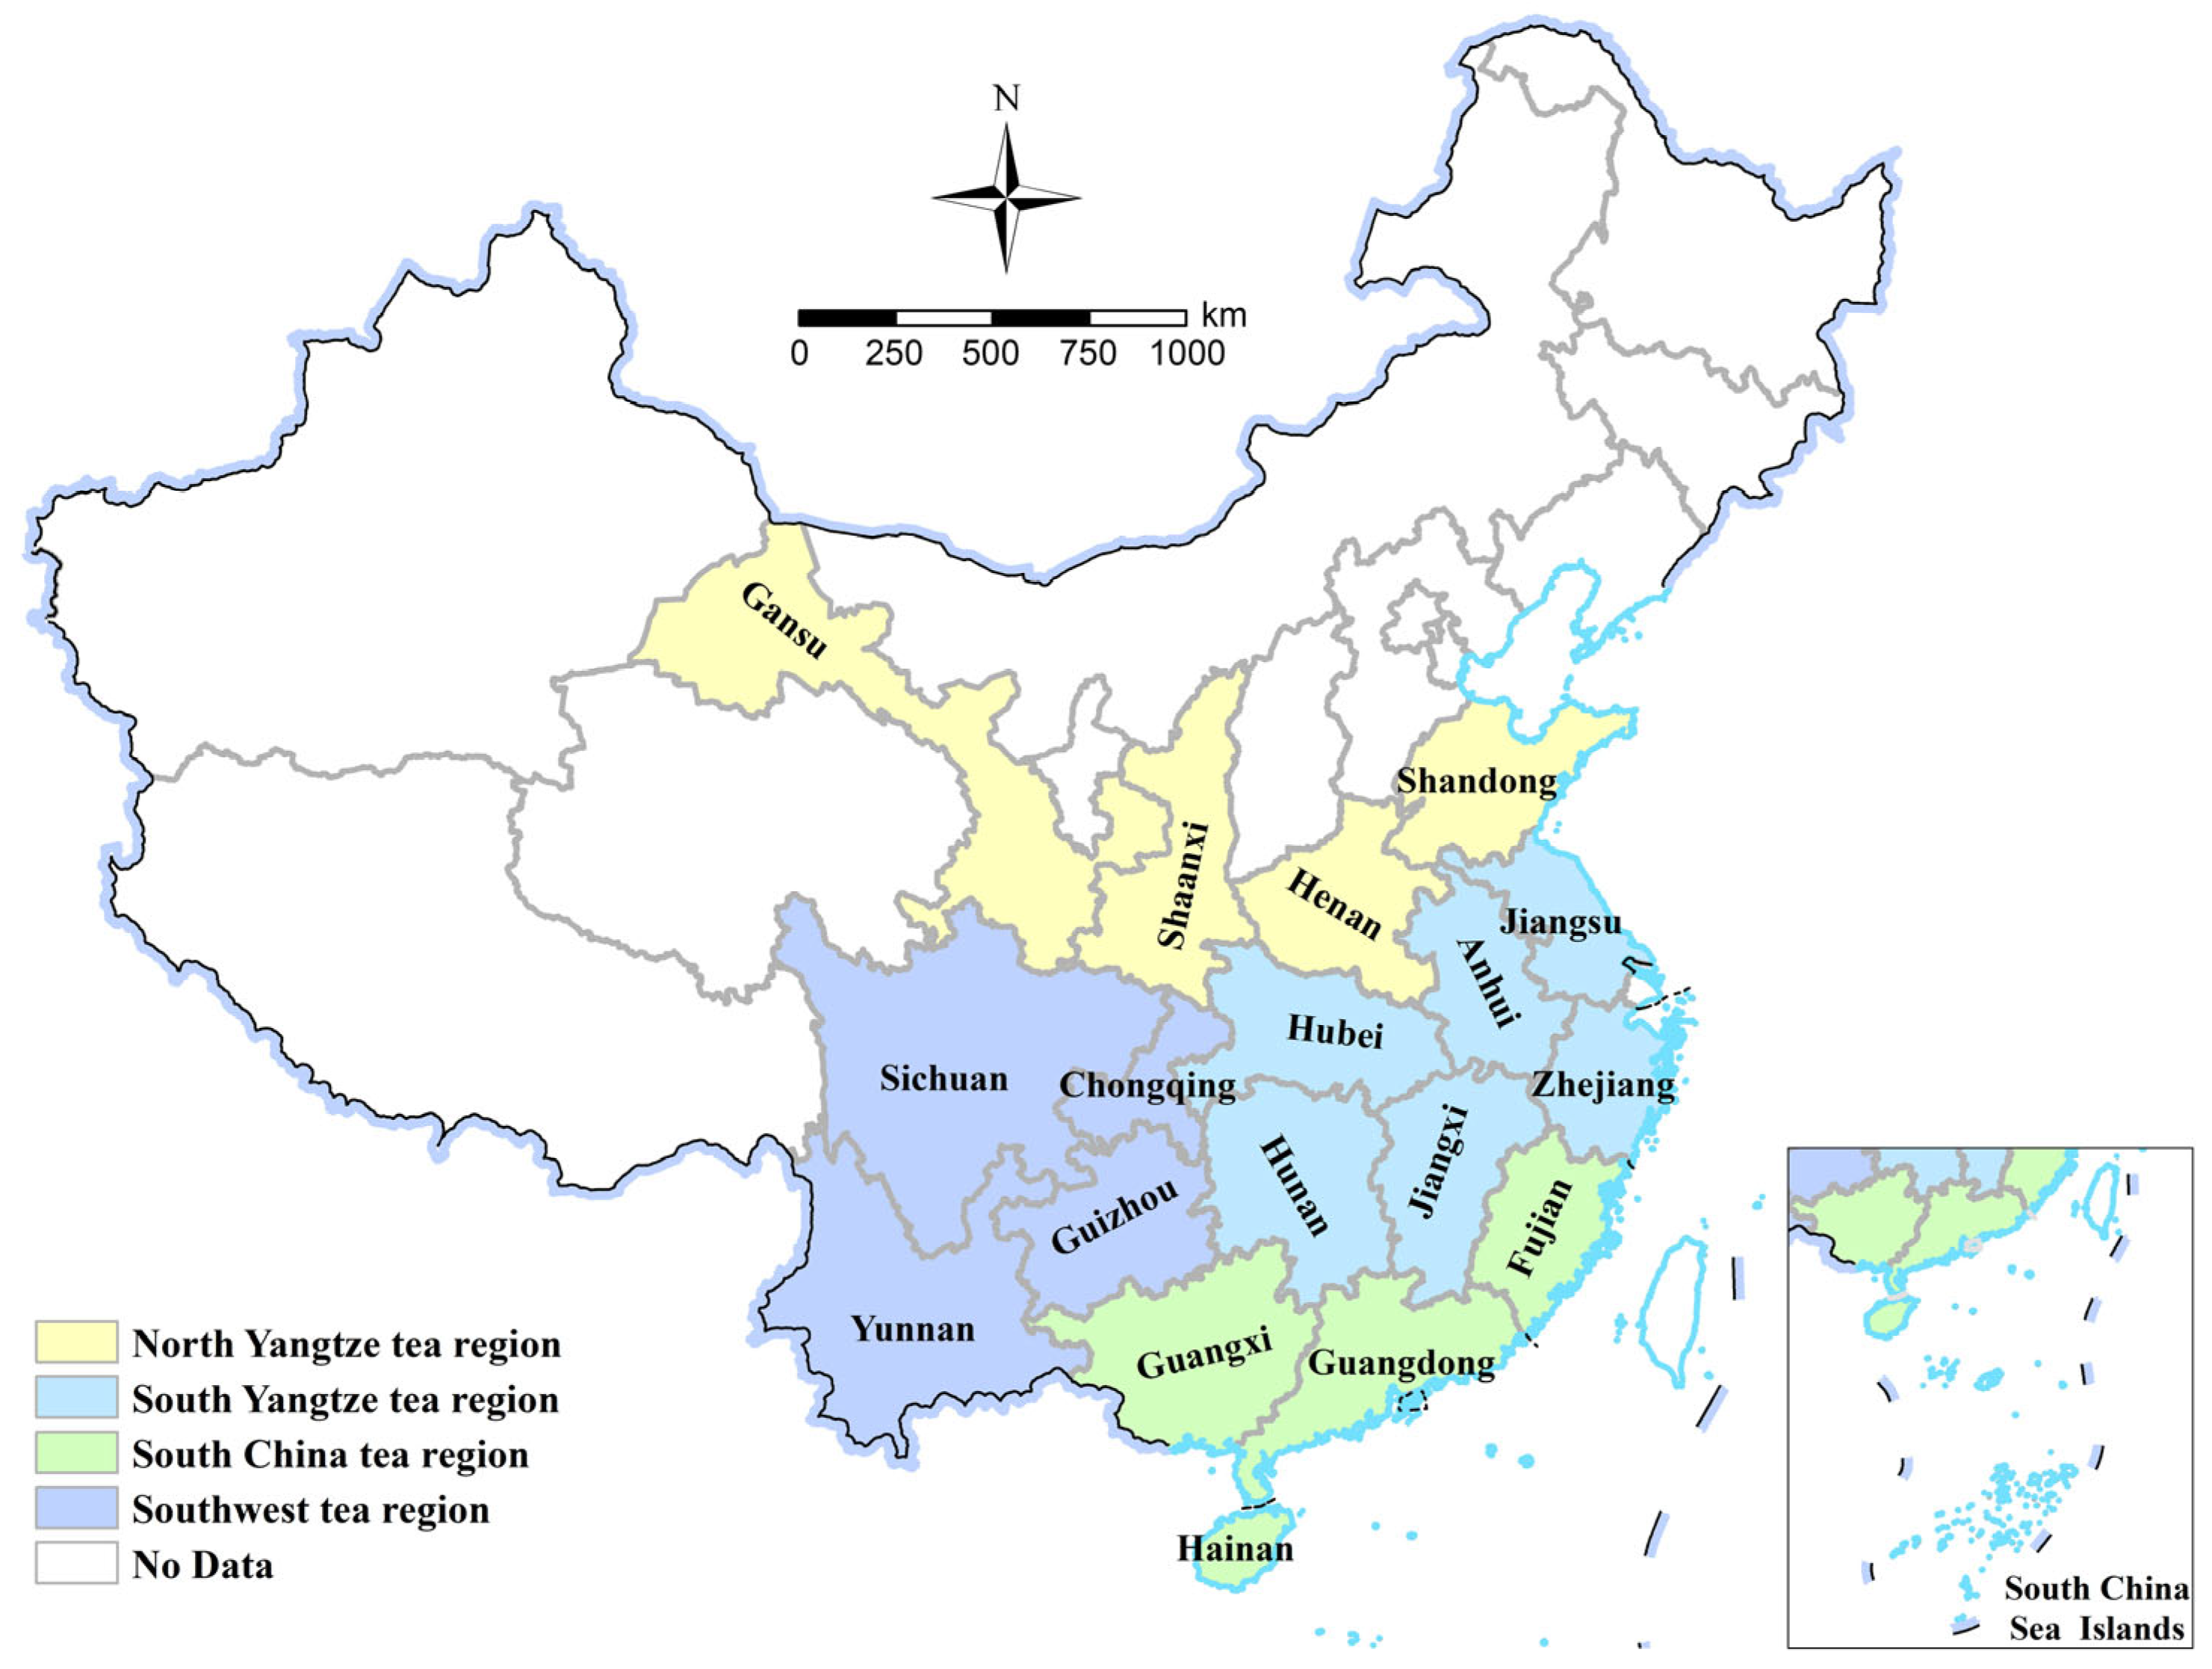
China, as the world’s largest tea producer with centuries-old cultivation traditions [33], mainly distributes its tea-producing regions across 18 provinces (Figure 2). Based on variations in natural endowments, tea cultivars, and product types, these areas are classified into four major regions: the Southwest Tea Region (SWTR), the North Yangtze Tea Region (NYTR), the South Yangtze Tea Region (SYTR), and the South China Tea Region (SCTR). These provinces exhibit diverse ecological conditions yielding distinctive, renowned teas, while their ethnic and cultural diversity fosters unique tea traditions. Complemented by rural revitalization policies, the regions’ abundant tea resources and cultural heritage form a solid foundation for TCT integration. This study, therefore, examines 18 tea-producing provinces to elucidate the interaction mechanism between TCT integration and rural revitalization across different regional contexts.
Figure 2.
Study area. Note: The data is based on vector data downloaded from the Tianditu Service Center (https://cloudcenter.tianditu.gov.cn/) (accessed on 23 March 2025), and the platform displays the review number: GS (2024) 0650.
3.2. Entropy Weight Method and Evaluation Scores
We follow Yang et al.’s study [17] to apply the entropy weight method to calculate the scores of development levels of TCT integration and rural revitalization across 18 Chinese provinces from 2013 to 2022. It has a merit that it is an objective weighting method that calculates the information entropy of indicators and determines the weight of each indicator based on its relative changes, thereby effectively avoiding subjective influences [34]. The weight and the calculation of the scores are written as below:
where represents the weight of indicator j calculated from the entropy weight method, and is the entropy. denotes the standardized indicators by the min-max normalization approach. indicates the comprehensive evaluation score of province j. Using the above formula, we calculated the comprehensive scores of TCT integration and rural revitalization for each province over the sample period.
3.3. Coupling Coordination Degree Model
The concept of coupling originates in physics, referring to the intensity of interaction between two or more systems [35,36]. Building on coupling theory, this study defined the interaction between TCT integration and rural revitalization as a coupled phenomenon and employed the coupling coordination model to quantify this relationship. Based on the coupling system model from physics, we constructed the following coupling degree (CD) model for TCT integration and rural revitalization [37]:
where defines the CD, and are the comprehensive evaluation values of TCT integration and rural revitalization, respectively. Drawing upon established research [38], the CD can be categorized into four levels, which are given in Table 1.
Table 1.
Definitions of coupling levels.
Since the CD only reflects the intensity of interaction between TCT integration and rural revitalization but cannot indicate their coordination quality, this study developed the coupling coordination degree (CCD) model to analyze the coordinated development level between these two subsystems across regions. The calculation formula is as follows:
where is the CCD, denotes the comprehensive evaluation scores of TCT integration and rural revitalization, and the coefficients and represent their respective contributions. Building on prior research demonstrating the equal importance of both subsystems’ development levels [26], the coefficients and were both set to 0.5. With reference to a previous study [39], we classified the CCD into ten levels, which are listed in Table 2.
Table 2.
Definitions of coordination levels.
3.4. Dagum Gini Coefficient and Its Decomposition
Dagum introduced the Dagum Gini coefficient to refine the decomposition of income inequality’s Gini coefficient, addressing limitations inherent in both the traditional Gini coefficient and the Theil index. The Dagum Gini coefficient overcomes the limitations of sample overlap in regional disparity measurements and ensures a comprehensive consideration of subsample distributions. We utilized this method to examine the regional differences in the CCD between TCT integration and rural revitalization. Referring to Lerman and Shlomo [40], the specific calculation equation is as follows:
In Equations (6)–(14), represents the Gini coefficient, and represent the intra-regional and inter-regional Gini coefficient, respectively. , , and represent the source of inter-group differences, intra-group differences, and transvariation density, respectively. represents the average CCD. represents the CCD of the -th province in region . represents the CCD of the -th city in region . is 18, represents the number of regional divisions, and represents the number of provinces in region . is the relative impact of CCD between regions and , and is the difference in CCD contribution rates between regions.
A high intra-regional Gini coefficient () indicates internal development disparities, necessitating targeted local policies. A high inter-regional Gini coefficient () reflects prominent regional gaps, calling for enhanced regional coordinated development. A significant transvariation density () suggests that CCD levels exhibit substantial cross-regional overlap, implying that policies based solely on regional averages are insufficient and should be replaced by more refined, province-specific strategies alongside cross-regional learning. Therefore, the key lies in analyzing the contributions of these three components to accurately identify the main sources of CCD spatial differentiation and implement corresponding measures.
3.5. Spatial Econometric Model
As indicated in the maps, high scores tend to be clustered spatially, which may indicate spatial autocorrelation. In this sense, spatial dependence should be incorporated in the regression models when examining what drives the coupling coordination level. Empirically, the spatial econometric model is an effective way to capture spatial effects and quantify spatial spillovers. The most general spatial econometric models can be described as follows [41]:
where y is the dependent variable, i.e., CCD integration in this study. is a spatial weights matrix. is the spatial lag of the dependent variable, which is used to capture the spatial spillover of the CCD. is an unknown parameter to be estimated, which is called spatial autoregressive coefficient. If is significant, it implies spatial effect of the dependent variable. denotes a set of explanatory variables and s are the unknown coefficients of the explanatory variable. In this study, drawing on the existing research outcomes in the academic field [42], we control for four explanatory variables, namely, fiscal condition, urban-rural community development, employment structure, and human capital level. Similarly, WX represents a set of spatial lags of the explanatory variables. is the unknown parameter of the spatial lags of the explanatory variables. and are the spatial and time-period fixed effects, respectively. is the random disturbance term. is the spatial autocorrelation coefficient, and is an idiosyncratic component.
A variety of commonly used models may result in different settings. They are the following.
- (1)
- , and , it is simplified to spatial autoregressive model;
- (2)
- , and , it is simplified to spatial error model;
- (3)
- , , and , it is simplified to spatial Durbin model (SDM);
- (4)
- , , and , it is simplified to spatial Durbin error model.
Empirically, SDM has been adopted in the existing studies since it has a couple of advantages [43]. Hence, we apply the SDM to identify the driving factors of the coupling coordination levels. In addition, to confirm that SDM overperforms the other spatial econometric models, we perform several tests.
In addition, referring to the relevant research results [44,45,46], the definitions, units, and descriptive statistics of the driving factors of CCD between TCT integration and rural revitalization are presented in Table 3.
Table 3.
Definitions, units, and descriptive statistics of the driving factors of CCD.
3.6. Comprehensive Evaluation Indicators
This study conceptualized TCT integration and rural revitalization as interacting, coupled systems. Following the principles of scientific rigor and data availability, and referring to the relevant research results, we constructed two evaluation index systems. One is the indicator system for evaluating the TCT integration, which comprises three dimensions, namely, tea industry development, cultural industry development, and tourism industry development. The weight for each indicator in this system is determined using the entropy weight method, which is shown in Table 4.
Table 4.
Indicator system of TCT integration.
The other is the indicator system for evaluating the rural revitalization subsystem, which is structured into five dimensions, including prosperous industry, ecological livability, civilized countryside, effective governance, and affluent living. The corresponding indicator weights, which are determined by the entropy weight method, are shown in Table 5.
Table 5.
Indicator system of rural revitalization.
3.7. Data Sources
This study employed panel data from 18 tea-producing provinces in China, with statistical indicators primarily sourced from authoritative yearbooks, including the China Statistical Yearbook, China Rural Statistical Yearbook, China Urban-Rural Construction Statistical Yearbook, China Social Statistical Yearbook, China Culture and Tourism Statistical Yearbook, China Civil Affairs Statistical Yearbook, China Population and Employment Statistical Yearbook, China Health Statistical Yearbook, Statistical Bulletin of National Economic and Social Development, and China Cultural and Related Industries Statistical Yearbook, supplemented by official reports from the China Tea Marketing Association. To ensure data completeness, missing values were systematically addressed through linear interpolation or mean imputation methods.
4. Empirical Results
4.1. Scores of TCT Integration and Rural Revitalization
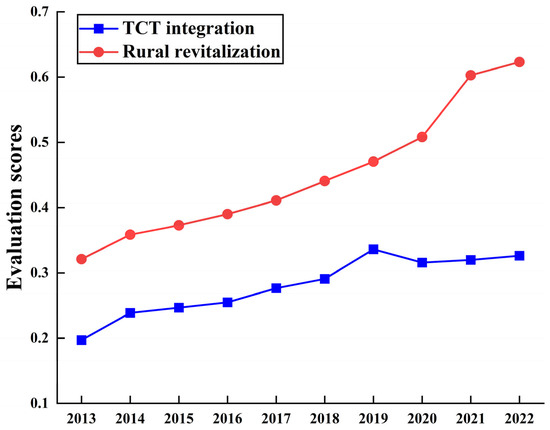
We utilized Equations (1) and (2) to calculate the comprehensive evaluation scores for both TCT integration and rural revitalization across 18 provinces during 2013–2022. The annual development levels were derived by averaging these provincial scores, and the trends are presented in Figure 3.
Figure 3.
Scores of TCT integration and rural revitalization from 2013 to 2022.
We find that China’s TCT integration and rural revitalization exhibited coordinated yet phased growth patterns over the sample period. From 2013 to 2019, both of them showed parallel development trajectories, indicating strong synergistic progress. However, a notable divergence emerged beginning in 2019. This divergence was driven by two key regime shifts: a 2019 dip in TCT integration due to the COVID-19 pandemic, and a 2020 surge in rural revitalization resulting from policy acceleration. Nevertheless, TCT integration displayed significant resilience, initiating a steady recovery from 2020 onward. This recovery was primarily facilitated by adaptive strategies such as product diversification and the shift toward domestic tourism substitution. These pathways not only supported the short-term rebound but also showed potential to persist, thereby underpinning the sector’s potential for future consolidation.
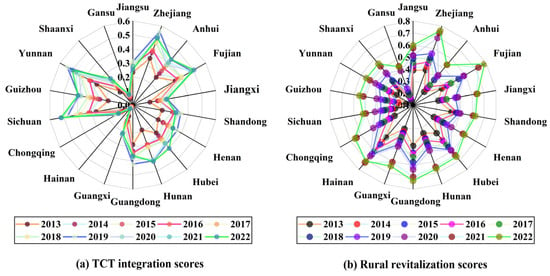
In addition, the comprehensive evaluation scores of TCT integration and rural revitalization across 18 provinces from 2013 to 2022 are visualized in Figure 4a and Figure 4b, respectively.
Figure 4.
Comprehensive evaluation scores for two subsystems in 18 provinces during 2013–2022.
As shown in Figure 4a, provincial-level TCT integration demonstrated an overall upward trend from 2013 to 2022. However, most provinces experienced declining scores during 2020–2022 due to the pandemic. In addition, it also revealed significant spatial heterogeneity in TCT integration across provinces. Specifically, the southeastern coastal provinces (e.g., Zhejiang and Fujian) and traditional southwest tea regions (e.g., Yunnan and Sichuan) maintained leading positions, with scores in 2022 ranging from 0.4 to 0.6. This advantage was primarily attributed to their established tea industry history, abundant cultural and tourism resources, and well-developed tourism infrastructure. Central provinces (e.g., Hubei and Hunan) exhibited steady growth, closely associated with their expanding tea industry scale and brand development. In contrast, northwestern (e.g., Gansu) and certain southern provinces (e.g., Hainan) lagged behind, constrained by factors including limited tea cultivation scale, underdeveloped tea culture IP, and inadequate tourism facilities. The formation of this spatial pattern was not only affected by the traditional tea industry base, but also related to the degree of development of regional culture and tourism resources. This distinct spatial pattern reflected the combined influence of historical tea industry foundations and differential levels of culture-tourism resources exploitation across regions.
As shown in Figure 4b, provincial rural revitalization levels exhibited consistent improvement across China from 2013 to 2022, with particularly accelerated progress after 2020 corresponding to the nationwide implementation of the rural revitalization strategy. Distinct spatial variations in rural revitalization development were identified. Specifically, several central-western provinces (e.g., Hubei, Sichuan, Yunnan) and northwestern regions (e.g., Shaanxi, Gansu) demonstrated outstanding performance. This achievement primarily resulted from policy synergy between poverty alleviation and rural revitalization initiatives, combined with the compounding effects of unique resource endowments. In contrast, eastern coastal regions (e.g., Jiangsu, Anhui, Fujian) and some central-western areas (e.g., Jiangxi) showed relatively slower progress. These regional differences not only underscored the focused orientation of policy implementation but also revealed the distinctive challenges encountered in rural revitalization across different regions, providing valuable evidence for formulating differentiated support policies.
4.2. Coupling Coordination Degrees
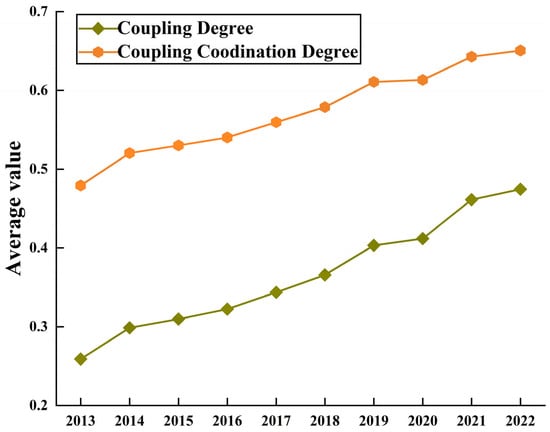
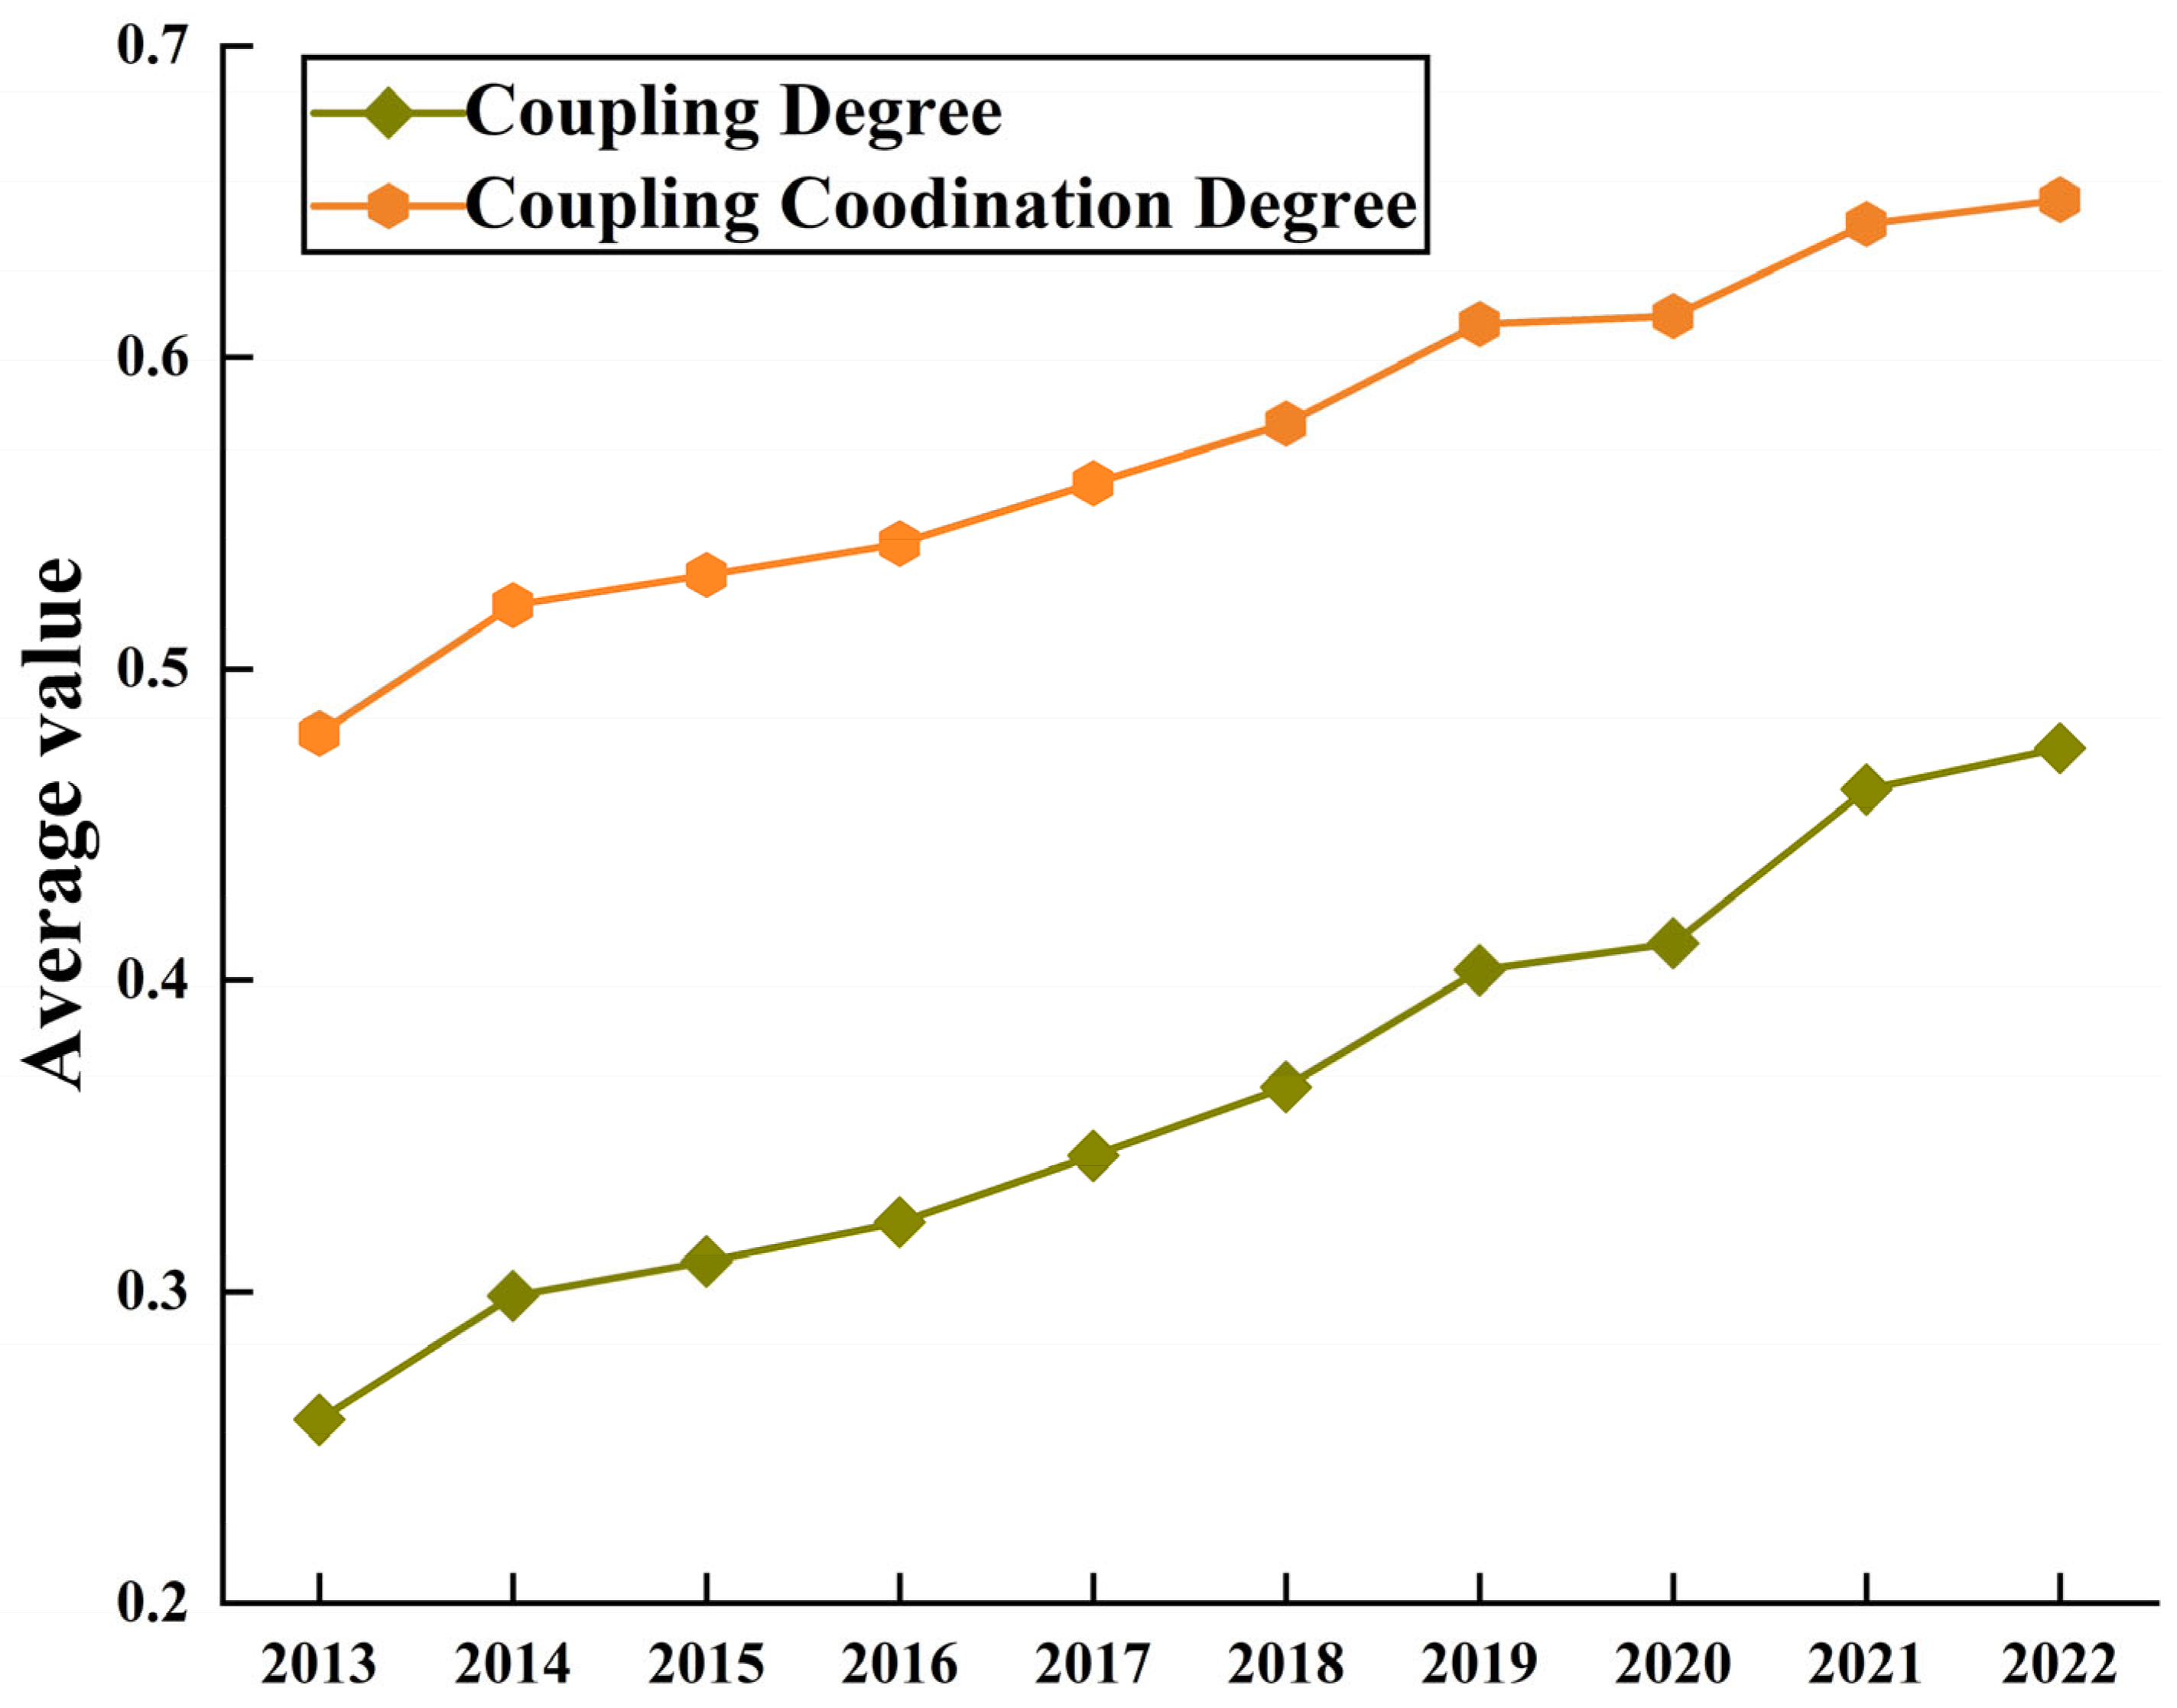
Based on the comprehensive development scores of the two systems, we calculated CDs and CCDs using Equations (3) and (5), respectively. The average values of CDs and CCDs across 18 provinces are plotted in Figure 5.
Figure 5.
CDs and CCDs between TCT integration and rural revitalization from 2013 to 2022.
We observe that the average CDs and CCDs of 18 provinces in China exhibited a fluctuating upward trend from 2013 to 2022. Specifically, the average CDs showed remarkable growth from 0.259 to 0.475 during this period, with a growth rate of 83.40%, developing from the low-level coupling stage to the antagonistic coupling stage. On the other hand, the average CCD increased from 0.479 to 0.651, with a growth rate of 35.91%, transitioning from the imminent imbalance stage to the primary coordination stage. The trends demonstrated a coupling relationship between TCT integration and rural revitalization, where mutual reinforcement could not only facilitate benign coupling but also enhance synergistic effects, ultimately promoting higher-level coordinated development.
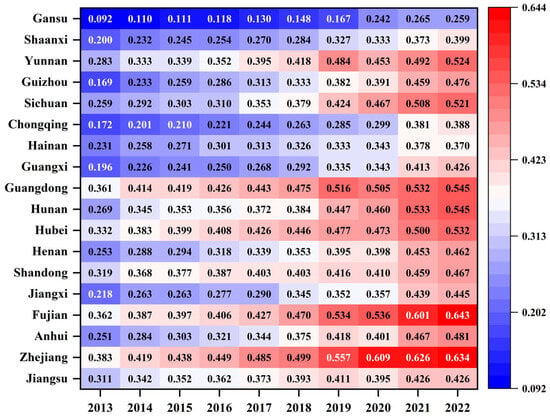
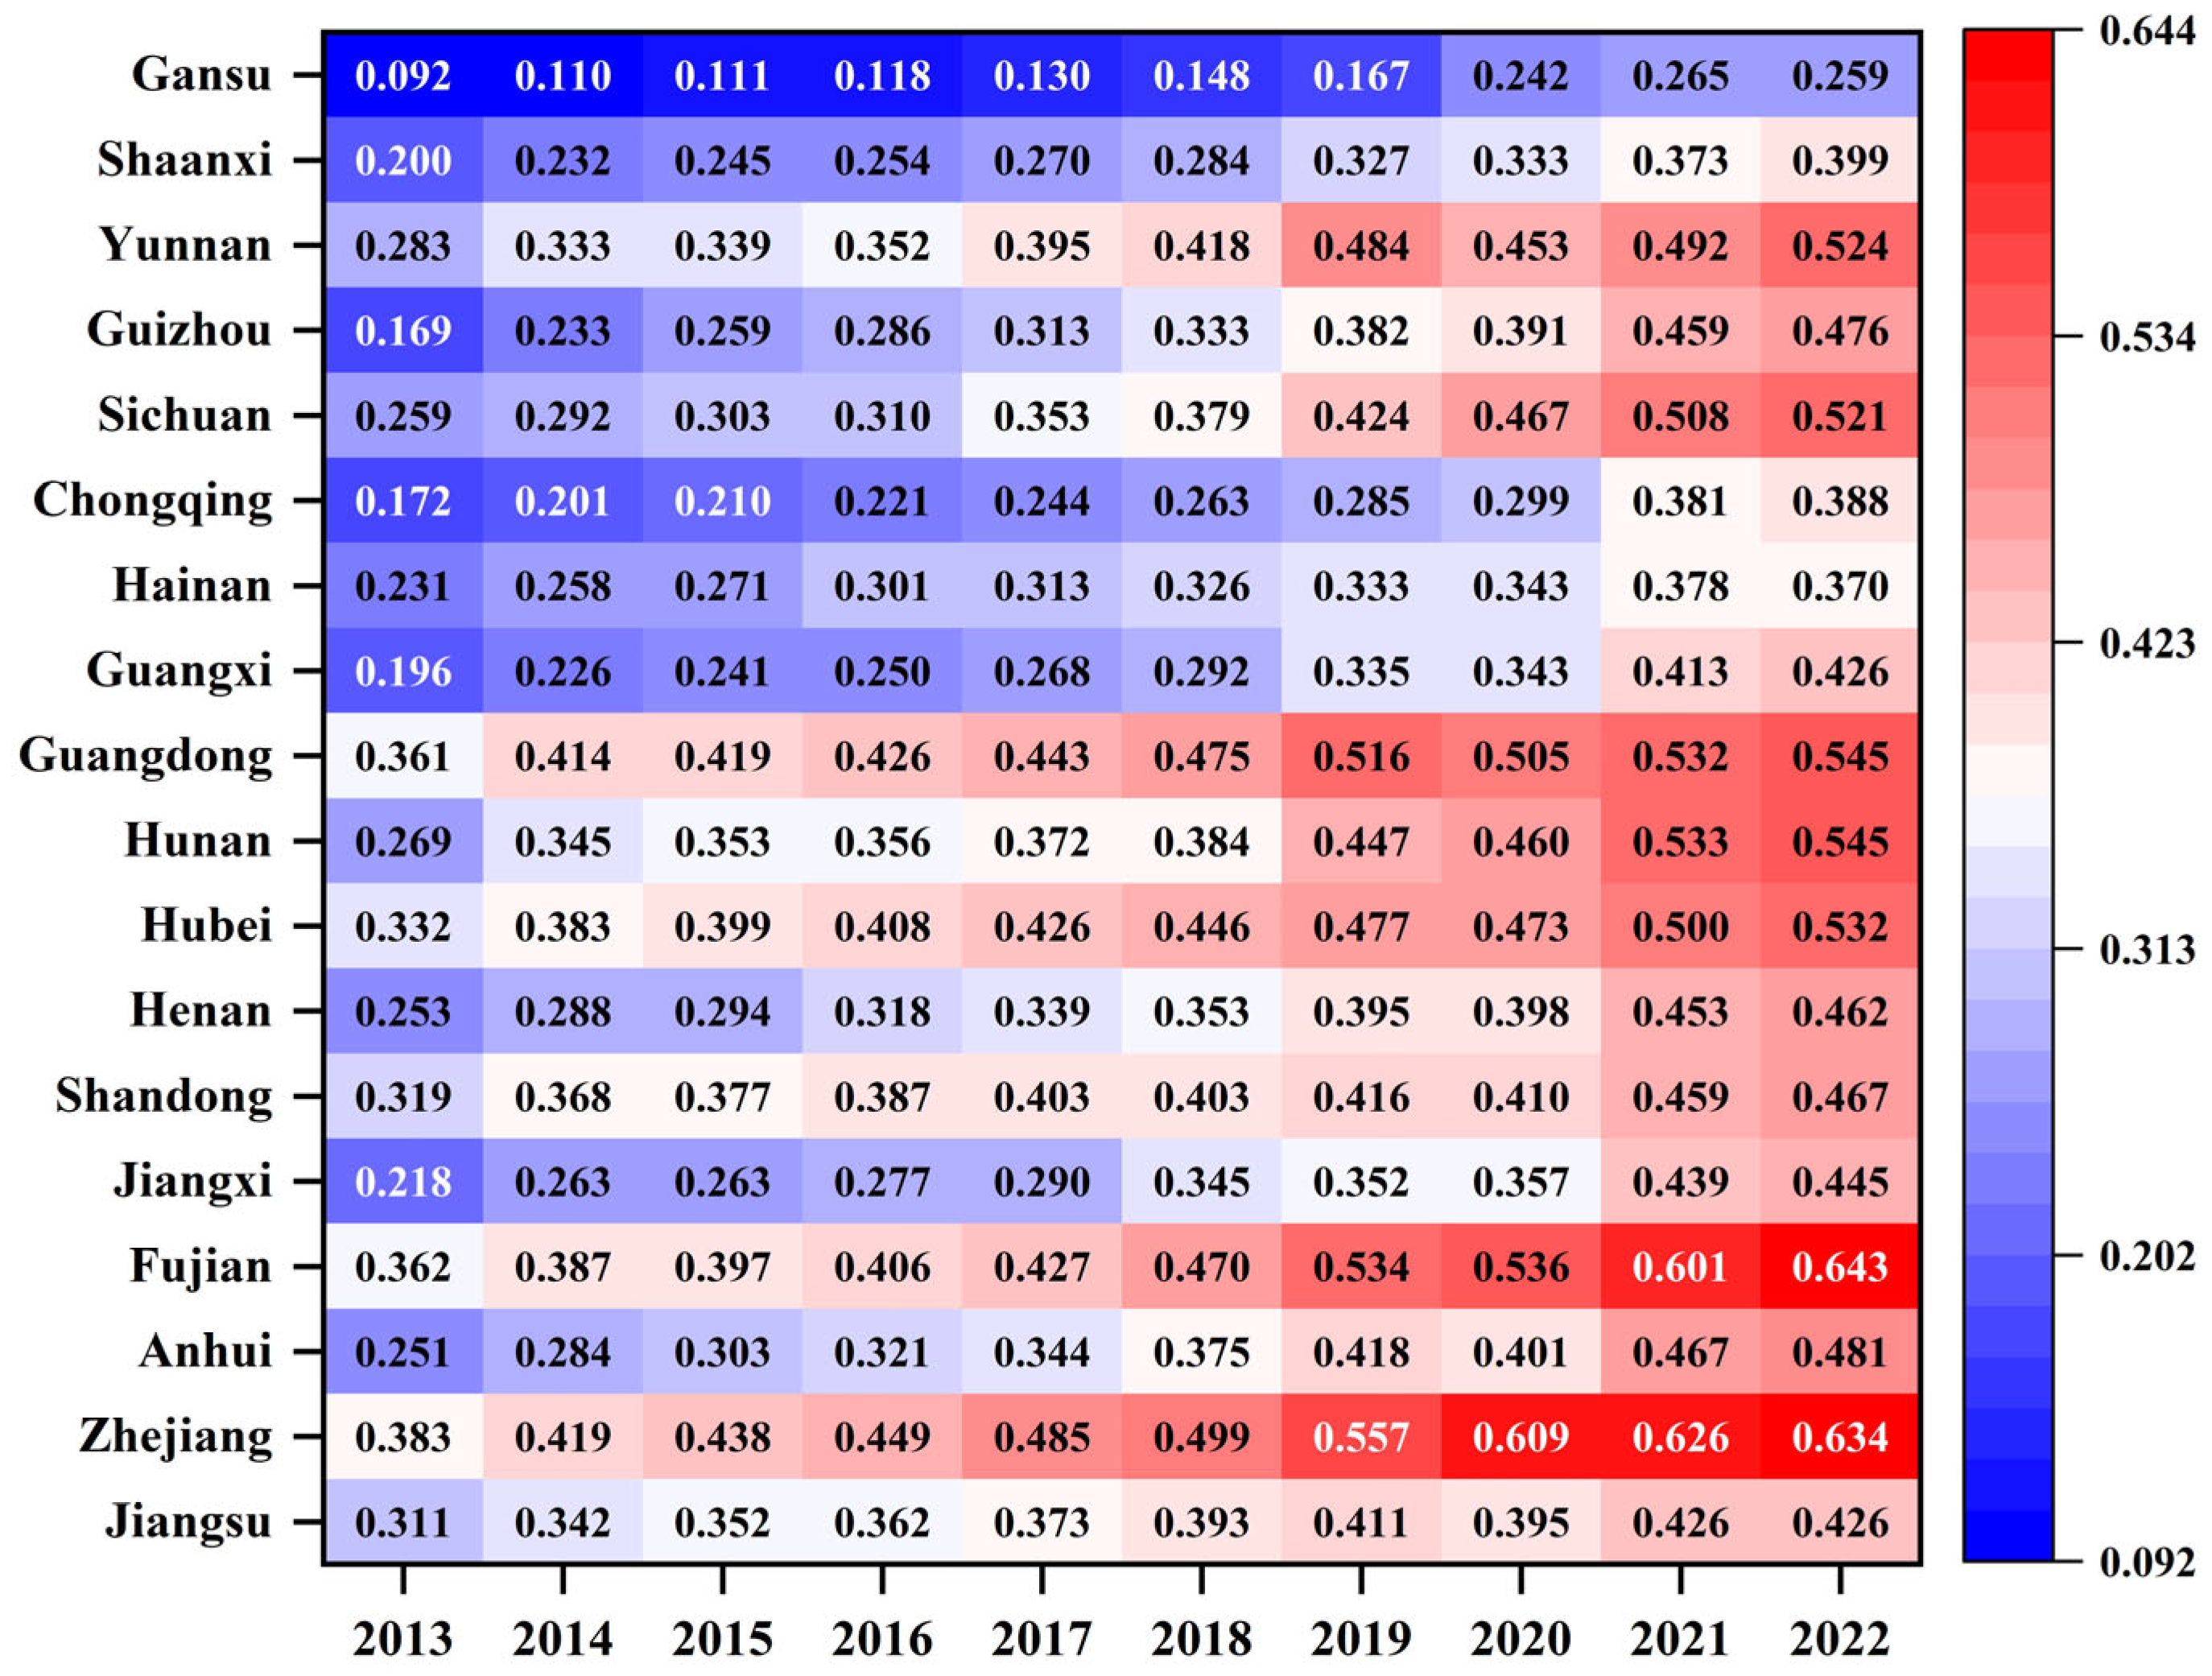
Specifically, we first analyze the trends in CDs across 18 provinces, as shown in Figure 6.
Figure 6.
CDs of the 18 provinces from 2013 to 2022.
As shown in Figure 6, the CDs of the 18 provinces between the two systems continued to rise. In 2013, most regions exhibited low-level coupling, with only six provinces reaching the antagonistic coupling stage, including Guangdong, Hubei, Shandong, Fujian, Zhejiang, and Jiangsu. By 2022, the CDs between the two systems improved significantly, with 17 provinces reaching at least the antagonistic coupling stage. Notably, seven provinces increased to the breaking-in coupling stage, i.e., Yunnan, Sichuan, Guangdong, Hunan, Hubei, Fujian, and Zhejiang. Gansu remained an exception, persisting in the low-level coupling stage despite demonstrating measurable progress, while becoming the only province without stage advancement throughout the sample period. In addition, provinces situated in southern, eastern, central, and southwestern China generally maintained higher CDs. Conversely, several regions consistently displayed lower coupling levels, particularly Chongqing in the southwest, Gansu and Shanxi in the northwest, along with Hainan. The spatial disparity implied that geographical factors might impose structural constraints on provincial-level coupling development between TCT integration and rural revitalization.
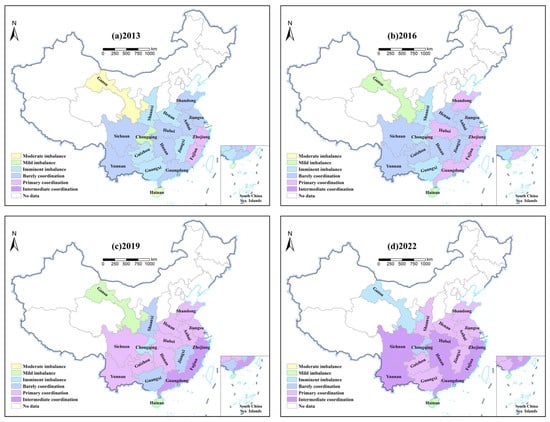
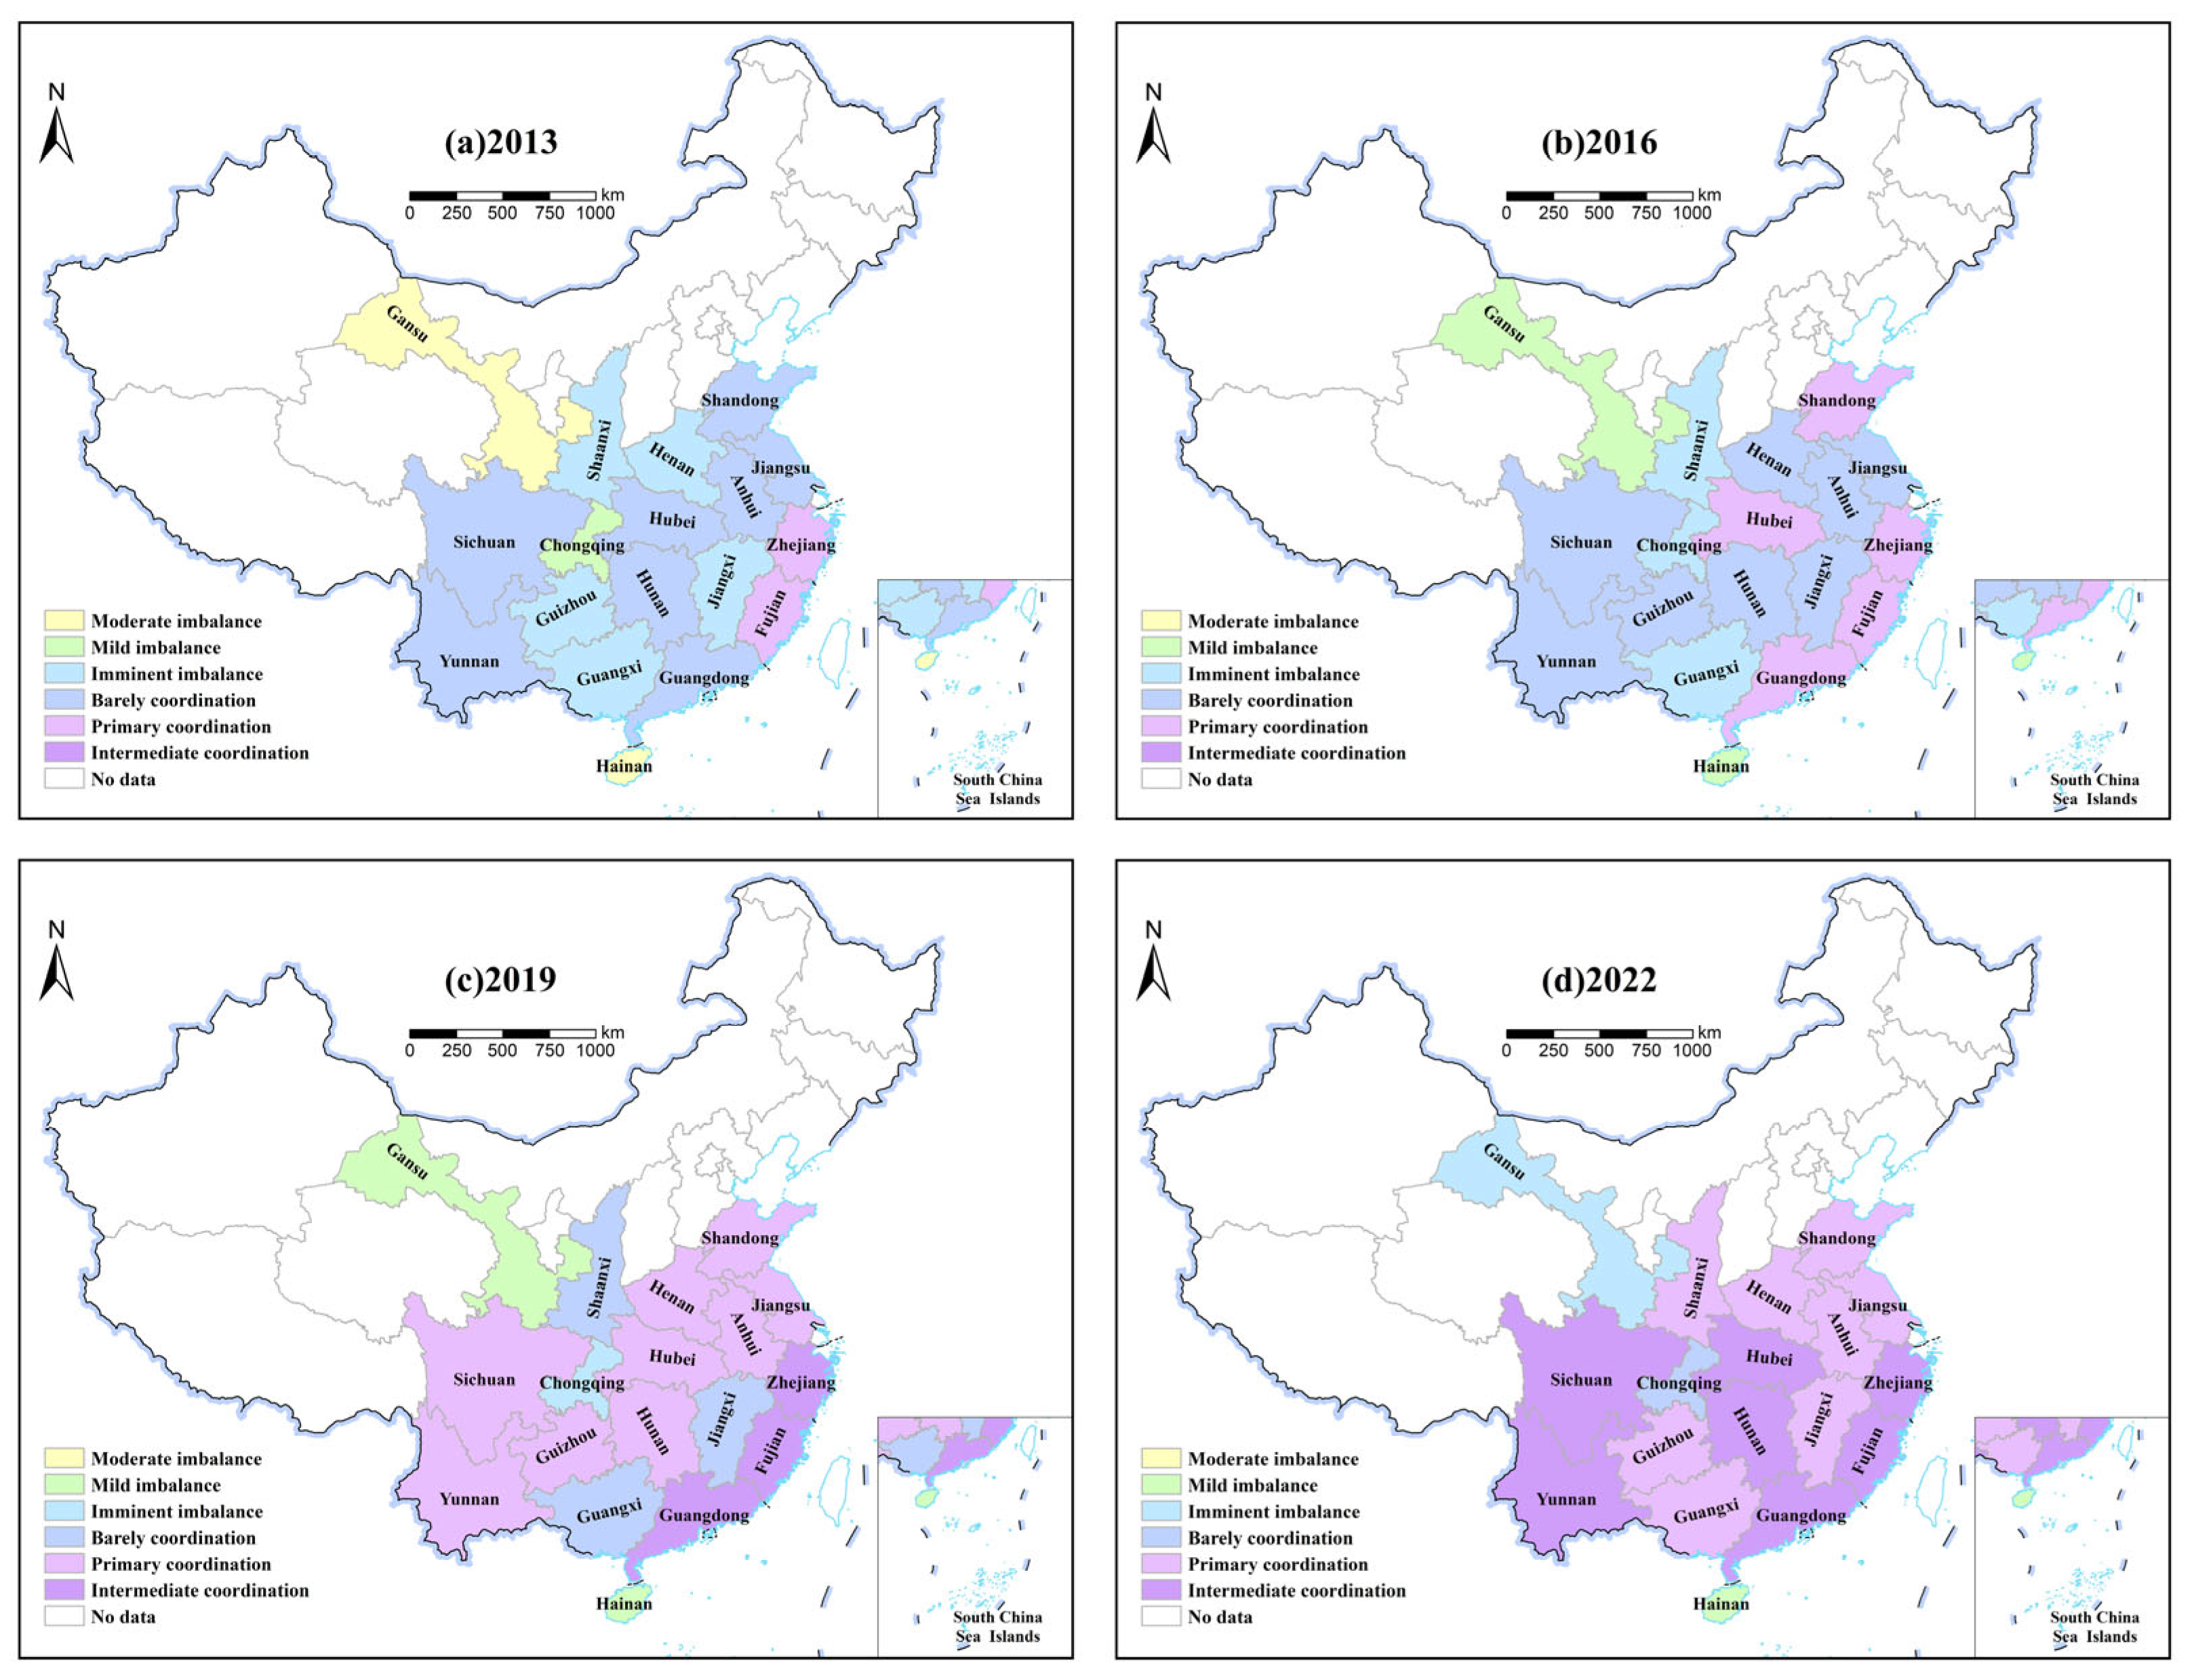
We then analyze the trends in CCDs across 18 provinces. We used the CCD data between TCT integration and rural revitalization for each province and draw the geographic distribution maps in 2013, 2016, 2019, and 2022 using ArcGIS 10.8, as shown in Figure 7.
Figure 7.
Spatial distribution of coordination types between TCT integration and rural revitalization.
As shown in Figure 7, the CCDs between the TCT integration and rural revitalization in the 18 provinces demonstrated an increasing trend. In 2013, most provinces exhibited low CCD levels, predominantly in the barely coordinated or imminent imbalance stages, with only Zhejiang and Fujian reaching the primary coordination stage. By 2022, the CCDs had improved significantly. Most provinces advanced to the primary coordination stage, and some provinces transitioned to the intermediate coordination stage, including Fujian, Zhejiang, Guangdong, Hubei, Hunan, Sichuan, and Yunnan. However, only Chongqing, Gansu, and Hainan remained at low coordination levels.
In terms of spatial patterns, areas with higher degrees of coordination expanded from the southeast coastal region to the mid-Yangtze region (i.e., the middle reaches of the Yangtze River) and the southwest region, forming a gradient progression of “coastal-river-inland”. This spatial diffusion pattern reflects underlying geographical and developmental disparities: coastal provinces (e.g., Zhejiang, Fujian) benefited from earlier infrastructure development and higher tourism accessibility, enabling earlier cluster formation; the mid-Yangtze region (e.g., Hubei, Hunan) leveraged stronger agricultural infrastructure and rich cultural heritage to subsequently emerge as high-coordination areas; while the southwestern region (e.g., Sichuan, Yunnan), though developing later, possesses abundant tea cultural resources and ecological advantages, and has recently evolved into emerging high-coordination clusters.
However, CCD gains in the future may face boundary conditions in provinces with limited tea cultivation bases or underdeveloped cultural IP (e.g., Gansu, Hainan, Chongqing). In these regions, progress may possibly come to a halt without complementary policies such as targeted digital readiness programs for cultural and tourism integration, investments in regional brand-building, or interventions to strengthen tea industry value chains. Future efforts should focus on such enabling conditions to ensure coordinated development becomes more spatially balanced and sustainable.
4.3. Regional Differences by Dagum Method
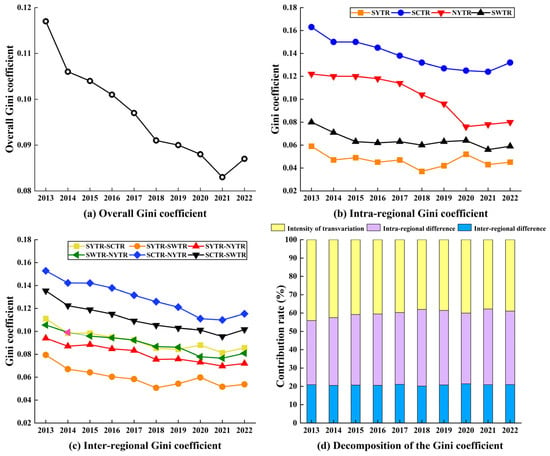
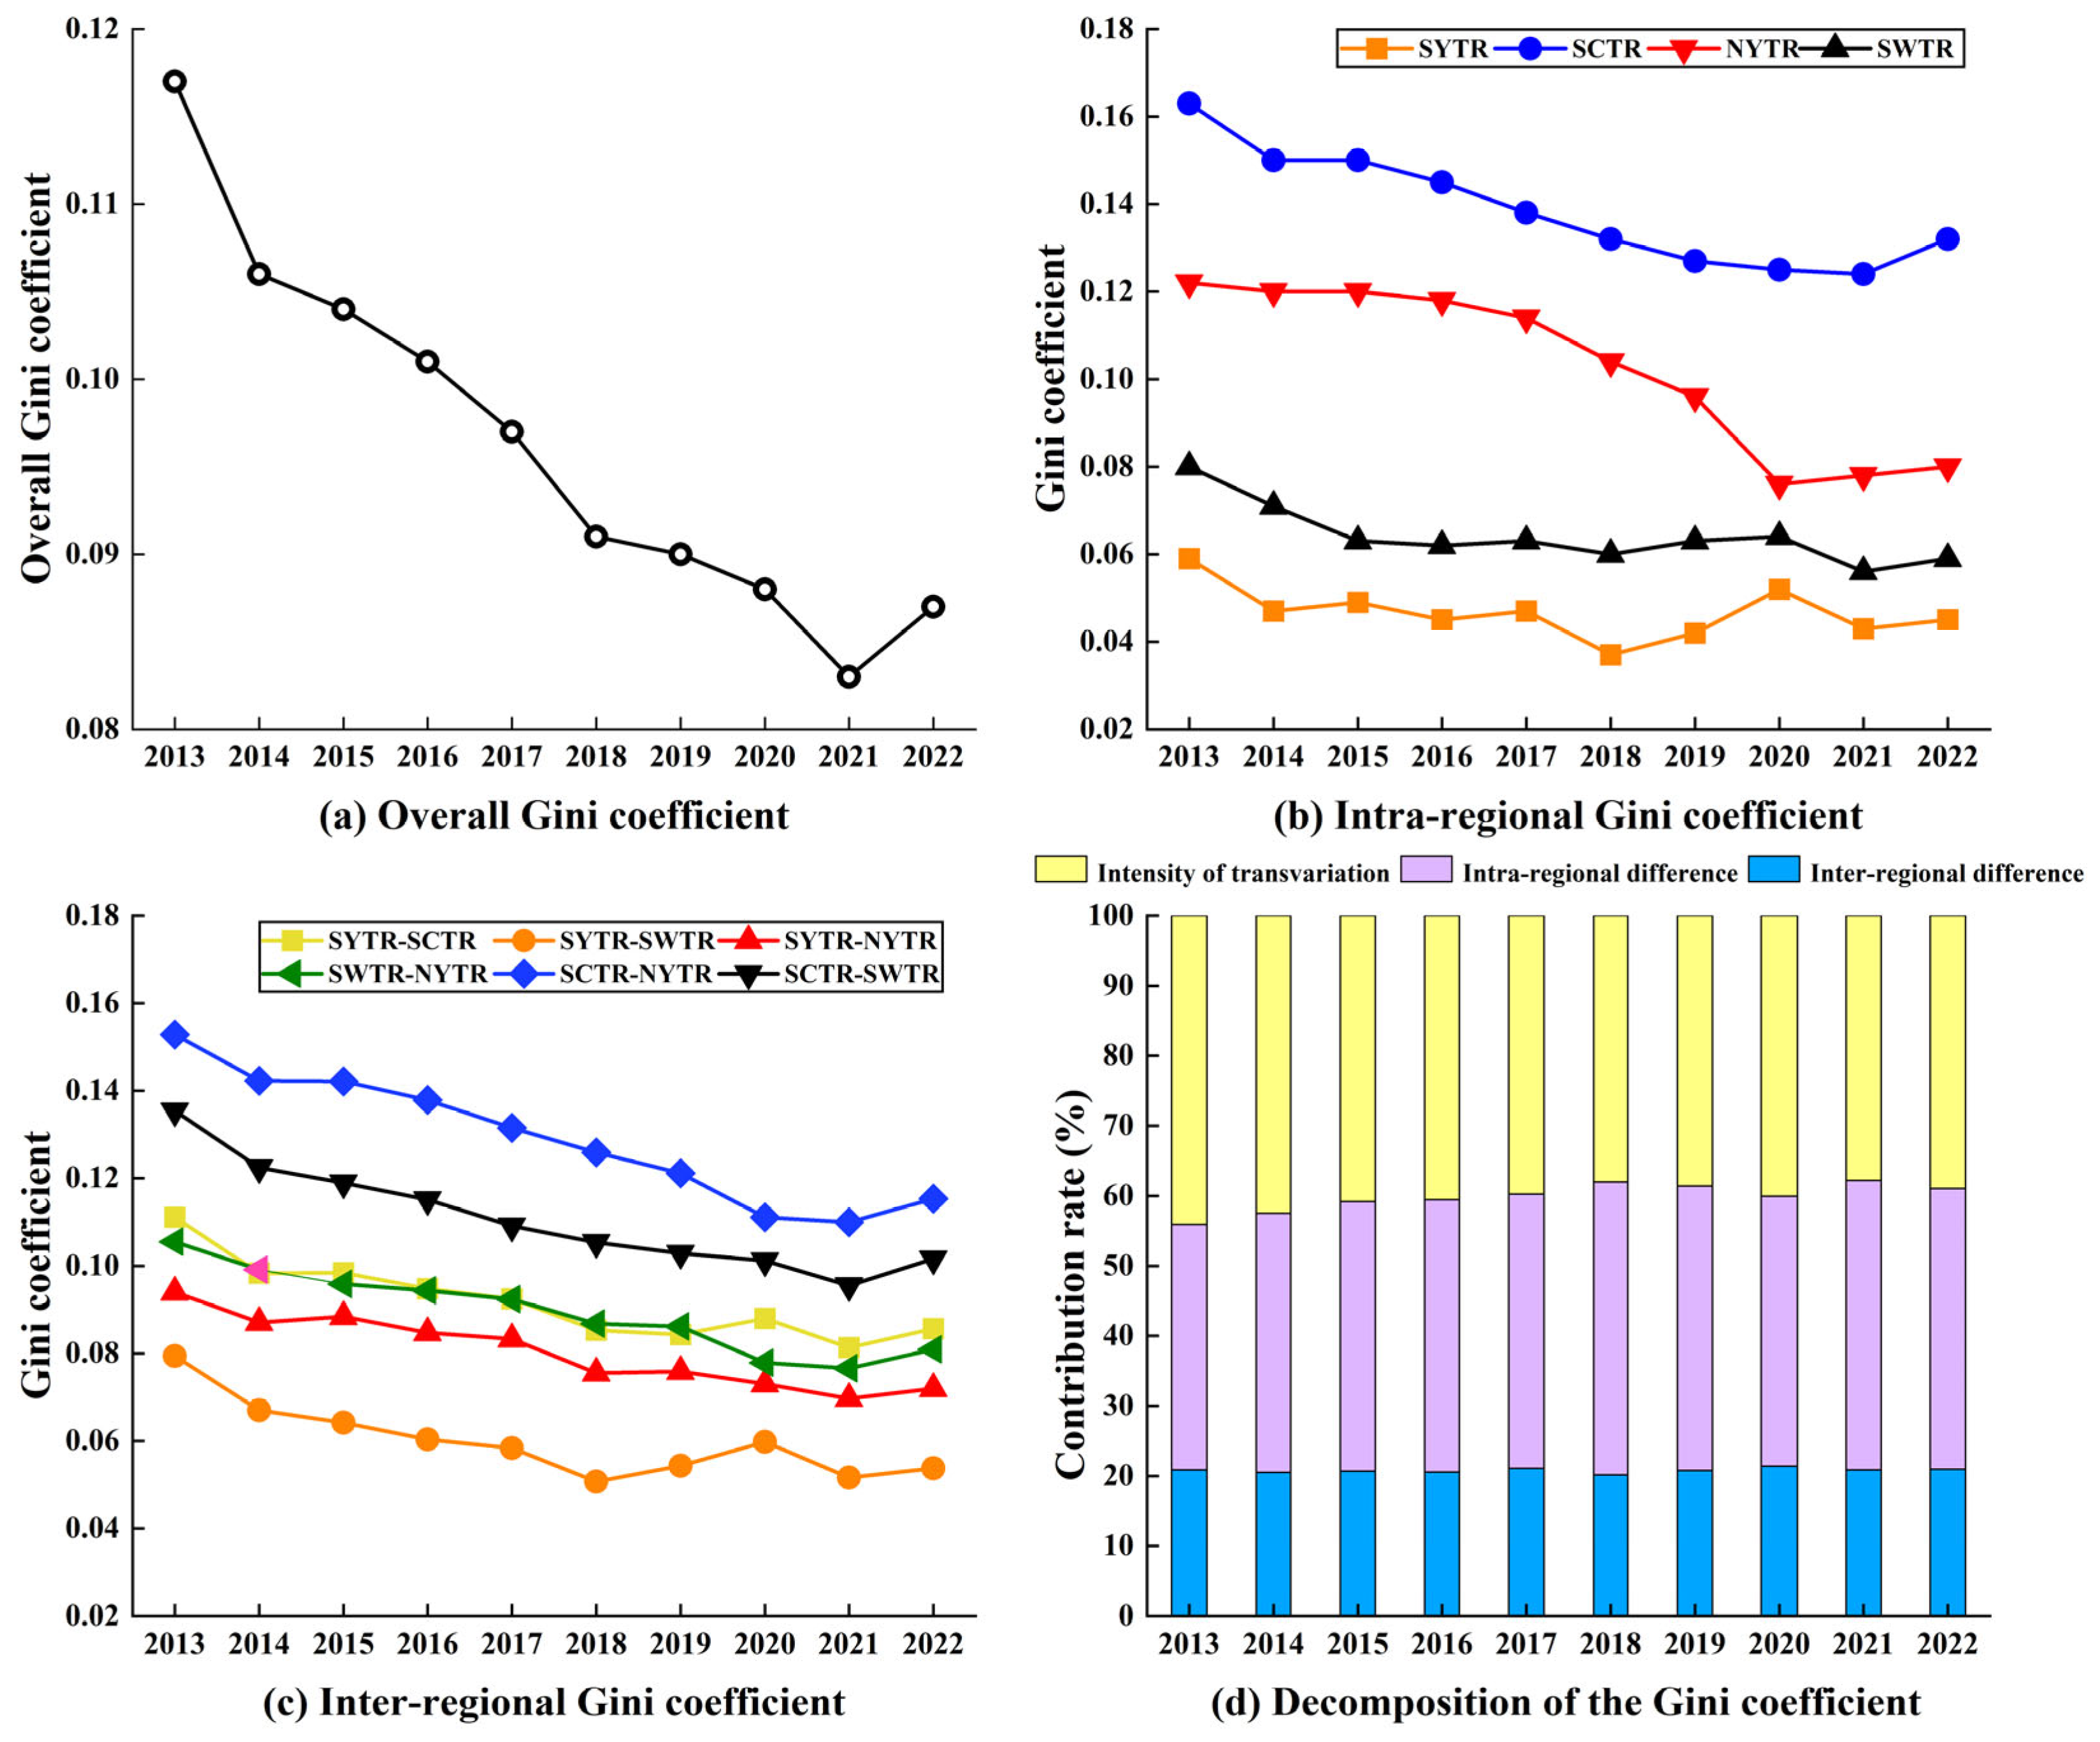
The Dagum Gini coefficient decomposition method is applied to analyze the CCDs across the four tea regions, uncovering the spatial disparities and the sources. The results are shown in Figure 8.
Figure 8.
Differences and contributions of CCDs across provinces in 2013–2022.
Figure 8a depicts the temporal variations in the overall Gini coefficients, reflecting the dynamic trend of overall disparities across the 18 provinces. We find that the overall Gini coefficient exhibits a fluctuating downward trend, decreasing from 0.117 in 2013 to 0.087 in 2022. This indicates a gradual reduction in regional disparities regarding the CCDs of TCT integration and rural revitalization, indicating an apparent convergence phenomenon among provinces. The narrowing disparities suggest that regional development policies over the past decade have produced positive synergistic effects.
Figure 8b illustrates the evolution of Gini coefficients within the four tea regions. Results show fluctuating downward trends across all regions, indicating improved coordination in development within each tea region. Regarding regional disparity levels, SCTR and NYTR maintain consistently higher Gini coefficients, indicating more pronounced internal development imbalances. In contrast, SWTR and SYTR demonstrate relatively lower coefficients, suggesting better-coordinated development and more controlled disparities among their constituent provinces. These findings imply that policy should focus on addressing intra-regional imbalances, particularly through targeted support for lagging areas within SCTR and NYTR, rather than applying uniform regional strategies.
Figure 8c illustrates the evolving trajectories of Gini coefficients among the four tea regions. The results indicate that all inter-regional Gini coefficients exhibit fluctuating downward trends, demonstrating a progressive narrowing of disparities in coupled coordination development between the tea regions. Notably, the between-region gap SCTR–NYTR is the largest throughout the study period. This demonstrates a notable difference in the CCDs between the SCTR and NYTR tea regions. Accordingly, policymakers should prioritize cross-regional infrastructure and industrial collaboration initiatives targeting the SCTR and NYTR tea regions to bridge this key development gap.
Figure 8d illustrates the sources of regional disparities and their respective contribution rates. In terms of mean values, transvariation density demonstrates the highest contribution rate (40.100%), followed by inter-regional disparities (39.113%) and intra-regional variations (20.787%). This indicates that the spatial heterogeneity of the CCDs primarily originates from transvariation density and inter-regional differences, while the influence of intra-regional disparities remains relatively limited. The dominant contribution of transvariation density reveals that provinces with higher and lower CCDs are interwoven across all four major tea regions, rather than being concentrated in specific geographical areas. Meanwhile, the high contribution rate of inter-regional disparities confirms significant development gaps among different tea regions. Based on these findings, policy formulation should break with conventional regional divisions by implementing targeted interventions based on provincial conditions, while simultaneously addressing significant inter-regional development gaps through cross-regional coordination mechanisms.
4.4. Results of Spatial Durbin Models
Drawing on the existing research outcomes in the academic field, another aim of this study is to identify and analyze the driving factors influencing the coordinated development between TCT integration and rural revitalization. As mentioned earlier, we build a spatial econometric model to explore the explanatory factors. However, it is necessary to conduct a series of tests to determine which model is the best fit, including the Lagrange multiplier (LM), the likelihood ratio (LR), and the Hausman tests. The test results are summarized in Table 6.
Table 6.
Results of LM and LR tests.
For all three spatial weight matrices, we find that the four statistics of the LM test are highly significant at the 1% significance level, indicating that both the spatial autoregressive model and the spatial error model are appropriate models. In other words, the SDM may be the best option for capturing the spatial effects. To confirm our conclusion, we then turn to the LR test results, which show that the SDM cannot be simplified to the spatial autoregressive model or spatial error model, indicating that the SDM is the best-fitted model. In addition, the Hausman test rejected the null hypothesis of random effects, suggesting fixed effects SDM. Therefore, the final model is the two-way fixed effects SDM.
Table 7 represents the estimation results of the two-way fixed effects SDM with three matrices, namely, the adjacency matrix, the geographic distance matrix, and the economic-geographic nested matrix. We observe that the spatial autoregressive coefficients (ρ) in all three models are significant and positive, indicating that the CCD between TCT integration and rural revitalization exhibited a significant positive spatial spillover effect. Specifically, an improvement in the local CCDs helps promote the CCDs in neighboring provinces. In addition, we find that the adjacency matrix yielded the highest Log-likelihood statistic, suggesting the best model fit.
Table 7.
Results of the two-way fixed effects SDM.
However, as suggested by LeSage and Pace (2009) [51], the estimated coefficients of the explanatory variables and their spatial lags should not be directly explained by the local and spatial spillover effects due to feedback loops. Thus, we follow their approach to calculate the direct, indirect, and total effects based on the adjacency matrix weight. The direct effects measure the impact of the explanatory variables on CCDs within the local province, while indirect effects represent the influence of neighboring provinces’ explanatory variables on the local province’s CCDs. The total effect is the summation of both direct and indirect effects. The results are presented in Table 8.
Table 8.
Direct, indirect, and total effects.
The direct effect of fiscal condition is significant and positive, indicating that fiscal condition significantly promoted the coupling coordination between TCT integration and rural revitalization within the province. However, the indirect effect is highly insignificant, implying that trans-provincial fiscal influences are limited. One possible explanation is that sufficient local fiscal resources enable direct investments in provincial rural infrastructure, particularly roads, telecommunication networks, and tourism facilities, which collectively establish the hardware foundation for TCT integration. Moreover, government funding serves as leverage to attract private capital participation, thereby improving rural development while creating employment opportunities and increasing incomes. This dual-drive mechanism, generating both economic and social benefits, not only provides sustained momentum for rural revitalization but also effectively promotes the TCT integration, ensuring long-term coordinated development.
The direct and indirect effects of urban-rural community development are both significant and positive, indicating that such development directly enhances TCT integration and rural revitalization coordination within the local province, while neighboring provinces’ community development exerts spatial spillover effects on the CCD in the local province. Within the provinces, community development can enhance infrastructure systems, including transportation networks, information technologies, and wastewater management, while establishing public service facilities such as tourist centers, smart guidance systems, and intangible cultural heritage exhibition spaces. These improvements collectively elevate scenic area reception capacity, consumption environments, and cultural experience quality, thereby providing robust support for TCT integration. Meanwhile, enhanced community development in adjacent provinces generates agglomeration effects that attract more regional resources, which indirectly facilitate the coordinated development of TCT integration and rural revitalization in the local province.
We find that the employment structure variable has significant and positive direct and indirect effects, indicating that employment structure upgrading promotes the coordinated development of TCT integration and rural industries within the province, while improved employment structure in neighboring provinces also generates positive spatial spillover effects on the local province. The increasing number of tertiary industry practitioners has instilled a new wave of innovation into the TCT integration, fostering a dynamic and creative environment, which systematically restructures the agricultural sector. This transformation has not only effectively modernized agricultural production methods but has also generated substantial additional income for rural residents, thereby providing sustained momentum for the implementation of rural revitalization strategies. The optimization and upgrading of employment structure in neighboring provinces can stimulate cross-province tourism consumption vitality and inject new developmental momentum into the regional cultural tourism market. This spatial spillover effect significantly enhances industrial optimization in the local province, effectively promoting the high-quality integrated development of TCT integration and rural revitalization.
Both the direct and indirect effects of human capital are found to be significant and positive, demonstrating that educational advancement contributes to the synergistic growth of TCT integration and rural development in the local province, while neighboring provinces’ human capital enhancement exerts beneficial cross-border influences. The improvement in human capital level reflects an increase in the number of educated individuals. Well-educated practitioners are more adept at integrating traditional tea culture with modern tourism demands, developing innovative formats such as tea culture study tours and immersive tea ceremony experiences, thereby injecting new vitality into rural industries. These innovative initiatives not only enhance product value-added but also boost local employment and income growth, creating a virtuous cycle of “innovation-driven industrial upgrading-rural revitalization”. Meanwhile, the enhancement of human capital in neighboring provinces facilitates industrial upgrading and rural revitalization in the local province through technology diffusion, talent mobility, and industrial synergy.
5. Conclusions
5.1. Summary of Key Findings
By employing the entropy method, the CCD model, the Dagum Gini coefficient decomposition, and the SDM, this study conducted a comprehensive analysis of the CCDs between TCT integration and rural revitalization across 18 tea-producing provinces. The key findings are as follows:
First, the overall TCT integration and rural revitalization indices exhibited a fluctuating upward trend, with the latter being consistently higher. At the provincial level, TCT integration and rural revitalization generally exhibited an upward trend. Southeastern coastal provinces (e.g., Zhejiang and Fujian) and traditional southwestern tea regions (e.g., Yunnan and Sichuan) maintained leading positions, while northwestern (e.g., Gansu) and some southern provinces (e.g., Hainan) lagged behind. Several central-western provinces (e.g., Hubei, Sichuan, Yunnan) and northwestern regions (e.g., Shaanxi, Gansu) show outstanding rural revitalization performance, while eastern coastal regions (e.g., Jiangsu, Anhui, Fujian) and a few central-western areas (e.g., Jiangxi) show relatively slower progress. Second, the CD improved but stayed low; CCD transitioned from dissonance to coordination. Spatially, the high-value areas of coordination spread from the southeast coast (e.g., Zhejiang, Fujian) to the middle Yangtze (e.g., Hubei, Hunan) and the southwestern inland (e.g., Sichuan, Yunnan), showing a stepped progression pattern of “coast-river-inland”. Third, transvariation density was the dominant cause of spatial heterogeneity in the CCD, as evidenced by the spatial interweaving of provinces with high and low CCDs across all regions. Concurrently, inter-regional disparities were also a critical source of this heterogeneity, with the most pronounced gap being that between the SCTR and the NYTR. Finally, the SDM results showed fiscal condition benefited only the local province, whereas urban–rural community development, employment structure, and human capital generated significant direct and indirect effects, serving as the key driving factors for inter-regional synergy.
5.2. Policy Recommendations
Based on the empirical findings, we propose four targeted policy recommendations to foster coordination development between TCT integration and rural revitalization and to reduce regional disparities.
First, a differentiated policy approach should be adopted. For leading regions such as the southeastern coastal areas and traditional southwestern tea zones, policy support should prioritize the development of high-quality TCT formats and facilitate the transition from scale expansion to quality enhancement. For lagging provinces in the northwest and some southern regions, efforts should focus on increasing infrastructure investment and cultivating distinctive tea culture intellectual properties to overcome development bottlenecks. Meanwhile, cross-regional coordination mechanisms should be established to encourage advanced provinces to support less-developed areas through technology transfer and talent exchange, thereby promoting balanced regional development.
Second, a “Point-Axis-Area” spatial development strategy should be implemented. Given the identified “coast-river-inland” stepped progression pattern of CCD, policy interventions should reinforce this natural spatial diffusion. The southeastern coastal regions should be solidified as core growth poles (“Points”) for innovation and high-value development. The Yangtze River basin should be strengthened as a crucial development corridor (“Axis”) to facilitate the inland transfer of capital, technology, and expertise. Concurrently, targeted support should be provided to cultivate southwestern inland regions as key growth “Areas”, thereby systematically promoting a coordinated and tiered development progression from coastal to riverine to inland zones.
Third, precision targeting mechanisms beyond administrative boundaries could be established. Given that spatial heterogeneity is primarily driven by the interwoven distribution of high-CCD and low-CCD provinces across all regions, policy interventions must transcend conventional regional divisions. A cross-provincial pairing assistance program should be implemented to facilitate targeted cooperation between high-CCD and low-CCD provinces, enabling knowledge transfer and capacity building. Simultaneously, coordinated planning and resource allocation should be employed to bridge the development gap between the SCTR and the NYTR, thereby fostering more balanced and integrated regional development.
Lastly, inter-regional synergy funds with spillover-focused allocation should be established. Considering the spatial spillover effects of urban-rural community development, employment structure, and human capital, a dedicated funding mechanism should be created to support projects with demonstrable cross-regional impacts. Provincial fiscal resources should continue to address localized needs, while the synergy fund specifically targets initiatives that enhance rural-urban integration, facilitate industrial upgrading, and develop regional talent pools.
5.3. Limitations and Future Research
This study is subject to several limitations. First, despite following a rigorous analytical procedure to construct the comprehensive indicator systems for TCT integration and rural revitalization, potential measurement errors may persist due to indicator selection and weight calculation. Second, while imputation methods were applied to address missing data, the results could be sensitive to the specific techniques employed. Third, although the SDM controls for spatial dependencies, potential endogeneity concerns (e.g., from omitted variables or reverse causality) might still challenge the estimation results. Finally, the reliance on provincial macro-data constrains our ability to validate the precise household-level welfare channels through which TCT integration operates, due to the lack of micro-level data.
These limitations present clear avenues for future work. We plan to collect granular micro-survey data to directly trace and validate the impact channels on household livelihoods and welfare. Furthermore, future research could explore advanced instrumental variables or natural experiment approaches to better address endogeneity and employ alternative indicator systems and imputation schemes for robustness checks, thereby moving closer to establishing causal inferences.
Author Contributions
All authors contributed to the study conception and design. Material preparation, data collection, and curation were performed by N.Y. The data analysis, draft writing, and editing were performed by N.Y., L.J., H.Z., and X.L. critically revised the work. All authors commented on previous versions of the manuscript. All authors have read and agreed to the published version of the manuscript.
Funding
This research was funded by National Natural Science Foundation of China (42430515, 42301257), Key Research and Development Program of Ningxia Autonomous Region (2023BEG02068), Rural Regional System of Observation and Research Station of Guangdong Province (2021B1212050026).
Data Availability Statement
Data is contained within the article. All data utilized in this study are sourced from publicly available, officially published yearbooks. These include the China Statistical Yearbook, China Rural Statistical Yearbook, China Urban-Rural Construction Statistical Yearbook, China Social Statistical Yearbook, China Culture and Tourism Statistical Yearbook, China Civil Affairs Statistical Yearbook, China Population and Employment Statistical Yearbook, China Health Statistical Yearbook, Statistical Bulletin of National Economic and Social Development, and China Cultural and Related Industries Statistical Yearbook.
Conflicts of Interest
The authors declare no conflicts of interest.
References
- Liu, Y.; Zang, Y.; Yang, Y. China’s rural revitalization and development: Theory, technology and management. J. Geogr. Sci. 2020, 30, 1923–1942. [Google Scholar] [CrossRef] [Scilit]
- Llorent-Bedmar, V.; Cobano-Delgado Palma, V.C.; Navarro-Granados, M. The rural exodus of young people from empty Spain. Socio-educational aspects. J. Rural. Stud. 2021, 82, 303–314. [Google Scholar] [CrossRef] [Scilit]
- Zhang, Y.; Yang, C.; Yan, S.; Wang, W.; Xue, Y. Alleviating relative poverty in rural China through a diffusion schema of returning farmer entrepreneurship. Sustainability 2023, 15, 1380. [Google Scholar] [CrossRef] [Scilit]
- Jiang, C.Y. Highlights of the No. 1 Central Document in 2024. J. Rural. Financ. Res. 2024, 45, 3–13. [Google Scholar] [CrossRef]
- Cheng, Q.; Luo, Z.; Xiang, L. Spatiotemporal differentiation of coupling and coordination relationship of the tea industry–tourism–ecological environment system in Fujian province, China. Sustainability 2021, 13, 10628. [Google Scholar] [CrossRef] [Scilit]
- Zhang, A.H. Exploring the industrial communication path of short video embedded in cultural tourism integration–an analysis based on Granovetter’s embeddedness theory. J. Shandong Univ. (Philos. Soc. Sci. Ed.) 2022, 72, 60–70. [Google Scholar] [CrossRef]
- Sun, J.X.; Huang, K.J.; Wang, X.J. Tourism development and rural revitalization based on local practices: Logic and cases. J. Tour. 2020, 35, 39–49. [Google Scholar] [CrossRef]
- Li, X.; Wang, L.; Wang, L. The Coupling Coordination Evaluation and Influencing Factors Analysis of the Development of China’s Digital Economy and the Construction of an Ecological Civilization. Pol. J. Environ. Stud. 2024, 33, 3747–3758. [Google Scholar] [CrossRef] [Scilit]
- Jolliffe, L. (Ed.) Tea and Tourism: Tourists, Traditions and Transformations; Channelview: Cleveland, UK, 2007. [Google Scholar]
- Jolliffe, L.; Aslam, M.S.M. Tea heritage tourism: Evidence from Sri Lanka. J. Herit. Tour. 2009, 4, 331–344. [Google Scholar] [CrossRef] [Scilit]
- Su, M.M.; Wall, G.; Wang, Y.; Jin, M. Livelihood sustainability in a rural tourism destination-Hetu Town, Anhui Province, China. Tour. Manag. 2019, 71, 272–281. [Google Scholar] [CrossRef] [Scilit]
- Kuswidiati, W. A Case Study of Participatory Development in the OVOP Movement: Green Tourism in Ajimu Town, Oita, Japan and Agro Tourism in Pasuruan, East Java, Indonesia; Research Paper; Graduate School of Policy Science Ritsumeikan University: Kyoto, Japan, 2008. [Google Scholar]
- Bai, Y.; Tang, C.; Peng, L.; Wu, J. Coordinated Development and Regional Differences of China’s Tea Culture and Tourism Industry. J. Southwest Univ. (Nat. Sci. Ed.) 2024, 46, 54–65. [Google Scholar] [CrossRef]
- Shi, X.P.; Pan, X.G.; Liu, M.F. Analysis of the coupling level measurement and driving factors of the tea culture and tourism industry in Linzhi city. J. Plateau Agric. 2025, 9, 294–303. [Google Scholar] [CrossRef]
- Lyu, W.Q.; Xiao, Z.F. A study of the differences in the coupling and coordinated tea-culture-tourism development and the relevant influencing factors: The case of 30 key tea-producing counties in Yunnan province. J. Yunnan Minzu Univ. (Philos. Soc. Sci. Ed.) 2024, 41, 78–92. [Google Scholar] [CrossRef]
- Su, M.M.; Wall, G.; Wang, Y. Integrating tea and tourism: A sustainable livelihoods approach. J. Sustain. Tour. 2019, 27, 1591–1608. [Google Scholar] [CrossRef] [Scilit]
- Yang, Z.; Wang, X.; Xiao, J. Measurement of the development level of tea tourism integration, spatiotemporal evolution and obstacle factors in China. PLoS ONE 2025, 20, e0329974. [Google Scholar] [CrossRef] [Scilit] [PubMed]
- Liu, A. Tourism in rural areas: Kedah, Malaysia. Tour. Manag. 2006, 27, 878–889. [Google Scholar] [CrossRef] [Scilit]
- Mbaiwa, J.E. The socio-economic and environmental impacts of tourism development on the Okavango Delta, north-western Botswana. J. Arid. Environ. 2003, 54, 447–467. [Google Scholar] [CrossRef] [Scilit]
- Ma, Y.F.; Zhang, C.H.; Liu, J.S.; Gao, Y.; Pang, W. Coupling with tourism: A new approach to sustainable development research. Tour. Hosp. Prospect. 2018, 2, 1–19. [Google Scholar]
- Liang, S.H.; Lai, I.K.W. Tea tourism: Designation of origin brand image, destination image, and visit intention. J. Vacat. Mark. 2023, 29, 409–427. [Google Scholar] [CrossRef] [Scilit]
- Cheng, S.; Hu, J.; Fox, D.; Zhang, Y. Tea tourism development in Xinyang, China: Stakeholders’ view. Tour. Manag. Perspect. 2012, 2, 28–34. [Google Scholar] [CrossRef] [Scilit]
- Pang, J.; Wei, L. Dynamic mechanism and pathways for the coupled and coordinated development of specialty agriculture and tourism: Evidence from 18 tea-producing provinces in China. World Agric. 2018, 40, 246–253. [Google Scholar] [CrossRef]
- Shen, J.; Chou, R.J. Rural revitalization of Xiamei: The development experiences of integrating tea tourism with ancient village preservation. J. Rural. Stud. 2022, 90, 42–52. [Google Scholar] [CrossRef] [Scilit]
- Xu, J.; Llinás, M.S.; Ramis, M.A.C. Tea tourism and rural revitalization: Insights and evidence from Zhejiang, China. J. Tour. Anal. Rev. Análisis Turístico 2022, 29, 101–130. [Google Scholar] [CrossRef] [Scilit]
- Zhao, B.; Zhan, S.W. Spatiotemporal evolution and influencing factors of the coupling coordination between agricultural-cultural-tourism integration and rural revitalization: A case study of Shaanxi province. Chin. J. Agric. Resour. Reg. Plan. 2025, 46, 1–14. [Google Scholar]
- Zhang, Z.S. Study on the multi-governance model of rural ecological environment governance from the perspective of rural revitalization strategy. J. Chongqing Univ. (Soc. Sci. Ed.) 2020, 26, 201–210. [Google Scholar] [CrossRef]
- Long, J.R.; Du, S.S.; Zhang, J.Q. Mechanism and model of rural vitalization guided by culture-tourism integration. Econ. Geogr. 2021, 41, 222–230. [Google Scholar] [CrossRef]
- Sita, K.; Aji, T.M.; Hanim, W. Integrating tea and tourism: A potential sustainable livelihood approach for Indonesia tea producer central area. IOP Conf. Ser. Earth Environ. Sci. 2021, 892, 012104. [Google Scholar] [CrossRef] [Scilit]
- Annes, A.; Wright, W. ‘Creating a room of one’s own’: French farm women, agritourism and the pursuit of empowerment. Women’s Stud. Int. Forum 2015, 53, 1–11. [Google Scholar] [CrossRef] [Scilit]
- Slusariuc, G.C. Rural tourism an opportunity for development. Rev. Tur.—Stud. Cercet. Tur. 2018, 26, 59–62. [Google Scholar]
- Su, M.J.; Lin, W.Q.; Fan, X.Y.; Jiao, J.; Yu, L.T.; Wang, Y.F. Planning and practice of integrated tea-culture-tourism-wellness development in Taishun County. Tea Commun. 2025, 52, 119–124. [Google Scholar] [CrossRef]
- Pan, S.Y.; Nie, Q.; Tai, H.C.; Song, X.L.; Tong, Y.F.; Zhang, L.J.F.; Wu, X.-W.; Lin, Z.-H.; Zhang, Y.-Y.; Ye, D.-Y.; et al. Tea and tea drinking: China’s outstanding contributions to the mankind. Chin. Med. 2022, 17, 27. [Google Scholar] [CrossRef] [Scilit]
- Wang, M.; Zhao, X.; Gong, Q.; Ji, Z. Measurement of regional green economy sustainable development ability based on entropy weight-topsis-coupling coordination degree—A case study in Shandong province, China. Sustainability 2019, 11, 280. [Google Scholar] [CrossRef] [Scilit]
- Ariken, M.; Zhang, F.; Liu, K.; Fang, C.; Kung, H.T. Coupling coordination analysis of urbanization and eco-environment in Yanqi Basin based on multi-source remote sensing data. Ecol. Indic. 2020, 114, 106331. [Google Scholar] [CrossRef] [Scilit]
- Liu, J.; Tian, Y.; Huang, K.; Yi, T. Spatial-temporal differentiation of the coupling coordinated development of regional energy-economy-ecology system: A case study of the Yangtze River Economic Belt. Ecol. Indic. 2021, 124, 107394. [Google Scholar] [CrossRef] [Scilit]
- Jiang, L.; Bai, L.; Wu, Y.M. Coupling and coordinating degrees of provincial economy, resources and environment in China. J. Nat. Resour. 2017, 32, 788–799. [Google Scholar] [CrossRef]
- Cheng, H.; Xu, Q.; Guo, Y.Q. Temporal and spatial evolution of the coupling coordinated development between tourism resources development and ecological environment in China. Econ. Geogr. 2019, 39, 233–240. [Google Scholar] [CrossRef]
- Feng, G.; Zhang, M. The coupling coordination development of rural e-commerce and rural revitalization: A case study of 10 rural revitalization demonstration counties in Guizhou. Procedia Comput. Sci. 2022, 199, 407–414. [Google Scholar] [CrossRef] [Scilit]
- Lerman, R.I.; Shlomo, Y. Improving the accuracy of estimates of Gini coefficients. J. Econom. 1989, 42, 43–47. [Google Scholar] [CrossRef] [Scilit]
- Elhorst, J.P. Matlab software for spatial panels. Int. Reg. Sci. Rev. 2014, 37, 389–405. [Google Scholar] [CrossRef] [Scilit]
- Yan, Z.; Sotiriadis, M.; Shen, S. Integrating a local asset/resource into tourism and leisure offering: The case of tea resources in Longwu Town, Zhejiang Province, China. Sustainability 2021, 13, 1920. [Google Scholar] [CrossRef] [Scilit]
- Peng, W.; Yin, Y.; Wen, Z.; Kuang, J. Spatial spillover effect of green innovation on economic development quality in China: Evidence from a panel data of 270 prefecture-level and above cities. Sustain. Cities Soc. 2021, 69, 102863. [Google Scholar] [CrossRef] [Scilit]
- Song, Y.X.; Yao, C.C.; Sun, Y.H. Coupling coordination evaluation and obstacle factors analysis of tourism disturbance and community resilience in agricultural heritage site: A case study of Hani terraces. Tour. Trib. 2023, 38, 86–96. [Google Scholar] [CrossRef]
- Zhong, Y.; Dong, X.J. Spatio-temporal evolution and influencing factors of coupling coordination between new urbanization and comprehensive rural revitalization in Central China. Acta Geogr. Sin. 2025, 80, 2159–2180. [Google Scholar] [CrossRef]
- Zou, D.Y.; Li, B.Z.; Qu, B.L. Spatiotemporal characteristics and influencing factors of coupling coordination between integration of culture and tourism and rural revitalization: A case study of Fuian Province. J. Fujian Norm. Univ. (Nat. Sci. Ed.) 2025, 41, 131–140. Available online: https://kns.cnki.net/kcms2/article/abstract?v=djJQlkjC3sD9HLrWHFVbeTo8gTUKTh9JTRzgaUM0zYy-1RCEoALumBs1Hzsrk3eEWbqwwuuZ3wZgD1a0pm_s8Mh8zI_CaQMf4A1rpIns9eB8lj742ei2oDfqgqOS467Azbfx8Giwx9jfoy9gkuwBqNlMpxdEku6viC2teQuZC5gMjj7twWIdVA==&uniplatform=NZKPT&language=CHS (accessed on 22 September 2025).
- Song, L.T.; Bai, Y.X. Construction of Evaluation Index System and Regional Difference Decomposition of Rural Revitalization Level. Stat. Decis. 2022, 38, 17–21. [Google Scholar] [CrossRef]
- Yang, J.R.; He, F.J.; Wang, H. Informatization construction, digital economy, and rural revitalization. Stat. Decis. 2023, 39, 51–56. [Google Scholar] [CrossRef]
- Yan, Y.H.; Li, W.; Hu, X.Q.; Zhang, R.G. The impact effect and empirical evidence of digital financial inclusion on rural revitalization. Stat. Decis. 2023, 39, 131–135. [Google Scholar] [CrossRef]
- Li, Z.P.; Li, X.J. Evaluation of rural revitalization development level and diagnosis of obstacle factors in the Yangtze River Delta region. Stat. Decis. 2023, 39, 77–81. [Google Scholar] [CrossRef]
- LeSage, J.; Pace, R.K. Introduction to Spatial Econometrics; Chapman and Hall/CRC: Boca Raton, FL, USA, 2009. [Google Scholar]

Disclaimer/Publisher’s Note: The statements, opinions and data contained in all publications are solely those of the individual author(s) and contributor(s) and not of MDPI and/or the editor(s). MDPI and/or the editor(s) disclaim responsibility for any injury to people or property resulting from any ideas, methods, instructions or products referred to in the content. |
© 2025 by the authors. Licensee MDPI, Basel, Switzerland. This article is an open access article distributed under the terms and conditions of the Creative Commons Attribution (CC BY) license (https://creativecommons.org/licenses/by/4.0/).