


Error in Figure/Table
In the original publication [1], there was a mistake in Table 1. The total number of studies and the total study population for the prevalence of SCD in Europe, the global birth prevalence and the global prevalence of SCT per 100,000 were amended. The corrected Table 1 appears below.
Table 1.
Quantitative analysis of SCD and SCT for prevalence and birth prevalence.
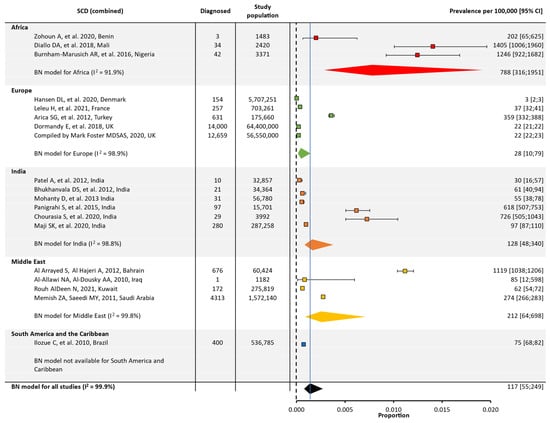
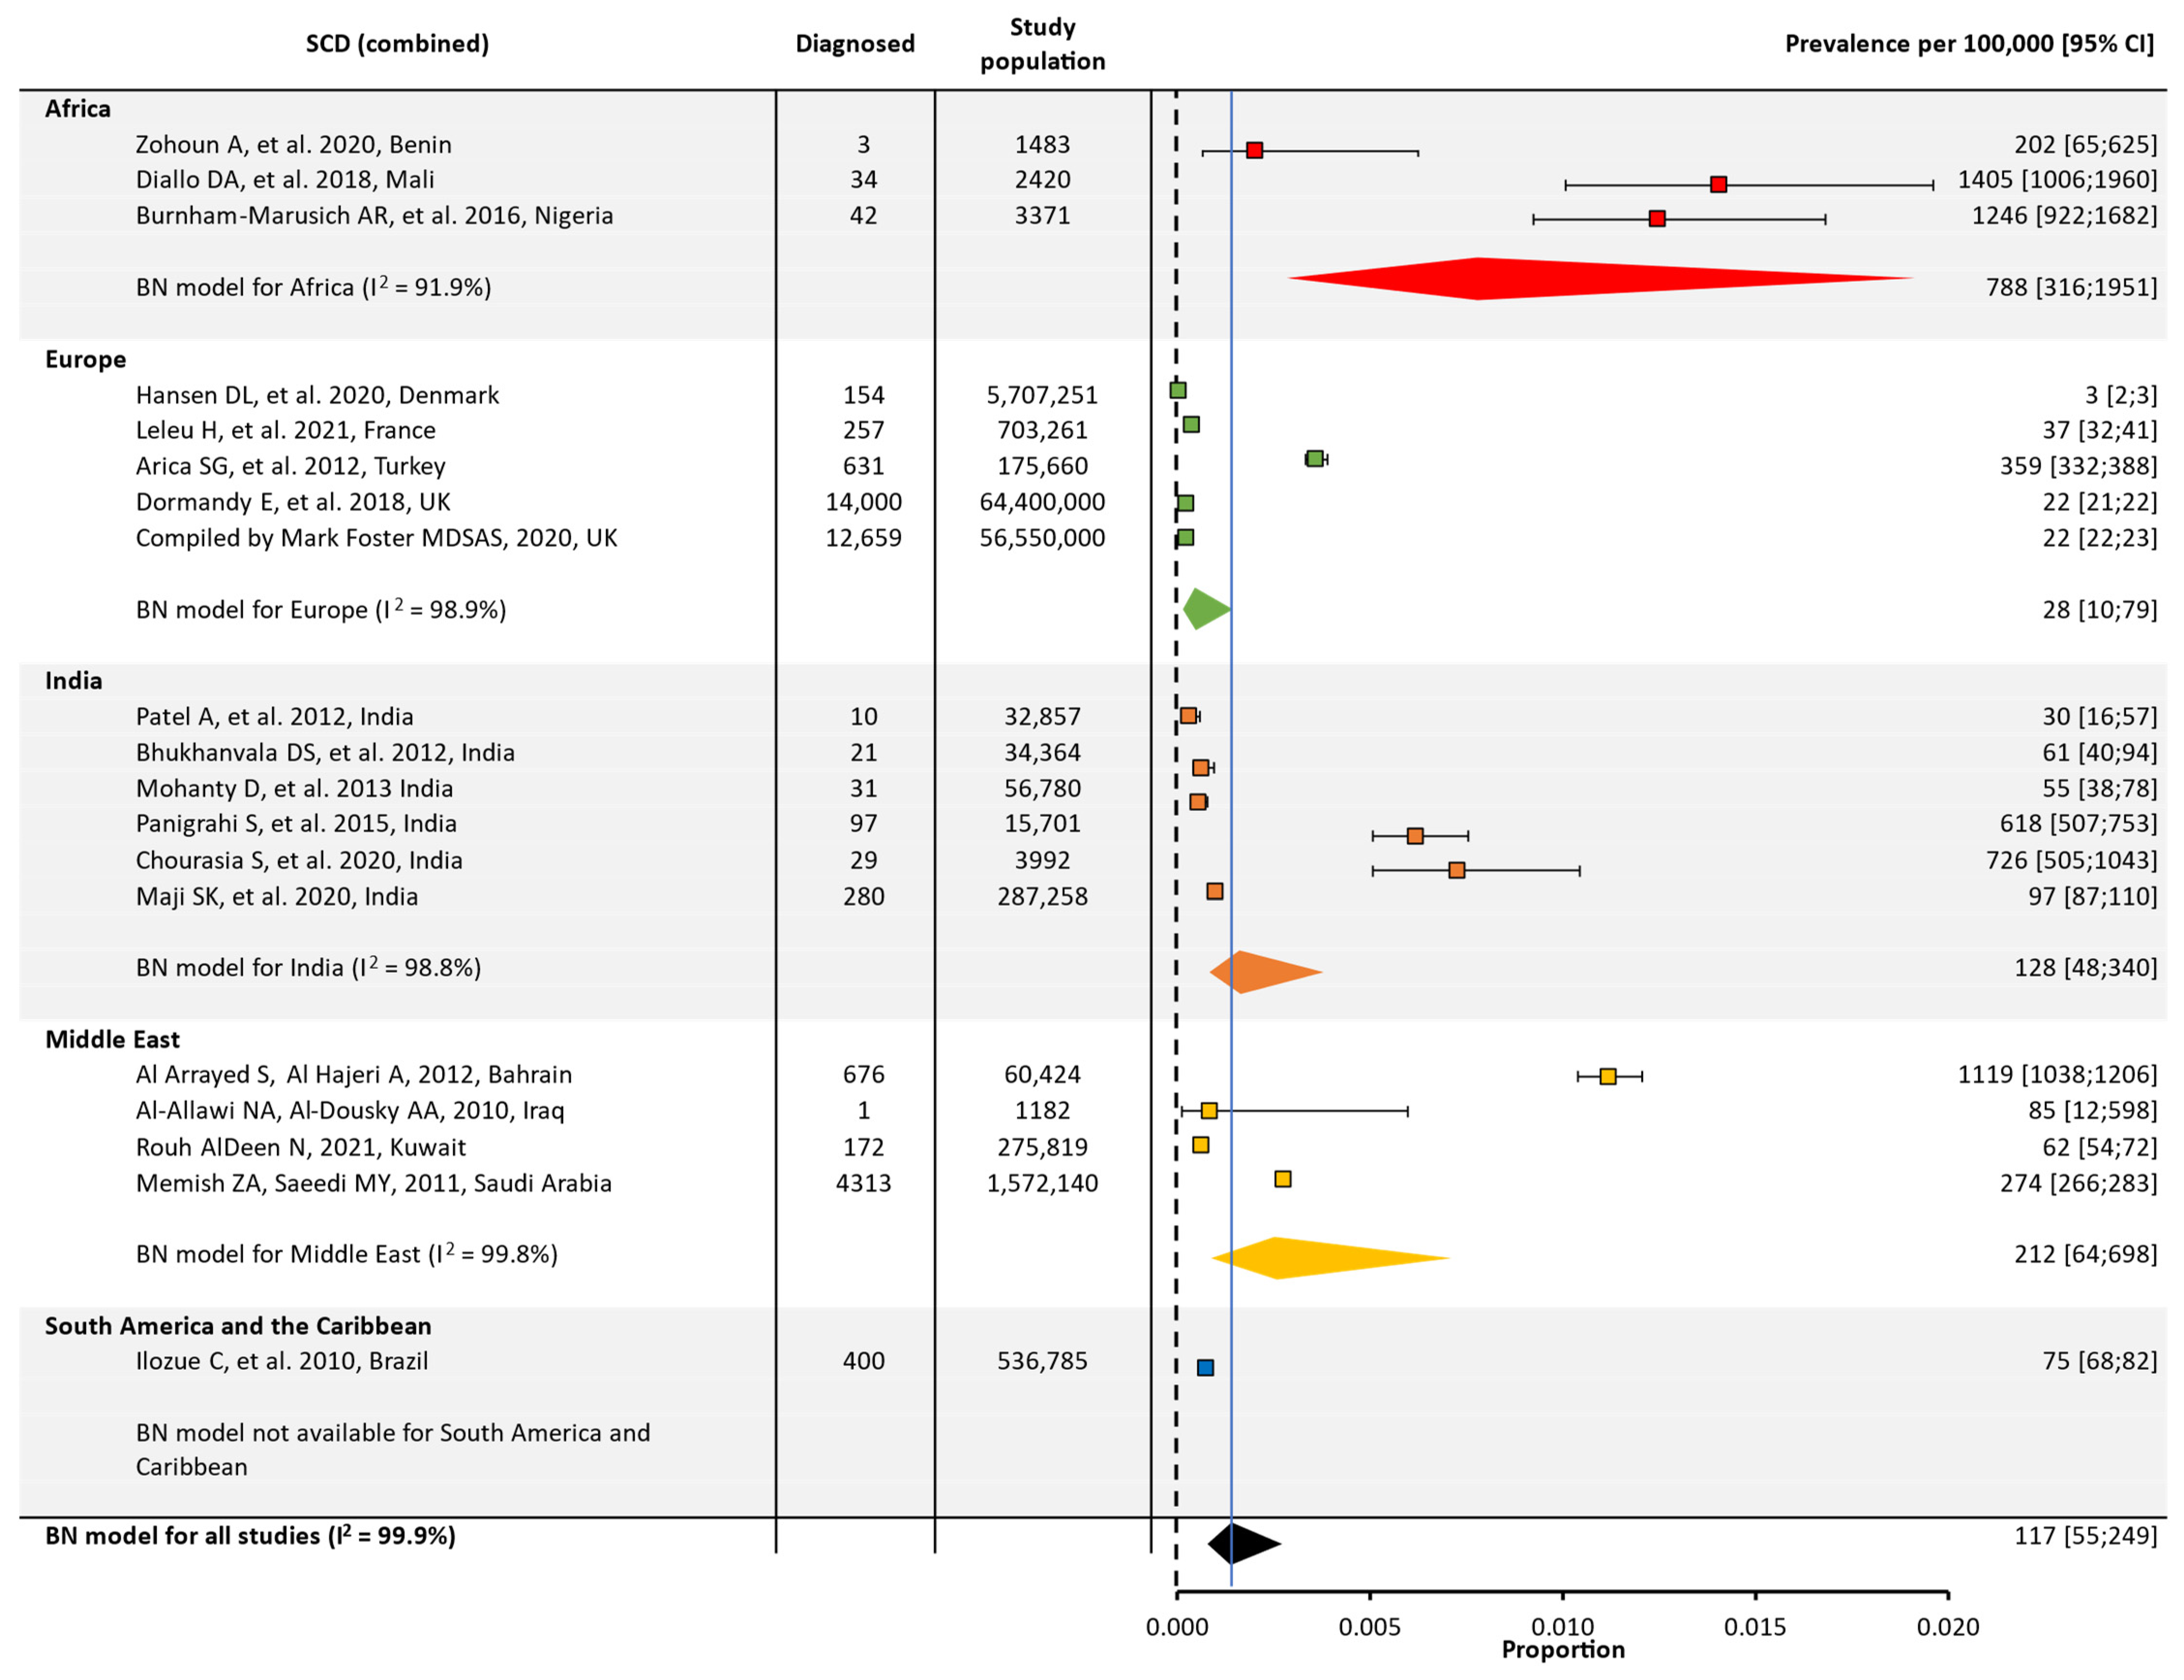
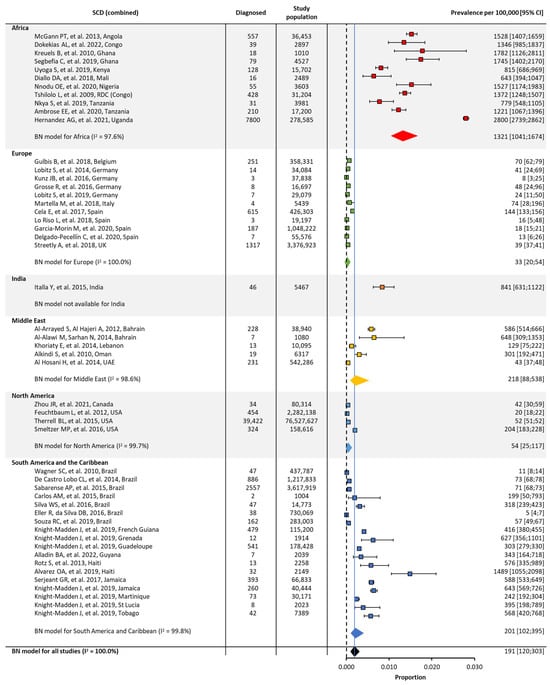
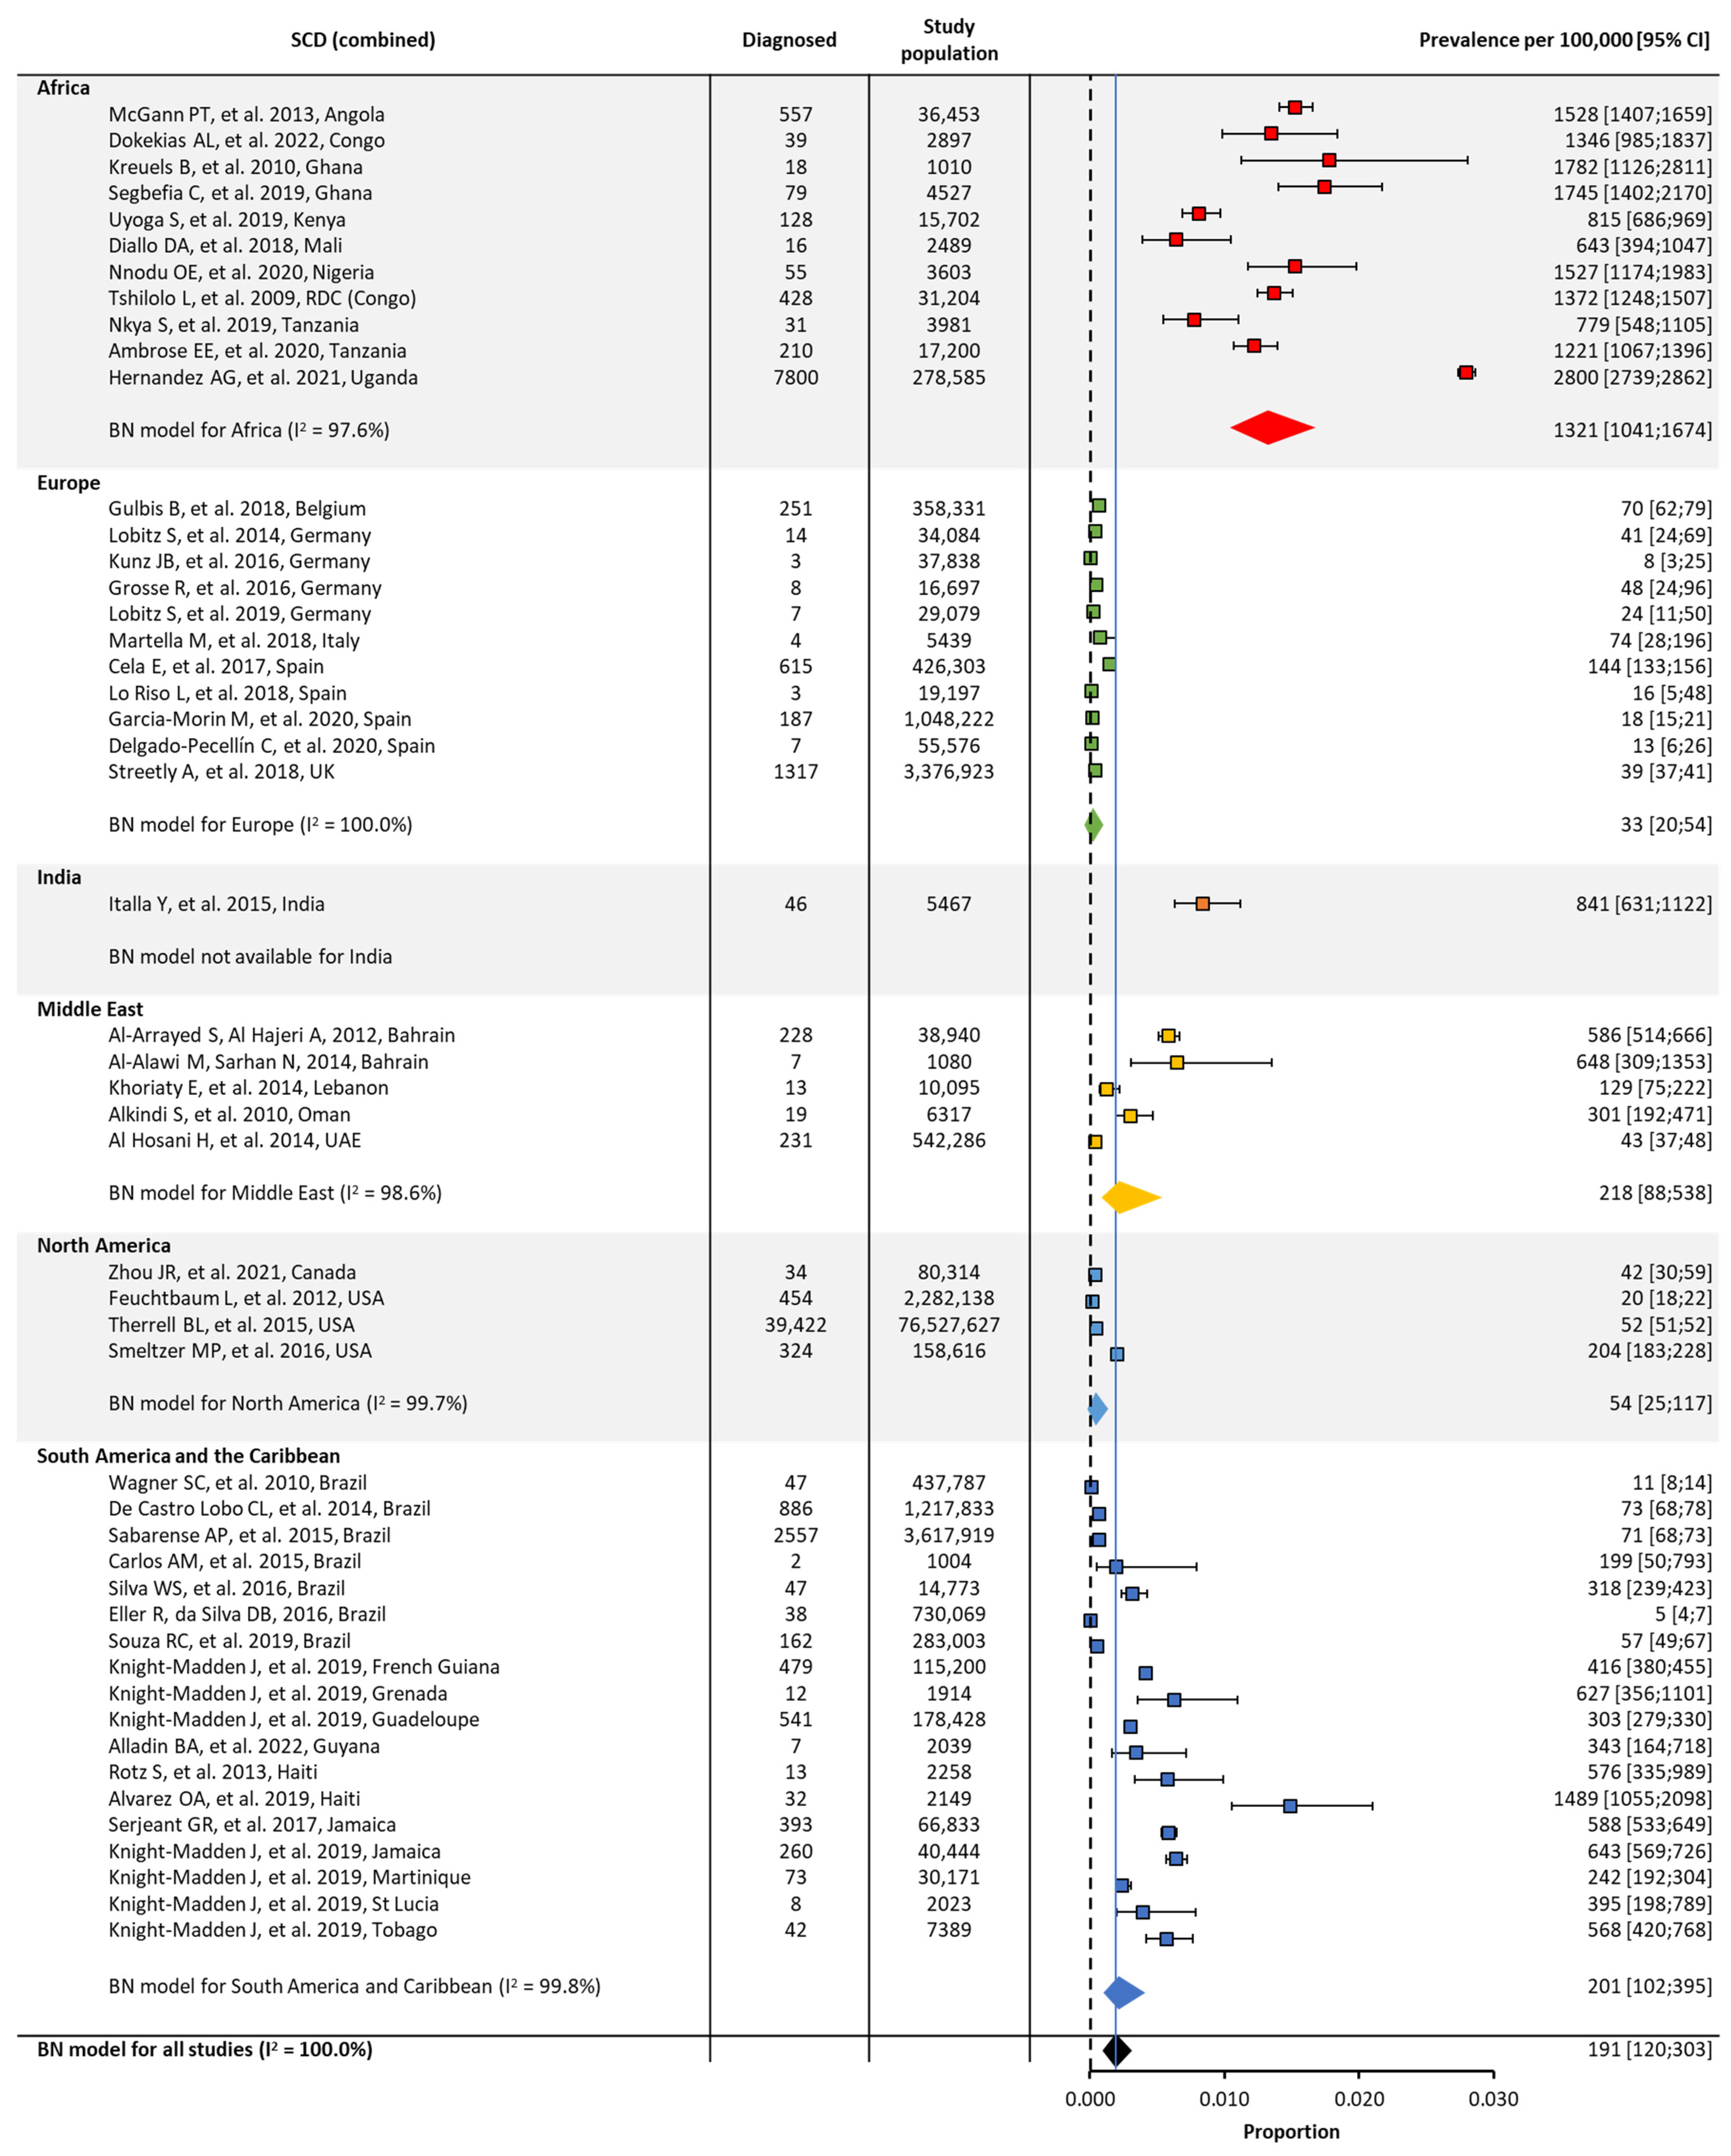
In the original publication, there was a mistake in Figure 2. The heterogeneity (I2) number for Europe and the confidence intervals have been adjusted. A reference citation for the Middle East has also been updated. The corrected Figure 2 appears below.
Figure 2.
Global and regional prevalence a of SCD in Africa [22–24], Europe [25–29], India [30–35], the Middle East [36–39], and South America/the Caribbean [40]. a Within each region, the prevalence was estimated using a binomial normal model, which assumed a binomial distribution for the individual studies with a mean value drawn from a normal distribution for a regional/global value. The prevalence for each reference was determined from the log odds. A summary estimate was determined for each region with >2 studies. North America had insufficient data to determine the prevalence of SCD. I2 describes the percentage of variation across studies that was due to heterogeneity rather than chance, scored from 0 to 100%, in which 100% is maximum heterogeneity. BN, binomial normal; CI, confidence interval; SCD, sickle cell disease.
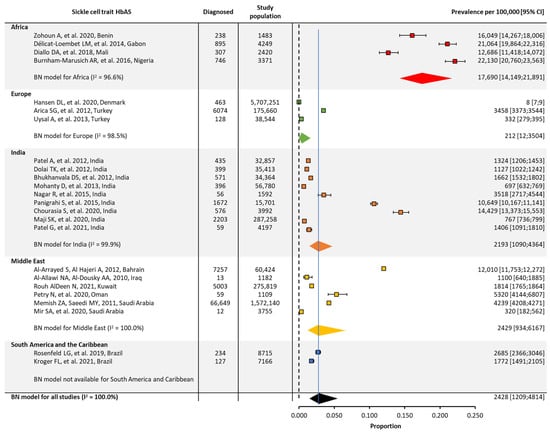
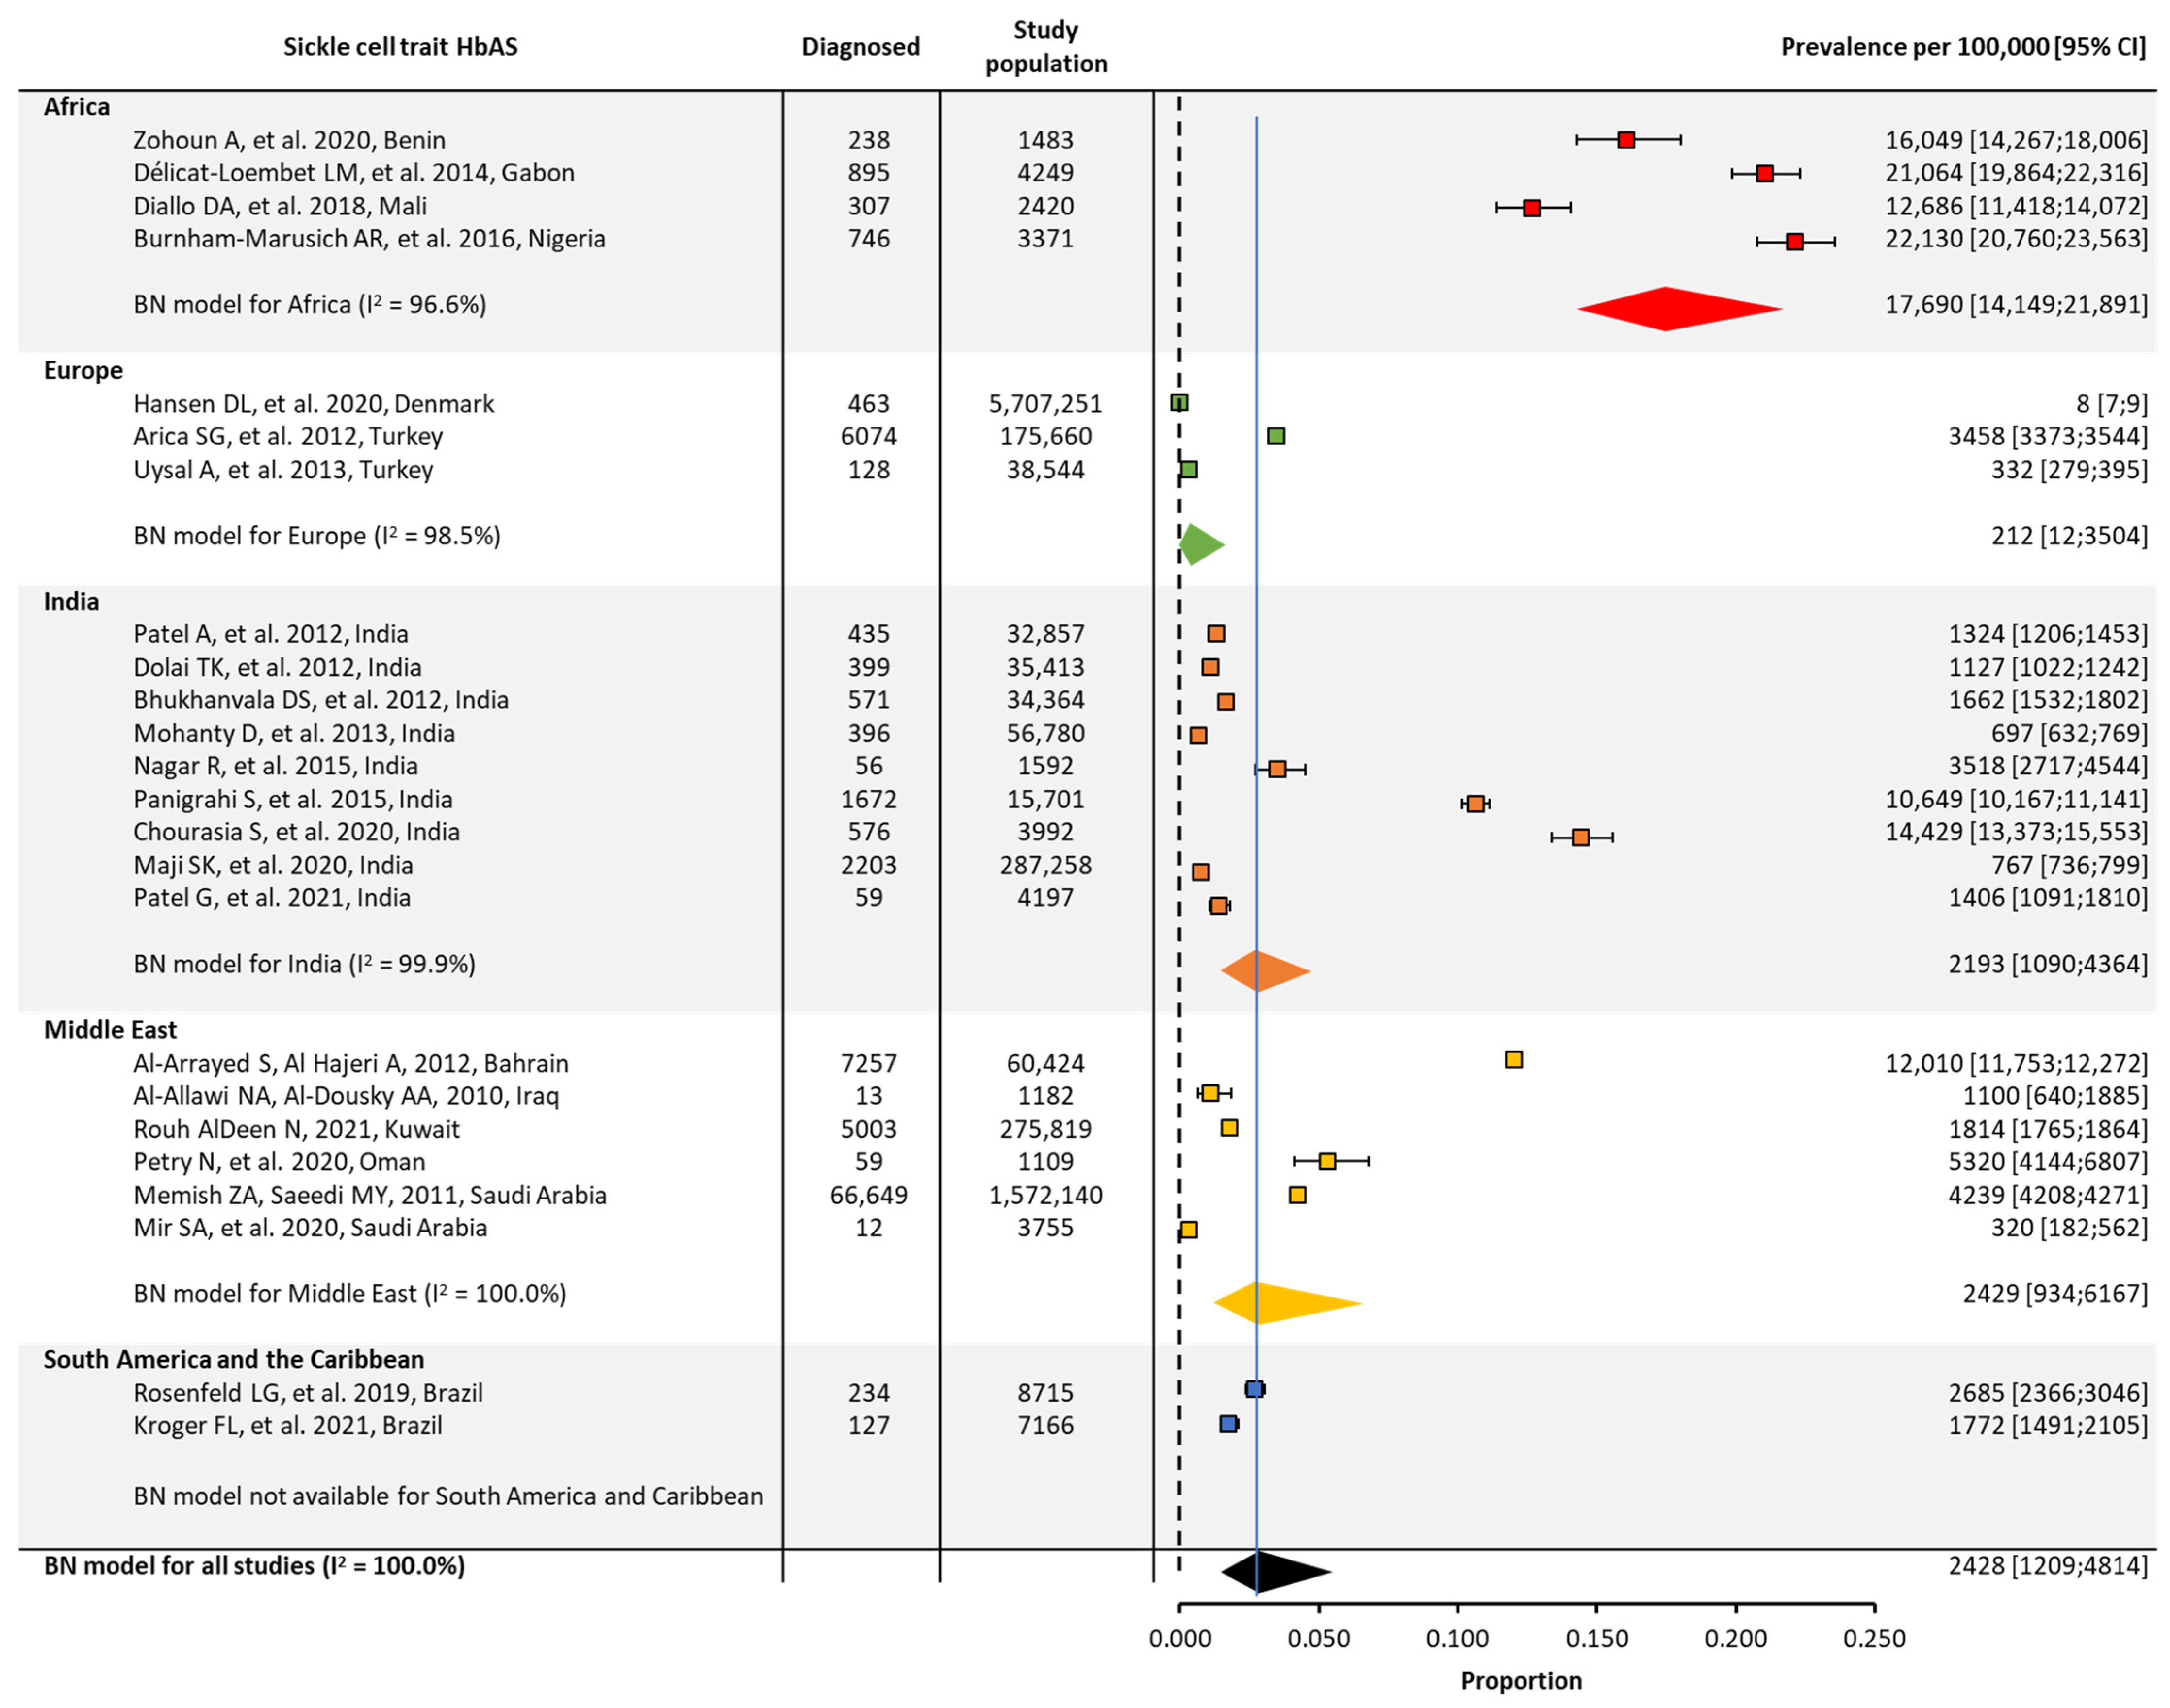
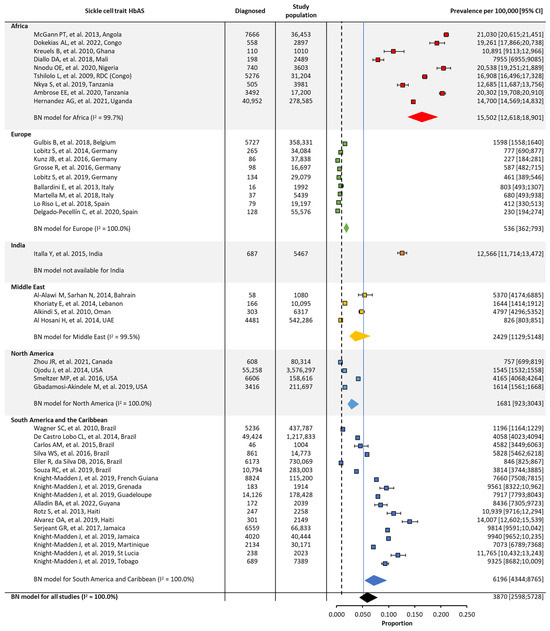
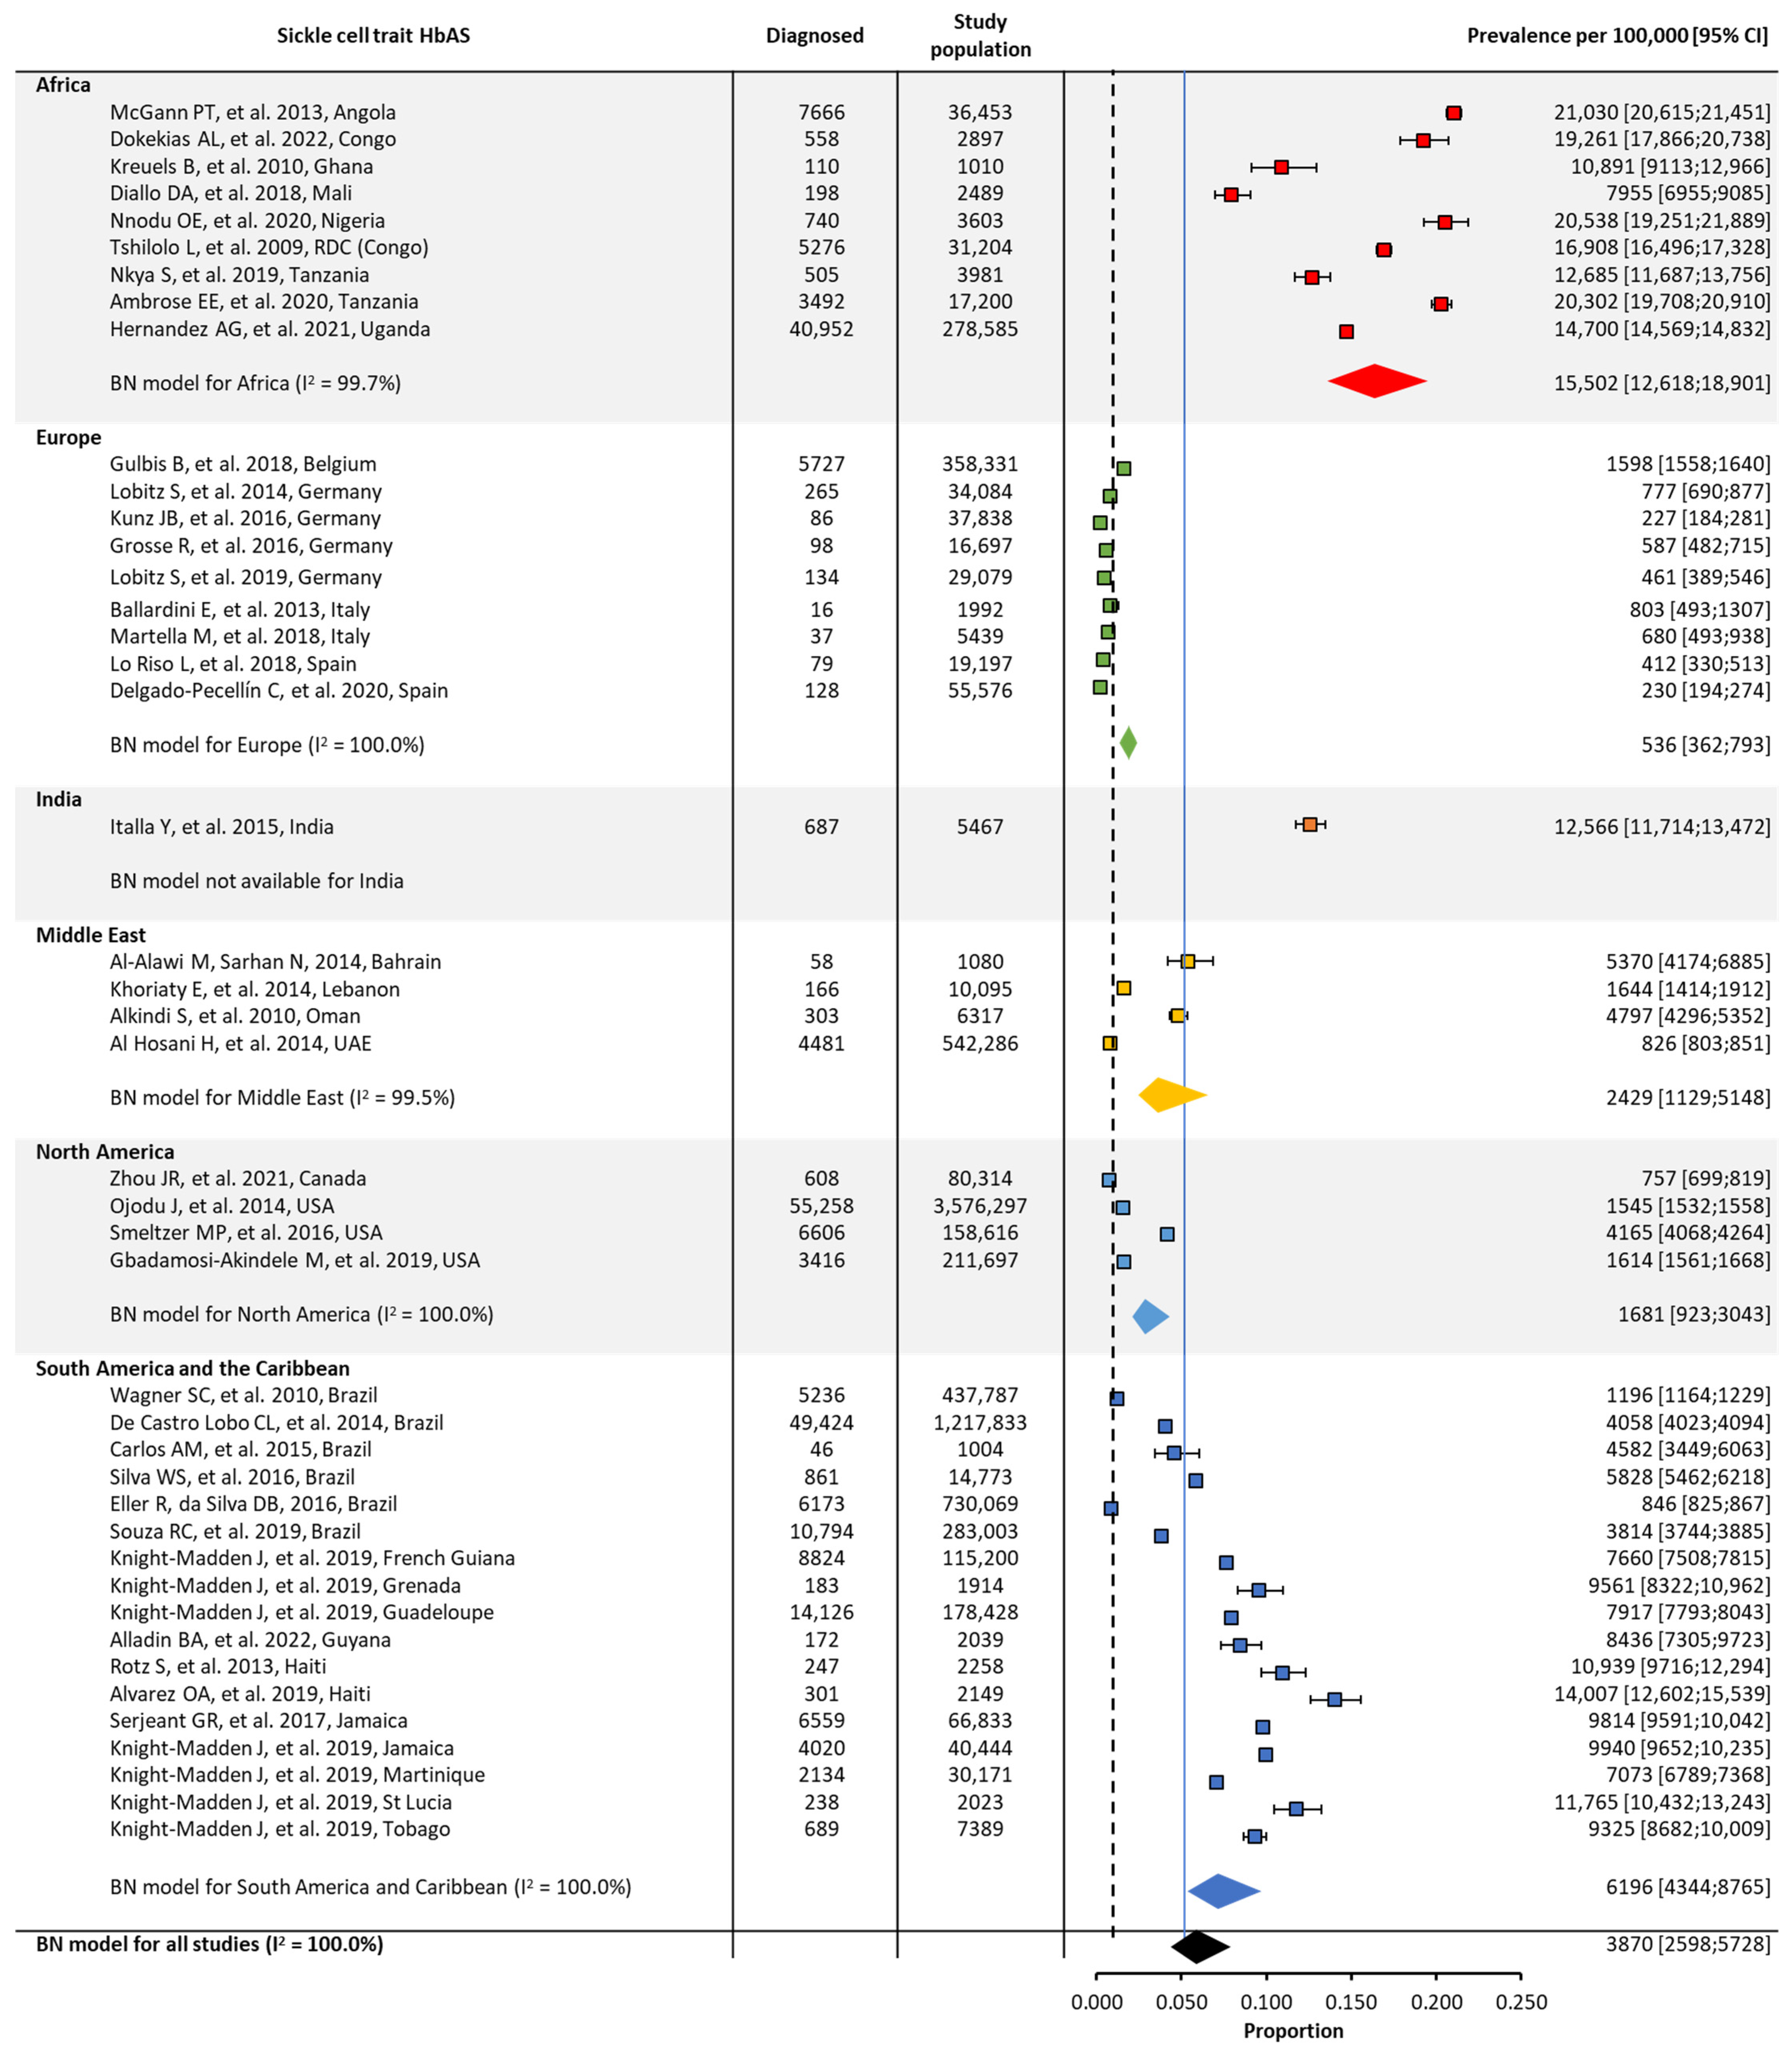
In the original publication, there was a mistake in Figure 3. The confidence intervals, the heterogeneity (I2) number for Europe, and the overall prevalence number have been adjusted. Additionally, a reference citation for the Middle East has been amended. The corrected Figure 3 appears below.
Figure 3.
Global and regional prevalence a of sickle cell trait in Africa [22–24,41], Europe [26,28,42], India [30–35,43–45], the Middle East [36–39,46,47], and South America/the Caribbean [48,49]. a Within each region, the prevalence was estimated using a binomial normal model, which assumed a binomial distribution for the individual studies with a mean value drawn from a normal distribution for a regional/global value. The prevalence for each reference was determined from the log odds. A summary estimate was determined for each region with >2 studies. North America had insufficient data to determine the prevalence of SCD. I2 describes the percentage of variation across studies that was due to heterogeneity rather than chance, scored from 0 to 100%, in which 100% is maximum heterogeneity. BN, binomial normal; CI, confidence interval; SCD, sickle cell disease.
In the original publication, there was a mistake in Figure 4. The confidence intervals, one prevalence number for Africa, the heterogeneity (I2) number for Europe, and the overall I2 number have been adjusted. A reference citation for the Middle East has also been updated. The corrected Figure 4 appears below.
Figure 4.
Global and regional birth prevalence a of SCD in Africa [23,50–59], Europe [60–70], India [71], the Middle East [39,72–75], North America [76–79], and South America/the Caribbean [80–91]. a Within each region, the birth prevalence was estimated using a binomial normal model, which assumed a binomial distribution for the individual studies with a mean value drawn from a normal distribution for a regional/global value. The prevalence for each reference was determined from the log odds. A summary estimate was determined for each region with >2 studies. I2 describes the percentage of variation across studies that was due to heterogeneity rather than chance, scored from 0 to 100%, in which 100% is maximum heterogeneity. BN, binomial normal; CI, confidence interval; SCD, sickle cell disease.
In the original publication, there was a mistake in Figure 5. One prevalence number for Europe, the confidence intervals, and one heterogeneity (I2) number for Europe have been adjusted. The corrected Figure 5 appears below.
Figure 5.
Global and regional birth prevalence a of sickle cell trait in Africa [23,50–54,57–59], Europe [61,63,65–70,92], India [71], the Middle East [72–75], North America [76,79,93,94], and South America/the Caribbean [80–83,85–91]. a Within each region, the birth prevalence was estimated using a binomial normal model, which assumed a binomial distribution for the individual studies with a mean value drawn from a normal distribution for a regional/global value. The prevalence for each reference was determined from the log odds. A summary estimate was determined for each region with >2 studies. I2 describes the percentage of variation across studies that was due to heterogeneity rather than chance, scored from 0 to 100%, in which 100% is maximum heterogeneity. BN, binomial normal; CI, confidence interval; SCD, sickle cell disease.
The authors state that the scientific conclusions are unaffected. These corrections were approved by the Academic Editor. The original publication has also been updated.
Reference
- Colombatti, R.; Hegemann, I.; Medici, M.; Birkegård, C. Systematic Literature Review Shows Gaps in Data on Global Prevalence and Birth Prevalence of Sickle Cell Disease and Sickle Cell Trait: Call for Action to Scale Up and Harmonize Data Collection. J. Clin. Med. 2023, 12, 5538. [Google Scholar] [CrossRef] [Scilit] [PubMed]

Disclaimer/Publisher’s Note: The statements, opinions and data contained in all publications are solely those of the individual author(s) and contributor(s) and not of MDPI and/or the editor(s). MDPI and/or the editor(s) disclaim responsibility for any injury to people or property resulting from any ideas, methods, instructions or products referred to in the content. |
© 2024 by the authors. Licensee MDPI, Basel, Switzerland. This article is an open access article distributed under the terms and conditions of the Creative Commons Attribution (CC BY) license (https://creativecommons.org/licenses/by/4.0/).