


Abstract
The rational development of microbiota-targeted therapeutics requires a combined assessment of the physiological effects of candidate microorganisms on the host and their ecological effects on the gut microbiota. The present study evaluates the toxicological properties and gut microbiota-related effects of a newly identified microorganism, designated as the Limosilactobacillus reuteri ATA-LTC-Lr050600 strain. In the 28-day single-dose limit study, conducted using OECD Guideline 407 as the methodological framework, no consistent pattern of adverse effects was observed in terms of the evaluated biochemical parameters, organ weights, and macroscopic findings. The 16S rRNA gene sequencing of faecal samples revealed time-dependent changes in microbial diversity and taxonomic composition. While an increase was observed in the relative abundance of the Lactobacillus and Bifidobacterium genera, which are associated with lactate and acetate production, no such increase was detected in taxa associated with butyrate and propionate production. While alpha diversity indices demonstrated only limited changes following probiotic supplementation, beta diversity analysis did not reveal any statistically significant changes in the overall microbial community structure. Following the implementation of a correction for multiple comparisons, statistical significance was not maintained for any of the redox-related parameters. When all findings are evaluated collectively, the results provide complementary information regarding the characterisation of the toxicological profile and microbiota-related effects of the L. reuteri ATA-LTC-Lr050600 strain.
1. Introduction
The gut microbiota represents a complex microbial ecosystem involved in host metabolic homeostasis, nutrient biotransformation, intestinal barrier function, and immune regulation [1,2,3,4,5]. Interactions between the microbiota and the host extend beyond local gastrointestinal processes and are associated with systemic immune and metabolic responses [3,4]. Alterations in microbial community structure and function have been linked to intestinal permeability, metabolic inflammation, and disrupted host–microbiota interactions [2,5]. These associations have encouraged research into approaches that modulate the gut microbiota, including dietary interventions that can influence human immune status [6,7]. However, probiotic effects cannot be generalized across all microorganisms. The definition of probiotics emphasizes a demonstrated health benefit, while published evidence highlights the importance of considering the characteristics of the specific strain and the context in which it is evaluated [8,9]. Accordingly, the evaluation of a new probiotic candidate requires strain-specific assessment of its safety profile and potential effects on the intestinal microbial community rather than reliance on species-level identity alone.
Limosilactobacillus reuteri has been investigated for its interactions with the intestinal environment, mucosal immunity, and microbial metabolism. Studies of selected strains have reported effects on intestinal mucosal responses and epithelial repair in experimental models [10,11]. In addition, L. reuteri has been shown to induce CD4+CD8αα+ intraepithelial T cells under specific experimental conditions, demonstrating that particular strains can influence intestinal immune responses [12]. Research has examined the antimicrobial activity of reuterin, a glycerol-derived compound associated with L. reuteri, and its potential effects on microbial community composition and metabolite profiles in gut microbiota systems [13,14]. The probiotic, antimicrobial and immunomodulatory properties of L. reuteri are strain-dependent and are related to the metabolic characteristics of individual strains [15].
Safety assessment is an essential component of the evaluation of probiotic candidates intended for oral administration. L. reuteri has been investigated in different food and health-related applications, and safety-related assessments have been conducted for specific strains. In Europe, the Qualified Presumption of Safety (QPS) approach developed by the European Food Safety Authority (EFSA) provides a framework for evaluating microorganisms at the taxonomic unit level. In the United States, certain L. reuteri strains have also been the subject of Generally Recognized as Safe (GRAS) notifications to the Food and Drug Administration (FDA). However, these assessments are specific to their respective regulatory frameworks and intended uses and should not be interpreted as establishing the safety of every strain of the species. Previous studies have examined the tolerability of particular L. reuteri strains in clinical or experimental settings, including studies of supplementation and intestinal responses [16,17]. Nevertheless, evidence obtained from other strains cannot establish the safety profile of a newly isolated candidate, including L. reuteri ATA-LTC-Lr050600, which requires strain-specific experimental evaluation. OECD Test Guideline 407 provides a standardized framework for assessing the effects of repeated oral administration over 28 days in rodents [18].
In addition to toxicological observations and serum biochemical measurements [16,17], faecal microbiota profiling can be used to characterize changes in microbial diversity and taxonomic composition following administration. Probiotics can influence microbial ecology and may inhibit the establishment of pathogenic microorganisms, although these effects may vary depending on the strain and experimental context [19,20]. A pilot study of Limosilactobacillus reuteri LMG-P 27481 investigated gut microbiota diversity and function following oral administration, providing a relevant precedent for microbiota-associated assessment [21]. Nevertheless, changes in alpha diversity, beta diversity, or the relative abundance of selected taxa should not, in isolation, be interpreted as evidence of improved host health, stable colonization, or a specific metabolic benefit. Although previous research has described antimicrobial activities of L. reuteri and its associated metabolites, these effects should not be assumed to occur uniformly across strains or experimental settings [11,13]. Accordingly, microbiota measurements should be interpreted as complementary ecological outcomes rather than direct evidence of probiotic efficacy.
The present study investigated the newly isolated L. reuteri ATA-LTC-Lr050600 strain through toxicological and faecal microbiota assessments. The candidate strain was evaluated in a 28-day repeated-dose oral toxicity study conducted in rats, using OECD Test Guideline 407 as the methodological framework [18]. Serum biochemical parameters, redox-related measurements, absolute organ weights, and macroscopic findings were evaluated to characterize the responses associated with strain administration. In addition, 16S rRNA gene sequencing of faecal samples collected at baseline (Day 0) and Day 15 was performed to examine temporal changes in microbial diversity and taxonomic composition. The study aimed to provide strain-specific experimental data on the toxicological findings and faecal microbiota changes associated with L. reuteri ATA-LTC-Lr050600.
2. Materials and Methods
2.1. Origin and Preparation of the Probiotic Material
The bacterial candidate evaluated in this investigation, L. reuteri ATA-LTC-Lr050600, originates from the intestinal microbiota of a healthy human donor residing in the Balıkesir province of Türkiye. For standardization and long-term traceability, the isolate has been cryopreserved and cataloged within the institutional repository of the ATA Culture Collection [accession identifier: 159-RE.
L. reuteri ATA-LTC-Lr050600 was produced as a viable lyophilized probiotic preparation under controlled manufacturing conditions. The master culture was activated under anaerobic conditions and propagated in an appropriate growth medium. After reaching the required cell density, the seed culture was transferred to a bioreactor at a 5% inoculation ratio and fermented anaerobically for 72 h. Following fermentation, the bacterial cells were coated with a sodium alginate–inulin formulation, recovered by centrifugation, rapidly frozen at −80 °C, and subsequently lyophilized. The sodium alginate–inulin matrix was used as a protective formulation to enhance bacterial stability during processing and storage. The final lyophilized preparation was standardized to contain approximately 109–1011 CFU/g of culturable L. reuteri ATA-LTC-Lr050600 cells and was stored under controlled room-temperature conditions until use [22].
The bacterial candidate evaluated in this investigation, L. reuteri ATA-LTC-Lr050600, originates from the intestinal microbiota of a healthy human donor residing in Balıkesir province, Türkiye. For standardization and long-term traceability, the isolate was cryopreserved and catalogued within the institutional repository of the ATA Culture Collection (JBBMOQ000000000).
L. reuteri ATA-LTC-Lr050600 was produced as a viable lyophilized probiotic preparation under controlled manufacturing conditions. The master culture was activated under anaerobic conditions and propagated in an appropriate growth medium. After reaching the required cell density, the seed culture was transferred to a bioreactor at a 5% inoculation ratio and fermented anaerobically for 72 h. Following fermentation, the bacterial cells were coated with a sodium alginate–inulin formulation, recovered by centrifugation, rapidly frozen at −80 °C, and subsequently lyophilized. The sodium alginate–inulin matrix served as a protective formulation during processing and storage. The final lyophilized preparation contained approximately 109–1011 CFU/g of culturable L. reuteri ATA-LTC-Lr050600 cells.
Before administration, the lyophilized preparation was [describe preparation and suspension procedure] and administered by oral gavage at a targeted dose of 1000 mg/kg body weight/day for 28 days. The vehicle used for the control group was sterile drinking water.
2.2. Animal Study
2.2.1. Ethical Approval and Animal Husbandry
All in vivo experimental protocols received formal ethical clearance from the Local Animal Care and Use Committee at the Izmir Biomedicine and Genome Center. The local ethics committee evaluated and approved two distinct protocols on the same date (10 April 2025): Protocol 2025-011 was dedicated entirely to the 28-day repeated-dose oral toxicity study, while Protocol 2025-003 was exclusively designed for the independent gut microbiota study. No animals or control groups were shared between these two experimental cohorts, nor were they shared with any other study. The study was strictly executed in compliance with relevant institutional animal welfare requirements and reported according to the ARRIVE 2.0 guidelines [23]. Although designed using the general principles of OECD Test Guideline 407, the study was conducted in an academic research environment and is therefore non-GLP (Good Laboratory Practice)-compliant. The animals and biological samples evaluated in the present study originated from the 28-day repeated-dose oral administration experiment, specifically focusing on serum biochemical, redox-related, absolute organ-weight, and macroscopic findings.
Healthy, specific pathogen-free [SPF] Wistar albino rats, weighing between 180 and 220 g [6–8 weeks old], were procured from the IBG breeding facility. Prior to any experimental intervention, the rodents were subjected to a one-week habituation phase to minimize stress. Throughout the duration of the study, the subjects were singly housed in individually ventilated stainless-steel cages. The vivarium was maintained under continuously monitored, standardized macroenvironmental parameters, which included a strict 12-h circadian light/dark cycle, an ambient temperature of 22 ± 3 °C, and relative humidity strictly regulated at 50 ± 20%. Standard laboratory rodent chow [LabDiet® 5001, LabDiet, St. Louis, MO, USA; catalog no. 5001] and drinking water were provided ad libitum. Environmental enrichment, including wooden gnawing blocks and nesting material, was provided throughout the study.
Group size was predetermined based on the minimum number of animals recommended in OECD Test Guideline 407 for repeated-dose oral toxicity studies. Accordingly, five animals of each sex were included in each experimental cohort.
2.2.2. Experimental Design
For the in vivo exposure model, experimental cohorts were randomly assigned to either the vehicle Control or the L. reuteri ATA-LTC-Lr050600 treatment group [n = 5/sex/group] using a computer-generated randomization sequence stratified by baseline body weight. The study was conducted as a 28-day single-dose limit study using OECD Test Guideline 407 as the methodological framework. The subjects received the lyophilized probiotic formulation at a targeted dosage of 1000 mg/kg body weight per day.
The subjects received the lyophilized probiotic formulation at a targeted dosage of 1000 mg/kg body weight per day.
The test material or an equivalent volume of the aqueous vehicle [sterile drinking water] was introduced directly into the stomach via oral gavage once daily over a continuous 28-day timeframe. Dose volumes were dynamically adjusted to reflect individual body weight measurements. Upon completion of the 28-day regimen, animals allocated to the main groups were euthanized for biological sampling.
Concurrently, additional Control Recovery and L. reuteri Recovery subsets [each comprising 5 males and 5 females] were maintained for a 14-day treatment-free observation phase. This period was incorporated to monitor the potential reversibility or persistence of any biochemical and macroscopic findings following treatment withdrawal.
2.3. Biochemical and Histopathological Assessment
2.3.1. Blood Collection and Serum Biochemical Analysis
Upon conclusion of the respective 28-day administration and 14-day recovery phases, all animals were subjected to an overnight fasting protocol with unrestricted access to drinking water. Surgical-plane anesthesia was achieved via an intraperitoneal injection cocktail of ketamine [80 mg/kg; Atafen, Izmir, Türkiye] and xylazine [10 mg/kg; Piramal Critical Care, Bethlehem, PA, USA]. While fully anesthetized, terminal blood specimens were secured through intracardiac puncture.
For the biochemical panel, samples were transferred into serum separator tubes [SST; BD Vacutainer, catalog no. BDAM368879] and processed following standard laboratory protocols. The quantitative determination of systemic markers—specifically alanine aminotransferase [ALT], aspartate aminotransferase [AST], alkaline phosphatase [ALP], urea, creatinine, glucose, total cholesterol, triglycerides, albumin, total protein, total bilirubin, sodium—was performed utilizing an automated RX Daytona Plus clinical chemistry analyzer [Randox Laboratories Ltd., Crumlin, County Antrim, UK] strictly according to the manufacturer’s specifications.
2.3.2. Assessment of Total Antioxidant and Oxidant Status
Blood samples were collected into serum tubes and allowed to clot for 30 min. Subsequently, the tubes were subjected to a centrifugation process at 1500× g for a duration of 10 min. The resulting serum samples were stored at −80 °C until the day of analysis. Serum total antioxidant status (TAS) and total oxidant status (TOS) levels were determined spectrophotometrically using commercial colorimetric assay kits (Rel Assay Diagnostics, Gaziantep, Turkiye) in accordance with the manufacturer’s instructions [24]. Based on the manufacturer’s validation data, the intra-assay and inter-assay coefficients of variation (CVs) were 3.3% and 2.8% for the TAS assay and 3.9% and 3.2% for the TOS assay, respectively. The oxidative stress index (OSI) was calculated in order to assess the balance between total oxidant status (TOS) and total antioxidant status (TAS). TOS levels were expressed in µmol H2O2 equivalent/L, while TAS levels were expressed in mmol Trolox equivalent/L [25]. Prior to calculating the OSI, TAS values were converted from mmol Trolox equivalent/L to µmol Trolox equivalent/L to ensure consistency in units. The OSI was calculated by multiplying the ratio of TOS levels to TAS levels by 100 [18].
2.3.3. Necropsy and Organ Weight Determination
Following terminal blood collection, all animals underwent comprehensive necropsy examinations. The brain, heart, liver, kidneys, spleen, thymus, adrenal glands, and reproductive organs were examined macroscopically, and absolute organ weights were recorded in grams. Organ weights and macroscopic findings were evaluated separately by sex and study phase. The main groups were examined on Day 28, whereas the recovery groups were examined after an additional 14-day treatment-free period (Day 42); only organs and tissues actually assessed in each phase are reported. For organ-weight endpoints, group comparisons used individual recorded weights, with the parameter-specific Grubbs exclusions reflected in the original laboratory summaries.
2.4. Gut Microbiota Analysis by 16S rRNA Gene Sequencing
To assess the compositional dynamics of the gut microbiota, 16S rRNA gene amplicon sequencing was performed under a separate ethical clearance granted by the Izmir Biomedicine and Genome Center Ethics Committee [Protocol No. 2025-003]. An independent cohort consisting of 120 female Wistar albino rats was administered L. reuteri ATA-LTC-Lr050600 via daily oral gavage over a 14-day period. To prevent microbial cross-contamination via coprophagy, all animals in this cohort were singly housed in individually ventilated stainless-steel cages under identical environmental conditions to the toxicity cohort. In strict compliance with animal welfare and experimental orthogonality protocols, no subjects or controls from the 28-day repeated-dose toxicity cohort (Protocol 2025-011) were repurposed for this phase of the study. Fresh fecal pellets were systematically collected at baseline [Day 0] and post-intervention [Day 15] to evaluate longitudinal shifts in microbial diversity and taxonomic profiles.
Total genomic DNA was isolated from the fecal aliquots utilizing the High Pure PCR Template Preparation Kit [Roche Diagnostics, Mannheim, Germany] following the manufacturer’s instructions. DNA yield and integrity were quantified via the Quant-iT PicoGreen dsDNA Assay Kit [Thermo Fisher Scientific, Waltham, MA, USA]. The V4 hypervariable region of the bacterial 16S rRNA gene was amplified using the 515F/806R primer pair. The resulting amplicons were barcoded using the Nextera XT Index Kit [Illumina, San Diego, CA, USA], normalized to equimolar ratios, and sequenced on an Illumina MiSeq instrument employing MiSeq Reagent Kit v3 chemistry [yielding 2 × 250 bp paired-end reads].
Raw sequence data from the 16S rRNA gene amplicon sequencing were imported into the QIIME2 framework (version 2023.2) for bioinformatic processing. The DADA2 pipeline was applied for stringent quality filtering, sequence denoising, chimera eradication, and the resolution of amplicon sequence variants (ASVs). Taxonomic classification of the ASVs was conducted against the SILVA 138 reference database. The relative abundance of the genus Lactobacillus, as assigned by the SILVA 138 reference database, increased in all five probiotic-treated animals, with the mean relative abundance rising from 3.83% at baseline to 43.99% at Day 15. However, this change did not reach statistical significance (paired p = 0.0625), and the group × time interaction was not significant after FDR correction (q = 0.34). All subsequent data organization and downstream bioinformatic analyses were executed in a single unified pipeline within the R environment (version 4.6.1) relying on the phyloseq package. Sample labels were cross-checked between taxonomic levels and against raw read counts; two pairs of mislabelled probiotic samples were corrected before analysis.
Intra-sample (alpha) diversity was quantified using the Chao1, Shannon, and Simpson indices. Inter-sample (beta) diversity was strictly assessed using Bray–Curtis, Jaccard, and Aitchison distances calculated from centred log-ratio (CLR)-transformed abundance data, as appropriate for each distance metric. Principal component analysis (PCA) was performed using CLR-transformed data, while principal coordinate analysis (PCoA) was used to visualize the distance-based beta-diversity patterns. Published data from healthy Wistar albino rats were used as a literature reference for the descriptive comparison of the fecal microbiota findings. These data were used solely for contextual interpretation and were not treated as a concurrent control group; no direct statistical comparisons were performed. SCFA producers were defined a priori as literature-based functional groups: butyrate producers [26] and propionate producers [26,27]. The species included in these functional groups are detailed in Supplementary Table S6.
2.5. Statistical Analysis
Statistical analyses of the toxicological endpoints were performed separately for female and male rats and separately for the main and recovery cohorts. Continuous variables are presented as mean ± standard deviation (SD). Comparisons between corresponding control and *L. reuteri*-treated groups were performed using two-sided exact permutation tests. To account for multiple comparisons, raw p-values for biochemical, redox-related, and organ-weight endpoints were adjusted using the Holm method within each endpoint family, separately for each sex and study phase. Mean differences with 95% confidence intervals and Hedges’ *g* effect sizes were additionally calculated. Macroscopic findings were summarized descriptively. Holm-adjusted *p*-values < 0.05 were considered statistically significant.
For the gut microbiota data, differences in microbial community composition over time were evaluated using permutational multivariate analysis of variance (PERMANOVA) implemented with the *adonis2* function in the *vegan* package (version 2.7-6). To account for the paired longitudinal sampling design, permutations were restricted within individual animals using the *permute* package. Differential abundance analysis at the phylum, genus, and species hierarchies was performed utilizing DESeq2 (version 1.52.0) and ANCOM-BC2 (version 2.14.0), alongside Linear discriminant analysis Effect Size (LEfSe) for identifying discriminant taxa. Paired longitudinal comparisons between Day 0 and Day 15 were additionally evaluated using the exact two-sided Wilcoxon signed-rank test. Differences between groups in the change over time (group × time interaction) were tested with the Mann–Whitney U test on per-animal differences. The Benjamini–Hochberg method was utilized for multiple testing corrections (false discovery rate, FDR). Statistical significance was defined a priori as *p* < 0.05 or *q* < 0.05 after adjustment.
Because each animal was sampled on Day 0 and Day 15, within-group changes were tested with the exact two-sided Wilcoxon signed-rank test. Differences between groups in the change over time (group × time interaction) were tested with the Mann–Whitney U test on per-animal differences (Day 15–Day 0). With five and six pairs, the smallest attainable p-values are 0.0625 and 0.031, respectively. Taxa present in at least 25% of samples with a mean relative abundance of at least 0.1% were tested, and p-values were adjusted with the Benjamini–Hochberg method within each taxonomic level and test family. Beta diversity was tested with PERMANOVA (vegan adonis2), with permutations restricted within animals and complete enumeration. Differential abundance of genera was assessed with DESeq2 (paired design with animals nested within groups, poscounts size factors, and ashr shrinkage) and with ANCOM-BC2 (random intercept for animal). Analyses were performed in R 4.6.1 (vegan 2.7-6, DESeq2 1.52.0, ANCOMBC 2.14.0.
3. Results
3.1. Biochemical Parameters of Animal Studies
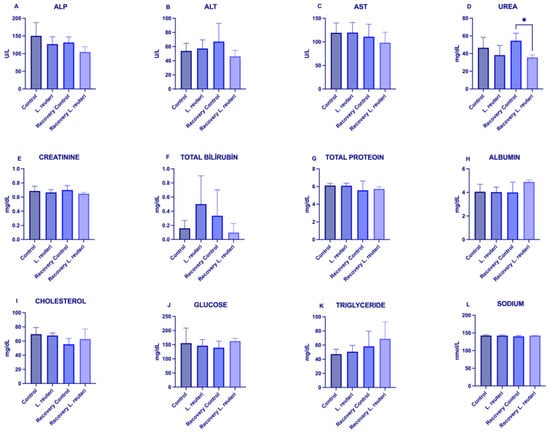
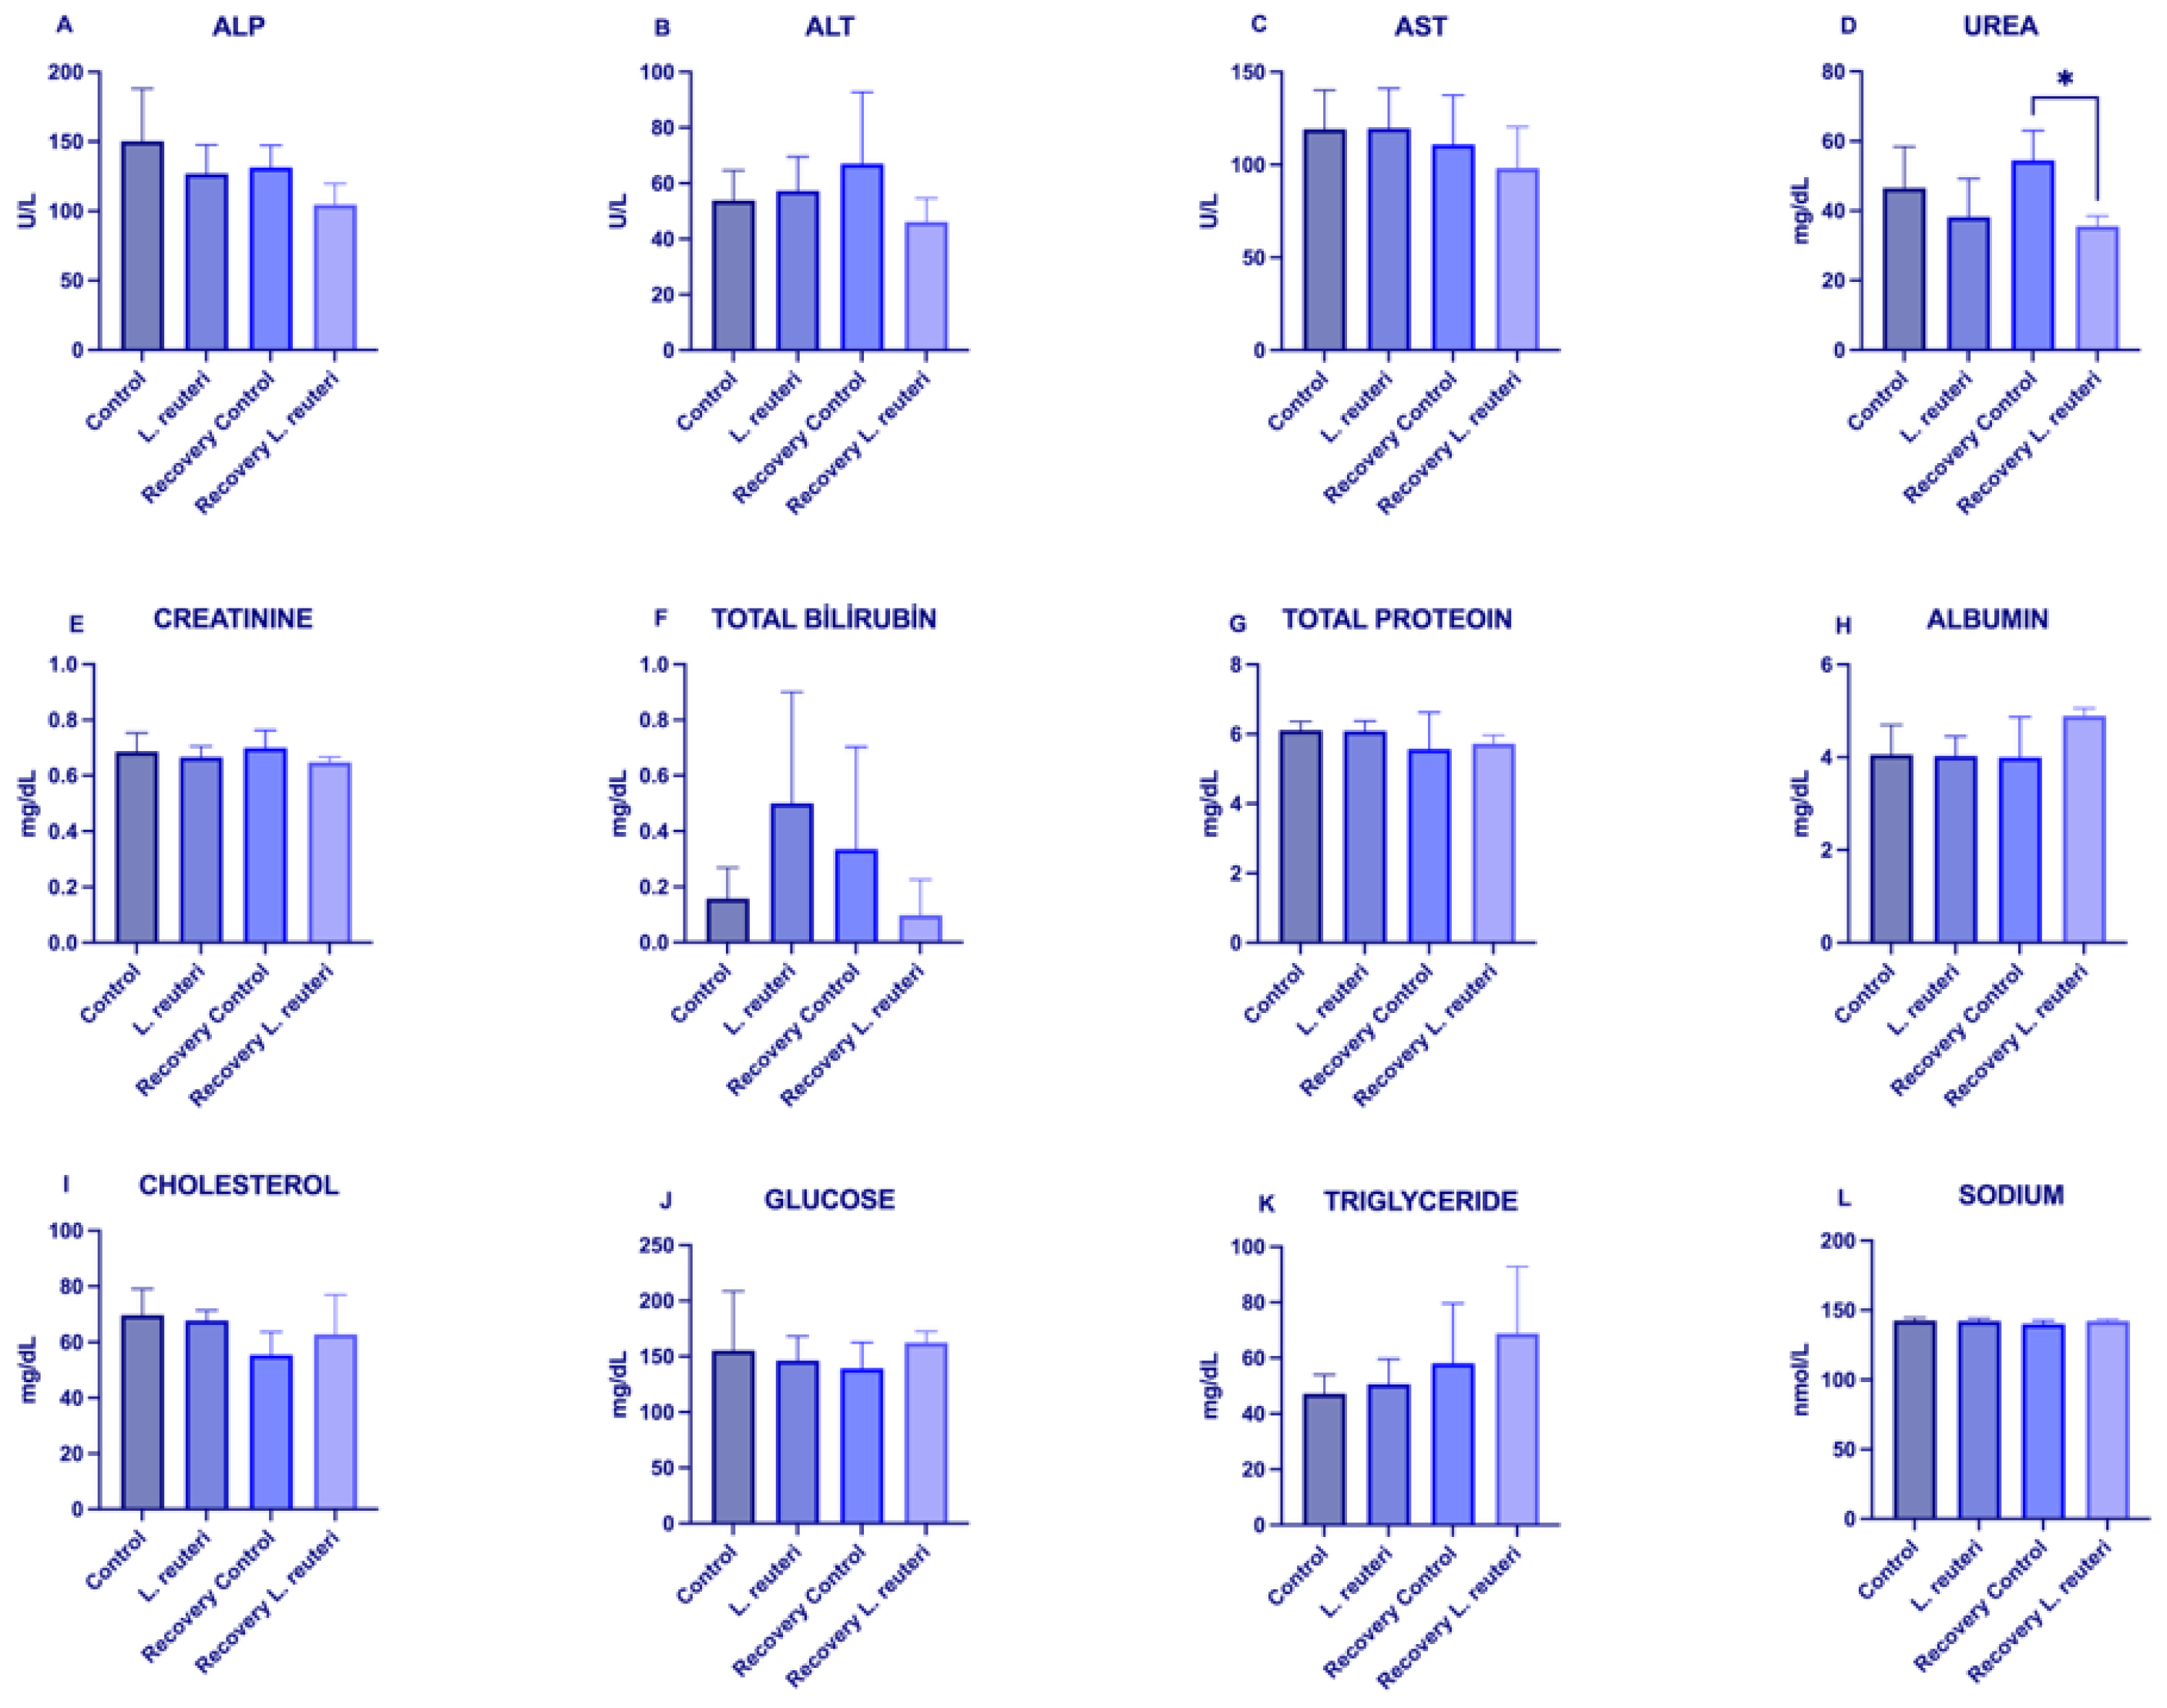
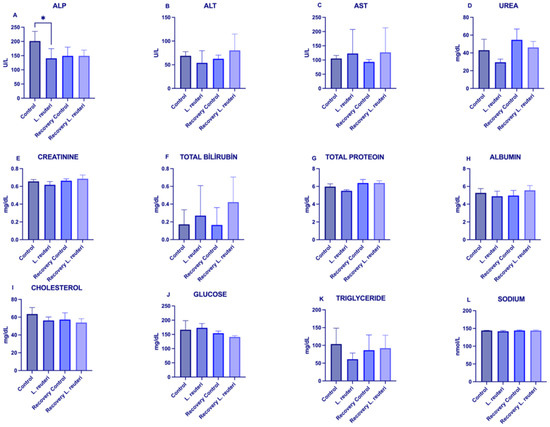
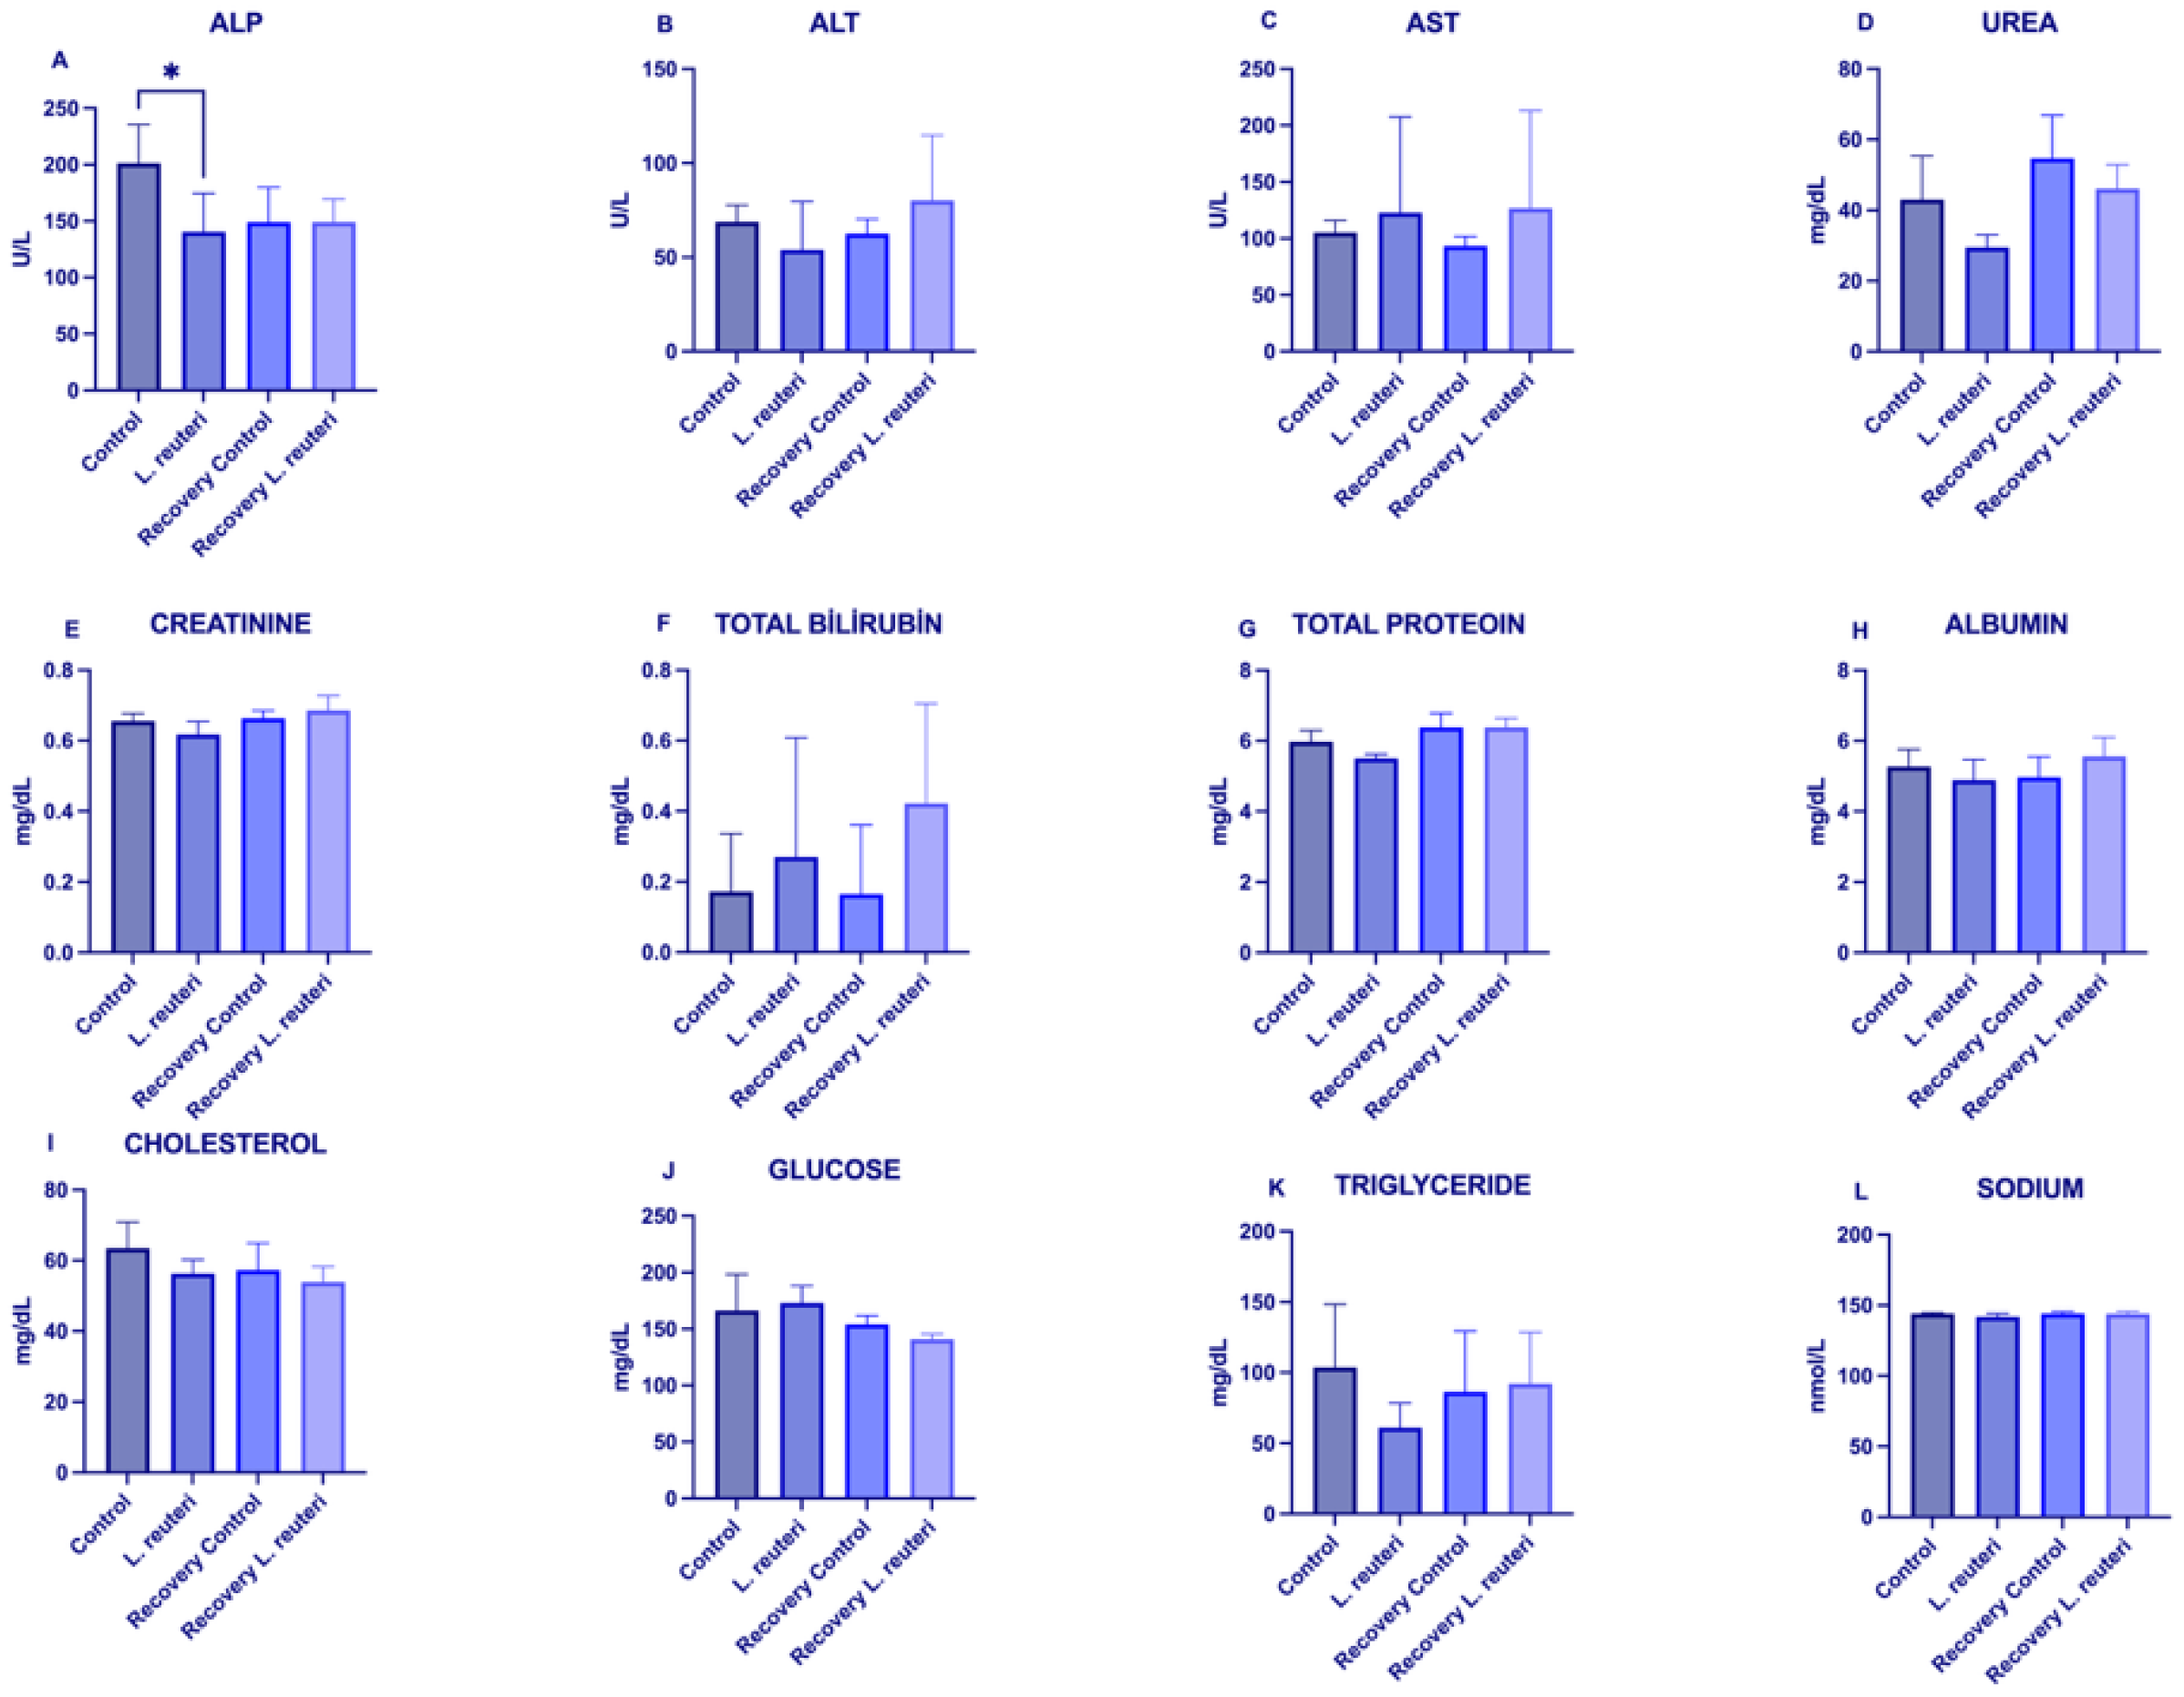
Serum biochemical profiles remained broadly comparable among the experimental groups in both sexes. Most of the measured parameters showed no statistically significant differences. Numerical differences were observed for several parameters, including lower urea concentrations in female recovery animals and lower ALP concentrations in male main-group animals. These differences reached nominal significance in the unadjusted analyses but did not remain statistically significant after Holm correction for multiple comparisons (adjusted p = 0.135 and 0.413, respectively). Mean total bilirubin and triglyceride concentrations also showed numerical variation and substantial inter-individual variability, but no statistically significant differences remained after multiplicity adjustment. Overall, no serum biochemical endpoint remained statistically significant after Holm correction. Detailed effect estimates, 95% confidence intervals, effect sizes, and adjusted p-values are provided in Supplementary Table S1 (see Figure 1 and Figure 2).
Figure 1.
Serum biochemical parameters in female rats following L. reuteri administration and recovery. Serum levels of (A) alkaline phosphatase [ALP], (B) alanine aminotransferase [ALT], (C) aspartate aminotransferase [AST], (D) urea, (E) creatinine, (F) total bilirubin, (G) total protein, (H) albumin, (I) cholesterol, (J) glucose, (K) triglyceride, and (L) sodium were compared among the Control, L. reuteri, Recovery Control, and Recovery L. reuteri groups. Data are presented as mean ± SD. No statistically significant differences remained after Holm correction for multiple comparisons. * p < 0.05.
Figure 2.
Serum biochemical parameters in male rats following L. reuteri administration and recovery. Serum levels of (A) alkaline phosphatase [ALP], (B) alanine aminotransferase [ALT], (C) aspartate aminotransferase [AST], (D) urea, (E) creatinine, (F) total bilirubin, (G) total protein, (H) albumin, (I) cholesterol, (J) glucose, (K) triglyceride, and (L) sodium were compared among the Control, L. reuteri, Recovery Control, and Recovery L. reuteri groups. Data are presented as mean ± SD. No statistically significant differences remained after Holm correction for multiple comparisons. * p < 0.05.
3.2. Organ Weights and Macroscopic Findings
In the main study (Day 28), none of the absolute organ-weight comparisons between L. reuteri-treated rats and the corresponding controls remained statistically significant after Holm correction (Table 1). In the recovery groups (Day 42), female rats receiving L. reuteri exhibited higher absolute liver weights (6.914 ± 0.584 vs. 6.051 ± 0.390 g) and kidney weights (1.657 ± 0.109 vs. 1.485 ± 0.043 g) than female recovery controls (two-sided exact permutation test; Holm-adjusted p = 0.0238 for each comparison). No other recovery-phase organ-weight comparison was significant after Holm adjustment. Macroscopic examination revealed no gross abnormalities in the main control or L. reuteri groups in either sex. During recovery, kidney findings were recorded in 1/5 female and 1/5 male recovery-control animals and in 2/5 male recovery-L. reuteri animals; none were recorded in female recovery-L. reuteri animals. No other macroscopic abnormalities were reported in the tissues examined (Table 2). In the absence of accompanying histopathology, the biological relevance and treatment relationship of these findings remain uncertain.
Table 1.
Absolute organ weights (g) in female and male rats following repeated oral administration of L. reuteri ATA-LTC-Lr050600. Main (Day 28) and recovery (Day 42) results are presented in the same table.
Table 2.
Macroscopic necropsy findings following repeated oral administration of L. reuteri ATA-LTC-Lr050600 (animals with findings/animals examined).
3.3. The Effects of L. reuteri ATA-LTC-Lr050600 Supplementation on the Faecal Microbiota
Faecal microbiota composition was characterized using 16S rRNA gene amplicon sequencing. The workflow included genomic DNA extraction, PCR amplification, amplicon purification, library preparation, sequencing, quality control, and bioinformatic analysis.
Within-group changes between Day 0 and Day 15 were assessed with the exact Wilcoxon signed-rank test, and differences between groups in these changes with the Mann–Whitney test on per-animal differences. No alpha-diversity index changed significantly in either group (all p > 0.10; Figure 3). In the probiotic group, the median Shannon index decreased from 4.68 to 2.32 (p = 0.19), and Simpson dominance increased from 0.030 to 0.197 (p = 0.31), consistent with the expansion of Lactobacillus. At genus level, the mean relative abundance of Lactobacillus increased from 3.83% to 43.99% in the probiotic group and rose in all five animals (p = 0.0625, the minimum attainable with five pairs). It also increased in the control group, from 16.44% to 26.38%, and the group × time interaction was not significant after FDR correction (q = 0.34; Table 3, Figure 3). After Benjamini–Hochberg correction, no taxon changed significantly at any taxonomic level (all q ≥ 0.19; Supplementary Table S4).
Table 3.
Relative abundances of selected gut microbiota taxa at baseline (Day 0) and post-intervention (Day 15).
Figure 3.
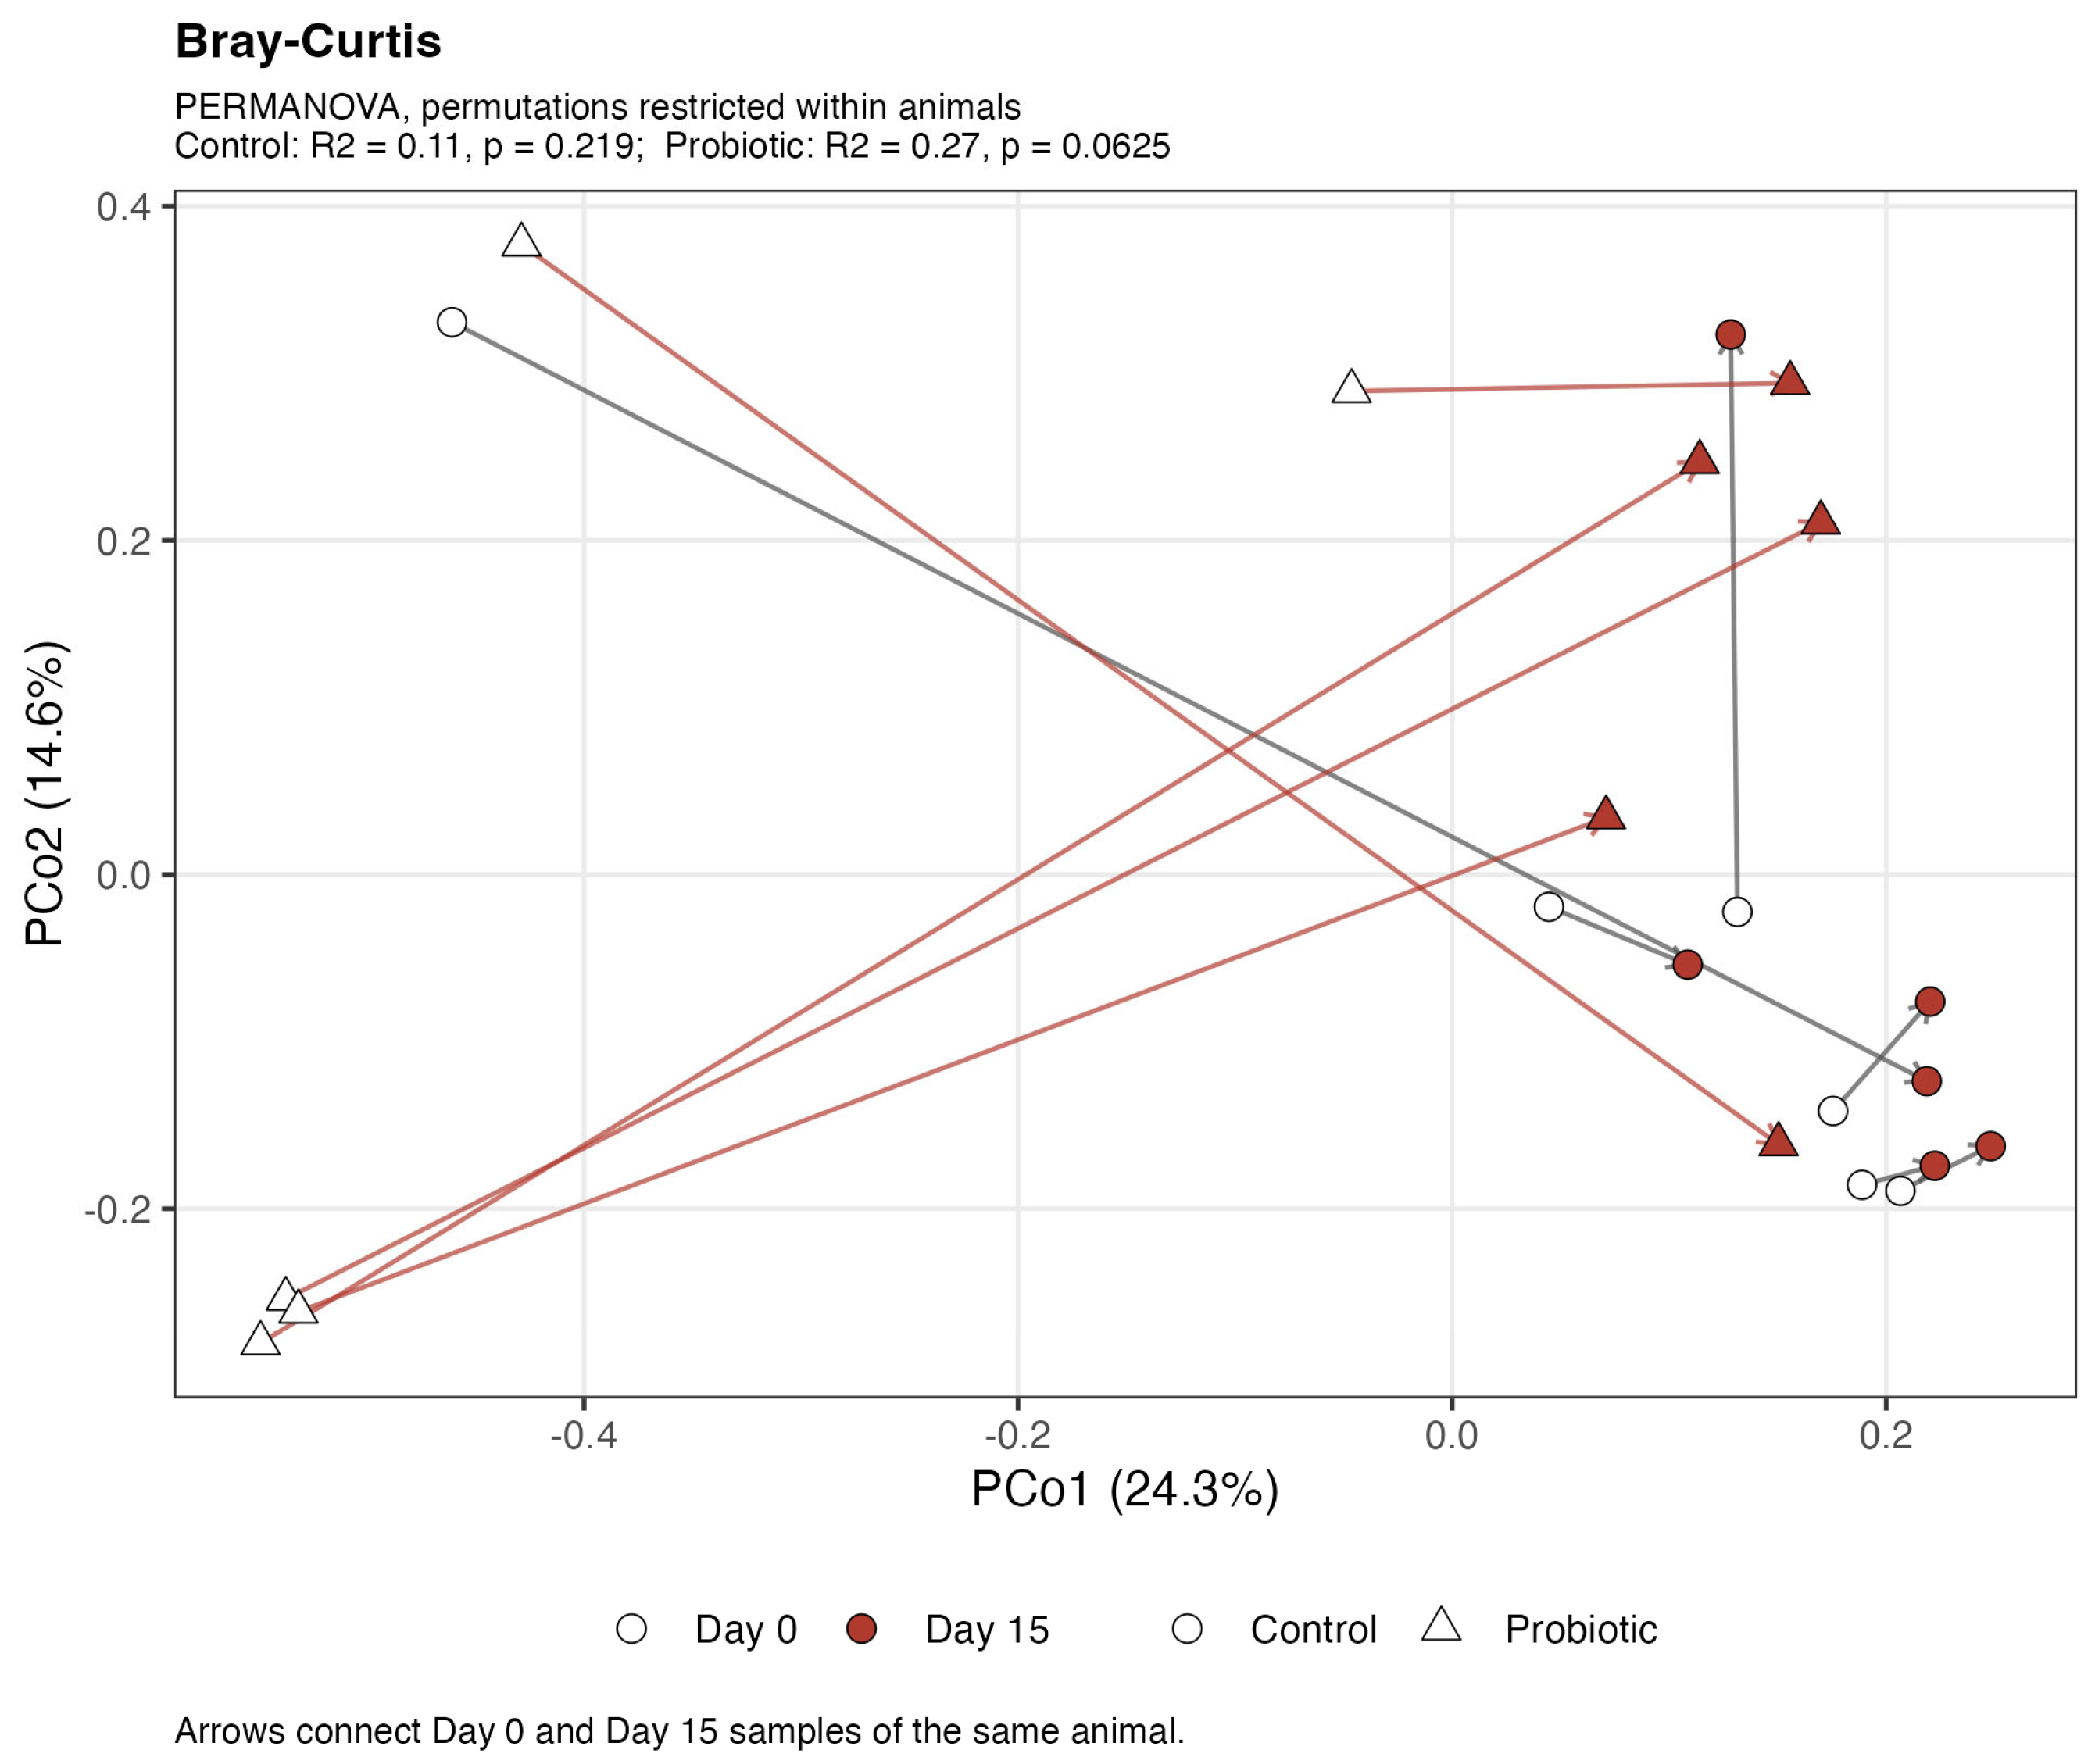
Alpha diversity metrics of the rat gut microbiota at baseline [Day 0] and following 14 days of L. reuteri ATA-LTC-Lr050600 administration [Day 15]. Box plots illustrate the [A] Shannon diversity index, [B] Chao1 richness estimator, and [C] Simpson index. Data are presented as median with interquartile range [IQR]. Statistical significance was determined using the paired Wilcoxon signed-rank test. Beta-diversity analysis was used to examine differences in microbial community composition between Day 0 and Day 15. The PCA and PCoA plots showed a visual separation between baseline and post-intervention samples, suggesting a shift in community composition during the study period (Figure 4). However, visual separation alone does not establish statistical significance. Consistent with this, PERMANOVA did not detect a statistically significant temporal change in overall microbial community structure in either the control or probiotic group.
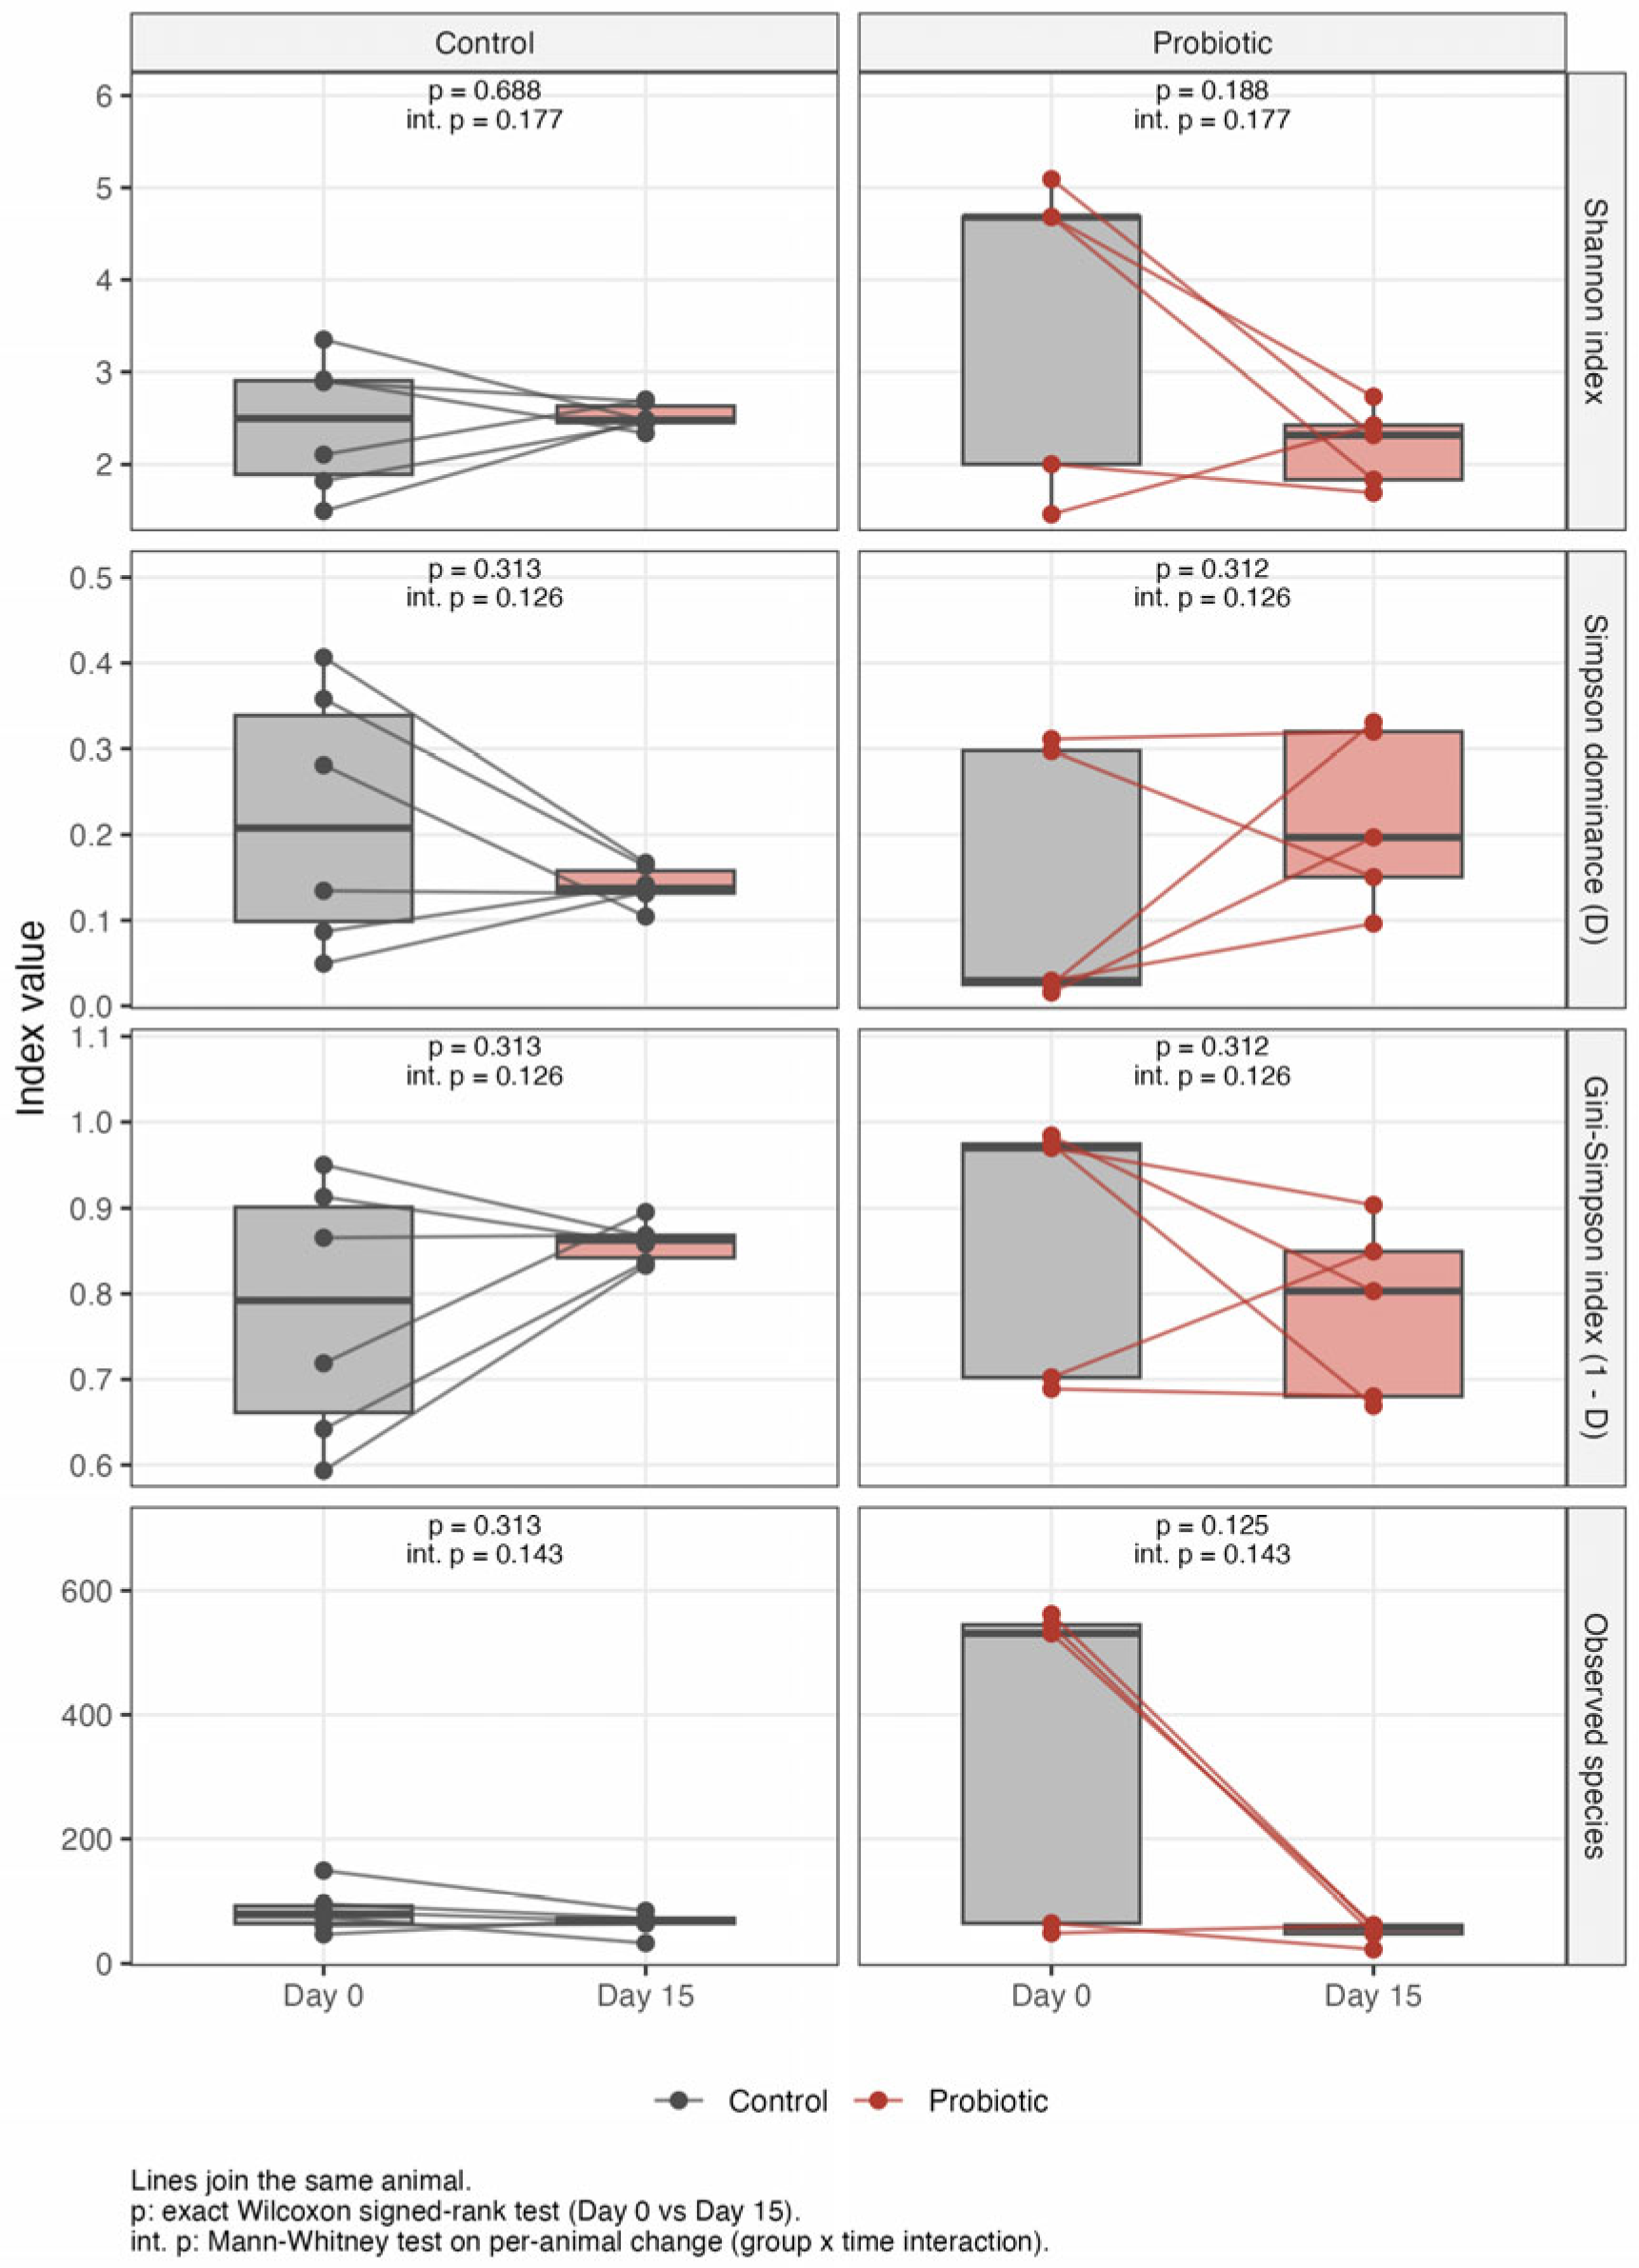
Figure 4.
Beta diversity of the gut microbiota. Principal Coordinate Analysis (PCoA) based on Bray–Curtis dissimilarity comparing microbial community structure between Day 0 (baseline) and Day 15 (post-intervention). Each point represents an individual faecal sample. Colours indicate sampling time points, while symbols distinguish the Control and Probiotic groups. Arrows connect Day 0 and Day 15 samples obtained from the same animal. Statistical differences in community structure were evaluated using PERMANOVA, with permutations restricted within animals and complete enumeration. For the Control group, R2 = 0.11 (p = 0.219), and for the Probiotic group, R2 = 0.27 (p = 0.0625). The p-value of 0.0625 represents the minimum attainable value for the five paired animals in the Probiotic group under the applied permutation scheme and should therefore be interpreted in the context of this sample-size limitation.
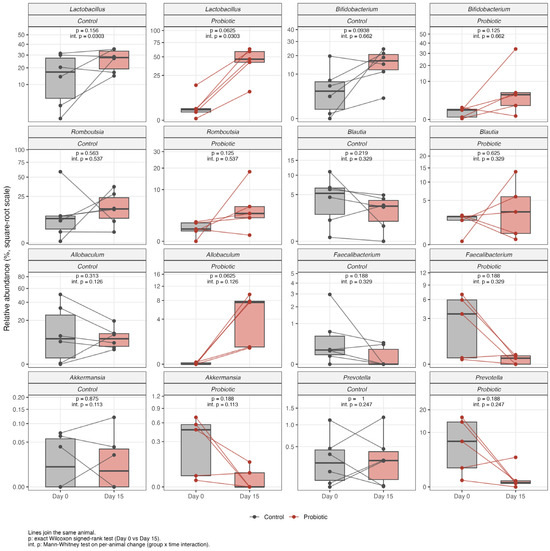
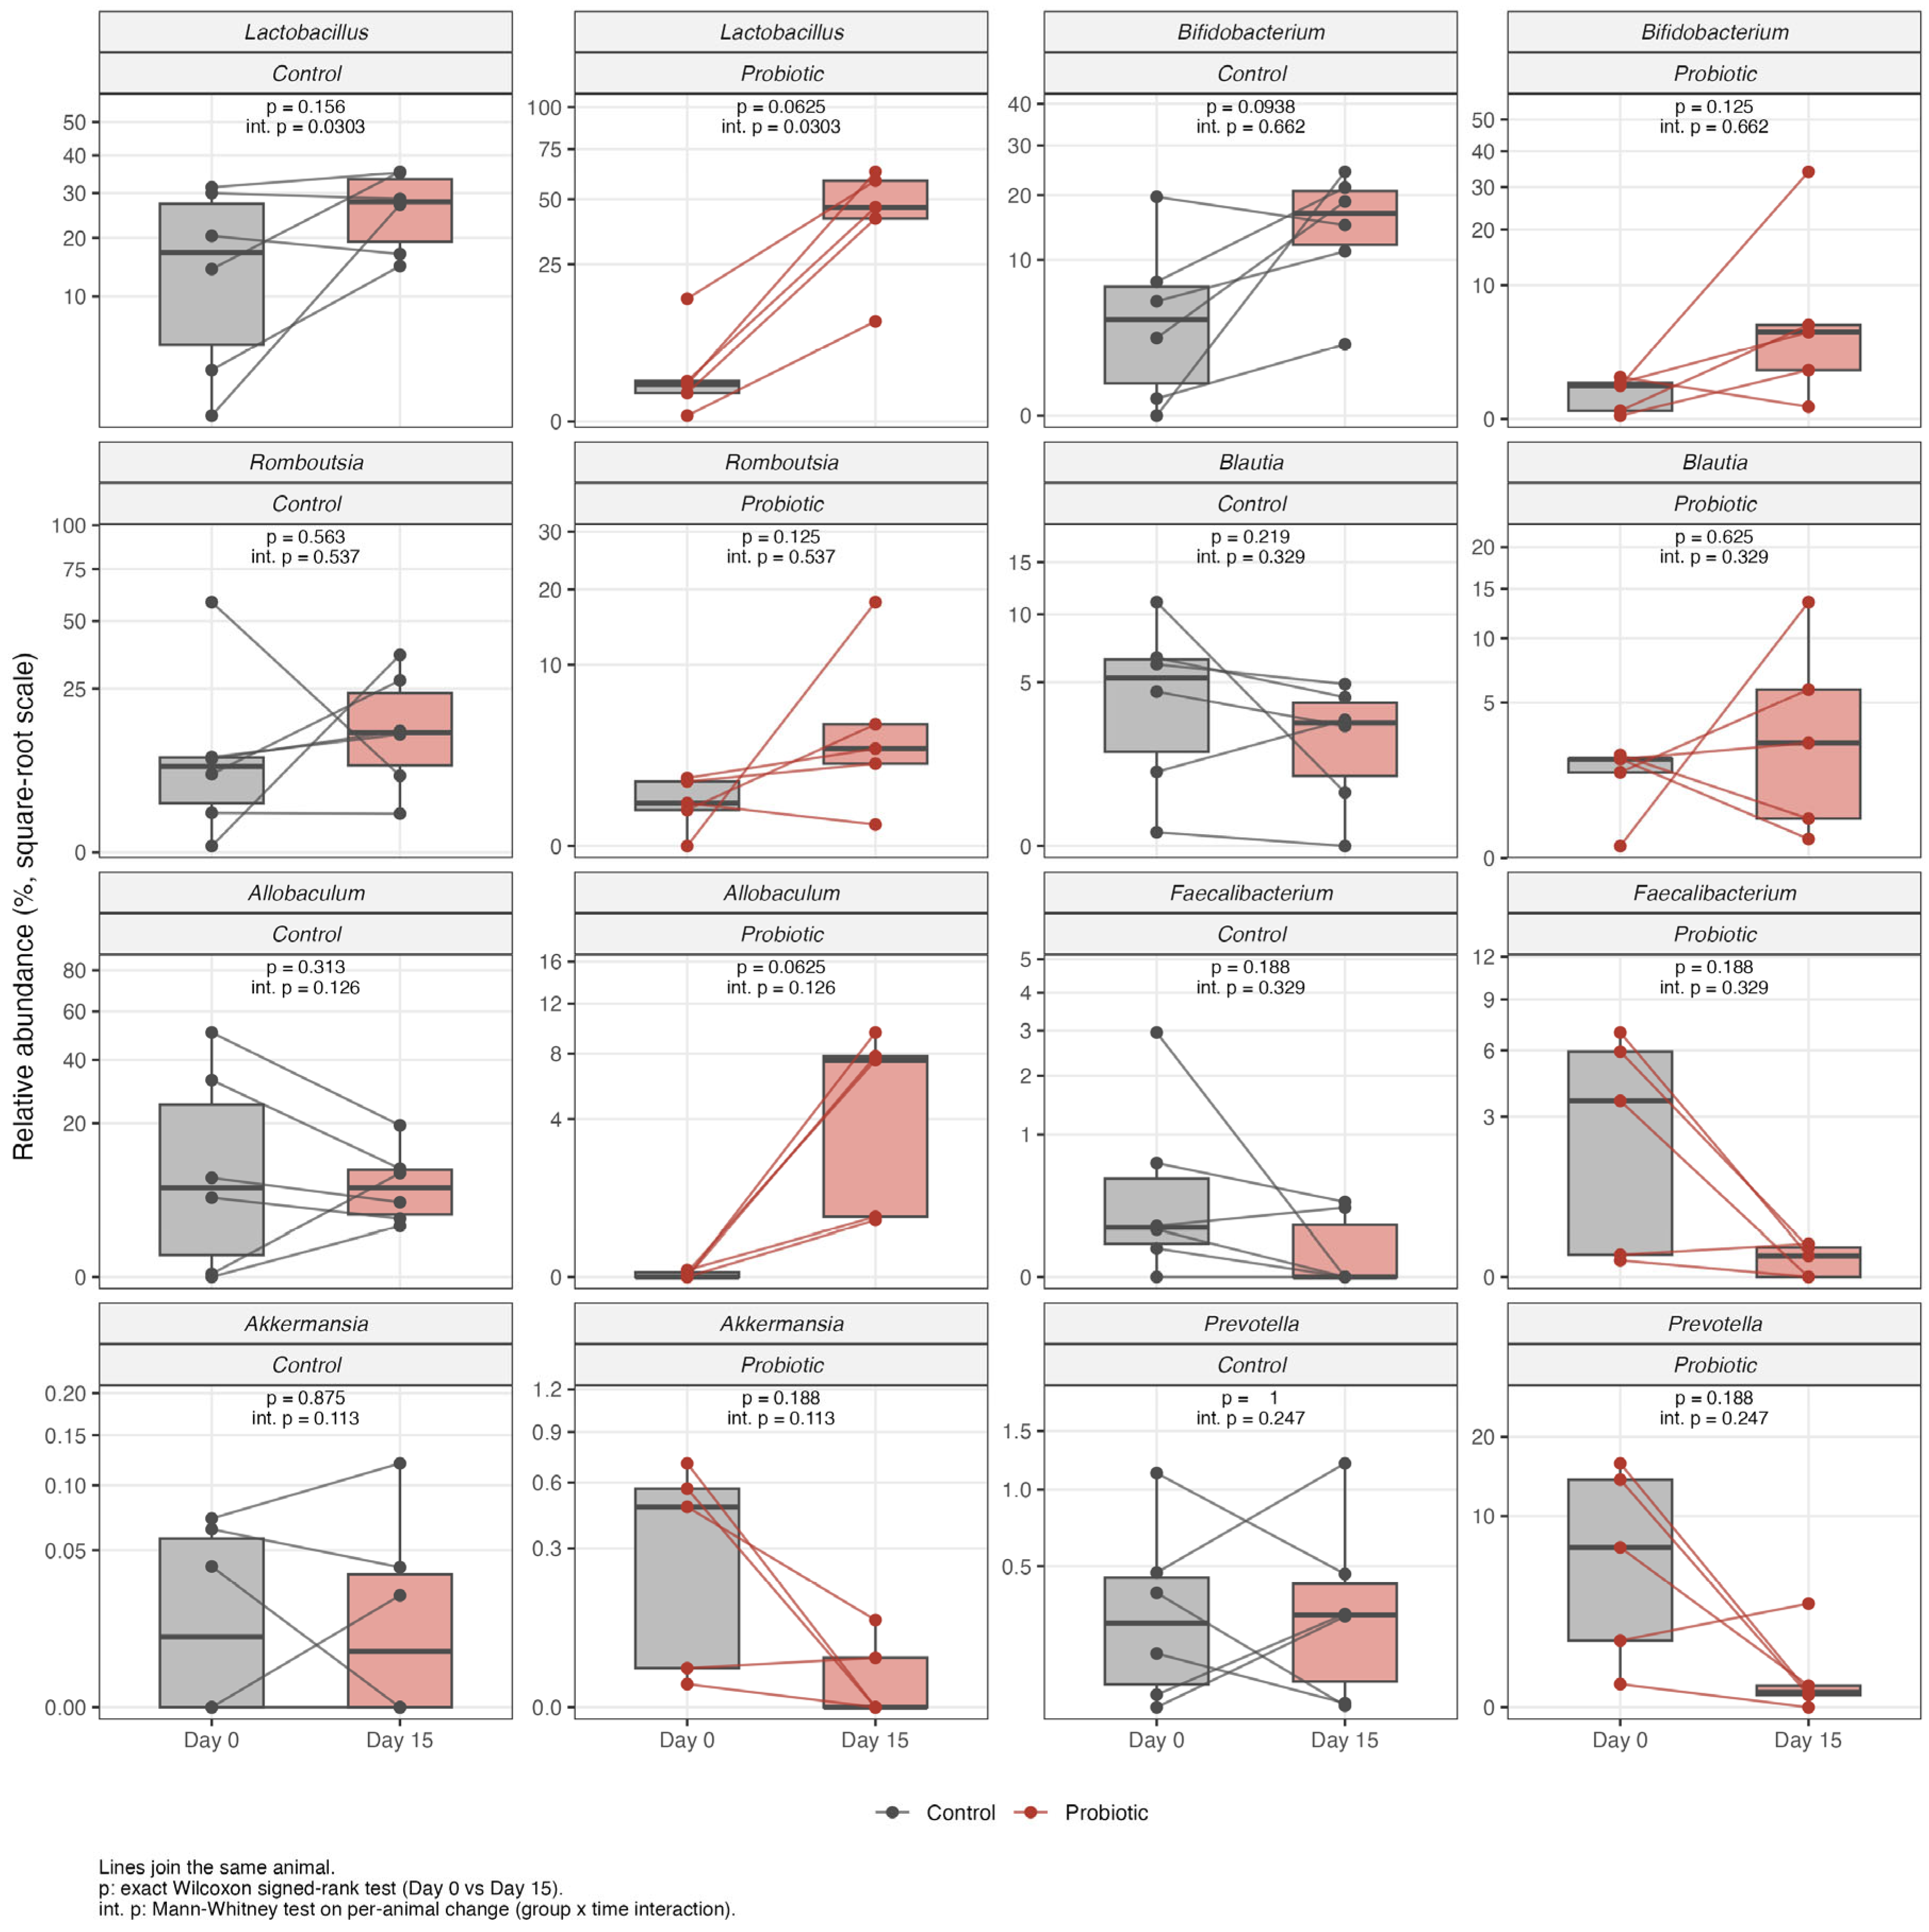
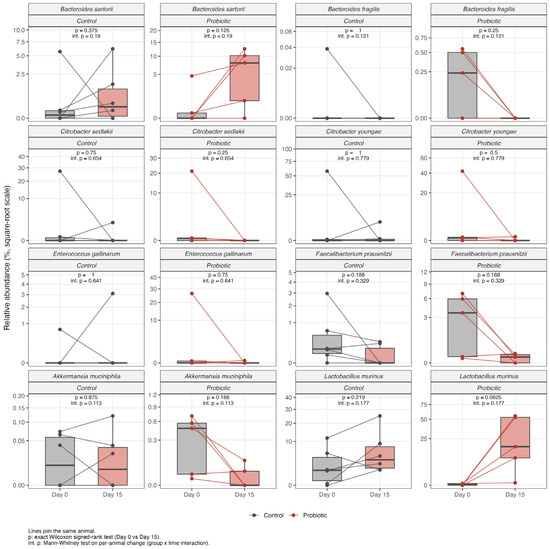
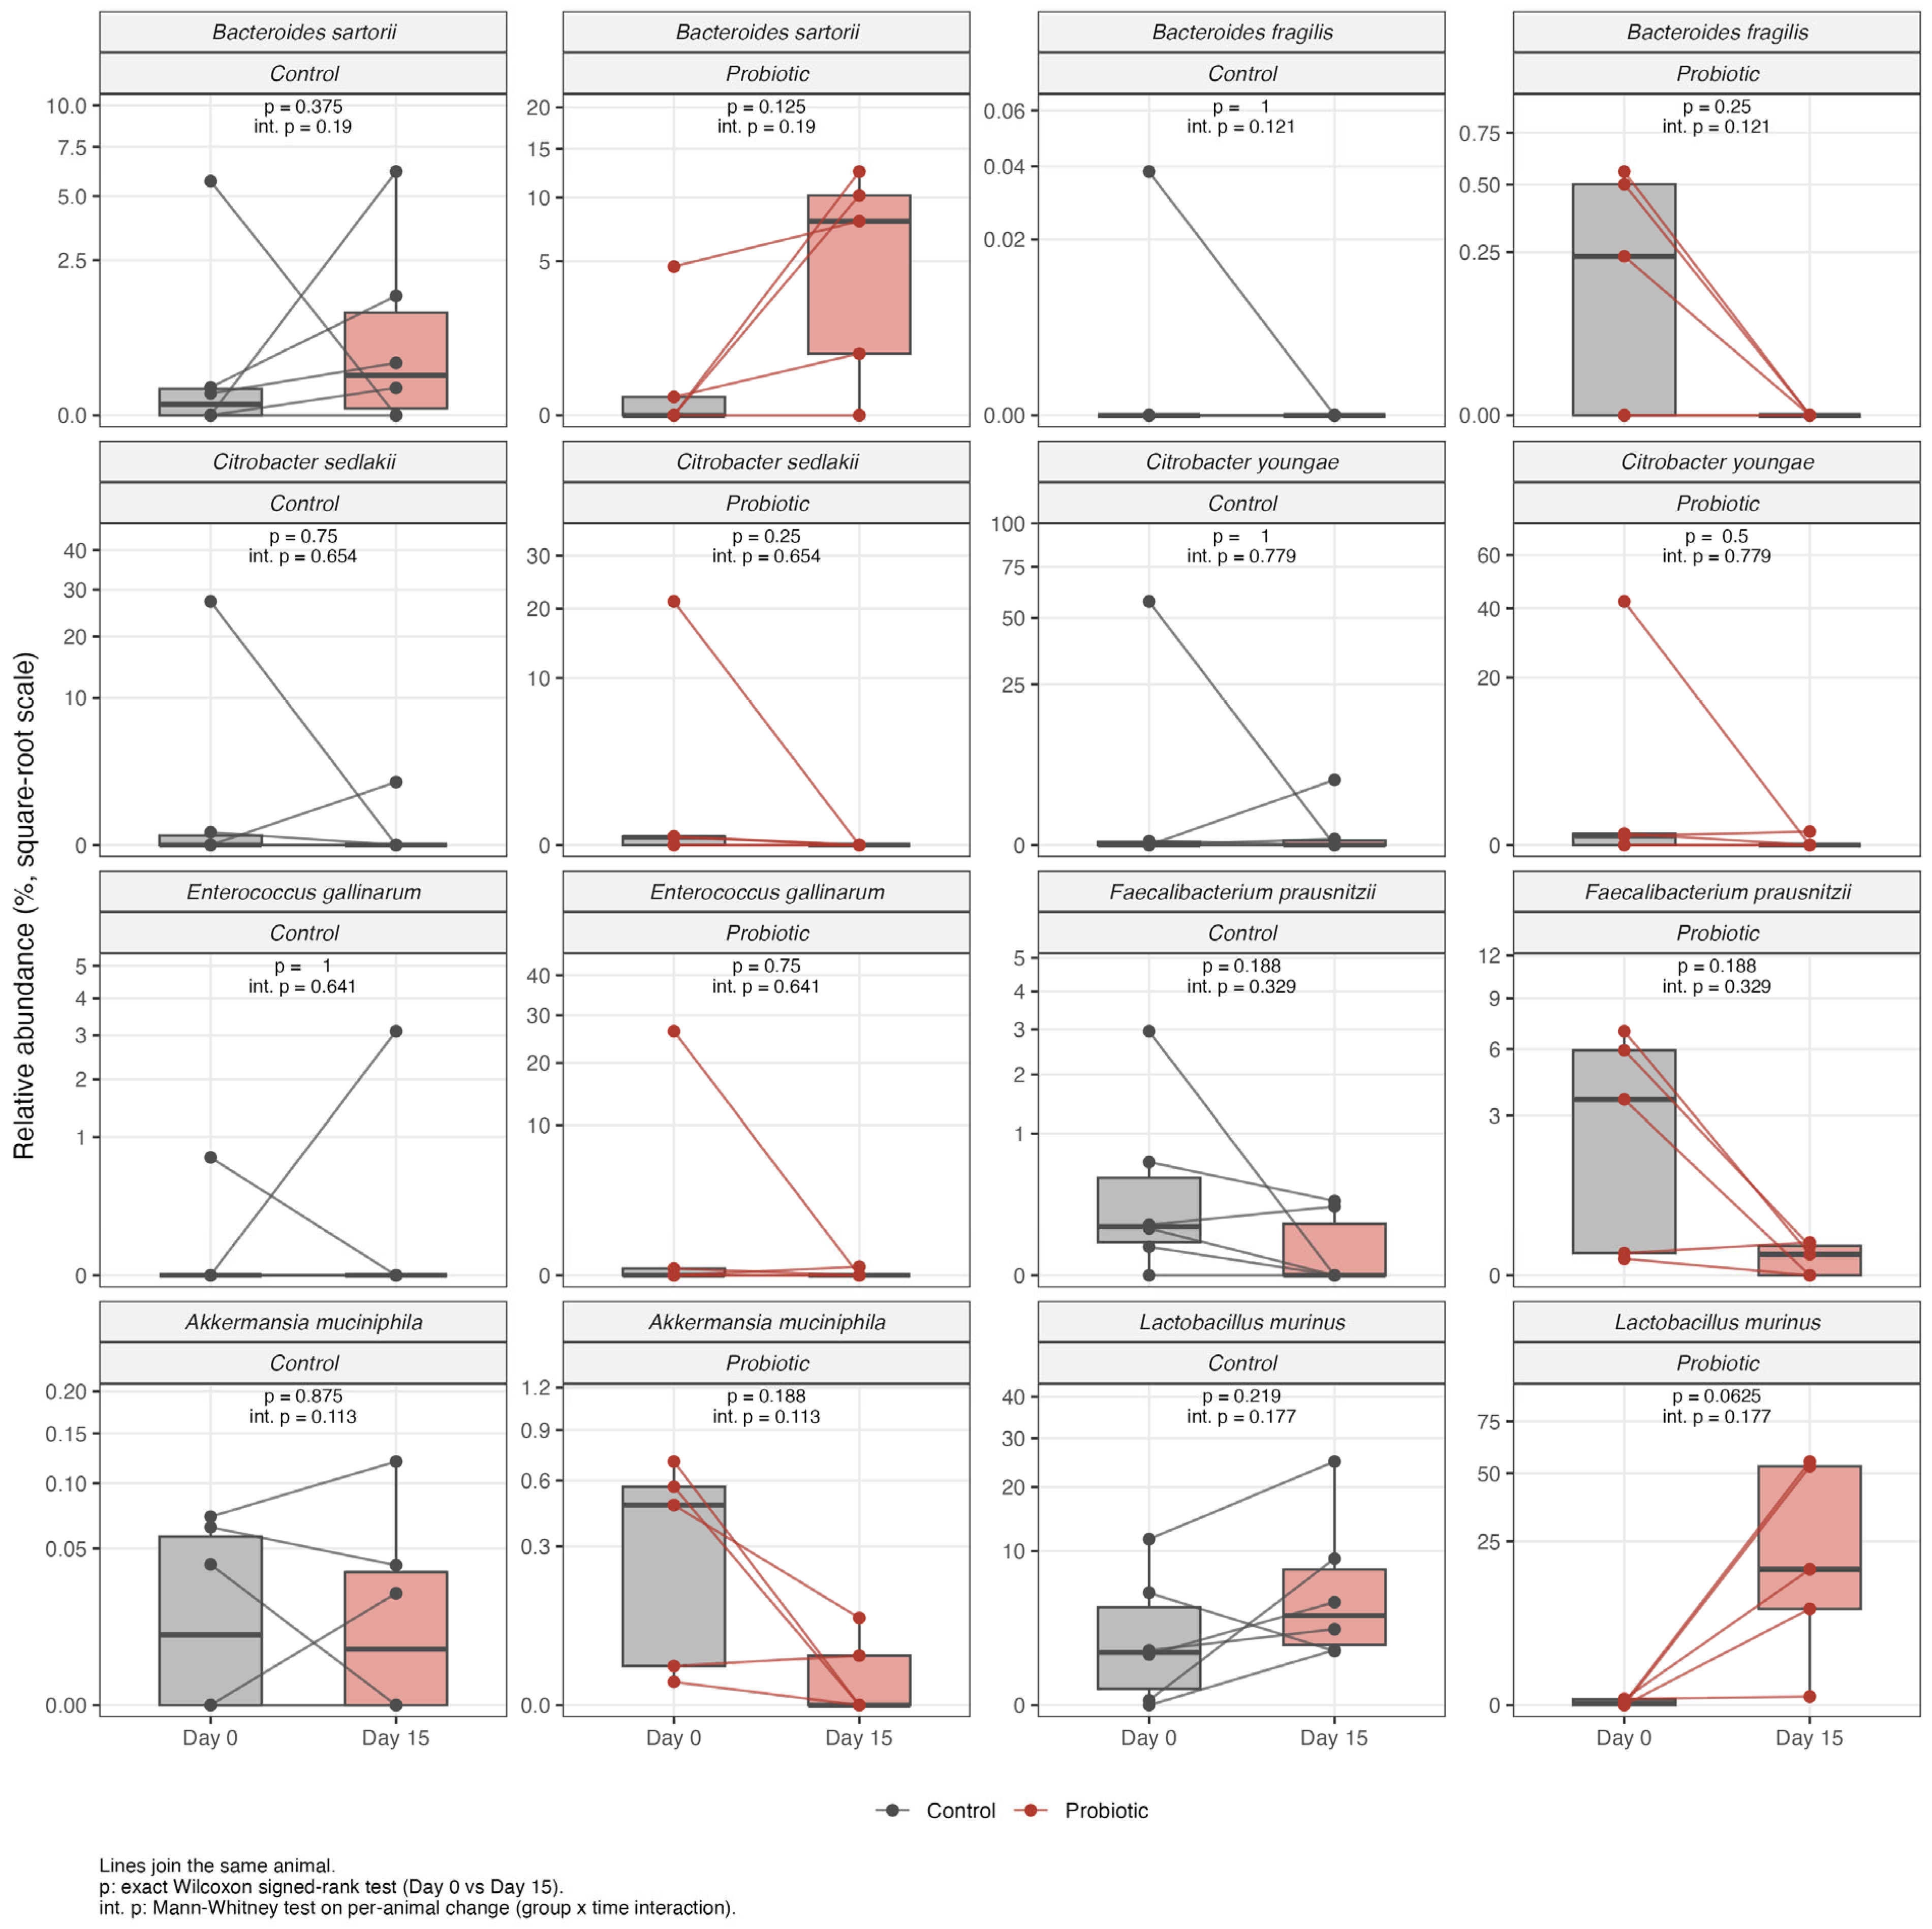
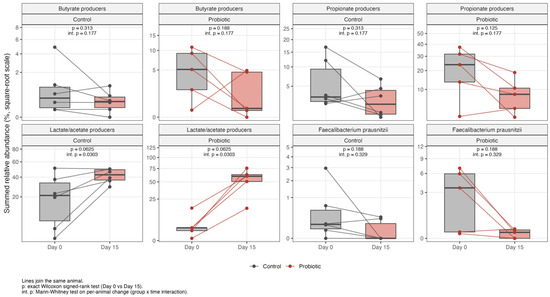
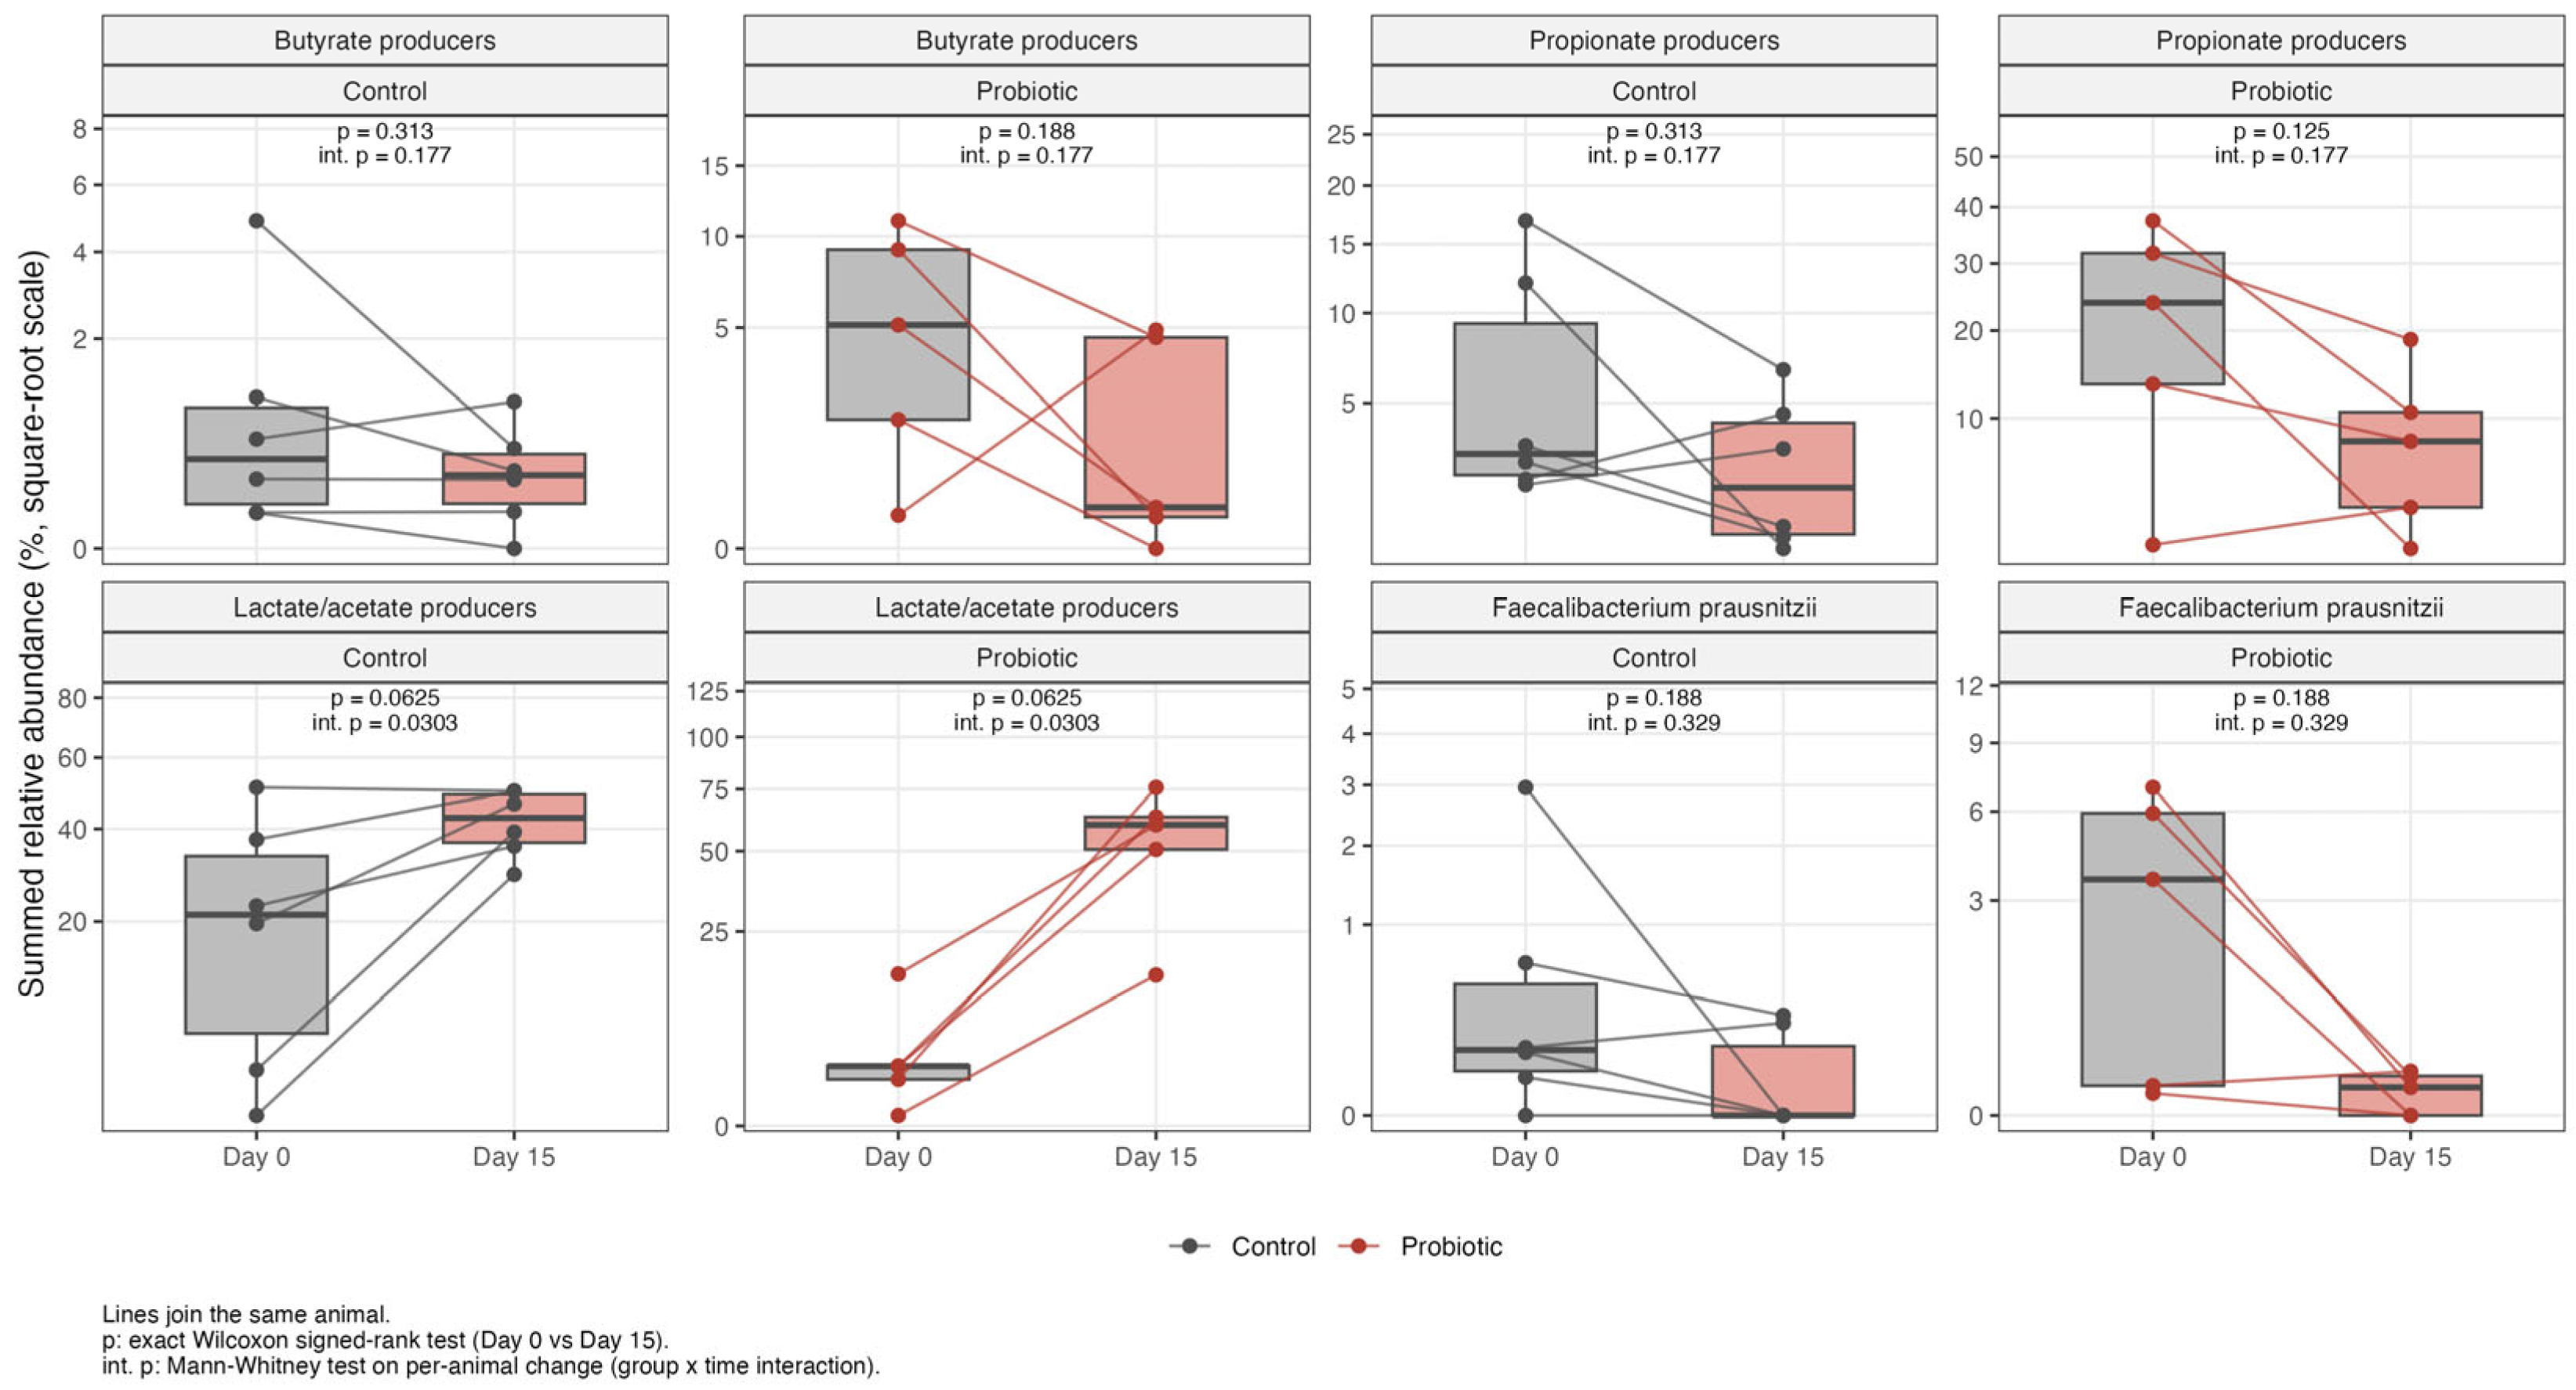
Temporal changes in the relative abundances of selected bacterial genera were further visualized using paired plots for the Control and Probiotic groups (Figure 5). Individual points represent the relative abundance measured in each animal at Day 0 and Day 15, and connecting lines indicate paired samples from the same animal. Within-group temporal comparisons and between-group differences in temporal changes were evaluated using paired tests and group × time interaction analyses, respectively.
Figure 5.
Paired relative-abundance profiles of selected gut bacterial genera at baseline (Day 0) and post-intervention (Day 15) in the Control and Probiotic groups. Individual points represent individual animals, and connecting lines indicate paired samples from the same animal. Within-group comparisons were performed using the Wilcoxon signed-rank test (p), while differences in temporal changes between groups were assessed using the Mann–Whitney U test (int. p). Relative abundances are expressed as percentages.
To provide an overview of the temporal changes in gut microbiota composition, the mean relative abundances of selected taxa at the phylum and genus levels were compared between baseline (Day 0) and post-intervention (Day 15) samples (Table 3). At the phylum level, the probiotic group showed numerical increases in Firmicutes (34.47% to 74.04%) and decreases in Bacteroidetes (20.07% to 8.46%) and Proteobacteria (36.28% to 6.95%). At the genus level, numerical increases were observed in Lactobacillus (3.83% to 43.99%), Bifidobacterium (0.48% to 8.93%), Romboutsia (0.73% to 5.53%), and Allobaculum (0.002% to 5.21%), whereas Faecalibacterium (3.33% to 0.06%), Akkermansia (0.36% to 0.02%), and Prevotella (7.76% to 0.64%) showed numerical decreases. However, none of the paired comparisons reached statistical significance (all p > 0.05), and no significant group-by-time interactions were detected after multiple-testing correction (all interaction q-values > 0.05). These findings therefore describe numerical changes in relative abundance rather than statistically confirmed intervention-associated effects.
Species-level relative-abundance analysis showed decreases in several selected taxa following the intervention. Citrobacter sedlakii decreased from 4.26% at baseline to undetectable levels at Day 15, while Citrobacter youngae decreased from 8.49% to 0.03% and Escherichia coli from 12.09% to 6.55%. Akkermansia muciniphila (phylum Verrucomicrobia) also showed a numerical decrease in mean relative abundance, from 0.36% at baseline to 0.02% at Day 15; however, this difference was not statistically significant (p = 0.19). In contrast, Bacteroides sartorii showed a numerical increase in mean relative abundance from 0.95% at baseline to 6.29% at Day 15; however, this difference was not statistically significant (p = 0.10; Figure 6). These results indicate taxon-specific changes in relative abundance; however, they do not, by themselves, establish changes in absolute bacterial load, pathogenic activity, or infection risk.
Figure 6.
Relative abundance of selected opportunistic and pathogenic taxa in the rat gut microbiota at baseline [Day 0] and following 14 days of L. reuteri ATA-LTC-Lr050600 administration [Day 15]. Data represent the mean percentage abundances of specific species [e.g., Citrobacter spp., Escherichia coli, Klebsiella pneumoniae] across the experimental cohort.
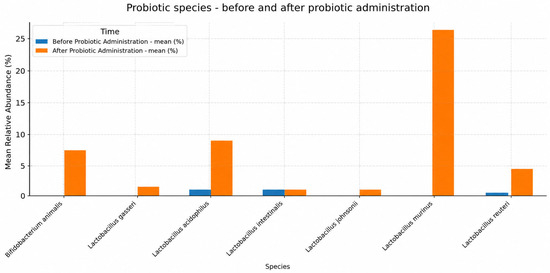
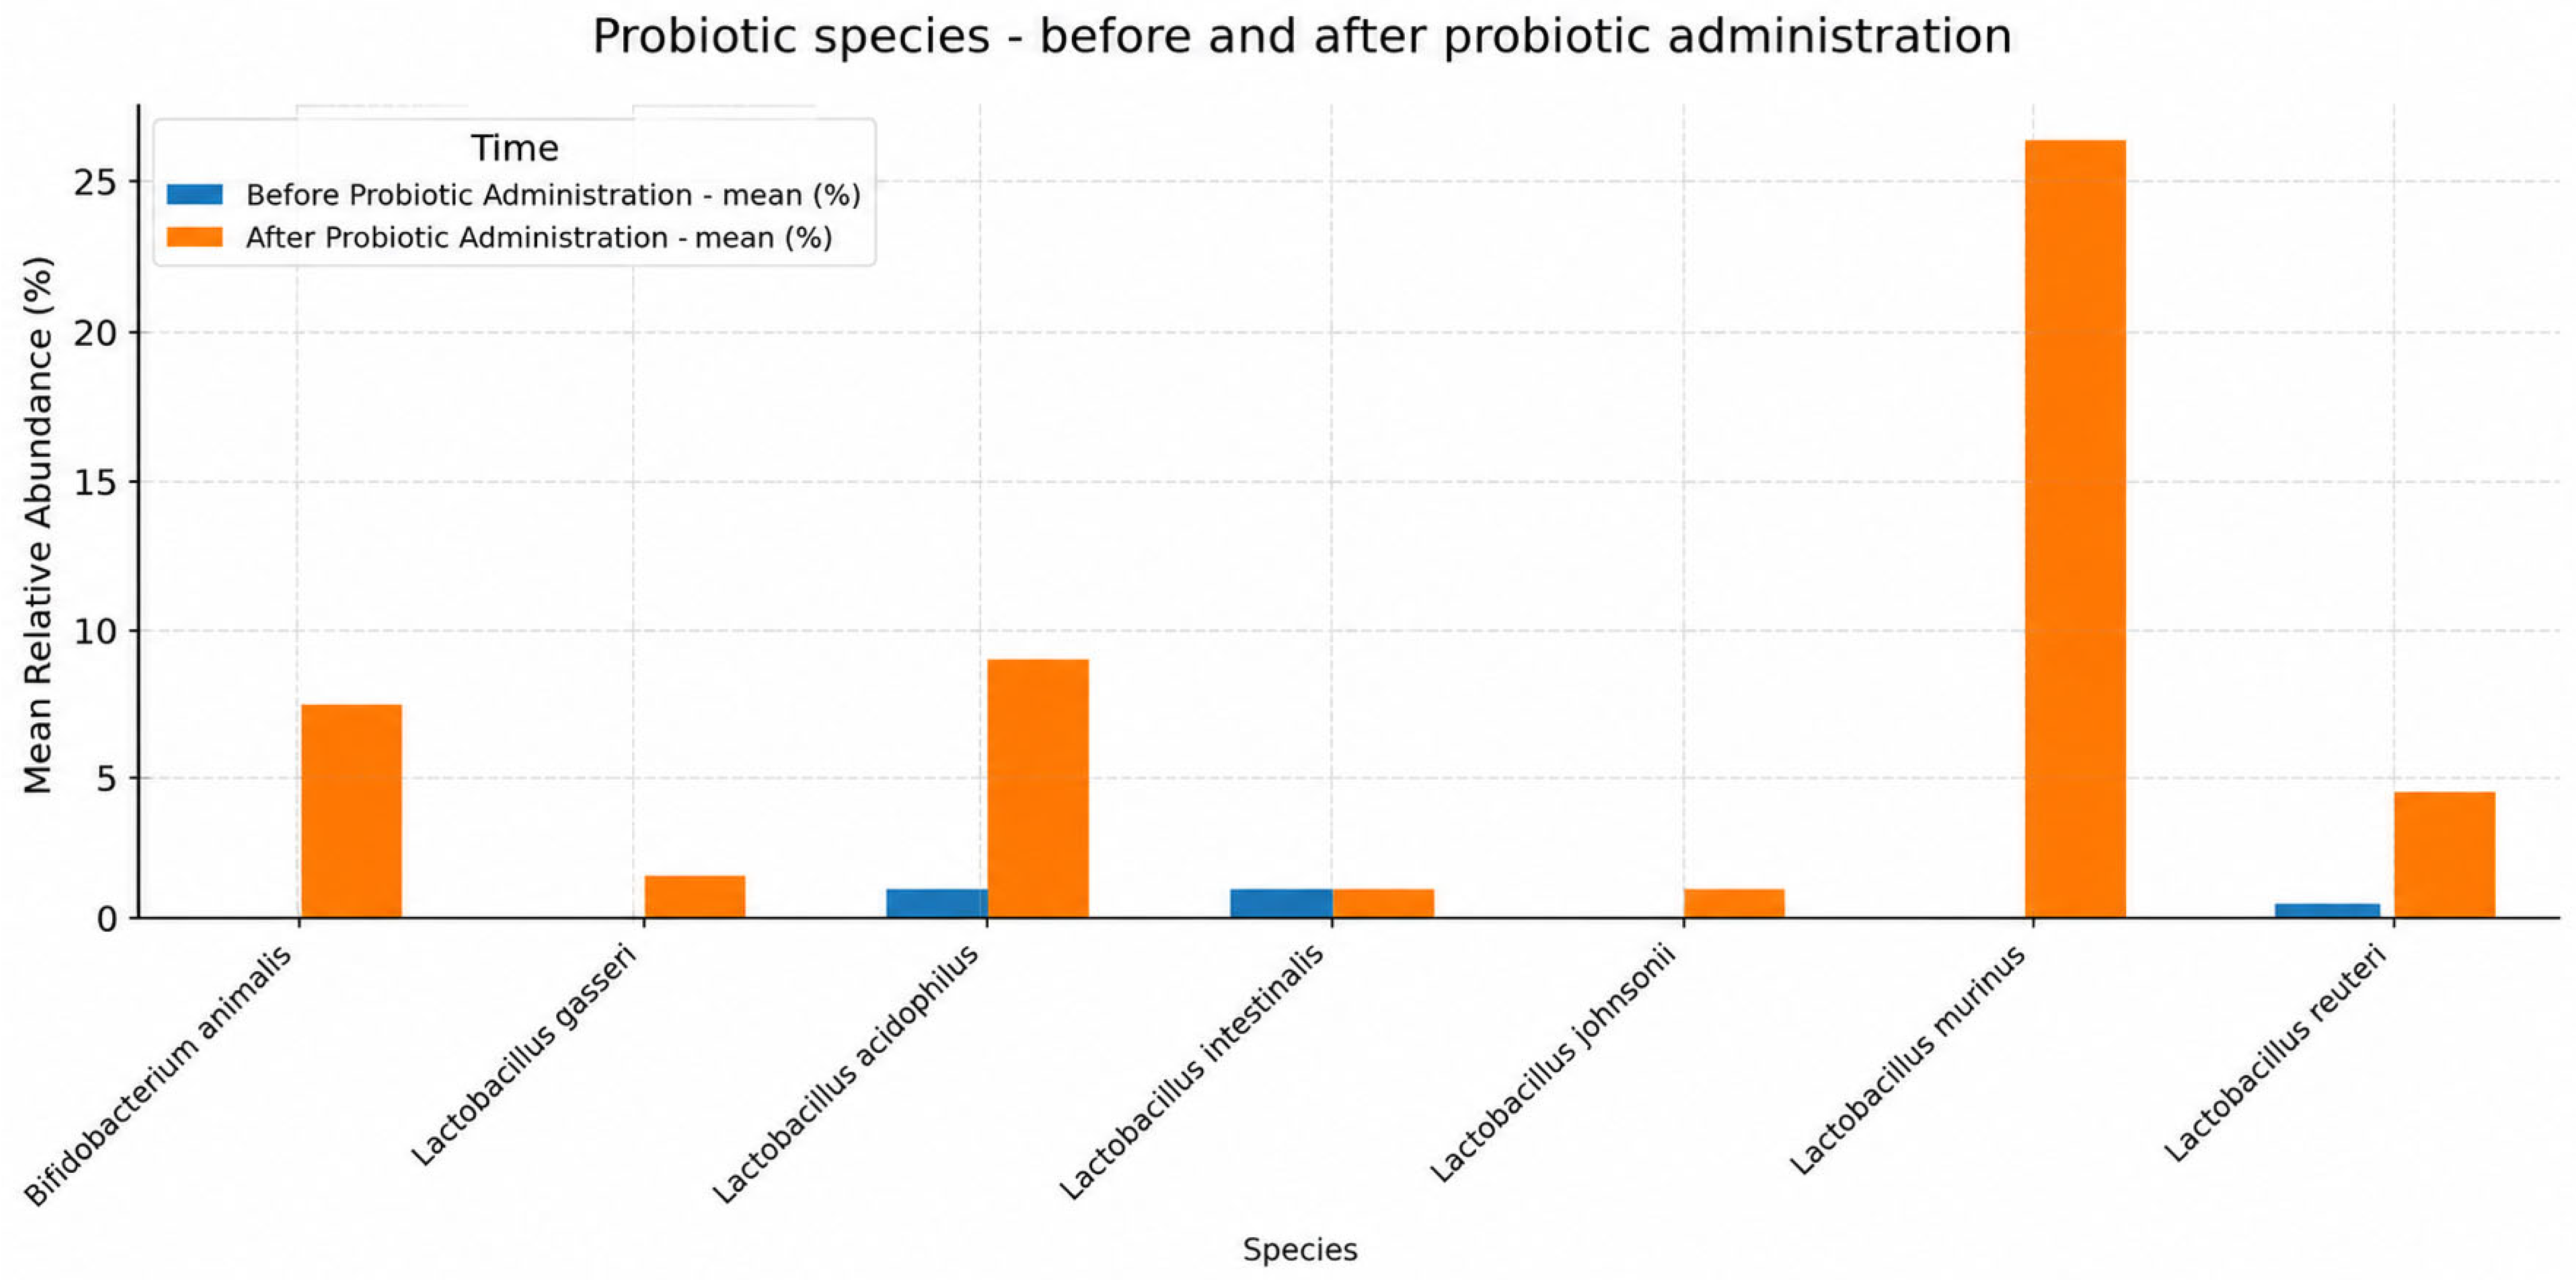
Several microbial species associated with probiotic or commensal properties showed increased relative abundance at Day 15 compared with baseline (Figure 7). These included Lactobacillus murinus, L. acidophilus, Bifidobacterium animalis, L. reuteri, L. intestinalis, L. johnsonii, and Bifidobacterium pseudolongum. This result suggests a change in the relative abundance of the selected taxa, but the interpretation depends on how the overall comparison was defined and whether it accounted for the paired measurements and multiple taxon-level comparisons.
Figure 7.
Relative abundance of beneficial and probiotic-associated microbial species in the rat gut microbiota at baseline [Day 0] and post-intervention [Day 15]. Data represent mean percentage abundances.
When selected commensal microbial species associated with short-chain fatty acid (SCFA) production were evaluated, an increase in their relative abundance was observed following treatment [Figure 8]. Among these taxa, Clostridium disporicum, Allobaculum stercoricanis, and Eubacterium hallii showed notable increases. However, the overall comparison of this group of taxa was not statistically significant (p = 0.061).
Figure 8.
Relative abundance of commensal taxa strictly associated with short-chain fatty acid [SCFA] production at baseline [Day 0] and post-intervention [Day 15]. Data represent the mean percentage abundances of putative SCFA producers, including Clostridium disporicum, Allobaculum stercoricanis, and Eubacterium hallii.
Faecal microbiota profiles at baseline (Day 0) and after the intervention (Day 15) were compared within the same animals. Published microbiota profiles from healthy rats were used only as contextual references to aid descriptive interpretation. They did not constitute a concurrent control group, and no direct quantitative or statistical comparisons were performed between the present dataset and the published literature [28]. Consequently, the observed temporal changes cannot be attributed exclusively to L. reuteri ATA-LTC-Lr050600 supplementation, because changes over time and other potential influences could not be separated from the intervention effect.
3.4. Effects of Lactobacillus reuteri ATA-LTC-Lr050600 on Oxidative Stress-Related Parameters
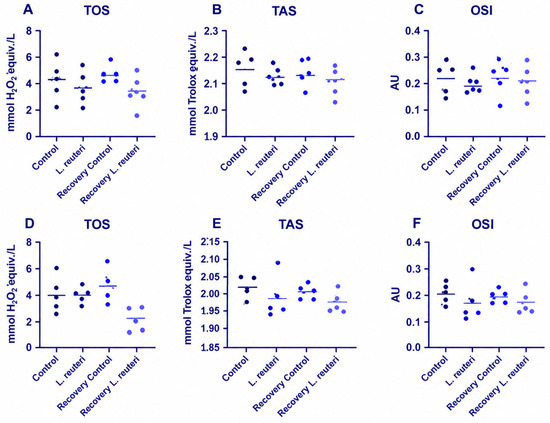
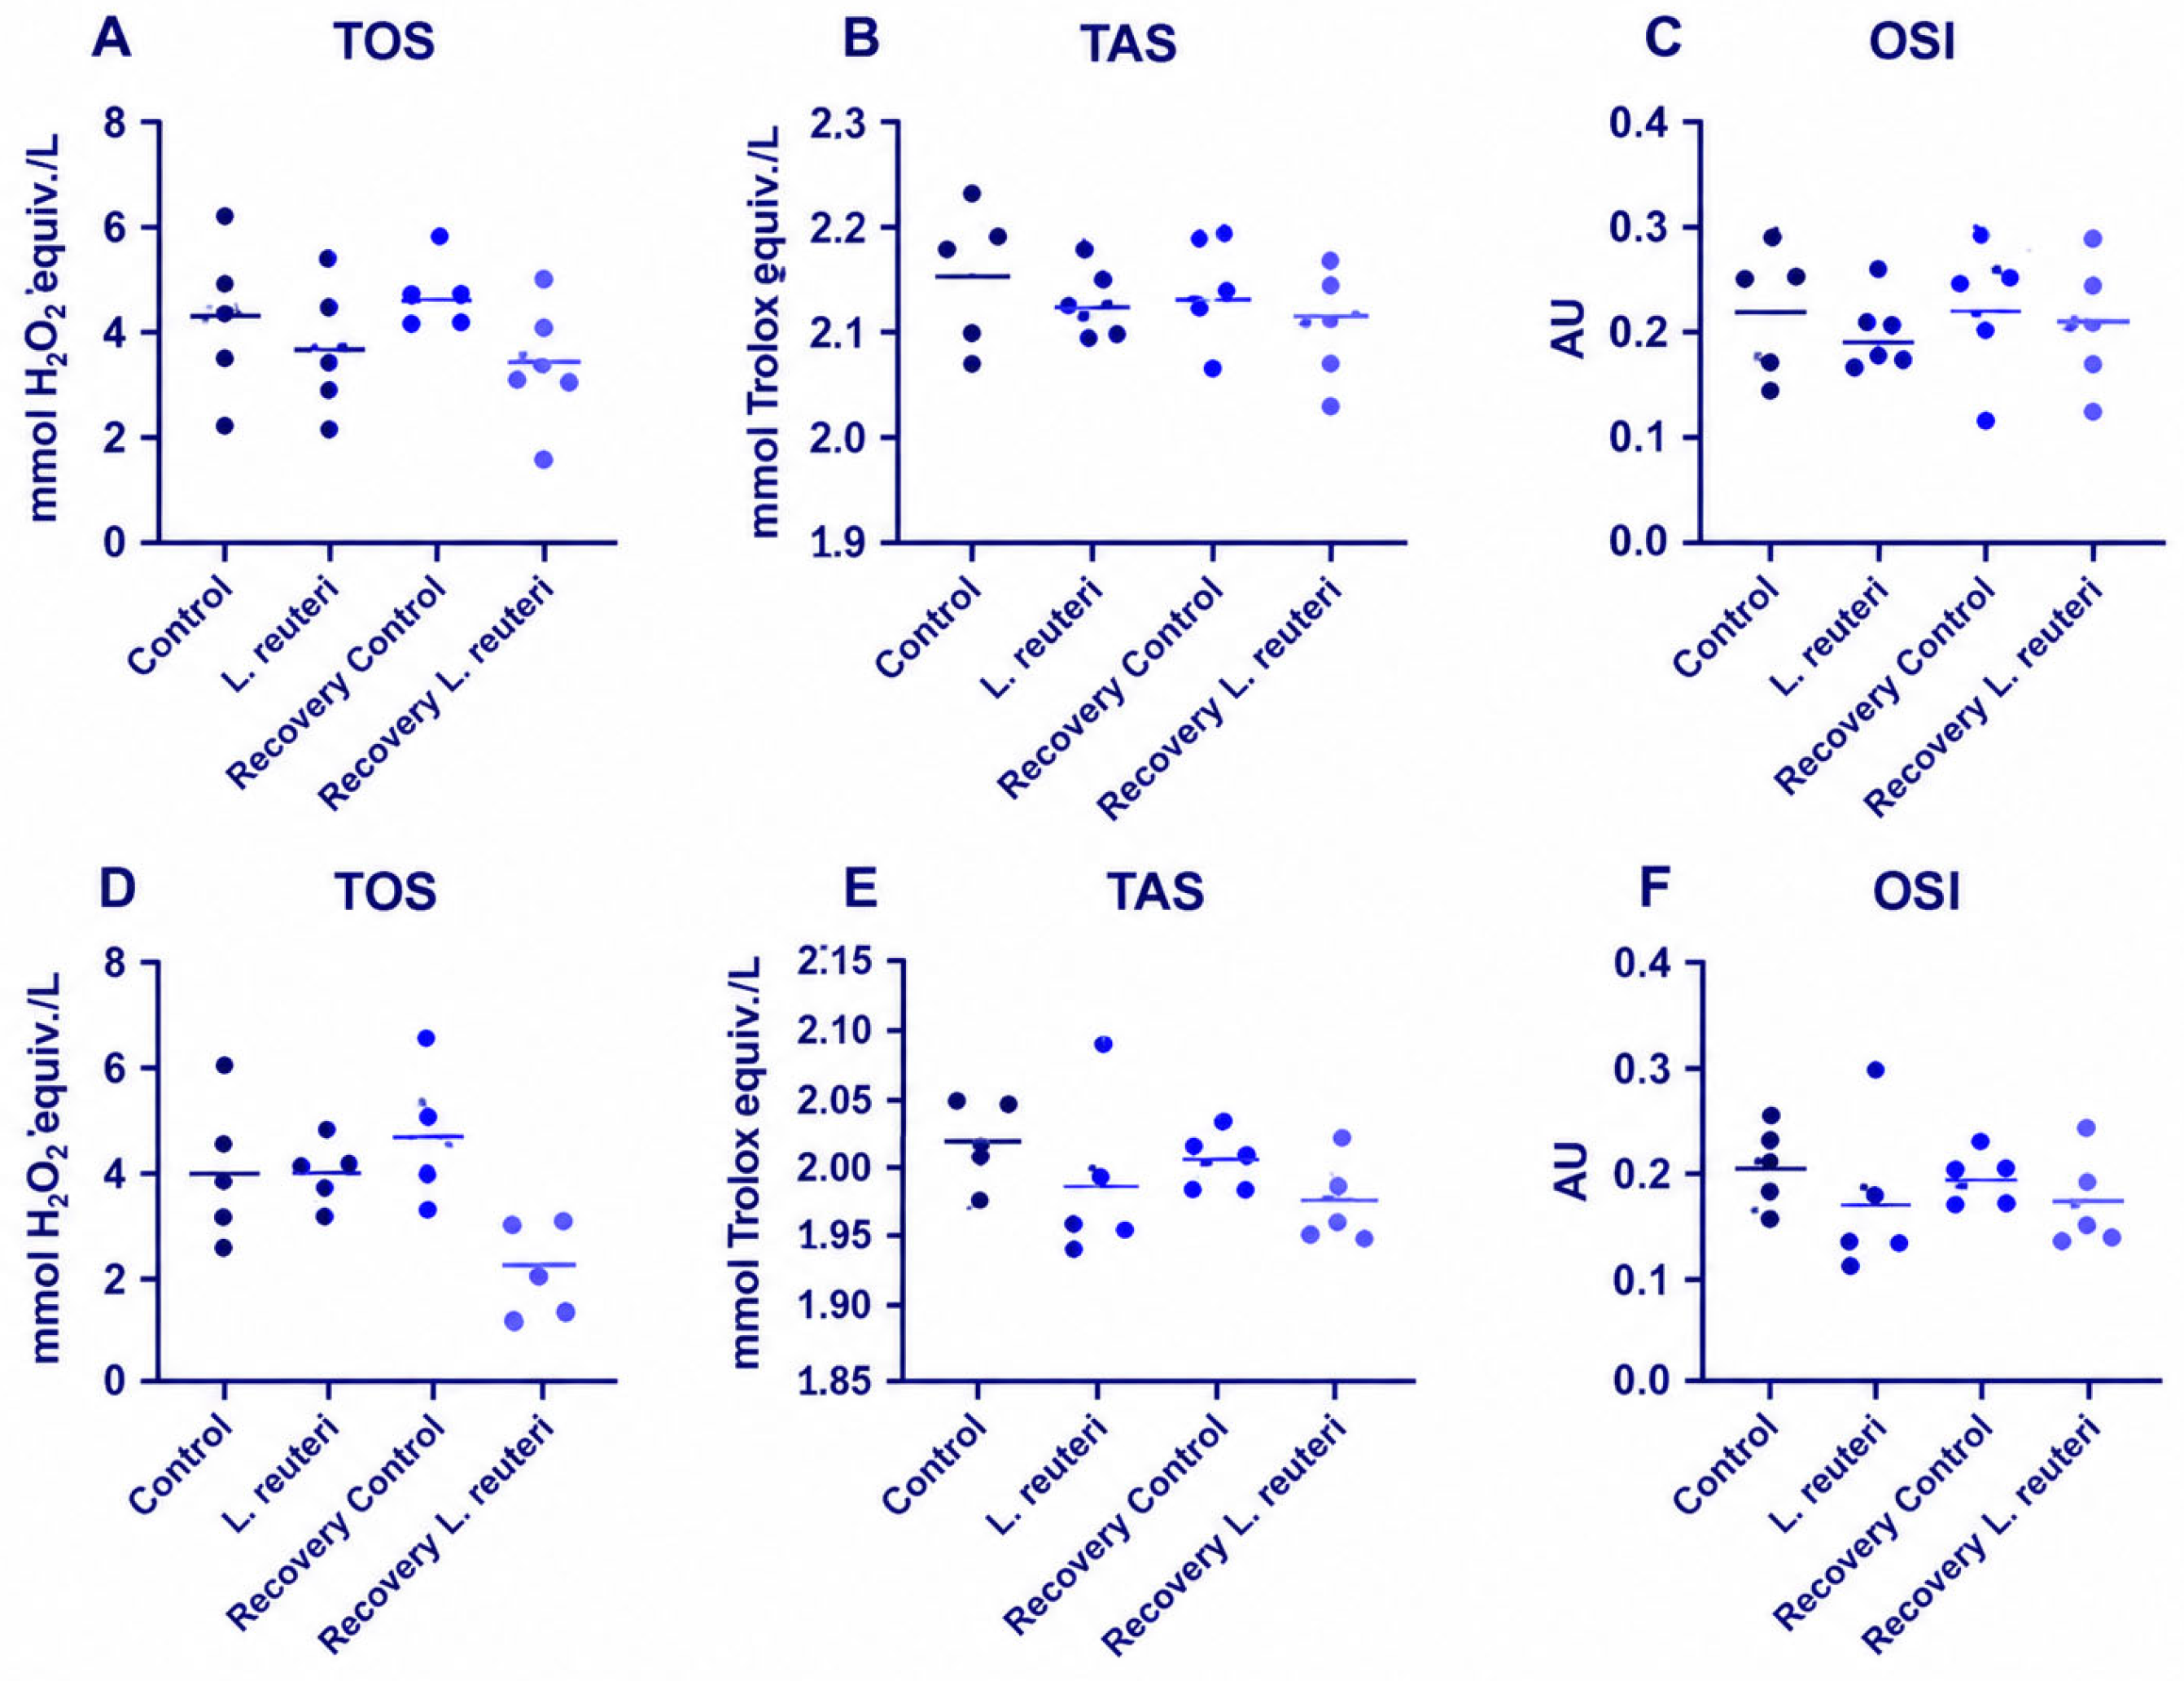
TAS, TOS, and OSI were evaluated separately in female and male rats. No statistically significant differences in TOS or OSI were identified between the corresponding control and L. reuteri groups. During the recovery phase, TAS was numerically lower in the L. reuteri groups than in the corresponding recovery controls in both sexes. These differences were nominally significant before adjustment but did not remain statistically significant after Holm correction for multiple comparisons (adjusted p = 0.135 for both sexes). The mean TAS differences were −0.086 mmol Trolox equiv./L in females and −0.099 mmol Trolox equiv./L in males. Individual animal values are shown in Figure 9, and detailed statistical estimates are provided in Supplementary Table S1.
Figure 9.
Serum total oxidant status (TOS), total antioxidant status (TAS), and oxidative stress index (OSI) in female (A–C) and male (D–F) rats following L. reuteri ATA-LTC-Lr050600 administration and recovery. Individual points represent individual animals (n = 5/group), and horizontal lines indicate group means. Comparisons were performed separately between Control and L. reuteri groups and between Recovery Control and Recovery L. reuteri groups. No differences remained statistically significant after correction for multiple comparisons.
4. Discussion
The present study aimed to evaluate selected toxicological, biochemical, redox-related, and faecal microbiota outcomes associated with Limosilactobacillus reuteri ATA-LTC-Lr050600. The toxicological assessment was conducted following 28 days of daily oral administration, with an additional 14-day treatment-free recovery period in designated recovery groups. Faecal microbiota profiles were evaluated at baseline (Day 0) and Day 15 to characterize temporal changes in microbial diversity and taxonomic composition. The findings showed temporal changes in faecal microbiota composition, accompanied by generally comparable profiles for most of the measured biochemical parameters, organ weights, and systemic redox-related indices. However, these findings should be interpreted as observations under the conditions of the study rather than as definitive evidence of a causal relationship or functional benefit.
The biochemical findings were generally consistent with the absence of a broad pattern of treatment-associated disturbance across the parameters examined. Although isolated differences were observed in individual markers, these were not accompanied by a consistent pattern across the measured biochemical endpoints. Similar findings have been reported in studies evaluating L. reuteri strains and other lactic acid bacteria, in which isolated biochemical changes were not necessarily accompanied by broader alterations in clinical chemistry or other toxicological endpoints [17,29,30,31,32]. In the present study, this overall pattern provides physiological context for the microbiota findings, but it does not independently establish the safety or efficacy of the strain beyond the endpoints and experimental conditions evaluated. The redox-related findings require cautious interpretation. TOS and OSI did not differ significantly between the corresponding groups, while TAS was numerically lower in the recovery L. reuteri groups in both sexes. Although these TAS differences reached nominal significance in the unadjusted analyses, neither remained statistically significant after correction for multiple comparisons. The differences were small in relative magnitude, occurred only after the treatment-free recovery period, and were not accompanied by corresponding changes in TOS or OSI. Moreover, TAS values in the recovery control groups were slightly higher than those in the respective main controls. Taken together, these findings do not support a specific treatment-related antioxidant or pro-oxidant effect of L. reuteri ATA-LTC-Lr050600.
Organ-weight analysis identified increased absolute liver and kidney weights in female rats at the end of the 14-day recovery period (Holm-adjusted p = 0.0238 for both organs), while no organ-weight difference remained significant in the main study or in male recovery animals. This sex- and phase-specific finding requires cautious interpretation. The macroscopic findings included isolated kidney observations in both recovery controls and treated animals, without a consistent treatment-specific distribution. In the absence of corresponding histopathological findings, the toxicological significance of the female recovery organ-weight differences remains uncertain. These observations warrant explicit reporting rather than a conclusion that no organ-weight differences occurred.
The faecal microbiota analysis revealed changes in selected alpha-diversity indices between baseline and Day 15. Simpson dominance increased on Day 15 in the probiotic group, reflecting the expansion of a few dominant taxa, but the change was not statistically significant (p = 0.31). These results indicate changes in estimated richness and diversity-related measures during the observation period. However, changes in alpha-diversity indices do not, by themselves, establish that the microbiota became healthier or more functionally beneficial [33]. The interpretation of beta-diversity findings also requires consideration of the statistical evidence supporting differences in community structure. Visual separation in PCA or PCoA plots can suggest compositional differences, but statistical significance should be determined from the corresponding inferential analysis, including the PERMANOVA result where applicable [34,35,36]. Regarding beta diversity, Day 0 and Day 15 samples were not clearly separated in the ordination, and PERMANOVA did not detect a significant effect of time in either group. These findings suggest that, despite changes in selected alpha-diversity indices, the overall microbial community structure remained statistically comparable over the study period.
At the taxonomic level, changes were observed in several bacterial groups, including Lactobacillus and Bifidobacterium, as well as in selected species-level taxa. The relative abundances of Lactobacillus murinus, L. acidophilus, Bifidobacterium animalis, B. pseudolongum, and L. reuteri increased in the reported comparisons, whereas selected taxa, including Citrobacter sedlakii, Citrobacter youngae, and Escherichia coli, decreased in relative abundance. These findings describe changes in the composition of the faecal microbial community. Although previous studies have investigated probiotic-associated properties of several of these taxa [37,38,39,40,41,42], taxonomic identity alone does not establish the function or health effect of a population within the specific experimental context. In addition, 16S rRNA gene amplicon sequencing provides relative-abundance estimates and does not directly quantify absolute bacterial loads. Consequently, the observed reductions in selected taxa cannot be interpreted as direct evidence of reduced pathogenic activity, lower infection risk, or improved intestinal health. Importantly, Citrobacter sedlakii and Citrobacter youngae were abundant only in two baseline samples, one from a control animal and one from a probiotic-treated animal. Thus, their baseline distribution was not specific to the treatment group, and the subsequent reductions should not be attributed directly to probiotic administration.
The relative abundance of the genus Lactobacillus, as assigned by the SILVA 138 reference database, increased in all five probiotic-treated animals, with the mean relative abundance rising from 3.83% at baseline to 43.99% at Day 15. However, this change did not reach statistical significance (paired p = 0.0625), and the group × time interaction was not significant after FDR correction (q = 0.34). Bifidobacterium also increased in the control group (from 5.84% to 15.47%), indicating that its increase was not specific to probiotic treatment.
At the phylum level, Firmicutes showed a numerical change in relative abundance between Day 0 and Day 15. At the genus level, numerical changes were also observed in Romboutsia and Blautia. The corresponding mean relative abundance values are presented in Table 3. These changes are described as numerical differences and should not be interpreted as statistically significant effects.
Several taxa, including Akkermansia muciniphila, Prevotella, Dialister, Veillonella, Gemmiger, and Barnesiella, were detected predominantly in three animals from the probiotic group at baseline (Day 0) and were either undetectable or present at lower relative abundances on Day 15. The observed numerical decrease in A. muciniphila, a mucin-degrading bacterium associated with intestinal barrier homeostasis, may be of biological interest. However, its relative abundance was low (<1%), and the change was not statistically significant. Therefore, this finding should be interpreted cautiously and does not provide direct evidence of altered intestinal barrier function.
Changes were also observed in taxa associated in the literature with short-chain fatty acid (SCFA) metabolism, including Clostridium disporicum, Allobaculum stercoricanis, and Eubacterium hallii [43,44]. These findings may provide a basis for investigating possible links between microbiota composition and microbial metabolism. However, SCFA concentrations were not measured in the present study, and the relative abundance of taxa associated with SCFA production does not establish actual metabolite output. Similarly, the study did not directly measure intestinal barrier integrity, microbial metabolic activity, or molecular markers that could establish a mechanistic relationship between the observed taxonomic changes and systemic redox parameters. Accordingly, the proposed links between microbial composition, SCFA metabolism, and host redox regulation should be considered hypotheses for future investigation rather than demonstrated mechanisms [45,46,47,48].
Faecalibacterium prausnitzii, a major butyrate-producing commensal, showed a decrease in relative abundance following probiotic administration; however, this change was not statistically significant. The observed pattern was largely influenced by three baseline samples in which the relative abundance of this species exceeded 1%. This baseline variability should be considered when interpreting the temporal changes in this taxon.
To further contextualize the microbiota findings, the study by Liu et al. [28], which investigated the effects of Limosilactobacillus reuteri DSM 17938 in rats under different dietary conditions and included a concurrent control group, provides a relevant point of comparison. Their study highlights the importance of dietary background and experimental controls when interpreting probiotic-associated changes in gut microbial composition. In the present study, administration of L. reuteri ATA-LTC-Lr050600 was associated with temporal changes in faecal microbiota composition and diversity between the pre-administration and post-administration sampling points. However, these findings cannot be considered directly equivalent to those reported by Liu et al. [28], because the studies differed in the bacterial strain, dietary conditions, and experimental design. Importantly, although paired faecal samples were available before and after administration in the present study, no concurrent untreated control group was included in the microbiota analysis. Therefore, the study of Liu et al. [28] provides an external literature-based comparator but cannot replace an internal control group. Accordingly, the observed microbiota changes should be interpreted as treatment-associated temporal differences rather than definitive evidence that the intervention alone caused these changes.
An important limitation is that the faecal microbiota analysis was based on paired samples collected from the same animals at baseline and after 14 days of administration, without a concurrent untreated control group for this specific analysis. Published microbiota profiles from other studies provide contextual information but cannot substitute for a control group within the present experiment. Additionally, three baseline samples in the probiotic group exhibited unusually high microbial richness, which may have contributed to the observed differences in dispersion between groups. This baseline heterogeneity should be considered when interpreting the beta-diversity patterns and temporal changes. Another limitation of the present study is the relatively small sample size in certain experimental groups (n = 5–6 animals per group), which may have limited the statistical power to detect small or moderate differences. Therefore, the observed temporal differences cannot be attributed exclusively to administration of L. reuteri ATA-LTC-Lr050600, because intervention-related changes cannot be fully distinguished from time-dependent variation or other potential influences. Differences in strains, diets, husbandry conditions, and analytical methods also limit direct comparisons with published studies, including studies that incorporated concurrent control groups [34,35,36,37,38,39,40,41,42,43,44,45,46,47,48,49,50]. These limitations should be considered when interpreting the magnitude and biological relevance of the observed microbiota changes.
Most measured biochemical parameters, organ-weight profiles, and systemic TOS and OSI values did not show a consistent pattern of alteration, although differences in individual endpoints, including TAS during the recovery period, were observed. The microbiota findings identify taxonomic and diversity-related changes that warrant further investigation, but they do not establish functional improvement, increased SCFA production, or a causal relationship between the administered strain and the observed community changes. Future controlled studies incorporating absolute microbial quantification, metabolomic profiling, and targeted host-response measurements are needed to determine the functional significance and reproducibility of these observations.
5. Conclusions
The administration of L. reuteri ATA-LTC-Lr050600 was found to be associated with time-dependent changes in the diversity and composition of the fecal microbiota between baseline and day 15. These alterations were concomitant with comparable profiles in the majority of systemic biochemical parameters and organ weights measured under the study conditions. However, disparities were identified in select individual parameters. In the absence of a concurrent untreated control group in the microbiota analysis, it is not possible to attribute the observed time-dependent changes solely to the strain treatment. Furthermore, although TAS, TOS, and OSI were evaluated as general indicators of systemic redox status, targeted molecular or enzymatic markers were not examined to characterize specific oxidative or antioxidant mechanisms. Consequently, the present findings do not lend support to a particular antioxidant effect or a causal relationship between the observed microbiota changes and host redox homeostasis. Further controlled studies incorporating metabolomic profiling and direct measurements of redox biomarkers are required to elucidate the biological significance of the observed microbiota changes and to investigate potential relationships between microbial functions and host responses. The following conclusions are posited: The administration of L. reuteri ATA-LTC-Lr050600 was found to be associated with time-dependent changes in the diversity and composition of the fecal microbiota between baseline and day 15. These alterations were concomitant with comparable profiles in the majority of systemic biochemical parameters and organ weights measured under the study conditions. Nevertheless, discrepancies were observed in certain individual parameters. The absence of a concurrent untreated control group in the microbiota analysis precludes attribution of the observed time-dependent changes solely to the strain administration. Furthermore, although TAS, TOS and OSI were evaluated as general indicators of systemic redox status, targeted molecular or enzymatic markers were not examined.
Supplementary Materials
The following supporting information can be downloaded at: https://www.mdpi.com/article/10.3390/antiox15111513/s1.
Author Contributions
Conceptualization, İ.A. and E.O.B.; methodology, İ.A., A.A.K. and B.Ç.; software, B.C.Ö., A.R.B.; validation, Ş.K., Ş.Ö.K. and F.H.; formal analysis, E.O.B. and R.H.; investigation, E.O.B., B.C.Ö., A.R.B., A.H., R.A. and G.Y.; resources, İ.A., B.Ç. and B.A.B.; data curation, F.H. and I.M.; writing—original draft preparation, E.O.B., İ.A. and Ş.K.; writing—review and editing, İ.A., A.A.K., Ş.Ö.K., A.H., B.A.B. and I.M.; visualization, B.C.Ö. and E.O.B.; supervision, İ.A., B.Ç. and A.A.K.; project administration, İ.A.; funding acquisition, İ.A. All authors have read and agreed to the published version of the manuscript.
Funding
This research received no external funding.
Institutional Review Board Statement
The animal study protocol was approved by the IBG Local Animal Experimentation Ethics Committee [Approval No. 2025-011; 10 April 2025]. The gut microbiota study was approved by the Izmir Biomedicine and Genome Center Ethics Committee [Protocol No. 2025-003; 10 April 2025].
Informed Consent Statement
Not applicable.
Data Availability Statement
The raw data supporting the conclusions of this article will be made available by the authors upon request.
Acknowledgments
We confirm that all individuals mentioned in the Acknowledgements section have provided their consent to be acknowledged. During the preparation of this manuscript, the authors used ChatGPT [GPT-5, OpenAI, San Francisco, CA, USA; OpenAI] for language editing, grammar improvement, manuscript organization, and graphical layout assistance. The authors have reviewed and edited the output and take full responsibility for the content of this publication. The graphical abstract was created using BioRender.com. Created in BioRender. Bursalioglu, EO. [2026] https://BioRender.com/2pz33zs (accessed on 11 July 2026).
Conflicts of Interest
Ertuğrul Osman Bursalıoğlu, Şaban Kalay, Ahmet Arif Kurt, Rana Hamdemir, Şükran Özdatlı Kurtuluş, Fatih Hacımustafaoğlu, Burcu Aydın Boyama, Ayşenur Hacımustafaoğlu and Irma Mahmuljin declare that the research was conducted in the absence of any commercial or financial relationships that could be construed as potential conflicts of interest. Reyhan Aliusta is employed by Venar Sağlık A.Ş. İsmail Aslan and Bekir Çakıcı are affiliated with ATABIO Technologies Co., Ltd., and SFA R&D Private Health Services Co., Ltd. Batuhan Cenk Özkan and Abdurrahman Recep Bülbül are affiliated with ATABIO Technologies Co., Ltd. Gamze Yıldırım is employed by Kızılay Beverages. The bacterial strain investigated in this study was isolated and is produced by ATABIO Technologies Co., Ltd., which retains ownership of the strain. Authors affiliated with ATABIO Technologies Co., Ltd. participated in the experimental procedures, data analysis, interpretation of results, and manuscript preparation. These commercial interests and contributions are disclosed as potential conflicts of interest.
Abbreviations
The following abbreviations are used in this manuscript:
| ALP | Alkaline phosphatase |
| ALT | Alanine aminotransferase |
| AST | Aspartate aminotransferase |
| CRP | C-reactive protein |
| ROS | Reactive oxygen species |
| SOD | Superoxide dismutase |
| SCFA | Short-chain fatty acid |
| AhR | Aryl hydrocarbon receptor |
| H&E | Hematoxylin and eosin |
| DNA/dsDNA | Deoxyribonucleic acid/double-stranded DNA |
| rRNA | Ribosomal RNA |
| PCR | Polymerase chain reaction |
| ASV/ASVs | Amplicon sequence variant[s] |
| GC/LC-MS | Gas or liquid chromatography-mass spectrometry |
| PCA | Principal Component Analysis |
| PCoA | Principal Coordinate Analysis |
| LEfSe | Linear discriminant analysis Effect Size |
| LDA | Linear discriminant analysis |
| SD | Standard deviation |
| IQR | Interquartile range |
| OECD | Organization for Economic Co-operation and Development |
| NCBI | National Center for Biotechnology Information |
| IBG | Izmir Biomedicine and Genome Center |
| CFU | Colony-forming unit |
| SPF | Specific pathogen-free |
| SST | Serum separator tubes |
| NC | Negative control |
| RB | Recovery group |
| LA | Slide/sample collected |
References
- Koren, O.; Collado, M.C.; Chassaing, B.; Silverman, M.A.; Konnikova, L. Microbial metabolites at the front line: Orchestrating gastrointestinal and systemic barrier immunity across the lifespan. Cell Rep. 2026, 45, 117556. [Google Scholar] [CrossRef] [Scilit] [PubMed]
- Di Vincenzo, F.; Del Gaudio, A.; Petito, V.; Lopetuso, L.R.; Scaldaferri, F. Gut microbiota, intestinal permeability, and systemic inflammation: A narrative review. Intern. Emerg. Med. 2024, 19, 275–293. [Google Scholar] [CrossRef] [Scilit] [PubMed]
- Zheng, D.; Liwinski, T.; Elinav, E. Interaction between microbiota and immunity in health and disease. Cell Res. 2020, 30, 492–506. [Google Scholar] [CrossRef] [Scilit] [PubMed]
- Lo, B.C.; Chen, G.Y.; Núñez, G.; Caruso, R. Gut microbiota and systemic immunity in health and disease. Int. Immunol. 2021, 33, 197–209. [Google Scholar] [CrossRef] [Scilit] [PubMed]
- Tilg, H.; Zmora, N.; Adolph, T.E.; Elinav, E. The intestinal microbiota fuelling metabolic inflammation. Nat. Rev. Immunol. 2020, 20, 40–54. [Google Scholar] [CrossRef] [Scilit] [PubMed]
- Wastyk, H.C.; Fragiadakis, G.K.; Perelman, D.; Dahan, D.; Merrill, B.D.; Yu, F.B.; Topf, M.; Gonzalez, C.G.; Van Treuren, W.; Han, S.; et al. Gut-microbiota-targeted diets modulate human immune status. Cell 2021, 184, 4137–4153. [Google Scholar] [CrossRef] [Scilit] [PubMed]
- Peterson, C.T.; Sharma, V.; Elmén, L.; Peterson, S.N. Immune homeostasis, dysbiosis and therapeutic modulation of the gut microbiota. Clin. Exp. Immunol. 2015, 179, 363–377. [Google Scholar] [CrossRef] [Scilit] [PubMed]
- Sanders, M.E.; Merenstein, D.J.; Reid, G.; Gibson, G.R.; Rastall, R.A. Probiotics and prebiotics in intestinal health and disease: From biology to the clinic. Nat. Rev. Gastroenterol. Hepatol. 2019, 16, 605–616. [Google Scholar] [CrossRef] [Scilit] [PubMed]
- Nowicki, K.N.; Pories, W.J. Bacteria with potential: Improving outcomes through probiotic use following Roux-en-Y gastric bypass. Clin. Obes. 2023, 13, e12552. [Google Scholar] [CrossRef] [Scilit] [PubMed]
- Dicksved, J.; Schreiber, O.; Willing, B.; Petersson, J.; Rang, S.; Phillipson, M.; Holm, L.; Roos, S. Lactobacillus reuteri maintains a functional mucosal barrier during DSS treatment despite mucus layer dysfunction. PLoS ONE 2012, 7, e46399. [Google Scholar] [CrossRef] [Scilit] [PubMed]
- Wu, H.; Xie, S.; Miao, J.; Li, Y.; Wang, Z.; Wang, M.; Yu, Q. Lactobacillus reuteri maintains intestinal epithelial regeneration and repairs damaged intestinal mucosa. Gut Microbes 2020, 11, 997–1014. [Google Scholar] [CrossRef] [Scilit] [PubMed]
- Cervantes-Barragan, L.; Chai, J.N.; Tianero, M.D.; Di Luccia, B.; Ahern, P.P.; Merriman, J.; Cortez, V.S.; Caparon, M.G.; Donia, M.S.; Gilfillan, S.; et al. Lactobacillus reuteri induces gut intraepithelial CD4+CD8αα+ T cells. Science 2017, 357, 806–810. [Google Scholar] [CrossRef] [Scilit] [PubMed]
- Liu, Z.; Cao, Q.; Wang, W.; Wang, B.; Yang, Y.; Xian, C.J.; Zhai, Y. The Impact of Lactobacillus reuteri on Oral and Systemic Health: A Comprehensive Review of Recent Research. Microorganisms 2024, 13, 45. [Google Scholar] [CrossRef] [Scilit] [PubMed]
- Yang, X.; Liu, W.; Zhang, X.; Sun, M.; Yi, H.; Liao, S.; Xiang, R.; Zhang, H.; Yang, Q.; Mori, H. Glycerol-derived reuterin regulates human intestinal microbiota and metabolites. Front. Microbiol. 2024, 15, 1454408. [Google Scholar] [CrossRef] [Scilit] [PubMed]
- Abuqwider, J.; Altamimi, M.; Mauriello, G. Limosilactobacillus reuteri in Health and Disease. Microorganisms 2022, 10, 522. [Google Scholar] [CrossRef] [Scilit] [PubMed]
- Wolf, B.W.; Garleb, K.A.; Ataya, D.G.; Casas, I.A. Safety and tolerance of Lactobacillus reuteri supplementation to a population infected with the human immunodeficiency virus. Food Chem. Toxicol. 1998, 36, 1085–1094. [Google Scholar] [CrossRef] [Scilit] [PubMed]
- Gangaiah, D.; Gu, M.; Zaparte, A.; Will, O.; Dolan, L.C.; Goering, A.; Pillai, J.; Mane, S.P.; Plata, G.; Helmes, E.B.; et al. Effects of L. reuteri strains PTA-126787 and PTA-126788 on intestinal barrier integrity and immune homeostasis in an alcohol-induced leaky gut model. Sci. Rep. 2024, 14, 19584. [Google Scholar] [CrossRef] [Scilit] [PubMed]
- OECD. Test No. 407: Repeated Dose 28-day Oral Toxicity Study in Rodents. In OECD Guidelines for the Testing of Chemicals, Section 4; OECD Publishing: Paris, France, 2025. [Google Scholar] [CrossRef] [Scilit]
- Hill, C.; Guarner, F.; Reid, G.; Gibson, G.R.; Merenstein, D.J.; Pot, B.; Morelli, L.; Canani, R.B.; Flint, H.J.; Salminen, S.; et al. Expert consensus document: The International Scientific Association for Probiotics and Prebiotics consensus statement on the scope and appropriate use of the term probiotic. Nat. Rev. Gastroenterol. Hepatol. 2014, 11, 506–514. [Google Scholar] [CrossRef] [Scilit] [PubMed]
- Shi, S.; Liu, J.; Dong, J.; Hu, J.; Liu, Y.; Feng, J.; Zhou, D. Research progress on the regulation mechanism of probiotics on the microecological flora of infected intestines in livestock and poultry. Lett. Appl. Microbiol. 2022, 74, 647–655. [Google Scholar] [CrossRef] [Scilit] [PubMed]
- Ojetti, V.; Petruzziello, C.; Migneco, A.; Candelli, M.; Saviano, A. Impact of oral administration of Lactobacillus reuteri LMG-P 27481 on human gut microbiota diversity and function: A pilot study. Biomedicines 2025, 13, 2840. [Google Scholar] [CrossRef] [Scilit] [PubMed]
- Aslan, İ.; Celebi, L.T.; Kayhan, H.; Kizilay, E.; Gülbahar, M.Y.; Kurt, H.; Cakici, B. Probiotic formulations containing fixed and essential oils ameliorates SIBO-induced gut dysbiosis in rats. Pharmaceuticals 2023, 16, 1041. [Google Scholar] [CrossRef] [Scilit] [PubMed]
- du Sert, N.P.; Hurst, V.; Ahluwalia, A.; Alam, S.; Avey, M.T.; Baker, M.; Browne, W.J.; Clark, A.; Cuthill, I.C.; Dirnagl, U.; et al. The ARRIVE guidelines 2.0: Updated guidelines for reporting animal research. PLoS Biol. 2020, 18, e3000410. [Google Scholar] [CrossRef] [Scilit] [PubMed]
- Erel, O. A novel automated direct measurement method for total antioxidant capacity using a new generation, more stable ABTS radical cation. Clin. Biochem. 2004, 37, 277–285. [Google Scholar] [CrossRef] [Scilit] [PubMed]
- Erel, O. A new automated colorimetric method for measuring total oxidant status. Clin. Biochem. 2005, 38, 1103–1111. [Google Scholar] [CrossRef] [Scilit]
- Morrison, D.J.; Preston, T. Formation of short chain fatty acids by the gut microbiota and their impact on human metabolism. Gut Microbes 2016, 7, 189–200. [Google Scholar] [CrossRef] [Scilit] [PubMed]
- Reichardt, N.; Duncan, S.H.; Young, P.; Belenguer, A.; McWilliam Leitch, C.; Scott, K.P.; Flint, H.J.; Louis, P. Phylogenetic distribution of three pathways for propionate production within the human gut microbiota. ISME J. 2014, 8, 1323–1335. [Google Scholar] [CrossRef] [Scilit] [PubMed]
- Liu, H.; Qin, Y.; Li, K.; Li, M.; Yang, J.; Tao, H.; Tang, Y.; Yang, L.; Chen, S.; Liu, Y.; et al. Potential type 2 diabetes mellitus drug HMPA promotes short-chain fatty acid production by improving carbon catabolite repression effect of gut microbiota. Br. J. Pharmacol. 2021, 178, 946–963. [Google Scholar] [CrossRef] [Scilit] [PubMed]
- Shokryazdan, P.; Jahromi, M.F.; Liang, J.B.; Ramasamy, K.; Sieo, C.C.; Ho, Y.W. Safety assessment of two new Lactobacillus strains as probiotic for human using a rat model. PLoS ONE 2016, 11, e0159851. [Google Scholar] [CrossRef] [Scilit] [PubMed]
- Tsai, C.C.; Leu, S.F.; Huang, Q.R.; Chou, L.C.; Huang, C.C. Safety evaluation of multiple strains of Lactobacillus plantarum and Pediococcus pentosaceus in Wistar rats based on the Ames test and a 28-day feeding study. Sci. World J. 2014, 2014, 928652. [Google Scholar] [CrossRef] [Scilit] [PubMed]
- Szabo, N.J.; Dolan, L.C.; Burdock, G.A.; Shibano, T.; Sato, S.-I.; Suzuki, H.; Uesugi, T.; Yamahira, S.; Toba, M.; Ueno, H. Safety evaluation of Lactobacillus pentosus strain b240. Food Chem. Toxicol. 2011, 49, 251–258. [Google Scholar] [CrossRef] [Scilit] [PubMed]
- Negi, A.; Pasam, T.; Farqadain, S.M.; Mahalaxmi, Y.; Dandekar, M.P. In-vitro and preclinical testing of Bacillus subtilis UBBS-14 probiotic in rats shows no toxicity. Toxicol. Res. 2024, 13, tfae021. [Google Scholar] [CrossRef] [Scilit] [PubMed]
- Deng, Y.; Umbach, A.K.; Neufeld, J.D. Nonparametric richness estimators Chao1 and ACE must not be used with amplicon sequence variant data. ISME J. 2024, 18, wrae106. [Google Scholar] [CrossRef] [Scilit] [PubMed]
- Xia, Y.; Sun, J. Bioinformatic and statistical analysis of microbiome data. In From Raw Sequences to Advanced Modeling with QIIME 2 and R; Springer Nature: Cham, Switzerland, 2023. [Google Scholar]
- Costa, M.; Weese, J.S. Methods and basic concepts for microbiota assessment. Vet. J. 2019, 249, 10–15. [Google Scholar] [CrossRef] [Scilit] [PubMed]
- Finn, D.R. A metagenomic alpha-diversity index for microbial functional biodiversity. FEMS Microbiol. Ecol. 2024, 100, fiae019. [Google Scholar] [CrossRef] [Scilit] [PubMed]
- Mu, Q.; Tavella, V.J.; Luo, X.M. Role of Lactobacillus reuteri in human health and diseases. Front. Microbiol. 2018, 9, 757. [Google Scholar] [CrossRef] [Scilit] [PubMed]
- O’Callaghan, A.; Van Sinderen, D. Bifidobacteria and their role as members of the human gut microbiota. Front. Microbiol. 2016, 7, 925. [Google Scholar] [CrossRef] [Scilit] [PubMed]
- Klaenhammer, T.R.; Altermann, E.; Pfeiler, E.; Buck, B.L.; Goh, Y.-J.; O’FLaherty, S.; Barrangou, R.; Duong, T. Functional genomics of probiotic Lactobacilli. J. Clin. Gastroenterol. 2008, 42, S160–S162. [Google Scholar] [CrossRef] [Scilit] [PubMed]
- Den Besten, G.; Van Eunen, K.; Groen, A.K.; Venema, K.; Reijngoud, D.J.; Bakker, B.M. The role of short-chain fatty acids in the interplay between diet, gut microbiota, and host energy metabolism. J. Lipid Res. 2013, 54, 2325–2340. [Google Scholar] [CrossRef] [Scilit] [PubMed]
- Shin, N.R.; Whon, T.W.; Bae, J.W. Proteobacteria: Microbial signature of dysbiosis in gut microbiota. Trends Biotechnol. 2015, 33, 496–503. [Google Scholar] [CrossRef] [Scilit] [PubMed]
- Litvak, Y.; Byndloss, M.X.; Tsolis, R.M.; Bäumler, A.J. Dysbiotic Proteobacteria expansion: A microbial signature of epithelial dysfunction. Curr. Opin. Microbiol. 2017, 39, 1–6. [Google Scholar] [CrossRef] [Scilit] [PubMed]
- Greetham, H.L.; Gibson, G.R.; Giffard, C.; Hippe, H.; Merkhoffer, B.; Khatib, U.; Collins, M.D. Allobaculum stercoricanis gen. nov., sp. nov., isolated from canine feces. Anaerobe 2004, 10, 301–307. [Google Scholar] [CrossRef] [Scilit] [PubMed]
- Louis, P.; Flint, H.J. Formation of propionate and butyrate by the human colonic microbiota. Environ. Microbiol. 2017, 19, 29–41. [Google Scholar] [CrossRef] [Scilit] [PubMed]
- Markowiak-Kopeć, P.; Śliżewska, K. The effect of probiotics on the production of short-chain fatty acids by human intestinal microbiome. Nutrients 2020, 12, 1107. [Google Scholar] [CrossRef] [Scilit] [PubMed]
- Rivière, A.; Selak, M.; Lantin, D.; Leroy, F.; De Vuyst, L. Bifidobacteria and butyrate-producing colon bacteria: Importance and strategies for their stimulation in the human gut. Front. Microbiol. 2016, 7, 979. [Google Scholar] [CrossRef] [Scilit] [PubMed]
- Plaza-Diaz, J.; Ruiz-Ojeda, F.J.; Gil-Iglesias, M.; Gil, A. Mechanisms of action of probiotics. Adv. Nutr. 2019, 10, S49–S66. [Google Scholar] [CrossRef] [Scilit] [PubMed]
- Hemarajata, P.; Versalovic, J. Effects of probiotics on gut microbiota: Mechanisms of intestinal immunomodulation and neuromodulation. Ther. Adv. Gastroenterol. 2013, 6, 39–51. [Google Scholar] [CrossRef] [Scilit] [PubMed]
- Binda, C.; Lopetuso, L.R.; Rizzatti, G.; Gibiino, G.; Cennamo, V.; Gasbarrini, A. Actinobacteria: A relevant minority for the maintenance of gut homeostasis. Dig. Liver Dis. 2018, 50, 421–428. [Google Scholar] [CrossRef] [Scilit] [PubMed]
- Karkman, A.; Lehtimäki, J.; Ruokolainen, L. The ecology of human microbiota: Dynamics and diversity in health and disease. Ann. N. Y. Acad. Sci. 2017, 1399, 78–92. [Google Scholar] [CrossRef] [Scilit] [PubMed]

Disclaimer/Publisher’s Note: The statements, opinions and data contained in all publications are solely those of the individual author(s) and contributor(s) and not of MDPI and/or the editor(s). MDPI and/or the editor(s) disclaim responsibility for any injury to people or property resulting from any ideas, methods, instructions or products referred to in the content. |
© 2026 by the authors. Licensee MDPI, Basel, Switzerland. This article is an open access article distributed under the terms and conditions of the Creative Commons Attribution (CC BY) license.