


Abstract
Blueberries are rich in anthocyanins and phenolic acids, which contribute to fruit coloration and antioxidant properties. Given that blueberries ripen unevenly, unripe berries are unintentionally included at harvest. This study evaluated the effects of postharvest ultraviolet-B (UV-B) irradiation on anthocyanins and antioxidants in blueberries at different maturity stages: S1 (unripe green), S2 (unripe greenish pink), S3 (unripe pink), S4 (ripe purple), and S5 (fully ripe purple). UV-B was applied at 0–3 W·m−2 for 72 h. UV-B promoted coloration and anthocyanidin accumulation in S1 and S2 relative to non-irradiated controls, although their contents remained below those in fully ripe S5 fruit. Total anthocyanidin content remained relatively unchanged at S3 and decreased at S4, whereas accumulation in S5 increased at 1 W·m−2. UV-B-induced changes in antioxidant activity tended not to parallel anthocyanidin patterns consistently. At S2, treatment at 3 W·m−2 increased anthocyanidin content but decreased chlorogenic acid (CGA) content and ABTS radical scavenging activity. At S5, ABTS activity was highest at 1 W·m−2, whereas CGA content was highest at 3 W·m−2. These contrasts show that neither anthocyanidin nor CGA content alone explained the antioxidant responses. Overall, postharvest UV-B modulated phenolic accumulation and antioxidant properties differently according to fruit maturity and UV-B intensity.
1. Introduction
Blueberry contains various phenolic compounds, including anthocyanins, other flavonoids, and phenolic acids. It is consumed worldwide because of its high nutritional value and potential health benefits [1]. In particular, anthocyanins are major pigments responsible for the blue to purple coloration of blueberry skin and are among the principal bioactive compounds in the fruit. They exhibit antioxidant properties and have various health-promoting effects [2]. These compounds include diverse derivatives of cyanidin, delphinidin, and malvidin, whose composition and abundance change substantially during fruit maturation and coloration [3]. In addition to anthocyanins, the fruit contains other phenolics, such as chlorogenic acid (CGA), which contribute to its antioxidant properties [4]. Therefore, understanding the composition and accumulation patterns of anthocyanins and other phenolic compounds, as well as the factors that regulate their accumulation, is important for evaluating and improving the functional quality of blueberry fruit.
Harvesting of blueberries is highly labor-intensive because of factors including fruit positioning, uneven ripening, and the structural characteristics of the shrub increases production costs and reduces labor productivity [1,5]. Mechanical harvesting has been considered an alternative to overcome these challenges; however, fruit on the same plant and within the same cluster often ripens asynchronously, so fruit at different maturity stages is harvested simultaneously [6]. Given that fruit maturation is a critical determinant of not only skin color but also the composition and content of phenolic compounds, including anthocyanins, immature fruit may differ considerably from fully ripened fruit in these functional compounds [7]. Additionally, harvested fruit is prone to softening and sensitive to physical damage, which limits the options for postharvest sorting and handling [8]. Therefore, appropriate postharvest treatment techniques that promote coloration and the accumulation of bioactive compounds in immature fruit are required to enhance the quality and utility of fruit with uneven maturity.
Among postharvest treatments, light treatment has attracted attention as a method for regulating fruit coloration and secondary metabolism without chemical application [9]. Indeed, many studies have reported that postharvest light treatment can promote skin coloration and induce the accumulation of anthocyanins and phenolic compounds in various fruits including apples and peaches [10,11,12]. In particular, ultraviolet-B (UV-B) radiation acts both as an environmental stressor and as a light signal that triggers various secondary metabolic responses in plants [13]. Li et al. [13] reported that long-term UV-B irradiation applied approximately seven weeks before harvest resulted in fruit ripening and anthocyanin accumulation in highbush blueberries and promoted the accumulation of delphinidin-, petunidin-, and malvidin-derived glycosides [14]. These results suggest that UV-B treatment can promote anthocyanin accumulation in blueberry fruit. However, long-term preharvest UV-B irradiation is limited by the need for prolonged irradiation under actual production conditions. Conversely, postharvest UV-B treatment can be applied to harvested fruit for a relatively limited period and may modulate flavonoid metabolism and thus effect the accumulation of anthocyanins and phenolic compounds as well as antioxidant properties. Therefore, postharvest UV-B treatment can be considered a strategy for promoting coloration and the accumulation of bioactive compounds in immature blueberry fruit, thereby reducing the quality heterogeneity associated with differences in fruit maturation at harvest.
Although postharvest UV-B treatment can induce fruit coloration, these responses may depend on the physiological state of the fruit at the time of treatment [15]. Fruit maturity is a key determinant of the abundant and composition of anthocyanins and phenolic acids. Given that the physiological and metabolic status of fruit changes during maturation, its secondary metabolic response to postharvest UV-B treatment may also vary with maturity. However, it remains unclear whether UV-B-induced changes in individual compounds are consistently associated with changes in antioxidant activity across blueberry maturity stages. Therefore, this study investigated the effects of postharvest UV-B treatment on anthocyanins and phenolic accumulation and on antioxidant activity in blueberries of different maturity stages. The aim was to elucidate maturity-dependent fruit responses and thereby evaluate the potential of postharvest UV-B treatment to enhance coloration and the accumulation of functional compounds in blueberries.
2. Materials and Methods
2.1. Chemicals and Plant Materials
Analytical-grade individual anthocyanidin standards were obtained from Alfa Aesar (Tewksbury, MA, USA). CGA, ascorbic acid and gallic acid were purchased from Daejung Chemicals & Metals (Siheung, Republic of Korea). All solvents and chemicals used in the experiments were of analytical grade.
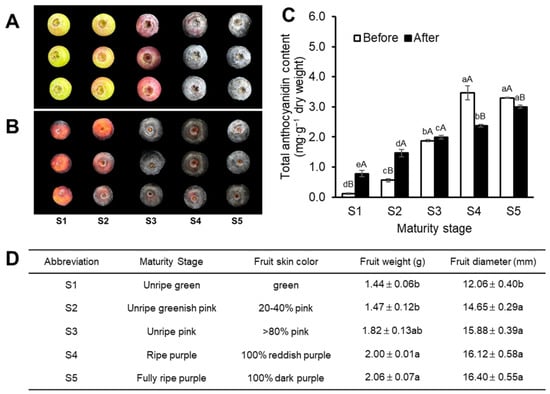
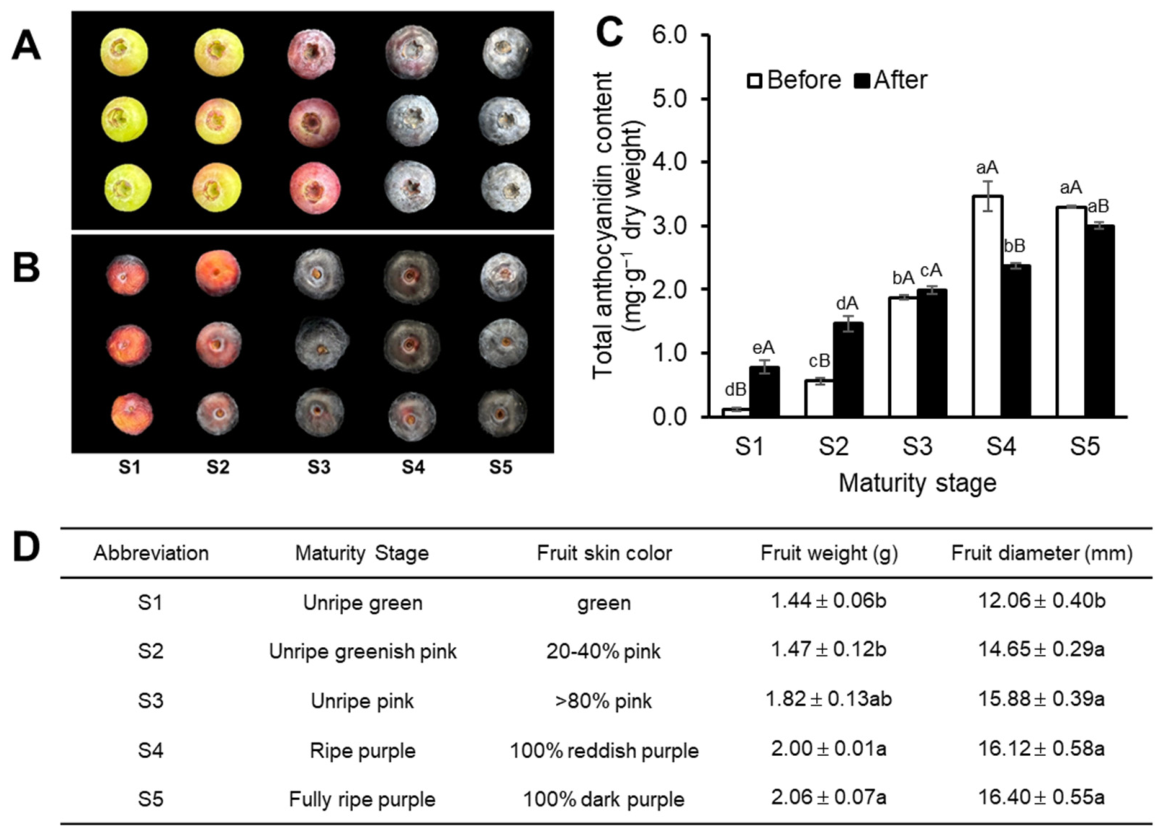
Blueberry fruit was harvested in July 2025 from a blueberry farm in Yongin, Republic of Korea (37°05′52.5″ N, 127°07′21.9″ E). Fruit was randomly harvested from 25 bushes. The harvested fruit was classified into five maturity stages based primarily on skin color. (Figure 1A): stage 1 (S1, unripe green); stage 2 (S2, unripe greenish pink); stage 3 (S3, unripe pink); stage 4 (S4, ripe purple); and stage 5 (S5, fully ripe purple). Figure 1 shows the physicochemical characteristics of the fruit at each maturity stage, including total anthocyanidin content (TAC), fruit weight, and diameter.
Figure 1.
Fruit appearance, total anthocyanidin content, and baseline characteristics of blueberry fruit at five maturity stages (S1–S5). Fruit appearance before treatment (A) and after UV-B treatment at 3 W·m−2 for 72 h (B). (C) Total anthocyanidin content before and after treatment, calculated as the sum of the five individual anthocyanidins quantified by HPLC after acid hydrolysis. (D) Physical characteristics of the blueberry fruit at each maturity stage. Values are presented as the mean ± SE (n = 3). In (C,D), different lowercase letters indicate significant differences among maturity stages within the same treatment, whereas different uppercase letters (D) indicate significant differences between UV-B treatments within the same maturity stage. Statistical differences were determined using Tukey’s studentized test (p < 0.05).
2.2. UV-B Treatment
The classified blueberry fruit was irradiated with UV-B at 1, 2, and 3 W∙m−2 using a narrowband UV-B lamp (TL 20W/01-RS; Philips Co., Hamburg, Germany). UV-B intensity and emission spectra were measured after the radiation passed through the transparent plastic bags. The transmitted radiation ranged from 305 to 315 nm, with a peak at 313 nm. The emission spectrum was measured using a spectrometer (SV2100, K-MAC, Daejeon, Republic of Korea). The fruit was placed in transparent plastic bags in a single layer without overlap and sprayed thrice with distilled water to maintain moisture. Non-irradiated fruit was prepared in the same manner as UV-B-treated fruit and stored in the dark. Both irradiated and non-irradiated samples were maintained at 20 ± 1 °C throughout the treatment period. UV-B was applied continuously for 72 h, and samples from the irradiated and non-irradiated groups were collected at 24-h intervals (0, 24, 48, and 72 h). The collected fruit was chopped, immediately frozen at −80 °C, and freeze-dried. The freeze-dried samples were used for high-performance liquid chromatography (HPLC), antioxidant activity, and total phenolic content (TPC) analyses.
2.3. Physicochemical Analysis
2.3.1. Total Soluble Solids (TSS) and Titratable Acidity (TA)
TSS and TA were determined following the method of Adetoro et al. [16], with some modifications. Samples collected before treatment (0 h) and after 72 h of treatment were analyzed. Each biological replicate comprised at least 20 whole fruits, which were freeze-dried, ground, and thoroughly mixed into a homogeneous powder. A 1-g aliquot of the powder was extracted with 20 mL of distilled water by sonication for 1 h. Each biological replicate was extracted and analyzed separately. The extract was centrifuged at 12,000× g for 5 min, and the supernatant was used for TSS and TA measurements.
For TSS measurement, 100 μL of the supernatant was placed on a digital refractometer (PAL-1, ATAGO, Minato-ku, Japan), and values were expressed as °Brix.
For TA determination, the supernatant was diluted 10-fold with distilled water. Approximately 2 mL of the diluted extract was mixed with 100 μL of 1% phenolphthalein solution and titrated with 0.1 N NaOH to pH 8.2 using a pH meter (HI 5521, Hanna Instruments, Woonsocket, RI, USA). The exact aliquot volume was recorded and used to calculate the dry sample mass represented in the titration. TA was expressed as g citric acid equivalents (CAE) per 100 g dry weight.
2.3.2. Colorimetric Assays
Morphological images of were taken using a digital single-lens reflex (DSLR) camera (D5000, Nikon, Tokyo, Japan), with the distance between the sample and the camera lens kept constant. Color values (RGB) were obtained following the method described by Lim et al. [17]. The RGB values were converted into L*, a*, and b* values using the OpenRGB software v.2.30.10125; Logicol, Trieste, Italy).
2.4. HPLC Analysis
2.4.1. Analysis of Anthocyanidins
Anthocyanidin analysis followed the method descried by Chung et al. (2016) [18], with some modification. The freeze-dried sample (20 mg) was extracted with 1 mL of 100% methanol by sonication condition for 1 h. The extract was centrifuged at 12,000× g for 5 min, and the supernatant was collected. For acid hydrolysis, 500 µL of the supernatant was mixed with 250 µL of 3 N HCl. The mixture was incubated at 80 °C for 5 h. After hydrolysis, the mixture was cooled to room temperature and filtered through a 45-µm syringe filter (Futecs Co., Ltd., Daejeon, Republic of Korea) before HPLC analysis. Anthocyanidins were analyzed using a Waters 2695 Alliance HPLC system with a Waters 996 photodiode array (PDA) detector (Waters Inc., Milford, MA, USA). Anthocyanidins were separated on a Prontosil 120-5-C18 SH column (250 × 4.6 mm, 5 µm; Bischoff, Leonberg, Germany). The mobile phase consisted of solvent A (water with 5% formic acid) and solvent B (acetonitrile with 5% formic acid) with the following linear gradient: 0–40 min, 8–20% B; 40–50 min, 20–45% B; 50–58 min, 45–8% B; 58–60 min, 8% B. The flow rate was 0.7 mL/min, and the injection volume was 5 µL. Peaks were detected at 520 nm. Cyanidin, delphinidin, and petunidin were identified by comparing their retention times and UV–Vis absorption spectra with those of authentic standards analyzed under the same chromatographic conditions and quantified using their respective calibration curves. Peonidin and malvidin were tentatively identified based on their chromatographic elution order and UV-Vis absorption characteristics reported in previous studies (Table S1 and Figure S1). Their contents were estimated using the cyanidin calibration curve and expressed as cyanidin equivalents (Table S1). TAC was calculated as the sum of the five individual anthocyanidins quantified by HPLC after acid hydrolysis.
2.4.2. CGA Analysis
Phenolic acids were analyzed by HPLC following the methods descried by Wang et al. (2017) [19] with some modifications. The ground samples (20 mg) were extracted with 1mL of 80% methanol at 30 °C by sonication for 1 h. The mixture was centrifuged at 12,000× g for 10 min, and the supernatant was collected. The supernatant was then processed as described in Section 2.4.1 for HPLC analysis. The mobile phase consisted of solvent A (water with 0.1% formic acid) and solvent B (methanol). The gradient elution program was as follows: 0–10 min, 0–12% B; 10–20 min, 12–20% B; 20–30 min, 20–30% B; 30–40 min, 30–32% B; 40–55 min, 32–35% B; 55–65 min, 35–37% B; 65–68 min, 37–50% B; 68–72 min, 50–51% B; 72–77 min, 51% B; 77–85 min, 51–53% B; 85–98 min, 53–60% B; 98–102 min, 60–90% B; 102–104 min, 90–0% B; 104–105 min, 0% B. The injection volume was 10 µL and peaks were detected at 280 nm. CGA was quantified using a calibration curve of the CGA standard (Figure S3).
2.5. Antioxidant Activities and TPC
The extracts were used to determine the antioxidant activity and TPC following the method of Kim et al. (2024), with some modifications [20]. Antioxidant activity was determined using the 2,2′-azino-bis (3-ethylbenzothiazoline-6-sulfonic acid) (ABTS) radical scavenging assay. Absorbance was measured at 734 nm, and activity was expressed as mg vitamin C equivalents (VCE)·g−1 dry weight. TPC was determined using the Folin–Ciocalteu assay and expressed as mg gallic acid equivalents (GAE)·g−1 dry weight.
2.6. Statistical Analysis
All data are expressed as the mean ± standard error (SE) of three replicates. Statistical analysis was performed using SAS software (Enterprise Guide 7.1; SAS Institute Inc., Cary, NC, USA). Differences among maturity stages and UV-B intensities were determined using Tukey’s studentized test (p < 0.05). Principal component analysis (PCA) plots were generated using RStudio (version 4.1.2; RStudio, Inc., PBC). PCA was performed separately for each maturity stage to explore variation in phenolic composition and ABTS radical scavenging activity across UV-B treatments. Each maturity-specific PCA included 12 biological samples, comprising three independent replicates at each of four UV-B irradiances (0, 1, 2, and 3 W·m−2). The variables included the five individual anthocyanidins, TAC, CGA, TPC, and ABTS radical scavenging activity.
3. Results
3.1. Classification of Blueberry Fruit by Maturity
Figure 1 shows the appearance and characteristics of blueberry fruit at different maturity stages before (0 h) and after UV-B treatment at 3 W·m−2 for 72 h. The fruit was classified into five maturity stages (S1–S5) as described in Section 2.1. Following UV-B treatment, visible changes in skin coloration were observed particularly in immature fruits (S1–S3), whereas the relatively mature S4 and S5 fruit showed less pronounced changes in external appearance (Figure 1A,B). Before UV-B treatment, TAC was low in immature S1 and S2 fruits (0.14 and 0.25 mg·g−1 d.w., respectively). TAC increased as maturity progressed, reaching the highest level of 4.29 mg·g−1 d.w. in fully ripe S5 fruit. After UV-B treatment at 3 W·m−2 for 72 h, TAC in S1 and S2 fruits increased to 1.47 and 1.65 mg·g−1 d.w., respectively, corresponding to approximately 10.5- and 6.6-fold increases over their initial levels. These values were comparable to the initial TAC of S3 fruit (1.62 mg·g−1 d.w.). In S3 fruit, in which coloration had already begun, TAC also increased from 1.62 to 1.99 mg·g−1 d.w. following UV-B treatment. Conversely, TAC decreased from 2.54 to 2.38 mg·g−1 d.w. in S4 fruit and, to a greater extent, from 4.29 to 3.00 mg·g−1 d.w. in S5. Overall, changes in TAC following UV-B treatment differed according to fruit maturity. Although TAC increased in immature fruits (S1 and S2) following UV-B treatment at 3 W·m−2 for 72 h, their concentrations remained lower than that in fully ripe S5 fruit under the same treatment conditions.
3.2. Physicochemical Properties of the Classified Blueberry Fruit
Table 1 shows the physicochemical properties of blueberry fruit at different maturity stages according to postharvest UV-B treatment. Before UV-B treatment, TSS ranged from 2.90–4.43 °Brix to and generally tended to increase with advancing maturity. After 72 h of UV-B treatment, TSS showed no distinct differences among UV-B intensities at most maturity stages. At S5, TSS was significantly higher at 1 W·m−2 than at 2 W·m−2, whereas neither treatment differed significantly from the control or the 3 W·m−2 treatment.
Table 1.
Physicochemical properties of blueberry fruit at different maturity stages before treatment and after 72 h under UV-B irradiances of 0, 1, 2, and 3 W·m−2.
Without UV-B treatment, TA was highest in S1 (24.39%) and decreased continuously as maturation progressed, reaching its lowest level at S5 (6.17%). Following UV-B treatment, changes in TA varied with the maturity stage and UV-B intensity. In S1, TA was significantly lower at 3 W·m−2 than in the control, whereas in S2, it was significantly higher at 2 W·m−2 than at the other intensities. In S3, the highest TA was observed at 1 W·m−2, whereas in S4, TA was significantly lower at 2 W·m−2 than in the control. In S5, TA did not differ significantly between the control and UV-B treatments. Overall, changes in TA in response to UV-B treatment varied with fruit maturity rather than following a consistent intensity-dependent pattern.
Fruit skin color also changed distinctly depending on fruit maturity and UV-B treatment. Before UV-B treatment, L* was highest in (86.18). It decreased as maturity progressed, reaching relatively low levels in the colored stages (S3–S5). In S1, UV-B treatment significantly decreased L* from 86.70 in the control to 56.73–68.33 and significantly increased a* from −19.62 to 34.59–36.14. The b* value also decreased distinctly, from 79.68 in the control to 22.35–48.85. S2 showed similar patterns, with UV-B treatment decreasing L* and b* and increasing a*. S2 fruit contained both green and partially pigmented surface regions, contributing to substantial variability in color values, particularly a*. In S3–S5, changes in color parameters following UV-B treatment were relatively limited compared with those in S1 and varied with the color parameter and UV-B intensity. In S3, the L* value was significantly higher at 2 W·m−2 than in the other treatments, whereas the b* value was significantly lower at 3 W·m−2 than in the control. In S4 and S5, L* or a* values did not differ significantly among UV-B treatments, whereas b* values were significantly lower at 3 W·m−2 than in the respective controls. Overall, changes in skin color in response to postharvest UV-B treatment varied with maturity and were most pronounced in the least mature S1 fruit.
3.3. Anthocyanidin Profiles in Response to Postharvest UV-B Treatment
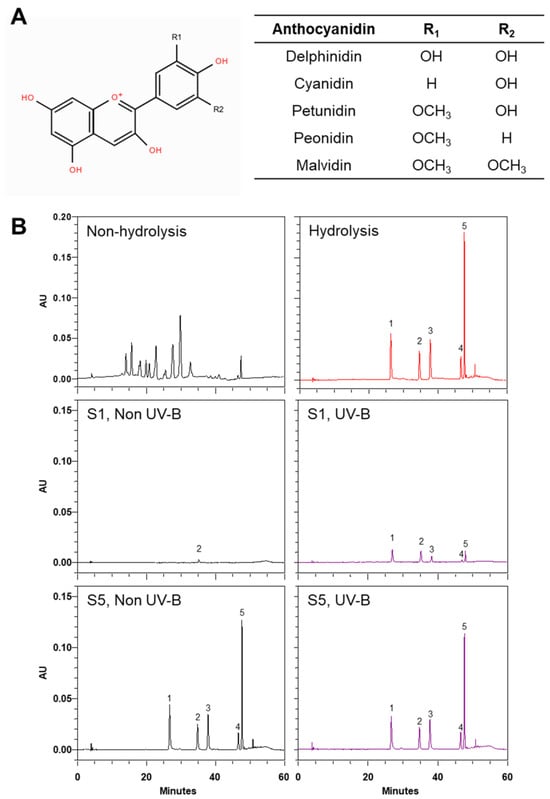
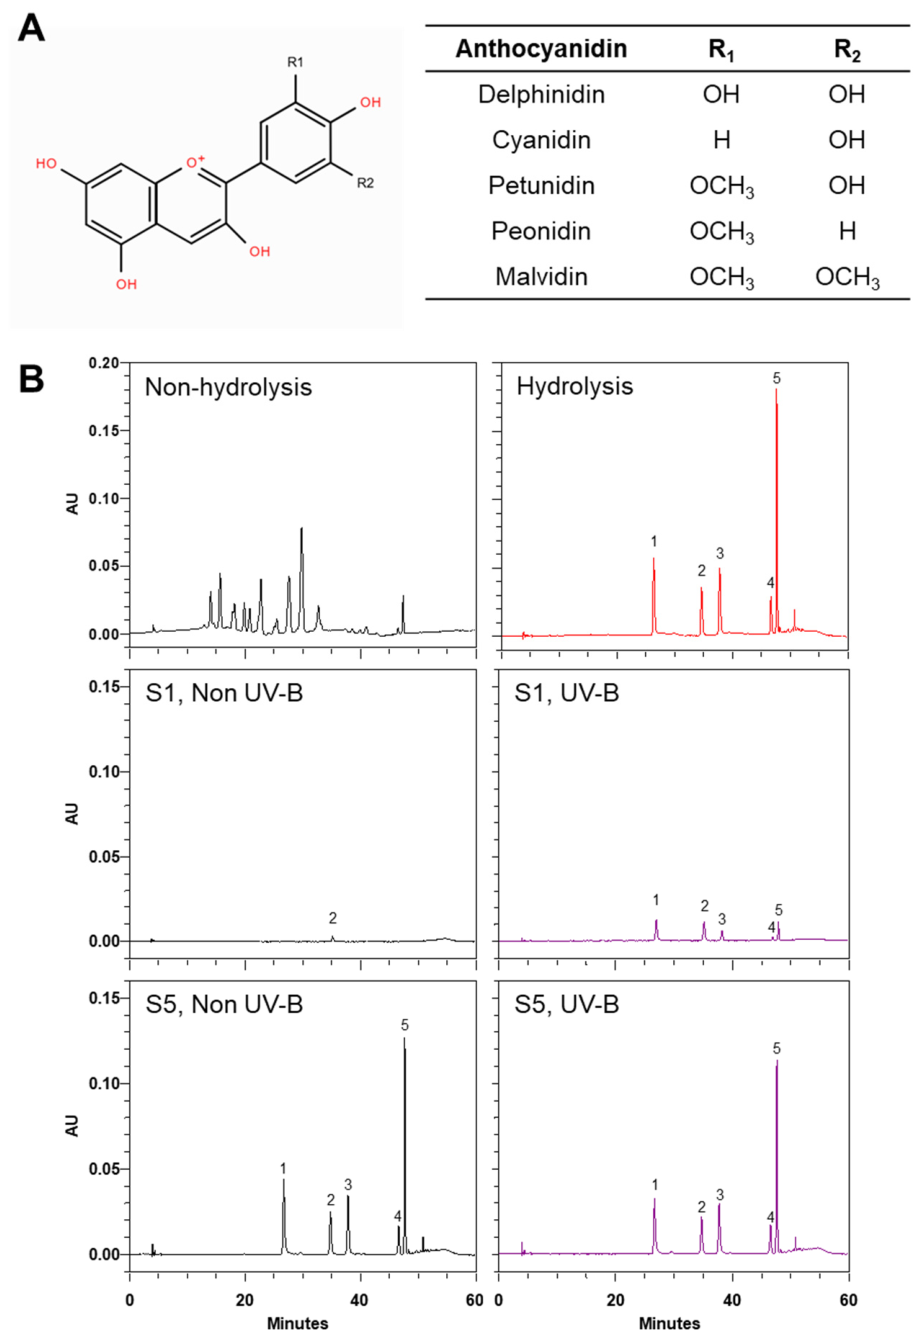
Figure 2 and Figure S2 shows the chemical structures and representative HPLC chromatograms of the five anthocyanidins detected in hydrolyzed blueberry extracts: delphinidin, cyanidin, petunidin, peonidin, and malvidin. In the absence of UV-B irradiation (dark conditions), cyanidin was the major anthocyanidin in immature S1 and S2 fruit at the beginning of the treatment period (Table S1). In S1, cyanidin content increased from 0.04 at 0 h to 0.11 mg·g−1 d.w. at 72 h, whereas the other anthocyanidins remained undetected, except for a small amount of malvidin detected at 72 h. In S2, cyanidin content increased overall from 0.13 to 0.22 mg·g−1 d.w. and the other anthocyanidins also accumulated, with all five detected by 48 h. These results show that anthocyanidins accumulated in immature fruit during postharvest storage even without UV-B irradiation. In S3–S5 fruit, all five anthocyanidins were detected at the beginning of the treatment period, but their accumulation patterns differed among maturity stages (Table S1). In S3, anthocyanidin contents changed relatively little and, were slightly higher at 72 h than at 0 h. In S4, all anthocyanidins increased over the storage period, with the largest increases observed in cyanidin and malvidin. Conversely, in S5, all anthocyanidins were lower at 72 h than at 0 h. Therefore, the extent of change in individual anthocyanidin contents during dark storage depended on the maturity stage.
Figure 2.
(A) Chemical structures of the five anthocyanidins and (B) representative HPLC chromatograms of blueberry extracts detected at 520 nm. The top row in (B) shows non UV-B treated S5 extracts before acid hydrolysis (left; anthocyanins) and after acid hydrolysis (right; anthocyanidins). The middle and bottom rows show hydrolyzed extracts from S1 and S5 fruit, respectively, without postharvest UV-B treatment. (left) or following UV-B irradiation at 3 W·m−2 for 72 h (right). Peak identification: 1, delphinidin; 2, cyanidin; 3, petunidin; 4, peonidin; and 5, malvidin. Red and purple chromatogram colors indicate hydrolyzed extracts and UV-B-irradiated extracts, respectively.
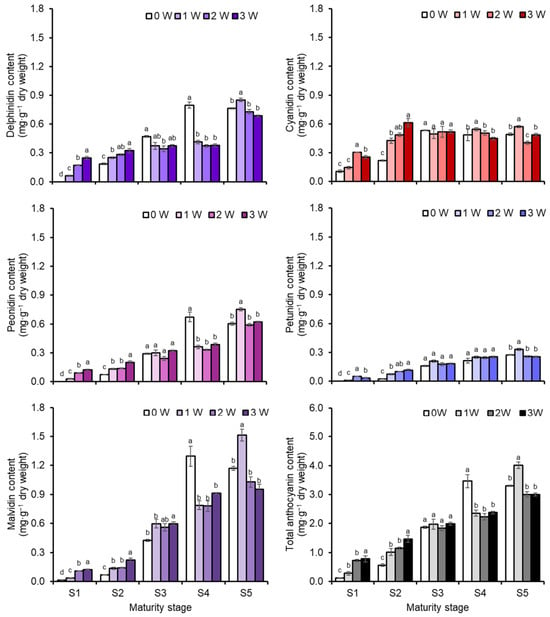
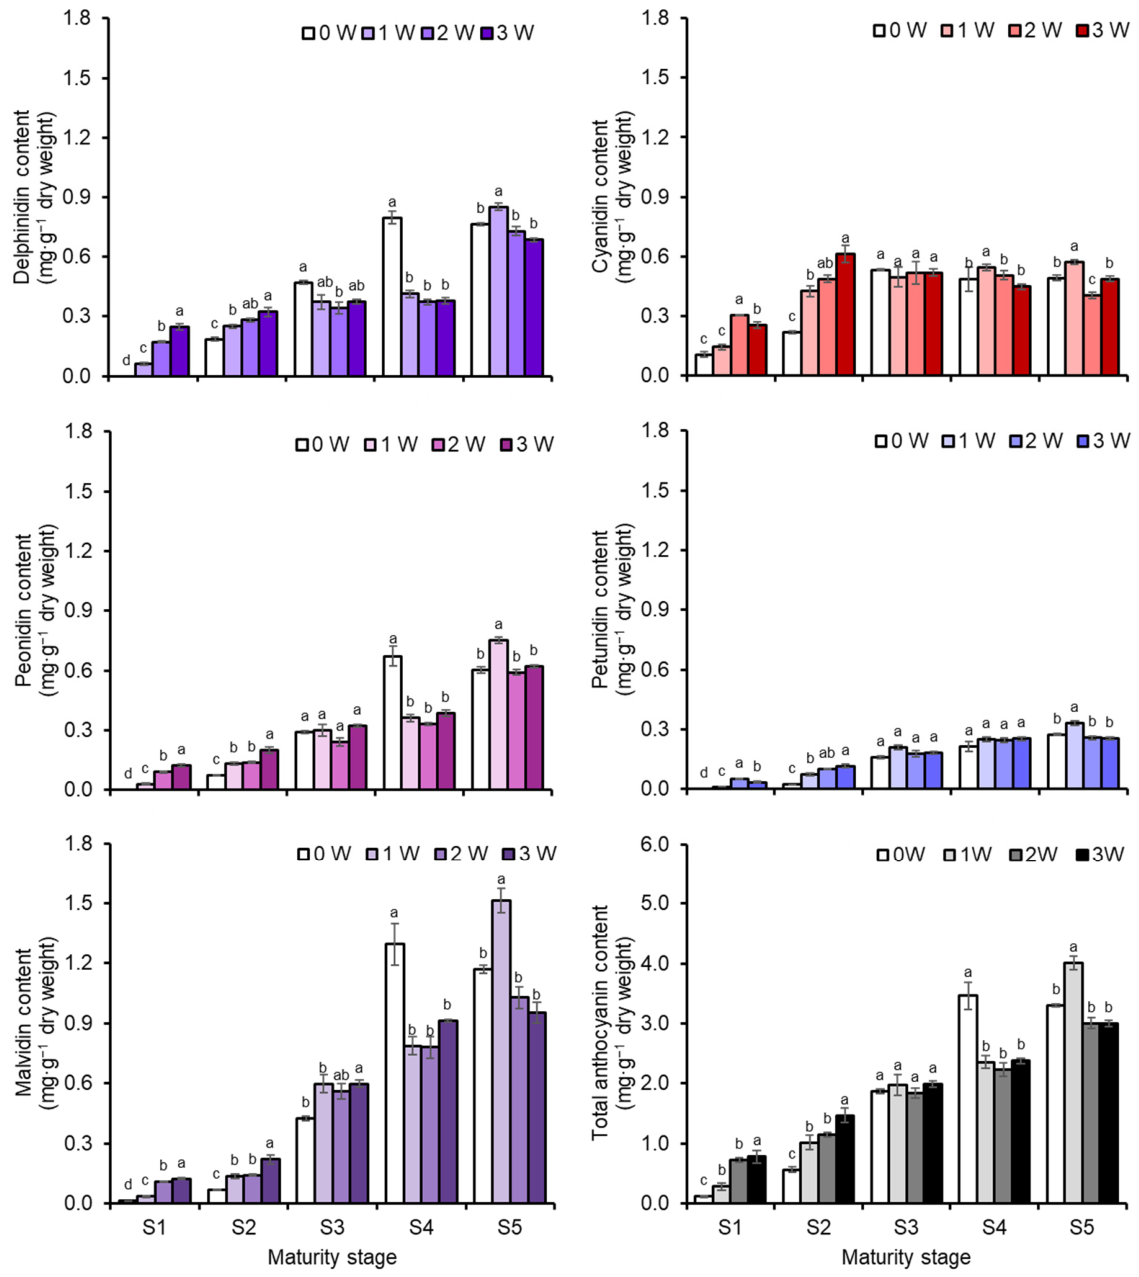
The effects of postharvest UV-B irradiation were evaluated by comparing irradiated fruit with non-irradiated controls at the same sampling time (Figure 3 and Table S1). At 72 h, UV-B treatment increased anthocyanidin accumulation in immature S1 and S2 fruits, whereas the responses in S3–S5 differed among individual anthocyanidins and UV-B irradiation conditions.
Figure 3.
Individual and total anthocyanidin contents of blueberry fruit at different maturity stages following postharvest UV-B treatment for 72 h. Values are presented as the mean ± SE (n = 3). Different lowercase letters indicate significant differences among UV-B intensities within the same maturity stage according to Tukey’s studentized test (p < 0.05). Legend labels 0W, 1W, 2W, and 3W denote UV-B irradiances of 0 (non-irradiated control), 1, 2, and 3 W·m−2, respectively. Peonidin and malvidin contents were estimated as cyanidin equivalents.
Postharvest UV-B treatment promoted anthocyanidin accumulation in immature S1 and S2 fruits. In S1, anthocyanidins, which were undetectable or present at very low levels before UV-B exposure, accumulated over time after exposure (Figure 3, Table S1). Three anthocyanidins (delphinidin, peonidin, and malvidin) accumulated continuously as UV-B intensity increased. Conversely, cyanidin and petunidin increased up to 2 W·m−2 but decreased at 3 W·m−2. In S2, increases in anthocyanidin contents following UV-B treatment were more pronounced. All five anthocyanidins increased with UV-B intensity, peaking at 3 W·m−2 after 72 h. In S3, delphinidin, cyanidin, petunidin, and peonidin decreased or remained comparable to the control after UV-B treatment, whereas malvidin levels were relatively higher in UV-B-treated fruit. In S4, delphinidin, peonidin, and malvidin were lower in UV-B-treated fruit than in the control, whereas cyanidin and petunidin remained comparable to or slightly higher than those in the control. In fully ripe S5, all five anthocyanidins were higher at 1 W·m−2 than in the control, whereas such increases were not observed at 2 or 3 W·m−2. Overall, anthocyanidin accumulation in response to postharvest UV-B treatment varied with fruit maturity, and after the onset of coloration, responses differed among individual anthocyanidins and UV-B intensities.
3.4. CGA
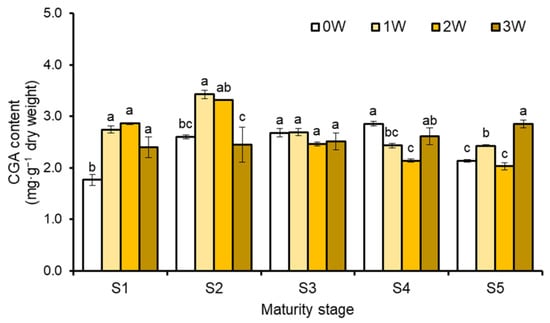
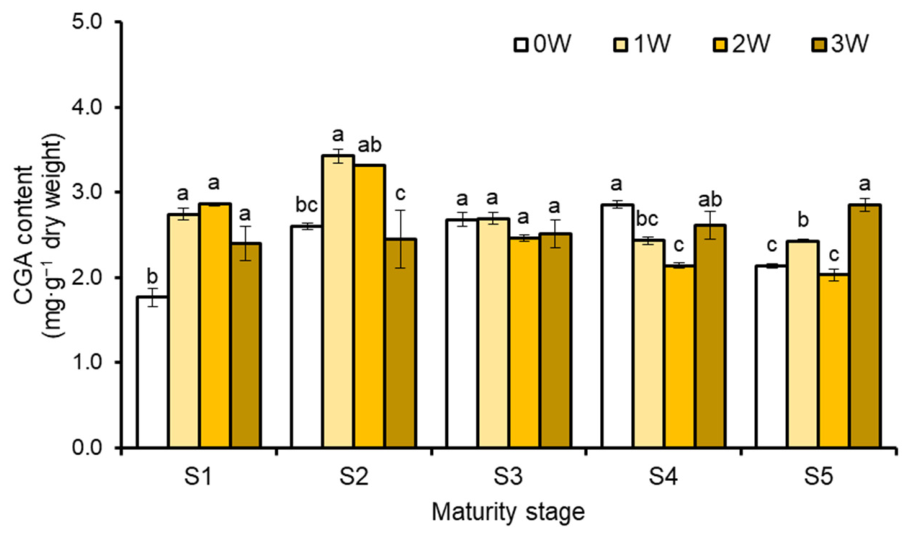
Figure 4 shows the CGA content of blueberry fruit at different maturity stages following postharvest UV-B treatment. Without UV-B treatment, CGA content tended to increase as the fruit matured, peaking at S4. In particular, the content increased approximately 1.5-fold between S1 and S2, representing the largest increase observed across the maturity stages. While the content continued to rise at S3 and S4, it decreased by approximately 25% at S5 compared to S4. In the UV-B treatment, changes in CGA content also varied depending on the fruit’s maturity and UV-B intensity. At the immature stages (S1 and S2), the content tended to increase with rising UV-B intensity but decreased beyond a certain intensity level. At S1, the content increased progressively with 1 and 2 W·m−2 treatments, peaking at the 2 W·m−2. Although the content decreased with the 3 W·m−2 treatment compared to the 2 W·m−2 treatment, this reduction was not statistically significant. A similar increasing trend up to the 2 W·m−2 treatment was observed in the S2. However, the content in the 3 W·m−2 treatment resulted in a sharp decline, showing to a level lower than that of the untreated control. In contrast, in S3, changes in CGA content in response to UV-B treatment were relatively limited. Across all treatment groups, CGA content remained within a similar range of 2.46–2.69 mg·g−1 d.w. and no statistically significant differences were observed based on UV-B intensity. Unlike the immature stage, at S4, the content showed a general decreasing trend in response to UV-B treatment. The extent of this reduction varied depending on the UV-B intensity, with all UV-B treated groups exhibiting relatively lower CGA levels compared to the untreated control. Conversely, S5 showed the opposite tendency to S4. CGA content increased generally increased with UV-B treatment and, was highest with in the 3 W·m−2 treatment group showing the highest levels.
Figure 4.
The phenolic compounds in blueberry fruit at different maturity stages after UV-B treatment (0, 1, 2, and 3 W·m−2) for 72 h. Values are presented as the mean ± SE (n = 3). Different lowercase letters indicate significant differences among UV-B intensities within the same maturity stage according to Tukey’s studentized test (p < 0.05). Legend labels 0W, 1W, 2W, and 3W denote UV-B irradiances of 0 (non-irradiated control), 1, 2, and 3 W·m−2, respectively.
3.5. Antioxidant Activity and TPC
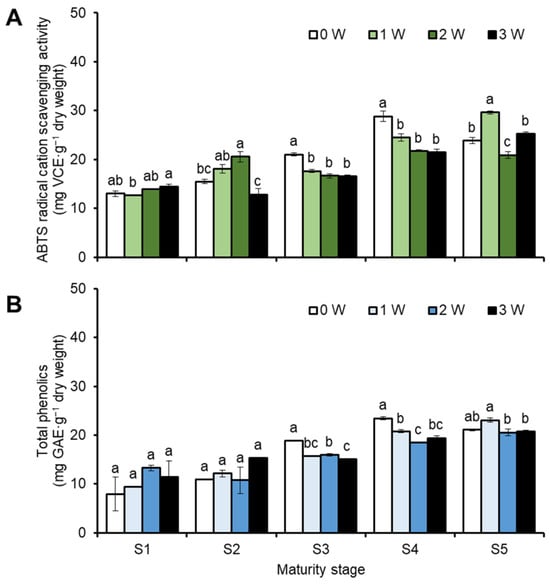
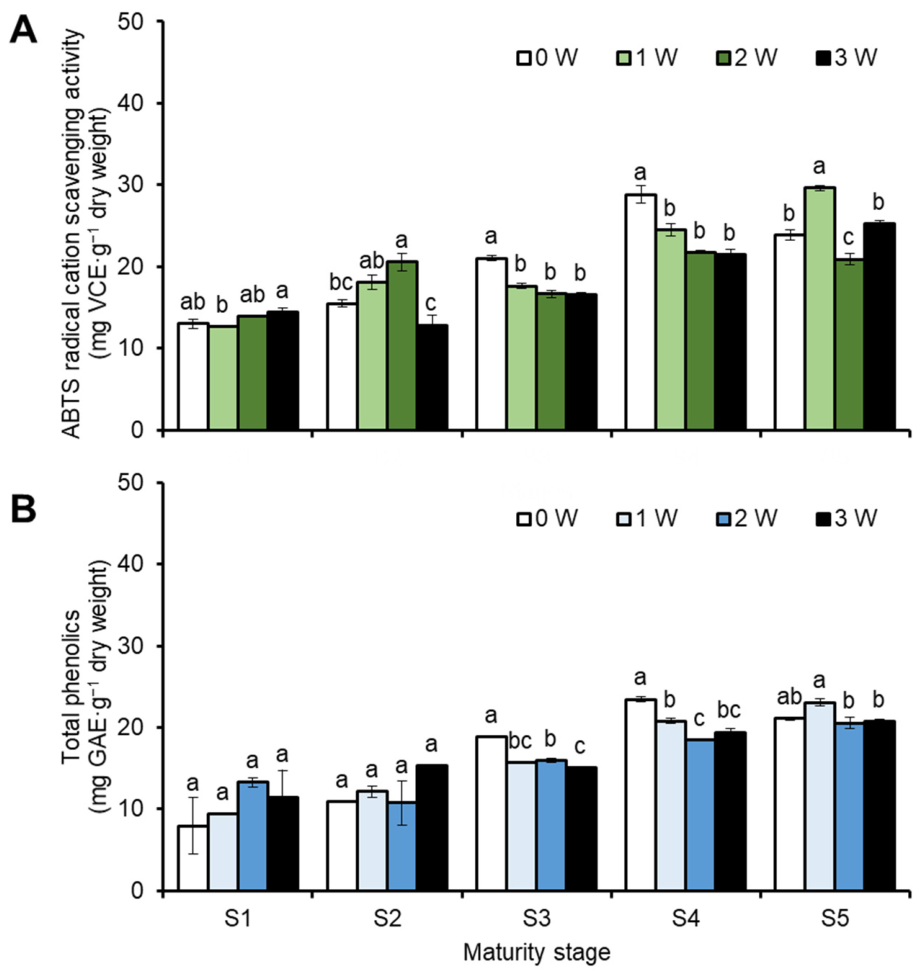
Figure 5 shows the ABTS radical scavenging activity and TPC of blueberry fruit at different maturity stages following postharvest UV-B treatment. In the non-irradiated control, ABTS radical scavenging activity generally increased as maturity advanced, from the lowest level at S1 to the highest at S4 (Figure 5A). The response to UV-B treatment varied with on the fruit maturity and UV-B intensity. In S1, the activity tended to increase at 2 and 3 W·m−2 compared with the control, although these differences were not statistically significant. However, the activity at 3 W·m−2 was significantly higher than that at 1 W·m−2. In S2, activity was highest at 2 W·m−2 and significantly lower at 3 W·m−2. In S3 and S4, all UV-B treatments resulted in lower activity than the control, with a decreasing trend as intensity increased. Conversely, S5 fruit exhibited the highest activity at 1 W·m−2, followed by a decline at higher intensities.
Figure 5.
(A) ABTS radical scavenging activity and (B) total phenolic content of blueberry fruit at different maturity stages following postharvest UV-B treatment for 72 h. ABTS radical scavenging activity and TPC are expressed as mg vitamin C equivalents (VCE)·g−1 dry weight and mg gallic acid equivalents (GAE)·g−1 dry weight, respectively. Values are presented as the mean ± SE (n = 3). Different lowercase letters indicate significant differences among UV-B intensities within the same maturity stage according to Tukey’s studentized test (p < 0.05). Legend labels 0W, 1W, 2W, and 3W denote UV-B irradiances of 0 (non-irradiated control), 1, 2, and 3 W·m−2, respectively.
TPC in the non-irradiated controls also generally increased as maturity progressed, ranging from 7.96 to 23.44 mg GAE·g−1 d.w. (Figure 5B). TPC did not differ significantly among UV-B treatments in S1 and S2. In S3, TPC was approximately 20% lower in all UV-B-treated groups than in the non-irradiated control. In S4, TPC was also significantly lower in all UV-B-treated samples than in the control. In S5, TPC was highest at 1 W·m−2 reaching 23.07 GAE·g−1 d.w., compared with 21.11 GAE·g−1 d.w. in the control, representing a 9.3% increase that was not statistically significant. Similarly, TPC at 2 and 3 W·m−2 did not differ significantly from the control. Overall, the effects of postharvest UV-B treatment on ABTS radical scavenging activity and TPC varied with fruit maturity rather than following a consistent intensity-dependent pattern.
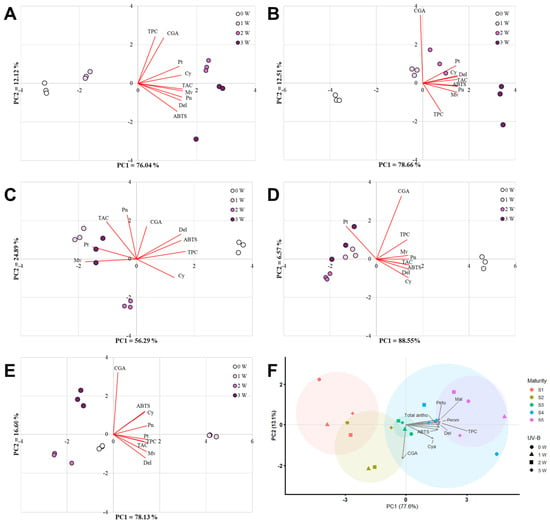
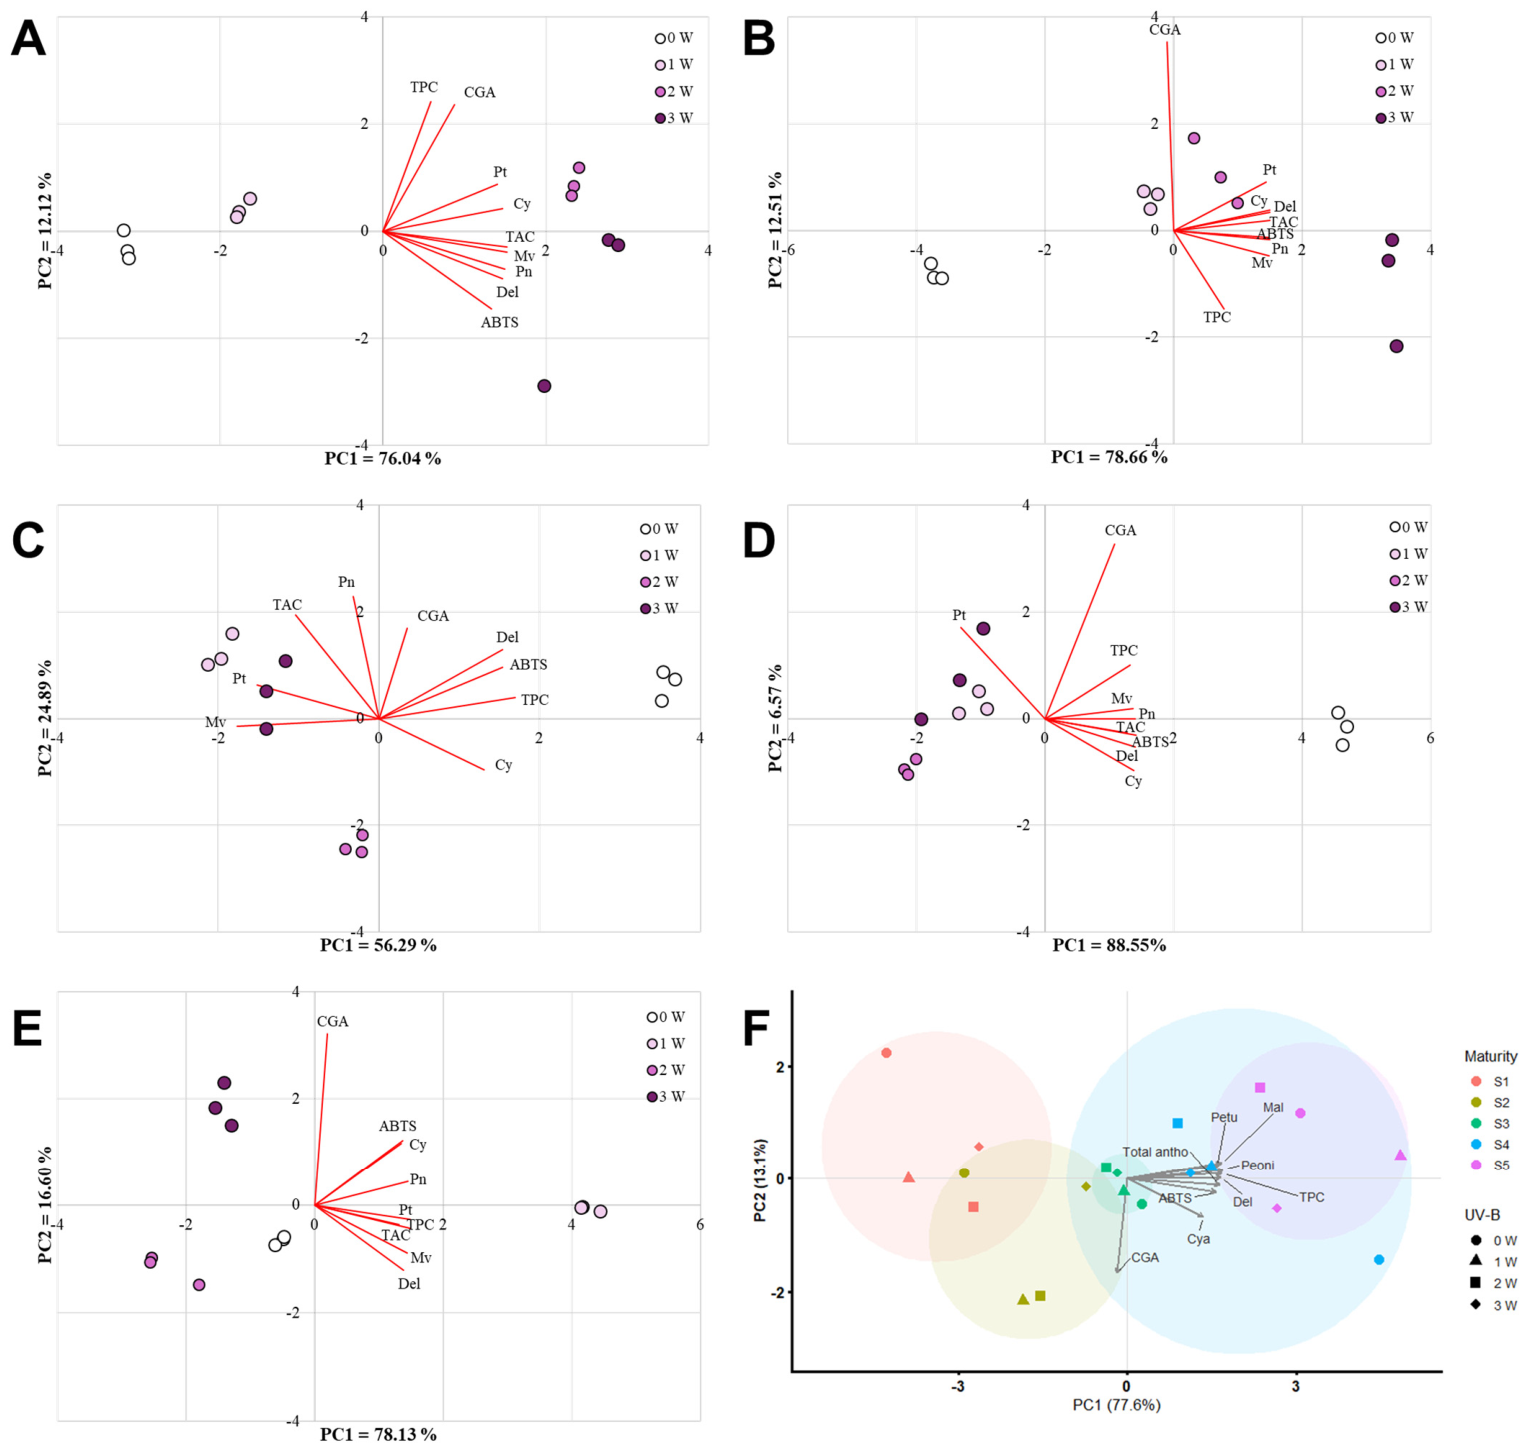
Principal component analysis (PCA) was performed separately for each maturity stage to explore variation in phenolic composition and ABTS radical scavenging activity across UV-B treatments (Figure 6A–E). Each analysis included 12 biological samples, comprising three independent replicates at each of four UV-B irradiances. The first two principal components explained 77.04%, 78.66%, 56.29%, 88.55%, and 78.13% of the total variance at S1–S5, respectively. At S1 and S2, irradiated samples were separated from the non-irradiated controls along PC1. At S3 and S4, the non-irradiated controls were located on the positive side of PC1, whereas irradiated samples were predominantly located on the negative side. At S5, samples treated at 1 W·m−2 were positioned in the direction of the ABTS and cyanidin loading vectors, whereas samples treated at 3 W·m−2 were positioned toward the CGA vector. These patterns illustrate maturity-dependent differences in the responses of the measured variables to UV-B treatment.
Figure 6.
Principal component analysis (PCA) of each component and ABTS radical scavenging activity in blueberry fruit following postharvest UV-B treatment. Separate PCA biplots for S1 (A), S2 (B), S3 (C), S4 (D), and S5 (E), each including 12 biological samples comprising three independent replicates at each UV-B intensity (0, 1, 2, and 3 W·m−2). (F) PCA biplot illustrating the distribution of blueberry samples according to maturity stage and UV-B intensity and the contributions of the measured variables. Del, delphinidin; Cy, cyanidin; Pn, peonidin; Pt, petunidin; Mv, malvidin; TAC, total anthocyanidin content; CGA, chlorogenic acid; TPC, total phenolic content; 0W, 0 W·m−2; 1W, 1 W·m−2; 2W, 2 W·m−2; 3W, 3 W·m−2.
The PCA incorporating all five maturity stages explained 90.7% of the total variance through PC1 (77.6%) and PC2 (13.1%) (Figure 6F). S1 and S2 samples were generally positioned on the negative side of PC1, whereas S4 and S5 samples were predominantly positioned on the positive side, with S3 samples located closer to the origin. These results describe differences in the overall phenolic and antioxidant profiles among maturity stages. The PCA patterns were interpreted as exploratory and were not used to infer statistically significant relationships between individual compounds and ABTS activity.
4. Discussion
Postharvest light treatment has been reported to affect coloration and the accumulation of bioactive compounds by regulating secondary metabolism in diverse fruits [21,22,23]. In particular, UV-B irradiation induces anthocyanin biosynthesis in blueberries, although its effects vary with fruit maturity stage and irradiation conditions [24,25]. Our present results showed that the responses of blueberries to postharvest UV-B treatment depended on both fruit maturity and UV-B intensity. Previous studies have shown that UV-B-induced accumulation of phenolics involves signaling through the UV-B photoreceptor UV RESISTANCE LOCUS 8 (UVR8), COP1, and the transcription factor ELONGATED HYPOCOTYL 5 (HY5) [14,25]. The signaling pathway regulates downstream transcription factors and genes involved in phenylpropanoid biosynthesis [14,25]. In blueberry fruit, Li et al. [14] demonstrated that UV-B increased the expression of F3’5’H, CHS, ANS and UFGT at both green and mature stages, whereas expression of DFR and F3’H increased specifically at the mature stage. These genes encode chalcone synthase, anthocyanin synthase, and anthocyanin glycosylation, respectively. These stage-dependent transcriptional responses provide a mechanistic basis for interpreting the different anthocyanidin responses observed in this study. However, gene expression and enzyme activities were not measured in the present study. Therefore, activation of genes related to this pathway under our postharvest treatment conditions remains to be verified. Although the underlying molecular mechanisms were not elucidated in this study, these results suggest that the divergent responses observed may reflect differences in anthocyanin biosynthesis among maturity stages.
Anthocyanidin contents also changed during dark storage without UV-B irradiation, demonstrating that postharvest changes occurred independently of UV-B exposure (Table S1). They increased in immature fruit (S1 and S2) and S4 but decreased in S5, whereas changes in S3 were relatively small. To distinguish UV-B responses from these time-dependent changes, anthocyanidin contents at the end of the 72-h treatment period were compared between irradiated fruit and non-irradiated controls held for the same duration.
Immature S1 and S2 fruit, which were initially green or greenish pink, developed visible coloration following postharvest UV-B treatment, and their TAC increased to levels comparable to those of S3 fruit (Figure 1 and Figure 3). A key finding was the difference in anthocyanidin accumulation between the two immature stages. Although both stages showed developed coloration and anthocyanidin accumulation following postharvest UV-B treatment, their initial anthocyanidin profiles differed. In S1 fruit, only cyanidin was detected before treatment, whereas the other anthocyanidins accumulated following UV-B exposure. In the S2 fruit, all five anthocyanidins were detected by 48 h even without UV-B irradiation, and their contents at 72 h were higher in the UV-B-treated fruit than in the non-irradiated control. According to previous studies [24,26,27], anthocyanin accumulation during maturation is accompanied by physiological changes in flavonoid biosynthetic gene expression. These developmental differences may underlie the different initial metabolic states observed in S1 and S2. UV-B treatment promoted anthocyanidin accumulation in S1, and accumulation was initially limited, while further enhanced the accumulation process already underway in S2. These findings suggest that immature blueberries retain the capacity to accumulate anthocyanidins in response to postharvest UV-B irradiation, even before substantial natural coloration has developed.
Unlike immature S1 and S2 fruits, S3-S5 fruits did not show a consistent anthocyanidin accumulation response to UV-B exposure (Figure 3). At S3, where coloration had already begun, UV-B treatment did not significantly change TAC, whereas individual anthocyanidins responded differently. Given that anthocyanin accumulation and coloration were already in progress in S3 fruit at harvest, UV-B-induced responses may have overlapped with ongoing ripening-related metabolic changes. At S4, where coloration was more advanced, UV-B treatment decreased in the contents of most anthocyanidins compared with the untreated control, indicating that the stimulatory effect observed in immature fruit was not sustained. However, in fully ripe S5 fruits, the response varied with UV-B intensity. All five anthocyanidins increased at 1 W·m−2, but no such increase was observed at 2 or 3 W·m−2. Thus, the response to UV-B did not simply diminish with advancing maturity but varied according to both the physiological state of the fruit and irradiation intensity. Anthocyanidin accumulation in fully ripe fruit at low, but not at higher, UV-B intensities suggests that the effective range of UV-B intensity may differ with fruit maturity.
Anthocyanins contribute to the antioxidant properties of blueberries, but changes in ABTS radical scavenging activity did not consistently parallel anthocyanidin accumulation across maturity stages (Figure 3 and Figure 5). Individual anthocyanidins differ in their radical scavenging activities. Koss-Mikołajczyk and Bartoszek [28] reported higher ABTS and 2,2-diphenyl-1-picrylhydrazyl (DPPH) activities for delphinidin and petunidin than for cyanidin, malvidin, and peonidin under their assay conditions. These differences highlight the importance of considering individual anthocyanidin profiles rather than TAC alone.
Other phenolic compounds, including phenolic acids, such as CGA, also contribute to the antioxidant properties [29]. In this study, CGA responses also exhibited varied with maturity stage and UV-B intensity (Figure 4). Several studies have documented differences in phenolic profiles among blueberry cultivars and harvest times. Timmers et al. [30] reported higher proportions of cyanidin glycosides in rabbiteye blueberries than in southern highbush blueberries, whereas delphinidin glycosides showed the opposite pattern. Anthocyanin contents and relative proportions also varied across harvest seasons. Yousef et al. [31] reported CGA concentrations of 58–139 mg per 100 g frozen fruit in rabbiteye cultivars, compared with 33–71 mg per 100 g in southern highbush cultivars. Kim et al. [32] reported cultivar-dependent differences in anthocyanin composition and content in highbush blueberries cultivated in Korea. These findings show that genetic background and harvest timing must be considered when comparing blueberry phenolic profiles.
TPC responses also differed among fruit maturity stages. In the non-irradiation, TPC ranged from 7.96 to 23.44 mg GAE·g−1 d.w. At S3, all UV-B treatments reduced TPC by approximately 20% relative to the non-irradiated control (0 W·m−2). At S5, TPC reached 23.07 mg GAE·g−1 d.w. at 1 W·m−2, compared with 21.11 mg GAE·g−1 d.w. in the non-irradiated control. This increase of 9.3% was not statistically significant, and none of the UV-B treatments significantly altered TPC at this stage. A recent study about wild blueberry populations reported a mean TPC of 5.86 ± 1.25 mg GAE·g−1 fresh weight [33], whereas S5 values in the present study ranged from 20.55 to 23.07 mg GAE·g−1 d.w. These values cannot be compared directly because of the different weight bases and the absence of water content data for conversion. Differences in fruit and growing condition, and extraction procedures further limit cross-study comparisons. Thus, these TPC responses indicate that UV-B effects on TPC differed among maturity stages, highlighting the need to examine individual phenolic compounds alongside antioxidant activity.
In the present study, the relationships among CGA, anthocyanidins, and ABTS activity differed with maturity and UV-B intensity. At S2, treatment at 3 W·m−2 increased all five anthocyanidins but decreased CGA content and ABTS activity. Although TPC did not differ significantly among UV-B treatments at S2, CGA content decreased while anthocyanidin content increased at 3 W·m−2. The CGA decline may have contributed to the reduced ABTS activity, but this contribution was not quantified. These results do not establish CGA loss as the sole cause of the decrease in ABTS activity. Therefore, differences in the activities of individual anthocyanidins alone cannot explain this response. At S5, treatment at 1 W·m−2 increased all five anthocyanidins and produced the highest ABTS activity. In contrast, CGA content increased from 2.13 mg·g−1 d.w. in the non-irradiated control to 2.85 mg·g−1 d.w. at 3 W·m−2, corresponding to a 33.8% increase, whereas ABTS activity was lower than at 1 W·m−2 (Figure 3, Figure 4 and Figure 5). Therefore, neither anthocyanidin nor CGA content alone explained the antioxidant responses across treatments. Previous studies provide further evidence that anthocyanin accumulation does not necessarily coincide with higher antioxidant activity. Giovanelli and Buratti [34] found that antioxidant activity was more closely related to total phenolic content than to anthocyanin content in wild and cultivated blueberries. Castrejón et al. [35] reported that anthocyanins increased during ripening in four highbush cultivars, whereas hydroxycinnamic acids, flavonols, and antioxidant activity generally decreased. These findings support the interpretation of the present ABTS results in terms of changes in multiple phenolic constituents.
Changes in phenolic contents reflect not only biosynthesis but also enzymatic oxidation, including reactions catalyzed by polyphenol oxidase (PPO). Müller et al. [36] reported that ultraviolet-C (UV-C) treatment reduced PPO activity in apple and grape juices, whereas UV-B had no detectable effect at the doses tested. These findings do not explain the PPO response in intact blueberry fruit under the present treatment conditions. Given that PPO activity was not measured in this study, its contribution to the observed phenolic changes remains unclear. Overall, the differing responses of anthocyanidins, CGA, TPC, and ABTS activity indicate that antioxidant responses cannot be explained by changes in a single measured component. Furthermore, PCA showed differences in the overall profiles of the measured variables among maturity stages (Figure 6F). Collectively, these results show that phenolic composition and antioxidant responses to postharvest UV-B treatment varied with fruit maturity and irradiation intensity. Additionally, antioxidant activity was evaluated using the ABTS radical scavenging assay alone. Complementary assays, such as the ferric reducing antioxidant power (FRAP) or oxygen radical absorbance capacity (ORAC) assay, are needed to assess whether the observed responses extend to other measures of antioxidant capacity.
In conclusion, the maturity-dependent responses observed in this study have practical implications for applying postharvest UV-B treatment to blueberry fruit of heterogeneous maturity. Because blueberries ripen asynchronously, fruit at different maturity stages may be harvested together, particularly during mechanical harvesting. These results suggest that postharvest UV-B treatment may be particularly useful for promoting coloration and anthocyanidin accumulation in immature fruit rather than being applied uniformly to fruits at all maturity stages. Thus, postharvest UV-B treatment has potential as a strategy to reduce the quality heterogeneity associated with the presence of immature fruit at harvest. However, practical application will require further optimization of UV-B intensity and treatment duration according to fruit maturity, together with evaluation of effects on storability and other quality attributes.
5. Conclusions
This study showed that the response of postharvest blueberry fruit to UV-B treatment depended on fruit maturity and UV-B intensity. In immature fruit (S1 and S2), postharvest UV-B treatment significantly promoted skin coloration and anthocyanidin accumulation. Conversely, at later maturity stages (S3–S5), the response was limited or different from that of immature fruit. UV-B treatment left TAC relatively unchanged at S3 and decreased it at S4, whereas fully ripe S5 fruit exhibited enhanced anthocyanidin accumulation only at a relatively low intensity (1 W·m−2). The effects of UV-B on antioxidant properties also depended on fruit maturity stage and irradiation intensity. Changes in ABTS radical scavenging activity and TPC did not consistently parallel anthocyanin accumulation. CGA, a major phenolic acid in blueberry fruit also showed distinct maturity- and intensity-dependent responses to UV-B treatment. The contrasting responses of anthocyanidins, CGA, TPC, and ABTS radical scavenging activity suggest that the antioxidant response of blueberry fruit to postharvest UV-B treatment cannot be attributed to changes in a single group of phenolic compounds. This response may reflect changes in the overall composition and relative abundance of multiple antioxidant constituents. Overall, these findings highlight fruit maturity as key factor affecting the efficacy of postharvest UV-B treatment, and demonstrate that the effects were particularly pronounced in immature blueberries. Further research is required to determine suitable UV-B intensities and treatment durations for each maturity stage and to evaluate their effects on postharvest quality and storability.
Supplementary Materials
The following supporting information can be downloaded at https://www.mdpi.com/article/10.3390/antiox15111512/s1: Table S1: Time-course changes in individual anthocyanidin contents (mg·g−1 dry weight) of blueberry fruit at different maturity stages during postharvest UV-B treatment. Figure S1: HPLC chromatograms and calibration data for anthocyanidin standards. Figure S2: Overlaid HPLC chromatograms of non-UV-B-treated blueberry fruit extracts at five maturity stages (S1–S5) before acid hydrolysis (upper panel; anthocyanins) and after acid hydrolysis (lower panel; anthocyanidins). Figure S3: Representative HPLC chromatogram and calibration curve of chlorogenic acid (CGA).
Author Contributions
Conceptualization, J.H.K. and S.H.E.; methodology, J.H.K. and J.L.; software, J.H.K.; validation, J.H.K. and S.H.E.; formal analysis, J.H.K.; investigation, J.H.K.; resources, S.H.E.; data curation, J.H.K.; writing—original draft preparation, J.H.K., J.L., J.C. and M.K.; writing—review and editing, S.H.E.; visualization, J.H.K.; supervision, S.H.E.; funding acquisition, S.H.E. All authors have read and agreed to the published version of the manuscript.
Funding
This research was funded by National Research Foundation of Korea (NRF), grant number NRF-2022R1A2C100769515.
Institutional Review Board Statement
Not applicable.
Informed Consent Statement
Not applicable.
Data Availability Statement
Data are contained within the article.
Acknowledgments
During the preparation of this manuscript/study, the authors used ChatGPT (GPT-5.6 Sol; OpenAI, San Francisco, CA, USA) for checking grammatical and logical errors. The authors have reviewed and edited the output and take full responsibility for the content of this publication.
Conflicts of Interest
The authors declare no conflicts of interest.
Abbreviations
The following abbreviations are used in this manuscript:
| TSS | Total soluble solids |
| TA | Titratable acidity |
| TPC | Total phenolic content |
| Del | Delphinidin |
| Cy | Cyanidin |
| Pn | Peonidin |
| Pt | Petunidin |
| Mv | Malvidin |
| TAC | Total anthocyanidin content |
| CGA | Chlorogenic acid |
References
- Brondino, L.; Borra, D.; Giuggioli, N.R.; Massaglia, S. Mechanized blueberry harvesting: Preliminary results in the Italian context. Agriculture 2021, 11, 1197. [Google Scholar] [CrossRef] [Scilit]
- Wu, Y.; Han, T.; Yang, H.; Lyu, L.; Li, W.; Wu, W. Known and potential health benefits and mechanisms of blueberry anthocyanins: A review. Food Biosci. 2023, 55, 103050. [Google Scholar] [CrossRef] [Scilit]
- Lin, Y.; Huang, G.; Zhang, Q.; Wang, Y.; Dia, V.P.; Meng, X. Ripening affects the physicochemical properties, phytochemicals and antioxidant capacities of two blueberry cultivars. Postharvest Biol. Technol. 2020, 162, 111097. [Google Scholar] [CrossRef] [Scilit]
- Su, X.; Zhang, J.; Wang, H.; Xu, J.; He, J.; Liu, L.; Zhang, T.; Chen, R.; Kang, J. Phenolic acid profiling, antioxidant, and anti-inflammatory activities, and miRNA regulation in the polyphenols of 16 blueberry samples from China. Molecules 2017, 22, 312. [Google Scholar] [CrossRef] [Scilit]
- Takeda, F.; Yang, W.Q.; Li, C.; Freivalds, A.; Sung, K.; Xu, R.; Hu, B.; Williamson, J.; Sargent, S. Applying new technologies to transform blueberry harvesting. Agronomy 2017, 7, 33. [Google Scholar] [CrossRef] [Scilit]
- Moggia, C.; Peñaloza, O.; Torres, J.; Romero-Bravo, S.; Sepulveda, D.; Jara, R.; Vivanco, S.; Valdés, M.; Zúñiga, M.; Beaudry, R.M.; et al. Within-plant variability in blueberry (Vaccinium corymbosum L.) II: Is a shorter harvest interval always the ideal strategy to maximize fruit firmness? Postharvest Biol. Technol. 2022, 186, 111815. [Google Scholar] [CrossRef] [Scilit]
- Gibson, L.; Rupasinghe, H.V.; Forney, C.F.; Eaton, L. Characterization of changes in polyphenols, antioxidant capacity and physico-chemical parameters during lowbush blueberry fruit ripening. Antioxidants 2013, 2, 216–229. [Google Scholar] [CrossRef] [Scilit]
- Moggia, C.; Graell, J.; Lara, I.; González, G.; Lobos, G.A. Firmness at harvest impacts postharvest fruit softening and internal browning development in mechanically damaged and non-damaged highbush blueberries (Vaccinium corymbosum L.). Front. Plant Sci. 2017, 8, 535. [Google Scholar] [CrossRef] [Scilit]
- Kavipriya, S.; Beaulah, A.; Sundharaiya, K.; Anitha, T.; Sivakumar, K.P. The role of LED lighting in enhancing post-harvest fruit and vegetable quality. Plant Sci. Today 2025, 12, 1–13. [Google Scholar] [CrossRef] [Scilit]
- Duan, S.; Kim, C.K.; Kim, J.H.; Eom, S.H. Metabolic factors regulating the inhibition of anthocyanin biosynthesis in ‘Shinano gold’ apple. Postharvest Biol. Technol. 2025, 230, 113731. [Google Scholar] [CrossRef] [Scilit]
- Zhao, Y.; Dong, W.; Wang, K.; Zhang, B.; Allan, A.C.; Lin-Wang, K.; Chen, K.; Xu, C. Differential sensitivity of fruit pigmentation to ultraviolet light between two peach cultivars. Front. Plant Sci. 2017, 8, 1552. [Google Scholar] [CrossRef] [Scilit]
- Wang, F.; Wang, J.; Ji, G.; Kang, X.; Li, Y.; Hu, J.; Quian, C.; Wang, S. Regulation of anthocyanins and quality in strawberries based on light quality. Horticulturae 2025, 11, 377. [Google Scholar] [CrossRef] [Scilit]
- Takshak, S.; Agrawal, S.B. Defense potential of secondary metabolites in medicinal plants under UV-B stress. J. Photochem. Photobiol. B Biol. 2019, 193, 51–88. [Google Scholar] [CrossRef] [Scilit]
- Li, T.; Yamane, H.; Tao, R. Preharvest long-term exposure to UV-B radiation promotes fruit ripening and modifies stage-specific anthocyanin metabolism in highbush blueberry. Hortic. Res. 2021, 8, 67. [Google Scholar] [CrossRef] [Scilit]
- Yang, J.; Shi, W.; Li, B.; Bai, Y.; Hou, Z. Preharvest and postharvest UV radiation affected flavonoid metabolism and antioxidant capacity differently in developing blueberries (Vaccinium corymbosum L.). Food Chem. 2019, 301, 125248. [Google Scholar] [CrossRef] [Scilit]
- Adetoro, A.O.; Opara, U.L.; Fawole, O.A. Effect of carrier agents on the physicochemical and technofunctional properties and antioxidant capacity of freeze-dried pomegranate juice (Punica granatum) powder. Foods 2020, 9, 1388. [Google Scholar] [CrossRef] [Scilit]
- Lim, Y.J.; Eom, S.H. The different contributors to antioxidant activity in thermally dried flesh and peel of astringent persimmon fruit. Antioxidants 2022, 11, 597. [Google Scholar] [CrossRef] [Scilit]
- Chung, S.W.; Yu, D.J.; Lee, H.J. Changes in anthocyanidin and anthocyanin pigments in highbush blueberry (Vaccinium corymbosum cv. Bluecrop) fruits during ripening. Hortic. Environ. Biotechnol. 2016, 57, 424–430. [Google Scholar] [CrossRef] [Scilit]
- Wang, T.; Xu, W.J.; Wang, S.X.; Kou, P.; Wang, P.; Wang, X.Q.; Fu, Y.J. Integrated and sustainable separation of chlorogenic acid from blueberry leaves by deep eutectic solvents coupled with aqueous two-phase system. Food Bioprod. Process. 2017, 105, 205–214. [Google Scholar] [CrossRef] [Scilit]
- Kim, J.H.; Lim, Y.J.; Kim, J.H.; Eom, S.H. Impact of dry processing on secondary metabolites in the petals of marigold (Tagetes spp.) cultivar. Horticulturae 2024, 10, 382. [Google Scholar] [CrossRef] [Scilit]
- Nassarawa, S.S.; Abdelshafy, A.M.; Xu, Y.; Li, L.; Luo, Z. Effect of light-emitting diodes (LEDs) on the quality of fruits and vegetables during postharvest period: A review. Food Bioprocess Technol. 2021, 14, 388–414. [Google Scholar] [CrossRef] [Scilit]
- Anchana, K.; Saraswathy, S.; Rajamanickam, C.; Venkatesan, K.; Elayarajan, M.; Anitha, T. Anthocyanin accumulation in fruit crops: A multi-layered regulatory network integrating molecular, epigenetic, hormonal and environmental regulation. Mol. Biol. Rep. 2026, 53, 1204. [Google Scholar] [CrossRef] [Scilit]
- Ryu, J.A.; Duan, S.; Jeong, H.Y.; Lee, C.; Kang, I.K.; Eom, S.H. Pigmentation and flavonoid metabolite diversity in immature ‘Fuji’ apple fruits in response to lights and methyl jasmonate. Int. J. Mol. Sci. 2022, 23, 1722. [Google Scholar] [CrossRef] [Scilit]
- Chung, S.W.; Yu, D.J.; Oh, H.D.; Ahn, J.H.; Huh, J.H.; Lee, H.J. Transcriptional regulation of abscisic acid biosynthesis and signal transduction, and anthocyanin biosynthesis in ‘Bluecrop’ highbush blueberry fruit during ripening. PLoS ONE 2017, 14, e0220015. [Google Scholar] [CrossRef] [Scilit]
- Yang, J.; Li, B.; Shi, W.; Gong, Z.; Chen, L.; Hou, Z. Transcriptional activation of anthocyanin biosynthesis in developing fruit of blueberries (Vaccinium corymbosum L.) by preharvest and postharvest UV irradiation. J. Agric. Food Chem. 2018, 66, 10931–10942. [Google Scholar] [CrossRef] [Scilit]
- Espley, R.V.; Jaakola, L. The role of environmental stress in fruit pigmentation. Plant Cell Environ. 2023, 46, 3663–3679. [Google Scholar] [CrossRef] [Scilit]
- Zapien-Macias, J.M.; Liu, T.; Nunez, G.H. Blueberry ripening mechanism: A systematic review of physiological and molecular evidence. Hortic. Res. 2025, 12, uhaf126. [Google Scholar] [CrossRef] [Scilit]
- Zhu, Y.; Wang, S.; Gao, G.; Zhou, J.; Wang, Q.; Li, J.; Sun, H. Analysis of phenolic acid composition and antioxidant activity contribution during blueberry development. J. Food Meas. Charact. 2026, 20, 20484–20497. [Google Scholar] [CrossRef] [Scilit]
- Koss-Mikołajczyk, I.; Bartoszek, A. Relationship between chemical structure and biological activity evaluated in vitro for six anthocyanidins most commonly occurring in edible plants. Molecules 2023, 28, 6156. [Google Scholar] [CrossRef] [Scilit]
- Timmers, M.A.; Grace, M.H.; Yousef, G.G.; Lila, M.A. Inter-and intra-seasonal changes in anthocyanin accumulation and global metabolite profiling of six blueberry genotypes. J. Food Compos. Anal. 2017, 59, 105–110. [Google Scholar] [CrossRef] [Scilit]
- Yousef, G.G.; Brown, A.F.; Funakoshi, Y.; Mbeunkui, F.; Grace, M.H.; Ballington, J.R.; Loraine, A.; Lila, M.A. Efficient quantification of the health-relevant anthocyanin and phenolic acid profiles in commercial cultivars and breeding selections of blueberries (Vaccinium spp.). J. Agric. Food Chem. 2013, 61, 4806–4815. [Google Scholar] [CrossRef] [Scilit]
- Kim, J.H.; Kwon, R.H.; Kim, S.A.; Na, H.; Cho, J.Y.; Kim, H.W. Characterization of anthocyanins including acetylated glycosides from highbush blueberry (Vaccinium corymbosum L.) cultivated in Korea based on UPLC-DAD-QToF/MS and UPLC-Qtrap-MS/MS. Foods 2025, 14, 188. [Google Scholar] [CrossRef] [Scilit]
- Yaylacı Karahalil, F. Bioactive composition and In Vitro antioxidant properties of wild blackberry (Rubus spp.) and blueberry (Vaccinium spp.) populations. Molecules 2026, 31, 3811. [Google Scholar] [CrossRef] [Scilit]
- Giovanelli, G.; Buratti, S. Comparison of polyphenolic composition and antioxidant activity of wild Italian blueberries and some cultivated varieties. Food Chem. 2009, 114, 903. [Google Scholar] [CrossRef] [Scilit]
- Castrejón, A.D.R.; Eichholz, I.; Rohn, S.; Kroh, L.W.; Huyskens-Keil, S. Phenolic profile and antioxidant activity of highbush blueberry (Vaccinium corymbosum L.) during fruit maturation and ripening. Food Chem. 2008, 109, 564–572. [Google Scholar] [CrossRef] [Scilit]
- Müller, A.; Noack, L.; Greiner, R.; Stahl, M.R.; Posten, C. Effect of UV-C and UV-B treatment on polyphenol oxidase activity and shelf life of apple and grape juices. Innov. Food Sci. Emerg. Technol. 2014, 26, 498–504. [Google Scholar] [CrossRef] [Scilit]

Disclaimer/Publisher’s Note: The statements, opinions and data contained in all publications are solely those of the individual author(s) and contributor(s) and not of MDPI and/or the editor(s). MDPI and/or the editor(s) disclaim responsibility for any injury to people or property resulting from any ideas, methods, instructions or products referred to in the content. |
© 2026 by the authors. Licensee MDPI, Basel, Switzerland. This article is an open access article distributed under the terms and conditions of the Creative Commons Attribution (CC BY) license.