


Abstract
Atopic dermatitis (AD) is a chronic inflammatory skin disease associated with mitochondrial oxidative stress and metabolic dysregulation. This study investigated the anti-inflammatory effects of limonin and the accompanying changes in selected mitochondrial parameters and metabolic signaling. In female C57BL/6 mice with MC903-induced atopic dermatitis-like skin inflammation, limonin reduced epidermal hyperplasia, dermal thickening, and inflammatory cytokine expression and lowered the proportions of inflammatory myeloid cells in ear skin. Limonin also suppressed Th1 and Th2 responses and altered regulatory T-cell frequencies. These effects were accompanied by a lower proportion of MitoTracker+MitoSOX+ cells, a higher proportion of MitoTracker+TMRM+ cells, and increased abundance of selected respiratory chain proteins. In IL-4/IL-13-stimulated human primary keratinocytes, limonin suppressed inflammatory chemokines and epithelial cytokines while decreasing the proportion of MitoTracker+MitoSOX+ cells and increasing the proportion of MitoTracker+TMRM+ cells. Limonin reduced the proportion of 2-NBDG-positive cells and lowered GLUT1 mRNA levels. It also increased maximal mitochondrial respiration and the abundance of selected oxidative phosphorylation subunits. These changes were accompanied by increased AMPKα Thr172 phosphorylation and decreased phosphorylation of mTOR at Ser2448, RICTOR at Thr1135, AKT at Ser473, and FOXO3a at Ser253. Cellular thermal shift assays revealed changes in mTOR and AMPKα thermal stability following limonin treatment. Limonin attenuated experimental AD-like skin inflammation and reduced inflammatory responses in cytokine-stimulated human keratinocytes, with accompanying changes in selected mitochondrial parameters and AMPK-mTOR-associated phosphorylation.
1. Introduction
Atopic dermatitis (AD) is a chronic, recurrent inflammatory skin disease resulting from a combination of skin barrier dysfunction, immune dysregulation, and environmental factors. It is characterized by persistent pruritus and eczematous skin lesions [1,2,3]. In particular, type 2 immune responses, primarily driven by IL-4 and IL-13, play a pivotal role in the development and persistence of AD, leading to reduced expression of skin barrier-related proteins, inflammatory cell infiltration, and alterations in the skin microenvironment [1,2,3]. These inflammatory responses are amplified by interactions among various immune cells, including Th2 cells, eosinophils, mast cells, and macrophages. During the chronic phase of the disease, additional T-cell populations, including Th1 cells, also contribute to its pathophysiology. Given the central role of type 2 immune responses, biologic therapies such as dupilumab, which targets IL-4Rα, and tralokinumab, which selectively neutralizes IL-13, have been developed and have demonstrated significant clinical efficacy in patients with moderate-to-severe AD [1,3]. However, despite their clinical efficacy, some patients do not achieve an adequate therapeutic response or experience adverse events, such as conjunctivitis and injection-site reactions. Consequently, there remains a need for novel therapeutic strategies to complement existing cytokine-targeted treatments [1,4,5,6]. In this context, the role of keratinocytes in initiating and amplifying inflammatory responses in AD warrants particular attention. Keratinocytes not only form the physical barrier of the skin but also function as active immunoregulatory cells that modulate immune cell activation and recruitment by producing TSLP, IL-25, IL-33, and various chemokines in response to inflammatory stimuli, including IL-4 and IL-13 [1]. Therefore, expanding therapeutic strategies for AD requires not only the blockade of specific inflammatory cytokines but also a better understanding of the intracellular molecular mechanisms that regulate inflammatory responses in keratinocytes.
Recent studies have highlighted mitochondrial dysfunction and disrupted redox homeostasis as important contributors to the pathophysiology of chronic inflammatory skin diseases [7,8]. Mitochondria generate ATP through oxidative phosphorylation (OXPHOS) [9]. They are also a source of reactive oxygen species (ROS) [10], and excess mitochondrial hydrogen peroxide has been implicated in epidermal inflammation in AD [11]. Alterations in mitochondrial metabolism and oxidative stress have also been reported in keratinocytes derived from patients with AD, suggesting a potential link between mitochondrial dysfunction and cutaneous inflammation [12,13]. Mitochondrial function and cellular metabolic adaptation are closely associated with AMP-activated protein kinase (AMPK) and mechanistic target of rapamycin (mTOR) signaling. Especially, mTOR complex 2 (mTORC2), which contains RICTOR, regulates cellular survival, metabolic homeostasis, and stress responses through signaling pathways involving AKT and FOXO transcription factors [14]. However, the relationship between mitochondrial redox dysregulation and mTORC2-associated signaling in keratinocytes under type 2 inflammatory conditions remains poorly understood.
Limonin is a naturally occurring limonoid found in citrus fruits that has been reported to exhibit anti-inflammatory and antioxidant activities in various experimental models of inflammatory disease [15,16,17,18]. Previous studies have shown that limonin attenuates acute lung injury through the modulation of AMPK-related signaling and suppresses inflammatory responses in a psoriasis-like dermatitis model, accompanied by alterations in mitochondrial ROS production and AMPK-mTOR-related signaling [16,19]. However, psoriasis and AD exhibit distinct immunopathological characteristics, and the effects of limonin on mitochondrial function and mTORC2-associated metabolic signaling in keratinocytes, particularly under IL-4/IL-13-driven type 2 inflammatory conditions, remain poorly understood.
In this study, we investigated the anti-inflammatory effects of limonin and associated immunometabolic alterations using an MC903-induced AD-like mouse model and IL-4/IL-13-stimulated human primary keratinocytes. Specifically, we examined mitochondrial oxidation- and membrane potential-associated fluorescence and respiratory function, together with alterations in AMPK- and mTORC2–AKT-FOXO3a-associated signaling, to characterize the metabolic regulatory effects and the inflammatory and metabolic responses to limonin in these experimental models of limonin in AD.
2. Materials and Methods
2.1. Reagents and Antibodies
Limonin and calcipotriol (MC903) were obtained from MedChemExpress (Monmouth Junction, NJ, USA). Recombinant human IL-4 and IL-13 were obtained from Enzynomics (Daejeon, Republic of Korea). Keratinocyte serum-free medium (KSFM) and its growth supplement were obtained from Gibco (Thermo Fisher Scientific, Grand Island, NY, USA), and type IV collagen was obtained from Sigma-Aldrich (St. Louis, MO, USA). Antibodies against phosphorylated and total mTOR, RICTOR, FOXO3a, AKT, and AMPKα, as well as β-actin, were obtained from Cell Signaling Technology (Danvers, MA, USA). The anti-DDIT4 antibody was obtained from Proteintech (Rosemont, IL, USA), and the Total OXPHOS Rodent WB Antibody Cocktail was obtained from Abcam (Cambridge, UK). Horseradish peroxidase (HRP)-conjugated secondary antibodies were obtained from Enzo Life Sciences (Farmingdale, NY, USA). Flow cytometry antibodies were obtained from BioLegend (San Diego, CA, USA), BD Biosciences (San Jose, CA, USA), and Invitrogen (Carlsbad, CA, USA). Fixable Viability Dye eFluor 780 was obtained from Invitrogen (Carlsbad, CA, USA). Reagent, kit, and consumable details are listed in Supplementary Table S1. Primer sequences and antibody details are provided in Supplementary Tables S2–S4.
2.2. Animals and Establishment of the MC903-Induced AD-like Mouse Model
Eight-week-old female C57BL/6 mice were purchased from Nara Biotech (Pyeongtaek, Gyeonggi-do, Republic of Korea) and housed at 22 ± 2 °C and 50 ± 10% relative humidity under a 12 h light/dark cycle, with ad libitum access to standard laboratory chow and water. After 7 days of acclimatization, 15 mice were randomly assigned to the control, MC903, and MC903 plus limonin groups (n = 5 mice per group). Each mouse was an independent biological replicate. Group size was based on preliminary findings, previous experience with tissue processing and cell isolation, and the feasibility of assessing the planned outcomes under the approved animal protocol. No primary outcome was prespecified for sample size determination, and no formal a priori sample size calculation was performed. Control mice received topical ethanol (20 μL per ear) daily on both ears for 12 days. Mice in the MC903 and MC903 plus limonin groups received topical MC903 (MedChemExpress, Monmouth Junction, NJ, USA) at 4 nmol in 20 μL of ethanol per ear daily on both ears for 12 days. Beginning on the first day of MC903 application, mice in the MC903 plus limonin group received intraperitoneal injections of limonin (MedChemExpress, Monmouth Junction, NJ, USA) at 0.4 mg per mouse in a total volume of 200 μL of 1× phosphate-buffered saline (PBS, prepared from a WELGENE stock, Gyeongsan, Gyeongsangbuk-do, Republic of Korea) every other day. Mice in the control and MC903 groups received intraperitoneal injections of 1× PBS alone. Ear thickness and body weight were monitored throughout the experiment. On day 12, mice were euthanized by CO2 inhalation, and ear tissues, auricular lymph nodes, and spleens were collected for subsequent analyses. No mice were excluded from the study. Technical issues, including instrument malfunction and insufficient cell recovery, prevented measurement of some samples, and instrument capacity limited the number of samples analyzed in certain assays. Consequently, data were available from four or five mice per group, depending on the assay. All animal procedures were approved by the Institutional Animal Care and Use Committee of Jeonbuk National University (approval no. 2026-08-051-001).
2.3. Assessment of Skin Lesions and Histological Analysis
Ear thickness was measured using a digital thickness gauge (Mitutoyo, Kawasaki, Kanagawa, Japan). Ear tissues were fixed in 4% paraformaldehyde in PBS (Thermo Fisher Chemicals, Ward Hill, MA, USA), embedded in paraffin, sectioned at 4 μm, and stained with hematoxylin and eosin (H&E). Images were acquired using an APX100 All-in-One Fluorescence Microscope (Evident, Hachioji, Tokyo, Japan) with a 20× objective. Epidermal and dermal thicknesses were measured in five randomly selected fields per sample. H&E-stained sections were also examined for inflammatory cell infiltration. The investigator who assessed the histological outcomes was blinded to group allocation.
2.4. Western Blot Analysis
Proteins were extracted from primary human keratinocytes using lysis buffer and from mouse ear tissues using T-PER Tissue Protein Extraction Reagent (Pierce Biotechnology, Thermo Fisher Scientific, Rockford, IL, USA). Protein concentrations were determined using Protein Assay Kit II (Bio-Rad Laboratories, Hercules, CA, USA). Equal amounts of protein were mixed with loading buffer and denatured by heating. Samples for oxidative phosphorylation (OXPHOS) analysis were heated at 55 °C for 10 min. Proteins were separated by SDS-PAGE on 6%, 10%, or 15% polyacrylamide gels, depending on the molecular weight of the target, and transferred to 0.45 μm nitrocellulose membranes (Bio-Rad Laboratories, Hercules, CA, USA). Precision Plus Protein Dual Color Standards (Bio-Rad Laboratories, Hercules, CA, USA) were used as molecular weight markers. Membranes were blocked with 5% bovine serum albumin and incubated with primary antibodies overnight at 4 °C. Antibodies against the phosphorylated and total forms of mTOR, RICTOR, AKT, FOXO3a, and AMPKα, as well as the antibody against β-actin, were obtained from Cell Signaling Technology (Danvers, MA, USA). The phospho-specific antibodies recognized mTOR Ser2448, RICTOR Thr1135, AKT Ser473, FOXO3a Ser253, and AMPKα Thr172. The Total OXPHOS Rodent WB Antibody Cocktail was obtained from Abcam (Cambridge, UK), and the anti-DDIT4 antibody was obtained from Proteintech (Rosemont, IL, USA). After washing with Tris-buffered saline containing Tween-20 (Biosolution, Suwon, Gyeonggi-do, Republic of Korea), membranes were incubated with the appropriate horseradish peroxidase-conjugated secondary antibodies (Enzo Life Sciences, Farmingdale, NY, USA) at room temperature. Bands were visualized using SuperSignal West Pico PLUS or SuperSignal West Dura Extended Duration chemiluminescent substrate (both from Pierce Biotechnology, Thermo Fisher Scientific, Rockford, IL, USA) and imaged using an Amersham Imager 600 (Cytiva, Marlborough, MA, USA). When phosphorylated and total forms of a protein were analyzed on the same membrane, the phosphorylated form was generally detected and imaged first. The membrane was then stripped using stripping buffer (CUREBIO, Seoul, Republic of Korea) and reprobed with an antibody against the corresponding total protein. For the mouse ear tissue blots, p-RICTOR was detected before total RICTOR (approximately 200 kDa), with stripping between the two detections. The same membrane was also stripped and reprobed in additional rounds to detect p-FOXO3a (approximately 97 kDa) and total mTOR (approximately 289 kDa), which differed substantially in molecular weight from RICTOR. The molecular weight marker lanes for p-RICTOR, total RICTOR, p-FOXO3a, and total mTOR therefore originated from the same physical membrane. Total FOXO3a was detected on a separately prepared membrane to minimize potential signal loss from repeated stripping. Band intensities were quantified using ImageJ (version 1.53k, National Institutes of Health, Bethesda, MD, USA). OXPHOS subunit signals were normalized to β-actin, and phosphorylated protein signals were normalized to their corresponding total protein signals. Additional reagent and antibody details are provided in Supplementary Tables S1 and S3, respectively. Uncropped Western blot source images and corresponding molecular weight marker lanes are provided in the Supplementary Material beginning with Figure S3.
2.5. Keratinocyte Stimulation and Limonin Treatment
Primary human keratinocytes were stimulated with recombinant human IL-4 and IL-13 (25 ng/mL each, Enzynomics, Daejeon, Republic of Korea). Assays that tested both limonin concentrations included an unstimulated PBS control, an IL-4/IL-13-stimulated PBS control, and two IL-4/IL-13-stimulated groups treated with limonin (MedChemExpress, Monmouth Junction, NJ, USA) at 10 or 20 μg/mL. Limonin was prepared in PBS (WELGENE, Gyeongsan, Gyeongsangbuk-do, Republic of Korea), and the final PBS content in the culture medium was 1% (v/v) in all four groups. Cells were harvested after 48 h. The treatment groups used in each assay are specified in the corresponding figure legends.
2.6. Cell Viability Assay
Primary human keratinocytes were seeded in 96-well plates and treated with PBS or limonin (2.5, 5, 10, or 20 μg/mL) for 24 h without IL-4 or IL-13 stimulation. MTT (Sigma-Aldrich, St. Louis, MO, USA) was prepared at 0.5 mg/mL in PBS and added at 20 μL per well. The plates were incubated at 37 °C for 2–4 h. The medium was removed, and the resulting formazan crystals were dissolved in 100 μL of dimethyl sulfoxide (DMSO, Sigma-Aldrich, St. Louis, MO, USA) per well. Absorbance was measured at 570 nm using a Synergy HTX Multi-Mode Microplate Reader (BioTek Instruments, Inc., Winooski, VT, USA) with Gen5 software (version 2.07). Cell viability was expressed as a percentage of the absorbance of the PBS-treated control.
2.7. RNA Extraction and Quantitative Real-Time PCR
Total RNA was extracted from mouse ear tissue and primary human keratinocytes using RNAiso Plus (Takara Bio, Kusatsu, Shiga, Japan). RNA concentration and purity were assessed using a NanoDrop spectrophotometer (Thermo Fisher Scientific, Wilmington, DE, USA). For each sample, 2 μg of total RNA was brought to 11 μL with nuclease-free water. First-strand cDNA was synthesized using the RevertAid First Strand cDNA Synthesis Kit (Thermo Fisher Scientific Baltics UAB, Vilnius, Lithuania). Each 20 μL reaction contained 11 μL of the RNA solution, 1 μL of oligo(dT) primer, 4 μL of 5× reaction buffer, 2 μL of 10 mM dNTP mix, 1 μL of RiboLock RNase inhibitor, and 1 μL of RevertAid reverse transcriptase. The reactions were vortexed, briefly centrifuged, and run on a T100 Thermal Cycler (Bio-Rad Laboratories, Hercules, CA, USA). The thermal program consisted of incubation at 65 °C for 5 min, a hold at 4 °C for 5 min, reverse transcription at 42 °C for 60 min, and reaction termination at 70 °C for 5 min, followed by a hold at 4 °C. Quantitative real-time PCR (qPCR) was performed on a QuantStudio 5 Real-Time PCR System (Applied Biosystems, Thermo Fisher Scientific, Carlsbad, CA, USA) using the RealHelix Premier qPCR Kit (Green, High ROX) (NanoHelix, Daejeon, Republic of Korea) and MicroAmp Optical 384-Well Reaction Plates with Barcode (Applied Biosystems, Thermo Fisher Scientific, Waltham, MA, USA). Each 10 μL qPCR reaction contained 1 μL of cDNA template. The amplification program consisted of an initial hold at 50 °C for 2 min and initial denaturation at 95 °C for 10 min, followed by 45 cycles of denaturation at 95 °C for 15 s and combined annealing and extension at 60 °C for 1 min. For melt-curve analysis, samples were held at 95 °C for 15 s and then at 60 °C for 1 min. The temperature was then increased to 95 °C at 0.075 °C/s and held at 95 °C for 15 s. The transcripts analyzed in primary human keratinocytes were CCL17, CCL22, CCL26, IL25, IL33, TSLP, NOX4, DRP1, NRF2, MFN2, and GLUT1. The transcripts analyzed in mouse ear tissue were Il4, Il5, Il13, Il31, Ifnγ, and Tslp. Relative transcript levels were calculated using the comparative 2−ΔΔCt method, with β-actin as the reference gene for both mouse and human samples. Results are expressed as fold changes relative to the respective control group, which was set to 1. Primer-specific amplification efficiencies were not experimentally determined, and β-actin expression stability across the experimental conditions was not independently assessed. Primer sequences are listed in Supplementary Table S2.
2.8. Isolation and Culture of Primary Human Keratinocytes
Discarded skin specimens were obtained from five adult donors undergoing elective plastic surgery at Jeonbuk National University Hospital. The donors were 42–54 years of age and included three women and two men. The study was approved by the Institutional Review Board of Jeonbuk National University Hospital (approval no. 2022-05-002-012), and written informed consent was obtained from all donors. Keratinocytes from three donors were cultured and analyzed separately without pooling, with one experiment performed per donor. Skin specimens were washed twice with PBS containing 1% penicillin–streptomycin (Gibco, Thermo Fisher Scientific, Waltham, MA, USA). After removal of subcutaneous fat, the specimens were cut into pieces of approximately 1 cm2 and incubated with Dispase II (2.4 mg/mL, Sigma-Aldrich, St. Louis, MO, USA) at 4 °C for approximately 20 h. The epidermis was separated from the dermis and incubated in 0.05% trypsin-EDTA (Gibco) at 37 °C for 10 min. Trypsinization was stopped by adding an equal volume of supplemented KSFM, and the epidermal sheets were gently triturated. The resulting cell suspension was passed through a 70 μm Falcon cell strainer (Corning Inc., Corning, NY, USA) and centrifuged at 180× g for 10 min. Keratinocytes were seeded onto culture dishes coated with type IV collagen and maintained in supplemented KSFM at 37 °C in a 5% CO2 atmosphere. Cells at passages 2–4 were used for experiments.
2.9. 2-NBDG Uptake Assay
Following the indicated treatments, primary human keratinocytes were incubated with the fluorescent glucose analog 2-NBDG (10 μg/mL, Invitrogen, Eugene, OR, USA) for 30 min at 37 °C in the dark. Cells were then washed with PBS, stained with a viability dye, and analyzed using an Attune NxT Acoustic Focusing Cytometer (Invitrogen, Carlsbad, CA, USA). The proportion of 2-NBDG-positive cells was expressed as a percentage of all viable cells.
2.10. Flow Cytometric Analysis of Mitochondrial Oxidation- and Membrane Potential Associated Fluorescence
Mitochondrial oxidation- and membrane potential-associated fluorescence was assessed in primary human keratinocytes and single-cell suspensions from mouse ear tissue. After the indicated treatments, keratinocytes were harvested, and mouse ear tissue was processed as described in Section 2.11. Cells were co-stained for 2 h at 37 °C in the dark with MitoTracker Green FM (100 nM, Invitrogen, Eugene, OR, USA) and either MitoSOX Red (1 μM) or tetramethylrhodamine methyl ester (TMRM, 4 nM, MitoProbe TMRM Assay Kit for Flow Cytometry), both from Invitrogen (Eugene, OR, USA). MitoTracker Green FM was used to identify MitoTracker-positive cells in both assays. After probe staining, cells were washed twice with medium and stained with Fixable Viability Dye eFluor 780 (Invitrogen, Carlsbad, CA, USA) for 20 min at room temperature in the dark. Samples were acquired using an Attune NxT Acoustic Focusing Cytometer. Within the viable-cell gate, MitoTracker Green fluorescence was plotted against either MitoSOX Red or TMRM fluorescence. MitoTracker+MitoSOX+ and MitoTracker+TMRM+ cells were quantified as percentages of all viable cells and reported as readouts associated with mitochondrial oxidation and membrane potential, respectively.
2.11. Flow Cytometry
At euthanasia, mouse ear tissues were collected, minced, and digested with Liberase TH (0.4 mg/mL, Roche Diagnostics GmbH, Mannheim, Germany) for 1.5 h. The resulting single-cell suspensions were filtered and washed. Auricular lymph nodes draining the ear skin were collected at the same time and mechanically dissociated through a 70 μm Falcon cell strainer (Corning Inc., Corning, NY, USA). The resulting suspensions were passed through a 40 μm Falcon cell strainer and washed twice with PBS before staining. For myeloid cell analysis, cells were stained with fluorochrome-conjugated antibodies against CD11b, F4/80, c-Kit (CD117), Siglec-F (CD170), FcεRIα, and Ly6G. For intracellular Th-cell analysis, cells were stimulated for 3 h with phorbol 12-myristate 13-acetate (PMA, 20 ng/mL) and ionomycin (1 μg/mL), both from Sigma-Aldrich (St. Louis, MO, USA), in the presence of GolgiPlug (1:1000 dilution, BD Biosciences, San Jose, CA, USA). Cells were stained for surface CD4 and CD25, fixed and permeabilized, and then stained intracellularly for IFN-γ, IL-4, and Foxp3. Antibodies were obtained from BioLegend (San Diego, CA, USA), BD Biosciences (San Jose, CA, USA), and Invitrogen (Carlsbad, CA, USA), as specified in Supplementary Table S4. Samples were acquired on an Attune NxT Acoustic Focusing Cytometer (Invitrogen, Carlsbad, CA, USA) and analyzed using FlowJo software (version 10.7.1, FlowJo, LLC, Ashland, OR, USA). Singlets were selected first to exclude doublets, followed by gating on an FSC-A versus SSC-A plot. Dead cells were then excluded using Fixable Viability Dye eFluor 780 (Invitrogen, Carlsbad, CA, USA). A CD45+ pre-gate was not applied. Within the viable-cell gate, eosinophils were identified as CD11b+Siglec-F+, macrophages as CD11b+F4/80+, mast cells as c-Kit+FcεRIα+, and neutrophils as CD11b+Ly6G+. Within the viable CD4+ population, Th1 cells were identified as IFN-γ+, Th2 cells as IL-4+, and regulatory T cells as CD25+Foxp3+. Representative gating strategies are shown in Supplementary Figure S4. The flow cytometry analyst was aware of group allocation.
2.12. Seahorse Extracellular Flux Analysis
Mitochondrial respiration in primary human keratinocytes was measured using a Seahorse XFp Extracellular Flux Analyzer (Agilent Technologies, Santa Clara, CA, USA). Keratinocytes were seeded in Seahorse XFp eight-well cell culture miniplates (Agilent Technologies) at 1 × 10⁵ cells per well. Cells were stimulated with IL-4 and IL-13 in the presence or absence of limonin (20 μg/mL). The oxygen consumption rate (OCR) was measured in Seahorse XF DMEM medium (pH 7.4) using the Seahorse XFp Cell Mito Stress Test Kit (both from Agilent Technologies) according to the manufacturer’s instructions. After baseline OCR measurements, oligomycin, FCCP, and the rotenone/antimycin A mixture supplied with the kit were sequentially injected. OCR data were analyzed using Seahorse Wave software (version 2.6.3.5, Agilent Technologies, Santa Clara, CA, USA). OCR values were normalized to the measured cell count in each well and expressed as pmol O2/min per 104 cells. Maximal respiration was calculated for each well by subtracting the non-mitochondrial OCR measured after rotenone/antimycin A injection from the peak OCR measured after FCCP injection.
2.13. Cellular Thermal Shift Assay
A cellular thermal shift assay (CETSA) was performed to assess the thermal stability of mTOR and AMPKα following limonin treatment. Primary human keratinocytes were treated with limonin (20 μg/mL) or DMSO vehicle for 1 h. Limonin was prepared from a DMSO stock, and the final DMSO concentration was approximately 1% (v/v) in both groups. After treatment, cells were washed with ice-cold PBS, harvested, and resuspended in PBS. Equal aliquots of the cell suspension were transferred to PCR tubes and heated for 3 min at 35, 40, 45, 50, 55, 60, 65, 70, or 75 °C using a thermal cycler. Immediately after heating, the samples were frozen in liquid nitrogen. Cells were lysed in NP-40 lysis buffer supplemented with a protease inhibitor cocktail and subjected to three freeze–thaw cycles, with freezing in liquid nitrogen and thawing at room temperature. The lysates were centrifuged at 20,000× g for 20 min at 4 °C. The soluble supernatants were collected for Western blot analysis, and band intensities were quantified using ImageJ (National Institutes of Health, Bethesda, MD, USA).
2.14. Statistical Analysis
Data are presented as the mean ± standard error of the mean (SEM). Statistical analyses were performed using GraphPad Prism 9 (GraphPad Software, San Diego, CA, USA). Comparisons between two independent groups were performed using an unpaired two-tailed Student’s t-test, whereas comparisons among multiple groups were performed using one-way analysis of variance (ANOVA) followed by Holm-Šídák’s multiple-comparisons test. Changes in ear thickness and body weight over time were analyzed using two-way repeated-measures ANOVA followed by Holm-Šídák’s multiple-comparisons test. Homogeneity of variance was evaluated using the Brown–Forsythe and Bartlett’s tests provided by GraphPad Prism for one-way ANOVA. The experimental unit and sample size (n) for each experiment are indicated in the corresponding figure legends. A two-sided p value < 0.05 was considered statistically significant.
3. Results
3.1. Limonin Attenuates MC903-Induced AD-like Skin Inflammation and Reduces Inflammatory Myeloid Cell Proportions
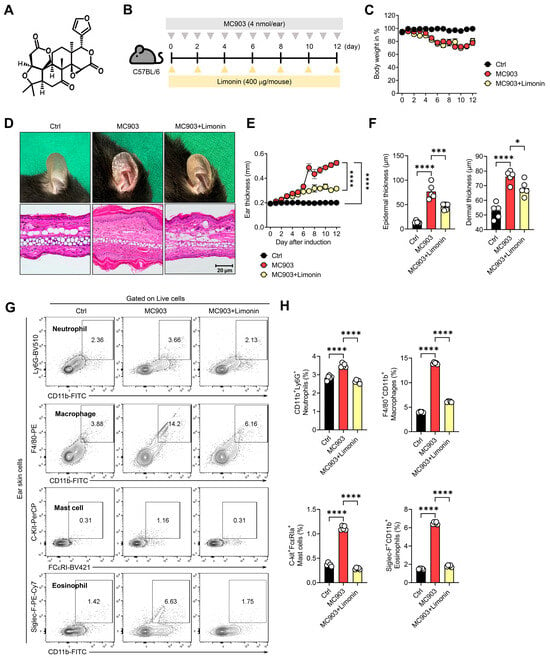
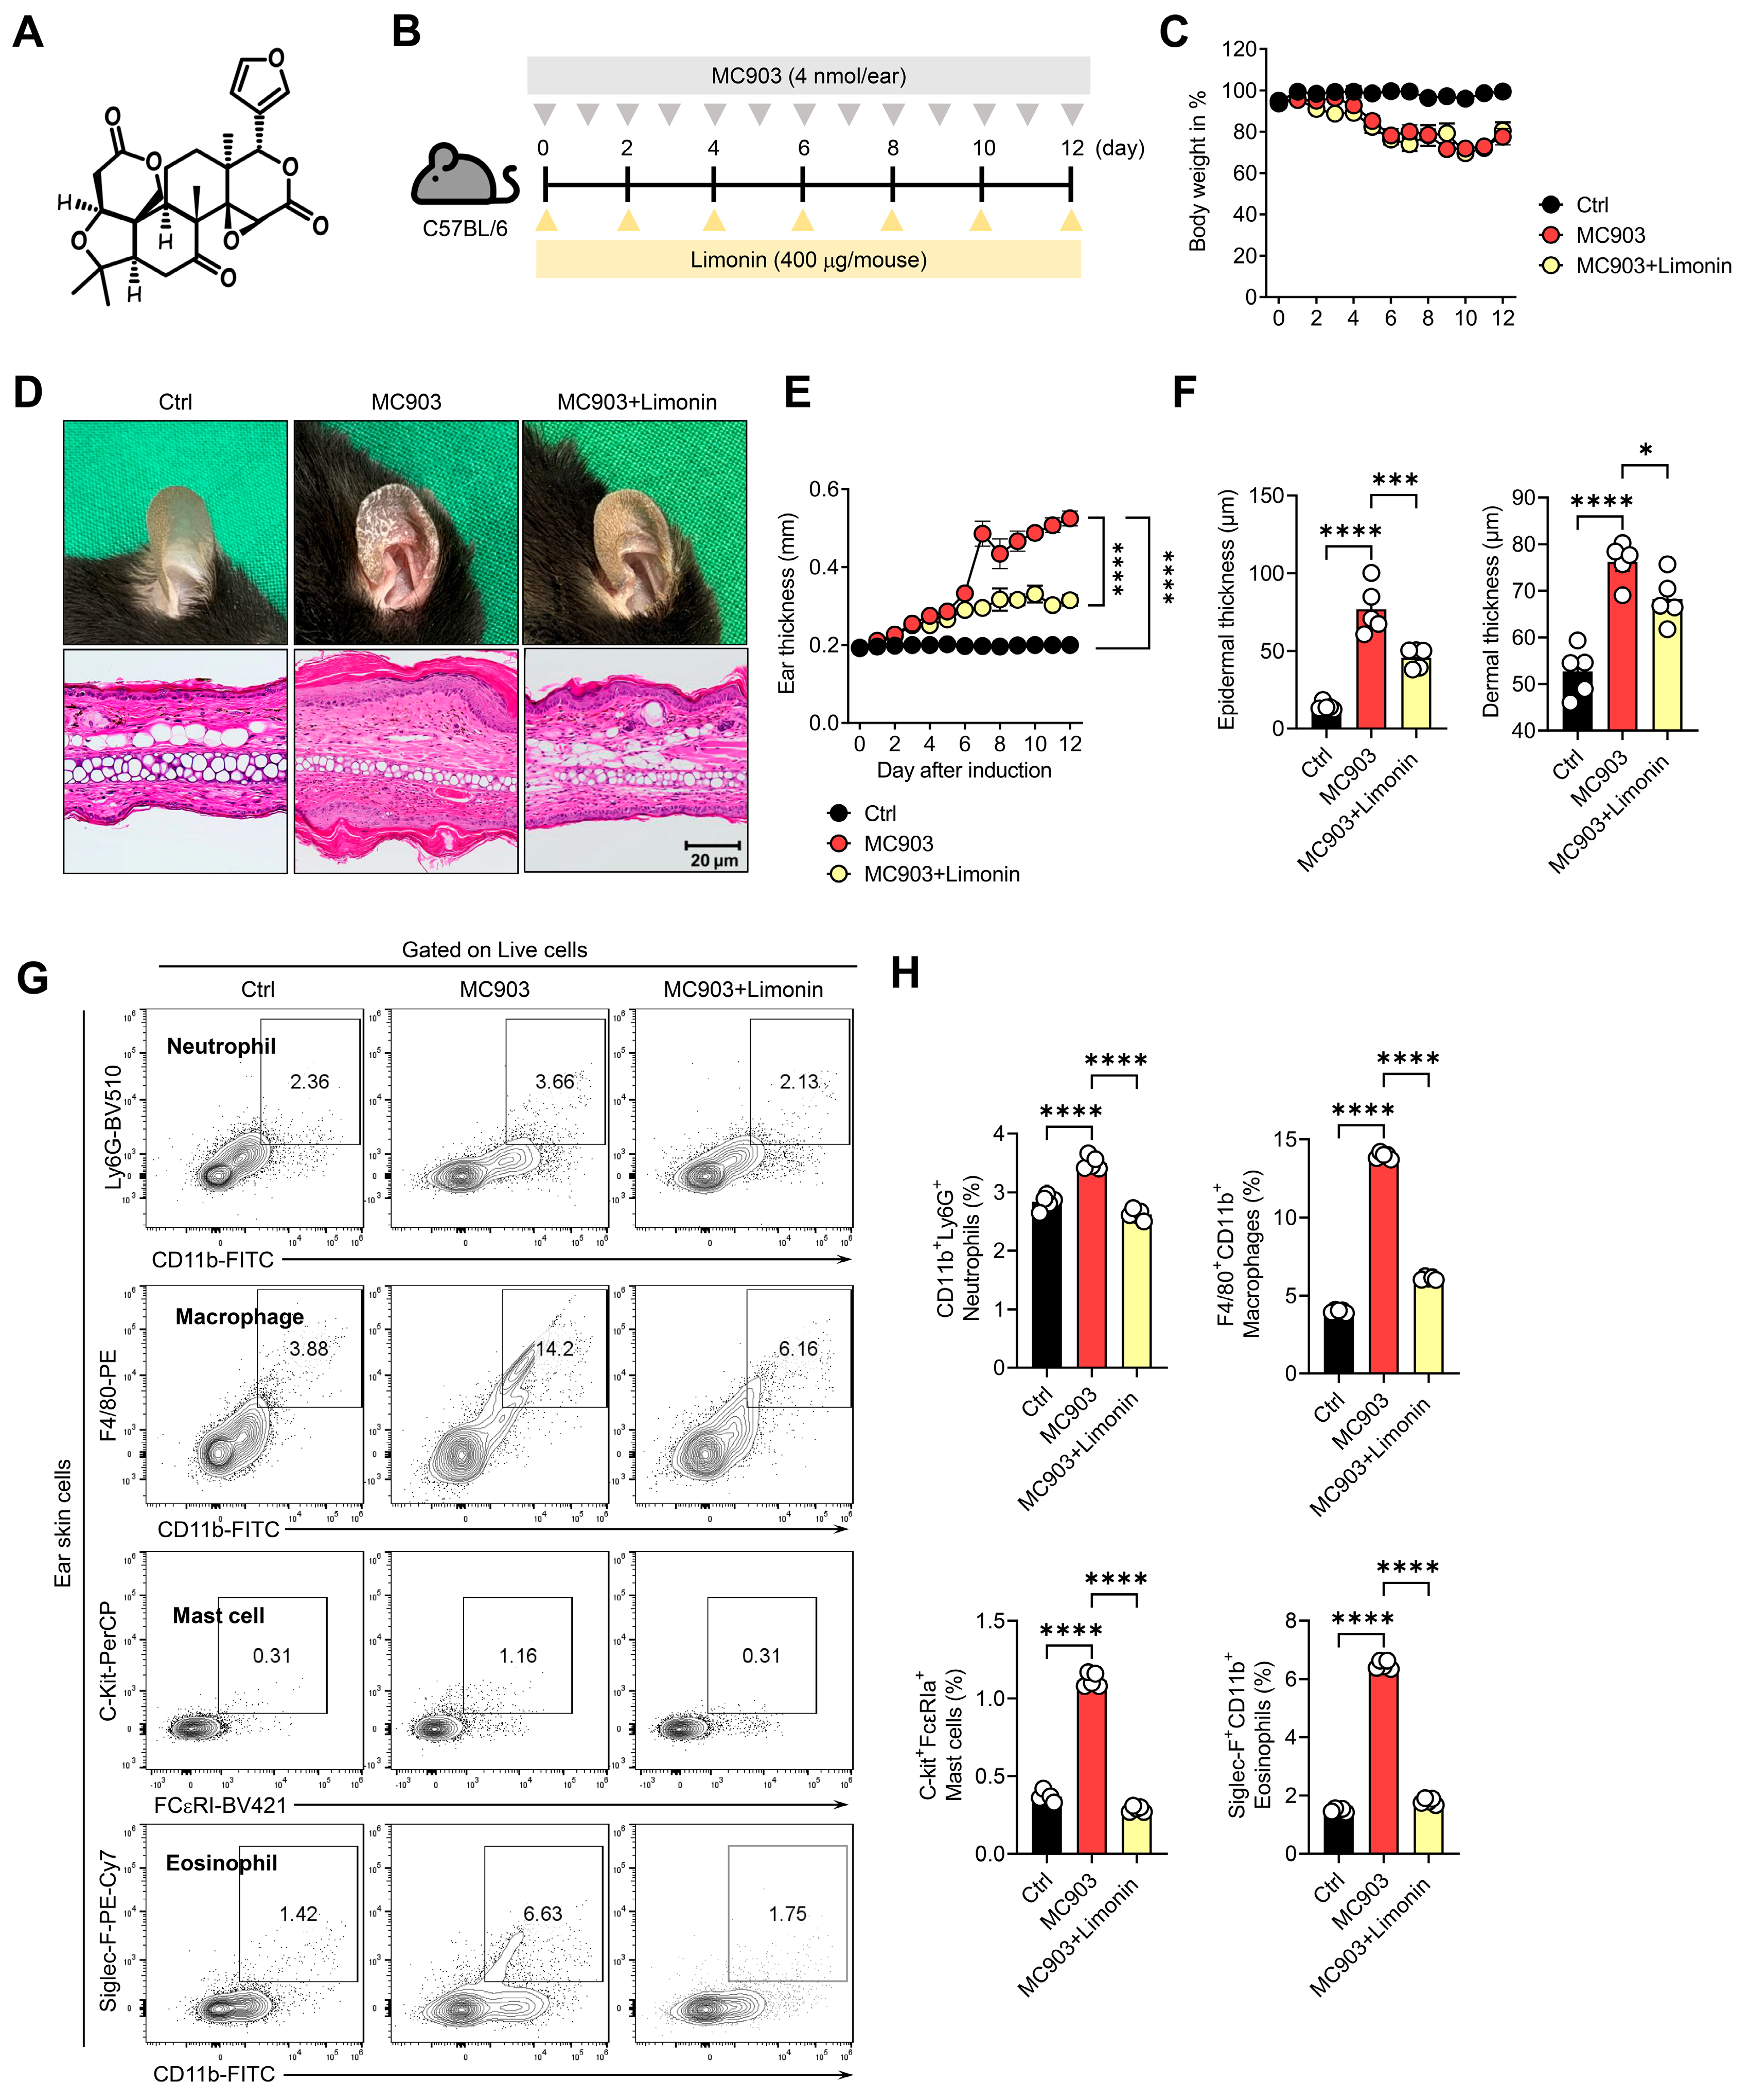
MC903 is widely used to establish an experimental model that recapitulates key inflammatory features of AD, including keratinocyte-derived inflammatory mediator production, type 2 immune responses, inflammatory cell infiltration, particularly eosinophils, and epidermal and dermal thickening [20,21]. Therefore, we evaluated the anti-inflammatory effects of limonin using an MC903-induced AD-like mouse model. The chemical structure of limonin is presented in Figure 1A. C57BL/6 mice were repeatedly treated with MC903 (4 nmol/ear) and administered limonin (400 μg/mouse) intraperitoneally, as illustrated in the experimental scheme (Figure 1B). Body weight monitoring revealed a reduction in body weight in MC903-treated mice compared with controls, with no apparent additional weight loss following limonin administration (Figure 1C). MC903 treatment induced pronounced dermatitis-like lesions characterized by erythema, edema, and scaling, whereas limonin administration alleviated these clinical manifestations (Figure 1D). Histological examination revealed marked epidermal hyperplasia and dermal thickening in MC903-treated mice compared with controls, both of which were attenuated by limonin treatment (Figure 1D). Consistently, longitudinal measurements demonstrated a progressive increase in ear thickness following MC903 exposure, which was significantly suppressed by limonin administration (Figure 1E). Quantitative histological analysis further confirmed significant reductions in epidermal and dermal thickness in limonin-treated mice (Figure 1F). To determine whether these histopathological improvements were accompanied by changes in inflammatory myeloid cell proportions, we performed flow cytometric analysis of cells isolated from ear skin. MC903 treatment significantly increased the proportions of CD11b+Ly6G+ neutrophils, F4/80+CD11b+ macrophages, c-Kit+FcεRI+ mast cells, and Siglec-F+CD11b+ eosinophils compared with controls (Figure 1G,H). In contrast, limonin administration significantly reduced the proportions of all four inflammatory cell populations (Figure 1G,H). We next examined whether similar changes in inflammatory cell populations occurred in skin-draining lymph nodes. MC903 treatment significantly increased the proportions of neutrophils, macrophages, mast cells, and eosinophils, whereas limonin administration reduced the proportions of these populations (Figure S1). Notably, the MC903-induced increases in eosinophil and mast cell proportions were markedly attenuated by limonin treatment. Collectively, these findings demonstrate that limonin attenuated MC903-induced AD-like skin inflammation, as reflected by reduced epidermal hyperplasia and dermal thickening, and lowered the proportions of inflammatory myeloid cells in ear skin and draining lymph nodes.
Figure 1.
Limonin attenuates MC903-induced skin inflammation and reduces the proportions of inflammatory myeloid cells in mouse ear skin. (A) Chemical structure of limonin. (B) Schematic of the experimental design. C57BL/6 mice were assigned to control, MC903, and MC903 plus limonin groups. Control mice received topical ethanol, and mice in the other two groups received topical MC903 (4 nmol per ear) daily for 12 days. Mice in the MC903 plus limonin group received intraperitoneal limonin (0.4 mg per mouse) every other day. Control and MC903 mice received intraperitoneal PBS. (C) Body weight over the experimental period. (D) Representative photographs of ears and hematoxylin and eosin (H&E)-stained ear sections from each group. Original magnification of (H&E) images, ×100. Scale bar, 20 μm. (E) Ear thickness over the experimental period. In panels (C,E), black, red, and yellow symbols indicate the control, MC903, and MC903 plus limonin groups, respectively. (F) Quantification of epidermal and dermal thickness in H&E-stained sections. (G) Representative flow cytometry plots showing CD11b+Ly6G+ neutrophils, F4/80+CD11b+ macrophages, c-Kit+FcεRI+ mast cells, and Siglec-F+CD11b+ eosinophils in ear skin. Contour lines indicate the relative density of flow cytometry events. (H) Quantification of each myeloid cell population as a percentage of viable cells. Quantitative data are presented as mean ± SEM (n = 5 mice per group). Endpoint data were analyzed using one-way ANOVA followed by Holm–Šídák’s multiple-comparisons test. Longitudinal data were analyzed using two-way repeated-measures ANOVA followed by Holm–Šídák’s multiple-comparisons test. * p < 0.05, *** p < 0.001, and **** p < 0.0001.
3.2. Limonin Suppresses Inflammatory Cytokine Expression and Reshapes T-Cell Responses in AD-like Skin Inflammation
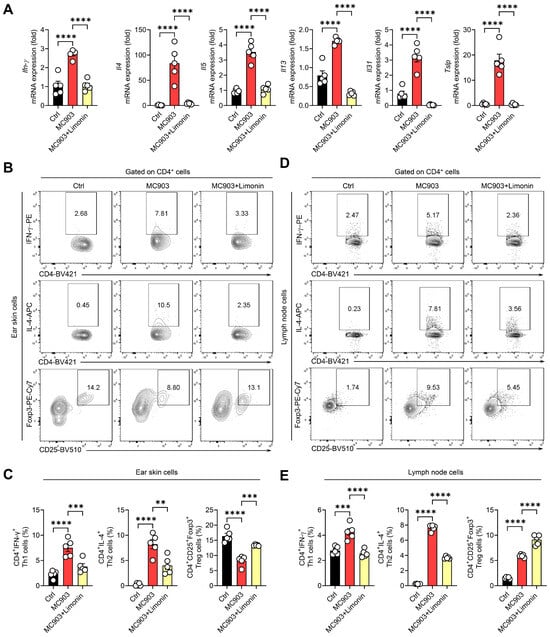
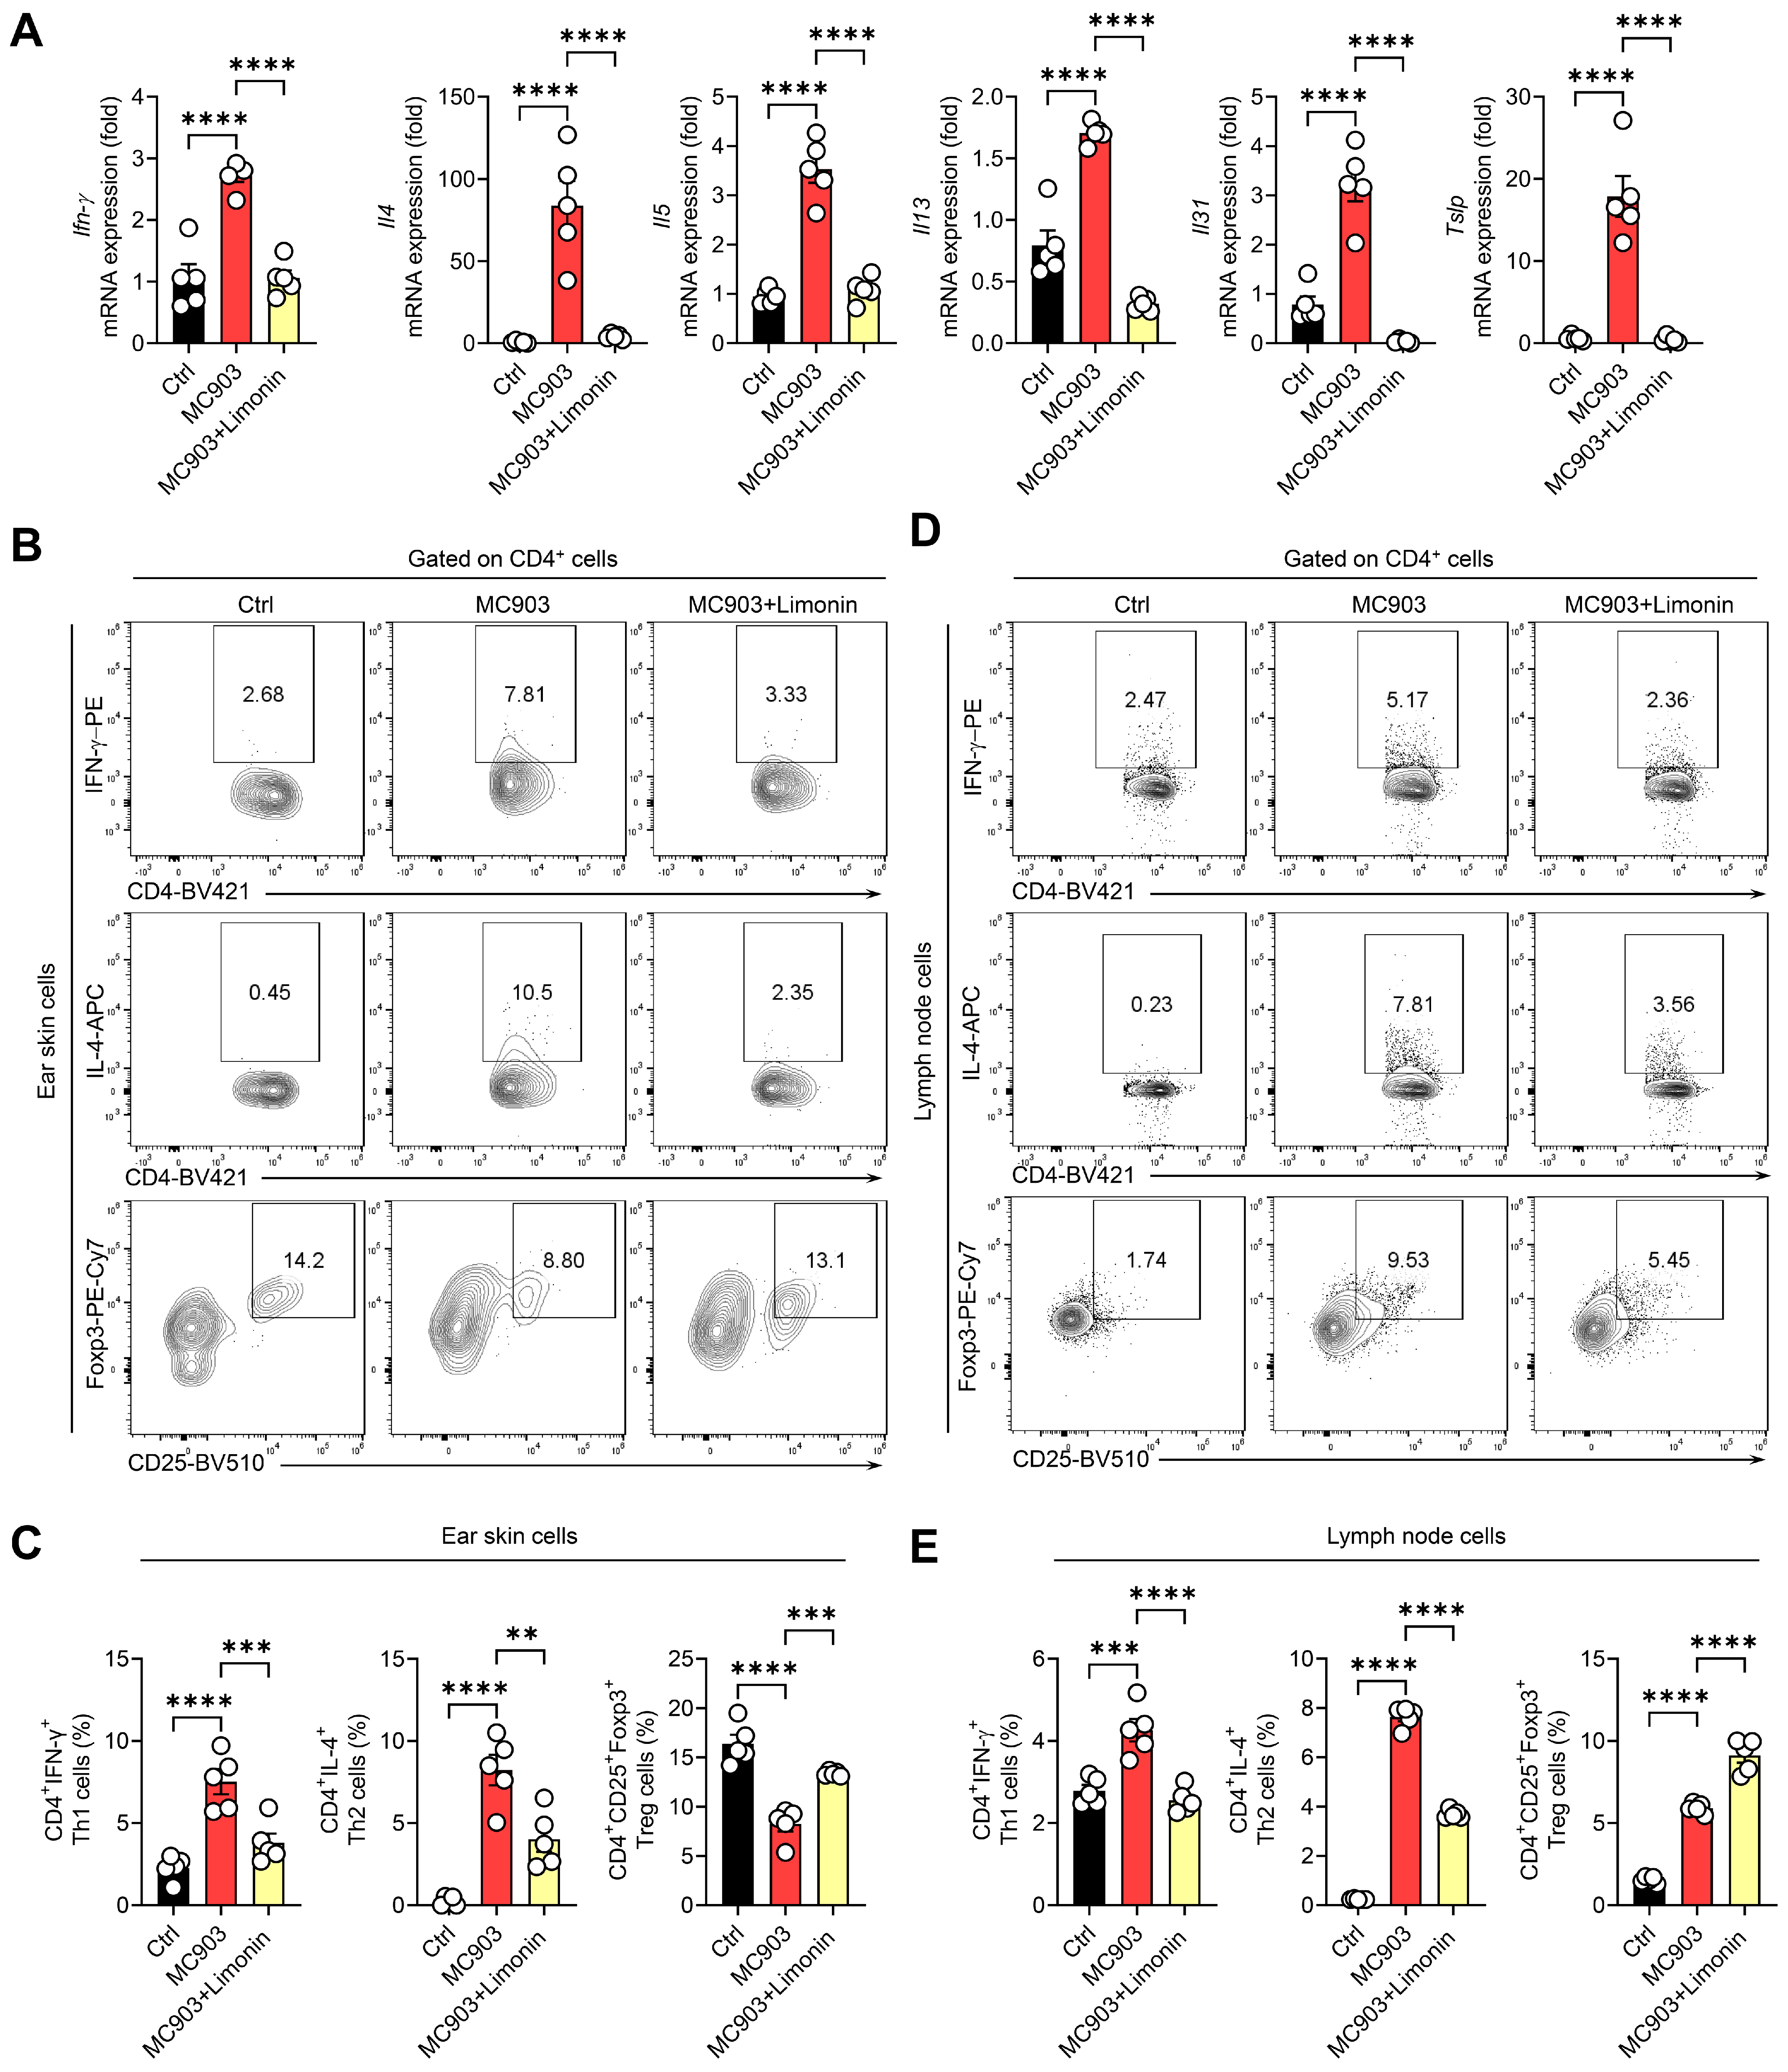
To determine whether the attenuation of AD-like skin inflammation by limonin was associated with changes in inflammatory cytokine expression and T-cell populations, the expression of inflammatory cytokines and epithelial-derived inflammatory mediators was examined in ear skin tissue. MC903 treatment significantly increased the mRNA expression of Ifnγ, Il4, Il5, Il13, Il31, and Tslp compared with controls (Figure 2A). Limonin administration significantly reduced the expression of all six genes. Notably, the marked MC903-induced increases in Il4 and Tslp expression were substantially attenuated by limonin treatment, suggesting that limonin may modulate both type 2 inflammatory responses and epithelial-derived inflammatory signaling (Figure 2A). Flow cytometric analysis of CD4+ T cells isolated from ear skin tissue revealed increased proportions of CD4+IFN-γ+ Th1 and CD4+IL-4+ Th2 cells following MC903 treatment, both of which were significantly reduced by limonin administration (Figure 2B,C). In contrast, the proportion of CD4+CD25+Foxp3+ regulatory T (Treg) cells was decreased in MC903-treated mice compared with controls but was significantly increased following limonin administration, approaching the level observed in control mice (Figure 2B,C). Similar changes in inflammatory T-cell populations were observed in skin-draining lymph nodes. MC903 treatment increased the proportions of CD4+IFN-γ+ and CD4+IL-4+ T cells, whereas limonin administration significantly reduced the proportions of both populations (Figure 2D,E). Interestingly, the proportion of CD4+CD25+Foxp3+ Treg cells in the draining lymph nodes was increased in MC903-treated mice compared with controls and was further elevated following limonin administration (Figure 2D,E). These findings indicate that Treg populations exhibit distinct responses to MC903-induced inflammation and limonin treatment in the skin and draining lymph nodes. These findings suggest that limonin attenuates AD-like skin inflammation in association with reduced type 2 inflammation-related gene expression, suppression of inflammatory CD4+ T-cell responses, and tissue-dependent changes in Treg populations.
Figure 2.
Limonin alters inflammatory cytokine expression and CD4+ T-cell subset frequencies in MC903-induced AD-like skin inflammation. (A) Relative mRNA levels of Ifng, Il4, Il5, Il13, Il31, and Tslp in ear skin from control, MC903, and MC903 plus limonin groups, measured by quantitative real-time PCR and normalized to β-actin. (B,D) Representative flow cytometry plots identifying CD4+IFN-γ+ Th1 cells, CD4+IL-4+ Th2 cells, and CD4+CD25+Foxp3+ regulatory T (Treg) cells in ear skin (B) and ear-draining auricular lymph nodes (D). Contour lines indicate the relative density of flow cytometry events. (C,E) Frequencies of Th1, Th2, and Treg cells, expressed as percentages of viable CD4+ cells in ear skin (C) and auricular lymph nodes (E). Quantitative data are presented as mean ± SEM (n = 5 mice per group). Statistical significance was assessed by one-way ANOVA followed by Holm–Šídák’s multiple-comparisons test. Brackets indicate the groups compared. ** p < 0.01, *** p < 0.001, and **** p < 0.0001.
3.3. Limonin Alters Mitochondrial Fluorescence Readouts and Respiratory Chain Protein Expression in Inflamed Ear Skin
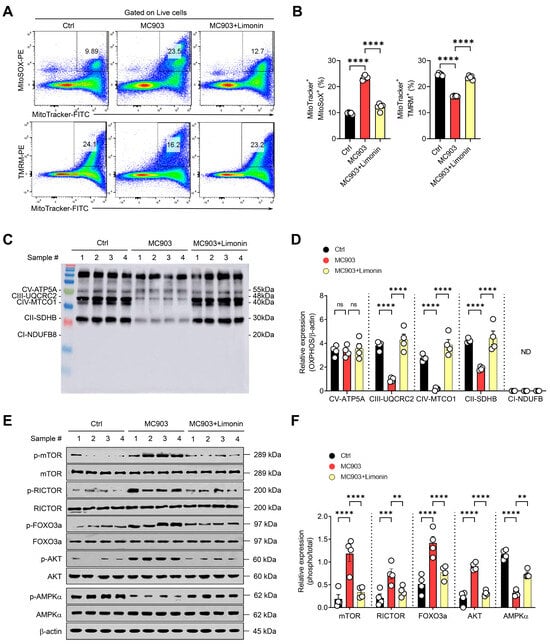
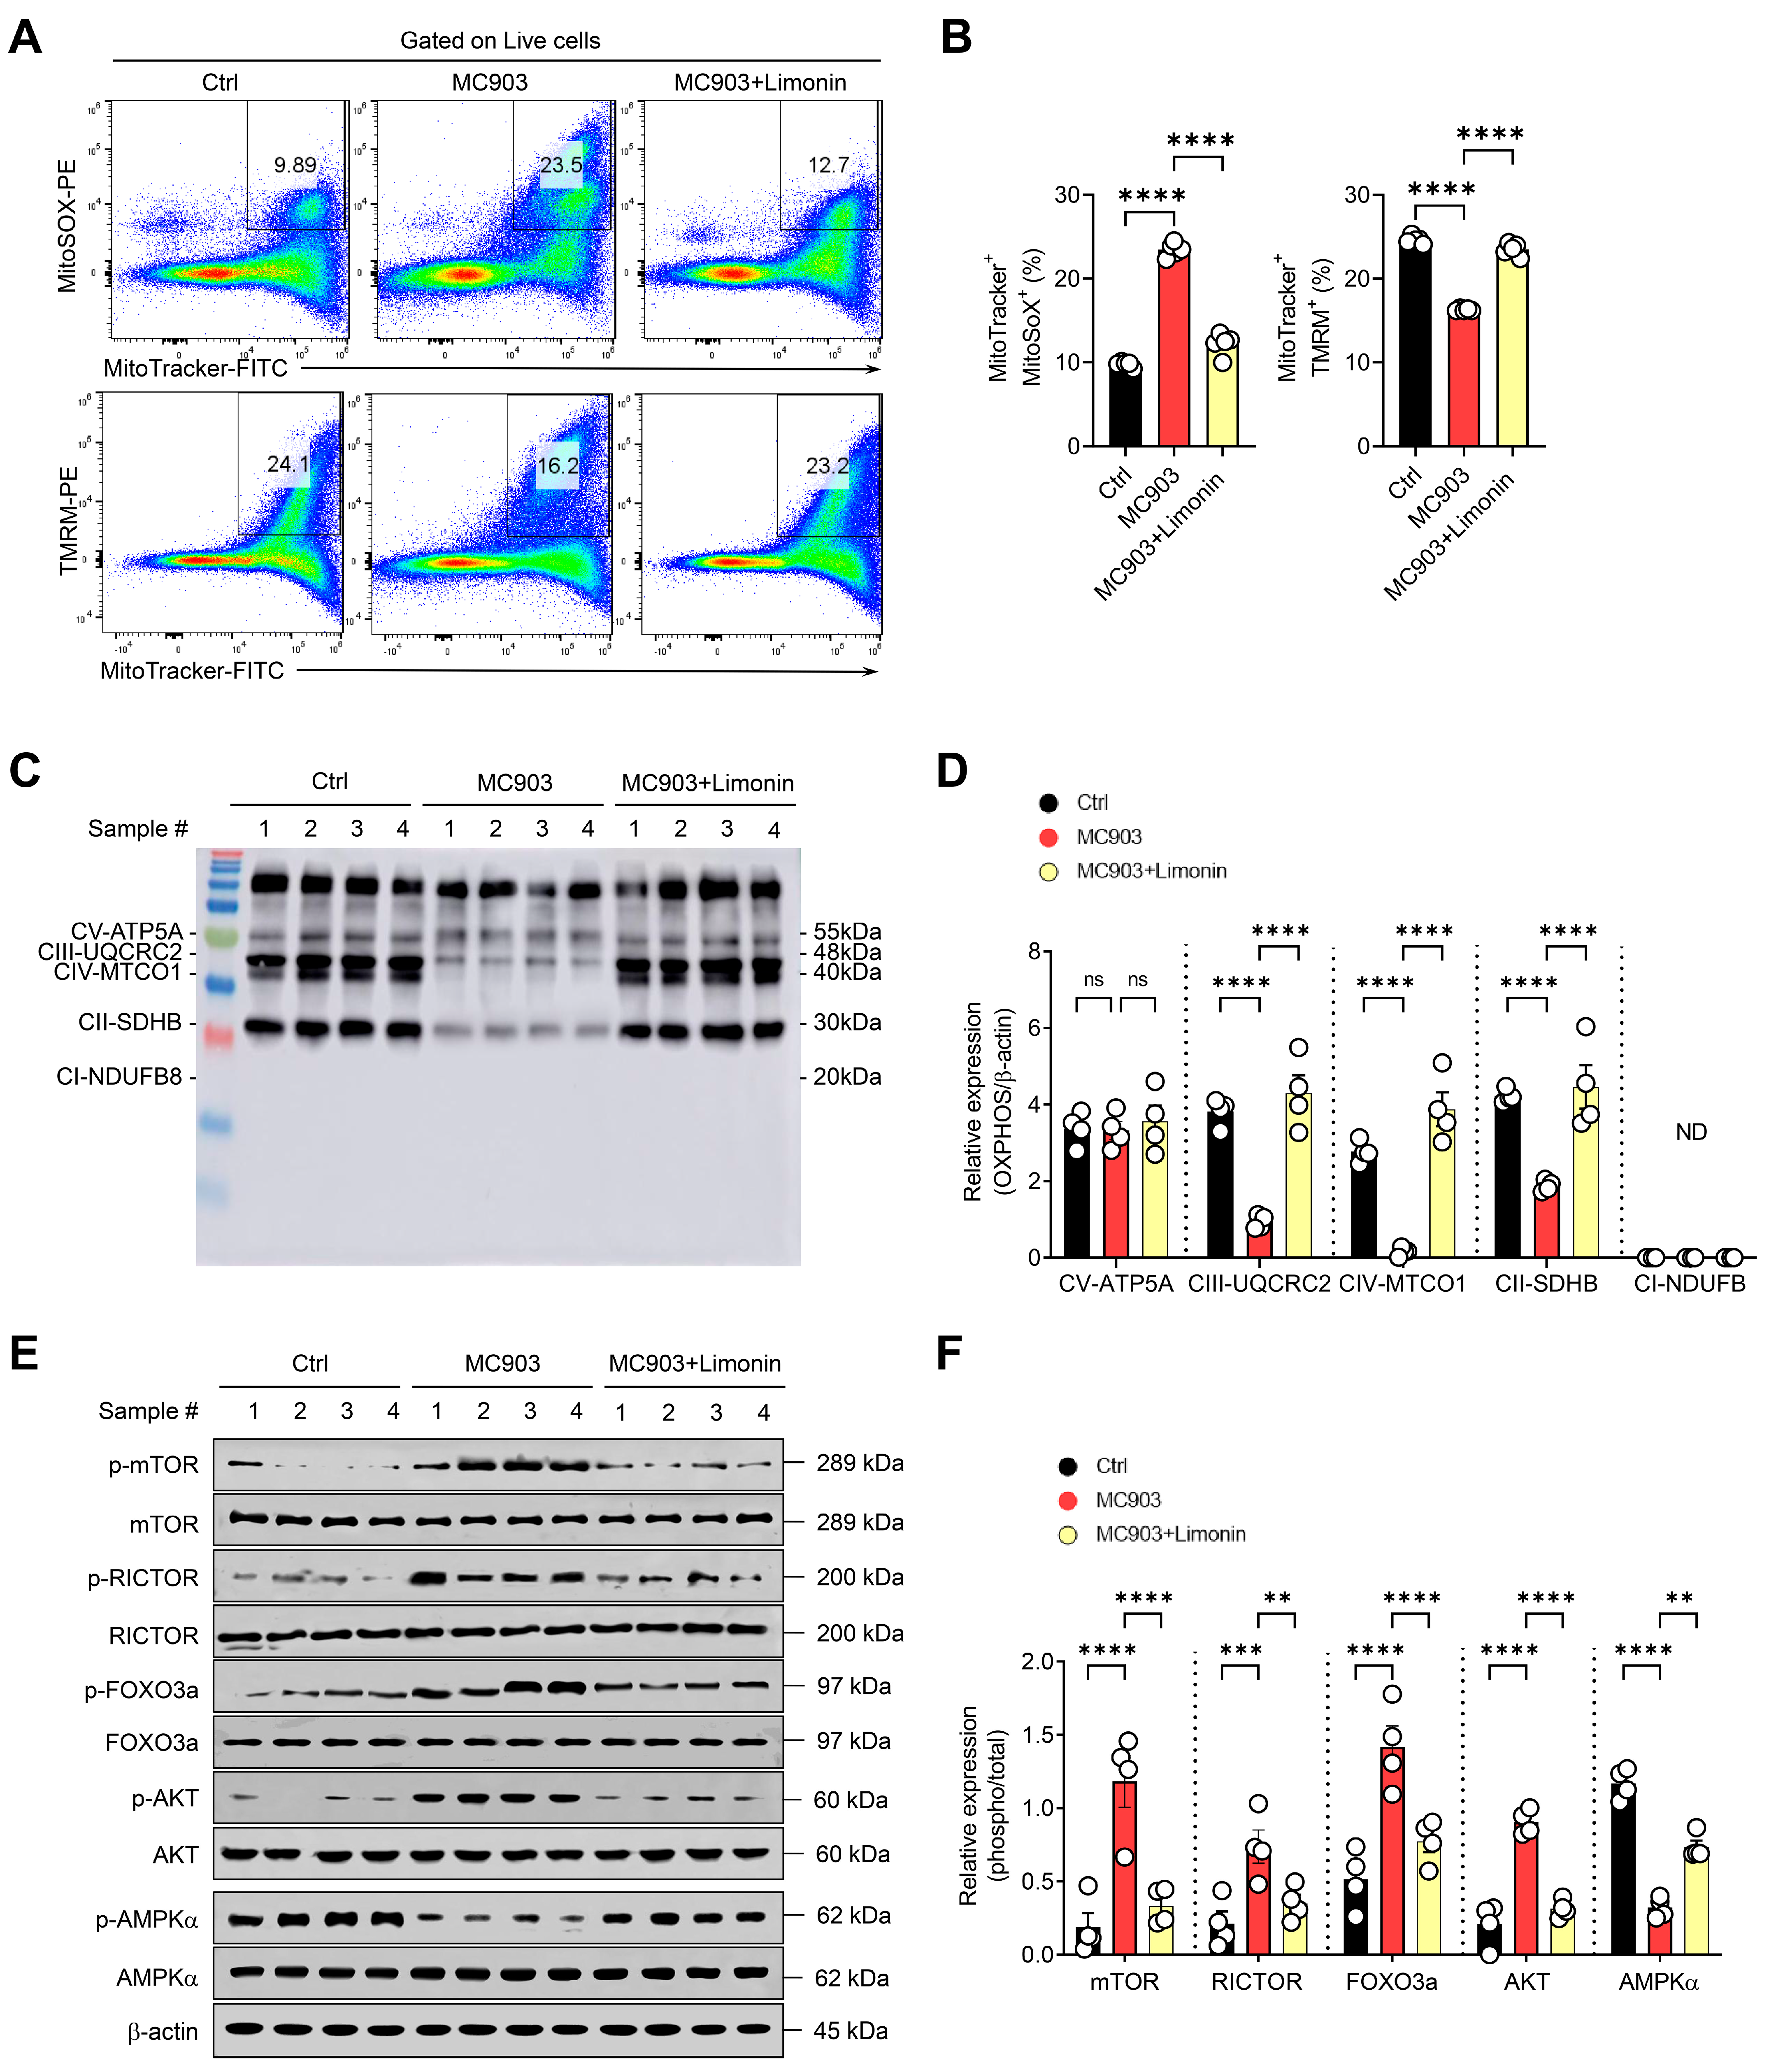
Cutaneous inflammation in AD is closely associated with oxidative stress and alterations in mitochondrial metabolism, and changes in mitochondrial function may influence inflammatory responses in skin cells, including keratinocytes [12,13]. To investigate whether the protective effects of limonin against skin inflammation were accompanied by changes in mitochondrial redox homeostasis and respiratory chain protein expression, mitochondrial oxidative stress and respiratory chain components were examined in MC903-induced AD-like skin inflammation. Mitochondrial oxidation-associated fluorescence was assessed using MitoTracker and MitoSOX in viable cells isolated from the ear skin of MC903-treated mice. The proportion of MitoTracker+MitoSOX+ cells was markedly increased following MC903 treatment compared with controls but was significantly reduced by limonin administration (Figure 3A,B). In contrast, the proportion of MitoTracker+TMRM+ cells was decreased in MC903-treated mice and significantly increased following limonin administration, reaching levels comparable to those observed in controls (Figure 3A,B).
Figure 3.
Limonin alters mitochondrial readouts and AMPK-mTOR-associated phosphorylation in inflamed mouse ear skin. (A) Representative flow cytometry plots of viable cells isolated from ear skin of control, MC903, and MC903 plus limonin groups. Boxed regions indicate the MitoTracker+MitoSOX+ and MitoTracker+TMRM+ gates. (B) Quantification of both double-positive populations as percentages of all viable cells (n = 5 mice per group). (C) Representative Western blots of mitochondrial oxidative phosphorylation (OXPHOS) complex subunits in ear skin. (D) Densitometric quantification of OXPHOS complex subunits normalized to β-actin (n = 4 mice per group). (E) Representative Western blots showing phosphorylated mTOR (Ser2448), RICTOR (Thr1135), AKT (Ser473), FOXO3a (Ser253), and AMPKα (Thr172), together with their corresponding total proteins. (F) Densitometric quantification of phosphorylated proteins normalized to their corresponding total protein levels (n = 4 mice per group). Western blot densitometry was performed using ImageJ. Data are presented as mean ± SEM. Statistical significance was assessed by one-way ANOVA followed by Holm–Šídák’s multiple-comparisons test. Brackets indicate the groups compared. ** p < 0.01, *** p < 0.001, and **** p < 0.0001. ns, not significant, # indicates the sample number; ND, not detected.
The expression of mitochondrial electron transport chain components was subsequently evaluated by Western blot analysis. MC903 treatment reduced the expression of UQCRC2 (complex III), MTCO1 (complex IV), and SDHB (complex II) compared with controls, whereas limonin administration significantly increased the expression of these proteins (Figure 3C,D). In contrast, ATP5A (complex V) expression did not differ significantly among the experimental groups, while NDUFB8 (complex I) was not detected under the experimental conditions (Figure 3C,D).
To determine whether these mitochondrial alterations were associated with changes in metabolic regulatory signaling, the phosphorylation levels of mTOR, RICTOR, FOXO3a, AKT, and AMPK were examined. MC903 treatment increased the relative phosphorylation levels of mTOR, RICTOR, FOXO3a, and AKT compared with controls, whereas limonin administration significantly reduced their phosphorylation levels (Figure 3E,F). Conversely, AMPK phosphorylation was decreased following MC903 treatment but was significantly increased by limonin administration (Figure 3E,F). Overall, these results suggest that limonin attenuates mitochondrial oxidation-associated changes and mitochondrial membrane potential loss while restoring respiratory chain protein expression in inflamed skin. These mitochondrial alterations were accompanied by changes in AMPK- and mTORC2-associated signaling involving RICTOR, AKT, and FOXO3a.
3.4. Limonin Attenuates Type 2 Cytokine-Induced Inflammatory Responses and Alters Mitochondrial Fluorescence Readouts in Primary Human Keratinocytes
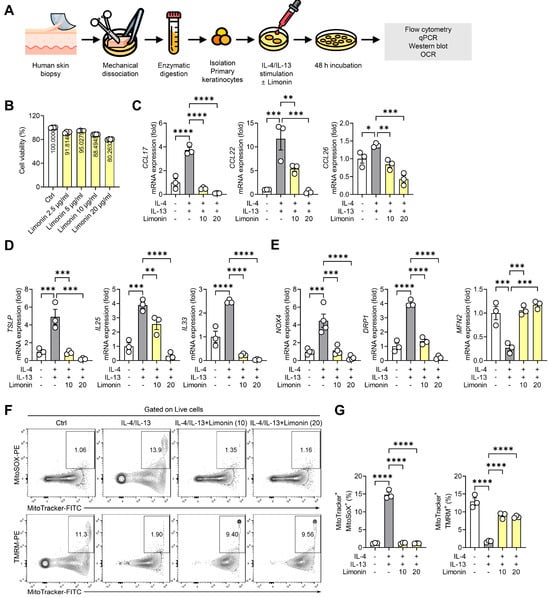
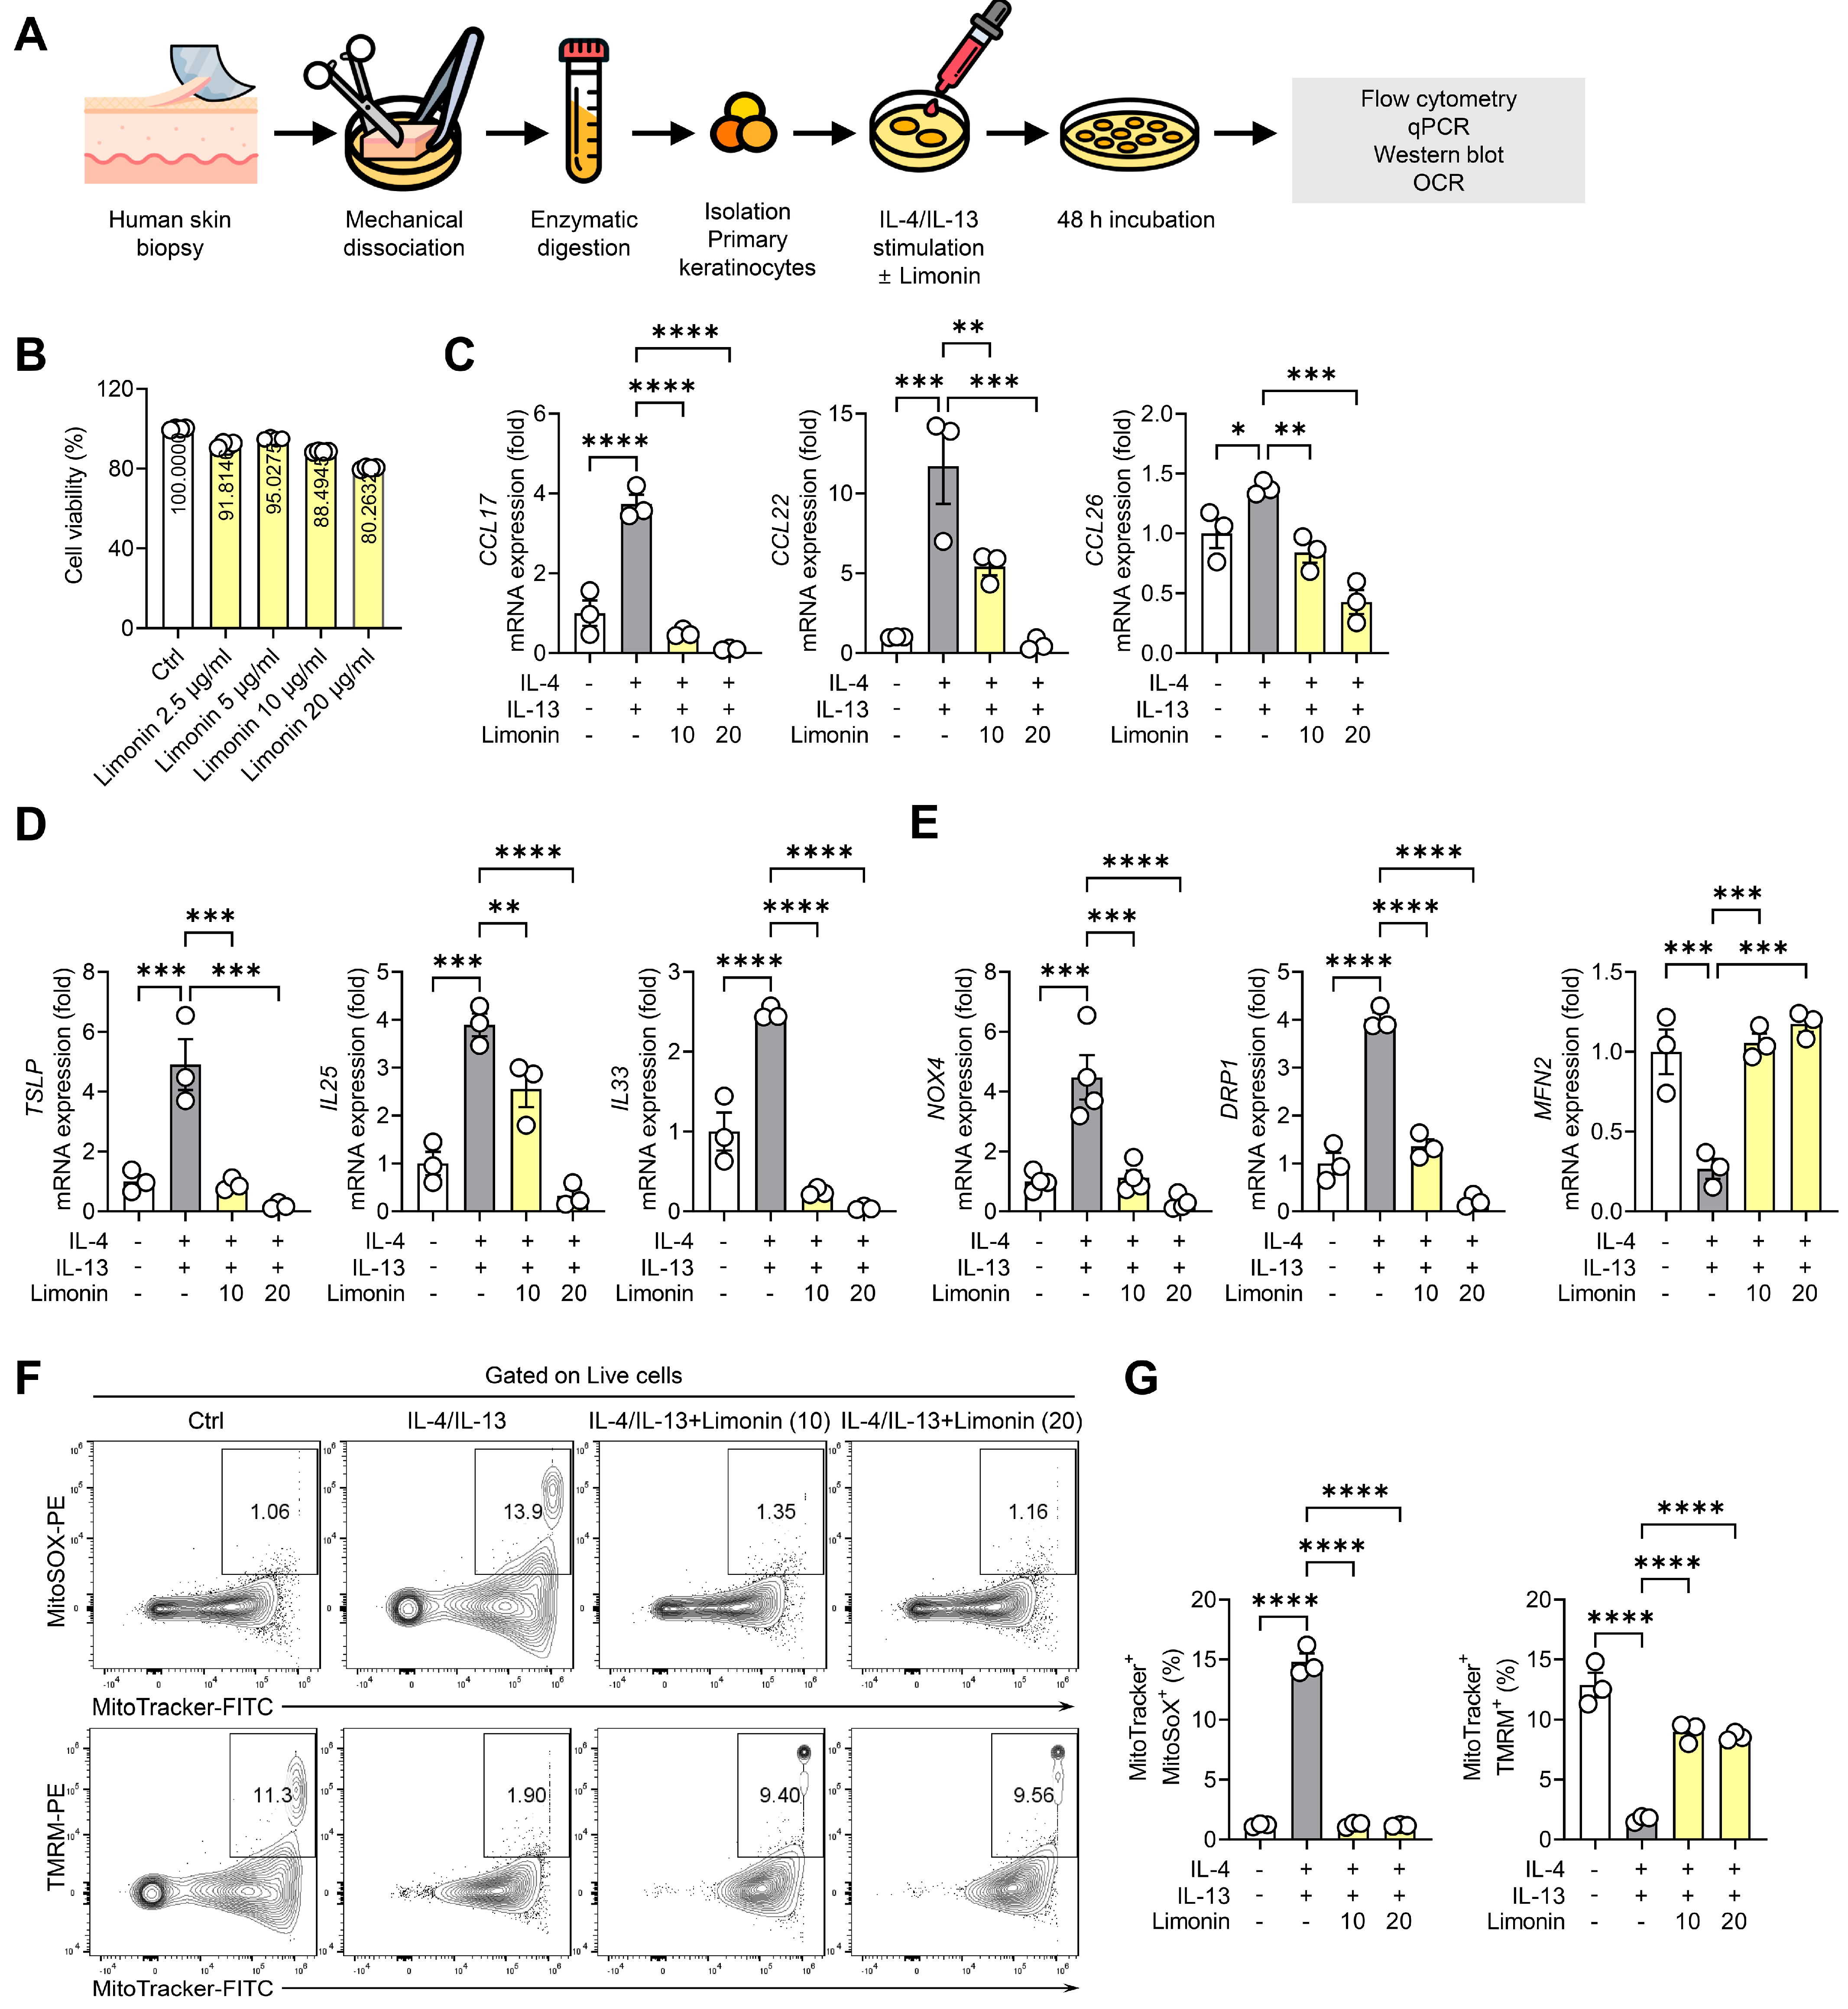
To examine whether the anti-inflammatory and mitochondrial effects of limonin observed in MC903-induced skin inflammation were also evident in human keratinocytes, primary keratinocytes were isolated from human skin tissue and stimulated with IL-4 and IL-13 to establish an in vitro model of type 2 inflammation (Figure 4A). Initial assessment of limonin cytotoxicity revealed that cell viability remained at approximately 80–100% of control levels across concentrations ranging from 2.5 to 20 μg/mL (Figure 4B). Based on these findings, limonin concentrations of 10 and 20 μg/mL were selected for subsequent experiments. IL-4/IL-13 stimulation increased the mRNA levels of CCL17, CCL22, and CCL26 in human primary keratinocytes (Figure 4C). Limonin treatment reduced the expression of these chemokines, with particularly pronounced suppression of CCL17 and CCL22 at 20 μg/mL. CCL26 expression also showed a decreasing trend following limonin treatment (Figure 4C). The expression of keratinocyte-derived inflammatory mediators, including TSLP, IL25, and IL33, was subsequently examined. IL-4/IL-13 stimulation increased the expression of all three genes, whereas limonin treatment significantly reduced their expression (Figure 4D). Notably, TSLP and IL33 expression was markedly decreased following treatment with 20 μg/mL limonin.
Figure 4.
Limonin attenuates epithelial inflammatory responses and alters mitochondrial fluorescence readouts in primary human keratinocytes. (A) Schematic of primary human keratinocyte isolation and IL-4/IL-13 stimulation in the presence or absence of limonin. (B) Cell viability measured by MTT assay after 24 h of treatment with PBS or limonin (2.5, 5, 10, or 20 μg/mL) without cytokine stimulation. Viability is expressed as a percentage of the PBS-treated control. (C–E) Relative mRNA levels of the chemokines CCL17, CCL22, and CCL26 (C), the epithelial inflammatory mediators TSLP, IL25, and IL33 (D), and NOX4, DRP1, and MFN2 (E). Transcript levels were normalized to β-actin. (F) Representative flow cytometry plots showing MitoTracker Green FM fluorescence plotted against MitoSOX Red (top) or TMRM (bottom) fluorescence in viable keratinocytes. Boxed regions indicate the respective double-positive gates. Contour lines indicate the relative density of flow cytometry events. (G) Quantification of MitoTracker+MitoSOX+ and MitoTracker+TMRM+ cells as percentages of all viable cells. In panels C–G, cells received PBS alone, IL-4 and IL-13 (25 ng/mL each) with PBS, or IL-4 and IL-13 with limonin (10 or 20 μg/mL) for 48 h. The final PBS content was 1% (v/v) in all groups. Quantitative data are presented as mean ± SEM from three independent donors (n = 3). Keratinocytes from each donor were cultured and analyzed separately without pooling, with one experiment per donor. Statistical significance was assessed by one-way ANOVA followed by Holm–Šídák’s multiple-comparisons test. Brackets indicate the groups compared. * p < 0.05, ** p < 0.01, *** p < 0.001, and **** p < 0.0001.
IL-4/IL-13 stimulation increased NOX4 and DRP1 mRNA levels in primary human keratinocytes. Limonin significantly reduced the mRNA levels of both genes relative to IL-4/IL-13 stimulation alone. IL-4/IL-13 stimulation decreased MFN2 mRNA levels, and limonin significantly increased them relative to IL-4/IL-13 stimulation alone (Figure 4E). NRF2 mRNA levels did not differ significantly among the experimental groups (Figure S2A).
Mitochondrial oxidation- and membrane potential-associated fluorescence was assessed by flow cytometry. IL-4/IL-13 stimulation markedly increased the proportion of MitoTracker+MitoSOX+ cells compared with controls, whereas treatment with either 10 or 20 μg/mL limonin significantly reduced this population (Figure 4F,G). Conversely, the proportion of MitoTracker+TMRM+ cells was markedly decreased following IL-4/IL-13 stimulation but significantly increased after limonin treatment (Figure 4F,G). The reductions in inflammatory mediator mRNA levels were accompanied by changes in mitochondrial oxidation- and membrane potential-associated fluorescence. These effects were accompanied by changes in the expression of genes associated with mitochondrial dynamics.
3.5. Limonin Reduces Glucose Uptake-Associated Responses and Increases Maximal Respiration in Inflammatory Keratinocytes
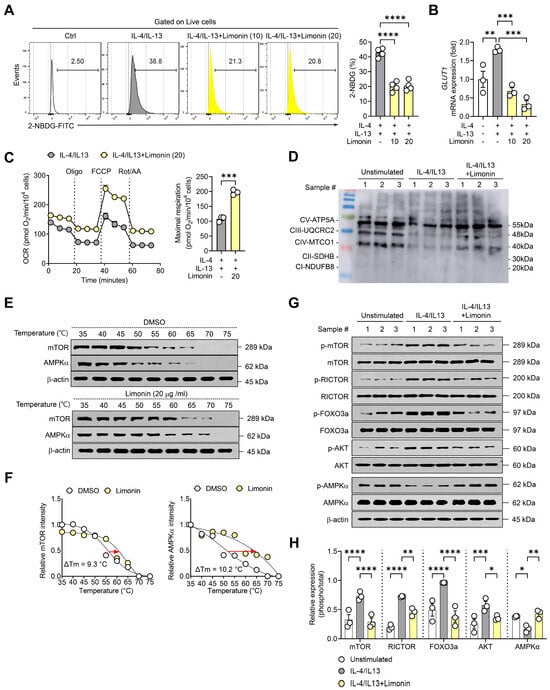
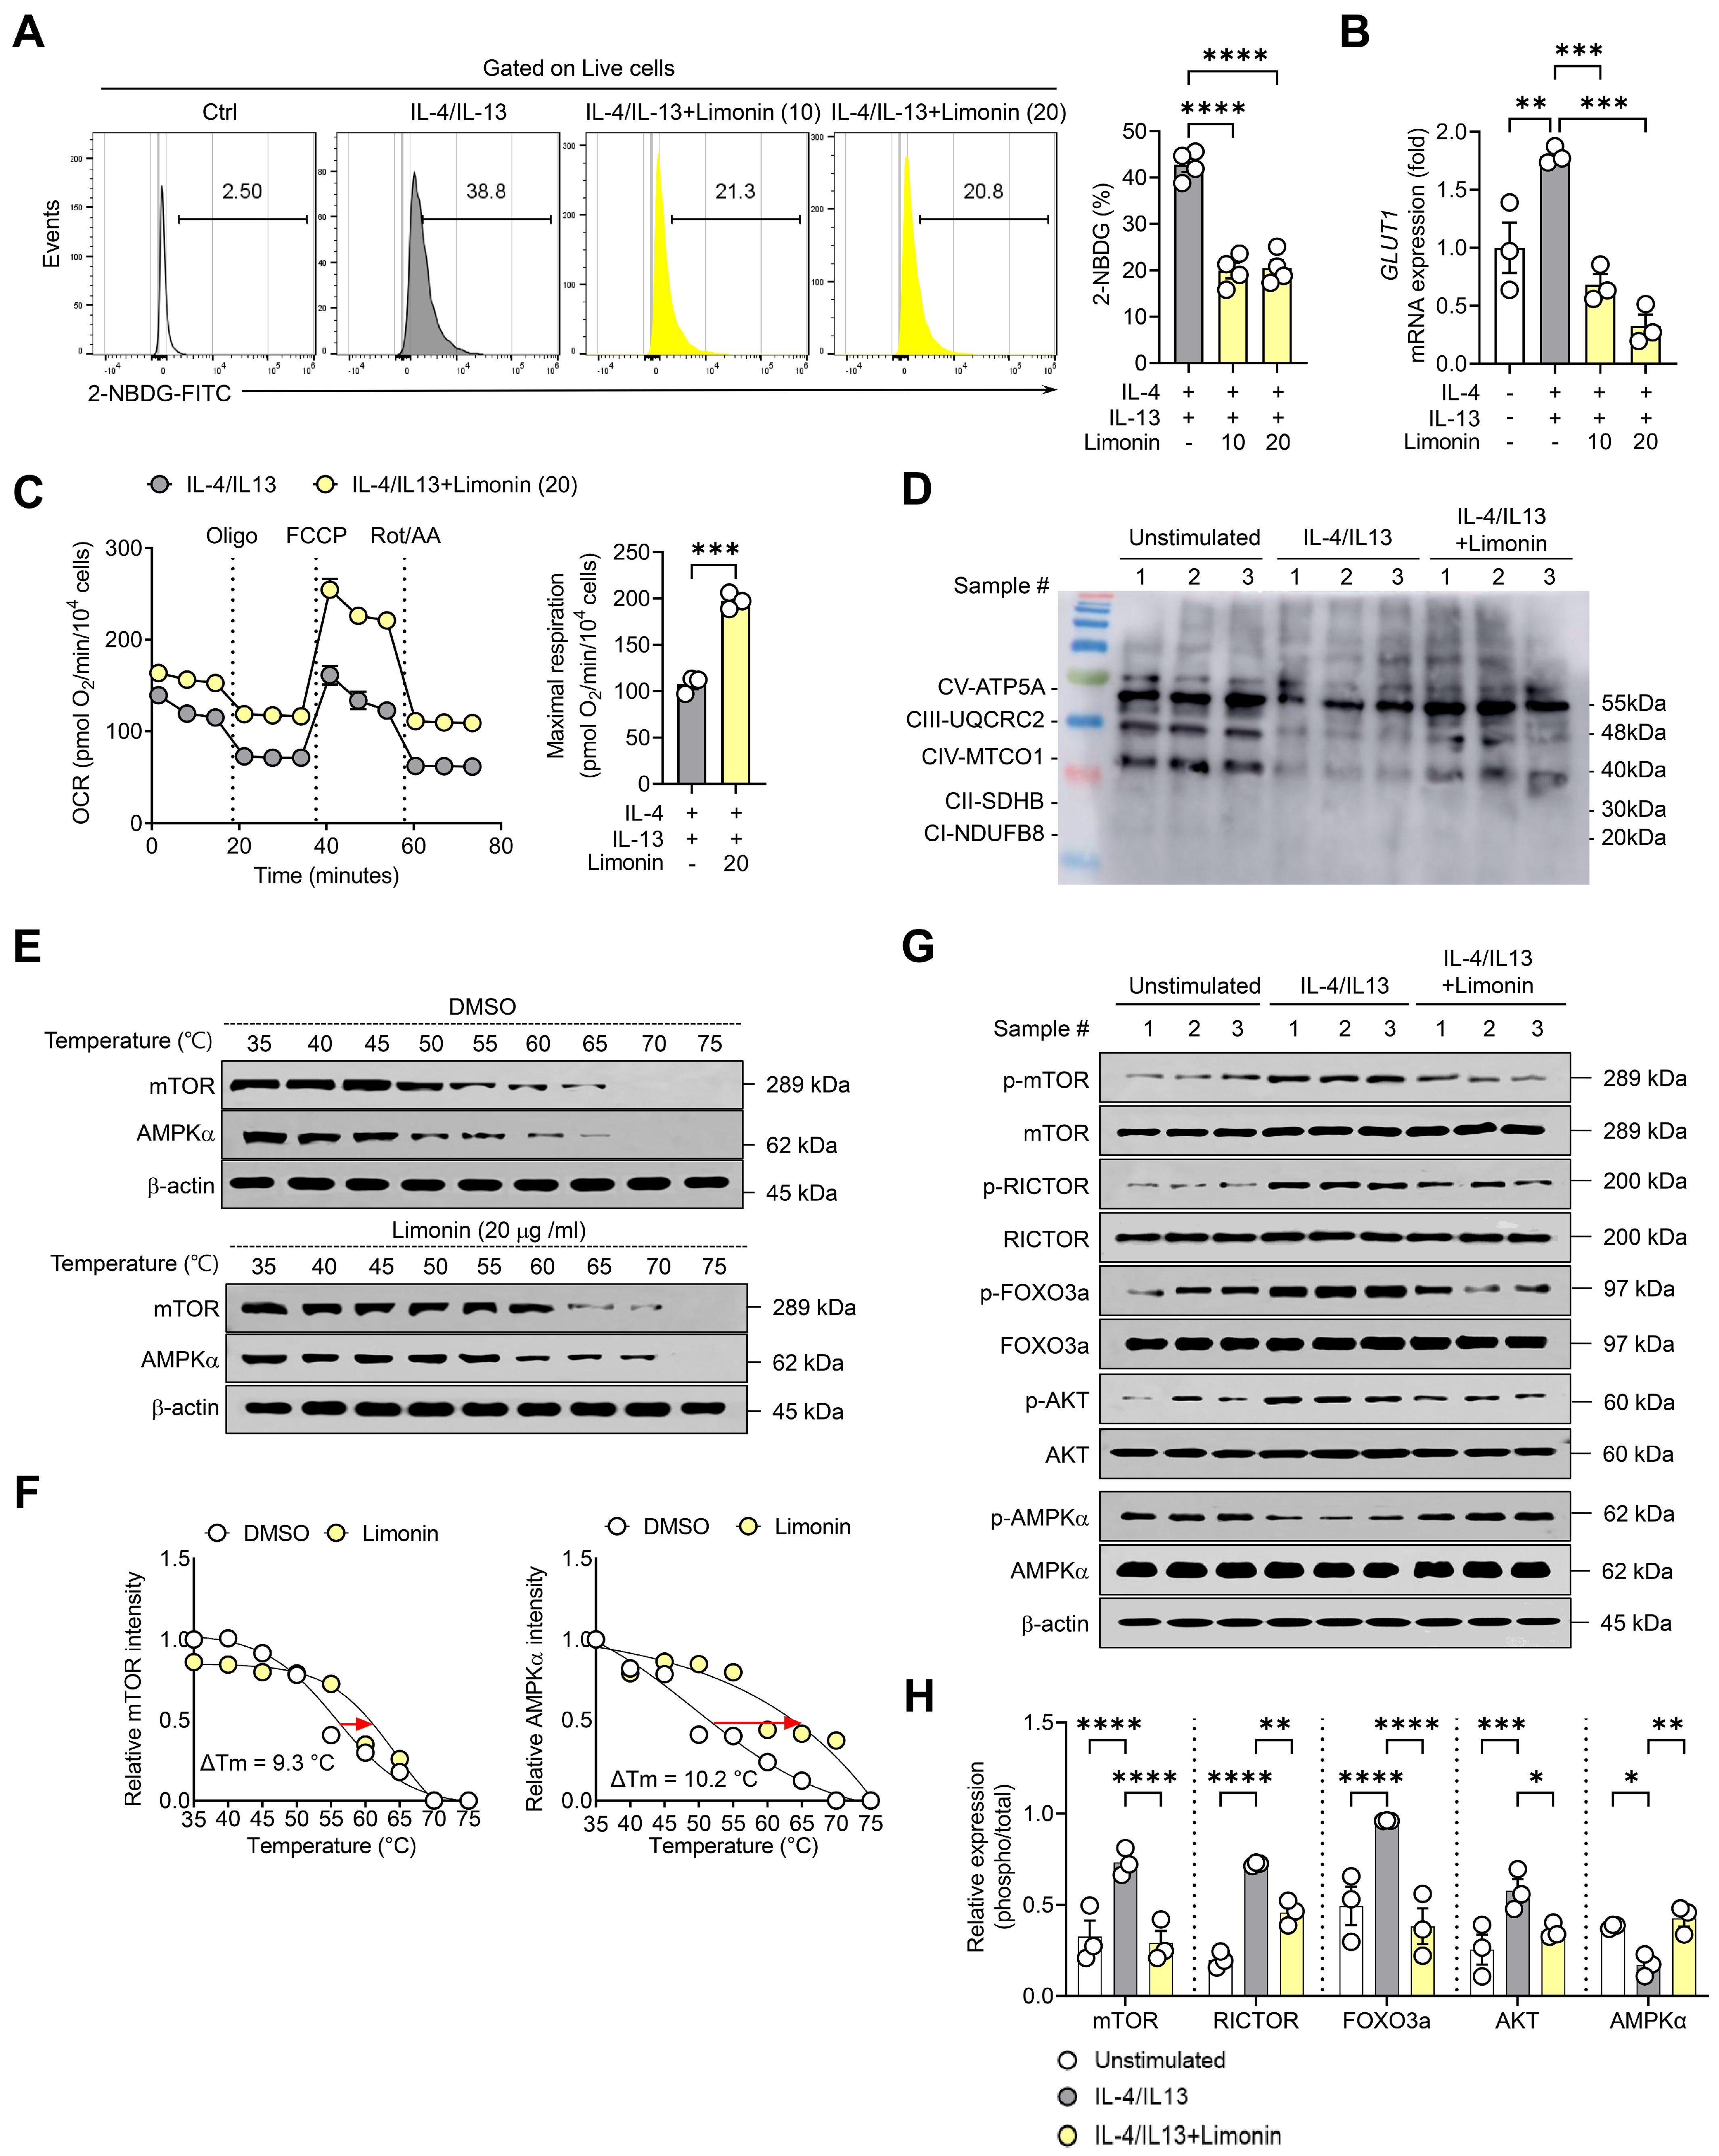
Representative histograms showed a higher proportion of 2-NBDG-positive keratinocytes after IL-4/IL-13 stimulation than in the unstimulated control. Limonin significantly reduced this proportion at both 10 and 20 μg/mL relative to IL-4/IL-13 stimulation alone (Figure 5A). GLUT1 mRNA levels also increased after IL-4/IL-13 stimulation and decreased with increasing limonin concentration (Figure 5B). These findings indicate reduced glucose uptake-associated responses in limonin-treated keratinocytes.
Figure 5.
Limonin increases maximal mitochondrial respiration, reduces glucose uptake-associated responses, and alters AMPK-mTOR-associated phosphorylation in primary human keratinocytes. (A) Representative flow cytometry histograms and quantification of 2-NBDG-positive cells as a percentage of viable cells. Histograms show an unstimulated PBS control, IL-4/IL-13-stimulated cells receiving PBS, and IL-4/IL-13-stimulated cells treated with limonin (10 or 20 μg/mL). The bar graph compares the three cytokine-stimulated groups. (B) Relative GLUT1 mRNA levels in the same four groups, normalized to β-actin. In panels A and B, the final PBS content was 1% (v/v) in all groups. (C) Oxygen consumption rate (OCR) profiles and quantification of maximal respiration in IL-4/IL-13-stimulated cells treated with or without limonin (20 μg/mL). Oligomycin (Oligo) was injected to inhibit ATP synthase, FCCP to elicit maximal respiration, and rotenone plus antimycin A (Rot/AA) to determine non-mitochondrial OCR. OCR values were normalized to the measured cell count in each well and expressed as pmol O2/min per 104 cells. Maximal respiration was calculated for each well by subtracting the non-mitochondrial OCR after Rot/AA injection from the peak OCR after FCCP injection. (D) Representative Western blots of oxidative phosphorylation (OXPHOS) complex subunits in unstimulated cells, IL-4/IL-13-stimulated cells, and IL-4/IL-13-stimulated cells treated with limonin. Densitometric quantification is shown in Figure S2B. (E) Representative cellular thermal shift assay (CETSA) blots for mTOR and AMPKα after treatment with DMSO vehicle or limonin (20 μg/mL) for 1 h. The final DMSO concentration was approximately 1% (v/v) in both groups. The blots are representative of three CETSA experiments. (F) Thermal denaturation curves for mTOR and AMPKα summarizing data from three CETSA experiments. Apparent melting temperature shifts (ΔTm) are indicated. (G) Representative Western blots of phosphorylated mTOR (Ser2448), RICTOR (Thr1135), FOXO3a (Ser253), AKT (Ser473), and AMPKα (Thr172), together with their corresponding total proteins, in the three treatment groups described in panel (D). (H) Densitometric quantification of phosphorylation normalized to the corresponding total protein levels. Each point in the bar graphs in panels (A–C,H) represents one independent donor. Panel (A) included four donors per quantified group (n = 4), and panels (B–D,G,H) included three donors per group (n = 3). Bar graphs show mean ± SEM. Maximal respiration in panel (C) was analyzed using a two-tailed unpaired Student’s t-test. Data in panels (A,B,H) were analyzed using one-way ANOVA followed by Holm–Šídák’s multiple-comparisons test. Brackets indicate the groups compared. * p < 0.05, ** p < 0.01, *** p < 0.001, and **** p < 0.0001. # indicates the sample number.
Oxygen consumption rate (OCR) was measured by Seahorse extracellular flux analysis. Maximal mitochondrial respiration, normalized to the measured cell count in each well, was significantly higher in IL-4/IL-13-stimulated keratinocytes treated with limonin (20 μg/mL) than in cells stimulated with IL-4/IL-13 alone (Figure 5C). To determine whether these changes in mitochondrial respiration were associated with alterations in electron transport chain components, OXPHOS protein expression was examined by Western blot analysis. IL-4/IL-13 stimulation reduced the expression of several OXPHOS complex proteins, whereas limonin treatment partially restored their expression (Figure 5D). Further quantitative analysis revealed that the expression levels of ATP5A (complex V), UQCRC2 (complex III), and MTCO1 (complex IV) were decreased following IL-4/IL-13 stimulation but significantly increased after limonin treatment (Figure S2B). In contrast, SDHB (complex II) and NDUFB8 (complex I) were not detected under the experimental conditions (Figure S2B).
A cellular thermal shift assay (CETSA) was performed to evaluate changes in the thermal stability of mTOR and AMPK proteins following limonin treatment. CETSA assesses changes in the thermal stability of proteins in response to compound treatment and can provide evidence of potential intracellular target engagement [22]. Compared with DMSO-treated controls, limonin-treated cells exhibited altered temperature-dependent thermal stability of mTOR and AMPKα (Figure 5E). Quantitative analysis of the thermal denaturation curves revealed increases in the apparent melting temperatures of mTOR and AMPKα by approximately 9.3 °C and 10.2 °C, respectively, following limonin treatment (Figure 5F).
In primary human keratinocytes, IL-4/IL-13 stimulation increased phosphorylation of mTOR at Ser2448, RICTOR at Thr1135, FOXO3a at Ser253, and AKT at Ser473 and decreased AMPKα Thr172 phosphorylation relative to the unstimulated control. Compared with IL-4/IL-13 stimulation alone, limonin reduced phosphorylation at the mTOR, RICTOR, FOXO3a, and AKT sites and increased AMPKα Thr172 phosphorylation (Figure 5G,H). These results indicate that limonin reduces glucose uptake-associated responses while enhancing mitochondrial respiration and respiratory chain protein expression in human primary keratinocytes exposed to a type 2 inflammatory environment. These metabolic changes were accompanied by altered thermal stability of mTOR and AMPKα and changes in AMPK- and mTOR-associated signaling involving RICTOR, AKT, and FOXO3a.
4. Discussion
Limonin attenuated AD-like skin inflammation, with accompanying changes in mitochondrial fluorescence readouts and AMPK-mTOR-associated phosphorylation. Notably, in human primary keratinocytes exposed to IL-4/IL-13-induced type 2 inflammatory conditions, limonin reduced mitochondrial oxidation-associated signals while enhancing respiratory capacity. These changes were accompanied by increased AMPK phosphorylation and decreased phosphorylation of mTOR, RICTOR, AKT, and FOXO3a. Together, these findings highlight the association between the anti-inflammatory effects of limonin and alterations in mitochondrial function and metabolic signaling under AD-associated type 2 inflammatory conditions.
In the MC903-induced model of AD-like dermatitis, limonin reduced the proportions of neutrophils, macrophages, mast cells, and eosinophils among viable cells isolated from ear skin. Limonin also reduced the proportions of Th1 and Th2 cells among viable CD4+ T cells in ear skin and auricular lymph nodes. MC903 decreased the proportion of Treg cells among viable CD4+ T cells in ear skin and increased it in the draining lymph nodes. Limonin shifted the Treg proportion toward control levels in ear skin and increased it further in the draining lymph nodes. These changes in cell proportions accompanied reduced skin thickening and improved histopathological findings. Absolute cell counts were not determined, so the flow cytometry data cannot establish changes in total inflammatory cell recruitment or systemic immunoregulatory activity. In IL-4/IL-13-stimulated primary human keratinocytes, limonin reduced the mRNA levels of CCL17, CCL22, TSLP, IL25, and IL33. CCL26 mRNA levels showed a downward trend. Because these mediators contribute to immune cell recruitment and the amplification of type 2 inflammation, the transcriptional changes suggest that limonin modulates keratinocyte-derived inflammatory signals.
Limonin reduced the proportion of MitoTracker+MitoSOX+ cells and increased the proportion of MitoTracker+TMRM+ cells. Excessive mitochondrial hydrogen peroxide production has been implicated in AD-associated epidermal inflammation, whereas mitochondria-targeted antioxidant treatment has been reported to alleviate inflammatory skin pathology [11]. In MC903-exposed skin, limonin restored the expression of OXPHOS complex II-, III-, and IV-associated proteins. The changes in respiratory chain protein abundance occurred alongside changes in mitochondrial oxidation- and membrane potential-associated fluorescence.
In human primary keratinocytes, limonin reduced mitochondrial oxidation-associated signals and improved membrane potential-related parameters while decreasing NOX4 and DRP1 mRNA expression and increasing MFN2 expression. NOX4 contributes to ROS generation and intracellular redox signaling [23,24], whereas DRP1 and MFN2 regulate mitochondrial fission and fusion, respectively [25]. Limonin decreased DRP1 mRNA levels and increased MFN2 mRNA levels in cytokine-stimulated keratinocytes. DRP1 and MFN2 protein abundance and mitochondrial fission and fusion were not assessed. Previous studies have shown that keratinocyte-derived ROS promote TSLP, IL-25, and IL-33 expression [26], whereas targeting mitochondrial oxidative stress attenuates AD-associated inflammation [11]. Consistent with these findings, the simultaneous reduction in mitochondrial oxidation-associated signals and epithelial-derived inflammatory mediators supports an association between mitochondrial redox status and keratinocyte inflammatory responses under type 2 cytokine stimulation.
An important metabolic feature of this study was the increase in maximal mitochondrial respiration despite reduced mitochondrial oxidation-associated signals in IL-4/IL-13-stimulated keratinocytes. Mitochondrial ROS production depends on electron transport chain redox status, electron supply, and membrane potential rather than oxygen consumption alone [10,27]. Thus, enhanced respiratory capacity does not necessarily increase oxidative stress. The concurrent recovery of OXPHOS-associated protein expression further suggests improved mitochondrial respiratory function without a corresponding increase in ROS-associated signals. In limonin-treated keratinocytes, the lower proportion of 2-NBDG-positive cells and lower GLUT1 mRNA levels were observed alongside increased maximal mitochondrial respiration. The 2-NBDG signal may reflect changes in analogue binding or uptake independently of GLUT1-mediated glucose transport, as reported in other cell types [28]. The increase in maximal respiration coincided with higher levels of selected OXPHOS subunits and could also reflect differences in the relative contributions of available respiratory substrates. Glycolytic flux, GLUT1 protein abundance, glucose transporter activity, and substrate-specific oxidation were not measured. Whether glucose-derived carbon was redirected toward mitochondrial oxidation therefore remains undetermined.
These findings should be considered in the context of metabolic heterogeneity in AD. Leman et al. reported increased mitochondrial activity and fatty acid oxidation-associated responses in nonlesional AD skin [12], indicating that mitochondrial metabolism may vary according to tissue state and inflammatory conditions. In the present study, enhanced respiratory capacity was accompanied by reduced mitochondrial oxidation-associated signals and inflammatory mediator expression, emphasizing the importance of evaluating respiratory function alongside redox status rather than interpreting mitochondrial activity solely by its direction of change. The mitochondrial responses to limonin were accompanied by modulation of AMPK-mTOR-related signaling. AMPK coordinates metabolic adaptation and mitochondrial homeostasis in response to cellular energy demands [29]. In both MC903-exposed mouse skin and IL-4/IL-13-stimulated human primary keratinocytes, limonin increased AMPK phosphorylation while decreasing mTOR phosphorylation. These consistent changes, together with reduced mitochondrial oxidation-associated signals and improved respiratory parameters, suggest that AMPK-mTOR-associated signaling is linked to the mitochondrial metabolic response to limonin under AD-associated inflammatory conditions.
Limonin reduced AKT Ser473 phosphorylation in both MC903-treated ear skin and IL-4/IL-13-stimulated primary human keratinocytes. Because mTORC2 can phosphorylate AKT at Ser473, this decrease is consistent with altered mTORC2-associated signaling [30,31]. Previous work has implicated RICTOR/mTORC2 in mitochondrial stress responses in keratinocytes [32]. RICTOR Thr1135 phosphorylation also decreased after limonin treatment. Thr1135 can be phosphorylated by S6K1, a downstream effector of mTORC1, and a change at this site alone is insufficient to infer a change in mTORC2 kinase activity [33]. FOXO3a Ser253 phosphorylation decreased alongside AKT Ser473 phosphorylation. CETSA showed increased thermal stability of mTOR and AMPKα after limonin treatment. In intact cells, such thermal shifts may also reflect changes in protein–protein interactions, post-translational modifications, or interactions with endogenous metabolites [34]. The observed shifts alone cannot establish direct binding, identify a binding site, or demonstrate that mTOR or AMPKα is a functionally relevant direct target of limonin.
Lee et al. reported that limonin reduced mitochondrial ROS production and selected respiratory parameters in a TPA-induced model of psoriasis-like dermatitis, alongside AMPK activation and reduced mTORC1-associated signaling [16]. In the present study, limonin increased maximal respiration and reduced the proportion of MitoTracker+MitoSOX+ cells in IL-4/IL-13-stimulated primary human keratinocytes. The two studies differ in both inflammatory stimulus and experimental system, and which of these differences accounts for the respiratory responses remains unclear.
This study has several limitations. Whether the observed mitochondrial changes contributed to the anti-inflammatory effects of limonin or depended on AMPK or mTORC2 signaling was not directly tested. MitoSOX Red and TMRM provided fluorescence readouts associated with oxidation and membrane potential, respectively, and the Seahorse assay measured oxygen consumption. These assays characterize selected mitochondrial responses, and restoration of mitochondrial redox homeostasis remains unestablished. The animal study used only female mice, with five mice per group and no formal a priori sample size calculation. The small group sizes limit the precision of the estimated effects and may have reduced our ability to detect modest effects across the outcomes examined. The absence of a limonin-only group prevented assessment of its effects under basal conditions, and the absence of a reference treatment prevented comparison with an established therapy. The short-term MC903 model also leaves open whether the findings extend to chronic disease, pruritus, or skin barrier function.
In a D-galactose-induced mouse model of skin aging, D-limonene reduced proinflammatory cytokine levels and malondialdehyde, a marker of lipid peroxidation [35]. In the present study, we administered limonin intraperitoneally to test whether a defined systemic dosing regimen could attenuate MC903-induced skin inflammation. The observed effects support further investigation of limonin as a plant-derived compound for AD-related skin inflammation. Its pharmacokinetics, skin penetration, and local bioavailability after topical administration remain to be established. Future studies should optimize the topical formulation and dose and evaluate local anti-inflammatory efficacy, safety, and tolerability. Studies using skin samples from patients with AD could assess whether the responses observed in primary human keratinocytes also occur in human AD skin.
5. Conclusions
Intraperitoneally administered limonin attenuated MC903-induced atopic dermatitis-like skin inflammation in mice. In IL-4/IL-13-stimulated primary human keratinocytes, limonin reduced inflammatory mediator expression, decreased the proportion of MitoTracker+MitoSOX+ cells, and increased maximal mitochondrial respiration. These responses were accompanied by increased AMPKα Thr172 phosphorylation and decreased AKT Ser473 phosphorylation. The efficacy and tolerability of topical limonin remain to be determined.
Supplementary Materials
The following supporting information can be downloaded at: https://www.mdpi.com/article/10.3390/antiox15111500/s1, Figure S1: Inflammatory cell populations in skin-draining lymph nodes; Figure S2: NRF2 mRNA expression and OXPHOS protein quantification in human primary keratinocytes; Figure S3: Uncropped Western blot images and corresponding molecular weight markers; Figure S4: Representative flow cytometry gating strategies; Table S1: Reagents, kits, and consumables used in this study; Table S2: Primer sequences for real-time PCR analysis; Table S3: Antibodies used for Western blot analysis; Table S4: Antibodies used for flow cytometric analysis.
Author Contributions
H.E.K.: Formal analysis, Data curation, writing—original draft preparation. E.K.: writing—review and editing, Funding acquisition. J.K.C.: Supervision, Conceptualization, Project administration, writing—review and editing, Funding acquisition. All authors have read and agreed to the published version of the manuscript.
Funding
This study was supported by the National Research Foundation of Korea (NRF) grant funded by the Korea government (MSIT) (RS-2025-23524668, RS-2026-25481980); the Korea Health Technology R&D Project through the Korea Health Industry Development Institute funded by the Ministry of Health & Welfare, Republic of Korea (HR22C1832). This research was supported by Culture, Sports and Tourism R&D Program through the Korea Creative Content Agency grant funded by the Ministry of Culture, Sports and Tourism in 2026 (Project Name: Development of Standardization Technology for Personal Exercise Records (PSR), Project Number: RS-2026-25546728).
Institutional Review Board Statement
The animal study protocol was approved by the Institutional Animal Care and Use Committee of Jeonbuk National University (approval no. 2026-08-051-001). The study involving human skin specimens was conducted in accordance with the Declaration of Helsinki, and approved by the Institutional Review Board of Jeonbuk National University Hospital (approval no. 2022-05-002-010).
Informed Consent Statement
Informed consent was obtained from all subjects involved in the study.
Data Availability Statement
The original contributions presented in this study are included in the article/Supplementary Materials. Further inquiries can be directed to the corresponding authors.
Acknowledgments
The authors gratefully acknowledge the technical support provided by the Center for University-wide Research Facilities (CURF) at Jeonbuk National University. During manuscript preparation, the authors used ChatGPT (OpenAI, GPT-6) exclusively for English-language editing and to improve the clarity of the original text. All AI-assisted revisions were reviewed and verified by the authors, who take full responsibility for the content of this publication.
Conflicts of Interest
The authors declare no conflicts of interest.
Abbreviations
The following abbreviations are used in this manuscript:
| 2-NBDG | 2-(N-(7-Nitrobenz-2-oxa-1,3-diazol-4-yl)amino)-2-deoxyglucose |
| AD | Atopic dermatitis |
| AKT | Protein kinase B |
| AMPK | AMP-activated protein kinase |
| ANOVA | Analysis of variance |
| ATP | Adenosine triphosphate |
| BSA | Bovine serum albumin |
| CCL17 | C–C motif chemokine ligand 17 |
| CCL22 | C–C motif chemokine ligand 22 |
| CCL26 | C–C motif chemokine ligand 26 |
| CETSA | Cellular thermal shift assay |
| DDIT4 | DNA damage-inducible transcript 4 |
| DMSO | Dimethyl sulfoxide |
| DRP1 | Dynamin-related protein 1 |
| FCCP | Carbonyl cyanide-p-trifluoromethoxyphenylhydrazone |
| FOXO3a | Forkhead box O3a |
| GLUT1 | Glucose transporter 1 |
| H&E | Hematoxylin and eosin |
| HRP | Horseradish peroxidase |
| IFN-γ | Interferon gamma |
| IL | Interleukin |
| KSFM | Keratinocyte serum-free medium |
| MC903 | Calcipotriol |
| MFN2 | Mitofusin 2 |
| MTT | 3-(4,5-Dimethylthiazol-2-yl)-2,5-diphenyltetrazolium bromide |
| mTOR | Mechanistic target of rapamycin |
| mTORC1 | Mechanistic target of rapamycin complex 1 |
| mTORC2 | Mechanistic target of rapamycin complex 2 |
| NOX4 | NADPH oxidase 4 |
| NRF2 | Nuclear factor erythroid 2-related factor 2 |
| OCR | Oxygen consumption rate |
| Oligo | Oligomycin |
| OXPHOS | Oxidative phosphorylation |
| PBMCs | Peripheral blood mononuclear cells |
| PBS | Phosphate-buffered saline |
| PMA | Phorbol 12-myristate 13-acetate |
| qPCR | Quantitative real-time polymerase chain reaction |
| RICTOR | Rapamycin-insensitive companion of mTOR |
| ROS | Reactive oxygen species |
| Rot/AA | Rotenone and antimycin A |
| SDS-PAGE | Sodium dodecyl sulfate–polyacrylamide gel electrophoresis |
| SEM | Standard error of the mean |
| TBST | Tris-buffered saline containing Tween-20 |
| Th1 | T helper 1 cells |
| Th2 | T helper 2 cells |
| TMRM | Tetramethylrhodamine methyl ester |
| TPA | 12-O-Tetradecanoylphorbol-13-acetate |
| Treg | Regulatory T cells |
| TSLP | Thymic stromal lymphopoietin |
References
- Facheris, P.; Jeffery, J.; Del Duca, E.; Guttman-Yassky, E. The translational revolution in atopic dermatitis: The paradigm shift from pathogenesis to treatment. Cell Mol. Immunol. 2023, 20, 448–474. [Google Scholar] [CrossRef] [Scilit]
- Criado, P.R.; Miot, H.A.; Bueno-Filho, R.; Ianhez, M.; Criado, R.F.J.; de Castro, C.C.S. Update on the pathogenesis of atopic dermatitis. An. Bras. Dermatol. 2024, 99, 895–915. [Google Scholar] [CrossRef] [Scilit]
- Torres, T.; Mendes-Bastos, P.; Cruz, M.J.; Duarte, B.; Filipe, P.; Lopes, M.J.P.; Goncalo, M. Interleukin-4 and Atopic Dermatitis: Why Does it Matter? A Narrative Review. Dermatol. Ther. 2025, 15, 579–597. [Google Scholar] [CrossRef] [Scilit]
- Blauvelt, A.; de Bruin-Weller, M.; Gooderham, M.; Cather, J.C.; Weisman, J.; Pariser, D.; Simpson, E.L.; Papp, K.A.; Hong, H.C.; Rubel, D.; et al. Long-term management of moderate-to-severe atopic dermatitis with dupilumab and concomitant topical corticosteroids (LIBERTY AD CHRONOS): A 1-year, randomised, double-blinded, placebo-controlled, phase 3 trial. Lancet 2017, 389, 2287–2303. [Google Scholar] [CrossRef] [Scilit]
- Simpson, E.L.; Bieber, T.; Guttman-Yassky, E.; Beck, L.A.; Blauvelt, A.; Cork, M.J.; Silverberg, J.I.; Deleuran, M.; Kataoka, Y.; Lacour, J.P.; et al. Two Phase 3 Trials of Dupilumab versus Placebo in Atopic Dermatitis. N. Engl. J. Med. 2016, 375, 2335–2348. [Google Scholar] [CrossRef] [Scilit]
- de Bruin-Weller, M.; Thaci, D.; Smith, C.H.; Reich, K.; Cork, M.J.; Radin, A.; Zhang, Q.; Akinlade, B.; Gadkari, A.; Eckert, L.; et al. Dupilumab with concomitant topical corticosteroid treatment in adults with atopic dermatitis with an inadequate response or intolerance to ciclosporin A or when this treatment is medically inadvisable: A placebo-controlled, randomized phase III clinical trial (LIBERTY AD CAFE). Br. J. Dermatol. 2018, 178, 1083–1101. [Google Scholar] [CrossRef] [Scilit]
- Sreedhar, A.; Aguilera-Aguirre, L.; Singh, K.K. Mitochondria in skin health, aging, and disease. Cell Death Dis. 2020, 11, 444. [Google Scholar] [CrossRef] [Scilit]
- Ahmad Jamil, H.; Abdul Karim, N. Mitochondrial homeostasis: Exploring their impact on skin disease pathogenesis. BioMed. Pharmacother. 2025, 189, 118349. [Google Scholar] [CrossRef] [Scilit]
- Kadenbach, B. Complex IV—The regulatory center of mitochondrial oxidative phosphorylation. Mitochondrion 2021, 58, 296–302. [Google Scholar] [CrossRef] [Scilit]
- Murphy, M.P. How mitochondria produce reactive oxygen species. Biochem. J. 2009, 417, 1–13. [Google Scholar] [CrossRef] [Scilit]
- Minzaghi, D.; Pavel, P.; Kremslehner, C.; Gruber, F.; Oberreiter, S.; Hagenbuchner, J.; Del Frari, B.; Blunder, S.; Gruber, R.; Dubrac, S. Excessive Production of Hydrogen Peroxide in Mitochondria Contributes to Atopic Dermatitis. J. Investig. Dermatol. 2023, 143, 1906–1918 e1908. [Google Scholar] [CrossRef] [Scilit]
- Leman, G.; Pavel, P.; Hermann, M.; Crumrine, D.; Elias, P.M.; Minzaghi, D.; Goudouneche, D.; Roshardt Prieto, N.M.; Cavinato, M.; Wanner, A.; et al. Mitochondrial Activity Is Upregulated in Nonlesional Atopic Dermatitis and Amenable to Therapeutic Intervention. J. Investig. Dermatol. 2022, 142, 2623–2634 e2612. [Google Scholar] [CrossRef] [Scilit]
- Koch, M.; Kockmann, T.; Rodriguez, E.; Wehkamp, U.; Hiebert, P.; Ben-Yehuda Greenwald, M.; Stolzl, D.; Beer, H.D.; Tschachler, E.; Weidinger, S.; et al. Quantitative Proteomics Identifies Reduced NRF2 Activity and Mitochondrial Dysfunction in Atopic Dermatitis. J. Investig. Dermatol. 2023, 143, 220–231.e227. [Google Scholar] [CrossRef] [Scilit]
- Kim, H.E.; Lee, J.Y.; Yoo, D.H.; Park, H.H.; Choi, E.J.; Nam, K.H.; Park, J.; Choi, J.K. Imidazole propionate ameliorates atopic dermatitis-like skin lesions by inhibiting mitochondrial ROS and mTORC2. Front. Immunol. 2024, 15, 1324026. [Google Scholar] [CrossRef] [Scilit]
- Li, J.; Li, Z.; Wang, P.; Jiang, Z. Limonin alleviates pyroptosis and inflammatory responses in cardiomyocytes of myocardial ischemia-reperfusion mice by inhibiting the caspase-3/GSDME pathway. Front. Immunol. 2026, 17, 1704424. [Google Scholar] [CrossRef] [Scilit]
- Lee, S.T.; Lee, J.Y.; Kim, H.E.; Park, J.Y.; Choi, J.K. Limonin Exhibits Anti-Inflammatory Effects by Inhibiting mTORC1 and Mitochondrial Reactive Oxygen Species in Psoriatic-like Skin Inflammation. Antioxidants 2024, 13, 1541. [Google Scholar] [CrossRef] [Scilit]
- Li, Q.; Li, F.; Wang, T. Limonin alleviates imiquimod-induced psoriasis-like skin inflammation in mice model by downregulating inflammatory responses. Naunyn Schmiedebergs Arch. Pharmacol. 2025, 398, 6901–6914. [Google Scholar] [CrossRef] [Scilit]
- Panda, S.P.; Kesharwani, A.; Singh, M.; Kumar, S.; Mayank; Mallick, S.P.; Guru, A. Limonin (LM) and its derivatives: Unveiling the neuroprotective and anti-inflammatory potential of LM and V-A-4 in the management of Alzheimer’s disease and Parkinson’s disease. Fitoterapia 2024, 178, 106173. [Google Scholar] [CrossRef] [Scilit]
- Liang, H.; Liu, G.; Fan, Q.; Nie, Z.; Xie, S.; Zhang, R. Limonin, a novel AMPK activator, protects against LPS-induced acute lung injury. Int. Immunopharmacol. 2023, 122, 110678. [Google Scholar] [CrossRef] [Scilit]
- Li, M.; Hener, P.; Zhang, Z.; Kato, S.; Metzger, D.; Chambon, P. Topical vitamin D3 and low-calcemic analogs induce thymic stromal lymphopoietin in mouse keratinocytes and trigger an atopic dermatitis. Proc. Natl. Acad. Sci. USA 2006, 103, 11736–11741. [Google Scholar] [CrossRef] [Scilit]
- Naidoo, K.; Jagot, F.; van den Elsen, L.; Pellefigues, C.; Jones, A.; Luo, H.; Johnston, K.; Painter, G.; Roediger, B.; Lee, J.; et al. Eosinophils Determine Dermal Thickening and Water Loss in an MC903 Model of Atopic Dermatitis. J. Investig. Dermatol. 2018, 138, 2606–2616. [Google Scholar] [CrossRef] [Scilit]
- Martinez Molina, D.; Jafari, R.; Ignatushchenko, M.; Seki, T.; Larsson, E.A.; Dan, C.; Sreekumar, L.; Cao, Y.; Nordlund, P. Monitoring Drug Target Engagement in Cells and Tissues Using the Cellular Thermal Shift Assay. Science 2013, 341, 84–87. [Google Scholar] [CrossRef] [Scilit]
- Kracun, D.; Lopes, L.R.; Cifuentes-Pagano, E.; Pagano, P.J. NADPH oxidases: Redox regulation of cell homeostasis and disease. Physiol. Rev. 2025, 105, 1291–1428. [Google Scholar] [CrossRef] [Scilit]
- Nisimoto, Y.; Diebold, B.A.; Cosentino-Gomes, D.; Lambeth, J.D. Nox4: A hydrogen peroxide-generating oxygen sensor. Biochemistry 2014, 53, 5111–5120. [Google Scholar] [CrossRef] [Scilit]
- Detmer, S.A.; Chan, D.C. Functions and dysfunctions of mitochondrial dynamics. Nat. Rev. Mol. Cell Biol. 2007, 8, 870–879. [Google Scholar] [CrossRef] [Scilit]
- Choi, D.I.; Park, J.H.; Choi, J.Y.; Piao, M.; Suh, M.S.; Lee, J.B.; Yun, S.J.; Lee, S.C. Keratinocytes-Derived Reactive Oxygen Species Play an Active Role to Induce Type 2 Inflammation of the Skin: A Pathogenic Role of Reactive Oxygen Species at the Early Phase of Atopic Dermatitis. Ann. Dermatol. 2021, 33, 26–36. [Google Scholar] [CrossRef] [Scilit]
- Sies, H.; Belousov, V.V.; Chandel, N.S.; Davies, M.J.; Jones, D.P.; Mann, G.E.; Murphy, M.P.; Yamamoto, M.; Winterbourn, C. Defining roles of specific reactive oxygen species (ROS) in cell biology and physiology. Nat. Rev. Mol. Cell Biol. 2022, 23, 499–515. [Google Scholar] [CrossRef] [Scilit]
- Hamilton, K.E.; Bouwer, M.F.; Louters, L.L.; Looyenga, B.D. Cellular binding and uptake of fluorescent glucose analogs 2-NBDG and 6-NBDG occurs independent of membrane glucose transporters. Biochimie 2021, 190, 1–11. [Google Scholar] [CrossRef] [Scilit]
- Herzig, S.; Shaw, R.J. AMPK: Guardian of metabolism and mitochondrial homeostasis. Nat. Rev. Mol. Cell Biol. 2018, 19, 121–135. [Google Scholar] [CrossRef] [Scilit]
- Sarbassov, D.D.; Guertin, D.A.; Ali, S.M.; Sabatini, D.M. Phosphorylation and Regulation of Akt/PKB by the Rictor-mTOR Complex. Science 2005, 307, 1098–1101. [Google Scholar] [CrossRef] [Scilit]
- Jacinto, E.; Facchinetti, V.; Liu, D.; Soto, N.; Wei, S.; Jung, S.Y.; Huang, Q.; Qin, J.; Su, B. SIN1/MIP1 maintains rictor-mTOR complex integrity and regulates Akt phosphorylation and substrate specificity. Cell 2006, 127, 125–137. [Google Scholar] [CrossRef] [Scilit]
- Tassone, B.; Saoncella, S.; Neri, F.; Ala, U.; Brusa, D.; Magnuson, M.A.; Provero, P.; Oliviero, S.; Riganti, C.; Calautti, E. Rictor/mTORC2 deficiency enhances keratinocyte stress tolerance via mitohormesis. Cell Death Differ. 2017, 24, 731–746. [Google Scholar] [CrossRef] [Scilit]
- Dibble, C.C.; Asara, J.M.; Manning, B.D. Characterization of Rictor phosphorylation sites reveals direct regulation of mTOR complex 2 by S6K1. Mol. Cell Biol. 2009, 29, 5657–5670. [Google Scholar] [CrossRef] [Scilit]
- Mateus, A.; Maatta, T.A.; Savitski, M.M. Thermal proteome profiling: Unbiased assessment of protein state through heat-induced stability changes. Proteome Sci. 2017, 15, 13. [Google Scholar] [CrossRef] [Scilit]
- AlBairmani, R.J.H.; Shihab, E.M.; Ridha-Salman, H.; Kadhim, H.M.; Mohammed, R.M.; Shahooth, S.S.; Abdalah, M.E.; Hameed, Z.E.; Hajwal, S.K.; Albasri, O.W.; et al. D-limonene attenuates D-galactose-induced skin aging mouse model. J. Mol. Histol. 2025, 56, 364. [Google Scholar] [CrossRef] [Scilit]
Disclaimer/Publisher’s Note: The statements, opinions and data contained in all publications are solely those of the individual author(s) and contributor(s) and not of MDPI and/or the editor(s). MDPI and/or the editor(s) disclaim responsibility for any injury to people or property resulting from any ideas, methods, instructions or products referred to in the content. |
© 2026 by the authors. Licensee MDPI, Basel, Switzerland. This article is an open access article distributed under the terms and conditions of the Creative Commons Attribution (CC BY) license.