


Abstract
Hedgehog interacting protein (Hhip) promotes tubular senescence and tubulopathy in diabetic kidney disease (DKD), but the underlying mechanisms remain incompletely understood. We investigated whether the senolytics (Dasatinib, D/Quercetin, Q) attenuate Hhip-associated renal proximal tubular cell (RPTC) senescence and tubulopathy. Murine diabetes was induced by low-dose streptozotocin in male RPTC-specific Hhip transgenic (HhipRPTC-Tg) and non-Tg mice, with or without D/Q treatment (D, 5 mg/kg, and Q, 50 mg/kg, by oral gavage for 3 consecutive days every 2 weeks). Primary RPTCs and immortalized rat RPTCs (IRPTCs) were used for in vitro studies. Diabetic mice developed RPTC tubulopathy, manifested by increased tubular senescence and oxidative stress, which was further exacerbated in diabetic HhipRPTC-Tg mice but significantly attenuated by D/Q treatment. D/Q improved mitochondrial network morphologic integrity in IRPTCs. Mechanistically, PTEN-induced kinase 1 (Pink1) expression increased in diabetes, whereas optineurin (Optn) expression, although increased relative to non-diabetic controls, was lower in diabetic HhipRPTC-Tg than diabetic non-Tg mice. Senolytics (D/Q) restored both Pink1 and Optn expression levels in RPTCs in vivo and in vitro, while also improving mitochondrial morphology in vitro. These findings suggest that senolytics (D/Q) attenuate Hhip-mediated RPTC senescence and tubulopathy in DKD, potentially involving altered Pink1–Optn-mediated mitophagy, which warrants further validation.
1. Introduction
Diabetic kidney disease (DKD) is one of the most costly and devastating consequences of diabetes, representing ~40% of all cases of kidney failure worldwide [1]. DKD is a heterogeneous disease and adversely impacts all renal cell types, including endothelial cells, renal proximal tubular cells (RPTCs), mesangial cells and podocytes [2,3,4]. Within the kidney, RPTCs are responsible for filtering glucose and resorbing metabolites [2,3,4]. To date, RPTC injury induced by DKD remains a clinically significant challenge that lacks mechanistic understanding.
Hyperglycemia is a key stress that alters cellular metabolism in RPTCs [2,3,4,5,6,7]. Phenotypically, under a high-glucose milieu, stressed RPTCs undergo cell cycle arrest, leading to cellular senescence and the active production of a senescence-associated secretory phenotype. In parallel, hyperglycemia induces early adaptive cellular hypertrophy and reorganization of the actin cytoskeleton in RPTCs. This, in turn, contributes to further metabolic impairments, including later mitochondrial dysfunction [5,8,9,10].
RPTCs possess the second-highest mitochondrial density in the body [10]. Mitochondrial dysfunction contributes to increased oxidative stress and activation of inflammatory pathways [2,3,4,10]. Through a self-perpetuating vicious cycle, senescent cells amplify inflammation, fibrosis, and apoptosis, ultimately driving progressive kidney functional decline [2,3,6,7]. Indeed, tubulopathy, characterized by senescence, fibrosis, and apoptosis, has been recognized as a hallmark of kidney dysfunction in DKD [2,3,5,6,7].
PTEN-induced kinase 1 (Pink1)-optineurin (Optn)-dependent mitophagy is a selective autophagic process that removes damaged mitochondria to preserve mitochondrial network integrity and cellular redox homeostasis [11,12,13]. Following mitochondrial injury, Pink1 (a central initiator of mitophagy [14]) stabilization activates the Pink1/Parkin pathway and promotes the recruitment of Optn (a critical selective autophagy receptor [15]) to damaged mitochondria, thereby facilitating autophagosome formation and mitochondrial degradation [14,16,17].
Senolytics, an emerging class of agents, selectively induce death of senescent cells that naturally accumulate with aging or with metabolic diseases including diabetes and obesity [18,19,20]. Notably, combining two senolytics, Dasatinib (D) and Quercetin (Q) (D/Q), may hold promise for specific targeting and clearing out senescent cells, thereby restoring the function of tissues or organisms in diabetic murine models [1,18,19,20,21]. Thus, senolytics has been proposed as a new direction for DKD management [1,5,18,19,20,21,22]. Relevant to RPTC remodeling in DKD, the effects of senolytics (D/Q) on mitochondrial fatty acid β-oxidation during RPTC remodeling have been investigated in db/db mice [22]. However, differences between the in vivo (glucolipotoxic) environment and the in vitro (high-glucose) conditions complicate the data interpretation and alignment of the findings across experimental settings [22].
Hhip, a molecule in the hedgehog pathway, encodes a 700-amino-acid protein attached to the cell membrane via a glycosylphosphatidylinositol anchor [23,24,25]. Hhip plays a key role in organ development [23], and its dysregulation has been implicated in various diseases, including cancer [26], pancreatitis [27], chronic obstructive pulmonary disease [28], and kidney disease [29,30,31,32,33]. We previously demonstrated that high glucose and oxidative stress stimulate Hhip expression [29,30,32,33], which may contribute to RPTC senescence in DKD [29,30,32]. However, it is unknown whether excessive tubular Hhip in RPTCs in HhipRPTC-transgenic (Tg) mice overexpressing Hhip, specifically in RPTCs [29,32], might functionally connect to tubular mitochondrial abnormalities in DKD [10,34,35,36], a main focus for the current study.
In this study, focusing on one important factor, hyperglycemia in vivo or high glucose in vitro, we hypothesized that excessive Hhip may promote RPTC senescence and mitochondrial abnormalities, potentially involving impaired Pink1–Optn-dependent mitophagy and contributing to DKD-induced tubulopathy. In contrast, senolytic (D/Q) treatment prevents this process.
2. Materials and Methods
2.1. Animal Models
We used our previously generated HhipRPTC-Tg mouse line (C57BL/6J) [29,32], which overexpresses mouse Hhip [Myc-Hhip (NM_020259.4, 494-2596bp, 700 aa)-Flag] in RPTCs driven by the kidney-specific, androgen-regulated protein (KAP) promoter, as described previously [37]. Thus, the experiments in vivo were entirely performed in male mice. In addition, under normal conditions, even though HhipRPTC-Tg (vs. non-Tg) mice in adulthood displayed higher levels of senescence in their RPTCs, HhipRPTC-Tg mice are grossly indistinguishable from non-Tg mice, including blood glucose and measured glomerular filtration rate (GFR) [32]. These features are ideal for this study regarding the impact of high-glucose milieu on RPTC remodeling, with or without Hhip overexpression in RPTCs.
Low-dose streptozotocin (LDSTZ) [31,32] was used to induce diabetes in both HhipRPTC-Tg mice and non-Tg littermates at 10 weeks of age. Briefly, mice received intraperitoneal (i.p) injections of LDSTZ [~45–50 mg per kg body weight (BW) daily for 5 consecutive days] and were euthanized at 24 weeks of age. Blood glucose levels were measured weekly with an Accu-Chek Performa glucometer (Roche Diagnostics, Laval, QC, Canada) [31,32]. Mice with blood glucose levels below 16 mmol/L (measured 72 h following the last LDSTZ injection) were excluded from analysis (non-Tg, n = 2; HhipRPTC-Tg, n = 3).
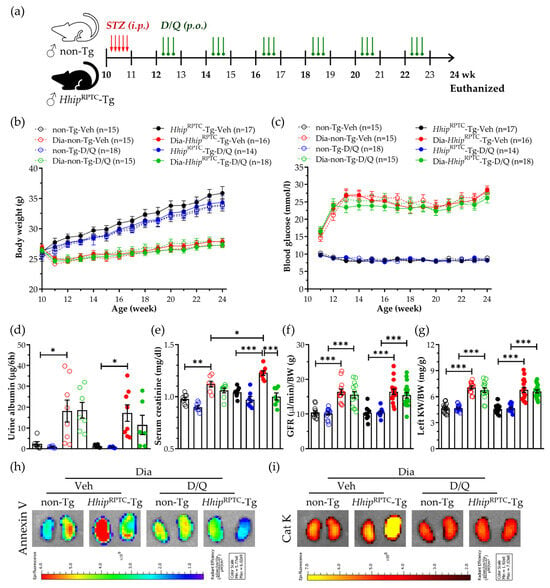
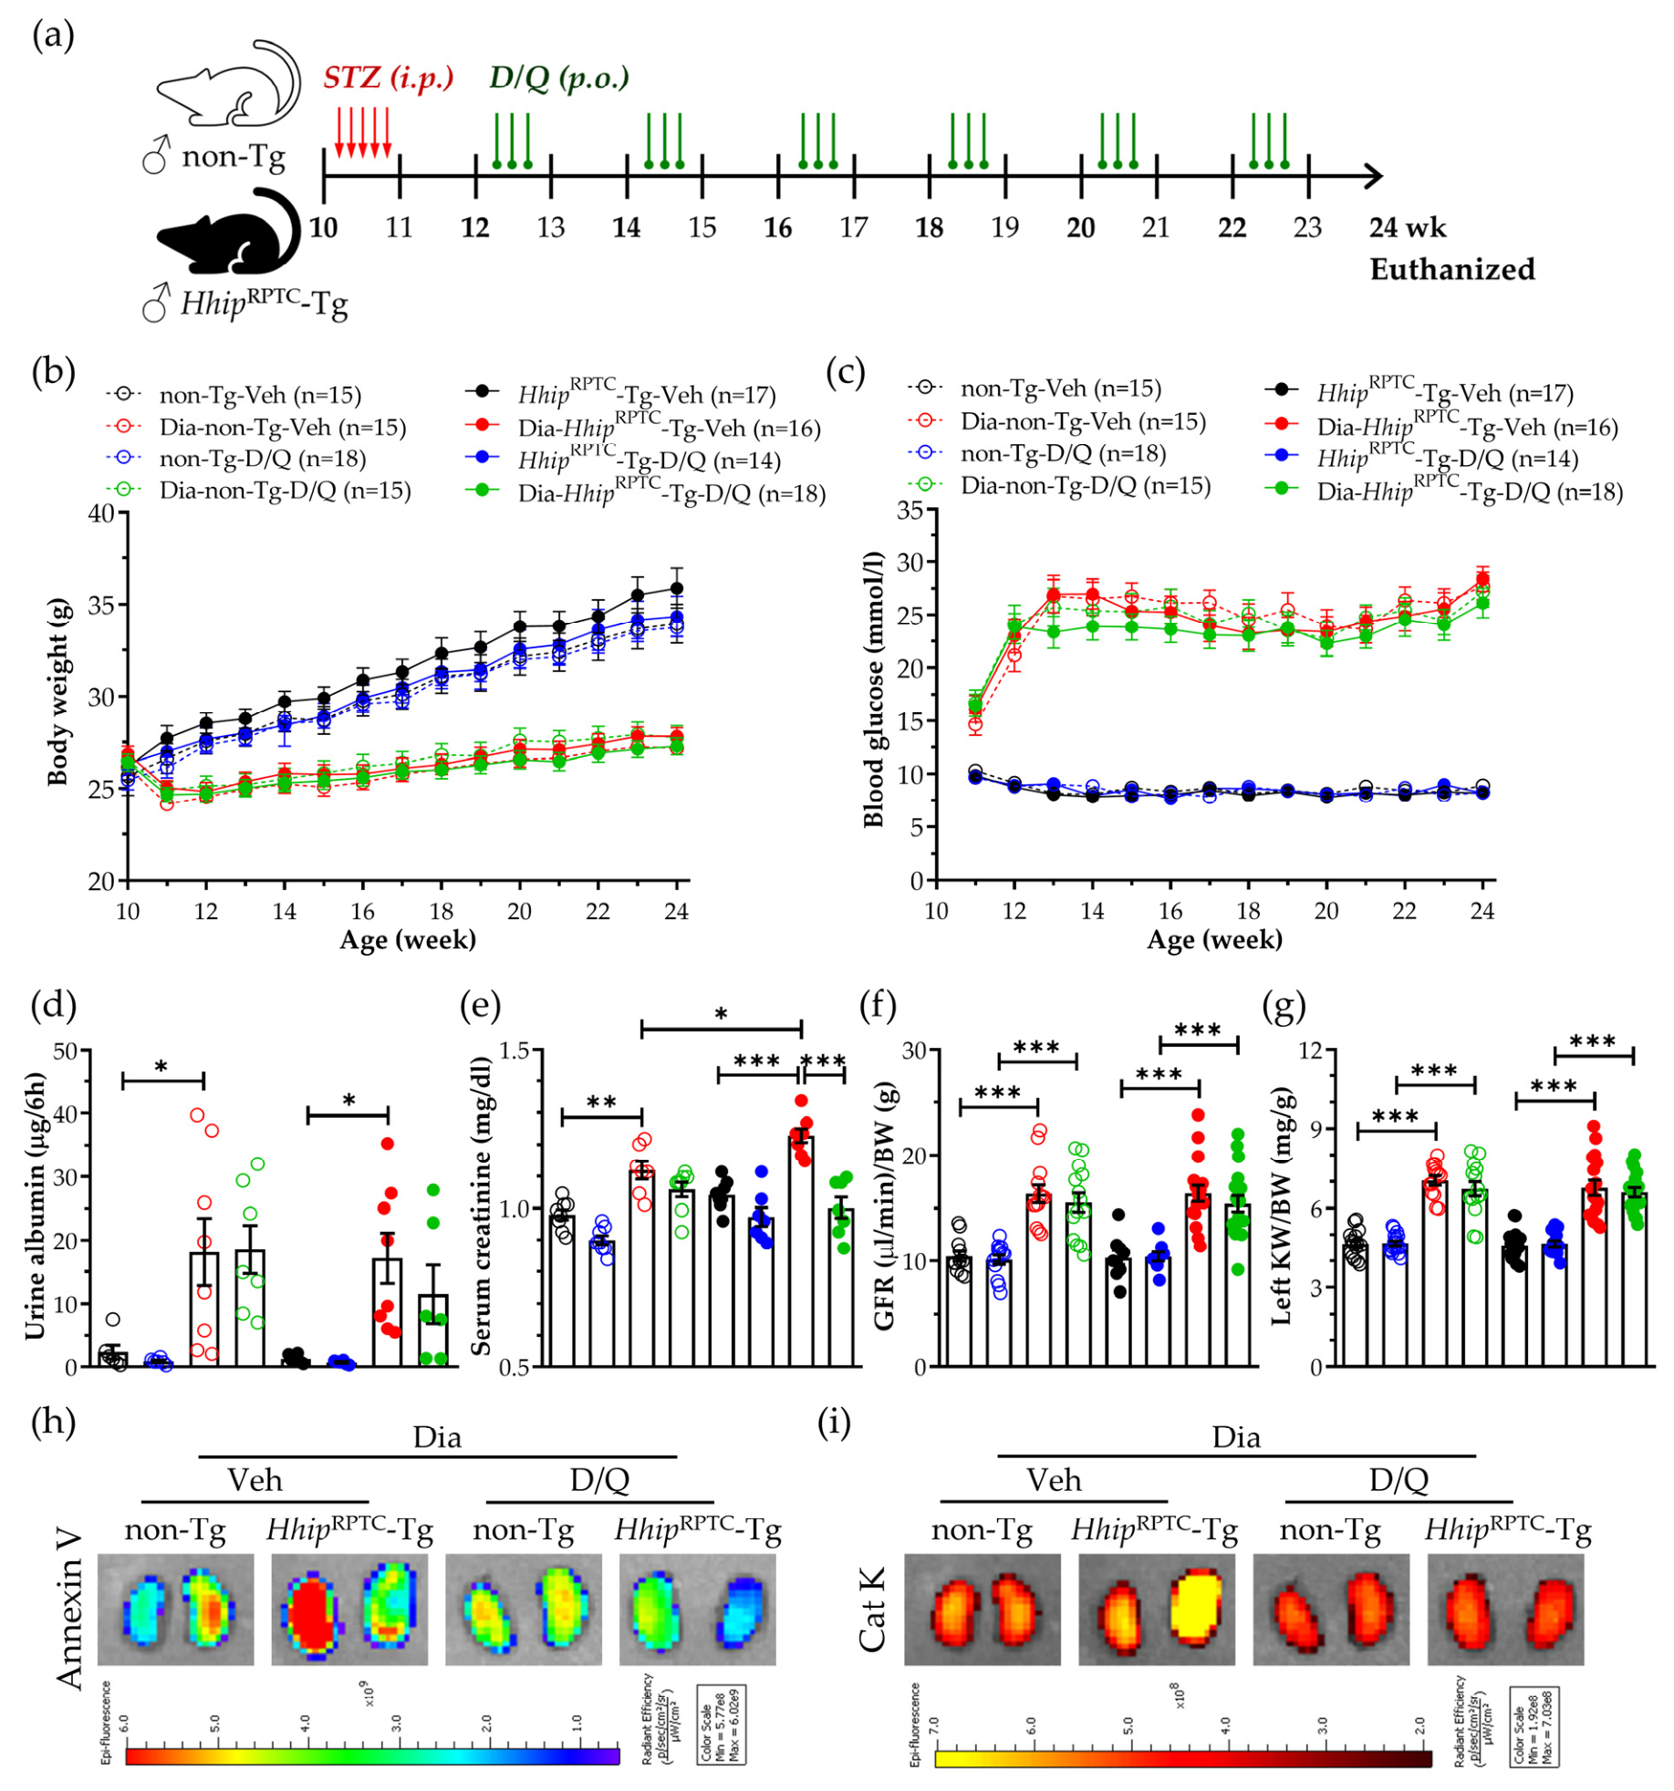
Senolytic treatment (D/Q) was administered using an intermittent dosing regimen [18,19,20,22] to minimize off-target effects [38,39]. D/Q or vehicle was given for 3 consecutive days at 2-week intervals over a 12-week period. D (5 mg/kg) and Q (50 mg/kg) were prepared in a vehicle containing 10% ethanol, 30% polyethylene glycol 400, and 60% Phosal 50 PG and administered by oral gavage (100–150 μL). The experimental design is summarized in Figure 1a. Using an age- and body-weight-matching protocol, both non-diabetic and diabetic mice were randomly assigned to either the vehicle-treated (Veh) or D/Q-treated subgroup. Eight experimental groups were studied, including both non-diabetic (non-Tg-Veh, non-Tg-D/Q, HhipRPTC-Tg-Veh, HhipRPTC-Tg-D/Q) and diabetic mice (Dia-non-Tg-Veh, Dia-non-Tg-D/Q, Dia-HhipRPTC-Tg-Veh, Dia-HhipRPTC-Tg-D/Q).
Figure 1.
The physiological index in mice monitored from 10 to 24 weeks old. (a) The scheme of experimental protocol; (b) BW (g) progression; (c) blood glucose (mmol/L) monitoring; (d) urinary albumin (ug/6h); (e) serum creatinine (mg/dL; D/Q × Hhip interaction, p = 0.0198); (f) GFR measurement; (g) KW/BW ratio. Data are shown as mean ± SEM for the indicated numbers of mice (n). Statistics were measured via three-way ANOVA followed by Tukey’s post hoc test. * p < 0.05; ** p < 0.01; *** p < 0.005; (h) Annexin-Vivo 750 analyzed by IVIS Spectrum CT 2D-Imaging in the kidneys of euthanized mice. Color scale represents radiant efficiency (p/sec/cm2/sr per μW/cm2), ranging from blue (low) to red (high); (i) Cat K 680 FAST NIR analyzed by IVIS Spectrum CT 2D-Imaging in the kidneys of euthanized mice. Color scale represents radiant efficiency (p/sec/cm2/sr per μW/cm2). Color bar ranges from dark red (low) to bright yellow (high).
All animal experiments were approved by the Animal Care Committee of the Centre de Recherche, Centre Hospitalier de l’Université de Montréal (CRCHUM) (Approval #: CM22036SZs, approved 11 November 2022).
2.2. Physiological Studies
The non-fasting blood glucose (mmol/L) via glucometer in live animals and the glucose concentration (mmol/L) in serum from euthanized mice using the glucose colorimetric kit (Cayman Chemical, Ann Arbor, MI, USA) were recorded [31,32]. Urinary albumin and serum creatinine were measured using enzyme-linked immunosorbent assay (ELISA) (Cat. 1011 & 1012, Ethos Biosciences, Newtown Square, PA, USA) [31,32]. The GFR/BW (μl·min−1·BW−1) was measured using the FITC–inulin method [31,32]. The kidneys were removed, weighed, and processed for histology and the isolation of RPTCs by Percoll gradient [29]. RT-qPCR [The Fast SYBR® green master mix kit (Cat. 46111, Thermo Fisher Scientific, Waltham, MA, USA) and the 7500 Fast real-time PCR system (Applied Biosystems, Life Technologies, Foster City, CA, USA)] was performed. Fold change in mRNA for each gene was determined and normalized to its own housekeeping gene Rpl13a by using the 2−ΔΔCT method [29,30,31,32,33]. The qPCR primers used are listed in Electronic Supplementary Material Table S1.
2.3. Histological Analysis
Kidney sections were stained with Periodic Acid–Schiff (PAS) and Masson’s trichrome staining by using standard methods. Glomerular and tubular injury scores were based on PAS images and a semi-quantitative scale from 0 to 4 [29,31,32]. The immunofluorescence (IF)/immunohistochemistry (IHC) and senescence-associated β-galactosidase assay (SA-β-gal) and staining were performed [29,32]. The antibodies used are listed in Supplementary Material Table S2.
2.4. The IVISense Fluorescent Annexin-Vivo 750 Imaging
The 2D fluorescent scanning [IVIS Spectrum CT Imaging (PerkinElmer Inc., Waltham, MA, USA)] was performed in mice anesthetized with isoflurane using the CRCHUM-phenotypic and small animal image platform following the manufacture’s protocol [29].
2.5. Oxidative Stress Measurements In Vivo and In Vitro
Oxidative stress such as reactive oxygen species (ROS) was measured by staining dihydroethidium (DHE), 8-hydroxy-2′-deoxyguanosine (8-OHdG) and NADPH oxidase 4 (Nox4), as previously described [40,41]. Relative staining intensity was semi-quantified using NIH ImageJ software 1.54p (Bethesda, MD, USA). Image acquisition and quantification were performed in a randomized and blinded manner.
2.6. Cell Culture
Both rat-immortalized renal proximal tubular cell line (IRPTCs) [42] and primary RPTC [29,32] culture from the above mice were used as previously reported. To mimic the in vivo conditions, naïve IRPTCs or IRPTCs overexpressing pcDNA3.1/mouse Hhip cDNA (Hhip-OVE) cf. IRPTCs-Con (transfected with the control plasmid, pcDNA3.1) [29] or Hhip silencing by transfection with Hhip-small interfering RNA (siHhip, Cat. 4390771, Invitrogen, Thermo Fisher Scientific, Waltham, MA, USA) (vs. scrambled RNA, Scr, Cat. 4390847, Invitrogen, Thermo Fisher Scientific, Waltham, MA, USA) were cultured in either normal glucose (NG, 5 mM D-glucose + 20 mM L-glucose to maintain equal osmolality) or high-glucose (HG, 25 mM D-glucose) ± senolytics (D, 2 nM/Q, 20 nM). The plasmid, pcDNA3.1/mHhip (mouse) was a gift from Andrew P. McMahon (Harvard University, Cambridge, MA, USA) [29,31,32,33]. Intracellular ATP levels were measured using ATP Determination Kit (Cat. A22066, Invitrogen, Thermo Fisher Scientific, Waltham, MA, USA) according to the manufacturer’s instructions.
2.7. Mitochondria Measurements in RPTCs
As previously reported [40,41], mitochondrial reactive oxygen species (mtROS) in IRPTCs were monitored using MitoSOX™ Red mitochondrial superoxide indicator (Cat. M36008, Invitrogen, Thermo Fisher Scientific, Waltham, MA, USA), and mitochondrial transmembrane potential (MMP) was assessed by JC-1 dye (Cat. T3168, Invitrogen, Thermo Fisher Scientific, Waltham, MA, USA). The staining cells were imaged using Nikon Eclipse Ti fluorescence microscope. Moreover, the 2D and 3D mitochondrial images in IRPTCs stained with MitoTracker™ Red CMXRos staining (Cat. M7512, Invitrogen, Thermo Fisher Scientific, Waltham, MA, USA) were generated by using a Zeiss LSM900 confocal microscope (CRCHUM platform). Mitochondrial morphology was quantified using the Mitochondria Analyzer Plugin, and Aspect Ratio (AR) of area of mitochondrion is calculated as follows: AR = dmax/dmin, where: dmax = major axis (longest diameter) of mitochondrion; dmin = minor axis (shortest diameter) of mitochondrion. AR = 1: perfect circle (round object, dmax = dmin); AR > 1: elongated or elliptical object (dmax > dmin) [43].
2.8. Statistical Analysis
Statistical analysis was performed through GraphPad Prism 8.0 (GraphPad Software, San Diego, CA, USA), and all data are presented as mean ± SEM. For animal studies, 6–18 mice per group were used. For in vitro studies, data represent results from 3–4 independent experiments. Normality was assessed using the Shapiro–Wilk test and Q-Q plot inspection. Homogeneity of variance was performed using the Brown–Forsythe test. Statistical significance was evaluated by Welch’s t-test and one-way, two-way or three-way ANOVA, as appropriate. Post hoc multiple comparisons were conducted using Tukey’s test. Statistical significance was set at p < 0.05.
3. Results
3.1. DKD Tubulopathy
The scheme of the experimental protocol is shown in Figure 1a. Under physiological conditions, both non-Tg and HhipRPTC-Tg mice exhibited normal growth, comparable physiological parameters (Figure 1) and normal renal morphology (Figure 2). Compared with their respective vehicle-treated controls (non-Tg-Veh and HhipRPTC-Tg-Veh), D/Q treatment alone did not affect growth patterns (Figure 1b), blood glucose levels (Figure 1c) or kidney function (Figure 1d–g) in either non-Tg-D/Q or HhipRPTC-Tg-D/Q mice.
Figure 2.
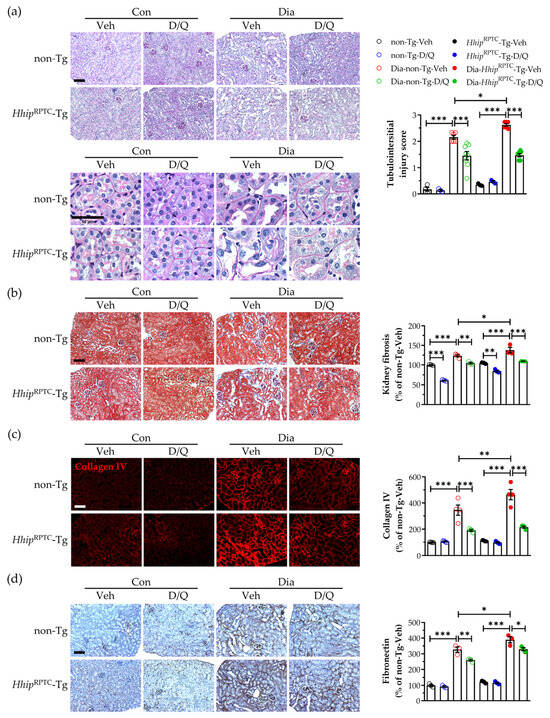
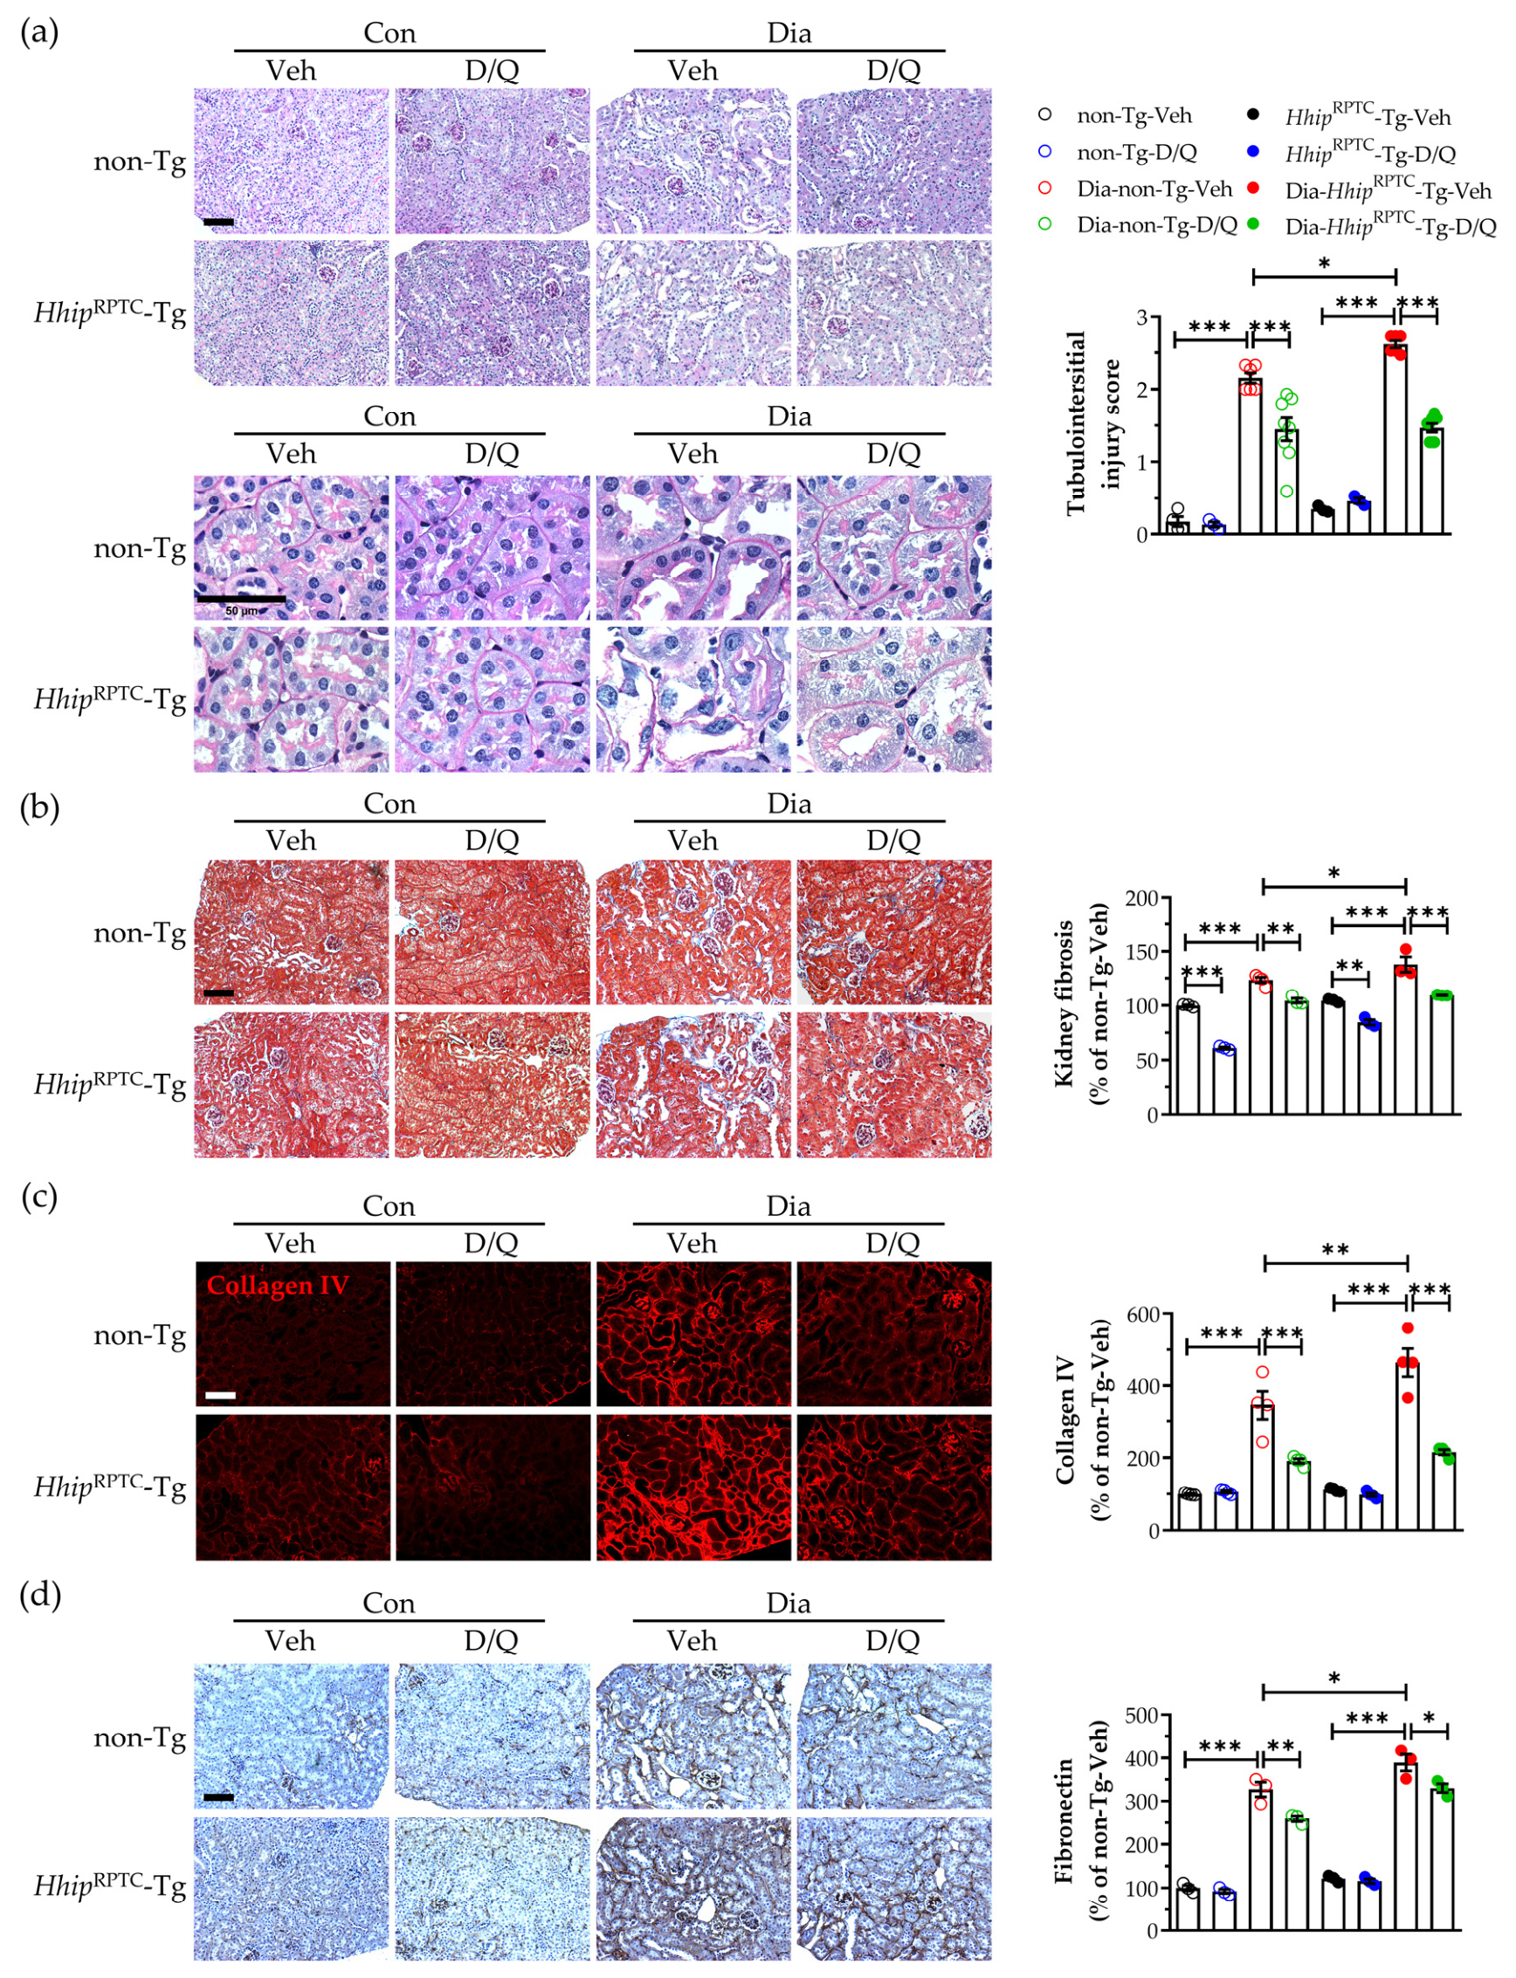
Kidney outcome analysis in mice. (a) PAS staining images. (b) Masson’s trichrome staining. (c) Collagen IV-IF staining. (d) Fibronectin-IHC staining. Scale bar, 100 µm. Data on semi-quantification of relevant staining are shown as mean ± SEM for the indicated numbers of mice (n). Each point represents an individual animal. Statistics were measured via three-way ANOVA followed by Tukey’s post hoc test. * p < 0.05; ** p < 0.01; *** p < 0.005.
In diabetes, compared to respective non-diabetic controls, diabetic mice had substantial weight loss (Figure 1b) and displayed typical DKD dysfunction, including sustained hyperglycemia (Figure 1c), increased urinary albumin (Figure 1d), serum creatinine (Figure 1e) and GFR (Figure 1f), as well as kidney hypertrophy (KW/BW ratio, Figure 1g), regardless of whether Hhip was overexpressed in RPTCs or not (Dia-non-Tg and Dia-HhipRPTC-Tg). Notably, serum creatinine levels were significantly elevated in diabetic mice, with a more pronounced increase in Dia-HhipRPTC-Tg mice than in Dia-non-Tg mice. Senolytic (D/Q) treatment significantly reduced serum creatinine levels in Dia-HhipRPTC-Tg mice. Three-way ANOVA revealed a significant D/Q × Hhip interaction (p < 0.05), indicating that the effect of D/Q on serum creatine was modulated by the Hhip genotype.
Similar to our previous report [29], the in vivo imaging using the IVIS Spectrum CT system revealed robust Annexin V apoptotic signals via Annexin-Vivo 750 (apoptosis) (Figure 1h) or Cat K 680 FAST NIR (fibrosis) (Figure 1i) in the kidneys of diabetic mice, but these features appeared to be grossly more pronounced in Dia-HhipRPTC-Tg cf. Dia-non-Tg mice.
As expected, diabetic mice exhibited characteristic features of diabetic tubulopathy (Figure 2a, PAS), including loss of the brush border, detachment of tubular epithelial cells from the tubular basement membrane, and tubular dilation. Increased tubulointerstitial fibrosis in those diabetic mice was evident, revealed by Masson’s trichrome staining (Figure 2b) and further confirmed by IF-collagen IV (Figure 2c) and IHC-fibronectin (Figure 2d) expression. Notably, these DKD features were more severe in Dia-HhipRPTC-Tg cf. Dia- non-Tg mice and were significantly attenuated by senolytic (D/Q) treatment in both Dia-non-Tg-D/Q and Dia-HhipRPTC-Tg-D/Q groups (Figure 2).
3.2. Tubular Senescence and Tubular Oxidative Stress
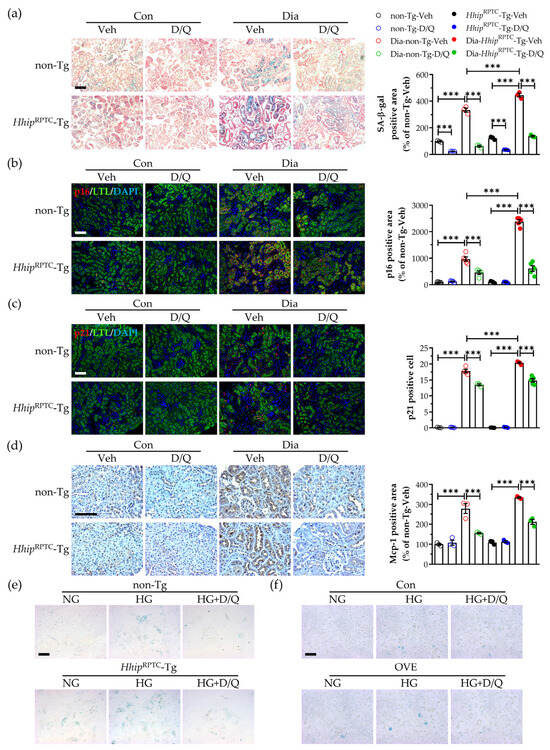
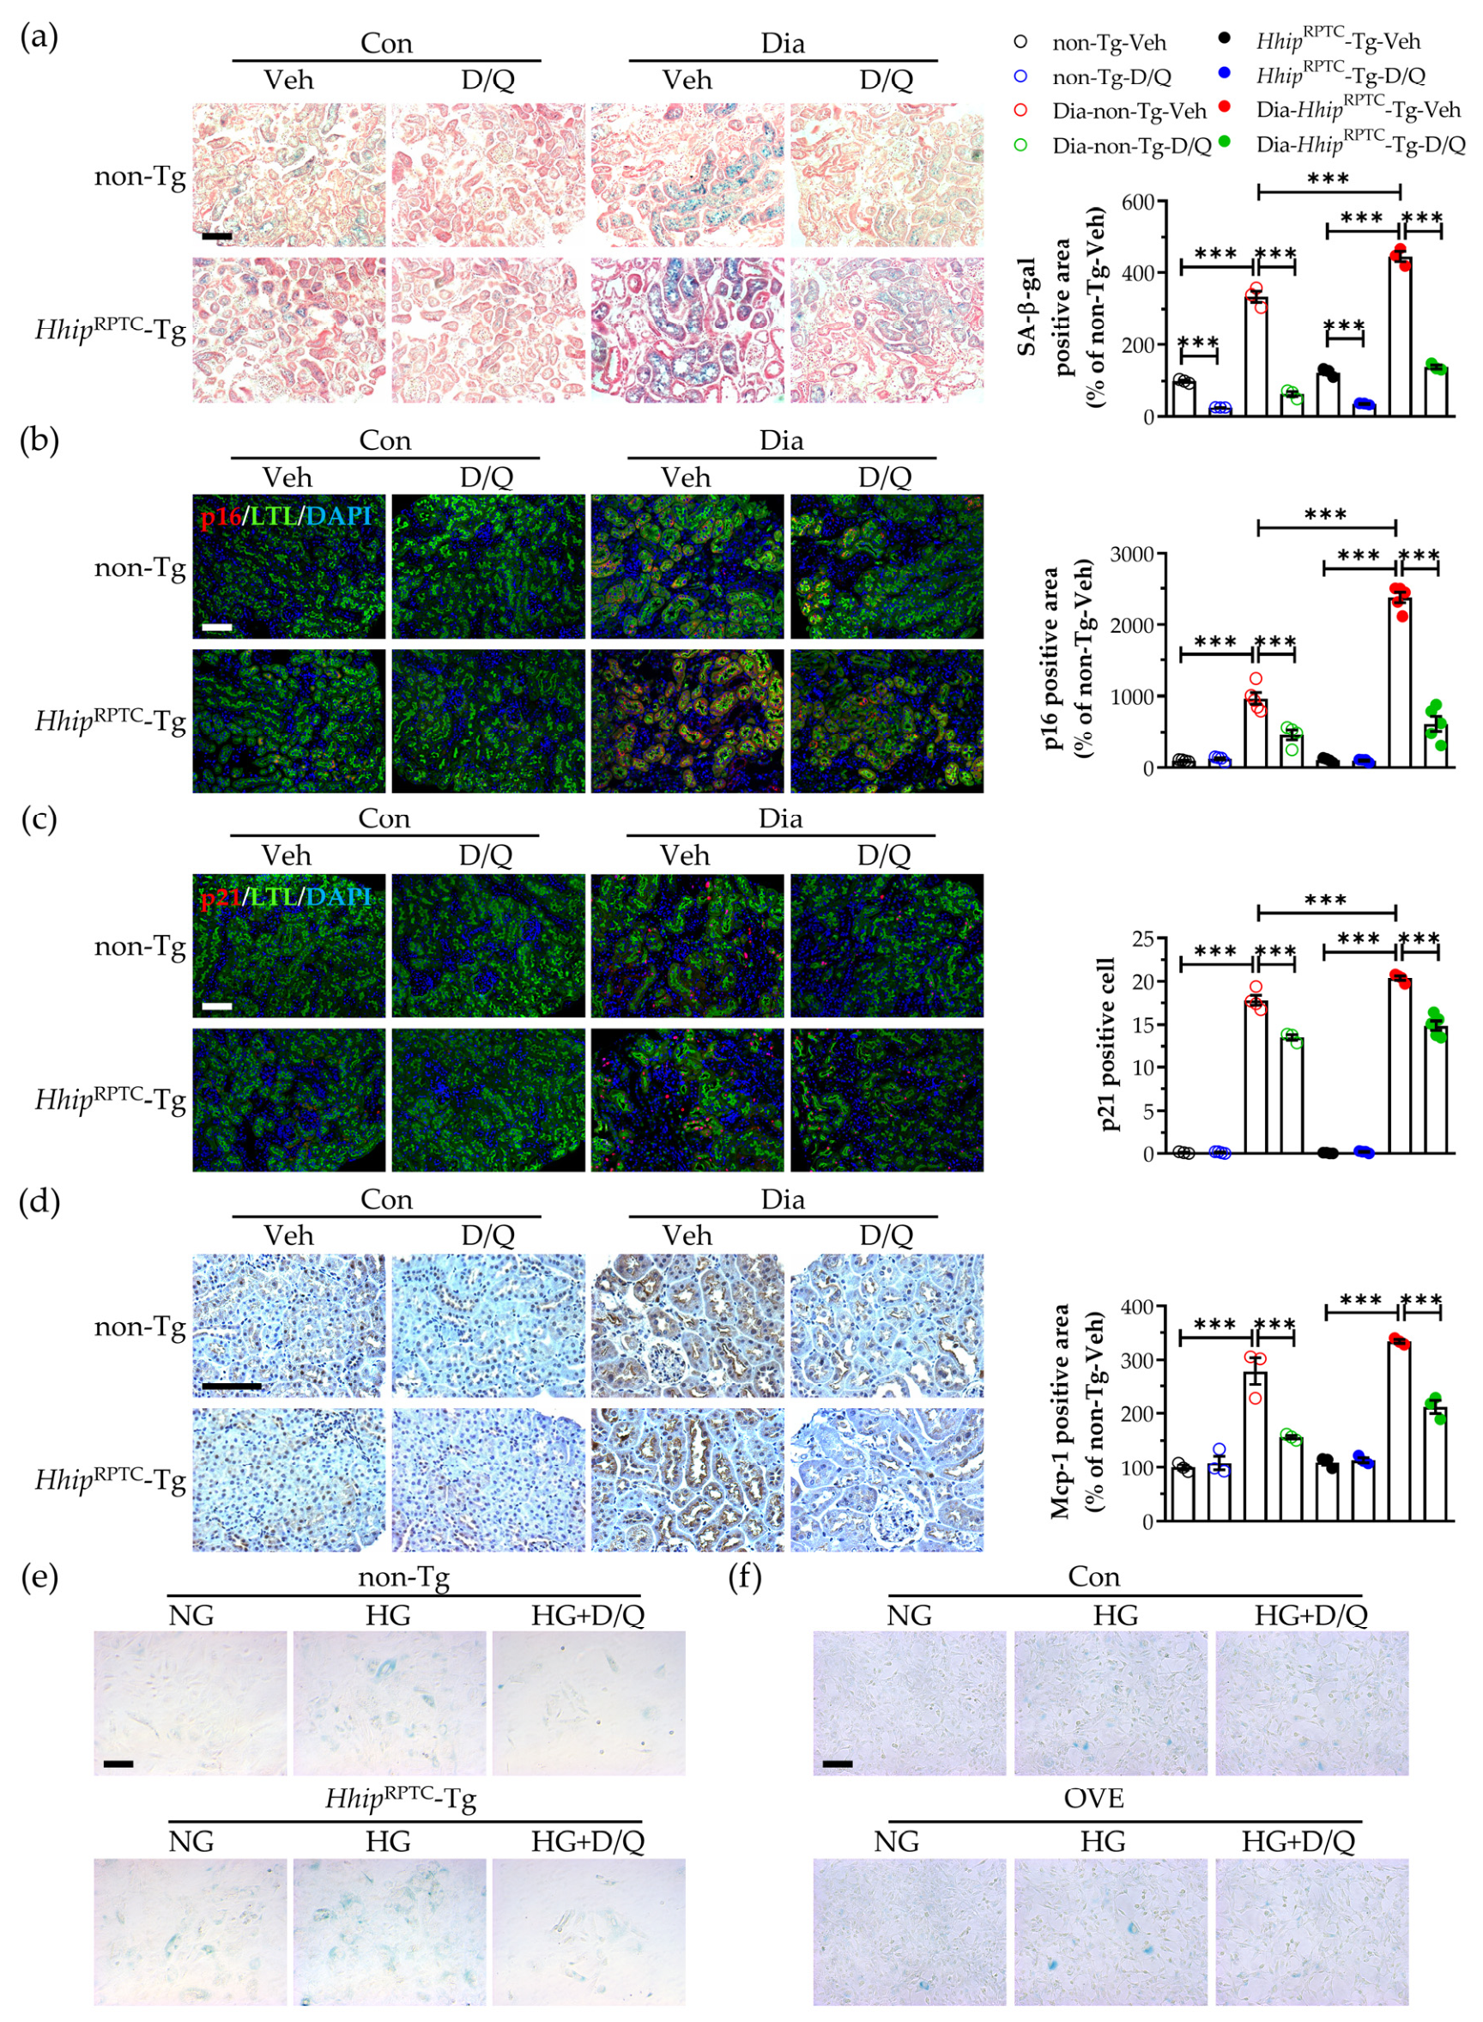
Compared with their respective non-diabetic controls, diabetic mice exhibited increased tubular senescence (Figure 3), evidenced by elevated SA-β-gal activity (Figure 3a), increased expression of the senescence markers p16 (Figure 3b) and p21 (Figure 3c), and enhanced Mcp-1 expression (Figure 3d) in the kidneys. A similar senescent pattern of SA-β-gal activity (Figure 3e, Supplementary Material Figure S1a) was also observed in primary cultured RPTCs isolated from these mice as well as IRPTCs (Figure 3f, Supplementary Material Figure S1b). Importantly, these senescent features were more pronounced in the kidneys of Dia-HhipRPTC-Tg mice than in Dia-non-Tg mice but were significantly ameliorated by senolytic (D/Q) treatment (Figure 3).
Figure 3.
Tubular senescence in the kidney. (a) SA-β-gal staining. (b) p16/LTL co-IF staining (D/Q × Hhip interaction, p < 0.0001). (c) p21/LTL co-IF staining. (d) Mcp-1 IHC staining. (e) SA-β-gal staining in primary cultured RPTCs isolated from mice. (f) SA-β-gal staining in IRPTCs. Scale bar, 100 µm. Data are shown as mean ± SEM for the indicated numbers of mice (n). Each point represents an individual animal. Statistics were measured via three-way ANOVA followed by Tukey’s post hoc test. *** p < 0.005.
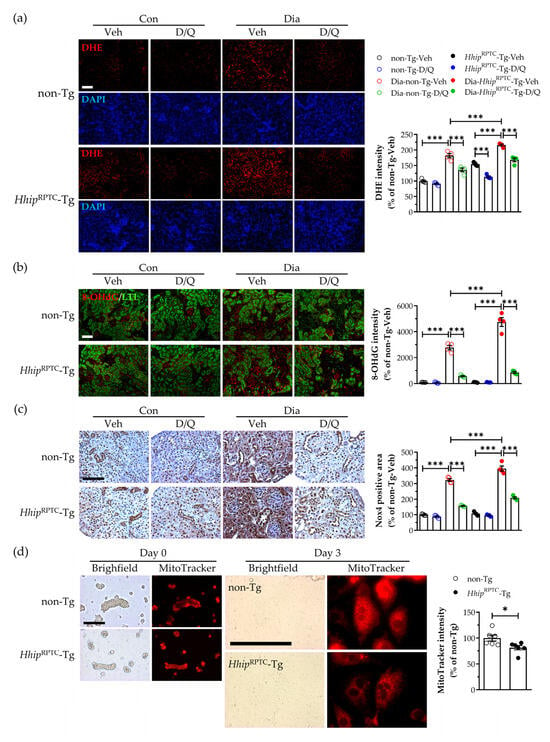
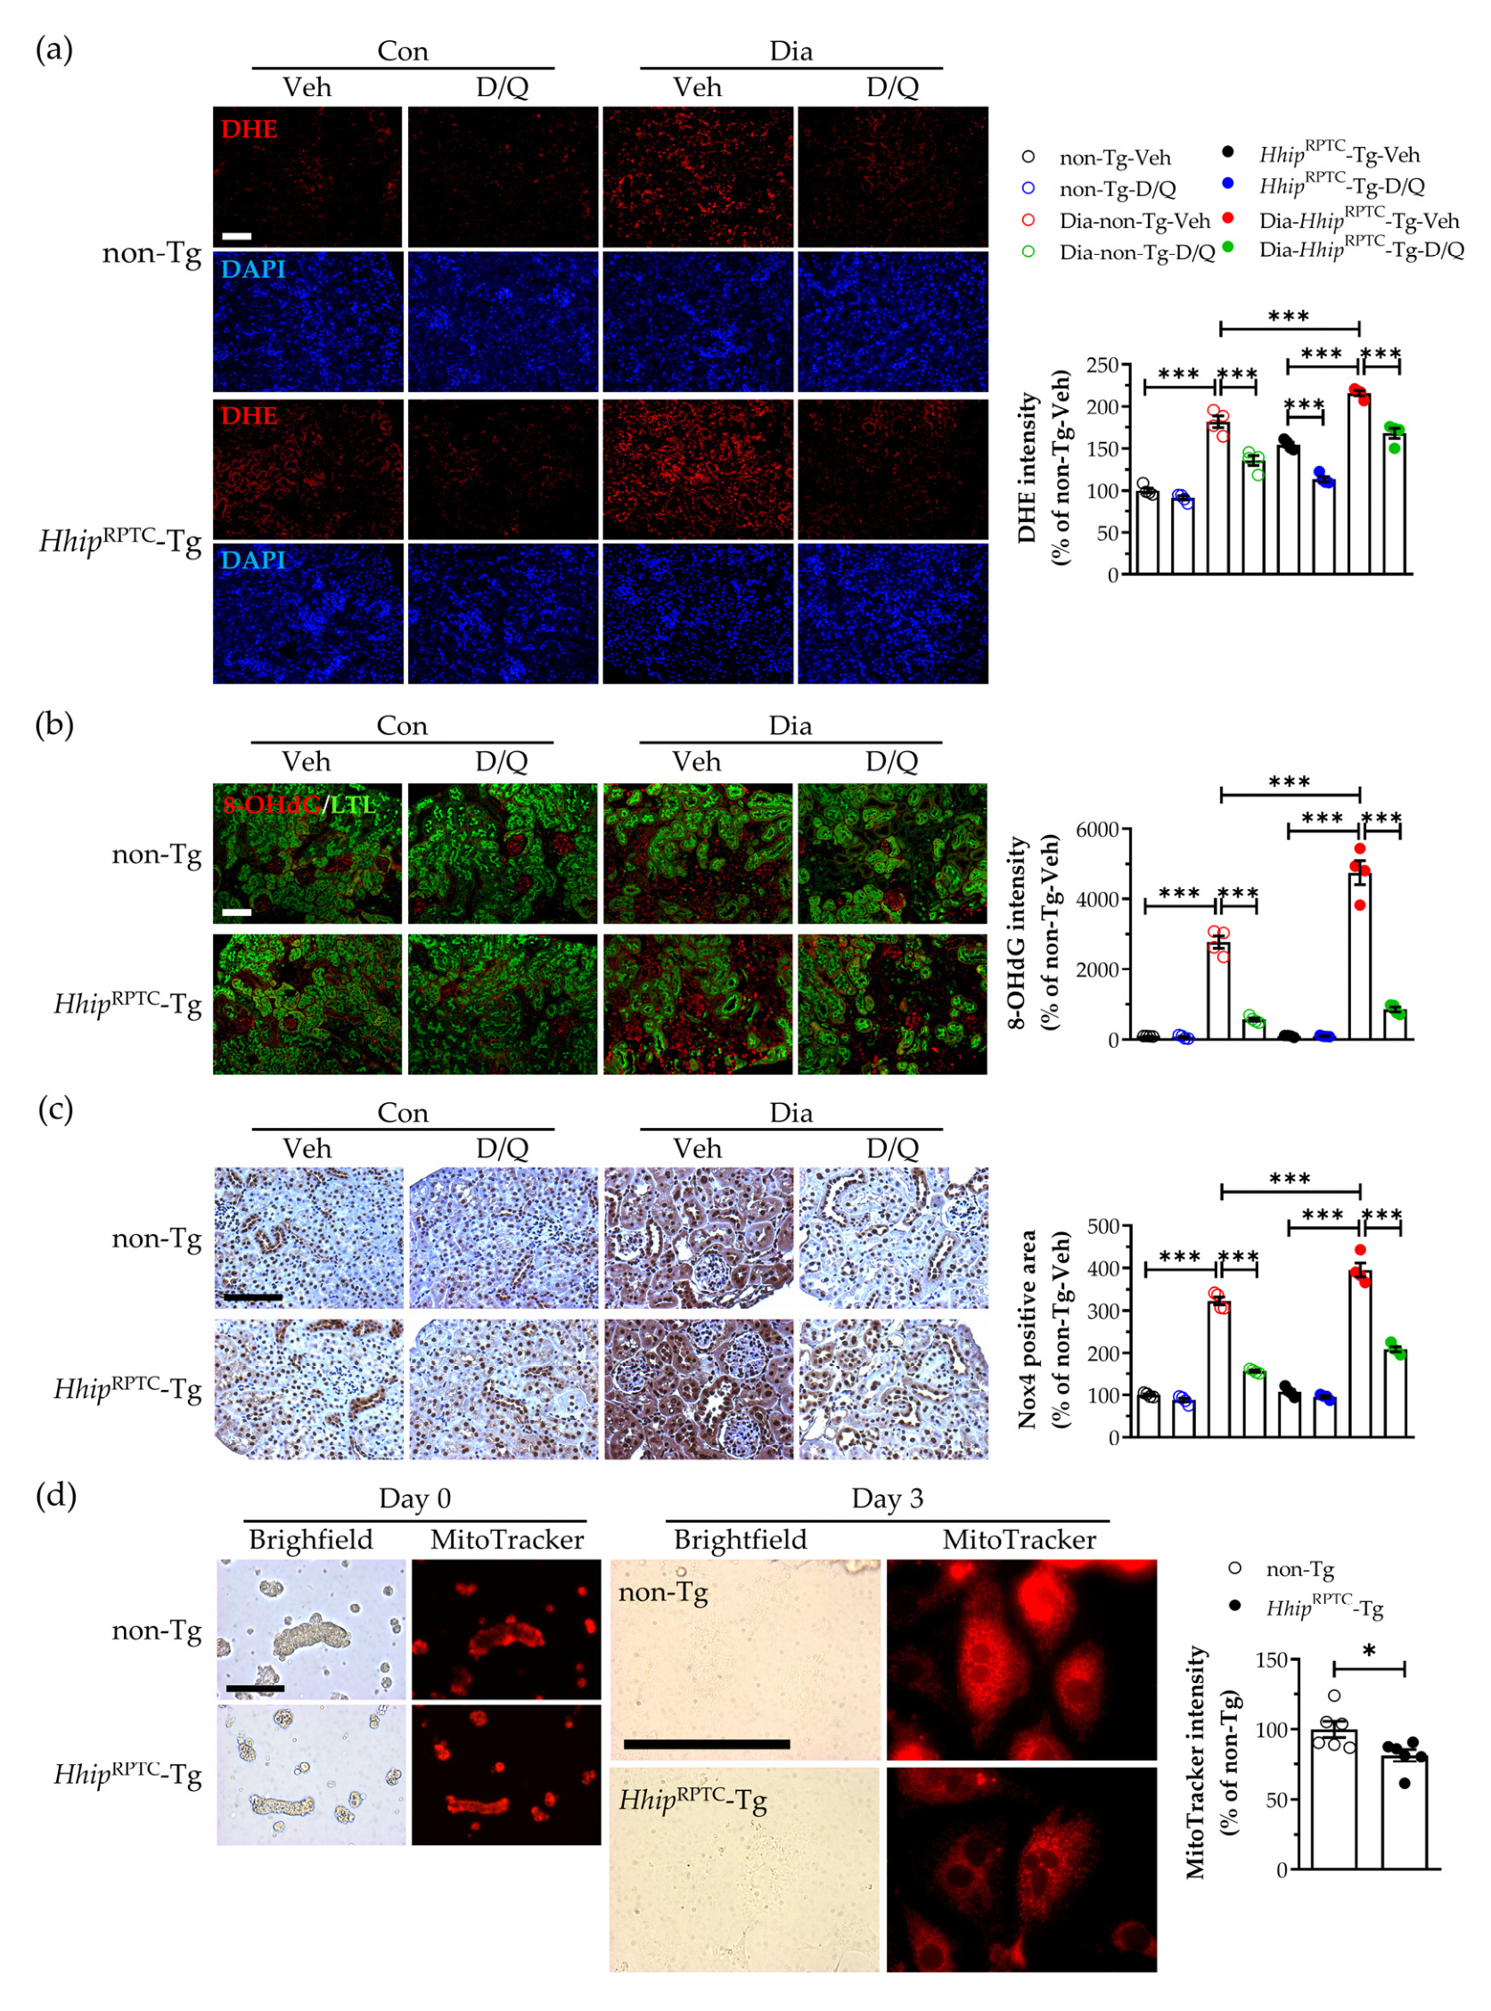
The increased tubular oxidative stress revealed by DHE (Figure 4a), 8-OHdG (Figure 4b), and Nox4 (Figure 4c) staining in the kidney was observed more in diabetic than non-diabetic mice and more pronounced in Dia-HhipRPTC-Tg cf. Dia-non-Tg mice. Senolytic (D/Q) treatment significantly attenuated these oxidative stress markers in both Dia-non-Tg-D/Q and Dia-HhipRPTC-Tg-D/Q groups (Figure 4). In addition, MitoTracker™ Red staining revealed a significant reduction in mitochondrial polarization and/or content in cultured RPTCs isolated from HhipRPTC-Tg mice compared with those from non-Tg mice (Figure 4d).
Figure 4.
Oxidative stress in the kidney. (a) DHE staining (D/Q × Hhip interaction, p = 0.0131). (b) 8-OHdG/LTL staining (D/Q × Hhip interaction, p = 0.0003). (c) Nox4-IHC staining. (d) MitoTracker staining in primary cultured RPTCs isolated from mice. Scale bar, 100 µm. Data are shown as mean ± SEM for the indicated numbers of mice (n). Each point represents an individual animal. Statistics were measured via three-way ANOVA followed by Tukey’s post hoc test, and Welch’s t-test. * p < 0.05; *** p < 0.005.
3.3. Mitochondrial Network Integrity In Vitro
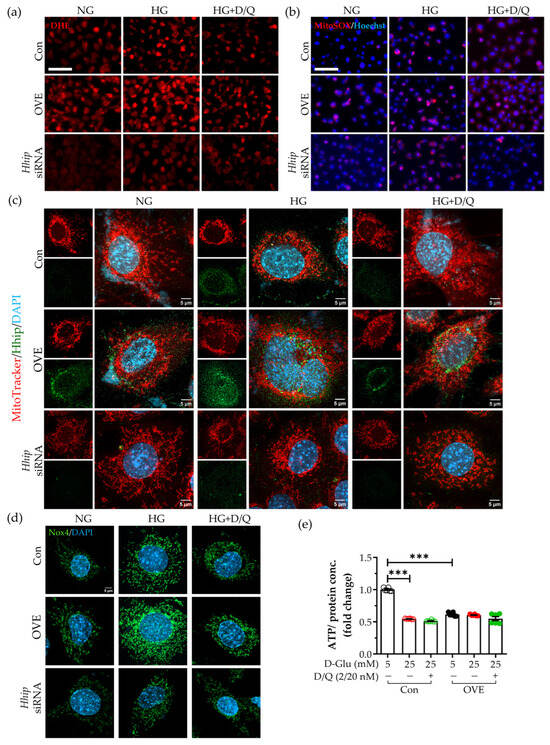
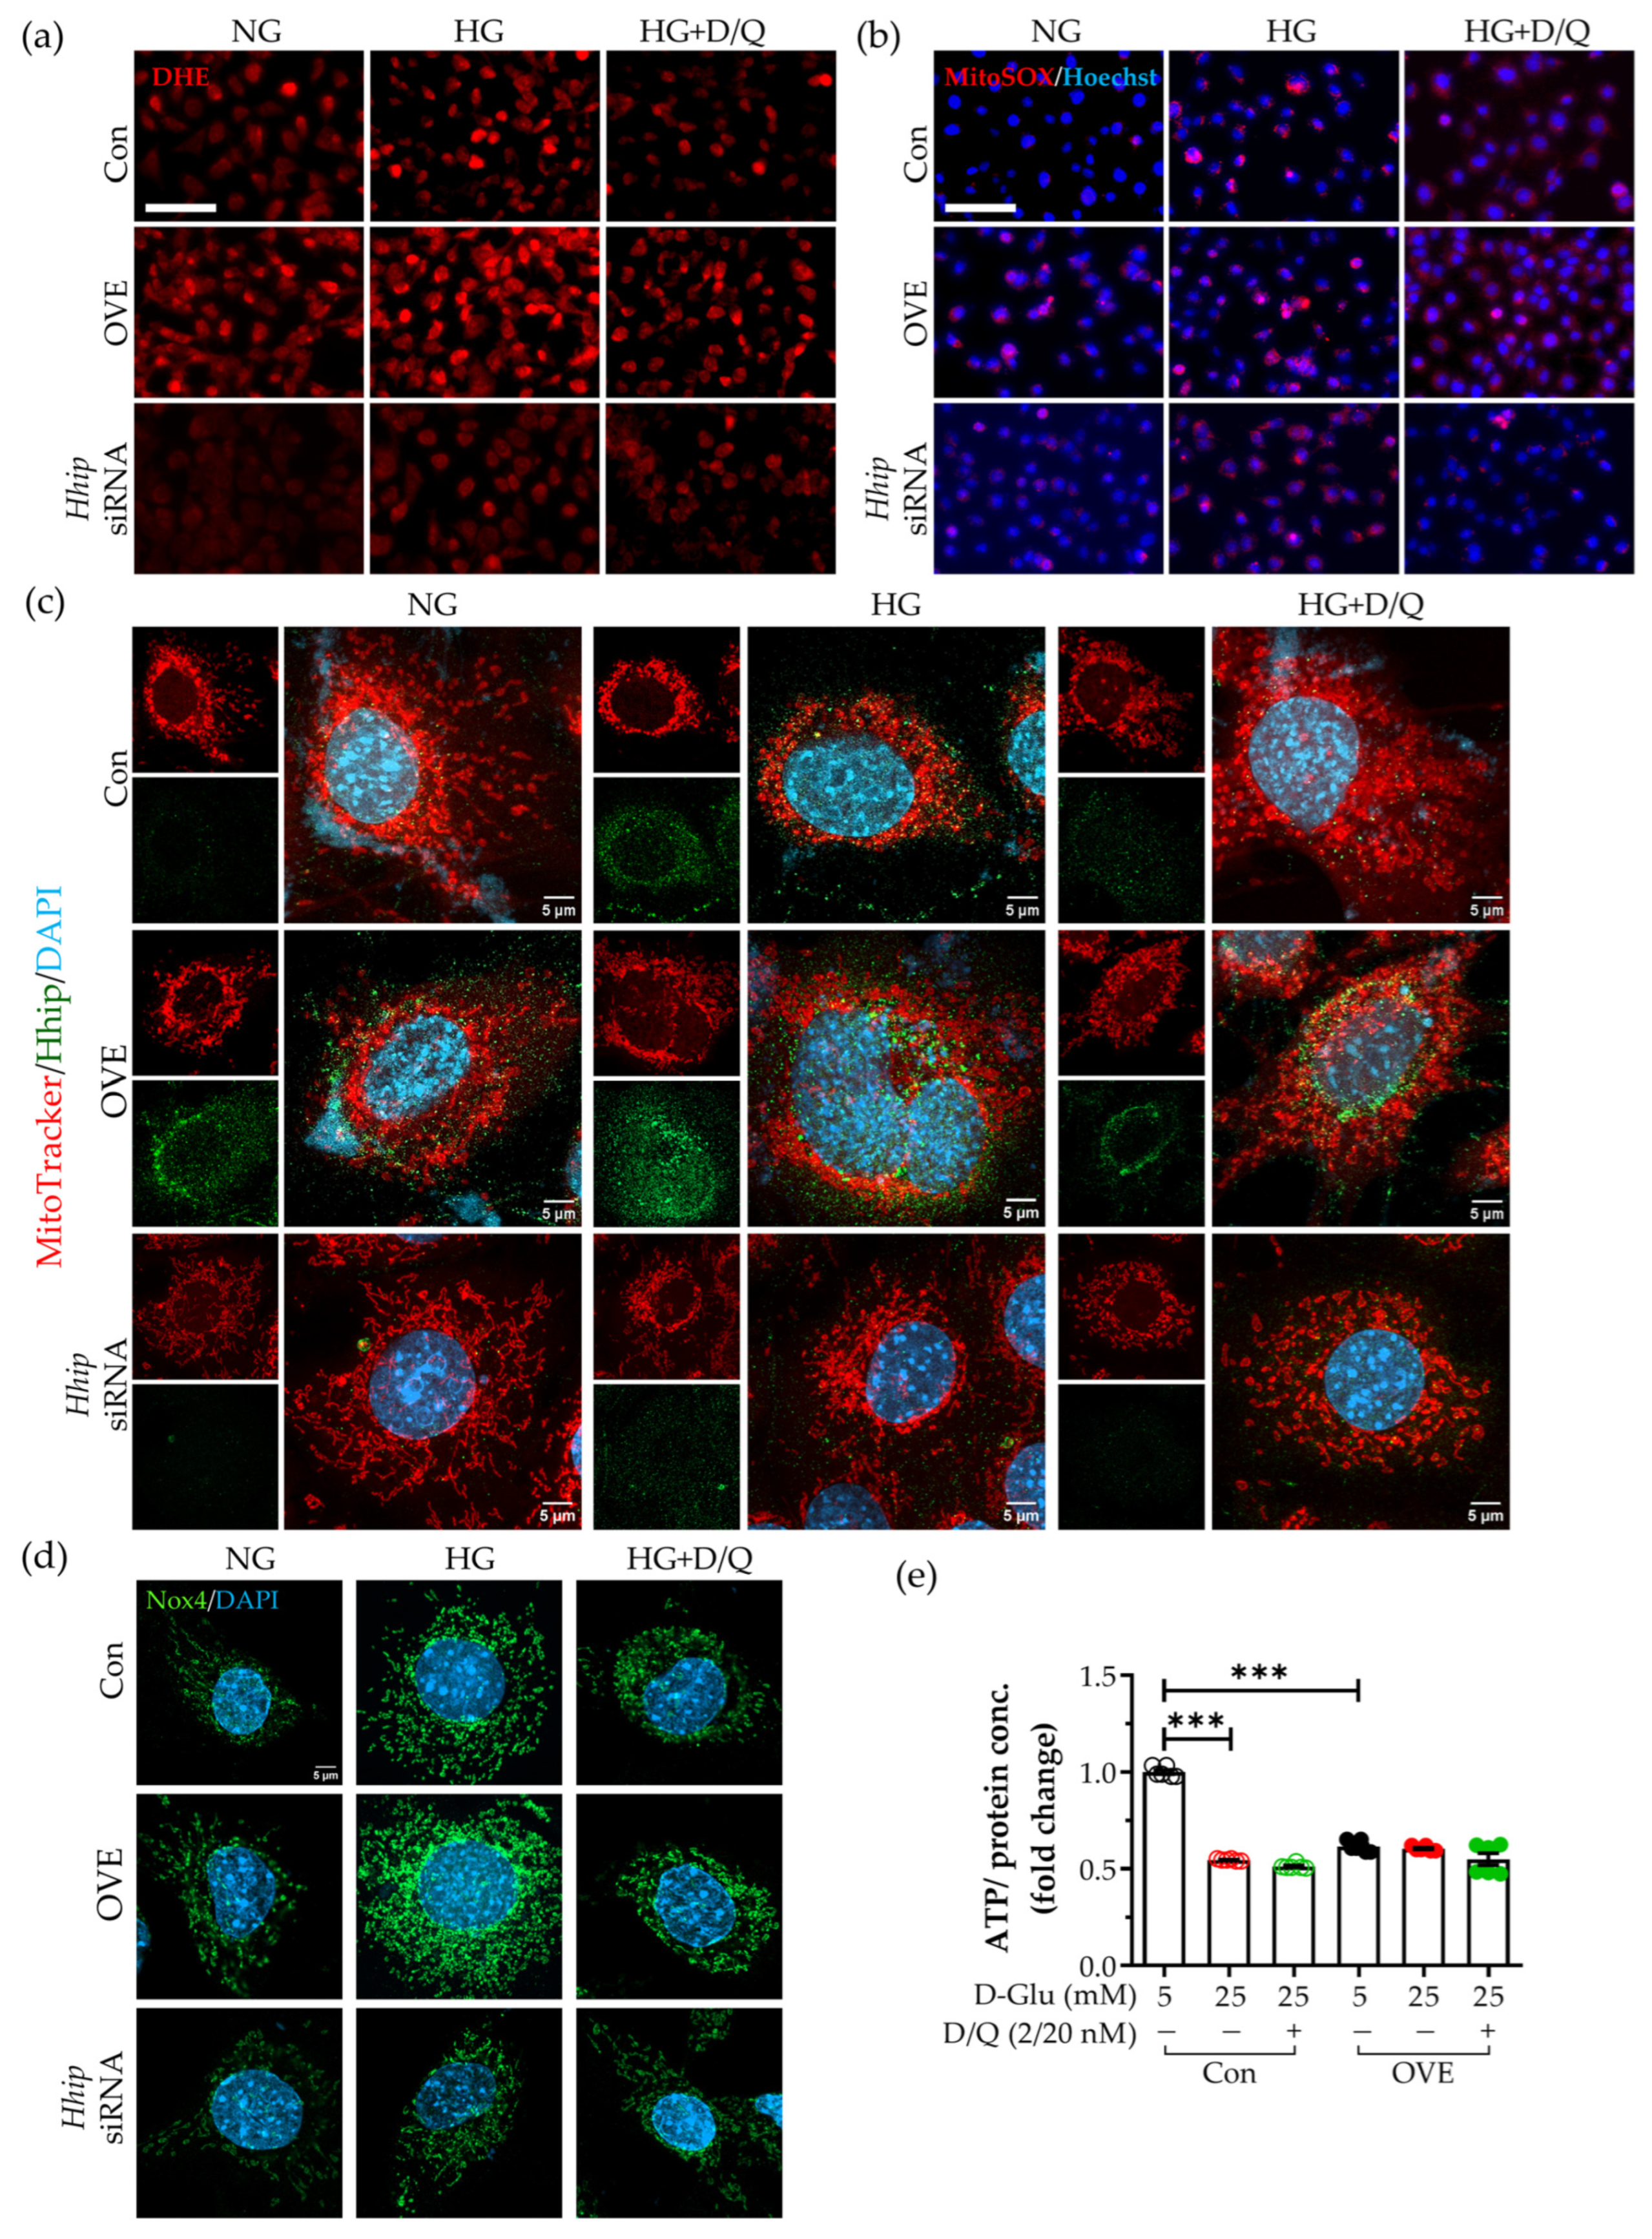
In IRPTCs, compared with normal glucose, high-glucose or Hhip overexpression alone stimulated ROS production (Figure 5a; Supplementary Material Figure S2a, DHE staining), increased mtROS accumulation (Figure 5b; Supplementary Material Figure S2b, MitoSox/Hoechst staining), reduced mitochondrial polarization and/or content (Figure 5c; Supplementary Material Figure S2c, Hhip/MitoTracker IF staining) and elevated Nox4 expression (Figure 5d; Supplementary Material Figure S2d, Nox4 IF staining), and those effects were more pronounced in combination. In contrast, treatment with either senolytics (D/Q) or with siRNA-Hhip significantly ameliorated the above changes in high-glucose or Hhip overexpression or combined. In parallel, ATP production was significantly reduced when IRPTCs were exposed to high glucose, Hhip overexpression, or their combination. Intriguingly, senolytic (D/Q) treatment did not restore ATP production under any of these conditions (Figure 5e).
Figure 5.
The measurements of oxidative stress: Nox4, mtROS and ATP levels in vitro. (a) DHE staining (scale bar, 100 µm). (b) MitoSOX/Hoechst staining (scale bar, 100 µm); (c) Hhip/Mitotracker staining (scale bar, 5 µm); (d) Nox4 IF staining (scale bar, 5 µm); IRPTCs (control vs. OVE vs. Hhip siRNA) exposure to normal (NG) vs. high glucose (HG) ± senolytics (D, 2 nM/Q, 20 nM) for 24 h. (e) ATP level. IRPTCs (control vs. OVE) exposure to normal (5 mM) vs. high glucose (25 mM) ± senolytics (D, 2 nM/Q, 20 nM) for 24 h. Data are shown as mean ± SEM. Each point represents an independent experiment. Statistics were measured via two-way ANOVA followed by Tukey’s post hoc test. *** p < 0.005.
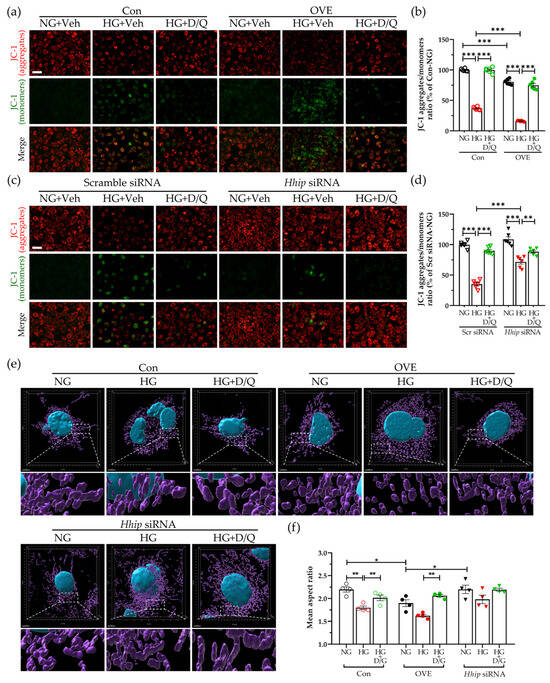
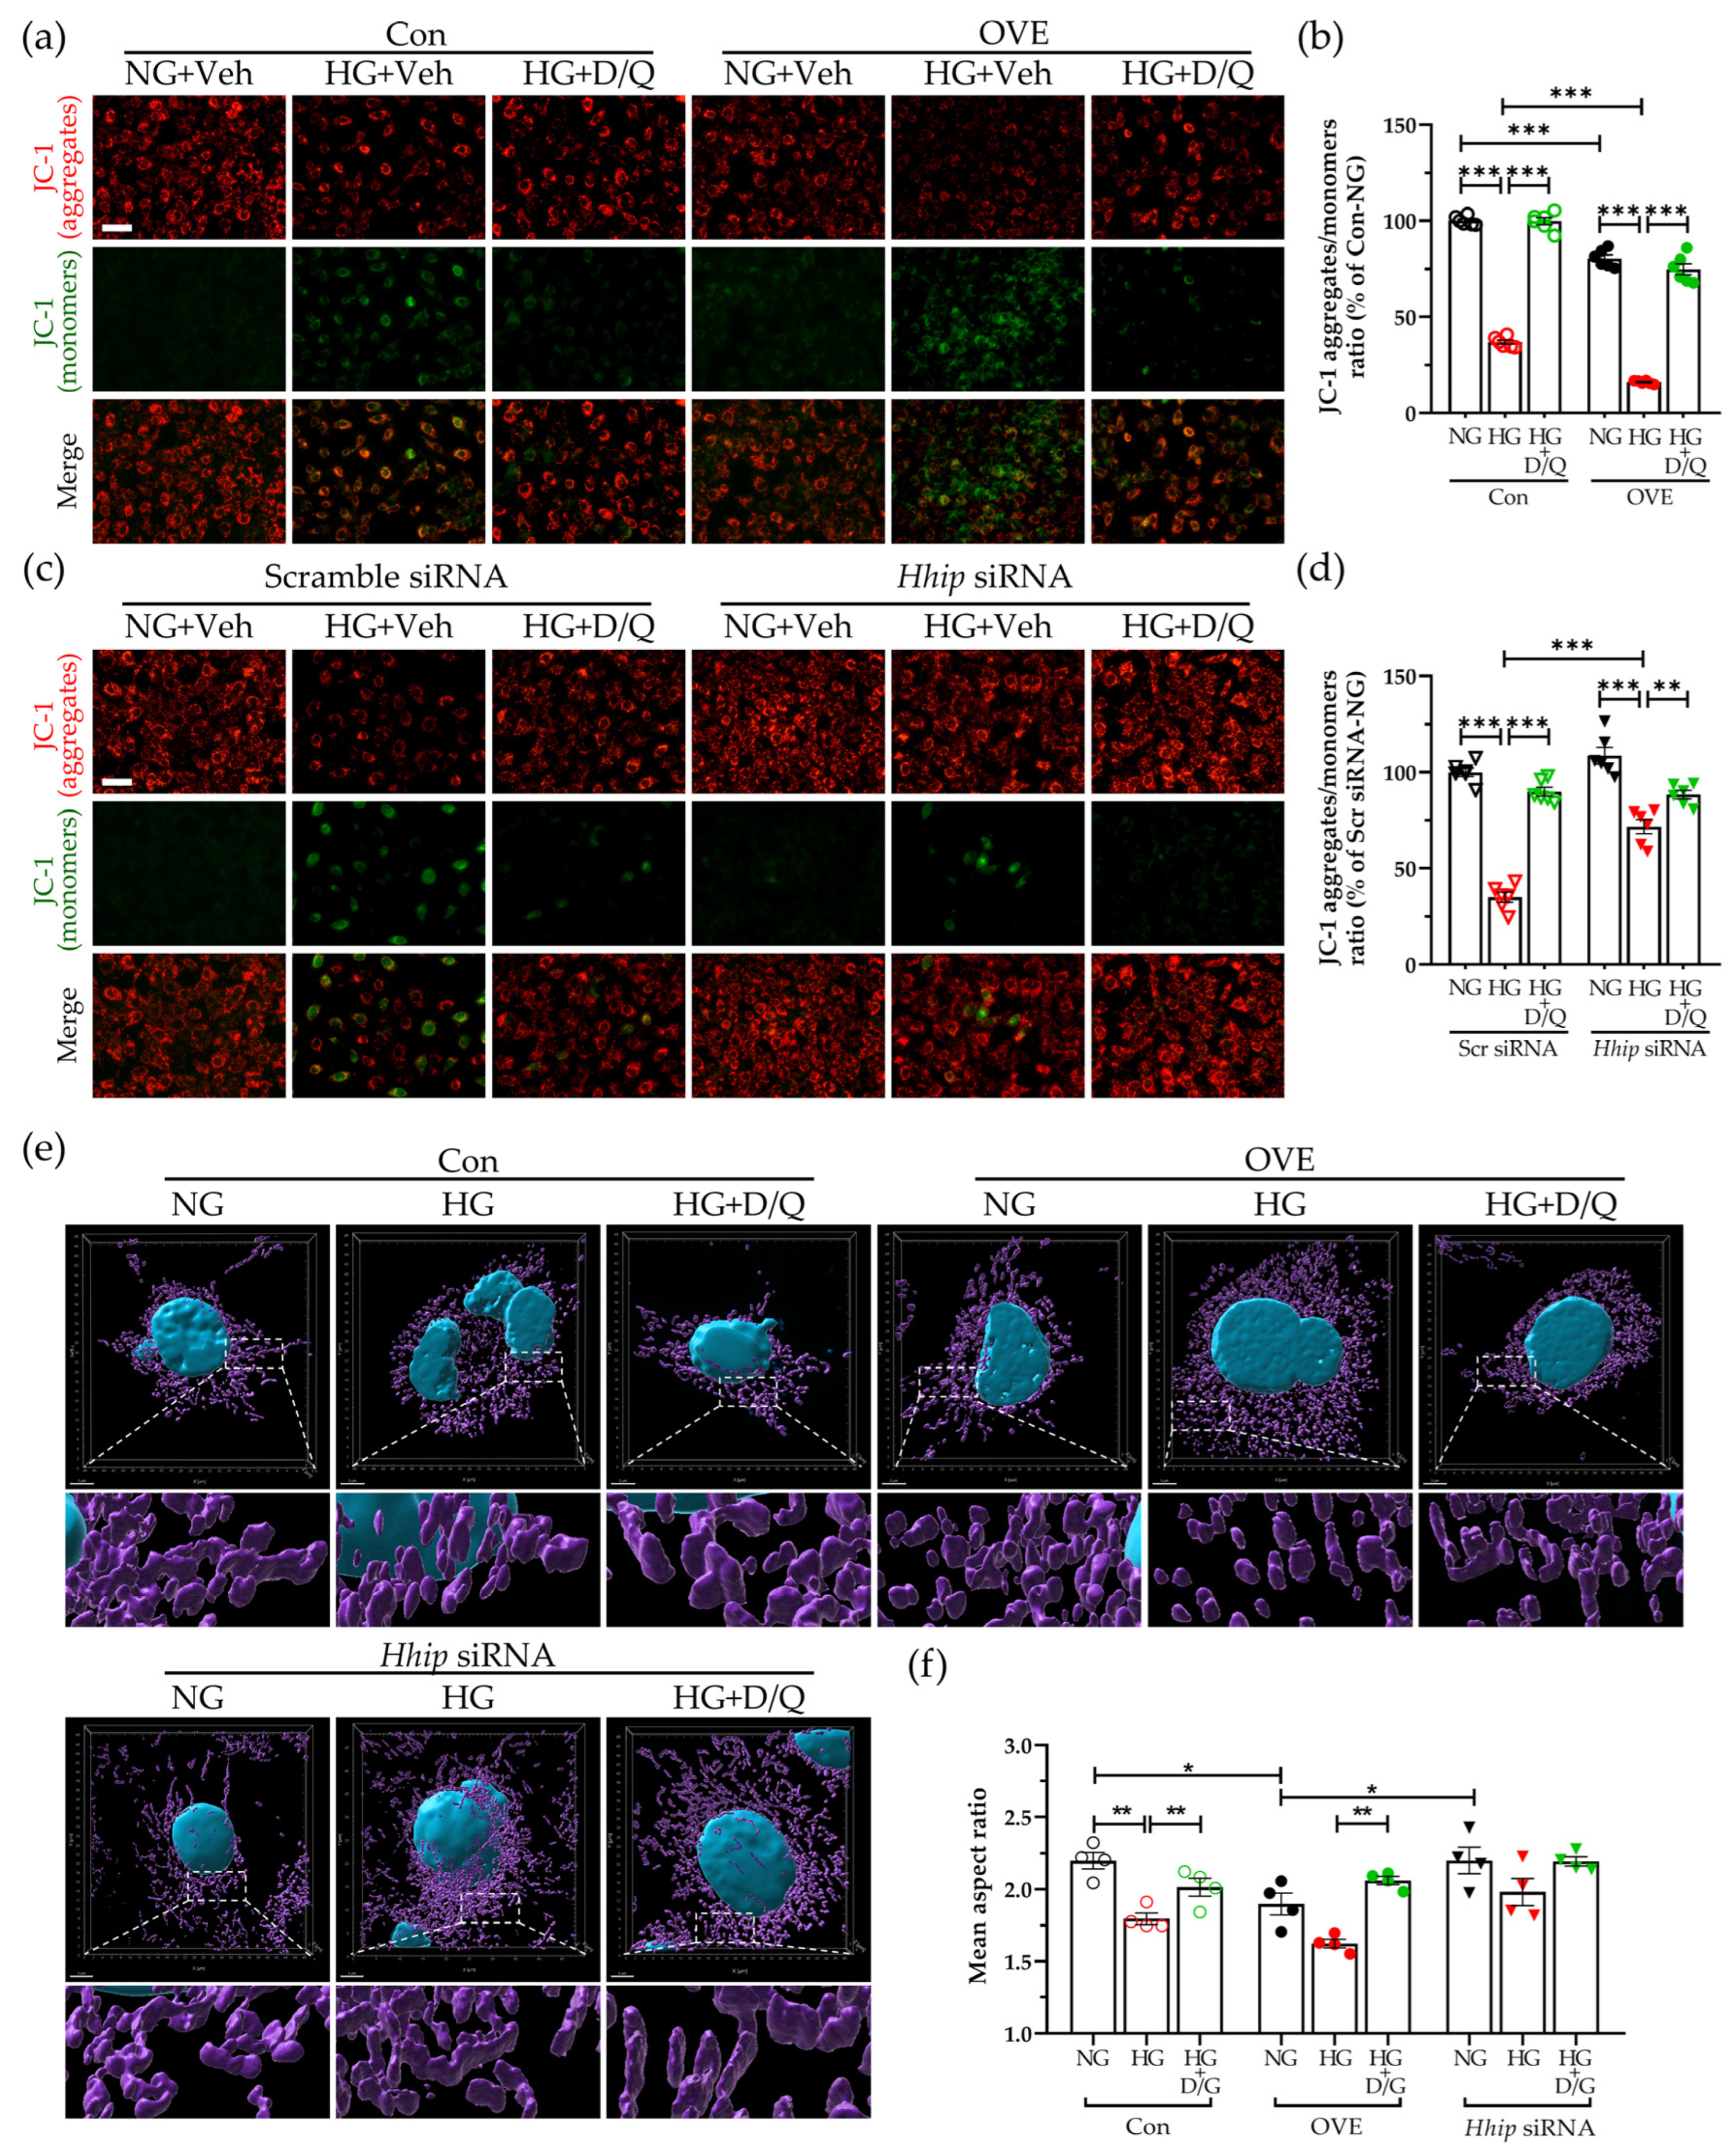
Compared to normal glucose, either high-glucose or Hhip overexpression alone in IRPTCs reduced MMP (Figure 6a–d, JC-1 assay) and promoted mitochondrial fragmentation (Figure 6e,f, 3D mitochondria), as evidenced by punctate and rounded mitochondrial structures, and these mitochondrial alterations were further exacerbated when both conditions were combined. Apparently, either senolytics (D/Q) or siRNA-Hhip treatment markedly restored mitochondrial network integrity (Figure 6). Semi-quantitation of mitochondrial network integrity supported these observations (Figure 6f).
Figure 6.
Mitochondrial network integrity in IRPTCs exposed to normal (NG) vs. high glucose (HG) ± senolytics (D, 2 nM/Q, 20 nM) for 24 h. (a–d) JC-1 staining and JC-1 aggregates/monomers ratio. Scale bar, 50 µm. (a,b) IRPTCs (control vs. OVE); (c,d) IRPTCs (Scr siRNA vs. Hhip siRNA); (e,f) 3D reconstructed mitochondria (pseudo-colored magenta) by Imaris (e) and semi-quantitation of mitochondrial AR (f). Scale bar, 5 μm. Data are shown as mean ± SEM. Each point represents an independent experiment. Statistics were measured via two-way ANOVA followed by Tukey’s post hoc test. * p < 0.05; ** p < 0.01; *** p < 0.005.
3.4. The Pink1-Optn-Dependent Mitophagy In Vivo and In Vitro
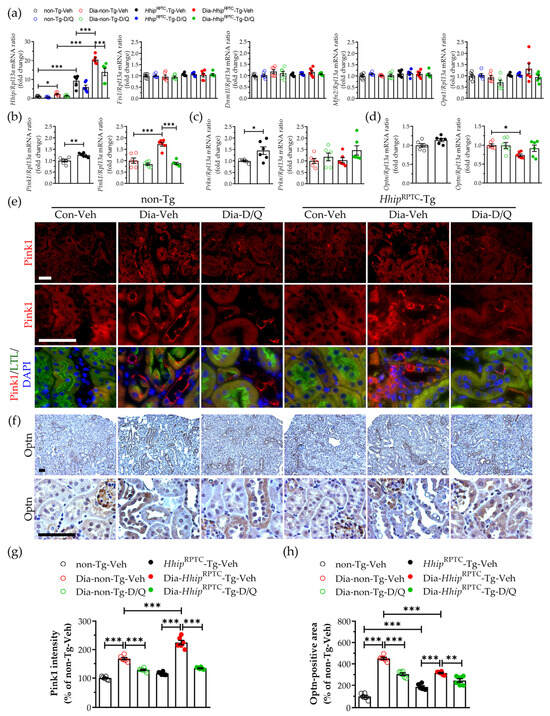
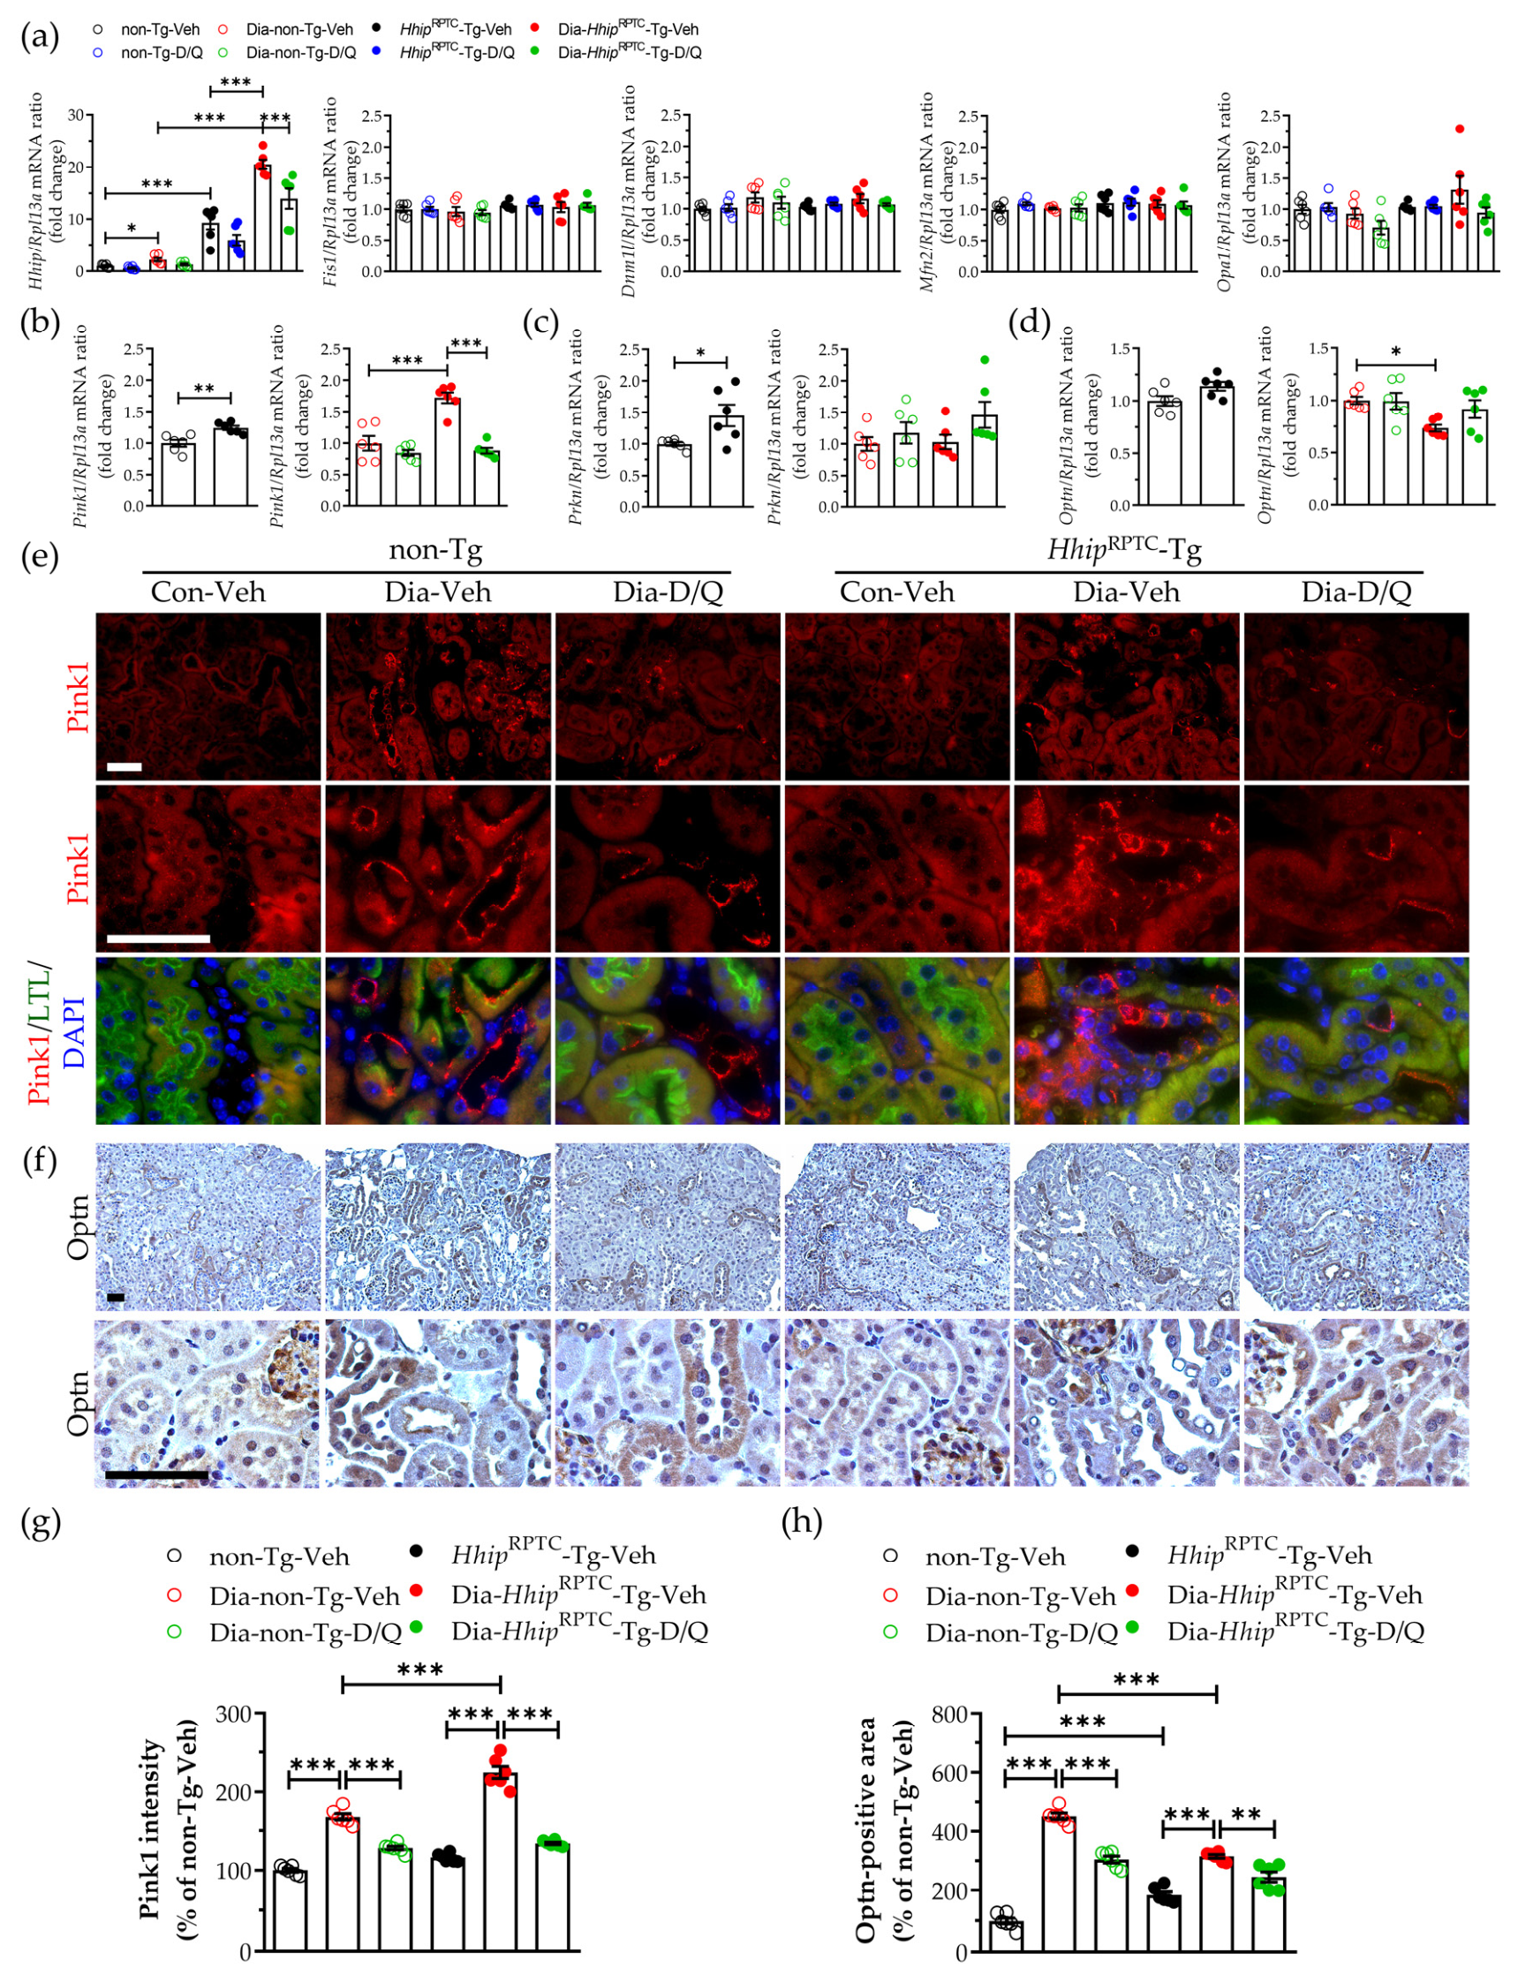
Several mitochondria-related genes [14,44] involved in mitochondrial dynamics (i.e., Fission mitochondrial 1(Fis1), Dynamin-1-Like (Dnm1l), Mitofusin 2 (Mfn2), Optic atrophy 1 (Opa1)) and mitophagy (i.e., PTEN-induced kinase 1 (Pink1), Parkin (Prkn) and Optineurin (Optn)) were further examined in isolated renal proximal tubules from our experimental mice (Figure 7a–d, qPCR). The mRNA levels of genes regulating mitochondrial dynamics, including Fis1, Dnm1l, Mfn2, and Opa1, remained comparable across all subgroups (Figure 7a). In contrast, the mitophagy-related genes, including Pink1 (Figure 7b), Prkn (Figure 7c), and Optn (Figure 7d), were relatively modestly but significantly altered in isolated renal proximal tubules from HhipRPTC-Tg compared with non-Tg mice, particularly under diabetic conditions.
Figure 7.
Mitophagy in vivo. (a–d) qPCR analysis in isolated renal proximal tubules from experimental mice at 24 weeks old. (a) Hhip, Fis1, Dnm1l, Mfn2, and Opa1; (b) Pink1; (c) Prkn; (d) Optn. Data are shown as mean ± SEM. Each point represents an individual animal. Statistics were measured via three-way and/or one-way ANOVA followed by Tukey’s post hoc test, and Welch’s t-test. * p < 0.05; ** p < 0.01; *** p < 0.005; (e–h) IF/IHC staining in the kidney and semi-quantification of the corresponding staining. (e,g) Pink1/LTL co-IF staining (e) and semi-quantification (g); (f,h) Optn IHC staining (f) and semi-quantification (h). Scale bar, 50 µm. Data on semi-quantification of relevant staining are shown as mean ± SEM. Each point represents an individual animal. Statistics were measured via two-way ANOVA followed by Tukey’s post hoc test. ** p < 0.01; *** p < 0.005.
We further verified the alteration in Pink1-Optn-dependent mitophagy [14,16,17,44] in vivo and in vitro. Compared with non-diabetic controls, both Pink1/Lotus tetragonolobus lectin (LTL)-IF (Figure 7e,g) and Optn-IHC expression (Figure 7f,h) were significantly increased in the kidneys of diabetic mice, particularly in injured RPTCs. However, damaged RPTCs in the kidneys of Dia-HhipRPTC-Tg mice exhibited more pronounced Pink1 accumulation and lower Optn expression than those in Dia-non-Tg mice. In contrast, senolytic (D/Q) treatment significantly attenuated Pink1 accumulation and restored Optn expression in the kidneys of both Dia-non-Tg and Dia-HhipRPTC-Tg mice.
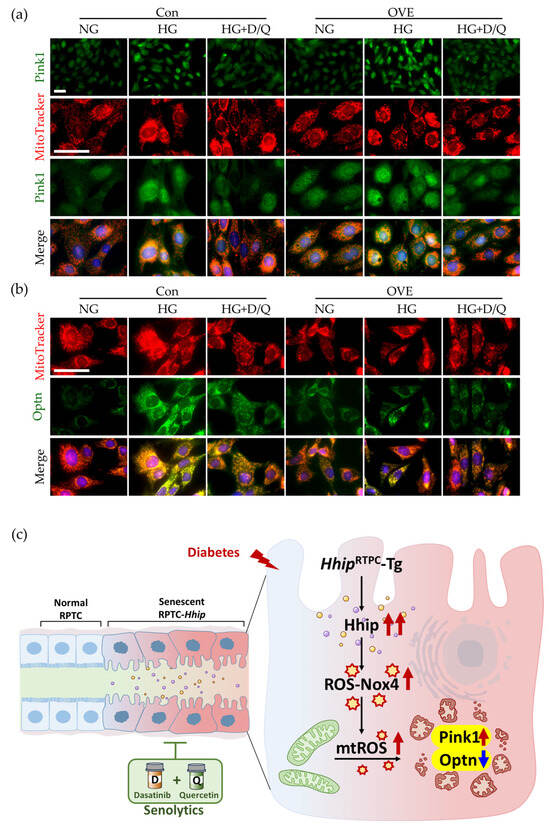
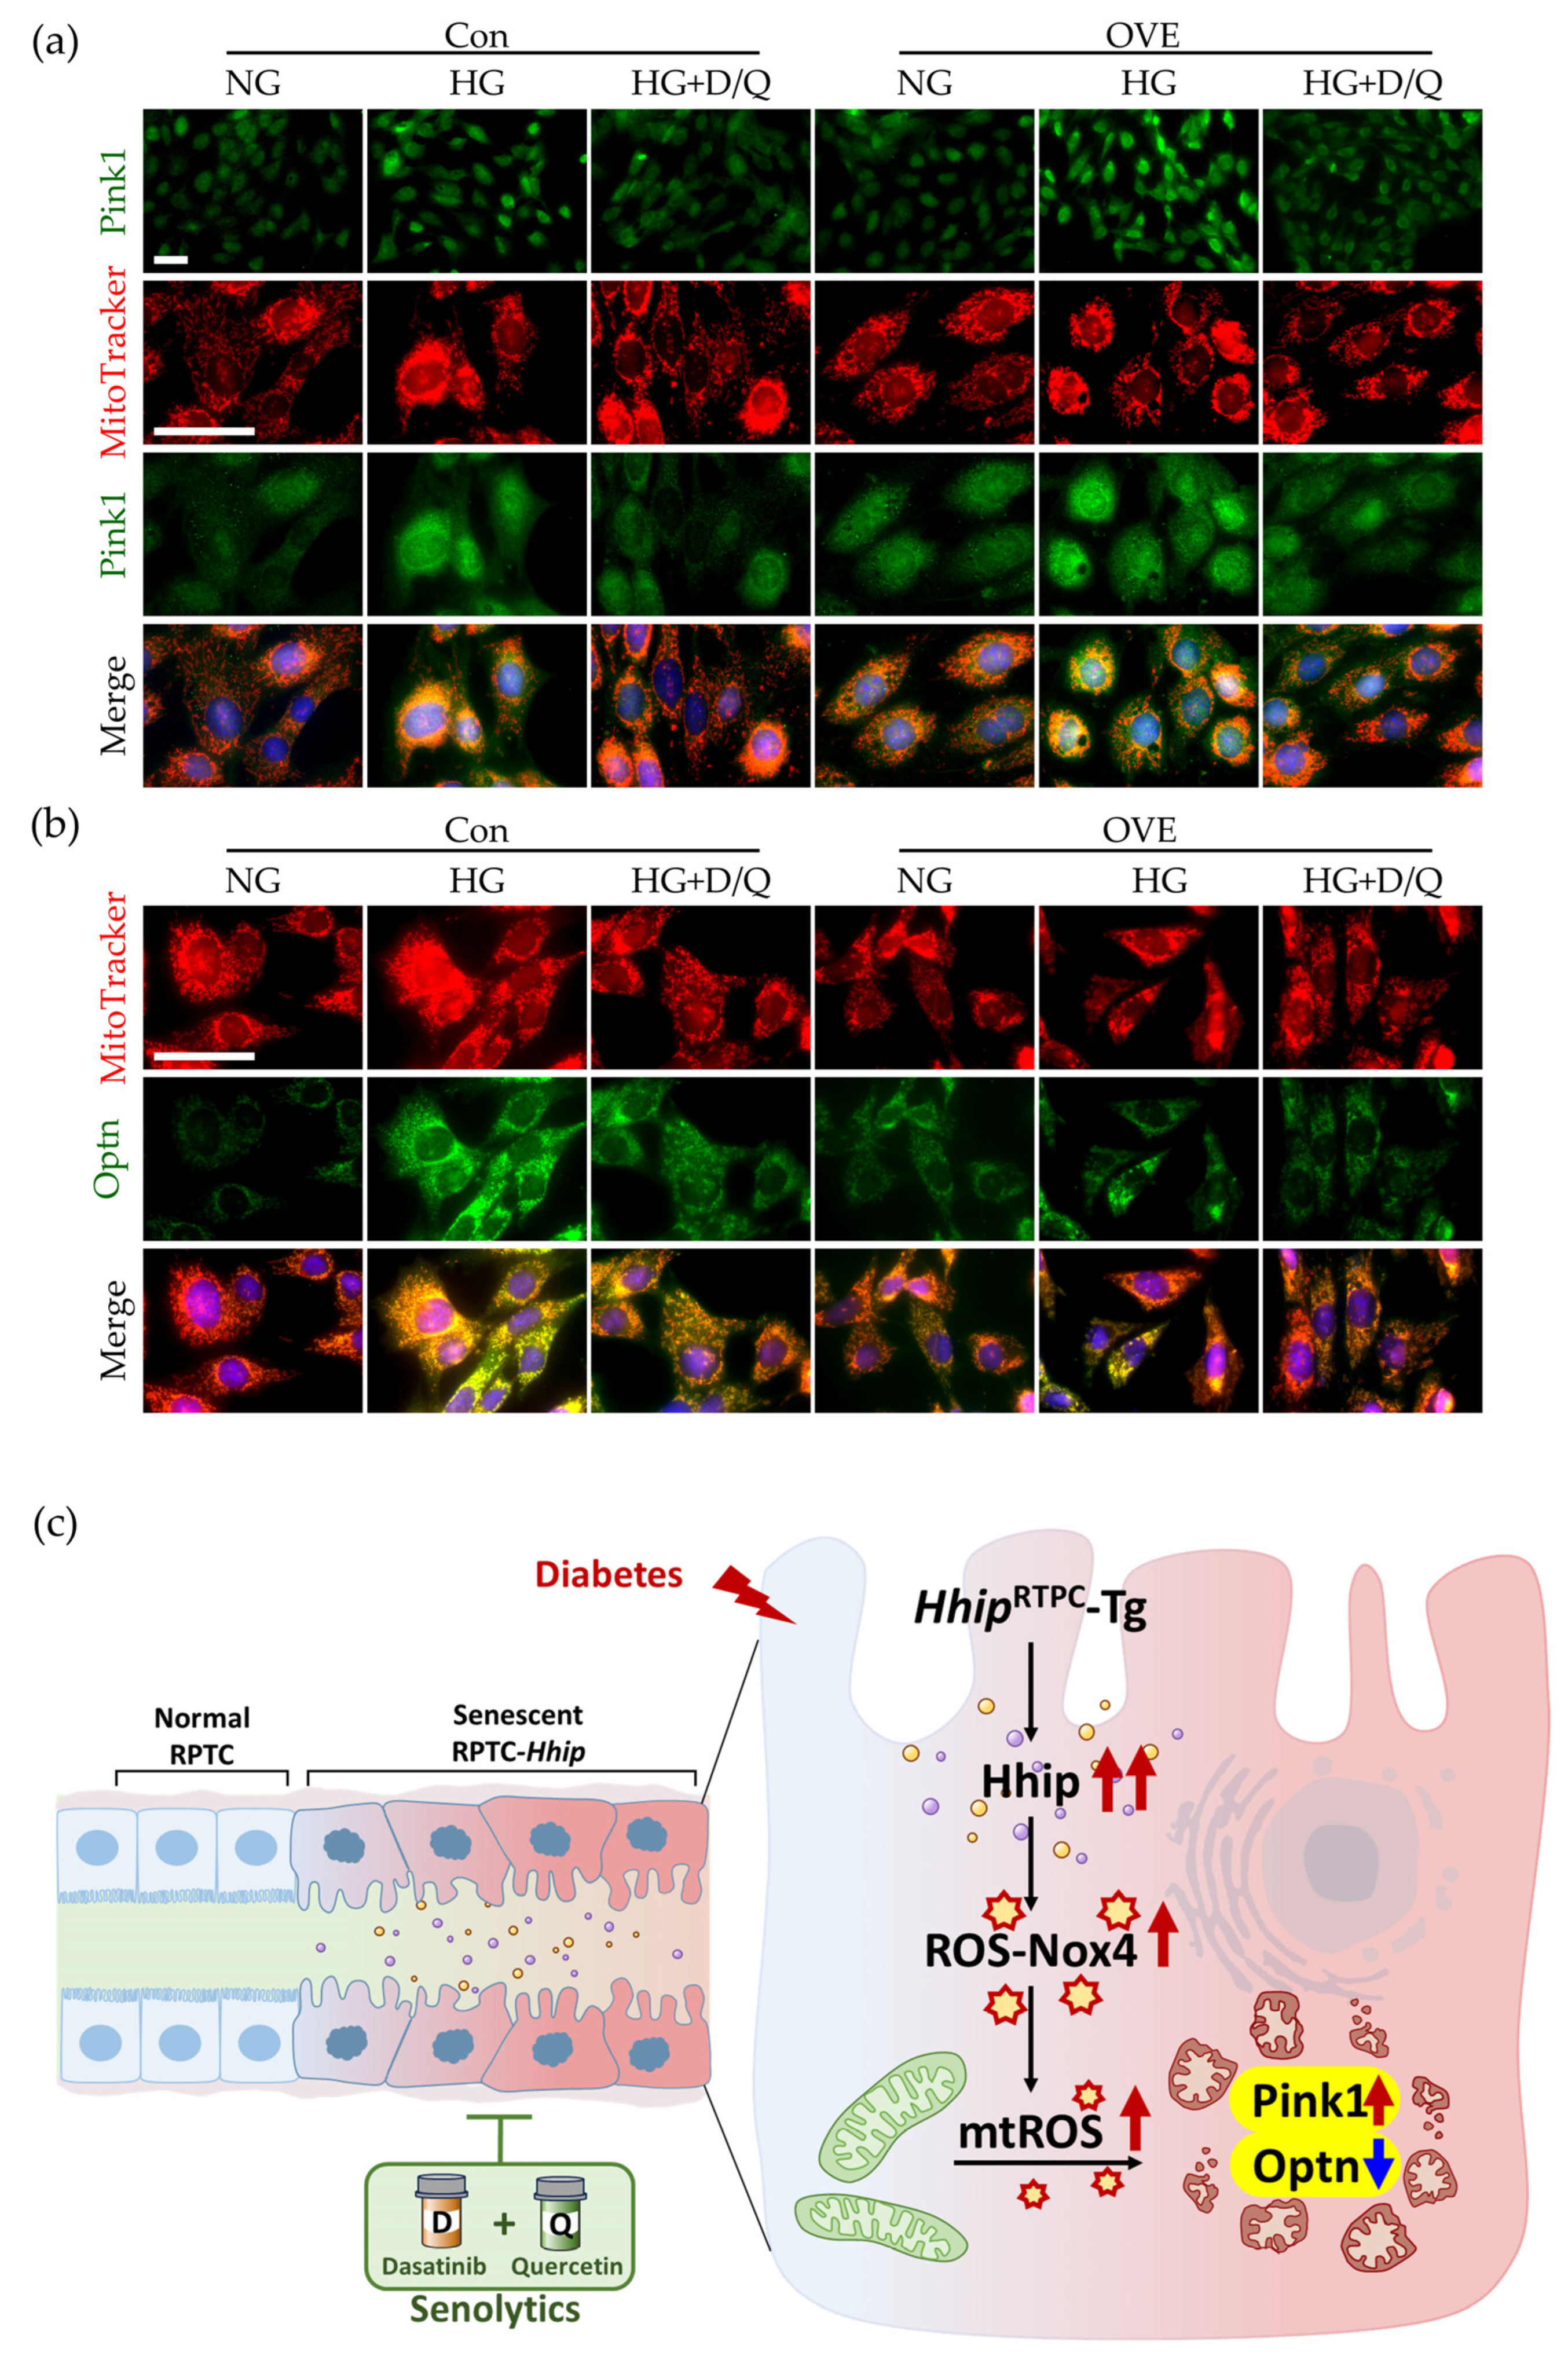
In vitro, compared with normal glucose, high glucose stimulated both Pink1 (Figure 8a; Supplementary Material Figure S3a) and Optn1 IF expression (Figure 8b; Supplementary Material Figure S3b) in IRPTCs with or without Hhip overexpression. Under a high-glucose milieu, Hhip-overexpressing IRPTCs exhibited more pronounced Pink1 accumulation and lower Optn expression than IRPTC control. In contrast, senolytic (D/Q) treatment attenuated these high-glucose-induced alterations in Pink1 and Optn expression in IRPTCs, both with and without Hhip overexpression (Figure 8a,b; Supplementary Material Figure S3a,b).
Figure 8.
Mitophagy in vitro. (a) Pink1/MitoTracker co-IF staining; (b) Optn/MitoTracker co-IF staining. IRPTCs (control vs. OVE) exposed to normal (NG) vs. high glucose (HG) ± senolytics (D, 2 nM/Q, 20 nM) for 24 h. Scale bar, 50 µm. (c) A schematic illustration of how excessive Hhip-induced mtROS disrupts the Pink1–Optn mitophagy pathway, characterized by Pink1 accumulation and reduced Optn expression. Impaired Pink1–Optn-mediated mitophagy consequently compromises the clearance of damaged mitochondria, resulting in mitochondrial dysmorphology. In contrast, senolytic (D/Q) treatment counteracts the effects of Hhip in RPTCs, thereby restoring mitochondrial network integrity under high-glucose conditions.
4. Discussion
In this study, as shown in the schematic in Figure 8c, we demonstrated that excessive tubular Hhip in RPTCs accelerates RPTC remodeling through enhanced cellular senescence, increased oxidative stress, and mitochondrial network fragmentation, thereby aggravating DKD tubulopathy. In contrast, senolytic (D/Q) treatment may interrupt and prevent this process, representing a novel therapeutic strategy to halt DKD progression.
Tubular senescence has emerged as a fundamental mechanism underlying the progression of DKD, extending beyond the traditional glomerulocentric paradigm to actively drive tubular dysfunction, persistent inflammation, and interstitial fibrosis [1,5,8,9,10]. RPTCs are highly susceptible to chronic hyperglycemia and oxidative stress [40,41]. Consistent with our previous observations [29,32], here, diabetic kidneys exhibited increased markers of cellular senescence and oxidative stress. Importantly, intermittent senolytic (D/Q) administration significantly reduced tubular senescence and oxidative stress in diabetic kidneys.
Since Nox4 is abundantly expressed in RPTCs and represents a major source of sustained ROS generation in DKD [45,46], we found that exacerbated DKD tubulopathy is associated with pronounced RPTC-Nox4 expression in the kidney of Dia-HhipRPTC-Tg cf. Dia-non-Tg mice, suggesting that increased tubular Hhip expression is not merely a consequence of diabetes but also actively contributes to ROS-Nox4-mediated DKD tubulopathy. Notably, senolytic (D/Q) treatment significantly reduced serum creatinine levels in Dia-HhipRPTC-Tg mice, underscoring an improvement in kidney function. Despite a favorable trend, senolytic (D/Q) treatment did not significantly prevent the increase in urinary albumin excretion in our diabetic mice during the 6 h urine collection period, possibly because diabetic urine samples were highly diluted, resulting in urinary creatinine levels indeed below the reliable detection range and precluding normalization of urinary albumin to urinary creatinine. In vitro, Hhip overexpression and high glucose synergistically increased intracellular ROS, mtROS, and Nox4 expression, whereas Hhip silencing or senolytic (D/Q) treatment significantly attenuated these responses. Together, both in vivo and in vitro observations suggest that Hhip-mediated Nox4 induction likely reinforces oxidative stress, creating a vicious cycle that perpetuates mitochondrial damage and tubular dysfunction.
In DKD, high glucose and oxidative stress are key drivers of cellular senescence and mitochondrial dysmorphology and/or dysfunction in RPTCs [3,5,10,36,47]. In this study, Hhip overexpression induced mtROS-mediated mitochondrial fragmentation, reduced ATP production, and impaired mitochondrial networking, with more pronounced effects under diabetic conditions. Previously, we demonstrated that hyperglycemia stimulates Hhip gene expression in RPTCs, and this increased Hhip further activates ATM/ATR-mediated DNA damage responses implicated in DKD tubulopathy [32]. Notably, beyond its canonical role in DNA repair, ATM also functions as a mtROS sensor that maintains mitochondrial homeostasis [14,48,49]. Together, our current data suggest that sustained Hhip expression might potentially activate the ATM-mediated DNA damage response and promote mtROS accumulation, thereby driving mitochondrial abnormalities that links excessive Hhip to RPTC senescence.
Despite the fact that senolytic (D/Q) treatment largely restored mitochondrial network integrity and reduced oxidative stress including mtROS, it was unable to restore ATP production in IRPTCs exposed to high glucose or overexpressing Hhip, which differs from another report showing that senolytics (D/Q) increased ATP levels in high-glucose-treated HK2 cells [22]. The basis for this discrepancy remains unclear and may reflect differences in experimental models or conditions. In fact, the dissociation between mitochondrial structure and function is increasingly recognized in DKD [50,51,52]. It appears that the beneficial effects of senolytics (D/Q) extend beyond the elimination of senescent cells. Removal of senescent cells may alleviate the chronic oxidative environment that perpetuates mitochondrial dysmorphology, but its restoration of mitochondrial morphology alone may be insufficient to fully recover mitochondrial bioenergetic capacity once DKD injury is established, warranting further mechanistic investigation in careful experimental settings.
Focusing on mitochondrial network integrity, we examined several mitochondria-related genes [14,44] in isolated renal proximal tubules from our experimental mice. Notably, the genes involved in mitochondrial dynamics (i.e., fission and/or fusion), including Fis1, Dnm1l, Mfn2, and Opa1, remained largely unchanged, whereas modest but significant changes in mitophagy-related genes including Pink1, Prkn, and Optn might be associated with the observed mitochondrial dysmorphology.
Of note, mtROS serves as an important signal for initiating Pink1/Parkin–Optn mitophagy, whereas efficient mitophagic clearance is essential for maintaining mitochondrial network integrity and redox homeostasis [14,44]. However, under sustained oxidative stress, excessive mtROS may overwhelm or disrupt the Pink1/Parkin–Optn mitophagy, impairing the clearance of damaged mitochondria and thereby further exacerbating mitochondrial abnormalities [12,14,53,54].
In DKD, a marked increase in Pink1 expression is exhibited in diabetic kidneys [50,51,52], particularly DKD-affected RPTCs [16,17]. However, the severe, unremitting loss of mitochondrial membrane potential and excessive mtROS lead to trapped and accumulating Pink1, and the downstream execution of mitophagy appears to be paralyzed, as reflected by suppressed Optn expression in injured RPTCs. As potential interpretations, reduced Optn expression may impair the clearance of damaged mitochondria, thereby exacerbating mitochondrial dysfunction and promoting tubulointerstitial inflammation and RPTC senescence, through activation of the NLRP3 inflammasome and subsequent release of IL-1β and IL-18, as reported [16,17]. In line, here, we found that increased Pink1 expression together with reduced Optn expression in RPTCs of either diabetic HhipRPTC-Tg or IRPTCs overexpressing Hhip in vitro, suggesting that excessive Hhip might be associated with destabilization of mitochondrial structure by disrupting the efficient execution of mitophagy, resulting in defective clearance of damaged mitochondria.
This study has several limitations. Although alterations in Pink1 and Optn expression suggest impaired mitophagy, direct measurements of mitophagic flux and mitochondrial respiration, as well as gain- and loss-of-function experiments targeting Pink1 and/or Optn, are required to fully establish the mechanisms by which Hhip regulates mitochondrial homeostasis. In addition, whether excessive Hhip targets other mechanisms linked to mitochondrial abnormalities in diabetes remains to be determined. Furthermore, while senolytic (D/Q) treatment effectively attenuated Hhip-mediated tubular injury in this experimental model, additional studies are needed to establish the long-term efficacy and safety of senolytic (D/Q) therapy and to determine whether similar mechanisms operate in human DKD.
In summary, excessive Hhip may amplify diabetic tubulopathy by promoting mtROS and potentially impairing Pink1/Parkin–Optn-mediated mitophagy, thereby worsening tubular senescence and dysfunction in DKD. Senolytic (D/Q) treatment attenuates this pathological process despite persistent hyperglycemia and limited ATP restoration. Further studies are required to establish the underlying mechanisms and validate these findings.
Supplementary Materials
The following supporting information can be downloaded at https://www.mdpi.com/article/10.3390/antiox15111496/s1, Figure S1: The semi-quantification of SA-β-gal-positive staining (Figure 3e,f); Figure S2: The semi-quantification of IF-positive staining (Figure 5a–d); Figure S3: The semi-quantification of IF-positive staining (Figure 8a,b); Table S1: qPCR primers; Table S2: Antibody Information.
Author Contributions
Principal investigators J.S.D.C. and S.-L.Z. are co-guarantors of these data and responsible for study conception and design; as such, they had full access to all study data, take responsibility for data integrity, and vouch for the accuracy of data analysis. S.-L.Z. drafted the manuscript. S.-Y.C., Y.-C.P., M.-C.L., W.-X.Y. and J.P., contributed to the in vivo and in vitro experiments and data collection. J.R.I., J.S.D.C. and S.-L.Z. contributed to the discussion and reviewed/edited the manuscript. All authors have read and agreed to the published version of the manuscript.
Funding
This work was supported, in part, by grants from the Canadian Institutes of Health Research (CIHR, PJ9-179813/PJ9-18014/PJT-186199 to JSDC; CIHR PJT173512/PJT173534/PTJ206252 to SLZ). No financial arrangements were made with commercial companies in this manuscript.
Institutional Review Board Statement
The animal study protocol was approved by the CRCHUM Animal Care Committee (approval # CM22036SZs).
Informed Consent Statement
All animal procedures were performed in accordance with the Principles of Laboratory Animal Care (NIH Publication No. 85-23, revised 1985; https://grants.nih.gov/policy-and-compliance/policy-topics/animal-welfare/laws-regulations/phs-policy, accessed on 29 June 2023).
Data Availability Statement
The original contributions presented in this study are included in the article/Supplementary Material. Further inquiries can be directed to the corresponding authors.
Acknowledgments
The authors thank the Centre de recherche du Centre hospitalier de l’Université de Montréal (CRCHUM) and Département de médecine, Université de Montréal, for their research support.
Conflicts of Interest
The authors declare no conflicts of interest.
Abbreviations
The following abbreviations are used in this manuscript:
| AR | Aspect Ratio |
| BW | Body weight |
| CRCHUM | Centre hospitalier de l’Université de Montréal |
| DHE | Dihydroethidium |
| DKD | Diabetic kidney disease |
| D/Q | Dasatinib (D)/Quercetin (Q) |
| Dnm11 | Dynamin-1-Like |
| Fis1 | Fission mitochondrial 1 |
| GFR | Glomerular filtration rate |
| HG | High glucose |
| Hhip | Hedgehog interacting protein |
| IF | Immunofluorescence |
| IHC | Immunohistochemistry |
| IRPTCs | Immortalized renal proximal tubular cell line |
| LTL | Lotus tetragonolobus lectin |
| Mfn2 | Mitofusin 2 |
| mtROS | Mitochondrial reactive oxygen species |
| NG | Normal glucose |
| Nox4 | NADPH oxidase 4 |
| Opa1 | Optic atrophy 1 |
| Optn | Optineurin |
| OVE | Overexpression |
| Pink1 | PTEN-induced kinase 1 (Pink1) |
| Prkn | Parkin |
| RPTCs | Renal proximal tubular cells |
| Scr | Scrambled RNA |
| siRNA | Small interfering RNA |
| Tg | Transgenic |
References
- Patel, H.A.; Wang, J.; Zinn, C.J.; Learmonth, M.; Bian, X.; Jurk, D.; Lerman, L.O.; Wolfram, J.; Hickson, L.J. Targeting cellular senescence in diabetic kidney disease: Potential of regenerative, cell-based therapies and other senotherapeutic approaches. Kidney Int. 2026, 109, 684–703. [Google Scholar] [CrossRef] [Scilit] [PubMed]
- Vallon, V.; Thomson, S.C. The tubular hypothesis of nephron filtration and diabetic kidney disease. Nat. Rev. Nephrol. 2020, 16, 317–336. [Google Scholar] [CrossRef] [Scilit] [PubMed]
- Vallon, V.; Verma, S. Effects of SGLT2 Inhibitors on Kidney and Cardiovascular Function. Annu. Rev. Physiol. 2021, 83, 503–528. [Google Scholar] [CrossRef] [Scilit] [PubMed]
- Mohandes, S.; Doke, T.; Hu, H.; Mukhi, D.; Dhillon, P.; Susztak, K. Molecular pathways that drive diabetic kidney disease. J. Clin. Investig. 2023, 133, e165654. [Google Scholar] [CrossRef] [Scilit] [PubMed]
- Chanvillard, L.; Mason, T.; Ferenbach, D.A. Understanding and targeting senescence in kidney disease. Clin. Kidney J. 2025, 18, sfaf190. [Google Scholar] [CrossRef] [Scilit] [PubMed]
- Hu, L.; Li, H.; Zi, M.; Li, W.; Liu, J.; Yang, Y.; Zhou, D.; Kong, Q.P.; Zhang, Y.; He, Y. Why Senescent Cells Are Resistant to Apoptosis: An Insight for Senolytic Development. Front. Cell Dev. Biol. 2022, 10, 822816. [Google Scholar] [CrossRef] [Scilit] [PubMed]
- Huang, W.; Hickson, L.J.; Eirin, A.; Kirkland, J.L.; Lerman, L.O. Cellular senescence: The good, the bad and the unknown. Nat. Rev. Nephrol. 2022, 18, 611–627. [Google Scholar] [CrossRef] [Scilit] [PubMed]
- Miwa, S.; Kashyap, S.; Chini, E.; von Zglinicki, T. Mitochondrial dysfunction in cell senescence and aging. J. Clin. Investig. 2022, 132, e158447. [Google Scholar] [CrossRef] [Scilit] [PubMed]
- Reck, M.; Baird, D.P.; Veizades, S.; Sutherland, C.; Bell, R.M.B.; Hur, H.; Cairns, C.; Janas, P.P.; Campbell, R.; Nam, A.; et al. Multiomic analysis of human kidney disease identifies a tractable inflammatory and pro-fibrotic tubular cell phenotype. Nat. Commun. 2025, 16, 4745. [Google Scholar] [CrossRef] [Scilit] [PubMed]
- Bhargava, P.; Schnellmann, R.G. Mitochondrial energetics in the kidney. Nat. Rev. Nephrol. 2017, 13, 629–646. [Google Scholar] [CrossRef] [Scilit] [PubMed]
- Kataura, T.; Wilson, N.; Ma, G.; Korolchuk, V.I. Mitophagy as a guardian against cellular aging. Autophagy 2025, 21, 249–251. [Google Scholar] [CrossRef] [Scilit] [PubMed]
- Kelly, G.; Kataura, T.; Panek, J.; Ma, G.; Salmonowicz, H.; Davis, A.; Kendall, H.; Brookes, C.; Ayine-Tora, D.M.; Banks, P.; et al. Suppressed basal mitophagy drives cellular aging phenotypes that can be reversed by a p62-targeting small molecule. Dev. Cell 2024, 59, 1924–1939.e7. [Google Scholar] [CrossRef] [Scilit] [PubMed]
- Kubli, D.A.; Gustafsson, Å.B. Mitochondria and mitophagy: The yin and yang of cell death control. Circ. Res. 2012, 111, 1208–1221. [Google Scholar] [CrossRef] [Scilit] [PubMed]
- Guo, Q.Q.; Wang, S.S.; Jiang, X.Y.; Xie, X.C.; Zou, Y.; Liu, J.W.; Guo, Y.; Li, Y.H.; Liu, X.Y.; Hao, S.; et al. Mitochondrial ROS triggers mitophagy through activating the DNA damage response signaling pathway. Proc. Natl. Acad. Sci. USA 2025, 122, e2502841122. [Google Scholar] [CrossRef] [Scilit] [PubMed]
- Medigovic, G.; Rachamala, H.K.; Dutta, S.K.; Pal, K. Structural and Functional Perspectives of Optineurin in Autophagy, Immune Signaling, and Cancer. Cells 2025, 14, 1746. [Google Scholar] [CrossRef] [Scilit] [PubMed]
- Chen, K.; Dai, H.; Yuan, J.; Chen, J.; Lin, L.; Zhang, W.; Wang, L.; Zhang, J.; Li, K.; He, Y. Optineurin-mediated mitophagy protects renal tubular epithelial cells against accelerated senescence in diabetic nephropathy. Cell Death Dis. 2018, 9, 105. [Google Scholar] [CrossRef] [Scilit] [PubMed]
- Chen, K.; Feng, L.; Hu, W.; Chen, J.; Wang, X.; Wang, L.; He, Y. Optineurin inhibits NLRP3 inflammasome activation by enhancing mitophagy of renal tubular cells in diabetic nephropathy. Faseb J. 2019, 33, 4571–4585. [Google Scholar] [CrossRef] [Scilit] [PubMed]
- Palmer, A.K.; Xu, M.; Zhu, Y.; Pirtskhalava, T.; Weivoda, M.M.; Hachfeld, C.M.; Prata, L.G.; van Dijk, T.H.; Verkade, E.; Casaclang-Verzosa, G.; et al. Targeting senescent cells alleviates obesity-induced metabolic dysfunction. Aging Cell 2019, 18, e12950. [Google Scholar] [CrossRef] [Scilit] [PubMed]
- Palmer, A.K.; Tchkonia, T.; Kirkland, J.L. Senolytics: Potential for Alleviating Diabetes and Its Complications. Endocrinology 2021, 162, bqab058. [Google Scholar] [CrossRef] [Scilit] [PubMed]
- Saccon, T.D.; Nagpal, R.; Yadav, H.; Cavalcante, M.B.; Nunes, A.D.C.; Schneider, A.; Gesing, A.; Hughes, B.; Yousefzadeh, M.; Tchkonia, T.; et al. Senolytic Combination of Dasatinib and Quercetin Alleviates Intestinal Senescence and Inflammation and Modulates the Gut Microbiome in Aged Mice. J. Gerontol. Ser. A Biol. Sci. Med. Sci. 2021, 76, 1895–1905. [Google Scholar] [CrossRef] [Scilit] [PubMed]
- Li, C.; Shen, Y.; Huang, L.; Liu, C.; Wang, J. Senolytic therapy ameliorates renal fibrosis postacute kidney injury by alleviating renal senescence. Faseb J. 2021, 35, e21229, Erratum in Faseb J. 2025, 39, e70860. https://doi.org/10.1096/fj.202502421. [Google Scholar] [CrossRef] [Scilit] [PubMed]
- Guo, X.; Wen, S.; Wang, J.; Zeng, X.; Yu, H.; Chen, Y.; Zhu, X.; Xu, L. Senolytic combination of dasatinib and quercetin attenuates renal damage in diabetic kidney disease. Phytomedicine 2024, 130, 155705. [Google Scholar] [CrossRef] [Scilit] [PubMed]
- Chuang, P.T.; McMahon, A.P. Vertebrate Hedgehog signalling modulated by induction of a Hedgehog-binding protein. Nature 1999, 397, 617–621. [Google Scholar] [CrossRef] [Scilit] [PubMed]
- Griffiths, S.C.; Schwab, R.A.; El Omari, K.; Bishop, B.; Iverson, E.J.; Malinauskas, T.; Dubey, R.; Qian, M.; Covey, D.F.; Gilbert, R.J.C.; et al. Hedgehog-Interacting Protein is a multimodal antagonist of Hedgehog signalling. Nat. Commun. 2021, 12, 7171. [Google Scholar] [CrossRef] [Scilit] [PubMed]
- Kwong, L.; Bijlsma, M.F.; Roelink, H. Shh-mediated degradation of Hhip allows cell autonomous and non-cell autonomous Shh signalling. Nat. Commun. 2014, 5, 4849. [Google Scholar] [CrossRef] [Scilit] [PubMed]
- Jiang, J.; Hui, C.C. Hedgehog signaling in development and cancer. Dev. Cell 2008, 15, 801–812. [Google Scholar] [CrossRef] [Scilit] [PubMed]
- Wang, L.W.; Lin, H.; Lu, Y.; Xia, W.; Gao, J.; Li, Z.S. Sonic hedgehog expression in a rat model of chronic pancreatitis. World J. Gastroenterol. 2014, 20, 4712–4717. [Google Scholar] [CrossRef] [Scilit] [PubMed]
- Liao, Y.; Liao, Y.; Wen, F. Association of human Hedgehog interacting protein gene polymorphisms with the risk of chronic obstructive pulmonary disease: A meta-analysis. Expert Rev. Respir. Med. 2022, 16, 447–459. [Google Scholar] [CrossRef] [Scilit] [PubMed]
- Chang, S.Y.; Liao, M.C.; Miyata, K.N.; Pang, Y.; Zhao, X.P.; Peng, J.; Rivard, A.; Ingelfinger, J.R.; Chan, J.S.D.; Zhang, S.L. Canagliflozin inhibits hedgehog interacting protein (Hhip) induction of tubulopathy in diabetic Akita mice. Transl. Res. 2025, 277, 13–26. [Google Scholar] [CrossRef] [Scilit] [PubMed]
- Miyata, K.N.; Zhao, X.P.; Chang, S.Y.; Liao, M.C.; Lo, C.S.; Chenier, I.; Ethier, J.; Cailhier, J.F.; Lattouf, J.B.; Troyanov, S.; et al. Increased urinary excretion of hedgehog interacting protein (uHhip) in early diabetic kidney disease. Transl. Res. 2020, 217, 1–10. [Google Scholar] [CrossRef] [Scilit] [PubMed]
- Zhao, X.P.; Chang, S.Y.; Liao, M.C.; Lo, C.S.; Chenier, I.; Luo, H.; Chiasson, J.L.; Ingelfinger, J.R.; Chan, J.S.D.; Zhang, S.L. Hedgehog Interacting Protein Promotes Fibrosis and Apoptosis in Glomerular Endothelial Cells in Murine Diabetes. Sci. Rep. 2018, 8, 5958. [Google Scholar] [CrossRef] [Scilit] [PubMed]
- Zhao, X.P.; Chang, S.Y.; Pang, Y.; Liao, M.C.; Peng, J.; Ingelfinger, J.R.; Chan, J.S.D.; Zhang, S.L. Hedgehog interacting protein activates sodium-glucose cotransporter 2 expression and promotes renal tubular epithelial cell senescence in a mouse model of type 1 diabetes. Diabetologia 2023, 66, 223–240. [Google Scholar] [CrossRef] [Scilit] [PubMed]
- Zhao, X.P.; Liao, M.C.; Chang, S.Y.; Abdo, S.; Aliou, Y.; Chenier, I.; Ingelfinger, J.R.; Zhang, S.L. Maternal diabetes modulates kidney formation in murine progeny: The role of hedgehog interacting protein (HHIP). Diabetologia 2014, 57, 1986–1996. [Google Scholar] [CrossRef] [Scilit] [PubMed]
- Natarajan, N.; Florentin, J.; Johny, E.; Xiao, H.; O’Neil, S.P.; Lei, L.; Shen, J.; Ohayon, L.; Johnson, A.R.; Rao, K.; et al. Aberrant mitochondrial DNA synthesis in macrophages exacerbates inflammation and atherosclerosis. Nat. Commun. 2024, 15, 7337. [Google Scholar] [CrossRef] [Scilit] [PubMed]
- Gerhardt, L.M.S.; Liu, J.; Koppitch, K.; Cippà, P.E.; McMahon, A.P. Single-nuclear transcriptomics reveals diversity of proximal tubule cell states in a dynamic response to acute kidney injury. Proc. Natl. Acad. Sci. USA 2021, 118, e2026684118. [Google Scholar] [CrossRef] [Scilit] [PubMed]
- Fan, X.; Yang, M.; Lang, Y.; Lu, S.; Kong, Z.; Gao, Y.; Shen, N.; Zhang, D.; Lv, Z. Mitochondrial metabolic reprogramming in diabetic kidney disease. Cell Death Dis. 2024, 15, 442. [Google Scholar] [CrossRef] [Scilit] [PubMed]
- Sachetelli, S.; Liu, Q.; Zhang, S.L.; Liu, F.; Hsieh, T.J.; Brezniceanu, M.L.; Guo, D.F.; Filep, J.G.; Ingelfinger, J.R.; Sigmund, C.D.; et al. RAS blockade decreases blood pressure and proteinuria in transgenic mice overexpressing rat angiotensinogen gene in the kidney. Kidney Int. 2006, 69, 1016–1023. [Google Scholar] [CrossRef] [Scilit] [PubMed]
- Hickson, L.J.; Langhi Prata, L.G.P.; Bobart, S.A.; Evans, T.K.; Giorgadze, N.; Hashmi, S.K.; Herrmann, S.M.; Jensen, M.D.; Jia, Q.; Jordan, K.L.; et al. Senolytics decrease senescent cells in humans: Preliminary report from a clinical trial of Dasatinib plus Quercetin in individuals with diabetic kidney disease. EBioMedicine 2019, 47, 446–456, Erratum in EBioMedicine 2020, 52, 102595. https://doi.org/10.1016/j.ebiom.2019.12.004. [Google Scholar] [CrossRef] [Scilit] [PubMed]
- Knoppert, S.N.; Valentijn, F.A.; Nguyen, T.Q.; Goldschmeding, R.; Falke, L.L. Cellular Senescence and the Kidney: Potential Therapeutic Targets and Tools. Front Pharmacol. 2019, 10, 770. [Google Scholar] [CrossRef] [Scilit] [PubMed]
- Yang, W.X.; Pang, Y.C.; Liao, M.C.; Peng, J.; Leal, D.N.; Yamashita, M.; Miyata, K.N.; Filep, J.G.; Ingelfinger, J.R.; Zhang, S.L.; et al. Intrarenal renin-angiotensin system inactivation ameliorates tubulopathy via attenuation of mitochondrial oxidative stress, dysfunction and senescence in diabetes. Clin. Sci. 2026, 140, 321–338. [Google Scholar] [CrossRef] [Scilit] [PubMed]
- Yang, W.X.; Su, K.; Liao, M.C.; Zhou, J.; Peng, J.; Hébert, M.J.; Leal, D.N.; Yamashita, M.; Miyata, K.N.; Filep, J.G.; et al. Renal Tubule-Specific Angiotensinogen Deletion Attenuates SGLT2 Expression and Ameliorates Diabetic Kidney Disease in Murine Models of Type 1 Diabetes. Diabetes 2025, 74, 554–568. [Google Scholar] [CrossRef] [Scilit] [PubMed]
- Ingelfinger, J.R.; Jung, F.; Diamant, D.; Haveran, L.; Lee, E.; Brem, A.; Tang, S.S. Rat proximal tubule cell line transformed with origin-defective SV40 DNA: Autocrine ANG II feedback. Am. J. Physiol. 1999, 276, F218–F227. [Google Scholar] [CrossRef] [Scilit] [PubMed]
- Chaudhry, A.; Shi, R.; Luciani, D.S. A pipeline for multidimensional confocal analysis of mitochondrial morphology, function, and dynamics in pancreatic β-cells. Am. J. Physiol. Endocrinol. Metab. 2020, 318, E87–E101. [Google Scholar] [CrossRef] [Scilit] [PubMed]
- Tábara, L.C.; Segawa, M.; Prudent, J. Molecular mechanisms of mitochondrial dynamics. Nat. Rev. Mol. Cell Biol. 2025, 26, 123–146. [Google Scholar] [CrossRef] [Scilit] [PubMed]
- Kim, S.M.; Kim, Y.G.; Jeong, K.H.; Lee, S.H.; Lee, T.W.; Ihm, C.G.; Moon, J.Y. Angiotensin II-induced mitochondrial Nox4 is a major endogenous source of oxidative stress in kidney tubular cells. PLoS ONE 2012, 7, e39739. [Google Scholar] [CrossRef] [Scilit] [PubMed]
- Irazabal, M.V.; Torres, V.E. Reactive Oxygen Species and Redox Signaling in Chronic Kidney Disease. Cells 2020, 9, 1342. [Google Scholar] [CrossRef] [Scilit] [PubMed]
- Docherty, M.H.; O’Sullivan, E.D.; Bonventre, J.V.; Ferenbach, D.A. Cellular Senescence in the Kidney. J. Am. Soc. Nephrol. 2019, 30, 726–736. [Google Scholar] [CrossRef] [Scilit] [PubMed]
- Guo, Z.; Kozlov, S.; Lavin, M.F.; Person, M.D.; Paull, T.T. ATM activation by oxidative stress. Science 2010, 330, 517–521. [Google Scholar] [CrossRef] [Scilit] [PubMed]
- Guo, Q.Q.; Wang, S.S.; Zhang, S.S.; Xu, H.D.; Li, X.M.; Guan, Y.; Yi, F.; Zhou, T.T.; Jiang, B.; Bai, N.; et al. ATM-CHK2-Beclin 1 axis promotes autophagy to maintain ROS homeostasis under oxidative stress. Embo J. 2020, 39, e103111. [Google Scholar] [CrossRef] [Scilit] [PubMed]
- Huang, C.; Bian, J.; Cao, Q.; Chen, X.M.; Pollock, C.A. The Mitochondrial Kinase PINK1 in Diabetic Kidney Disease. Int. J. Mol. Sci. 2021, 22, 1525. [Google Scholar] [CrossRef] [Scilit] [PubMed]
- Zhang, X.; Feng, J.; Li, X.; Wu, D.; Wang, Q.; Li, S.; Shi, C. Mitophagy in Diabetic Kidney Disease. Front. Cell Dev. Biol. 2021, 9, 778011. [Google Scholar] [CrossRef] [Scilit] [PubMed]
- Sung, M.J.; An, H.J.; Ha, M.H.; Park, S.H.; Jeong, H.Y.; Baek, J.; Lee, S.H.; Lee, Y.H.; Lee, S.Y. PTEN-induced kinase 1 exerts protective effects in diabetic kidney disease by attenuating mitochondrial dysfunction and necroptosis. Int. J. Biol. Sci. 2023, 19, 5145–5159. [Google Scholar] [CrossRef] [Scilit] [PubMed]
- Xiao, B.; Goh, J.Y.; Xiao, L.; Xian, H.; Lim, K.L.; Liou, Y.C. Reactive oxygen species trigger Parkin/PINK1 pathway-dependent mitophagy by inducing mitochondrial recruitment of Parkin. J. Biol. Chem. 2017, 292, 16697–16708. [Google Scholar] [CrossRef] [Scilit] [PubMed]
- Schofield, J.H.; Schafer, Z.T. Mitochondrial Reactive Oxygen Species and Mitophagy: A Complex and Nuanced Relationship. Antioxid. Redox Signal. 2021, 34, 517–530. [Google Scholar] [CrossRef] [Scilit] [PubMed]
Disclaimer/Publisher’s Note: The statements, opinions and data contained in all publications are solely those of the individual author(s) and contributor(s) and not of MDPI and/or the editor(s). MDPI and/or the editor(s) disclaim responsibility for any injury to people or property resulting from any ideas, methods, instructions or products referred to in the content. |
© 2026 by the authors. Licensee MDPI, Basel, Switzerland. This article is an open access article distributed under the terms and conditions of the Creative Commons Attribution (CC BY) license.