


Abstract
Irpex lacteus is a fungus that produces bioactive polysaccharides. In this study, the extraction of a crude Irpex lacteus polysaccharide-rich preparation (ILP) was optimized using response surface methodology (RSM) and a backpropagation neural network–genetic algorithm (BPNN–GA). The BPNN–GA-derived conditions, a liquid–solid ratio of 21 mL/g, extraction time of 3.2 h per cycle, temperature of 87 °C, and two extraction cycles, produced an ILP preparation yield of 5.31%. The carbohydrate fraction of ILP was composed mainly of glucose, galactose, and mannose. ILP exhibited predominantly an amorphous porous morphology, good thermal stability, and concentration-dependent DPPH and hydroxyl radical-scavenging activity. In LPS-stimulated RAW264.7 macrophages, ILP reduced intracellular ROS accumulation and malondialdehyde levels while restoring the activities of superoxide dismutase, catalase, and glutathione peroxidase. In a Caco-2/HT29-MTX-E12/RAW264.7 triple-culture model, ILP treatment increased transepithelial electrical resistance (TEER), reduced the basolateral-to-apical FITC-dextran fluorescence ratio, and altered the expression of mucus-associated markers, including ATOH1, MUC2, TFF3, and RETNLB. These effects were accompanied by lower TNF-α and IL-8 levels and changes in toll-like receptor 4 (TLR4)/myeloid differentiation primary response 88 (MyD88)/nuclear factor kappa B (NF-κB)-related markers. Collectively, these preliminary in vitro findings suggest that ILP may alleviate LPS-associated oxidative stress and inflammatory responses while supporting epithelial barrier function, highlighting its potential as a fungal-derived functional ingredient for intestinal health.
1. Introduction
The intestinal mucus barrier serves as the primary defense against luminal pathogens and toxins and is essential for maintaining gut homeostasis. Structurally, it comprises an epithelial cell monolayer and an overlying mucus layer, which collectively restrict the translocation of harmful substances while facilitating nutrient absorption. Disruption of this barrier, commonly driven by excessive oxidative and inflammatory stress, is a characteristic feature of various intestinal disorders [1]. Excessive production of reactive oxygen species (ROS) disrupts cellular redox homeostasis, promotes lipid peroxidation and oxidative damage, and impairs epithelial integrity and mucus production. Oxidative stress and inflammation can also reinforce each other, as inflammatory stimulation increases ROS generation, whereas sustained ROS accumulation further amplifies NF-κB-dependent inflammatory responses. In particular, hyperactivation of the toll-like receptor 4 (TLR4)/myeloid differentiation primary response 88 (MyD88)/nuclear factor kappa B (NF-κB) signaling cascade promotes the production of pro-inflammatory mediators that compromise epithelial barrier function and suppress mucus secretion [2]. Consequently, strategies that simultaneously alleviate oxidative stress and modulate inflammatory signaling have attracted considerable interest for protecting the intestinal mucus barrier.
Natural polysaccharides, particularly those isolated from medicinal and edible fungi, are widely recognized for their diverse bioactivities [3,4]. Among these, Irpex lacteus, a white-rot basidiomycete used in traditional medicine, has been reported to produce bioactive secondary metabolites. Although previous studies have confirmed the potential of fungal polysaccharides in alleviating intestinal inflammation, regulating oxidative stress, and restoring barrier function, information regarding the extraction optimization and functional evaluation of Irpex lacteus polysaccharides (ILP) remains scarce [5,6]. Previous research on Irpex lacteus polysaccharides has primarily focused on their isolation, purification, structural characteristics, and pharmacological activities. Zhang et al. isolated several water-soluble polysaccharide fractions from Irpex lacteus through hot-water extraction followed by ion-exchange and gel-filtration chromatography [7]. More recently, Liu et al. used cold-plasma pretreatment to enhance intracellular polysaccharide production in cultured Irpex lacteus mycelia [8]. However, the former study focused on polysaccharide fractionation and biological activity, whereas the latter focused on regulating intracellular polysaccharide biosynthesis. These studies did not compare statistical and neural-network models for optimizing hot-water extraction from Irpex lacteus fruiting bodies or connect extraction-process optimization with intestinal barrier-related evaluation.
The polysaccharide extraction process is a critical determinant of polysaccharide yield, physicochemical properties, and biological activity [9,10]. Response surface methodology (RSM), a widely used statistical approach, enables experimental design, model establishment, and evaluation of variable effects in extraction optimization [11]. However, RSM may not fully capture the complex nonlinear relationships among multiple variables. Recently, artificial neural networks (ANNs) have emerged as effective nonlinear modeling tools that simulate biological neural structures through self-learning and training, without requiring predefined mathematical models [11]. RSM combined with genetic algorithm–artificial neural network (GA-ANN) modeling has previously been used to optimize polysaccharide extraction from other biological materials, including Bletilla striata [11]. Among these approaches, backpropagation neural networks combined with genetic algorithms (BPNN-GA) have been applied to process prediction and optimization [12,13]. Together, these modeling approaches provide complementary perspectives on variable effects and nonlinear relationships in the multivariable extraction of polysaccharides from Irpex lacteus fruiting bodies.
In the present study, RSM and BPNN-GA were comparatively applied to an Irpex lacteus fruiting-body extraction system involving four practical variables: liquid–solid ratio (L/S), extraction time per cycle, extraction temperature, and number of extraction cycles. Additionally, the model-derived conditions were experimentally verified, and the resulting preparation was further evaluated through physicochemical characterization, chemical radical-scavenging assays, measurements of intracellular ROS accumulation, lipid peroxidation, and antioxidant enzyme activities in LPS-stimulated RAW264.7 macrophages, and a Caco-2/HT29-MTX-E12/RAW264.7 triple-culture intestinal barrier model. This design connects extraction-process optimization with physicochemical and cellular functional evaluation. This integrated approach will provide a basis for understanding the antioxidant, anti-inflammatory, and intestinal barrier-protective properties of ILP and evaluating its potential as a functional ingredient for supporting intestinal health.
2. Materials and Methods
2.1. Extraction of a Crude Polysaccharide-Rich Preparation from Irpex lacteus
Commercial fruiting bodies of Irpex lacteus were purchased from Jilin Langlang Northeast Specialty Products E-Commerce Co., Ltd. (Jilin, China). According to the supplier-provided product and traceability documentation, the material originated from the Changbai Mountain region, Jilin Province, China. The material was commercially obtained rather than cultivated by the authors. Its identification as Irpex lacteus was based on the supplier’s documentation; no independent taxonomic authentication or voucher specimen deposition was performed.
The dried fruiting bodies were pulverized, and 10.0 g of the resulting powder was mixed with distilled water at the liquid–solid ratio specified in the corresponding experimental design. Hot-water extraction was performed at the designated temperature and extraction time under continuous magnetic stirring at 350 rpm. After each extraction cycle, the mixture was centrifuged at 4500× g for 10 min, and the supernatant was collected. When multiple extraction cycles were performed, the remaining insoluble residue was resuspended in fresh distilled water at the designated liquid–solid ratio and subjected to the next extraction cycle under the same extraction temperature, extraction time, and stirring conditions. The supernatants obtained from all extraction cycles were pooled before ethanol precipitation. Four volumes of absolute ethanol were added to the pooled supernatant at a supernatant-to-ethanol volume ratio of 1:4 (v/v), corresponding to a final ethanol concentration of approximately 80% (v/v). The mixture was maintained at 4 °C for 24 h, and the resulting precipitate was collected by centrifugation at 4500× g for 10 min. The precipitate was redissolved in 50 mL of deionized water and transferred to a dialysis membrane with a molecular-weight cutoff of 3000 Da (Youbichun; Beijing Ruida Henghui Technology Development Co., Ltd., Beijing, China). Dialysis was performed against deionized water for 48 h, with the external water replaced every 8 h. Finally, the retained fraction was collected and lyophilized under vacuum to obtain a crude polysaccharide-rich preparation from Irpex lacteus, hereafter referred to as ILP.
2.2. Single-Factor Experiment on Extraction of a Crude Polysaccharide-Rich Preparation from Irpex lacteus
The polysaccharide extraction procedures described below were followed, and the resulting crude polysaccharides were weighed and assessed for purity.
(1) The extraction was conducted at 85 °C for 3 h per cycle, with two extraction cycles performed. Liquid–solid ratios (L/S) of 10–30 mL/g were tested. (2) The extraction was conducted at 85 °C with an L/S of 20 mL/g and two extraction cycles. Extraction time of 2–4 h per cycle were evaluated. (3) The extraction was conducted at an L/S of 20 mL/g for 3 h per cycle, with two extraction cycles, across temperatures of 75–95 °C. (4) The extraction was conducted at an L/S of 20 mL/g, 85 °C, for 3 h per cycle, with the number of extraction cycles of 1–5 tested.
The total carbohydrate content of the ILP preparation was determined using the phenol–sulfuric acid method with D-glucose (HPLC purity ≥ 98%; Beijing Solarbio Science & Technology Co., Ltd., Beijing, China) as the calibration standard. A 100 μg/mL D-glucose stock solution was diluted to prepare standards at concentrations of 0, 10, 20, 40, 60, 80, and 100 μg/mL. The standards were reacted with 6% phenol and concentrated sulfuric acid under the same conditions as the ILP samples, and the absorbance was measured at 490 nm after incubation in the dark for 30 min. The calibration equation was C = 331.04A490 − 22.82 (R2 = 0.9996), where A490 is the mean absorbance at 490 nm, and C is the glucose-equivalent concentration (μg/mL). The total carbohydrate content was calculated as follows:
where C is the glucose-equivalent concentration obtained from the calibration curve (μg/mL), V is the total volume of the sample solution (mL), D is the additional dilution factor, and m is the mass of the ILP preparation used for analysis (mg).
2.3. RSM for Extraction Optimization
Based on the single-factor results, the condition producing the highest extraction yield for each continuous factor was selected as the central BBD level, whereas adjacent values within the experimentally examined range were selected as the low and high levels. Accordingly, the coded levels of −1, 0, and +1 were 15, 20, and 25 mL/g for L/S; 3.0, 3.5, and 4.0 h per cycle for extraction time; and 85, 90, and 95 °C for extraction temperature, respectively. The yield increased significantly from one to two extraction cycles but showed no further significant increase beyond two cycles. Therefore, one, two, and three extraction cycles were selected as the low, central, and high levels, respectively. The BBD comprised 29 experimental runs. Each run was performed using three independently conducted complete extraction procedures. The L/S (A, mL/g), extraction time per cycle (B, h), extraction temperature (C, °C), and number of extraction cycles (D) were selected as independent factors, with each parameter investigated at three coded levels (Table S1). The fitting formula is as follows.
2.4. BPNN–GA Model Construction and Training
A three-layer BPNN was constructed in MATLAB R2024a using the 29 experimental observations listed in Table 1. The input layer consisted of four extraction parameters, whereas the ILP yield was defined as the output layer. The observations were randomly reordered and divided into 21 training, 4 validation, and 4 testing observations following the general data-partitioning procedure described by Chen et al. [11]. Runs 25–29 were obtained from five independently conducted extractions at the same center-point condition rather than from technical replicates. In the original random split, Runs 25–27 were assigned to the training subset, whereas Runs 28 and 29 were assigned to the testing subset. The assignment of each run is provided in Table 1. Candidate networks containing 3–12 hidden neurons were examined according to the empirical expression h = + a, where m = 4 was the number of input variables, n = 1 was the number of output variables, and a ranged from 1 to 10. Among the candidate architectures examined in the original workflow, the network containing 11 hidden neurons produced the lowest internal validation MSE and was therefore selected. The resulting network had a 4–11–1 architecture, with a hyperbolic tangent sigmoid transfer function in the hidden layer and a linear transfer function in the output layer. GA was subsequently applied at the network-parameter level to optimize the initial connection weights and biases before Levenberg–Marquardt training. Each chromosome encoded the input-to-hidden weights, hidden-layer biases, hidden-to-output weights, and output-layer bias. The weight-initialization GA used a population size of 25, a maximum of 45 generations, a crossover fraction of 0.8, roulette-wheel selection, two-point crossover, Gaussian mutation, and a migration fraction of 0.08. In the original implementation, the fitness function was defined as the mean of the MSE values calculated for the training and testing subsets. The chromosome with the lowest fitness value was used to initialize the network weights and biases. Following GA-based initialization, the network was further trained using the Levenberg–Marquardt algorithm (trainlm). The maximum number of epochs, performance goal, minimum gradient, and maximum number of validation failures were set to 1000, 1 × 10⁻⁴, 1 × 10⁻⁶, and 15, respectively. MATLAB default settings were used for the remaining trainlm parameters. Model agreement was evaluated on the original extraction-yield scale using the mean absolute error (MAE), mean squared error (MSE), and root mean squared error (RMSE).
where n is the number of samples, yi denotes the observed value, and represents the predicted value.
Table 1.
Box–Behnken experimental design.
After model establishment, GA was applied for a second and distinct purpose: searching the extraction-factor space for conditions associated with a high model-predicted yield. In this process-search GA, each individual represented a combination of the liquid–solid ratio, extraction time per cycle, extraction temperature, and number of extraction cycles, while the yield predicted by the trained BPNN–GA model was used as the fitness value. The process-search GA used floating-point encoding, a population size of 30, 300 iterations, a crossover probability of 0.6, and a mutation probability of 0.2. The population was iteratively updated to maximize the model-predicted extraction yield. Because all four factors were represented as continuous variables in the original numerical search, the number of extraction cycles could take a fractional value.
2.5. Validation of Extraction Conditions
The model-derived extraction conditions were adjusted to experimentally feasible settings before verification because the number of extraction cycles is a discrete variable and can only be implemented as an integer. The practical conditions used to verify the RSM-derived solution were a liquid-to-solid ratio of 21 mL/g, an extraction time of 3.4 h per cycle, an extraction temperature of 89 °C, and two extraction cycles. The corresponding conditions used to verify the BPNN–GA-derived solution were a liquid-to-solid ratio of 21 mL/g, an extraction time of 3.2 h per cycle, an extraction temperature of 87 °C, and two extraction cycles. Each set of conditions was evaluated using three independently conducted extraction experiments. Polysaccharide extraction yield was determined according to the procedure described in Section 2.2. The experimentally obtained yields were used to assess the practical performance of the model-derived extraction conditions.
2.6. Polysaccharide Physicochemical Properties
2.6.1. Determination of Residual Protein and Total Phenolic Content
Residual protein content was determined using a BCA protein assay kit (Solarbio Science & Technology Co., Ltd., Beijing, China; catalog no. PC0020), with bovine serum albumin as the calibration standard. The BCA working reagent was freshly prepared by mixing the BCA reagent and copper reagent at a volume ratio of 50:1. The ILP stock solution was diluted fourfold, and 20 μL of the diluted sample or BSA standard was added to a 96-well plate, followed by 200 μL of BCA working reagent. The plate was incubated at 37 °C for 30 min, after which the absorbance was measured at 562 nm. BSA standards were prepared at concentrations of 0, 25, 50, 100, 150, 200, 300, and 400 μg/mL. The calibration equation was Cprotein = 1114.7A562 − 173.06 (R2 = 0.9995), where Cprotein is the BSA-equivalent protein concentration (μg/mL), and A562 is the absorbance at 562 nm.
Total phenolic content was determined using the Folin–Ciocalteu method described by Tepsongkroh et al., with minor modifications [14]. The ILP stock solution was diluted twofold. One milliliter of the diluted sample or gallic acid standard was mixed with 4.0 mL of Folin–Ciocalteu reagent diluted tenfold with distilled water. After 3 min, 5.0 mL of 7.5% (w/v) sodium carbonate solution was added. The mixture was incubated at room temperature in the dark for 30 min, and its absorbance was measured at 765 nm. Gallic acid standards were prepared at concentrations of 0, 4, 8, 12, 20, and 30 μg/mL. The calibration equation was Cphenolic = 68.071A765 − 7.2484 (R2 = 0.9991), where Cphenolic is the gallic acid-equivalent concentration (μg/mL), and A765 is the absorbance at 765 nm.
where Cprotein and Cphenolic are the concentrations calculated from the corresponding calibration equation (μg/mL), D is the dilution factor, V is the total volume of the original sample solution (mL), and m is the dry mass of ILP used for solution preparation (mg).
2.6.2. I2–KI
For the I2–KI staining assay, 1 mL of ILP (1 mg/mL) was mixed with 0.5 mL of iodine reagent (0.2% KI, 0.02% I2, w/v). After 10 min, absorbance was scanned from 300 to 700 nm on a microplate reader [15]. Separately, 1 mL of ILP was incubated with 0.5 mL of α-amylase at 37 °C for 20 min, followed by dropwise addition of I2–KI reagent and a 10-min dark incubation to observe color changes. Distilled water and starch solution (1 mg/mL) were used as negative and positive controls, respectively. An α-amylase-treated starch sample was also analyzed to validate enzyme activity [16].
2.6.3. Monosaccharide Composition
According to Li et al. [17], the polysaccharide was hydrolyzed in trifluoroacetic acid (HPLC grade; ANPEL Laboratory Technologies (Shanghai) Inc., Shanghai, China) at 121 °C for 2 h. After hydrolysis, the residue from the nitrogen evaporation was subsequently rinsed two to three times with 99.99% methanol (HPLC grade; Sigma-Aldrich, St. Louis, MO, USA) to eliminate residual TFA and reconstituted in sterile water for analysis. Monosaccharide profiling was carried out using an ICS 5000+ ion chromatography system coupled with an electrochemical detector (Thermo Fisher Scientific, San Jose, CA, USA). Chromatographic separation was performed at 30 °C with a flow rate of 0.5 mL/min. Three eluents were employed: (A) ultrapure water, (B) 0.1 M NaOH (analytical grade; Sinopharm Chemical Reagent Co., Ltd., Shanghai, China), and (C) 0.1 M NaOH containing 0.2 M sodium acetate (analytical grade; Sigma-Aldrich, St. Louis, MO, USA). The gradient program was set as follows: 0–26 min, 95:5:0 to 85:5:10 (A/B/C); 26–42 min, 85:5:10; 42–42.1 min, 85:5:10 to 60:0:40; 42.1–52 min, 60:0:40 to 60:40:0; 52–52.1 min, 60:40:0 to 95:5:0; and 52.1–60 min, 95:5:0. Each monosaccharide was quantified using an external calibration curve constructed with the corresponding standard. The calibrated mass concentrations were corrected for the dilution factor and converted to molar concentrations according to their respective molecular weights. The molar percentage of each component was calculated by dividing its molar concentration by the sum of the molar concentrations of all ten detected and quantified components and multiplying by 100. Accordingly, the normalized molar percentages summed to 100 mol%.
2.6.4. Fourier Transform Infrared (FT–IR) Spectroscopy
FT-IR analysis was performed using a Nicolet iS5 spectrometer (Thermo Fisher Scientific, Madison, WI, USA). The polysaccharide was thoroughly blended with anhydrous KBr and compressed into transparent pellets for spectral analysis. FT–IR spectra were acquired over the range of 4000–400 cm−1 [18].
2.6.5. X-Ray Diffraction (XRD)
X-ray diffraction patterns were recorded using an Ultima IV X-ray diffractometer (Rigaku Corporation, Tokyo, Japan). The freeze-dried ILP sample was finely pulverized, passed through a 100-mesh sieve, and spread onto the sample holder. Diffraction data were acquired using Cu Kα radiation generated at an operating voltage of 40 kV and a current of 40 mA (1600 W). The patterns were recorded over a 2θ range of 5–60° using a step interval of 0.02° and a scanning rate of 2°/min, with the Ultima IV (185 mm) detector. During measurement, the divergence slit, horizontal divergence slit, and anti-scatter slit were adjusted to 1/2°, 10 mm, and 8.0 mm, respectively [19].
2.6.6. Scanning Electron Microscope (SEM)
SEM analysis was performed using a field-emission scanning electron microscope (SU8010, Hitachi, Tokyo, Japan). Before imaging, the powdered ILP sample was vacuum-coated with gold to improve electrical conductivity. Micrographs were then acquired at 30.0 kV with magnifications of 200×, 2000×, and 5000× to evaluate the surface architecture of the sample.
2.6.7. Thermal Stability
Thermal behavior of ILP was investigated using a thermogravimetric analyzer (TGA 2-star, Mettler Toledo, OH, USA). Approximately 5 mg of the freeze-dried ILP was placed in the sample pan and heated at 10 °C/min to evaluate its thermal stability.
2.6.8. Antioxidant Capacity
(1) DPPH radical-scavenging capacity: polysaccharide solutions (0.25–2.0 mg/mL) were combined with DPPH solution (0.3 mmol/L) in ethanol at a volume ratio of 1:1. The mixtures were maintained at 37 °C for 30 min, after which the absorbance was recorded at 517 nm.
where A0, Ai, and Aj represent the absorbance values of the blank, sample reaction group, and sample control, respectively.
(2) Hydroxyl radical-scavenging activity was determined using a commercial hydroxyl free radical assay kit (A018-1-1; Nanjing Jiancheng Bioengineering Institute, Nanjing, China) according to the manufacturer’s instructions. Hydroxyl radicals were generated by the Fenton reaction system supplied with the kit and reacted with a proprietary electron-acceptor substrate, followed by Griess color development. Reagent 2 stock solution was diluted 1:99 (v/v) with distilled water to prepare the substrate working solution. Component A of Reagent 3 was diluted 1:9 (v/v) with distilled water and then mixed with component B at a ratio of 1:1 (v/v) to prepare the Reagent 3 working solution. Reagent 4 stock solution was diluted 1:9 (v/v) with distilled water. The chromogenic reagent was freshly prepared by mixing Reagent 4 working solution, Reagent 5, Reagent 6, and glacial acetic acid at a volume ratio of 8:3:3:2. For the sample reaction, 0.2 mL of substrate working solution, 0.2 mL of ILP solution (0.25–2.0 mg/mL), and 0.4 mL of Reagent 3 working solution were mixed and incubated at 37 °C for exactly 1 min. Subsequently, 2.0 mL of the freshly prepared chromogenic reagent was added, followed by incubation at room temperature for 20 min. Absorbance was measured at 550 nm. The control reaction contained 0.2 mL of distilled water, 0.2 mL of substrate working solution, and 0.4 mL of Reagent 3 working solution. The blank reaction contained 0.4 mL of distilled water and 0.4 mL of Reagent 3 working solution. Both the control and blank reactions received 2.0 mL of chromogenic reagent and were treated under the same conditions as the sample. Ascorbic acid (Vc) was included as the positive control.
where Asample is the absorbance of the reaction containing ILP and substrate, Acontrol is the absorbance of the complete reaction in which ILP was replaced with distilled water, and Ablank is the background absorbance of the reaction containing neither ILP nor substrate.
2.7. Cell Culture
2.7.1. Cell Viability
RAW264.7 macrophages (murine macrophage cell line; Wuhan Procell Biotechnology Co., Ltd., Wuhan, China; Cellosaurus accession: CVCL_0493; RRID: CVCL_0493) were cultured in DMEM supplemented with 10% fetal bovine serum, 1% nonessential amino acids, and 1% penicillin–streptomycin at 37 °C in a humidified atmosphere containing 5% CO2. The medium was replaced every 1–2 days, and cells at passages 8–13 were used. Cell identity was based on the supplier’s documentation; no independent cell-line authentication or mycoplasma testing was performed.
For the CCK-8 assay, RAW264.7 cells were seeded into 96-well plates at a density of 1.5 × 10⁴ cells per well. Following this, the cultures were exposed to ILP at concentrations ranging from 0 to 1000 μg/mL for an additional 24 h, with LPS (Sigma-Aldrich, St. Louis, MO, USA, 1 μg/mL) used as a positive control. Cell viability was subsequently evaluated by adding Cell Counting Kit-8 reagent (Biosharp, Hefei, China). After 1.5 h of incubation, the absorbance was recorded at 450 nm [20].
2.7.2. Endotoxin Assessment of ILP
Endotoxin contamination in the ILP batch used for the cellular experiments was assessed using an Endotoxin Detection Kit based on recombinant factor C (MedChemExpress, Monmouth Junction, NJ, USA; catalog no. HY-K1099). ILP was prepared at 1 mg/mL using endotoxin-free water and diluted tenfold for analysis. Endotoxin-free water was used as the negative control. To evaluate potential matrix interference, the diluted ILP sample was analyzed both without and with an endotoxin spike at a final in-well concentration of 0.5 EU/mL. All standards, controls, and samples were analyzed in triplicate. Fluorescence was measured at excitation and emission wavelengths of 380 and 440 nm, respectively, immediately after addition of the reaction mixture and after incubation at 37 °C for 1 h. Net fluorescence changes were calculated after subtracting the mean △RFU of the negative control. The calibration equation was lg(C) = 1.1791 lg(net△RFU) − 5.1405 (R2 = 0.9993), where C is the in-well endotoxin concentration (EU/mL). Spike recovery was calculated as [(Cspiked − Cunspiked)/0.5] × 100, and recoveries between 50% and 200% were considered acceptable. The endotoxin content was calculated after correcting for the tenfold sample dilution and the twofold dilution resulting from mixing the sample with the reaction reagent.
2.7.3. Reactive Oxygen Species (ROS)
Intracellular ROS were evaluated using a reactive oxygen species assay kit (Beyotime Biotechnology, Shanghai, China) containing the DCFH–DA fluorescent probe [10]. Following 24 h of simultaneous exposure to LPS and ILP, the RAW 264.7 cells were rinsed twice with pre-warmed DPBS and then incubated with DCFH–DA (10 μM) for 30 min. After removing the probe solution, the cells were washed twice with PBS to eliminate any unbound dye. ROS levels were quantified as the percentage of fluorescence intensity relative to that of the control group [21].
2.7.4. Biochemical Marker
Following a 24-h co-incubation period with LPS and ILP, RAW 264.7 macrophages were collected. Commercially available kits were employed to measure SOD, CAT, GSH-PX, and MDA levels, with catalog numbers A001–3–1, A007–1–1, A005–1, and A003–1, respectively (Nanjing Jiancheng Bioengineering Institute, Nanjing, China). All assays were conducted with manufacturers’ protocols.
2.8. Transwell Cell Culture
2.8.1. Cell Viability
Caco-2 cells (human colorectal adenocarcinoma-derived epithelial cells; Cellverse Co., Ltd., Shanghai, China; Cellosaurus accession: CVCL_0025; RRID: CVCL_0025) and HT29-MTX-E12 cells (a mucus-secreting subclone derived from human colon adenocarcinoma cells; Cellverse Co., Ltd., Shanghai, China; Cellosaurus accession: CVCL_G356; RRID: CVCL_G356) were used to establish an epithelial co-culture. Caco-2 and HT29-MTX-E12 cells were cultured separately in DMEM supplemented with 10% fetal bovine serum, 1% nonessential amino acids, and 1% penicillin–streptomycin at 37 °C in a humidified atmosphere containing 5% CO2. The medium was replaced every 2–3 days. Caco-2 and HT29-MTX-E12 cells were used at passages 15–22 and 5–12, respectively. Their identities were based on the supplier’s documentation; no independent cell-line authentication or mycoplasma testing was performed. The two cell lines were co-cultured at a ratio of 75:25 (Caco-2: HT29-MTX-E12). The effect of ILP on the viability of the co-culture was evaluated using a CCK-8 assay. The cells were treated with ILP at concentrations of 0–1000 μg/mL for 24 h. After treatment, CCK-8 reagent (Biosharp, Hefei, China) was added according to the manufacturer’s instructions, and absorbance was measured at 450 nm.
2.8.2. Triple-Culture Intestinal Epithelial–Immune Model
The triple-culture model was established following previously reported methods with slight modifications [22,23]. Caco-2 and HT29-MTX-E12 cells were mixed at a 75:25 ratio (Caco-2:HT29-MTX-E12) and seeded onto the apical compartment of 12-well Transwell inserts with polyester (PET) membranes (Corning, Corning, NY, USA; membrane area: 1.12 cm2; pore size: 0.4 μm) with 5 × 10⁴ cells per insert. The medium was changed every 2–3 days until the TEER reached values exceeding 300 Ω·cm2. On day 21, the inserts were placed into 12-well plates containing pre-cultured RAW 264.7 macrophages in the basolateral chamber, thereby forming a triple-culture system. The apical and basolateral compartment volumes were 500 μL and 1500 μL, respectively. ILP was added to the apical compartment at a final concentration of 200 μg/mL, while LPS was simultaneously added to the basolateral compartment at a final concentration of 1 μg/mL. The system was then incubated for 24 h. Cells receiving neither ILP nor LPS were designated as the normal control (N group), whereas those treated with LPS alone served as the model group (LPS group).
2.8.3. Transepithelial Electrical Resistance (TEER)
TEER was monitored using a Millicell–ERS–2 electrical resistance system (Merck Millipore, Burlington, MA, USA). Only those cell monolayers exhibiting TEER readings above 300 Ω·cm2 were deemed to have adequate tightness and were therefore selected for further experimentation [22].
TEER (Ω·cm2) = (Measured value − blank value) × 1.12
2.8.4. Permeability Analysis
FITC-dextran passage across the co-culture barrier was assessed using a Transwell assay. The apical and basolateral compartments were each washed twice with PBS. Subsequently, 500 μL of DMEM containing 100 μg/mL FITC-dextran (4 kDa, Beyotime Biotechnology, Shanghai, China) was added to the apical compartment, and 1500 μL of phenol red-free DMEM was added to the basolateral compartment. The Transwell system was incubated for 1.5 h in a cell culture incubator protected from light. At the endpoint, 100 μL of solution was collected from each compartment, and fluorescence intensity was measured at an excitation wavelength of 485 nm and an emission wavelength of 520 nm. The endpoint basolateral-to-apical fluorescence ratio was calculated by dividing the fluorescence intensity of the basolateral sample by that of the apical sample. Because a FITC-dextran calibration curve was not established, the ratio was interpreted as a semiquantitative fluorescence-based indicator.
2.8.5. Cytokine Measurement
After treatment, culture medium was collected separately from the apical and basolateral compartments. Human IL-8 in the apical medium was measured using a human IL-8 ELISA kit (Shanghai Xinle Biotechnology Co., Ltd., Shanghai, China), whereas mouse TNF-α in the basolateral medium was measured using a mouse TNF-α ELISA kit (Shanghai Xinle Biotechnology Co., Ltd., Shanghai, China), with absorbance read at 450 nm. NO concentrations were quantified using the NO assay kit (Nanjing Jiancheng Bioengineering Institute, Nanjing, China), with absorbance read at 550 nm. NO levels were determined in the basolateral chamber.
2.8.6. RT-qPCR
Total RNA was isolated using the Simple P Total RNA Extraction Kit (Bioer Technology Co., Ltd., Hangzhou, China). cDNA was then synthesized from the extracted RNA using the PrimeScript™ RT Kit (Takara Bio Inc., Shiga, Japan), with all procedures performed according to the manufacturer’s specifications. Real-time qPCR was carried out on a QuantStudio® 3 system using TB Green® Premix Ex TaqTM II (TaKaRa Bio Inc., Shiga, Japan) [24]. The relative abundance of target transcripts was determined via the 2−ΔΔCt method. Primer sequences and thermocycling conditions are detailed in Table S2 and Figure S1, respectively.
2.8.7. Western Blot (WB)
WB was performed to evaluate protein expression levels [25]. Proteins extracted from cells in the apical chamber were probed for ATOH1, TFF3, RETNLβ, and MUC2, whereas those from the basolateral chamber were analyzed for TLR4, MyD88, IκBα, p-IκBα, p65, and p-p65. Primary antibodies against ATOH1 (P106762; polyclonal; 1:1000), TFF3 (P104212; polyclonal; 1:1000), MUC2 (R014045; clone 38E22198, 1:1000), MyD88 (P012343; polyclonal; 1:1000), IκBα (P100859; polyclonal; 1:1000), p-IκBα (Ser32; R016106; clone 99I18M73; 1:1000), p65 (R012746; clone 99M06L21; 1:1000), and p-p65 (Ser536; R013789; clone 12L74M11; 1:1000) were purchased from Epizyme Biotech. The anti-RELMβ antibody (PK13139S; polyclonal; 1:1000) was purchased from Abmart, and the anti-TLR4 antibody (66350; clone 3G9A4; 1:10,000) was purchased from Proteintech. Cells were lysed on ice in RIPA buffer (with protease/phosphatase inhibitors). Proteins (20 µg) were separated by SDS-PAGE using gel concentrations selected according to the molecular-weight range of the target: 15% for proteins below 20 kDa, 12.5% for proteins of approximately 20–40 kDa, 10% for proteins of approximately 40–80 kDa, 7.5% for proteins of approximately 80–150 kDa, and 6% for proteins above 150 kDa. Proteins were blotted onto PVDF, blocked with 5% BSA (1 h, RT), and probed with primary (overnight, 4 °C) and HRP-secondary (1 h, RT) antibodies. Signals were detected by ECL and captured on an Alliance MINI HD 9 imager (UVITEC Cambridge, Cambridge, UK). Brightness and contrast were adjusted uniformly across each image; no localized modifications, erasure, or image splicing were performed.
2.9. Statistical Analysis
Data are presented as the mean ± standard deviation (SD). Each of the 29 response-surface experimental runs was performed using three independently conducted extraction procedures, and the mean of the three replicates was used for model construction. Non-cell-based assays were performed using three independent experimental replicates (n = 3). Cell-based assays were performed using three independent biological replicates (n = 3), except for the CCK-8 assay, which included six independent biological replicates (n = 6). Technical measurements, where applicable, were averaged within each independent replicate before statistical analysis and were not treated as independent observations. TEER was monitored repeatedly in the same Transwell inserts during epithelial co-culture development to determine whether the inserts met the criterion for subsequent experiments. Comparisons among multiple groups were performed using one-way ANOVA followed by Tukey’s multiple-comparison test. Tukey’s test adjusted for group comparisons within each endpoint; no additional adjustment was applied across the different biological endpoints. Therefore, findings across endpoints were interpreted as exploratory. Western blot results were evaluated qualitatively and were not included in inferential statistical analysis. A value of p < 0.05 was considered statistically significant. Graphical representations of the data were generated using Origin 2019, while statistical analyses were performed with SPSS 23.0.
3. Results and Discussion
3.1. Single-Factor Experiment of Polysaccharide Extraction
3.1.1. Liquid–Solid Ratio (L/S)
The effect of L/S on polysaccharide yield from Irpex lacteus was investigated over a range of 10–30 mL/g, with extraction time per cycle (3 h), temperature (85 °C), and extraction cycles (two) held constant. Both the mass and purity of the extracted polysaccharide increased with increasing ratio from 10 to 20 mL/g, reaching a maximum yield at 20 mL/g (Figure 1a). Beyond this point (20–30 mL/g), the yield declined progressively. This trend can be attributed to two opposing factors: an increase in solvent volume enhances solute–solvent contact and the concentration gradient, facilitating polysaccharide dissolution and diffusion [9]. However, excessive solvent may prolong diffusion pathways within the tissue and impede solute transfer, leading to resource inefficiency [26]. Therefore, 20 mL/g was selected as the optimal L/S.
Figure 1.
The effects of the liquid–solid ratio (a), extraction time per cycle (b), extraction temperature (c), and number of extraction cycles (d) on the quality, purity, and yield of polysaccharides (n = 3). Data are presented as mean ± SD. Different lowercase letters indicate a statistically significant difference (p < 0.05).
3.1.2. Extraction Time per Cycle
The effect of extraction time per cycle (2–4 h) on polysaccharide yield from Irpex lacteus was examined under fixed conditions of L/S (20 mL/g), temperature (85 °C), and two extraction cycles. The mass, purity, and overall yield of extracted polysaccharides increased progressively with time from 2 to 3.5 h per cycle, reaching a maximum at 3.5 h; further extension to 4 h resulted in a decline in all parameters (Figure 1b). The initial increase may be attributed to prolonged and thorough solvent–substrate contact, which promotes dissolution and release of polysaccharides. However, beyond 3.5 h, the yield decreased, likely due to the attainment of a potential energy equilibrium between extracts and the solvent. At this point, the solvent has exhausted its full dissolving capacity [10]. Therefore, 3.5 h per cycle was selected as the optimal extraction time.
3.1.3. Extraction Temperature
The effect of extraction temperature (75–95 °C) on polysaccharide yield from Irpex lacteus was evaluated under fixed conditions of L/S (20 mL/g), extraction time per cycle (3 h), and two extraction cycles. The mass, purity, and yield of polysaccharides increased with temperature from 75 to 90 °C, reaching a maximum at 90 °C, followed by a decline at 95 °C (Figure 1c). The initial increase may be attributed to enhanced cell wall disruption and membrane lipid loosening at moderate temperatures, which facilitates polysaccharide release. However, excessive temperatures can induce polysaccharide degradation, reduce structural integrity, and promote the dissolution of interfering substances, thereby impairing extraction efficiency [10,11]. Therefore, 90 °C was selected as the optimal extraction temperature.
3.1.4. Number of Extraction Cycles
The influence of extraction cycles (1–5) on polysaccharide yield from Irpex lacteus was examined under fixed conditions of L/S (20 mL/g), extraction time per cycle (3 h), and temperature (85 °C). The yield increased significantly when the cycle was raised from 1 to 2 (Figure 1d, p < 0.05), likely due to enhanced solvent–substrate interactions that facilitate polysaccharide release. However, no significant variation in yield was observed between 2 and 5 cycles (p > 0.05), indicating that a saturation point had been reached, consistent with the findings of [10]. Considering that additional cycles also increase solvent consumption and operational costs, two extraction cycles were selected as optimal.
3.2. RSM Experimental Analysis
Based on the single-factor results, the BBD was centered at an L/S of 20 mL/g, an extraction time of 3.5 h per cycle, a temperature of 90 °C, and two extraction cycles. Adjacent levels within the experimentally examined ranges were selected to evaluate response curvature and potential factor interactions. The L/S (A), extraction time per cycle (B), temperature (C), and number of extraction cycles (D) were evaluated for their effects on polysaccharide extraction yield (Y). The data are presented in Table 1 and were fitted to a quadratic polynomial regression model.
Y = 4.598 + 0.2658 A − 0.1917 B − 0.1883 C + 0.2808 D + 0.015 AB − 0.1375 AC − 0.12 AD + 0.0625 BC + 0.0075 BD − 0.02 CD − 0.6223 A2 − 0.4611 B2 − 0.4386 C2 − 0.7198 D2
Table 2 presents the analysis of variance results for the Box–Behnken experimental design. The relative impact of the four variables on polysaccharide yield was ranked in the following descending order: D > A > B > C. The quadratic model was statistically significant (F = 34.4826, p < 0.0001). The lack-of-fit test yielded a p-value of 0.0505; therefore, lack of fit was not detected at the predefined significance level of 0.05. The coefficient of variation (C.V.) was 3.6032%, reflecting favorable model precision and reproducibility. The R2, adjusted R2, and predicted R2 values were 0.9718, 0.9436, and 0.8451, respectively, indicating that the model accounted for 97.18% of the total variability and exhibited strong concordance between experimental observations and predicted outcomes, rendering it suitable for forecasting polysaccharide extraction yield. Residual diagnostics were further examined using the normal probability plot, residuals-versus-predicted plot, and residuals-versus-run plot (Figure S2). The internally studentized residuals approximately followed the reference line in the normal probability plot and were distributed around zero without an evident systematic pattern in the residuals-versus-predicted or residuals-versus-run plots. All internally studentized residuals were within −3 to +3, indicating no obvious extreme outliers.
Table 2.
Variance analysis for response surface methodology.
The curvature of the three-dimensional surfaces reflects the magnitude of response variation, and steeper curvature indicates a more pronounced influence of the corresponding factor. As each of the four variables increased, the yield initially rose and then declined (Figure 2a–f). Moderate increases in L/S, extraction time per cycle, and temperature enhanced polysaccharide dissolution and release, whereas excessive levels promoted degradation, oxidation, or resource waste, consistent with previous reports [9,10]. The contour plots in Figure S3 were used to visualize the model-predicted response surfaces. However, none of the pairwise interaction terms were statistically significant at the 5% level (AB, p = 0.8238; AC, p = 0.0564; AD, p = 0.0910; BC, p = 0.3606; BD, p = 0.9113; and CD, p = 0.7667). Therefore, based on the continuous quadratic model, the theoretical optimum was an L/S of 21.12 mL/g, an extraction time of 3.39 h per cycle, a temperature of 88.65 °C, and 2.18 extraction cycles, with a predicted maximum yield of 4.70%. Because the number of extraction cycles is a discrete variable, the model-derived value was subsequently adjusted to an integer for experimental verification, as described in Section 3.4.
Figure 2.
Three-dimensional response surface plots were generated to visualize the interactive effects of various extraction parameters on polysaccharide yield. Liquid–solid ratio with time per cycle (a), liquid–solid ratio with temperature (b), liquid–solid ratio with extraction cycles (c), time per cycle with temperature (d), time per cycle with extraction cycles (e), and temperature with extraction cycles (f).
3.3. BPNN−GA Optimization
Compared with RSM, ANN offers superior performance in modeling complex and nonlinear multivariate systems [27]. The BPNN, equipped with self-learning capabilities, can be further enhanced by coupling with GA that simulates natural evolution, enabling global optimization within defined domains and improving the reliability and stability of predictions. The GA-BPNN mimics human cognitive processes through a network architecture analogous to neural structures. Using limited experimental data, it approximates the mathematical relationships between inputs and outputs via iterative backpropagation, while the genetic algorithm optimizes network parameters to enhance learning efficiency [28]. Herein, a three-layer BPNN model was established to evaluate the effects of four extraction factors on the polysaccharide yield from Irpex lacteus. The network contained 11 hidden-layer neurons, with polysaccharide yield as the output (Figure 3a). The GA-BPNN was subsequently constructed by optimizing connection weights and thresholds using the genetic algorithm.
Figure 3.
An optimization approach integrating BPNN with GA was adopted. (a) Schematic diagram of the BPNN structure, (b) GA convergence performance, (c) MSE decay curve during GA-BPNN training, (d) training state of the GA-BPNN model, (e) regression fit between predicted and experimental values, (f) comparison of predicted versus actual data, and (g) the GA optimization trajectory.
The GA (population 25, generations 45, crossover 0.8, mutation 0.08) iteratively updated weights/thresholds until convergence (fitness: optimal 0.0014, average 0.0066; Figure 3b). Weights and thresholds were iteratively updated until convergence, then applied to BPNN training (1000 epochs, target error 0.0001). To prevent overfitting, the number of epochs was constrained, and training was terminated when the MSE reached its minimum and the correlation coefficient (R) reached its maximum. Network training used the Levenberg–Marquardt algorithm (optimal validation performance in Figure 3c). As training progressed, the MSE curves for both training and validation gradually declined and stabilized, indicating satisfactory model performance. The minimum validation MSE on the normalized response scale was 0.023006 at epoch 4. Network training terminated at epoch 6 when the gradient decreased to 7.8816 × 10⁻⁷, below the specified minimum-gradient threshold of 1 × 10⁻⁶ (Figure 3d). Regression performance (Figure 3e) showed tight clustering around X = Y [13]. Overall R = 0.9926 (training/validation/test: 0.9973/0.9995/0.9984). Using the same 29 experimental observations, the performance metrics calculated from the unrounded predictions showed that the BPNN–GA model produced MAE, MSE, and RMSE values of 0.0439, 0.00531, and 0.0729, respectively, whereas the corresponding RSM values were 0.0726, 0.00844, and 0.0919. BPNN–GA therefore showed lower apparent residual errors than RSM within the available experimental design. Figure 3f presents the observed and predicted extraction yields for the original training, validation, and testing subsets. Although the five center-point runs were obtained from independent extraction experiments, they shared identical values for all four model inputs and were distributed across the training and testing subsets, resulting in some condition-level overlap. This feature, together with the relatively limited number of observations, should be considered when interpreting the testing performance. The current results support the applicability of BPNN–GA within the investigated experimental domain, while further validation using condition-grouped resampling and additional independent observations would strengthen the assessment of model generalizability.
For global optimization of extraction conditions (L/S 15–25 mL/g, time 3–4 h per cycle, temperature 85–95 °C, 1–3 extractions), the GA was run with population 30, crossover 0.6, mutation 0.2, floating-point encoding, individual length 1, and 300 iterations, using the neural network as the fitness function to maximize yield (convergence at iteration 300 in Figure 3g). Optimal conditions predicted were L/S 21.37 mL/g, time 3.23 h per cycle, temperature 86.90 °C, and 2.35 extractions, yielding a theoretical maximum of 5.38%.
3.4. Verification Experiment
Because the continuous theoretical solutions generated by both models contained factor values that required adjustment for experimental implementation, the model predictions were recalculated at the exact practical settings used in the verification experiments.
For the RSM model based on the BBD, the theoretical conditions were adjusted to a liquid–solid ratio of 21 mL/g, an extraction time of 3.4 h per cycle, a temperature of 89 °C, and two extraction cycles. At these exact practical settings, the RSM model predicted an extraction yield of 4.6737%, whereas the experimentally measured yield was 4.83 ± 0.15%. The absolute difference was 0.1563 percentage points, corresponding to a relative deviation of approximately 3.24% based on the measured value. This result indicated reasonable agreement between the RSM prediction and the experimental outcome within the investigated design space [29].
Similarly, the continuous conditions generated by BPNN–GA were adjusted to a liquid–solid ratio of 21 mL/g, an extraction time of 3.2 h per cycle, a temperature of 87 °C, and two extraction cycles. At these exact practical settings, the BPNN–GA model predicted an extraction yield of 4.8260%, whereas the experimentally measured yield was 5.31 ± 0.11%. On the basis of the experimentally measured yield and the practical operating conditions, the BPNN–GA-derived condition was adopted for subsequent preparation of ILP. Accordingly, the final extraction conditions were set at a liquid–solid ratio of 21 mL/g, an extraction time of 3.2 h per cycle, a temperature of 87 °C, and two extraction cycles.
3.5. Physicochemical Properties
3.5.1. Polysaccharide Purity and Other Compositional Characteristics of ILP
The ILP batch used for physicochemical characterization and biological experiments had a polysaccharide purity of 78.65 ± 1.56% on a glucose-equivalent dry-weight basis. Its residual protein content was 14.98 ± 0.65%, while its total phenolic content was 2.71 ± 0.18 mg GAE/g dry preparation. These compositional results indicate that the tested ILP was a crude polysaccharide-rich preparation rather than a chemically homogeneous polysaccharide.
To evaluate the reproducibility of the preparation procedure, the polysaccharide purity, residual protein content, and total phenolic content of three independently prepared ILP batches were further compared. The results demonstrated satisfactory compositional consistency among the three batches. Detailed individual-batch results and between-batch coefficients of variation are provided in Table S3. The corresponding between-batch coefficients of variation were 1.01%, 2.54%, and 3.03%, indicating satisfactory compositional consistency among the independently prepared ILP batches.
3.5.2. I2–KI
The iodine-reactivity characteristics of ILP were examined using the I2–KI assay. As shown in Figure 4a, ILP tested negative for amylose-like characteristics. The maximum absorption peaks of ILP were observed at 351 nm, with no detectable peak near 565 nm (Figure 4b). These results describe the iodine-reactivity characteristics of ILP.
Figure 4.
(a) I2–KI staining (A: water, B: ILP, C: ILP + α-amylase, D: Starch, and E: Starch + α-amylase), and (b) UV–vis spectrum. Ion chromatograms of the mixed monosaccharide standards (c) and ILP (d). FT–IR (e) and XRD (f) spectra of ILP.
3.5.3. Monosaccharide Composition of ILP
Ion chromatography analysis (Figure 4c,d) and quantitative determination (Table S4) revealed that the carbohydrate fraction of ILP was mainly composed of glucose (Glc), galactose (Gal), mannose (Man), fucose (Fuc), glucosamine (GlcN), and xylose (Xyl), with molar percentages of 65.82%, 8.82%, 8.53%, 5.85%, 3.84%, and 2.73%, respectively. These six predominant components accounted for 95.59 mol% of the total monosaccharide composition. The remaining 4.41 mol% comprised minor amounts of arabinose (Ara, 0.74 mol%), rhamnose (Rha, 0.75 mol%), galacturonic acid (Gal-UA, 0.49 mol%), and glucuronic acid (Glc-UA, 2.43 mol%), as detailed in Table S4. This composition was consistent with other edible fungi, such as Dictyophora indusiate and Flammulina velutipes, which also contained glucose, galactose, and mannose [6,30]. Gut microbiota exhibit selective carbohydrate utilization. For instance, Escherichia coli preferentially consumes glucose over lactose [31]. The monosaccharide profile of ILP suggests its potential as a bioactive component accessible to the gut microbial community.
3.5.4. FT–IR Spectral Analysis
The FT–IR spectrum of ILP exhibited characteristic polysaccharide absorption peaks (Figure 4e). A broad band at 3416.1 cm−1 was assigned to O–H stretching vibrations, indicating abundant hydroxyl groups, while the peak at 2920.6 cm−1 corresponded to C–H stretching, a typical polysaccharide signature [3]. The absorption at 1647.5 cm−1 was attributed to C=O stretching or O–H bending of adsorbed water, suggesting hygroscopicity [25]. Peaks at 1411.1, 1375.4, and 1322.8 cm−1 were associated with CH2 and CH3 bending vibrations, confirming the polysaccharide backbone and the presence of side chains [25,32]. An absorption band at approximately 1153.3 cm−1 indicated the presence of pyranose units [33], while peaks at 1258.7, 1153.3, 1072.2, and 1049.4 cm−1 were assigned to C–O–C and C–OH stretching vibrations, confirming glycosidic and ether linkages [25]. Collectively, these findings characterize ILP as a compositionally complex, polysaccharide-rich preparation with physicochemical features commonly associated with fungal polysaccharides [25].
3.5.5. XRD and Microstructure
X-ray diffraction analysis revealed a broad and “bun-shaped” diffraction peak (Figure 4f), indicative of an amorphous structure for ILP. This characteristic was associated with good solubility and was consistent with findings for other fungal polysaccharides [4,34]. SEM showed that ILP exhibited an interwoven, irregular, and porous lamellar morphology (Figure 5a). Such porous architecture suggested the presence of intermolecular interactions among polysaccharide chains, which may be closely related to its biological activity [4].
Figure 5.
(a) SEM analysis of ILP (200×, 2000×, and 5000×), (b) thermogravimetric analysis, and (c,d) DPPH and hydroxyl radical scavenging activity (n = 3), and data are presented as mean ± SD.
3.5.6. Thermal Stability
The TGA curve of ILP revealed two distinct stages of weight loss (Figure 5b). The initial loss of 12.35% between 25 and 161 °C was attributed to the removal of free and bound water, while the subsequent loss of 57.97% from 161 to 600 °C resulted from polysaccharide decomposition and depolymerization [35]. Above 600 °C, approximately 30% of the residue remained, likely corresponding to char or ash [36]. The DTG curve indicated the maximum rate of weight loss at 308 °C, identifying this temperature as the point of poorest thermal stability for ILP. These findings are consistent with those reported for other fungal polysaccharides, such as those from Morchella sextelata [37].
3.5.7. Antioxidant Capacity
Antioxidant capacity encompasses various mechanisms, including free radical scavenging and the ability to chelate transition metal catalysts. Upon interaction with electron-donating antioxidants, DPPH• is reduced to the stable DPPH-H form [5,15]. The DPPH radical scavenging activity of ILP increased in a concentration-dependent manner, reaching 43.14 ± 0.86% at 2 mg/mL (Figure 5c). Similarly, the hydroxyl radical scavenging rate of ILP increased with concentration across the tested range (Figure 5d), attaining 30.52 ± 0.94% at the same concentration.
3.6. Effects of ILP on Cellular Oxidative Stress
The effect of ILP on RAW 264.7 macrophage viability was evaluated using the CCK-8 assay across a concentration range of 0–1000 μg/mL. Cell viability increased gradually with rising ILP concentrations up to 200 μg/mL, beyond which a declining trend was observed (Figure 6a). Therefore, 200 μg/mL was selected for subsequent experiments. The ILP batch used in the cellular experiments yielded an endotoxin spike recovery of 94.29%, confirming that the sample matrix did not cause unacceptable interference under the selected assay conditions. After correction for the assay and sample dilution factors, the endotoxin content of ILP was 0.0734 ± 0.0022 EU/mg. Therefore, at the selected ILP concentration of 200 μg/mL, the corresponding residual endotoxin exposure in the culture medium was 0.0147 EU/mL. This trace level was considered unlikely to account for the subsequent cellular responses [38].
Figure 6.
Effects of ILP on LPS-induced oxidative stress in RAW264.7 cells. (a) Cell viability (n = 6), (b) ROS staining and (c) relative quantification (n = 3), (d) SOD and CAT activity, and (e) GSH-PX activity and MDA concentration (n = 3). N, untreated control group; LPS, lipopolysaccharide-treated group; LPS + ILP, group treated with lipopolysaccharide and ILP; ILP, Irpex lacteus crude polysaccharide-rich preparation; ROS, reactive oxygen species; SOD, superoxide dismutase; CAT, catalase; GSH-PX, glutathione peroxidase; MDA, malondialdehyde. Data are presented as mean ± SD. Different lowercase letters indicate a statistically significant difference (p < 0.05).
Inflammatory responses often lead to excessive ROS production, disrupting the antioxidant balance and causing damage to DNA, proteins, and lipids [1]. LPS treatment significantly increased intracellular ROS fluorescence (Figure 6b,c), confirming successful induction of oxidative stress. LPS treatment increased DCFH–DA fluorescence in RAW264.7 cells, whereas the LPS + ILP group showed lower fluorescence than the LPS group (Figure 6b,c). This observation is consistent with a reduction in probe oxidation-associated fluorescence under the assay conditions.
Additionally, LPS stimulation significantly decreased SOD, CAT, and GSH-PX activities by 25.50%, 35.25%, and 30.85%, respectively, while MDA levels increased by 58.97% (Figure 6d,e), indicating successful induction of oxidative damage. Following ILP treatment, SOD, CAT, and GSH-PX activities recovered by 24.52%, 23.95%, and 27.54%, respectively, while MDA levels decreased by 17.84%. MDA, a stable lipid peroxidation end product, indirectly indicates ROS-induced cellular damage [1]. Collectively, these results show that ILP alleviates LPS-induced oxidative stress in macrophages by enhancing antioxidant enzymes and suppressing lipid peroxidation, thereby exerting a protective antioxidant effect.
3.7. Effects of ILP on the Transwell Cell Barrier and Inflammation
3.7.1. Establishment and Characterization of the Intestinal Epithelial Barrier Model
The effect of ILP on the viability of the Caco-2/HT29-MTX-E12 co-culture was assessed using the CCK-8 assay (Figure 7a). Among the concentrations tested, 200 μg/mL ILP produced the highest CCK-8 readout, which was significantly higher than that of the untreated control (p < 0.05). At higher ILP concentrations, the CCK-8 readout showed a decreasing trend. Based on these results, 200 μg/mL ILP was selected for the subsequent triple-culture experiments. Caco-2 and HT29-MTX-E12 cells were co-cultured, and their morphological development was monitored over time (Figure 7b). On day 0, cells were evenly distributed; by day 7, they had aggregated while maintaining individual morphology; by day 14, tight junctions had formed, giving rise to a confluent monolayer with indistinct cell boundaries; and by day 21, the co-culture had further differentiated into a mature intestinal mucosal epithelium-like structure, with visible mucus aggregates.
Figure 7.
Effects of ILP on LPS-induced intestinal barrier dysfunction in the Caco-2/HT29-MTX-E12/RAW264.7 triple-culture model. (a) Viability of the Caco-2/HT29-MTX-E12 co-culture following ILP treatment (n = 6), (b) morphological development of cell co-culture, (c) the transepithelial electrical resistance with cell co-culture development, (d) TEER and basolateral-to-apical FITC-dextran fluorescence ratio, (e) NO content, and (f) mouse TNF-α in the basolateral medium and human IL-8 contents in the apical medium. Quantitative data in panels (c–f) were obtained from three independent biological replicates (n = 3). Cco-2, human intestinal epithelial cells; HT29-MTX-E12, human mucus-secreting goblet-like cells; RAW264.7, murine macrophages; TEER, transepithelial electrical resistance; NO, nitric oxide; TNF-α, tumor necrosis factor-alpha; IL-8, interleukin-8; N, untreated control group; LPS, lipopolysaccharide-treated group; LPS + ILP, group treated with lipopolysaccharide and ILP; ILP, Irpex lacteus crude polysaccharide-rich preparation. Data are presented as mean ± SD. Different lowercase letters indicate a statistically significant difference (p < 0.05).
TEER was measured to assess tight junction integrity and barrier function [39]. As shown in Figure 7c, TEER values increased significantly from day 4 onward and plateaued after day 16, reaching 310.24 ± 5.13 Ω·cm2 by day 21, confirming successful establishment of a functional intestinal barrier.
3.7.2. Protective Effect of ILP on LPS-Induced Barrier Disruption
TEER and the endpoint basolateral-to-apical FITC-dextran fluorescence ratio were measured. LPS treatment markedly compromised barrier integrity, reducing TEER to 148.59 ± 6.56 Ω·cm2. In contrast, ILP intervention significantly attenuated this disruption, maintaining TEER at 228.85 ± 11.05 Ω·cm2 (p < 0.05). In addition, the basolateral-to-apical FITC-dextran fluorescence ratio was significantly lower in the LPS + ILP group than in the LPS group (Figure 7d). Collectively, the TEER and fluorescence results suggest that ILP attenuated LPS-associated barrier dysfunction in the co-culture model.
3.7.3. Effect of ILP on NO and Cytokine Production
Nitric oxide (NO) and secreted cytokines are widely recognized as representative readouts of macrophage immune activation [1]. The N group exhibited basal NO levels (2.78 ± 0.49 μmol/L), while LPS stimulation significantly upregulated NO production (13.39 ± 0.99 μmol/L, Figure 7e), confirming the inflammatory responsiveness of the cellular model. Compared with the LPS group, ILP treatment significantly reduced NO production (10.37 ± 0.88 μmol/L, p < 0.05), consistent with the reported inhibitory effect of Ganoderma lucidum polysaccharides on LPS-induced NO production [25].
TNF-α, a pro-inflammatory cytokine primarily produced by macrophages, and IL-8, a chemokine involved in recruiting and activating intestinal intraepithelial lymphocytes, were also measured [39,40]. Upon LPS stimulation, TNF-α released from the basolateral chamber penetrated the membrane and activated intestinal epithelial cells in the apical chamber, promoting IL-8 secretion [41]. In this study, LPS significantly elevated both basolateral TNF-α and apical IL-8 levels (2801.86 ± 56.71 and 363.02 ± 5.68 pg/mL, respectively; Figure 7f), indicating successful activation of macrophages and subsequent inflammatory signaling to intestinal epithelial cells. Notably, ILP intervention significantly reduced both TNF-α and IL-8 levels (2060.38 ± 91.01 and 344.07 ± 7.11 pg/mL, respectively), suggesting that ILP attenuates macrophage-mediated inflammatory attack on the intestinal epithelial barrier.
3.7.4. Effect of ILP on Intestinal Epithelial Barrier
Melting-curve analysis showed a predominant peak for each of the eight target genes (Figure S4), providing supporting information on qPCR amplicon specificity. To evaluate the effects of ILP on the intestinal epithelial barrier, the mRNA levels of ATOH1 (a key transcription factor for goblet cell differentiation), TFF3 (a mucosal protective factor), RETNLB (a goblet cell-specific secretory protein), and MUC2 (the major mucin) were analyzed (Figure 8a). Compared with the untreated control, LPS stimulation decreased the mRNA levels of these markers. ILP treatment increased their expression relative to the LPS group, although MUC2 expression remained lower than that in the untreated control. Western blot bands also showed changes in ATOH1, TFF3, RELMβ, and MUC2 (approximately 110 kDa anti-MUC2 antibody-reactive band) following LPS and ILP treatment (Figure 8b). As ATOH1 is associated with goblet cell differentiation and MUC2, TFF3, and RELMβ contribute to epithelial barrier function [40,42], these findings suggest that ILP may support mucus-associated epithelial responses under inflammatory conditions. Together, these findings indicate that ILP treatment was associated with changes in mucus-associated marker expression. However, the observed expression patterns alone do not establish changes in goblet cell differentiation or protein secretion.
Figure 8.
Effects of ILP treatment on mucus-associated and inflammation-related markers in the intestinal epithelial–immune triple-culture model. (a) mRNA expression of mucus-associated genes. (b) Western blot bands of mucus-associated proteins. (c) mRNA expression of inflammation-related genes. (d) Western blot bands of TLR4/MyD88/NF-κB pathway-related proteins. (e) Schematic overview of the experimental model, measured outcomes, and proposed epithelial–macrophage interaction; the dashed arrow indicates a proposed interaction that was not directly tested. In panels (a) and (c), data are presented as mean ± SD (n = 3 independent biological replicates). Relative gene expression was calculated using the 2−ΔΔCt method. Statistical comparisons were performed on ΔCt values using one-way ANOVA followed by Tukey’s multiple-comparison test. Different lowercase letters indicate significant differences among treatment groups for the same gene (p < 0.05). Fold changes, 95% confidence intervals, and Tukey-adjusted p-values for the LPS + ILP versus LPS comparison are provided in Table S5. In panel (b), an approximately 110 kDa anti-MUC2 antibody-reactive band is shown; the identity of this signal was not independently validated. N, untreated control group; LPS, lipopolysaccharide-treated group; LPS + ILP, group treated with LPS and ILP; ILP, Irpex lacteus crude polysaccharide-rich preparation; ATOH1, atonal basic helix–loop–helix transcription factor 1; TFF3, trefoil factor 3; RETNLB, resistin-like beta gene; RELMβ, resistin-like beta protein; MUC2, mucin 2; Tlr4/TLR4, Toll-like receptor 4; Myd88/MyD88, myeloid differentiation primary response 88; Nfkbia, gene encoding inhibitor of NF-κB alpha; IκBα, inhibitor of NF-κB alpha; Rela, gene encoding the NF-κB p65 subunit; NF-κB, nuclear factor kappa B; p65, NF-κB p65 subunit; p-, phosphorylated; TEER, transepithelial electrical resistance; FITC-dextran, fluorescein isothiocyanate–dextran; DCFH-DA, 2′,7′-dichlorodihydrofluorescein diacetate; SOD, superoxide dismutase; CAT, catalase; GSH-PX, glutathione peroxidase; MDA, malondialdehyde; NO, nitric oxide; TNF-α, tumor necrosis factor alpha; IL-8, interleukin-8; kDa, kilodalton.
3.7.5. Effect of ILP on the Regulation of Inflammation
The TLR4/MyD88/NF-κB signaling pathway is involved in inflammatory responses that can affect intestinal barrier function. TLR4 recognizes extracellular stimuli and initiates downstream signaling associated with the production of pro-inflammatory mediators [43]. Under inflammatory conditions, IκBα phosphorylation and degradation can contribute to NF-κB activation [2].
In the present study, LPS stimulation increased the mRNA levels of Tlr4 and Myd88 and decreased the mRNA level of Nfkbia. Compared with the LPS group, ILP treatment was associated with lower Tlr4 and Myd88 mRNA levels and a higher Nfkbia mRNA level (Figure 8c). Western blot bands also showed differences in TLR4/MyD88/NF-κB-related proteins among the treatment groups (Figure 8d). Together with the changes in inflammatory mediators and barrier-related measurements, these findings are consistent with an association between ILP treatment and modulation of inflammatory signaling in the triple-culture model. Further pathway perturbation experiments are needed to determine whether TLR4/MyD88/NF-κB signaling contributes to the barrier-related effects of ILP.
In the triple-culture model, ILP was applied to the apical compartment, whereas RAW264.7 cells were located in the basolateral compartment (Figure 8e). Therefore, the observed responses may involve effects of ILP on epithelial cells and subsequent changes in epithelial–macrophage communication, or effects of ILP components that reached the basolateral compartment. Further studies are needed to clarify the site and mode of action of ILP in the co-culture system.
3.8. Limitations
Several limitations should be considered. The effects of ILP cannot be attributed exclusively to polysaccharides because of its crude composition. The mixed-species cell model and limited treatment conditions restrict the interpretation and in vivo relevance of the findings. In addition, uncertainties related to assay interference in CCK-8 and DCFH-DA assays, cytokine cross-reactivity, and qPCR amplification efficiencies and reference-gene stability validation should be considered. The changes in mucus-associated and inflammatory markers do not establish changes in mucus secretion or goblet cell differentiation, or a causal protective mechanism. Further studies using purified fractions, additional controls and concentrations, mechanistic approaches, and in vivo models are needed.
4. Conclusions
This study integrated process optimization with functional evaluation to characterize the antioxidant and intestinal barrier-protective properties of ILP. Compared with conventional RSM, the BPNN–GA model provided better predictive performance and a reliable basis for selecting the hot-water extraction conditions. The resulting ILP was a compositionally complex, polysaccharide-rich preparation that exhibited predominantly amorphous characteristics, thermal stability, and in vitro radical-scavenging activity. In LPS-stimulated macrophages, ILP treatment was associated with lower DCF fluorescence and changes in antioxidant enzyme activities and MDA levels. In the triple-culture model, ILP treatment was associated with higher TEER, a lower basolateral-to-apical FITC-dextran fluorescence ratio, and changes in mucus-associated marker expression compared with the LPS group. Changes in inflammatory mediators and TLR4/MyD88/NF-κB-related markers accompanied these effects. Collectively, these preliminary in vitro findings support the potential of the crude ILP polysaccharide-rich preparation as a fungal-derived functional ingredient for maintaining intestinal barrier health.
Supplementary Materials
The following supporting information can be downloaded at https://www.mdpi.com/article/10.3390/antiox15111493/s1, Table S1: Response surface experimental factors, levels and coding; Table S2: Primer information; Table S3: Variations in the physical and chemical properties of ILP across batches; Table S4: Molar ratio of monosaccharide composition; Table S5: Statistical comparison of qPCR gene expression between the LPS + ILP and LPS groups; Figure S1: Parameters for reverse transcription and RT-qPCR run protocols; Figure S2: Residual diagnostic plots for the BBD model; Figure S3: Contour plot of various extraction parameters on polysaccharide yield; Figure S4: Melting curves of the target genes analyzed by qPCR.
Author Contributions
Writing—original draft, writing—review & editing, S.C.; validation, W.S.; visualization, F.S.; formal analysis, Y.Z. (Yinzhi Zhang); methodology, H.L.; conceptualization, Y.J.; supervision, C.M.; project administration, Y.Z. (Yu Zhang). All authors have read and agreed to the published version of the manuscript.
Funding
This research was funded by the National Natural Science Foundation of China, grant number 32502220.
Institutional Review Board Statement
Not applicable.
Informed Consent Statement
Not applicable.
Data Availability Statement
The raw data supporting the conclusions of this article will be made available by the authors on request.
Conflicts of Interest
The authors declare no conflicts of interest.
Abbreviations
The following abbreviations are used in this manuscript:
| I2–KI | Iodine–potassium iodide |
| DPPH | 2,2-Diphenyl-1-picrylhydrazyl |
| DCFH–DA | 2′,7′-Dichlorodihydrofluorescein diacetate |
| ROS | Reactive oxygen species |
| TEER | Transepithelial electrical resistance |
| ELISA | Enzyme-linked immunosorbent assay |
| IL-8 | Interleukin-8 |
| TNF-α | Tumor necrosis factor-α |
| LPS | Lipopolysaccharide |
| SOD | Superoxide dismutase |
| CAT | Catalase |
| GSH-PX | Glutathione peroxidase |
| MDA | Malondialdehyde |
| NO | Nitric oxide |
| TLR4 | Toll-like receptor 4 |
| MyD88 | Myeloid differentiation primary response 88 |
| NF-κB | Nuclear factor-kappa B |
References
- Wang, Z.; Liu, X.; Bao, Y.; Wang, X.; Zhai, J.; Zhan, X.; Zhang, H. Characterization and anti-inflammation of a polysaccharide produced by Chaetomium globosum CGMCC 6882 on LPS-induced RAW 264.7 cells. Carbohydr. Polym. 2021, 251, 117129. [Google Scholar] [CrossRef] [Scilit] [PubMed]
- Hu, S.; Zhao, R.; Yuan, Y.; Tang, X.; Chi, X.; Wang, Z.; Zhou, X.; Zhou, Y.; Zhu, B.; Hu, J. Macrophage-targeted polyphenol-armored nanoparticles synergistically attenuate colitis by suppressing TLR4/Myd88/NF-κB and modulating gut microbiota. Chem. Eng. J. 2025, 522, 167934. [Google Scholar] [CrossRef] [Scilit]
- Liang, J.; Huang, Y.-X.; Zhu, X.-H.; Zhou, F.-Y.; Wu, T.-Y.; Jia, J.-F.; Liu, X.; Kuang, H.-X.; Xia, Y.-G. Structural identification, rheological properties and immunological receptor of a complex galacturonoglucan from fruits of Schisandra chinensis (Turcz.) Baill. Carbohydr. Polym. 2024, 346, 122644. [Google Scholar] [CrossRef] [Scilit] [PubMed]
- Song, J.; Xue, Q.; Wang, H.; Jin, R.; Liu, X.; Li, L.; Liu, Y.; Wang, D.; Hu, M. Structural characterization and osteogenic potential of polysaccharide purified from Sanghuangporus vaninii. Carbohydr. Polym. 2025, 367, 124018. [Google Scholar] [CrossRef] [Scilit] [PubMed]
- Li, Q.; Wang, W.; Zhu, Y.; Chen, Y.; Zhang, W.; Yu, P.; Mao, G.; Zhao, T.; Feng, W.; Yang, L.; et al. Structural elucidation and antioxidant activity a novel Se-polysaccharide from Se-enriched Grifola frondosa. Carbohydr. Polym. 2017, 161, 42–52. [Google Scholar] [CrossRef] [Scilit] [PubMed]
- Wang, L.; Zhang, Z.; Zeng, Z.; Lin, Y.; Xiong, B.; Zheng, B.; Zhang, Y.; Pan, L. Structural characterization of polysaccharide from an edible fungus Dictyophora indusiata and the remodel function of gut microbiota in inflammatory mice. Carbohydr. Polym. 2025, 351, 123141. [Google Scholar] [CrossRef] [Scilit] [PubMed]
- Na, Z.; Yan, L.; Jia-Hui, L.; Juan, W.; Shuang, Y.; Nan, Z.; Meng, Q.-F.; Li-Rong, T. Isolation, Purification and Bioactivities of Polysaccharides from Irpex lacteus. Chem. Res. Chin. Univ. 2012, 28, 249–254. [Google Scholar]
- Liu, Z.; Tang, Y.; Shi, X.; Han, J.; Niu, D.; Zhang, F.; Yi, X.; Zhu, J. Parameter Optimization and Regulatory Mechanism of Cold Plasma Pretreatment for Enhancing Intracellular Polysaccharides Yield in Irpex lacteus. Appl. Biochem. Biotechnol. 2026, 198, 6131–6150. [Google Scholar] [CrossRef] [Scilit] [PubMed]
- Qiu, J.; Xu, X.; Guo, J.; Wang, Z.; Wu, J.; Ding, H.; Xu, Y.; Wu, Y.; Ying, Q.; Qiu, J.; et al. Comparison of extraction processes, characterization and intestinal protection activity of Bletilla striata polysaccharides. Int. J. Biol. Macromol. 2024, 263, 130267. [Google Scholar] [CrossRef] [Scilit] [PubMed]
- Tang, D.-X.; Zhou, S.-Z.; Wang, Z.-J.; Zhang, Y.-L.; Liu, K.; Yang, J.-Y.; Yang, X.-J.; Li, Y.-S.; Zhang, X. Efficiently radiation-induced degradation and extraction of Polygonatum sibiricum polysaccharides and its excellent ROS scavenging properties. Chem. Eng. J. 2025, 505, 159717. [Google Scholar] [CrossRef] [Scilit]
- Chen, H.; Wang, B.; Li, J.; Xu, J.; Zeng, J.; Gao, W.; Chen, K. Comparative study on the extraction efficiency, characterization, and bioactivities of Bletilla striata polysaccharides using response surface methodology (RSM) and genetic algorithm-artificial neural network (GA-ANN). Int. J. Biol. Macromol. 2023, 226, 982–995. [Google Scholar] [CrossRef] [Scilit] [PubMed]
- Chakraborty, R.; Sahu, H. Intensification of biodiesel production from waste goat tallow using infrared radiation: Process evaluation through response surface methodology and artificial neural network. Appl. Energy 2014, 114, 827–836. [Google Scholar] [CrossRef] [Scilit]
- Jia, W.; Zhao, D.; Ding, L. An optimized RBF neural network algorithm based on partial least squares and genetic algorithm for classification of small sample. Appl. Soft Comput. 2016, 48, 373–384. [Google Scholar] [CrossRef] [Scilit]
- Tepsongkroh, B.; Thaihuttakij, C.; Supawong, S.; Jangchud, K. Impact of high pressure pre-treatment and hot water extraction on chemical properties of crude polysaccharide extract obtained from mushroom (Volvariella volvacea). Food Chem. X 2023, 19, 100864. [Google Scholar] [CrossRef] [Scilit] [PubMed]
- Wang, L.; Li, L.; Gao, J.; Huang, J.; Yang, Y.; Xu, Y.; Liu, S.; Yu, W. Characterization, antioxidant and immunomodulatory effects of selenized polysaccharides from dandelion roots. Carbohydr. Polym. 2021, 260, 117796. [Google Scholar] [CrossRef] [Scilit] [PubMed]
- Li, C.; Zhou, S.; Chen, S.; Xu, Z.; Xue, Q.; Wang, H.; Liu, T.; Chen, W.; Feng, J.; Chen, J.; et al. Gut microbiota-mediated immunomodulation underlies the anti-tumor effects of a novel ginseng polysaccharide. Carbohydr. Polym. 2025, 370, 124458. [Google Scholar] [CrossRef] [Scilit] [PubMed]
- Li, H.; Zhang, Y.; Zheng, Y.; Li, X.; Li, Z.; Man, C.; Zhang, Y.; Jiang, Y. Structural characterization of the exopolysaccharide produced by Bacillus amyloliquefaciens JM033 and evaluation of its ability to regulate immunity and intestinal flora. Int. J. Biol. Macromol. 2025, 306, 141052. [Google Scholar] [CrossRef] [Scilit] [PubMed]
- Cheng, S.; Li, W.; Ma, W.; Xu, C.; Li, H.; Jiang, Y.; Zhang, Y. Synergistic construction of whey protein isolate-Irpex lacteus polysaccharide gel via Lacticaseibacillus paracasei JY091 fermentation: Insights from multi-scale structure to enhanced functionality. Food Hydrocoll. 2026, 180, 112802. [Google Scholar] [CrossRef] [Scilit]
- Ji, C.; Zhang, Z.; Zhang, B.; Chen, J.; Liu, R.; Song, D.; Li, W.; Lin, N.; Zou, X.; Wang, J.; et al. Purification, characterization, and in vitro antitumor activity of a novel glucan from the purple sweet potato Ipomoea Batatas (L.) Lam. Carbohydr. Polym. 2021, 257, 117605. [Google Scholar] [CrossRef] [Scilit] [PubMed]
- Zhang, Y.; Zhong, C.; Liu, S.; Du, L.; Ma, H.; Zhang, H.; Li, Y.; He, C.; Guan, L. Ultrasonic assisted three-phase partitioning extraction and bioactivities validation of polysaccharides from Flammulina velutipes residues. Food Chem. X 2025, 31, 103177. [Google Scholar] [CrossRef] [Scilit] [PubMed]
- Quero, J.; Ballesteros, L.F.; Ferreira-Santos, P.; Velderrain-Rodriguez, G.R.; Rocha, C.M.R.; Pereira, R.N.; Teixeira, J.A.; Martin-Belloso, O.; Osada, J.; Rodríguez-Yoldi, M.J. Unveiling the Antioxidant Therapeutic Functionality of Sustainable Olive Pomace Active Ingredients. Antioxidants 2022, 11, 828. [Google Scholar] [CrossRef] [Scilit] [PubMed]
- Kono, G.; Yoshida, K.; Kokubo, E.; Ikeda, M.; Matsubara, T.; Koyama, T.; Iwamoto, H.; Miyaji, K. Fermentation Supernatant of Elderly Feces with Inulin and Partially Hydrolyzed Guar Gum Maintains the Barrier of Inflammation-Induced Caco-2/HT29-MTX-E12 Co-Cultured Cells. J. Agric. Food Chem. 2023, 71, 1510–1517. [Google Scholar] [CrossRef] [Scilit] [PubMed]
- Guo, F.; Tsao, R.; Li, C.; Wang, X.; Zhang, H.; Jiang, L.; Sun, Y.; Xiong, H. Polyphenol Content of Green Pea (Pisum sativum L.) Hull under In Vitro Digestion and Effects of Digestive Products on Anti-Inflammatory Activity and Intestinal Barrier in the Caco-2/Raw264.7 Coculture Model. J. Agric. Food Chem. 2022, 70, 3477–3488. [Google Scholar] [CrossRef] [Scilit] [PubMed]
- Cheng, S.; Li, H.; Ding, Y.; Huo, J.; Zheng, Y.; Jiang, Y.; Zhang, Y.; Man, C. The Probiotic Combination of Lacticaseibacillus paracasei JY062 and Lactobacillus gasseri JM1 Alleviates Gastrointestinal Motility Disorder via Improving Gut Microbiota. Nutrients 2023, 15, 839. [Google Scholar] [CrossRef] [Scilit] [PubMed]
- Wu, Z.-W.; Liu, X.-C.; Quan, C.-X.; Tao, X.-Y.; Yi, L.; Zhao, X.-F.; Peng, X.-R.; Qiu, M.-H. Novel galactose-rich polysaccharide from Ganoderma lucidum: Structural characterization and immunomodulatory activities. Carbohydr. Polym. 2025, 362, 123695. [Google Scholar] [CrossRef] [Scilit] [PubMed]
- Ying, Z.; Han, X.; Li, J. Ultrasound-assisted extraction of polysaccharides from mulberry leaves. Food Chem. 2011, 127, 1273–1279. [Google Scholar] [CrossRef] [Scilit] [PubMed]
- Ponmurugan, K.; Al-Dhabi, N.A.; Maran, J.P.; Karthikeyan, K.; Moothy, I.G.; Sivarajasekar, N.; Manoj, J.J.B. Ultrasound assisted pectic polysaccharide extraction and its characterization from waste heads of Helianthus annus. Carbohydr. Polym. 2017, 173, 707–713. [Google Scholar] [CrossRef] [Scilit] [PubMed]
- Zheng, S.; Li, F.; Luo, J.; Wang, Y.; Bao, J.; Lin, J.; Jiang, W. Optimizing the extraction process of total saponins from Panax vietnamensis based on response surface analysis and backpropagation neural network-genetic algorithm. Ind. Crops Prod. 2024, 220, 119252. [Google Scholar] [CrossRef] [Scilit]
- Chen, Y.; Wu, M.; Xu, X.; Zhu, S.; Shen, M.; Ma, A.; She, Z.; Shi, S.; Han, X.; Zhang, T. Optimization of ultrasound-assisted extraction of polysaccharides from Akebia Fruit using an artificial neural network model: Characteristics and antioxidant activity. Ultrason. Sonochem. 2025, 120, 107447. [Google Scholar] [CrossRef] [Scilit] [PubMed]
- Ye, J.; Wang, X.; Wang, K.; Deng, Y.; Yang, Y.; Ali, R.; Chen, F.; Wu, Z.; Liao, W.; Mao, L. A novel polysaccharide isolated from Flammulina velutipes, characterization, macrophage immunomodulatory activities and its impact on gut microbiota in rats. J. Anim. Physiol. Anim. Nutr. 2020, 104, 735–748. [Google Scholar] [CrossRef] [Scilit] [PubMed]
- Payling, L.; Fraser, K.; Loveday, S.M.; Sims, I.; Roy, N.; McNabb, W. The effects of carbohydrate structure on the composition and functionality of the human gut microbiota. Trends Food Sci. Technol. 2020, 97, 233–248. [Google Scholar] [CrossRef] [Scilit]
- Pak, U.; Cheng, H.; Liu, X.; Wang, Y.; Ho, C.; Ri, H.; Xu, J.; Qi, X.; Yu, H. Structural characterization and anti-oxidation activity of pectic polysaccharides from Swertia mileensis. Int. J. Biol. Macromol. 2023, 248, 125896. [Google Scholar] [CrossRef] [Scilit] [PubMed]
- Tian, W.; Dai, L.; Lu, S.; Luo, Z.; Qiu, Z.; Li, J.; Li, P.; Du, B. Effect of Bacillus sp. DU-106 fermentation on Dendrobium officinale polysaccharide: Structure and immunoregulatory activities. Int. J. Biol. Macromol. 2019, 135, 1034–1042. [Google Scholar] [CrossRef] [Scilit] [PubMed]
- Liu, C.Y.; Hu, D.J.; Zhu, H.; Zhang, Y.Y.; Qin, J.; Wang, F.; Zhang, Z.D.; Lv, G.P. Preparation, characterization and immunoregulatory activity of derivatives of polysaccharide from Atractylodes lancea (Thunb.) DC. Int. J. Biol. Macromol. 2022, 216, 225–234. [Google Scholar] [CrossRef] [Scilit] [PubMed]
- Yang, N.; Wang, D.; Geng, Y.; Man, J.; Gao, Y.; Hang, Y.; Zheng, H.; Zhang, M. Structure, physicochemical characterisation and properties of pectic polysaccharide from Premma puberula pamp. Food Hydrocoll. 2022, 128, 107550. [Google Scholar] [CrossRef] [Scilit]
- Bothara, S.B.; Singh, S. Thermal studies on natural polysaccharide. Asian Pac. J. Trop. Biomed. 2012, 2, S1031–S1035. [Google Scholar] [CrossRef] [Scilit]
- Li, F.; Jin, Y.; Wang, J.; Xu, H. Structure Identification of Two Polysaccharides from Morchella sextelata. Foods 2022, 11, 982. [Google Scholar] [CrossRef] [Scilit] [PubMed]
- Luong, M.; Zhang, Y.; Chamberlain, T.; Zhou, T.; Wright, J.F.; Dower, K.; Hall, J.P. Stimulation of TLR4 by recombinant HSP70 requires structural integrity of the HSP70 protein itself. J. Inflamm. 2012, 9, 11. [Google Scholar] [CrossRef] [Scilit] [PubMed]
- Feng, G.; Han, K.; Yang, Q.; Feng, W.; Guo, J.; Wang, J.; Yang, X. Interaction of Pyrogallol-Containing Polyphenols with Mucin Reinforces Intestinal Mucus Barrier Properties. J. Agric. Food Chem. 2022, 70, 9536–9546. [Google Scholar] [CrossRef] [Scilit] [PubMed]
- Li, J.; Zhang, L.; Wu, T.; Li, Y.; Zhou, X.; Ruan, Z. Indole-3-propionic Acid Improved the Intestinal Barrier by Enhancing Epithelial Barrier and Mucus Barrier. J. Agric. Food Chem. 2021, 69, 1487–1495. [Google Scholar] [CrossRef] [Scilit] [PubMed]
- Sonnier, D.I.; Bailey, S.R.; Schuster, R.M.; Lentsch, A.B.; Pritts, T.A. TNF-α Induces Vectorial Secretion of IL-8 in Caco-2 Cells. J. Gastrointest. Surg. 2010, 14, 1592–1598. [Google Scholar] [CrossRef] [Scilit] [PubMed]
- Paone, P.; Suriano, F.; Jian, C.; Korpela, K.; Delzenne, N.M.; Van Hul, M.; Salonen, A.; Cani, P.D. Prebiotic oligofructose protects against high-fat diet-induced obesity by changing the gut microbiota, intestinal mucus production, glycosylation and secretion. Gut Microbes 2022, 14, 2152307. [Google Scholar] [CrossRef] [Scilit] [PubMed]
- Lin, X.; Li, W.; Yuen, H.; Yuen, M.; Peng, Q. Immunomodulatory effect of intracellular polysaccharide from mycelia of Agaricus bitorquis (QuéL.) Sacc. Chaidam by TLR4-mediated MyD88 dependent signaling pathway. Int. J. Biol. Macromol. 2021, 183, 79–89. [Google Scholar] [CrossRef] [Scilit] [PubMed]
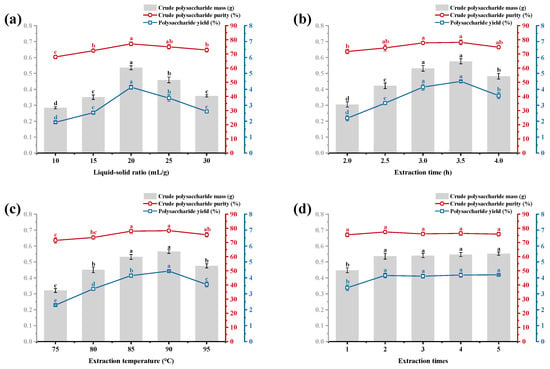
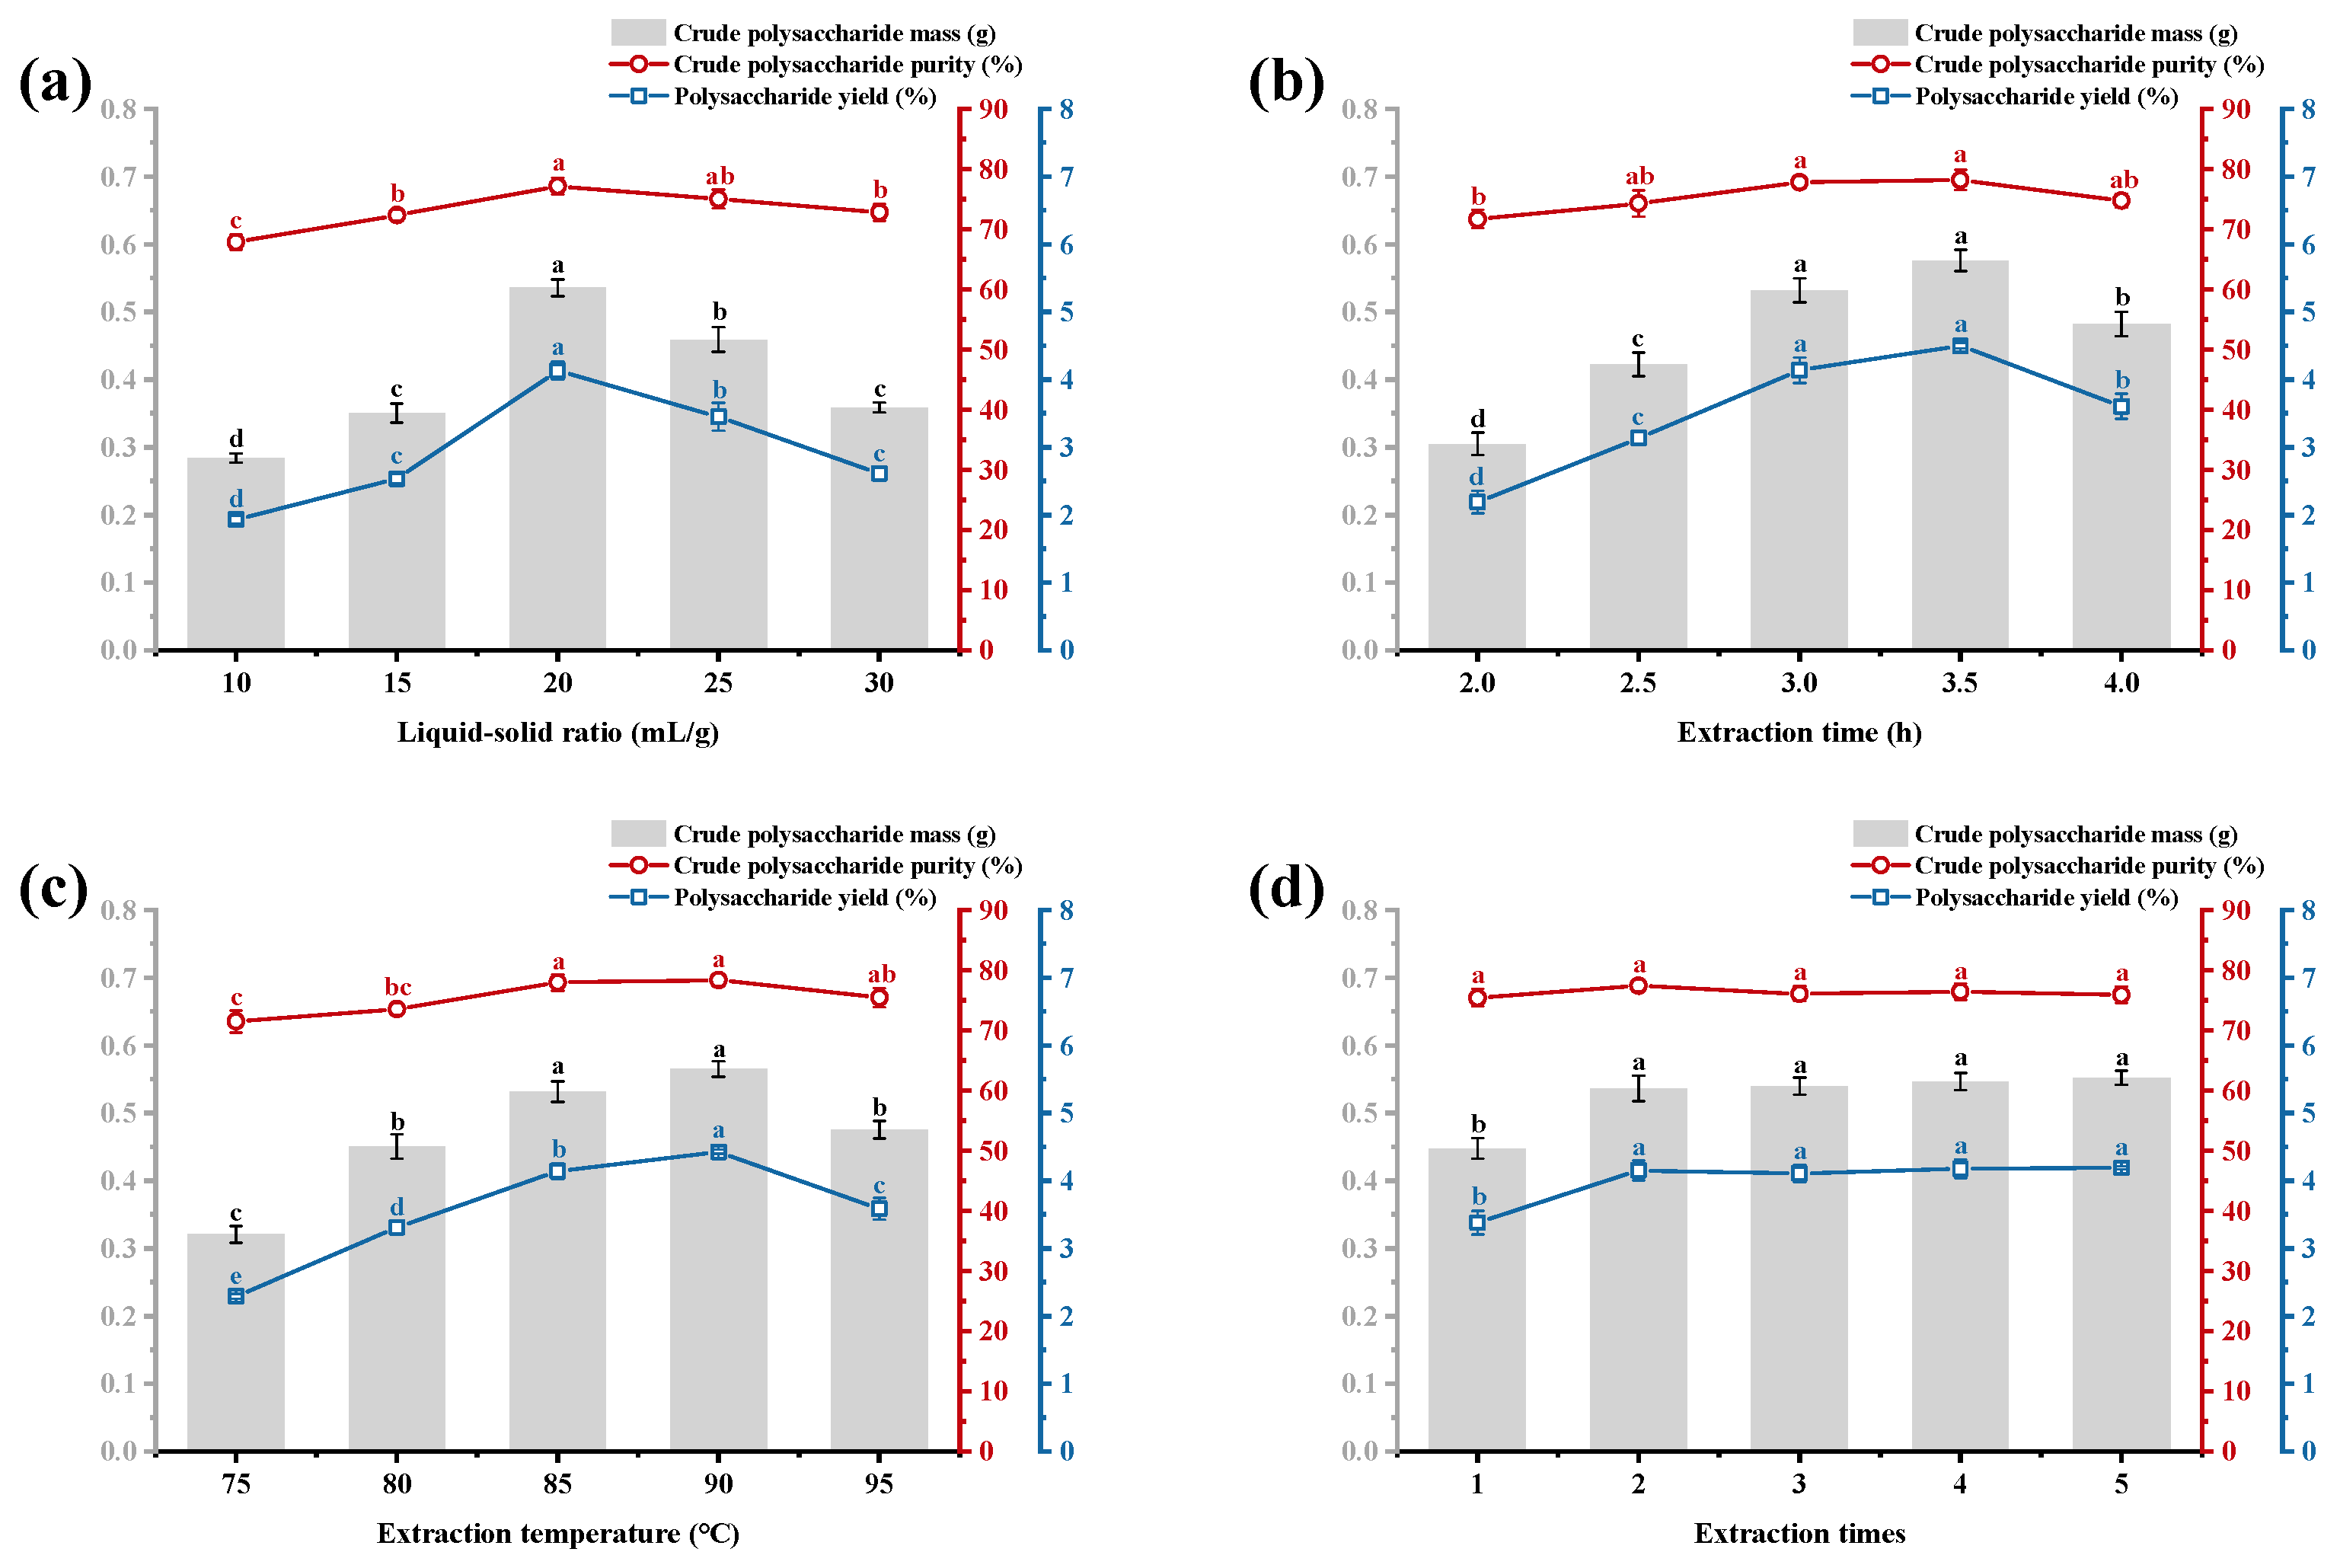
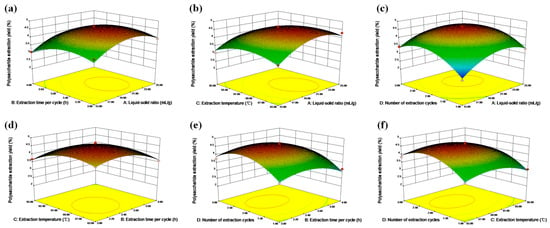
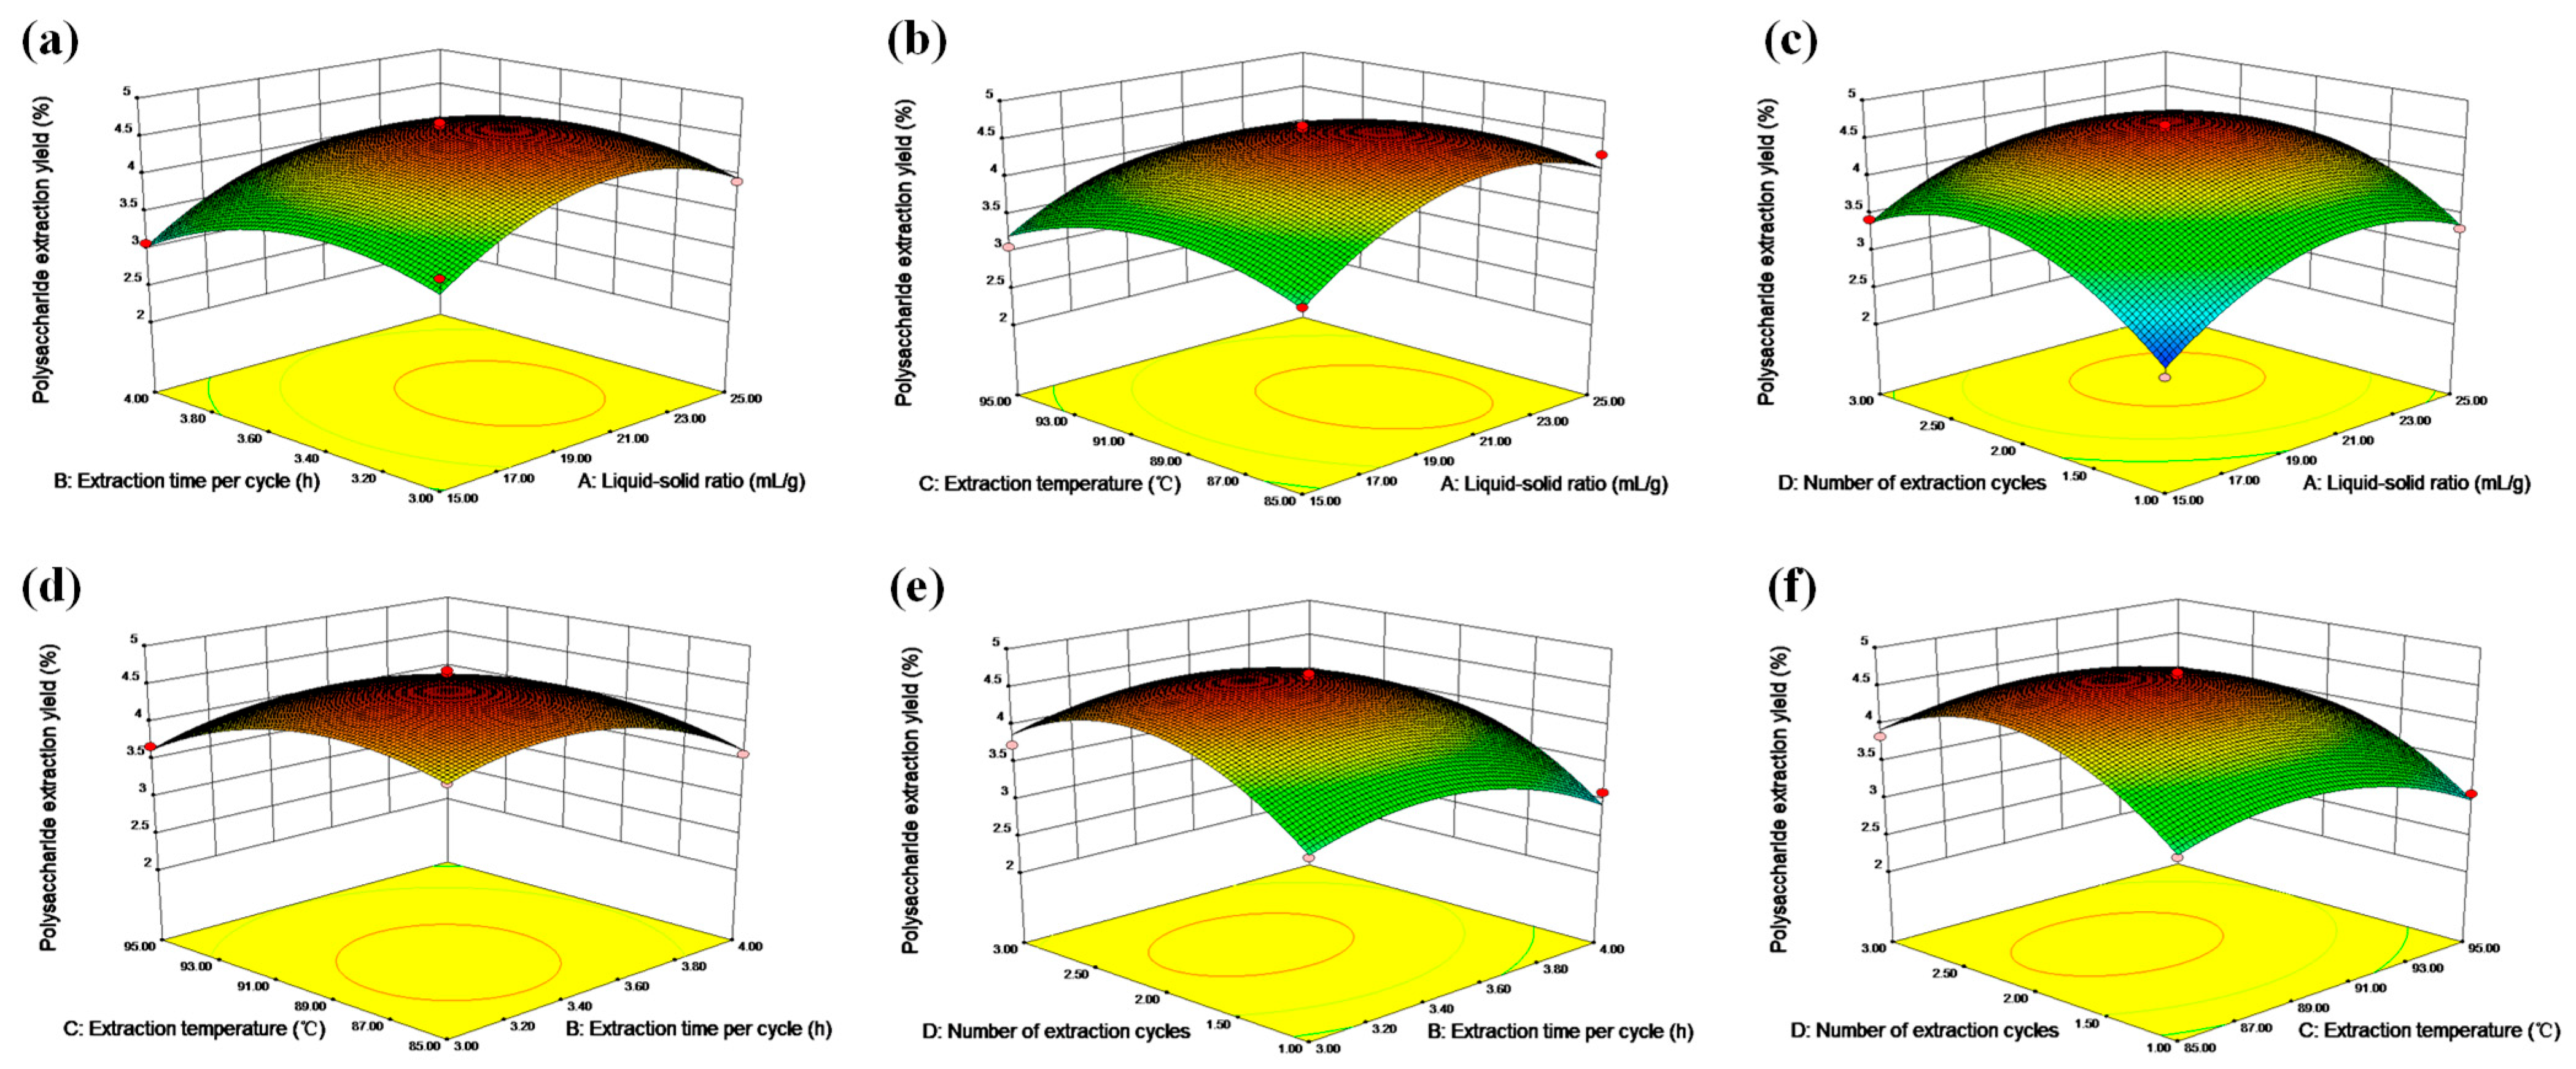
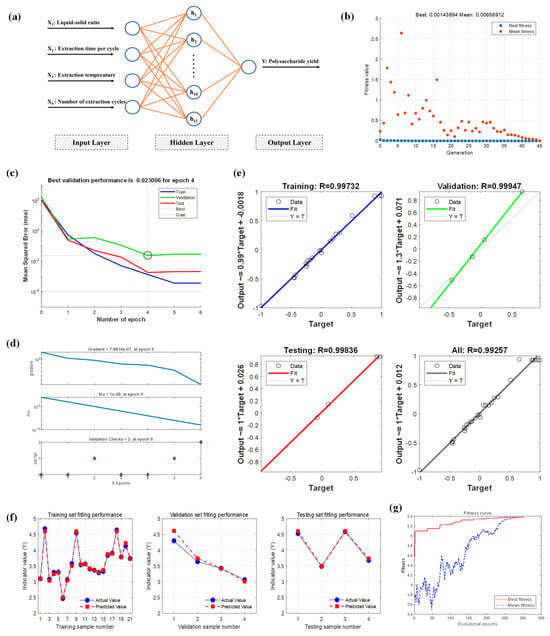
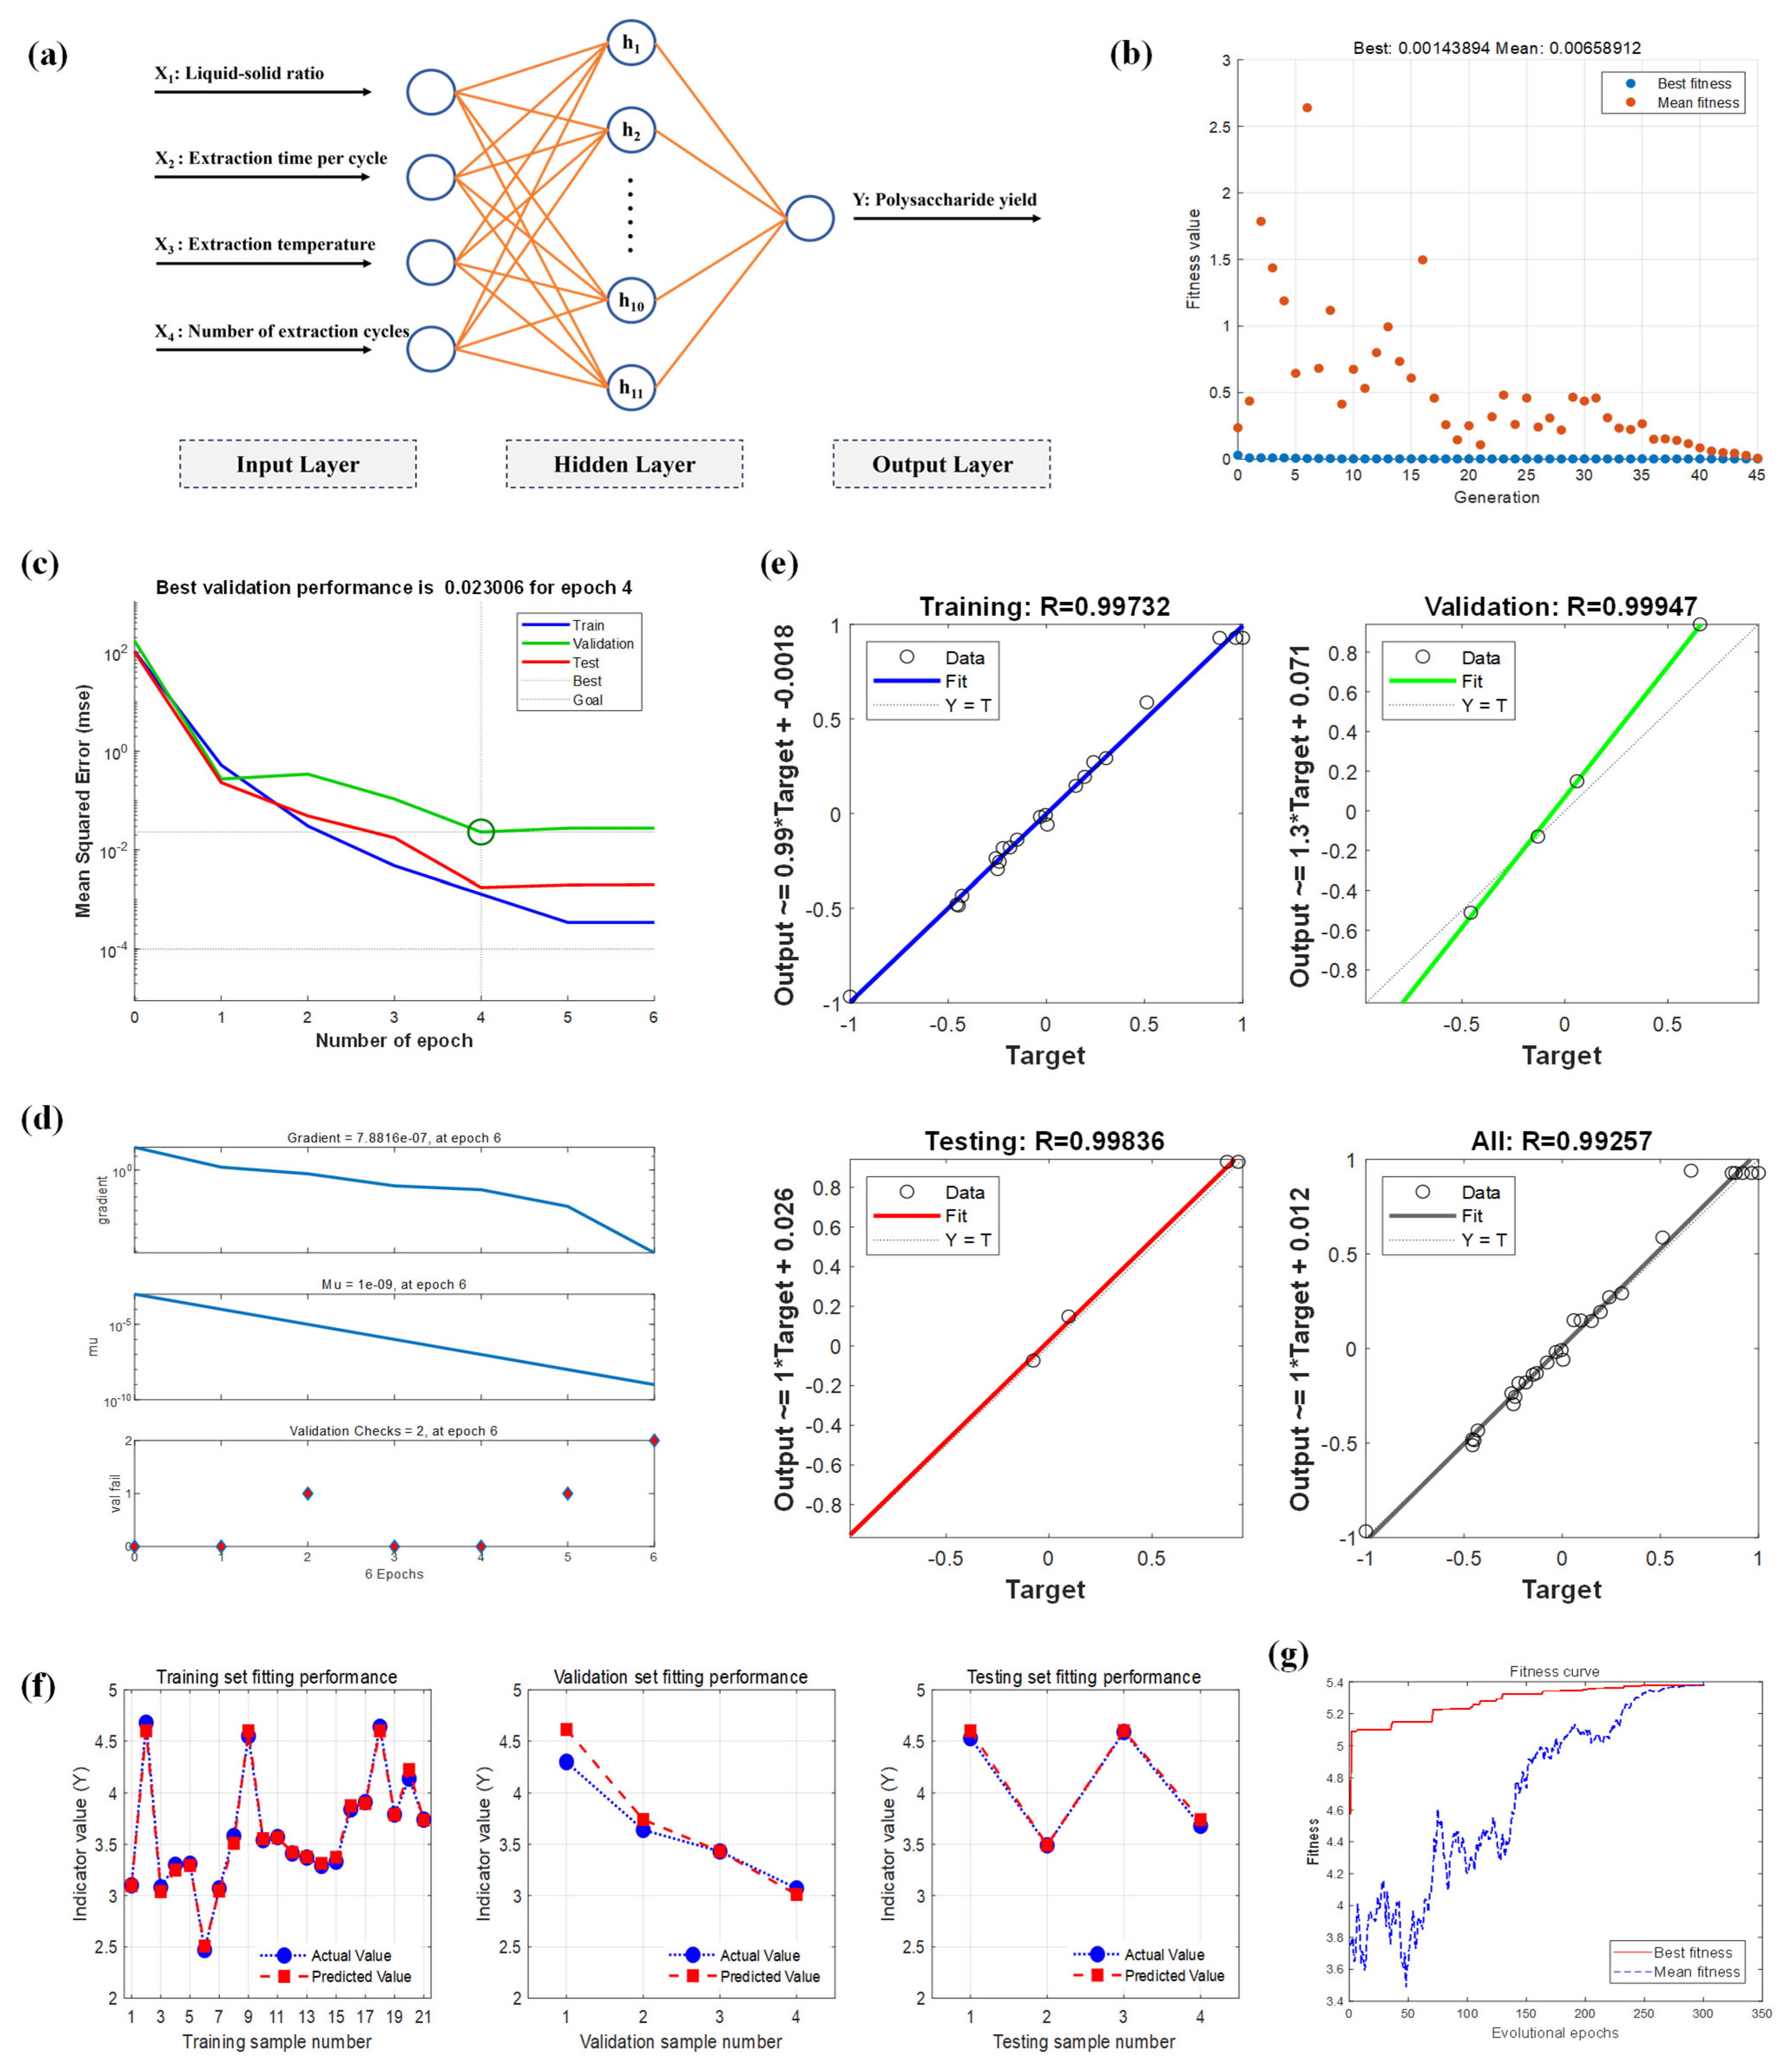
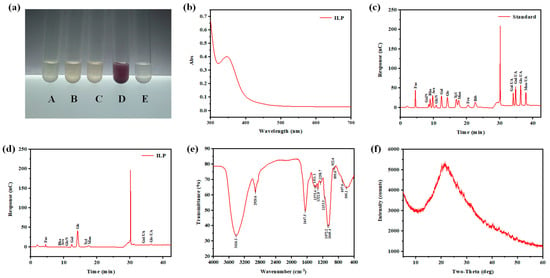
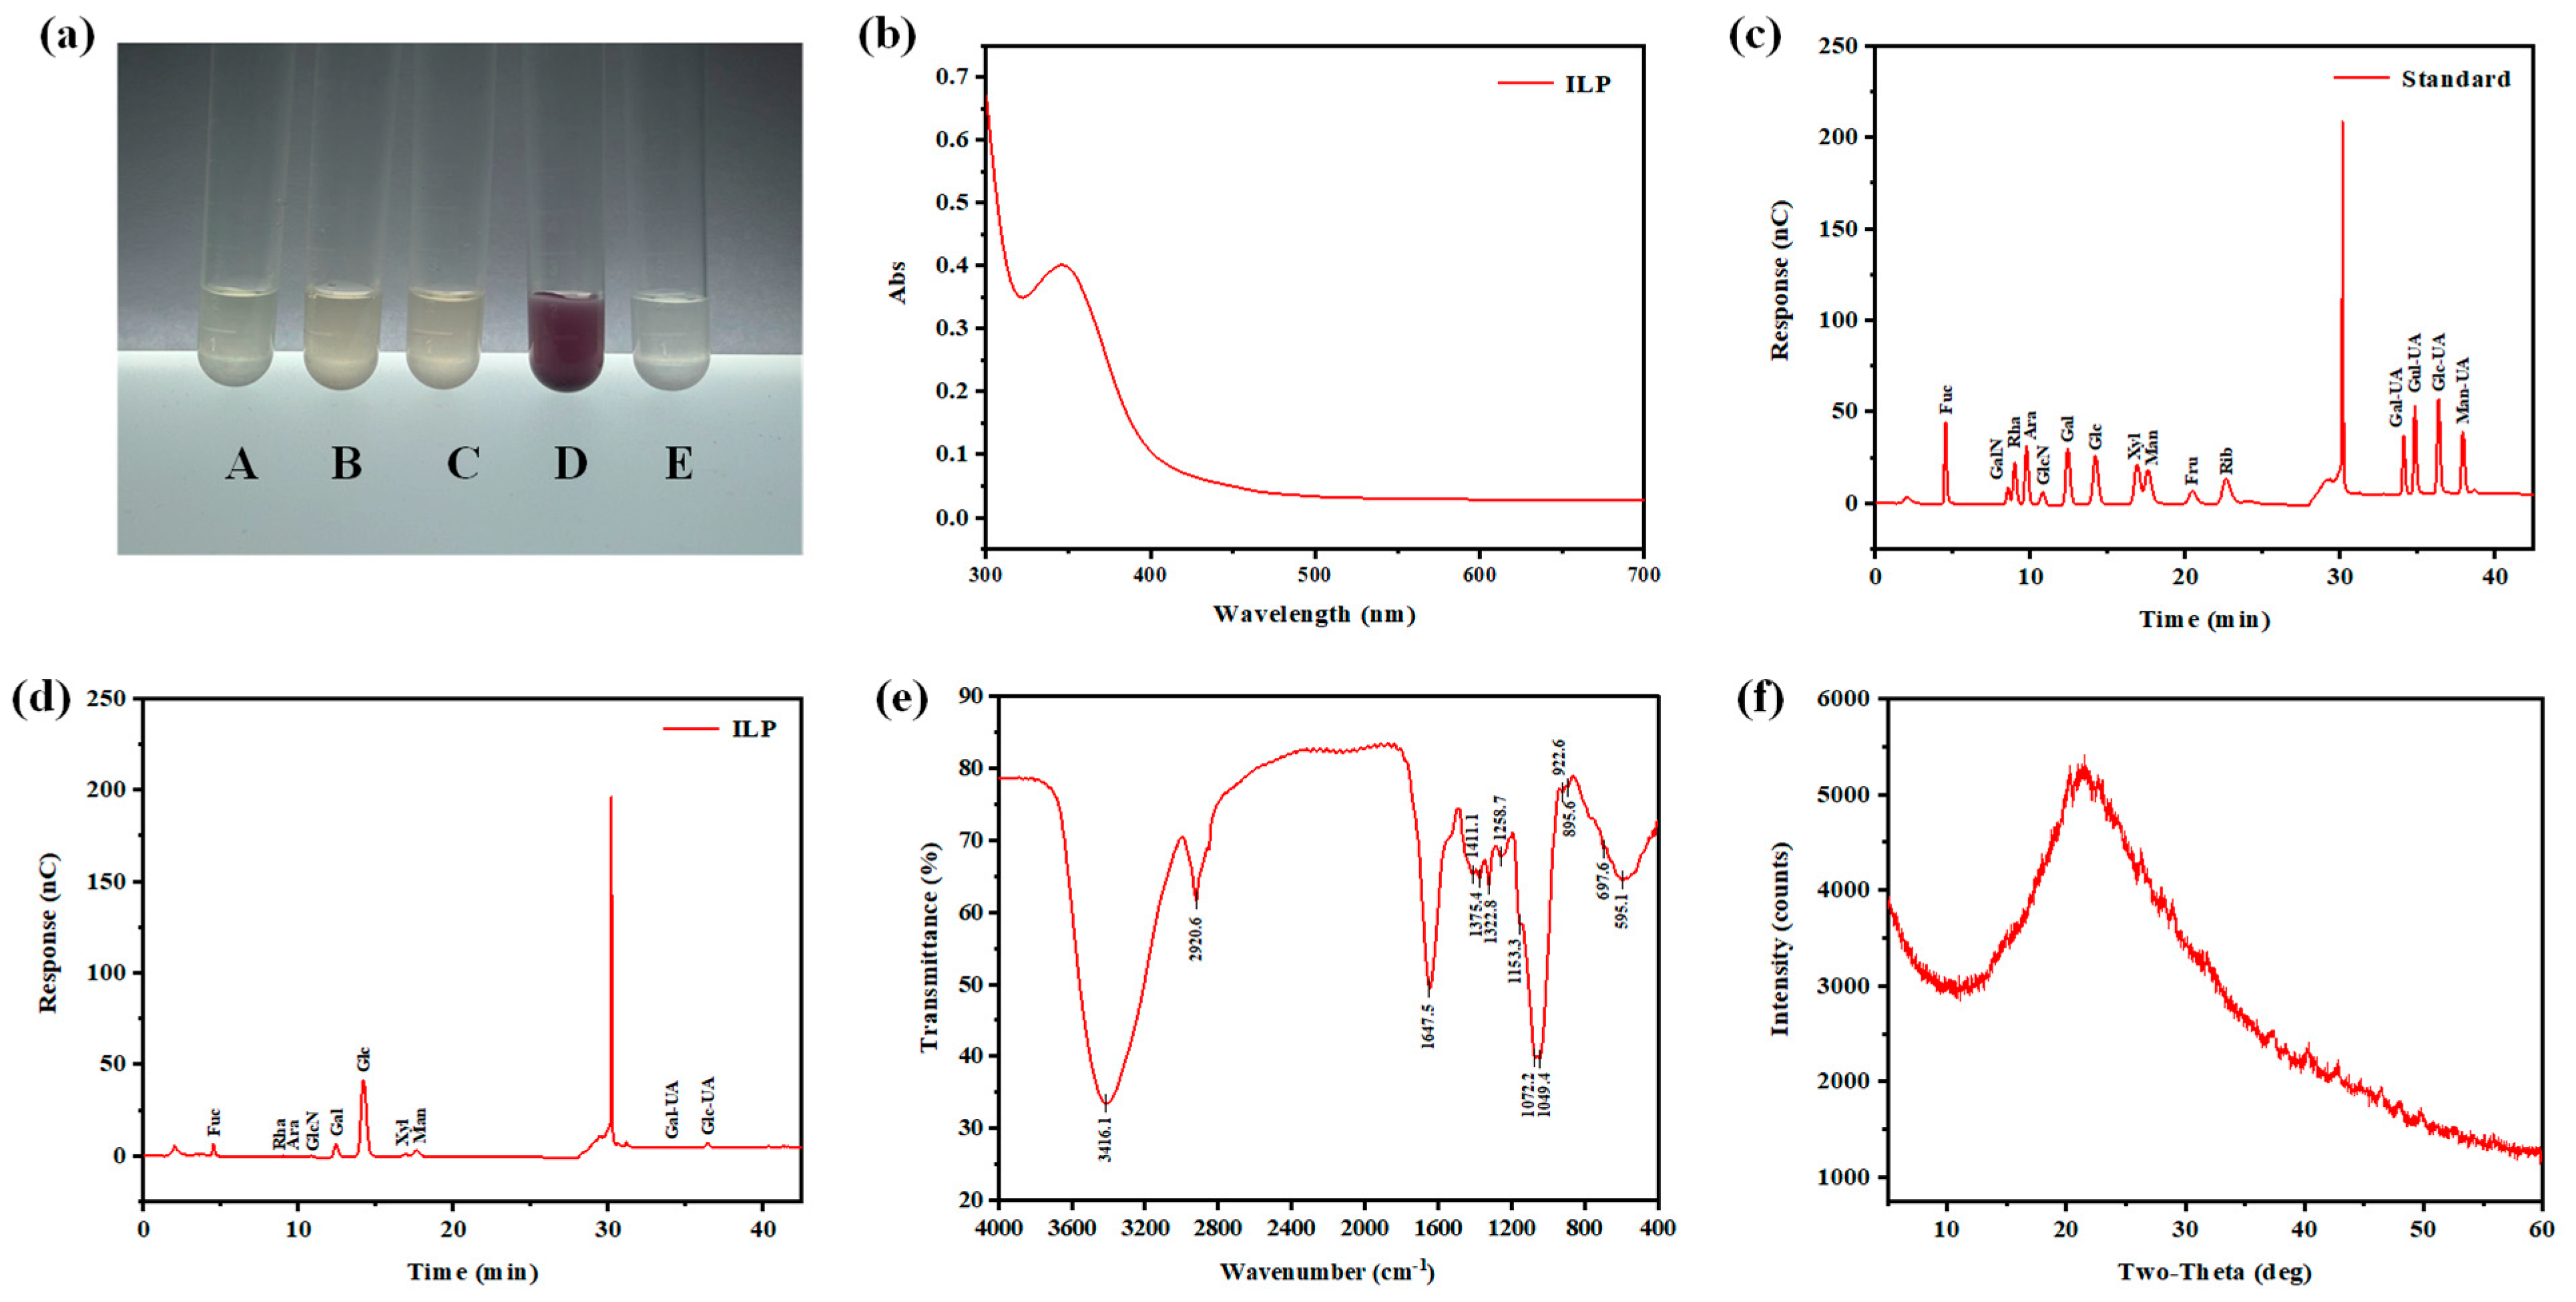
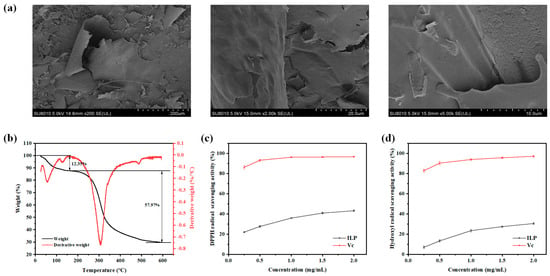
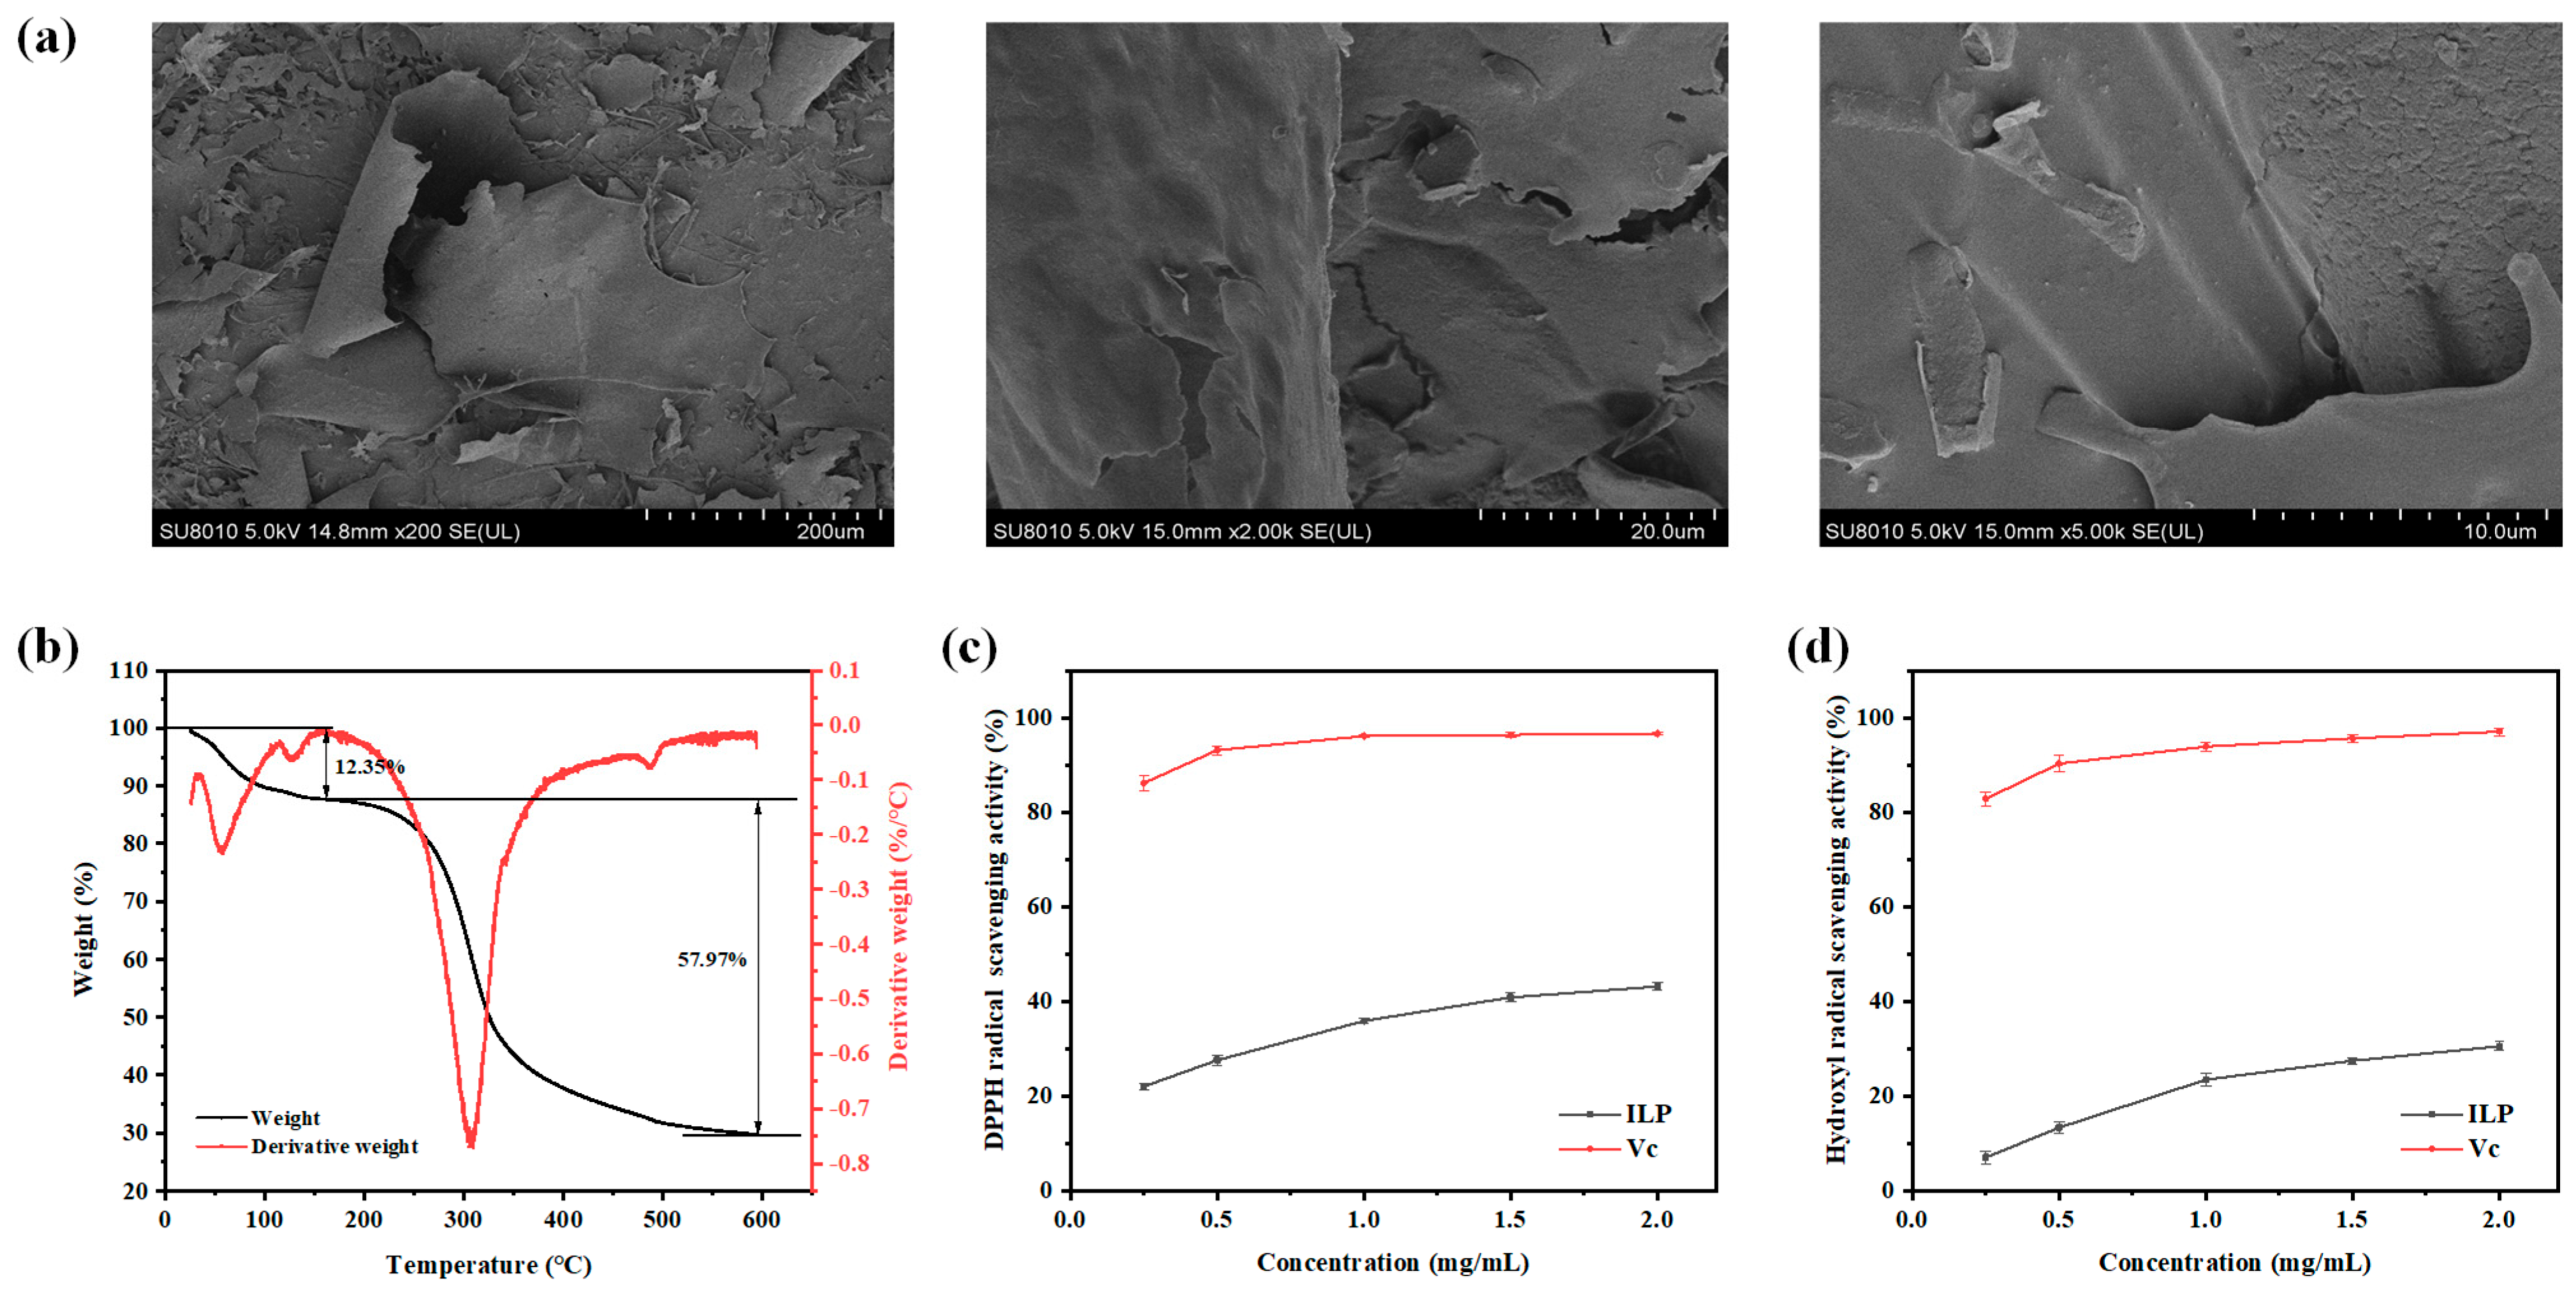
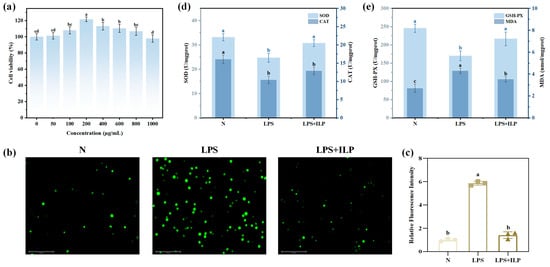
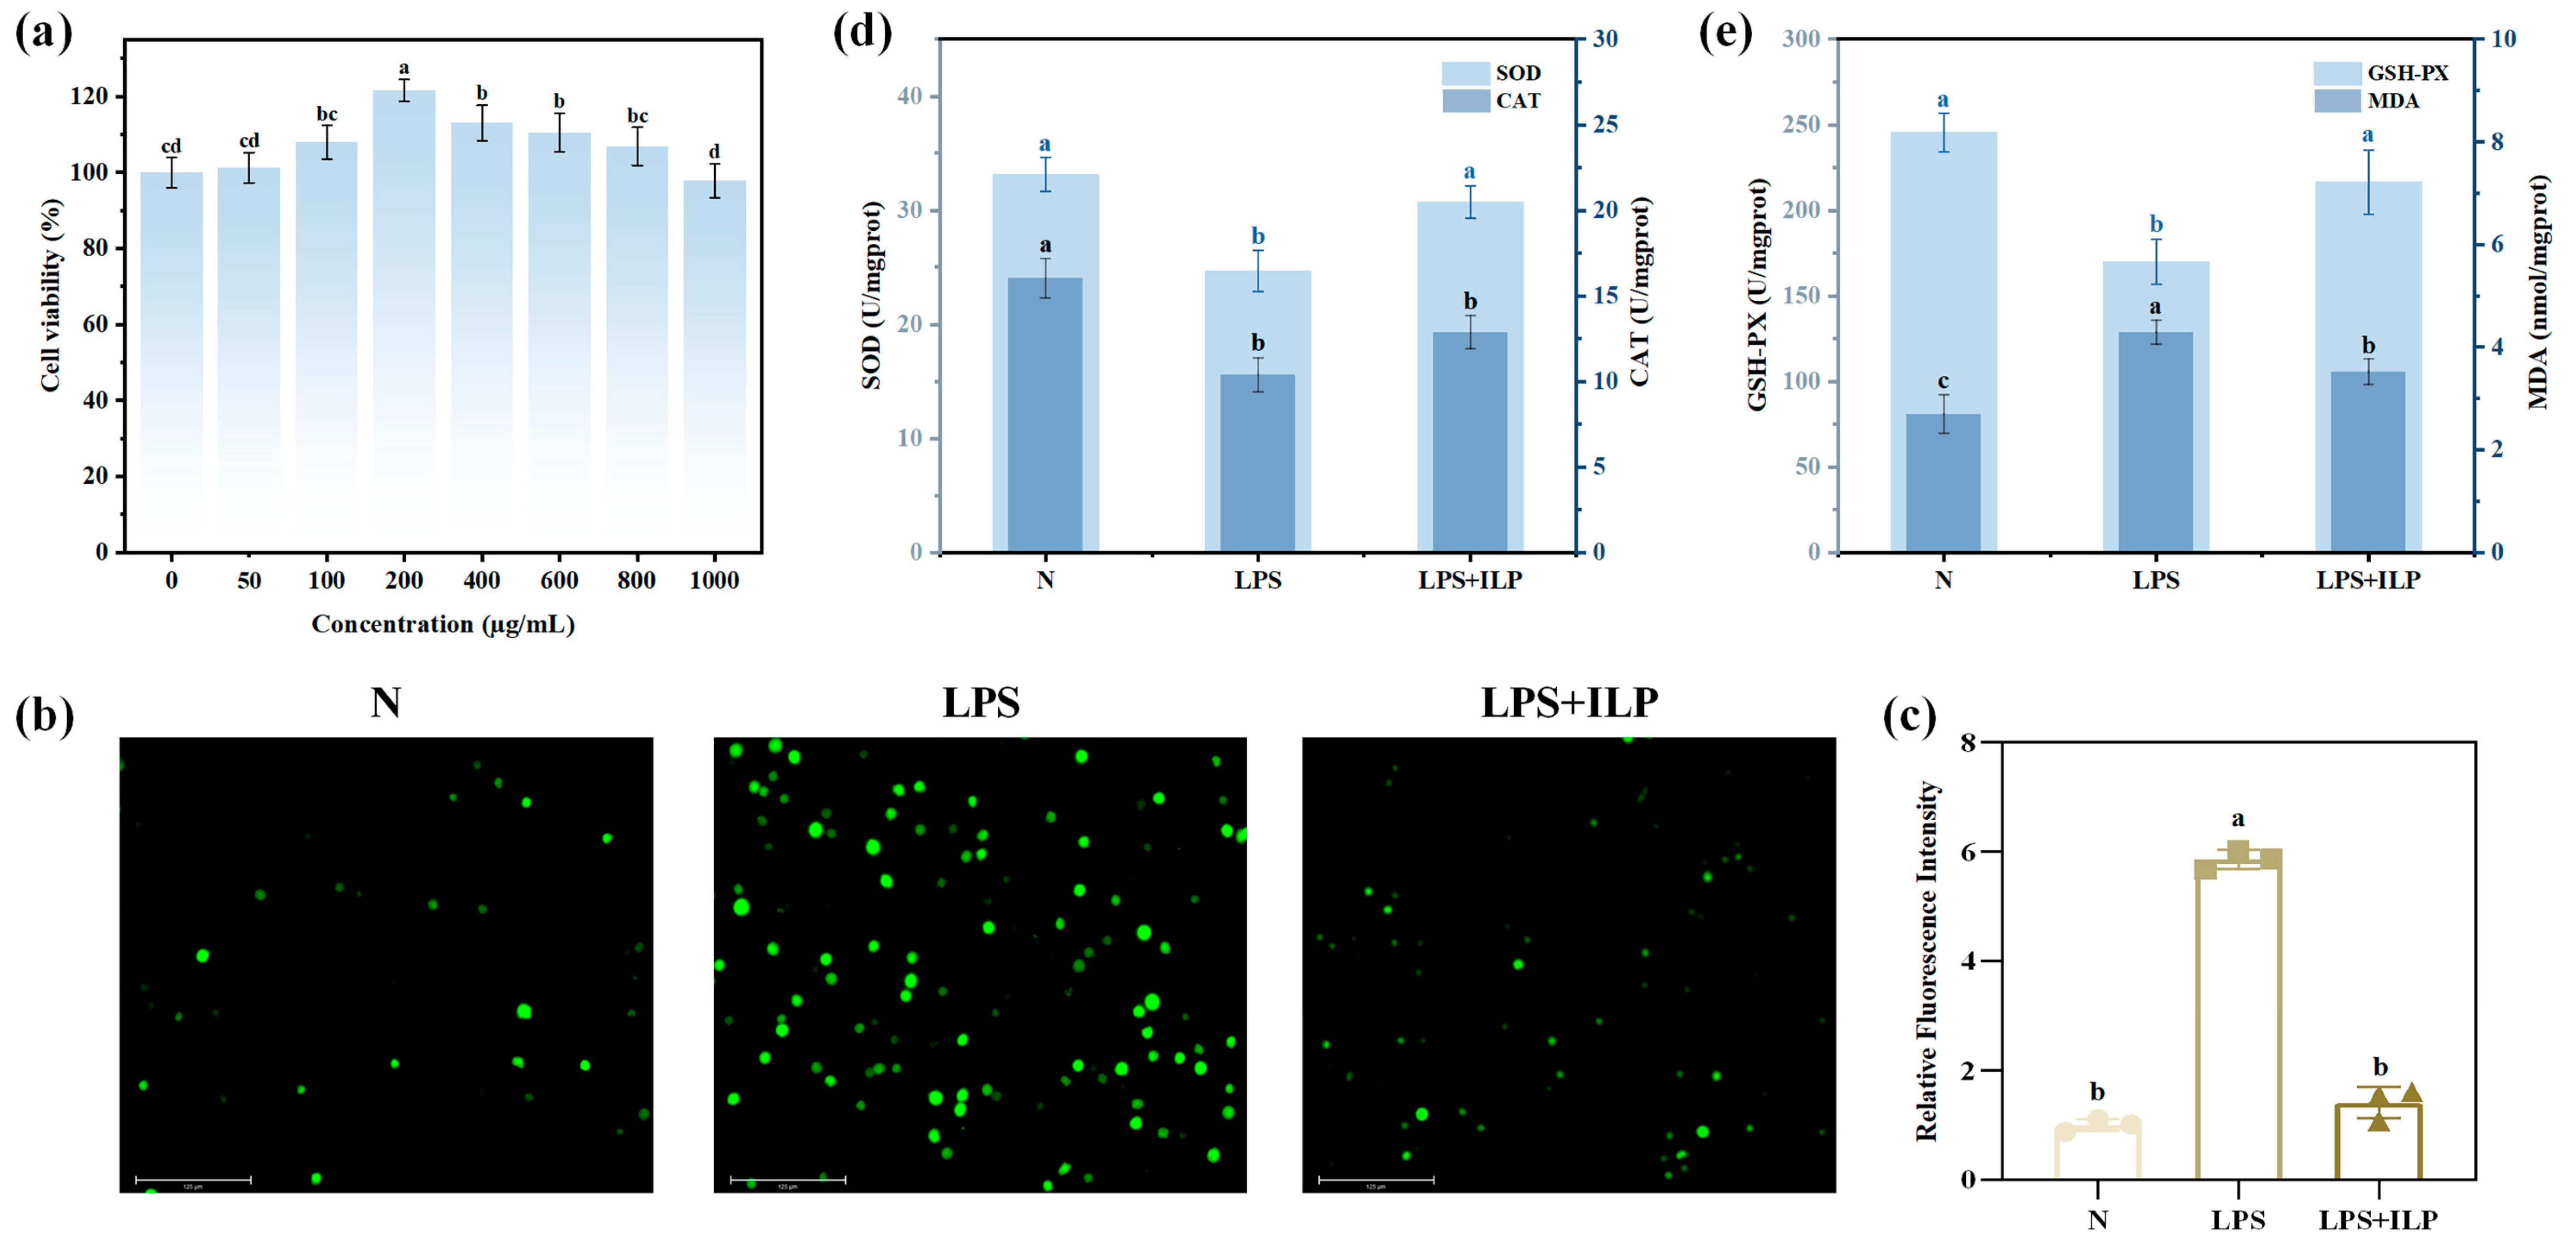
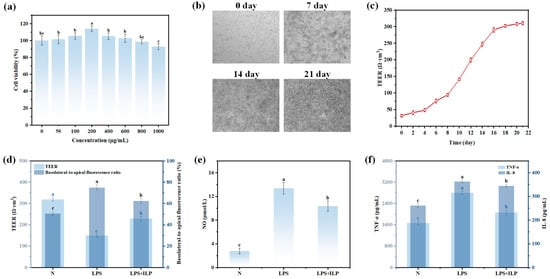
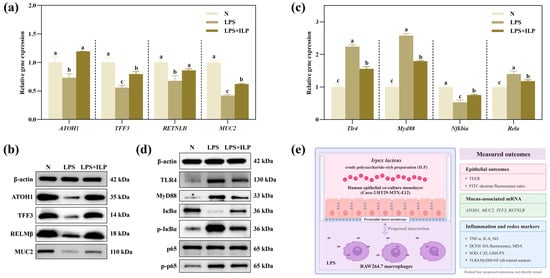

Disclaimer/Publisher’s Note: The statements, opinions and data contained in all publications are solely those of the individual author(s) and contributor(s) and not of MDPI and/or the editor(s). MDPI and/or the editor(s) disclaim responsibility for any injury to people or property resulting from any ideas, methods, instructions or products referred to in the content. |
© 2026 by the authors. Licensee MDPI, Basel, Switzerland. This article is an open access article distributed under the terms and conditions of the Creative Commons Attribution (CC BY) license.