


Abstract
Hydroxysafflor yellow A (HSYA), a bioactive constituent of Carthamus tinctorius L., has antioxidant and cytoprotective properties. Whether Keap1 is a candidate interaction partner of HSYA in RSL3-challenged hippocampal-derived cells remains unresolved. We examined mouse HT22 cells exposed to RSL3 using viability, mitochondrial, iron, oxidative stress, lipid peroxidation, and protein assays. HSYA pretreatment followed by continued co-incubation with RSL3 preserved viability and mitochondrial ultrastructure and attenuated labile Fe2+ accumulation, reactive oxygen species, and lipid peroxidation. These changes were accompanied by increased SLC7A11 and GPX4 abundance, reduced ACSL4, and attenuation of the RSL3-induced increase in HO-1. HSYA treatment was also associated with increased nuclear Nrf2 and the GAPDH-normalized p-GSK-3β (Ser9) signal. Docking, DARTS, lysate-based CETSA, and low-amplitude SPR responses provided complementary, exploratory evidence consistent with an HSYA–Keap1 interaction. These findings support the protective effects of HSYA against ferroptosis-associated injury and identify Keap1 as a candidate interaction partner. Integrating cellular protection with exploratory interaction evidence advances the pharmacological characterization of HSYA and provides a testable molecular hypothesis for further investigating its neuroprotective potential.
1. Introduction
Oxidative stress, iron dyshomeostasis, and lipid peroxidation contribute to neuronal injury in neurodegenerative disorders, including Alzheimer’s disease (AD) [1,2]. These processes are closely related to ferroptosis, an iron-dependent form of regulated cell death characterized by excessive phospholipid peroxidation [3,4]. Experimental disruption of neuronal antioxidant defenses, including glutathione peroxidase 4 (GPX4), can produce lipid oxidative damage and neurodegeneration [5]. These observations provide a rationale for investigating compounds that protect against ferroptosis-associated cellular injury.
Nuclear factor erythroid 2-related factor 2 (Nrf2) regulates antioxidant responses and processes involved in glutathione metabolism and iron homeostasis [6,7,8]. Its stability is controlled by several regulatory mechanisms. Under basal conditions, Kelch-like ECH-associated protein 1 (Keap1) acts as a substrate adaptor for a CUL3-containing ubiquitin ligase complex that promotes Nrf2 degradation. Separately, glycogen synthase kinase 3β (GSK-3β) can facilitate β-TrCP-dependent Nrf2 degradation through a Keap1-independent mechanism [9,10]. These mechanisms represent distinct routes of Nrf2 regulation and should not be interpreted as a single linear Keap1–GSK-3β–Nrf2 pathway.
Hydroxysafflor yellow A (HSYA), a characteristic constituent of Carthamus tinctorius L. (safflower), has shown protective effects in cerebral ischemia/reperfusion models [11,12]. Prior work also reported attenuation of ferroptosis-related injury in oxygen–glucose-deprived PC12 cells and ischemic stroke models [13,14]. These reports provide prior evidence of HSYA-associated protection in ferroptosis-related models. What remains unclear is whether the protection observed after a defined RSL3 challenge in hippocampal-derived HT22 cells is accompanied by complementary evidence that Keap1 may interact with HSYA and how the observed Keap1, GSK-3β, and Nrf2 changes should be interpreted without assuming a single causal pathway.
We therefore examined HSYA-associated protection in RSL3-treated mouse HT22 cells using viability, mitochondrial ultrastructure, labile Fe2+, oxidative stress, lipid peroxidation, and protein readouts. We assessed Keap1 abundance, the GAPDH-normalized p-GSK-3β (Ser9) signal, and nuclear Nrf2 accumulation as separate observations. To investigate Keap1 as a candidate interaction partner, we combined molecular docking with drug affinity responsive target stability (DARTS), lysate-based cellular thermal shift assays (CETSA), and surface plasmon resonance (SPR). The study emphasizes this complementary analysis of a candidate interaction alongside the ferroptosis-associated injury phenotype.
2. Materials and Methods
2.1. Reagents and Antibodies
Hydroxysafflor Yellow A (HSYA) (Cat. No.: HY-N0567) and Recombinant Mouse Keap1 protein (Cat. No.: HY-P702829) were purchased from MedChemExpress (Monmouth Junction, NJ, USA). RSL3 (Cat. No.: R873890) was purchased from Macklin (Shanghai, China). 3-(4,5-dimethylthiazol-2-yl)-2,5-diphenyltetrazolium bromide (MTT) (Cat. No.: IM0280) and Pronase E were obtained from Solarbio (Beijing, China). Dimethyl sulfoxide (DMSO) (Cat. No.: D5879) was purchased from Sigma-Aldrich (St. Louis, MO, USA). ROS assay kit (DCFH-DA, Cat. No.: S0033S), lipid peroxidation sensor C11-BODIPY 581/591 (Cat. No.: S0043S), and assay kits for Malondialdehyde (MDA), Glutathione (GSH), and Superoxide Dismutase (SOD) were purchased from Beyotime (Shanghai, China). FerrOrange (Cat. No.: F374) was purchased from Dojindo (Kumamoto, Japan). Primary antibodies against FTH1 (83428-1-RR), HO-1 (10701-1-AP), GPX4 (30388-1-AP), SLC7A11 (32384-1-AP), ACSL4 (22401-1-AP), Nrf2 (16396-1-AP), GSK-3β (22066-1-AP), p-GSK-3β (Ser9) (67558-1-Ig), Keap1 (80744-1-RR), GAPDH (10494-1-AP), and Histone H3 (17168-1-AP) were purchased from Proteintech (Wuhan, China). CoraLite®488-conjugated goat anti-rabbit IgG (Cat. No.: SA00013-2) and CoraLite®594-conjugated goat anti-rabbit IgG (Cat. No.: SA00013-4) were also obtained from Proteintech (Wuhan, China). HRP-conjugated goat anti-rabbit (Cat. No.: A0208) and goat anti-mouse (Cat. No.: A0216) secondary antibodies were purchased from Beyotime (Shanghai, China).
2.2. Network Pharmacology and Bioinformatics Analysis
The 2D chemical structure and canonical SMILES string of HSYA are available from PubChem (CID: 6443665) [15]. Potential HSYA targets were collected from SwissTargetPrediction (http://www.swisstargetprediction.ch/, accessed on 12 August 2025) [16] and TCMSP (https://old.tcmsp-e.com/tcmsp.php, accessed on 12 August 2025) [17]. Alzheimer’s disease (AD)-associated targets were acquired from GeneCards (https://www.genecards.org/, accessed on 12 August 2025) [18] using “Alzheimer’s disease”; ferroptosis-related genes were obtained from FerrDb (http://www.zhounan.org/ferrdb/, accessed on 12 August 2025) [19] and GeneCards using “ferroptosis”. Database searches and pathway annotations were retrieved on 12 August 2025. Human target annotations were used where applicable because the target-prediction and disease databases were curated primarily around human gene identifiers. The human-derived predictions provided context for the protein-expression and Keap1 interaction assays in mouse-derived HT22 cells; they were not treated as evidence that every predicted target had been experimentally validated.
To ensure data reliability, a probability score > 0 was used as the screening threshold for SwissTargetPrediction, whereas GeneCards targets with relevance scores greater than the median were retained. All retrieved targets were standardized to official gene symbols using the UniProtKB database (https://www.uniprot.org/, accessed on 12 August 2025), and duplicate genes from different databases were manually removed to obtain unique gene lists. The intersecting targets among HSYA, AD, and ferroptosis were identified using a Venn diagram. These common targets were then uploaded to the STRING database (version 12.0, https://string-db.org/, accessed on 12 August 2025) [20] to construct a protein–protein interaction network. The species was set to Homo sapiens, and the minimum required interaction score was set to medium confidence (>0.400). Disconnected nodes were hidden in the network.
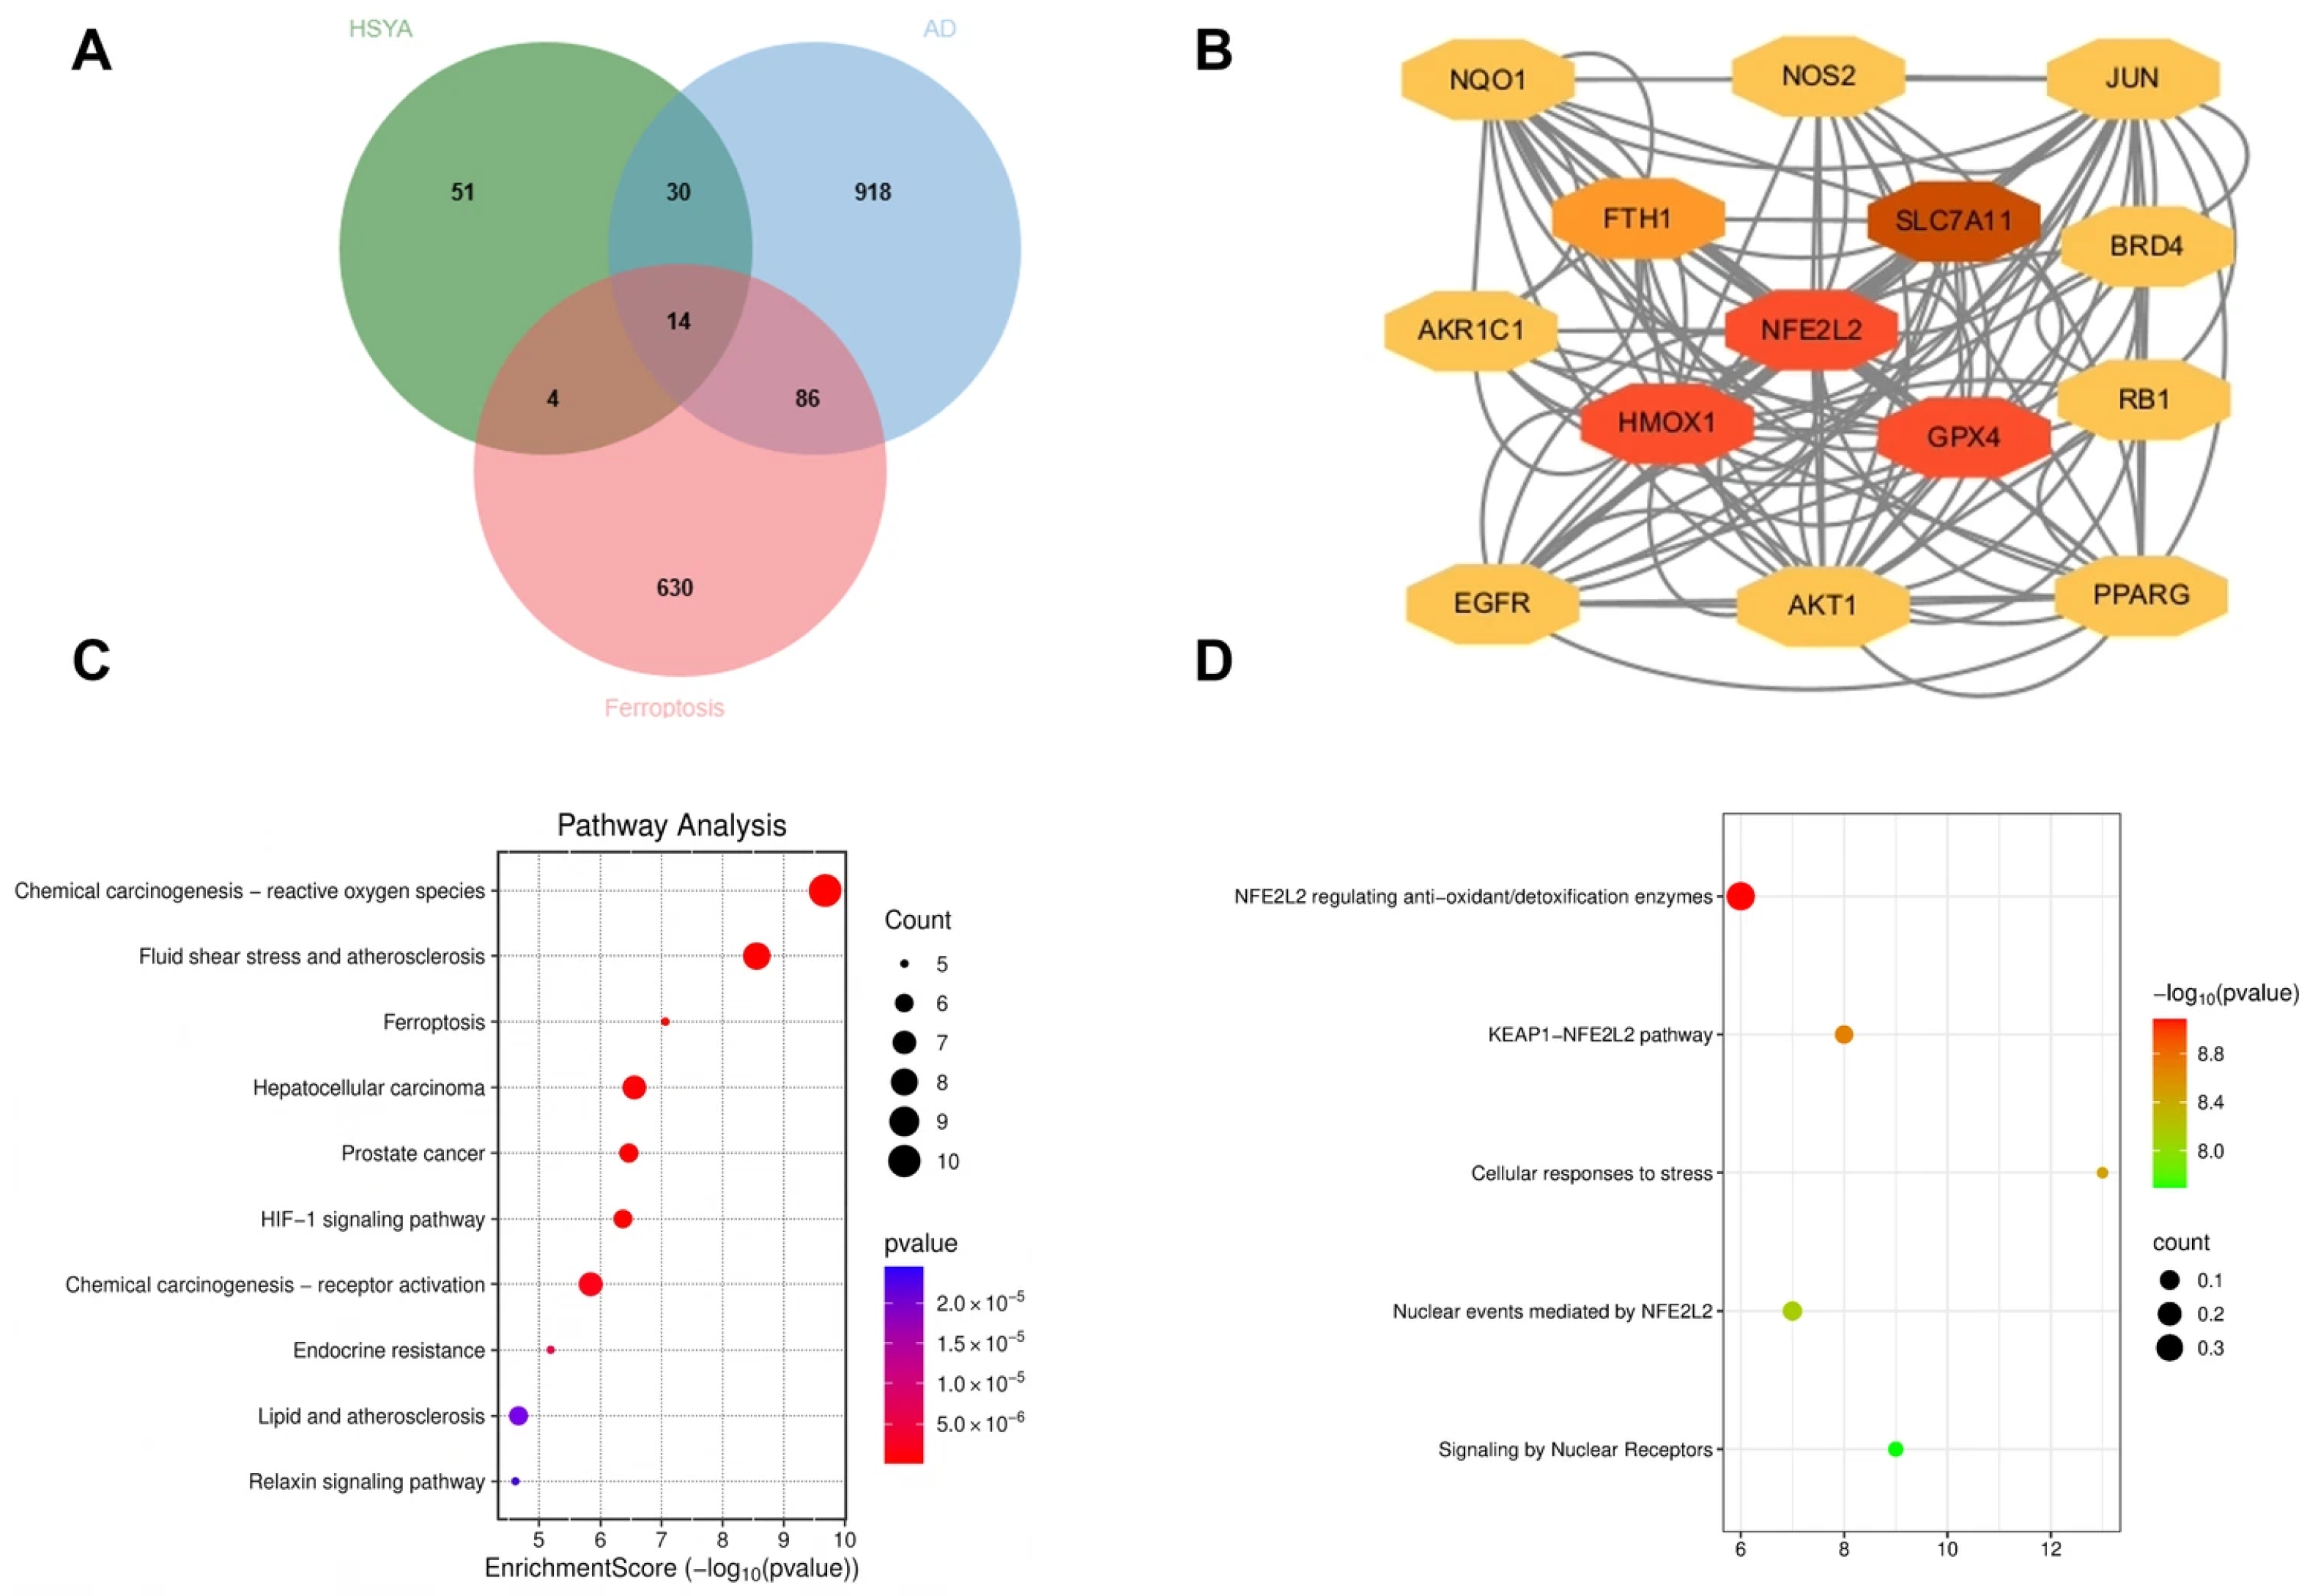
GO and KEGG enrichment analyses used clusterProfiler [21], and Reactome enrichment used ReactomePA in R (version 4.3.0). Human pathway annotations were retrieved on August 12, 2025. The WeiShengXin (SRplot) GO/Pathway enrichment bubble-plot module (https://www.bioinformatics.com.cn/, accessed on 12 August 2025) was used only for visualization, with default plotting settings. The Figure 1D terms included the KEAP1–NFE2L2 pathway and NFE2L2-mediated antioxidant and detoxification processes. Enrichment was assessed by the hypergeometric test. Figure 1C displays −log10(raw p) on the horizontal axis and raw p in the color scale; Figure 1D uses −log10(raw p) in its color scale. The Benjamini–Hochberg procedure was applied across tested terms, and only pathways with FDR-adjusted p < 0.05 were designated statistically significant. The pathway terms shown in Figure 1C,D, including IDs, counts, raw p values, Benjamini–Hochberg-adjusted p values, and hit genes, are listed in Supplementary Table S1. The original target-prediction query, enrichment background gene universe, and records of package versions and analysis settings were not available in the retained records for independent verification; the computational results are therefore interpreted as hypothesis-generating.
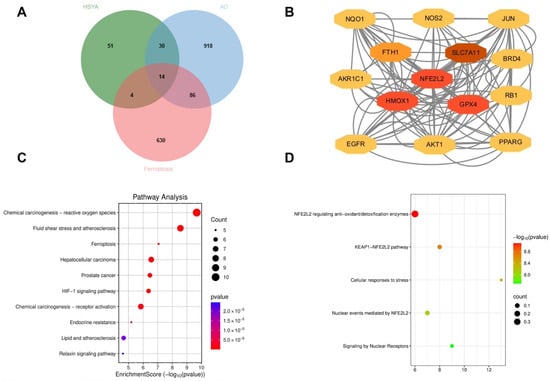
Figure 1.
Network pharmacology analysis: (A) Fourteen overlapping targets. (B) Protein–protein interaction network of the 14 intersecting genes; node colors do not denote experimentally measured expression changes. (C) KEGG enrichment: x-axis, −log10(raw p); colors, raw p. (D) Reactome pathway enrichment: x-axis, gene count; colors, −log10(raw p). Displayed p values are unadjusted; significance was defined by Benjamini–Hochberg FDR-adjusted p < 0.05.
2.3. Cell Culture and Treatment
Mouse hippocampal-derived HT22 cells (Cat. No. iCell-m020) were obtained from iCell (Shanghai, China) and cultured in Dulbecco’s modified Eagle medium with 10% fetal bovine serum and 1% penicillin–streptomycin at 37 °C and 5% CO2. RSL3 was applied at 0.5 μM for 24 h, a concentration and duration within the range reported in a published HT22 dose–response study [22]. The corresponding response in the present study is shown in Figure 2D. HSYA concentrations of 10 and 30 μM fall within the range studied in neuronal preparations [23,24]; the present study also tested HSYA alone at 1–50 μM (Figure 2B) and screened 1, 5, 10, and 30 μM HSYA during the RSL3 challenge (Figure 2D). Protection was observed at 10 and 30 μM, and 30 μM was used for subsequent protein and signaling experiments. For protection experiments, cells received HSYA for 2 h before RSL3 was added without removing HSYA, followed by a further 24 h of co-incubation. This pretreatment design tested whether HSYA exposure before and during the oxidative challenge attenuated injury; it did not test reversal of injury after RSL3 exposure. RSL3 and HSYA powders were dissolved in DMSO to prepare 10 mM stock solutions, aliquoted, and stored at −20 °C. Stocks were diluted in complete culture medium. The final DMSO concentration was matched at 0.5% (v/v) in all treatment and control groups.
Figure 2.
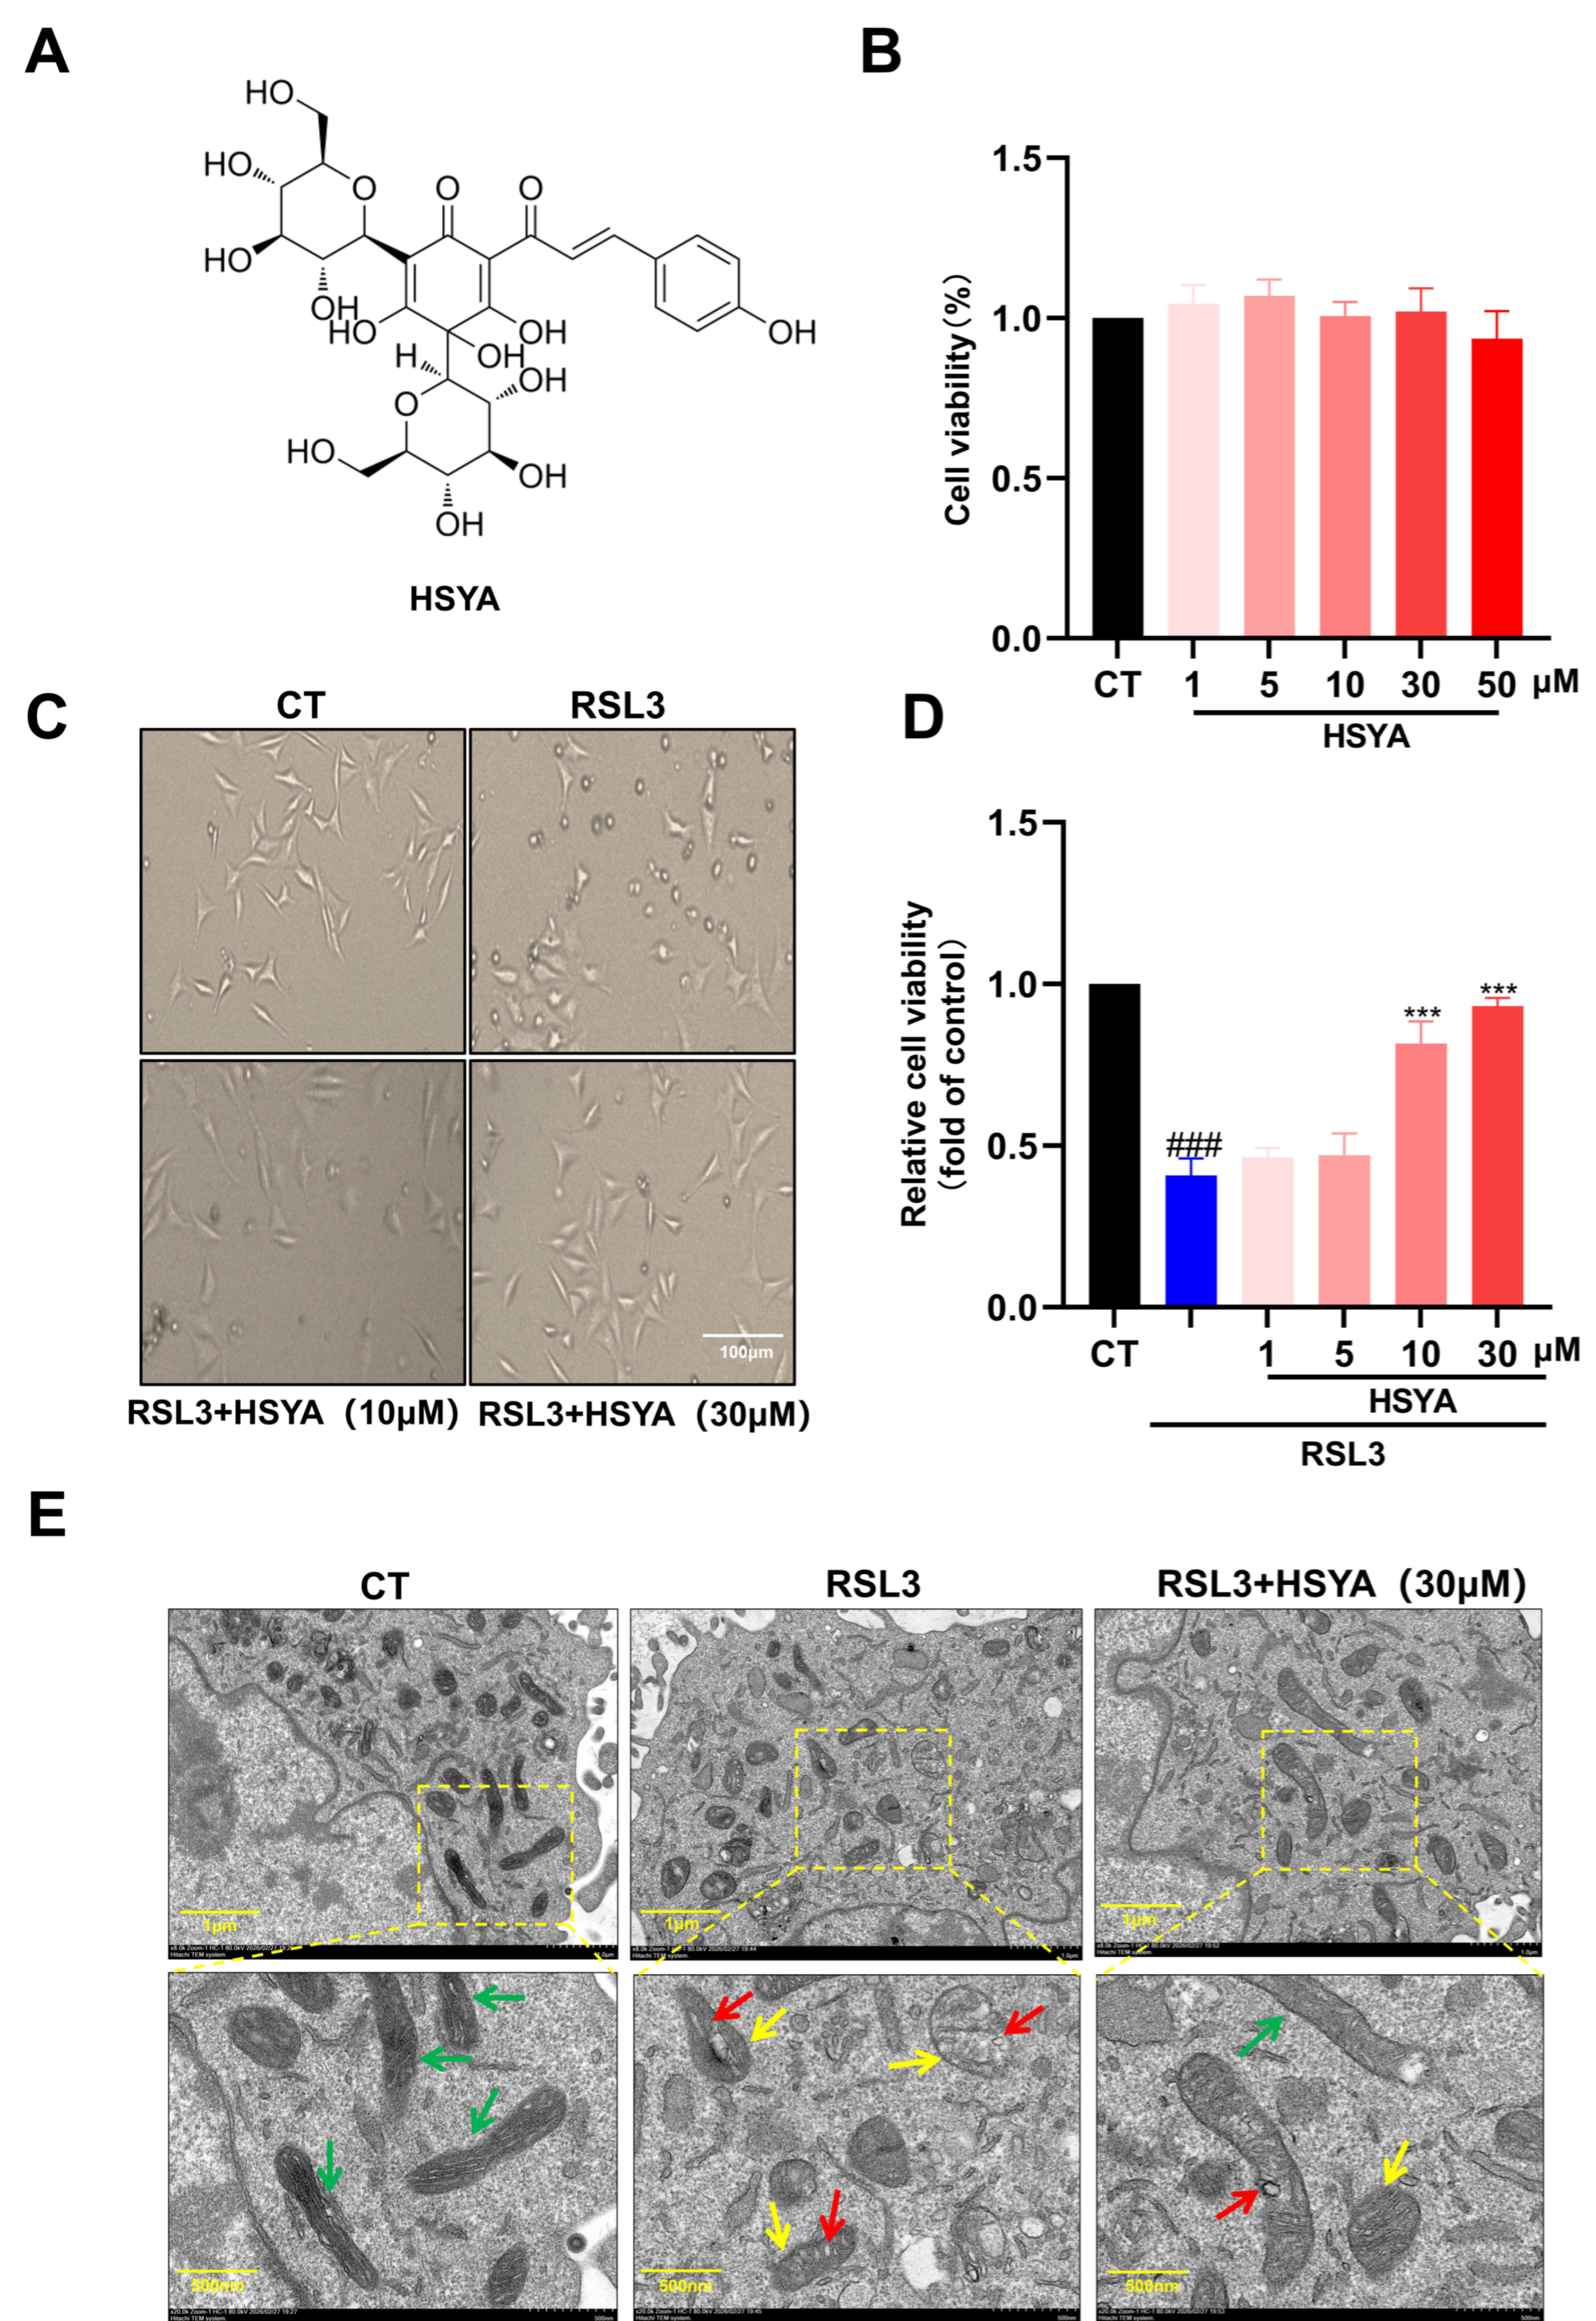
HSYA preserved viability and mitochondrial ultrastructure in RSL3-treated HT22 cells. (A) HSYA structure. (B) MTT viability after 24 h treatment with HSYA alone. (C) Representative phase-contrast morphology; scale bar, 100 μm. (D) MTT viability after RSL3 with or without HSYA. (E) Representative mitochondrial TEM images; colored arrows indicate preserved or altered cristae. For quantitative MTT panels (B,D), n = 3 independent biological experiments per group; technical wells were averaged within each experiment. Data are presented as mean ± SEM; one-way ANOVA with Tukey’s test. *** p < 0.001 versus RSL3; ### p < 0.001 versus control. TEM images represent n = 3 independent cultures, with three fields examined per culture (nine images across three independent cultures per group); sections and fields were not counted as independent.
2.4. Cell Viability and Morphological Observation
Cell viability was assessed using the MTT assay. HT22 cells were seeded into 96-well plates at a density of 3000 cells per well in 200 μL of culture medium and subjected to the indicated treatments. MTT solution was then added at 10 μL per well to achieve a final concentration of 0.5 mg/mL, followed by incubation for 4 h at 37 °C. The supernatant was removed, and 150 μL of DMSO was added to each well to dissolve the formazan crystals. Absorbance was measured at 570 nm using a Absorbance was measured at 570 nm using a Varioskan® Flash (Thermo Scientific, Waltham, MA, USA) microplate reader. Cell morphology was examined and photographed using a Cell morphology was examined and photographed using a phase-contrast microscope (Olympus, Tokyo, Japan).
2.5. Transmission Electron Microscopy (TEM)
HT22 cells were collected and fixed with 2.5% glutaraldehyde at 4 °C overnight, followed by post-fixation in 1% osmium tetroxide. After dehydration through a graded ethanol series and embedding in epoxy resin, ultrathin sections were cut and stained with uranyl acetate and lead citrate. TEM imaging was performed by Servicebio (Wuhan, China) using an HT7800 transmission electron microscope (Hitachi, Tokyo, Japan).. At least three ultrathin sections were prepared from each independent sample. To reduce localized sampling bias, each section was first surveyed at low magnification (approximately ×1200), with 10–15 grid regions containing intact cells scanned in a spatially distributed random manner. After assessing the overall cellular condition, organelle ultrastructure was imaged at medium to high magnification (approximately ×10,000–×30,000). Three fields were recorded per independent sample, yielding nine images across the three independent samples per group (n = 3). Sections, grid regions, and images were not counted as independent biological replicates. Mitochondrial membrane and cristae morphology were evaluated qualitatively; the displayed panels are representative images rather than a quantitative TEM endpoint.
2.6. Intracellular ROS, Fe2+, and Lipid Peroxidation Assays
Following treatment, HT22 cells were incubated with DCFH-DA (10 μM), FerroOrange (1 μM), or C11-BODIPY 581/591 (2 μM) [25,26] for 30 min at 37 °C in the dark to assess intracellular reactive oxygen species (ROS), labile Fe2+, and lipid peroxidation, respectively. Cells were subsequently washed with PBS, and fluorescence images were acquired using a Nikon confocal laser scanning microscope (Nikon, Tokyo, Japan) with a 20×/0.45 NA objective. Acquisition settings were kept identical across groups for each assay. Three randomly selected fields were acquired from each independent sample for ROS, Fe2+, and C11-BODIPY imaging, yielding nine images across three samples per group (n = 3). For each independent sample, at least 30 morphologically intact cells were assessed for Fe2+ and at least 15 for ROS across the sampled fields. Three cell-free 50 × 50-pixel squares were randomly selected within the same field to estimate the mean background fluorescence. Background-corrected cellular mean fluorescence intensity was calculated in ImageJ 1.53t as the cellular ROI integrated density divided by its area, minus the mean background intensity. Cell measurements were averaged within the field, and the three field means were averaged to yield one value per independent experiment. At least three cells per independent experiment were examined for C11-BODIPY imaging. C11-BODIPY images are presented qualitatively as representative oxidized (green) and non-oxidized (red) signals; no experiment-level green/red ratio or statistical analysis of that ratio is reported.
2.7. Biochemical Measurement of MDA, GSH/GSSG Ratio, and SOD
Treated cells were lysed and centrifuged to collect the supernatant. MDA levels and SOD activity were determined using the corresponding commercial assay kits according to the manufacturers’ instructions. Total glutathione and GSSG were measured using the GSH and GSSG Assay Kit (S0053, Beyotime Biotechnology, Shanghai, China), following the manufacturer’s protocol. Cell samples were prepared using the supplied Protein Removing Reagent M. Separate standard curves were prepared for total glutathione and GSSG using freshly diluted GSSG standards (0.5, 1, 2, 5, 10, and 15 μM). For GSSG measurement, 100 μL of each sample was mixed with 20 μL of diluted GSH-scavenging auxiliary solution and 4 μL of GSH-scavenging working solution, vortexed after each addition, and incubated at 25 °C for 60 min to remove endogenous GSH. GSSG standards underwent the same pretreatment. Absorbance was measured at 412 nm using a Varioskan Flash microplate reader (Thermo Scientific). For total glutathione measurements, the concentration obtained from the GSSG standard curve was multiplied by two to express total glutathione in GSH equivalents. GSH was calculated as total glutathione − 2 × GSSG, and the GSH/GSSG ratio was calculated by dividing GSH by GSSG. Sample dilution factors were accounted for, and glutathione concentrations were normalized to total protein measured by the BCA assay.
2.8. Immunofluorescence Staining
HT22 cells cultured on coverslips were fixed with 4% paraformaldehyde, permeabilized with 0.1% Triton X-100, and blocked with 5% BSA. Cells were then incubated overnight at 4 °C with primary antibodies against GPX4, ACSL4, or Nrf2 at the manufacturers’ recommended dilutions. Subsequently, the cells were incubated with fluorophore-conjugated secondary antibodies (CoraLite®488 or CoraLite®594), diluted as recommended by the manufacturers, at room temperature for 1 h in the dark. Nuclei were counterstained with DAPI. Images were acquired using a Nikon confocal microscope with a 20×/0.45 NA objective; acquisition settings were kept identical across groups for each staining assay. Two randomly selected fluorescence fields were acquired per independent culture. At least 15 morphologically intact cells were assessed per independent experiment. Mean fluorescence intensity was corrected for background using three randomly selected cell-free 50 × 50-pixel squares within the same field, as described for ROS and Fe2+ imaging. Cell-level measurements were averaged within the field. Quantified field-level values were averaged within each independent culture, and the resulting experiment-level means were used for statistical analysis.
2.9. Western Blot Analysis
Total protein from HT22 cells was extracted using RIPA lysis buffer containing protease and phosphatase inhibitors. Nuclei were isolated using a Nuclear Extraction Kit (SN0020, Solarbio, Beijing, China) according to the manufacturer’s instructions and then lysed using the same RIPA buffer used for whole-cell protein extraction to obtain nuclear proteins for immunoblotting. Nrf2 in Figure 5B was measured in whole-cell lysates (Total Nrf2). The first and third rows in Figure 5C represent nuclear and cytoplasmic Nrf2, respectively. Three independent biological samples were each fractionated into paired cytoplasmic and nuclear samples, yielding six fraction samples; these remained three independent biological replicates (n = 3). Each lane was loaded with 10 μL of protein lysate at 2 μg/μL (20 μg protein). Proteins were separated by SDS-PAGE and transferred onto PVDF membranes. The membranes were blocked and incubated with primary antibodies (FTH1, HO-1, ACSL4, SLC7A11, GPX4, Nrf2, p-GSK-3β, GSK-3β, Keap1, GAPDH, and Histone H3) at the manufacturers’ recommended dilutions overnight at 4 °C. After incubation with HRP-conjugated secondary antibodies at the manufacturers’ recommended dilutions, the protein bands were visualized using an ECL detection system and quantified via ImageJ software. FTH1 densitometry comprised four independent experiments, each containing CT, RSL3, and HSYA samples. Each of the two six-lane blot runs contained two independent experiments in the CT, RSL3, HSYA, CT, RSL3, and HSYA order (n = 4 per group). Whole-cell Total Nrf2 densitometry used four independent biological samples per group across two experimental runs (n = 4). Background-subtracted ImageJ densities were divided by the supplied same-lane GAPDH values and scaled to the mean of the two CT ratios within each run; individual CT variation was retained. p-GSK-3β (Ser9) and total GSK-3β were each normalized to the corresponding same-lane GAPDH signal; a p-GSK-3β/total GSK-3β ratio was not calculated.
2.10. Molecular Docking
The structure deposited as PDB 2Z32, a mouse Keap1 Kelch-domain complex with a prothymosin-α peptide, was retrieved from the RCSB Protein Data Bank. The prepared receptor retained chain A residues 324–613 and contained no peptide chain B, crystallographic waters, or other HETATM records. Water molecules and non-receptor heteroatoms were removed using PyMOL 2.5.0. For atoms with alternate locations, conformation A was retained. Missing atoms and residues were not modeled, and the receptor was not energy-minimized. In AutoDockTools (version 1.5.7), only polar hydrogens were added, nonpolar hydrogens were merged, and Kollman charges were assigned before exporting the receptor as a PDBQT file. Default residue protonation states were used without specifying a pH or performing external pKa calculations. The HSYA ligand was downloaded directly from PubChem (CID: 6443665) as a 3D SDF file. The supplied stereochemistry, bond orders, and three-dimensional conformers were retained without manual changes to protonation or additional force-field energy minimization. AutoDockTools assigned Gasteiger charges to the ligand and exported the ligand PDBQT file. Docking used AutoDock Vina 1.2.7 with the Vina scoring function, a rigid receptor, and a flexible ligand with 18 active torsions. The search box was centered at (−7.138, −38.952, −0.126) Å, with dimensions 40 × 32 × 38.4 Å; grid spacing was 0.375 Å, exhaustiveness was 8, and the recorded random seed was 54372198. Nine poses were returned, and the best-scoring pose (−9.828 kcal/mol) was visualized using PyMOL 2.5.0. Docking scores were interpreted as computational predictions rather than measured binding affinities.
2.11. Drug Affinity Responsive Target Stability Assay
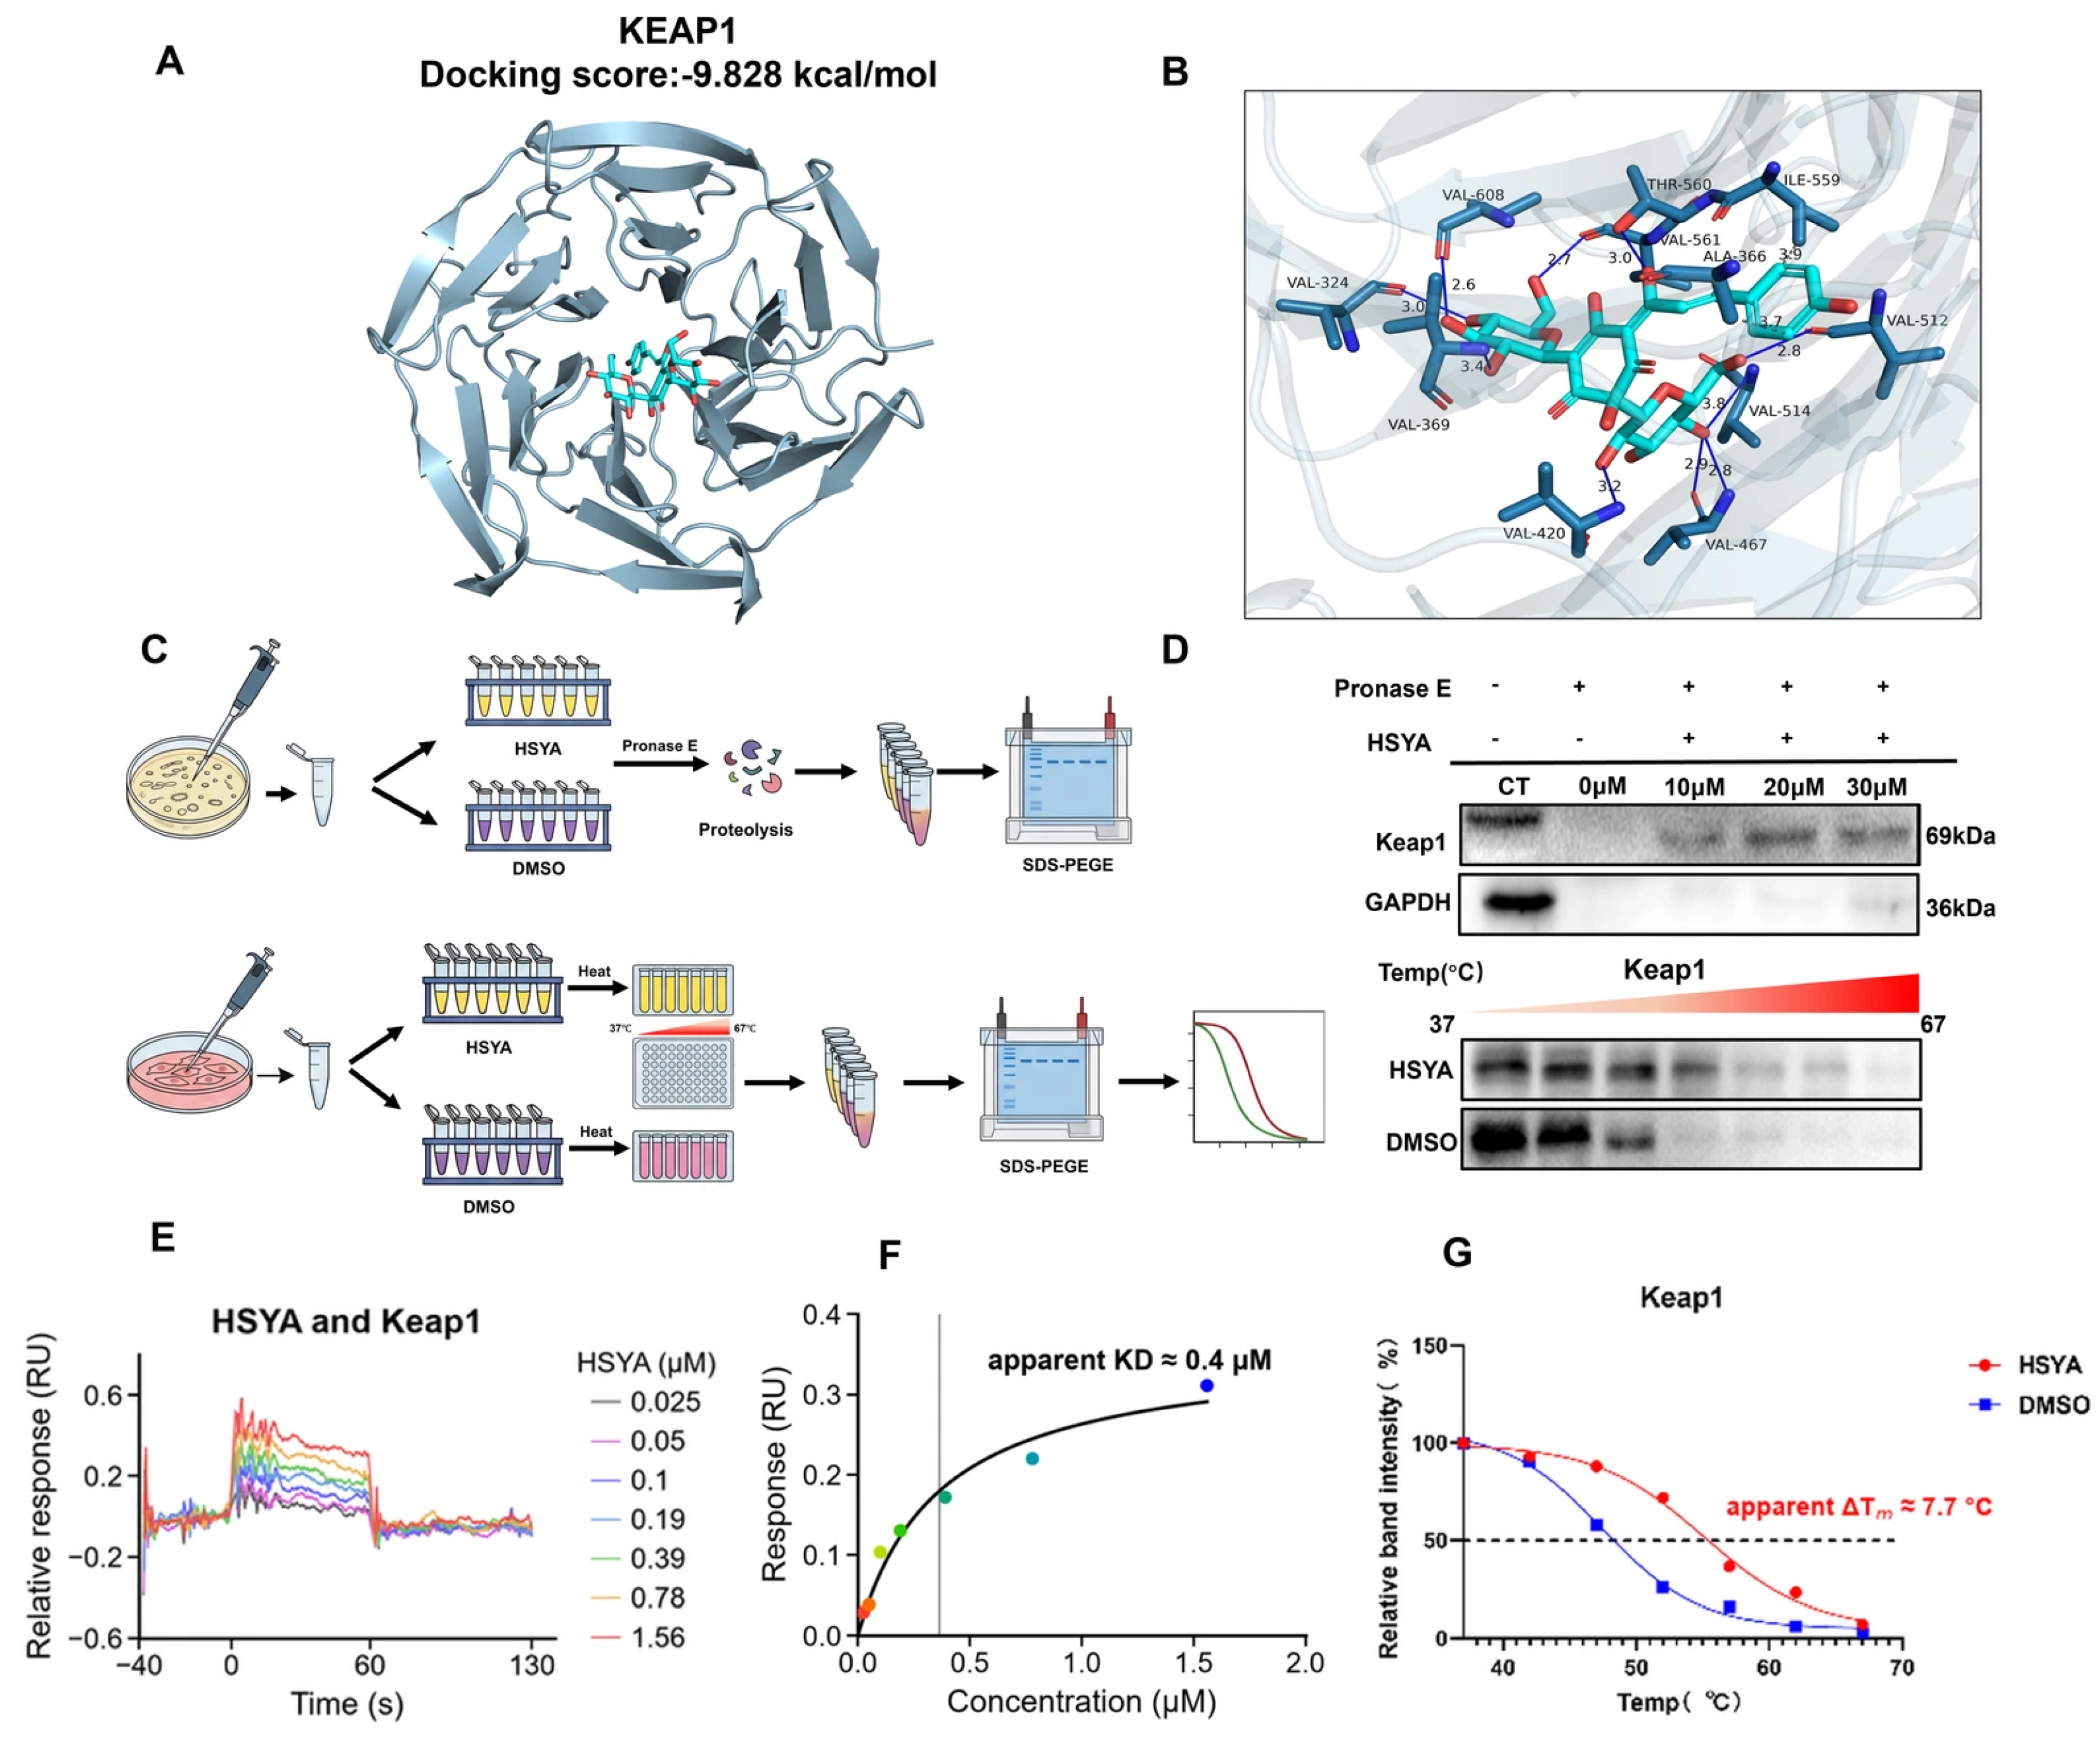
HT22 cell lysates were incubated with HSYA (10, 20, or 30 μM) or DMSO as the vehicle control for 1 h at room temperature. Pronase E was subsequently added at an enzyme-to-total-protein ratio of 1:1500 (w/w), and digestion was performed for 20 min at room temperature. Proteolysis was stopped by adding SDS loading buffer and boiling the samples. The abundance of Keap1 remaining after digestion was assessed by Western blotting. DARTS was performed in two independent experiments using separately prepared HT22 cell lysates, with technical repeats within each experiment.
2.12. Lysate-Based Cellular Thermal Shift Assay
HT22 cell lysates were incubated with HSYA (final concentration, 30 μM) or DMSO as the vehicle control for 1 h at room temperature. The lysates were divided into equal aliquots and heated for 5 min at a series of temperatures ranging from 37 °C to 67 °C using a thermal cycler(Bio-Rad, Hercules, CA, USA), followed by cooling at room temperature. After centrifugation to remove precipitated proteins, soluble Keap1 in the supernatant was detected by Western blotting. Thermal melting curves were fitted by nonlinear regression using a sigmoidal dose–response model in GraphPad Prism 11, with temperature as the independent variable. The apparent melting temperature (Tm) was defined as the midpoint of the fitted transition. The apparent thermal shift (ΔTm) was calculated as Tm for the HSYA-treated group minus Tm for the vehicle control group. CETSA was performed in one lysate experiment; temperature aliquots were used for measurement within that experiment.
2.13. Surface Plasmon Resonance
The interaction between HSYA and Keap1 was examined by SPR. Recombinant mouse Keap1 (Cat. No. HY-P702829) was buffer-exchanged into 10 mM sodium acetate buffer (pH 4.0) using Amicon Ultra-0.5 mL centrifugal filters (Millipore, Burlington, MA, USA) and immobilized on a CM5 sensor chip by amine coupling. The immobilization level was 200–300 response units. The running buffer contained 10 mM HEPES, 150 mM NaCl, 3 mM EDTA, 0.005% Tween-20, and 1% (v/v) DMSO at pH 7.4. HSYA was prepared in the running buffer at 0.025, 0.05, 0.1, 0.19, 0.39, 0.78, and 1.56 μM and injected in a multi-cycle format at a flow rate of 30 μL/min, with association and dissociation times of 60 and 120 s, respectively. Responses were processed using double referencing (subtraction of the reference channel and blank buffer injections) alongside DMSO solvent correction. Data were analyzed using Biacore Insight Evaluation software (version 5.0.18.22102). SPR was performed in one independent experiment with three technical repeats. The retained numerical export covers approximately −38 to 130 s and does not include the final 50 s of the protocol’s dissociation phase. For the displayed fit, responses at 52.5, 55, and 57.5 s were averaged within each concentration trace and fitted to a one-site saturation model with zero response at zero concentration. The fitted parameter is reported as an apparent KD and interpreted as exploratory because equilibrium and independent reproducibility were not established.
2.14. Statistical Analysis
For cell-based quantitative assays in Figure 2, Figure 3, Figure 4 and Figure 5, n = 3 denotes independently cultured biological experiments, except FTH1 densitometry in Figure 3D and whole-cell Total Nrf2 densitometry in Figure 5E, each of which used four independent biological samples per group (n = 4); the FTH1 samples represented four independent experiments distributed across two blot runs; and TEM used three independent cultures. Independent experimental counts for DARTS, CETSA, and SPR are given in their respective Methods. Technical wells and fields were averaged within each biological experiment. Quantitative cell-based data are mean ± SEM; group differences were analyzed by one-way ANOVA with Tukey’s test. DARTS, CETSA, and SPR are descriptive; the single CETSA experiment and single SPR run have no between-experiment SEM or inferential statistics.
Figure 3.
HSYA attenuated iron accumulation, oxidative stress, and lipid peroxidation in RSL3-challenged HT22 cells: (A) Representative FerrOrange, DCFH-DA, and C11-BODIPY images. (B) Fe2+ and ROS fluorescence quantification. (C) Representative HO-1 and FTH1 immunoblots with their respective same-membrane GAPDH controls. CT, untreated control; Model, RSL3; HSYA, RSL3 + HSYA. (D) HO-1 and recalculated FTH1 densitometry. (E) MDA, calculated GSH/GSSG ratio, and SOD activity. For (B), HO-1 in (D), and (E), n = 3 independent biological experiments per group; three fluorescence fields per independent culture were averaged for (B). FTH1 in (D): n = 4 independent experiments across two blot runs; FTH1/GAPDH ratios were scaled to the CT mean within each run. Data are mean ± SEM; one-way ANOVA with Tukey’s test. * p < 0.05, ** p < 0.01, *** p < 0.001 versus RSL3; ## p < 0.01, ### p < 0.001 versus CT. For FTH1, HSYA versus RSL3: p = 0.0484 (*); HSYA versus CT: p = 0.1143 (unmarked). Note: The HO-1 immunoblots in Figure 3C and the ACSL4 immunoblots in Figure 4C were derived from the same batch of samples and resolved on the same biological membrane; therefore, they share the same GAPDH loading control.
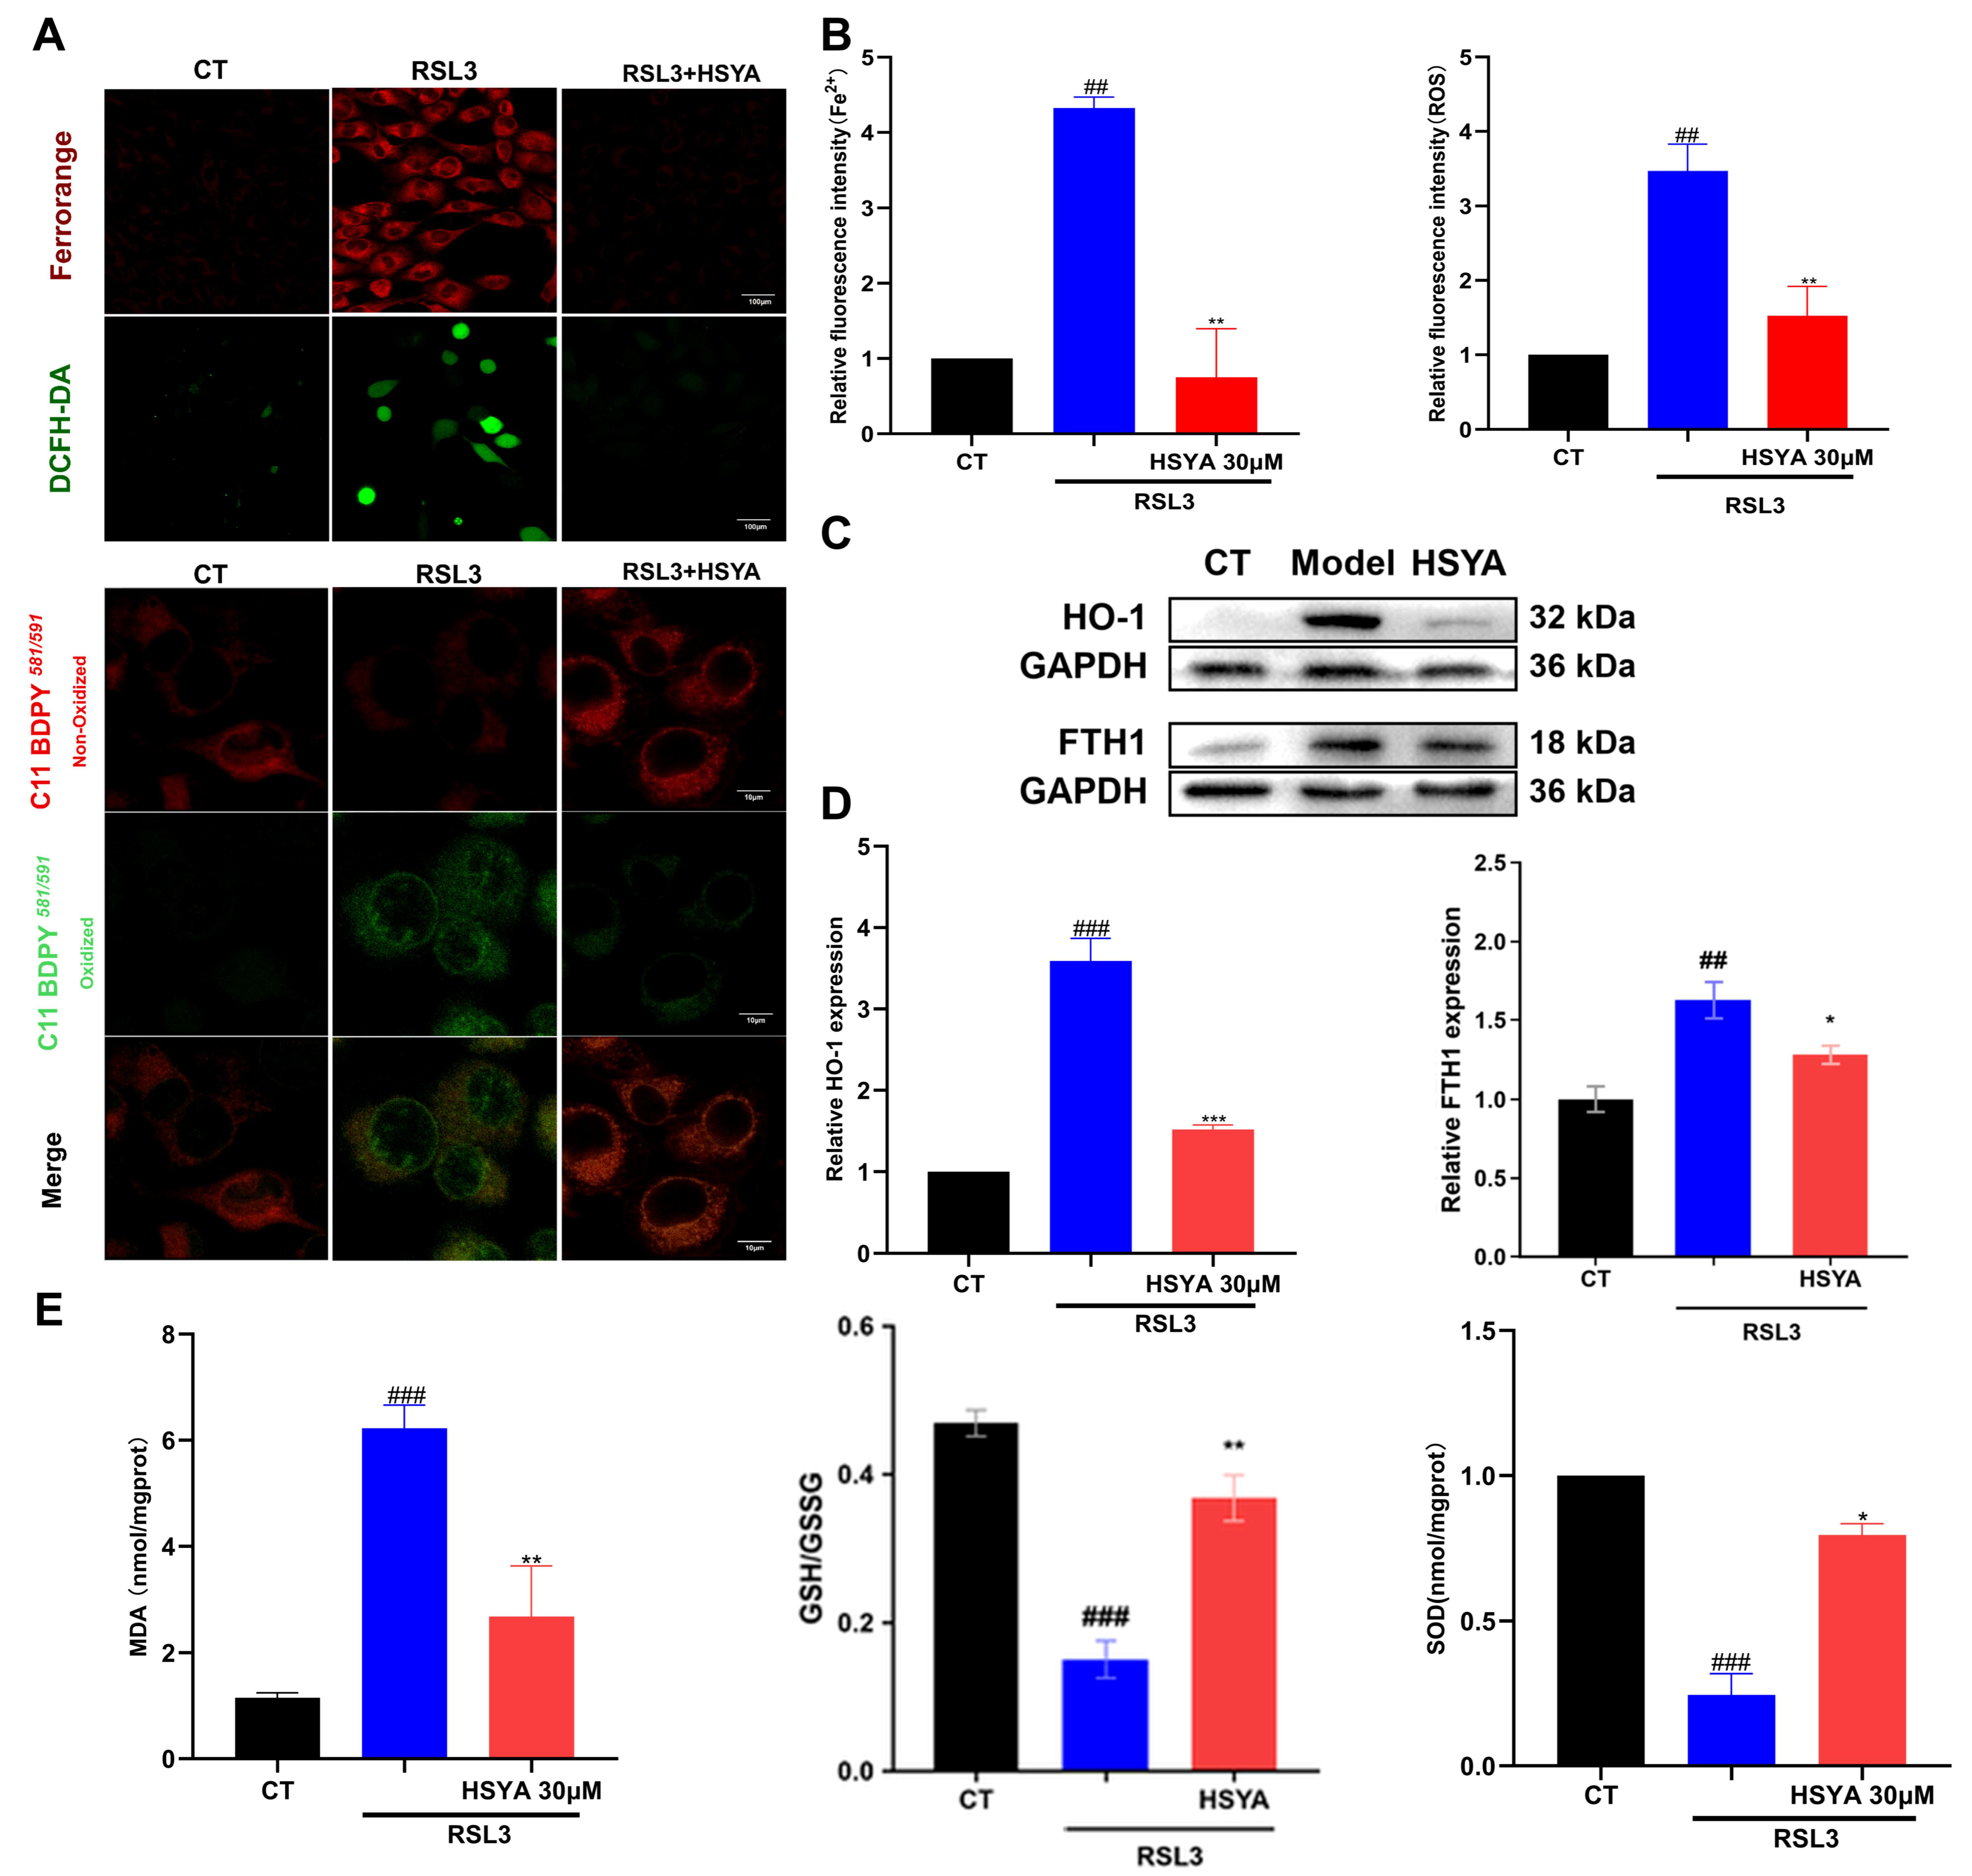
Figure 4.
HSYA increased SLC7A11 and GPX4 and reduced ACSL4 protein signals in RSL3-treated HT22 cells: (A) Representative GPX4 and ACSL4 immunofluorescence, with DAPI-stained nuclei; scale bars, 100 μm. (B) Experiment-level fluorescence quantification. (C) Representative ACSL4, SLC7A11, and GPX4 immunoblots, each with its corresponding same-membrane GAPDH. CT, untreated control; Model, RSL3; HSYA, RSL3 + HSYA. (D) Corresponding densitometry. For quantitative panels (B,D), n = 3 independent biological experiments per group; two fluorescence fields per independent culture were averaged for (B). Data are presented as mean ± SEM; one-way ANOVA with Tukey’s test. ** p < 0.01, *** p < 0.001 versus RSL3; ## p < 0.01, ### p < 0.001 versus control. Note: The HO-1 immunoblots in Figure 3C, the ACSL4 immunoblots in Figure 4C, and the Keap1 and GPX4 immunoblots in Figure 5C were derived from the same batch of samples and resolved on the same biological membrane; therefore, they share the same GAPDH loading control.
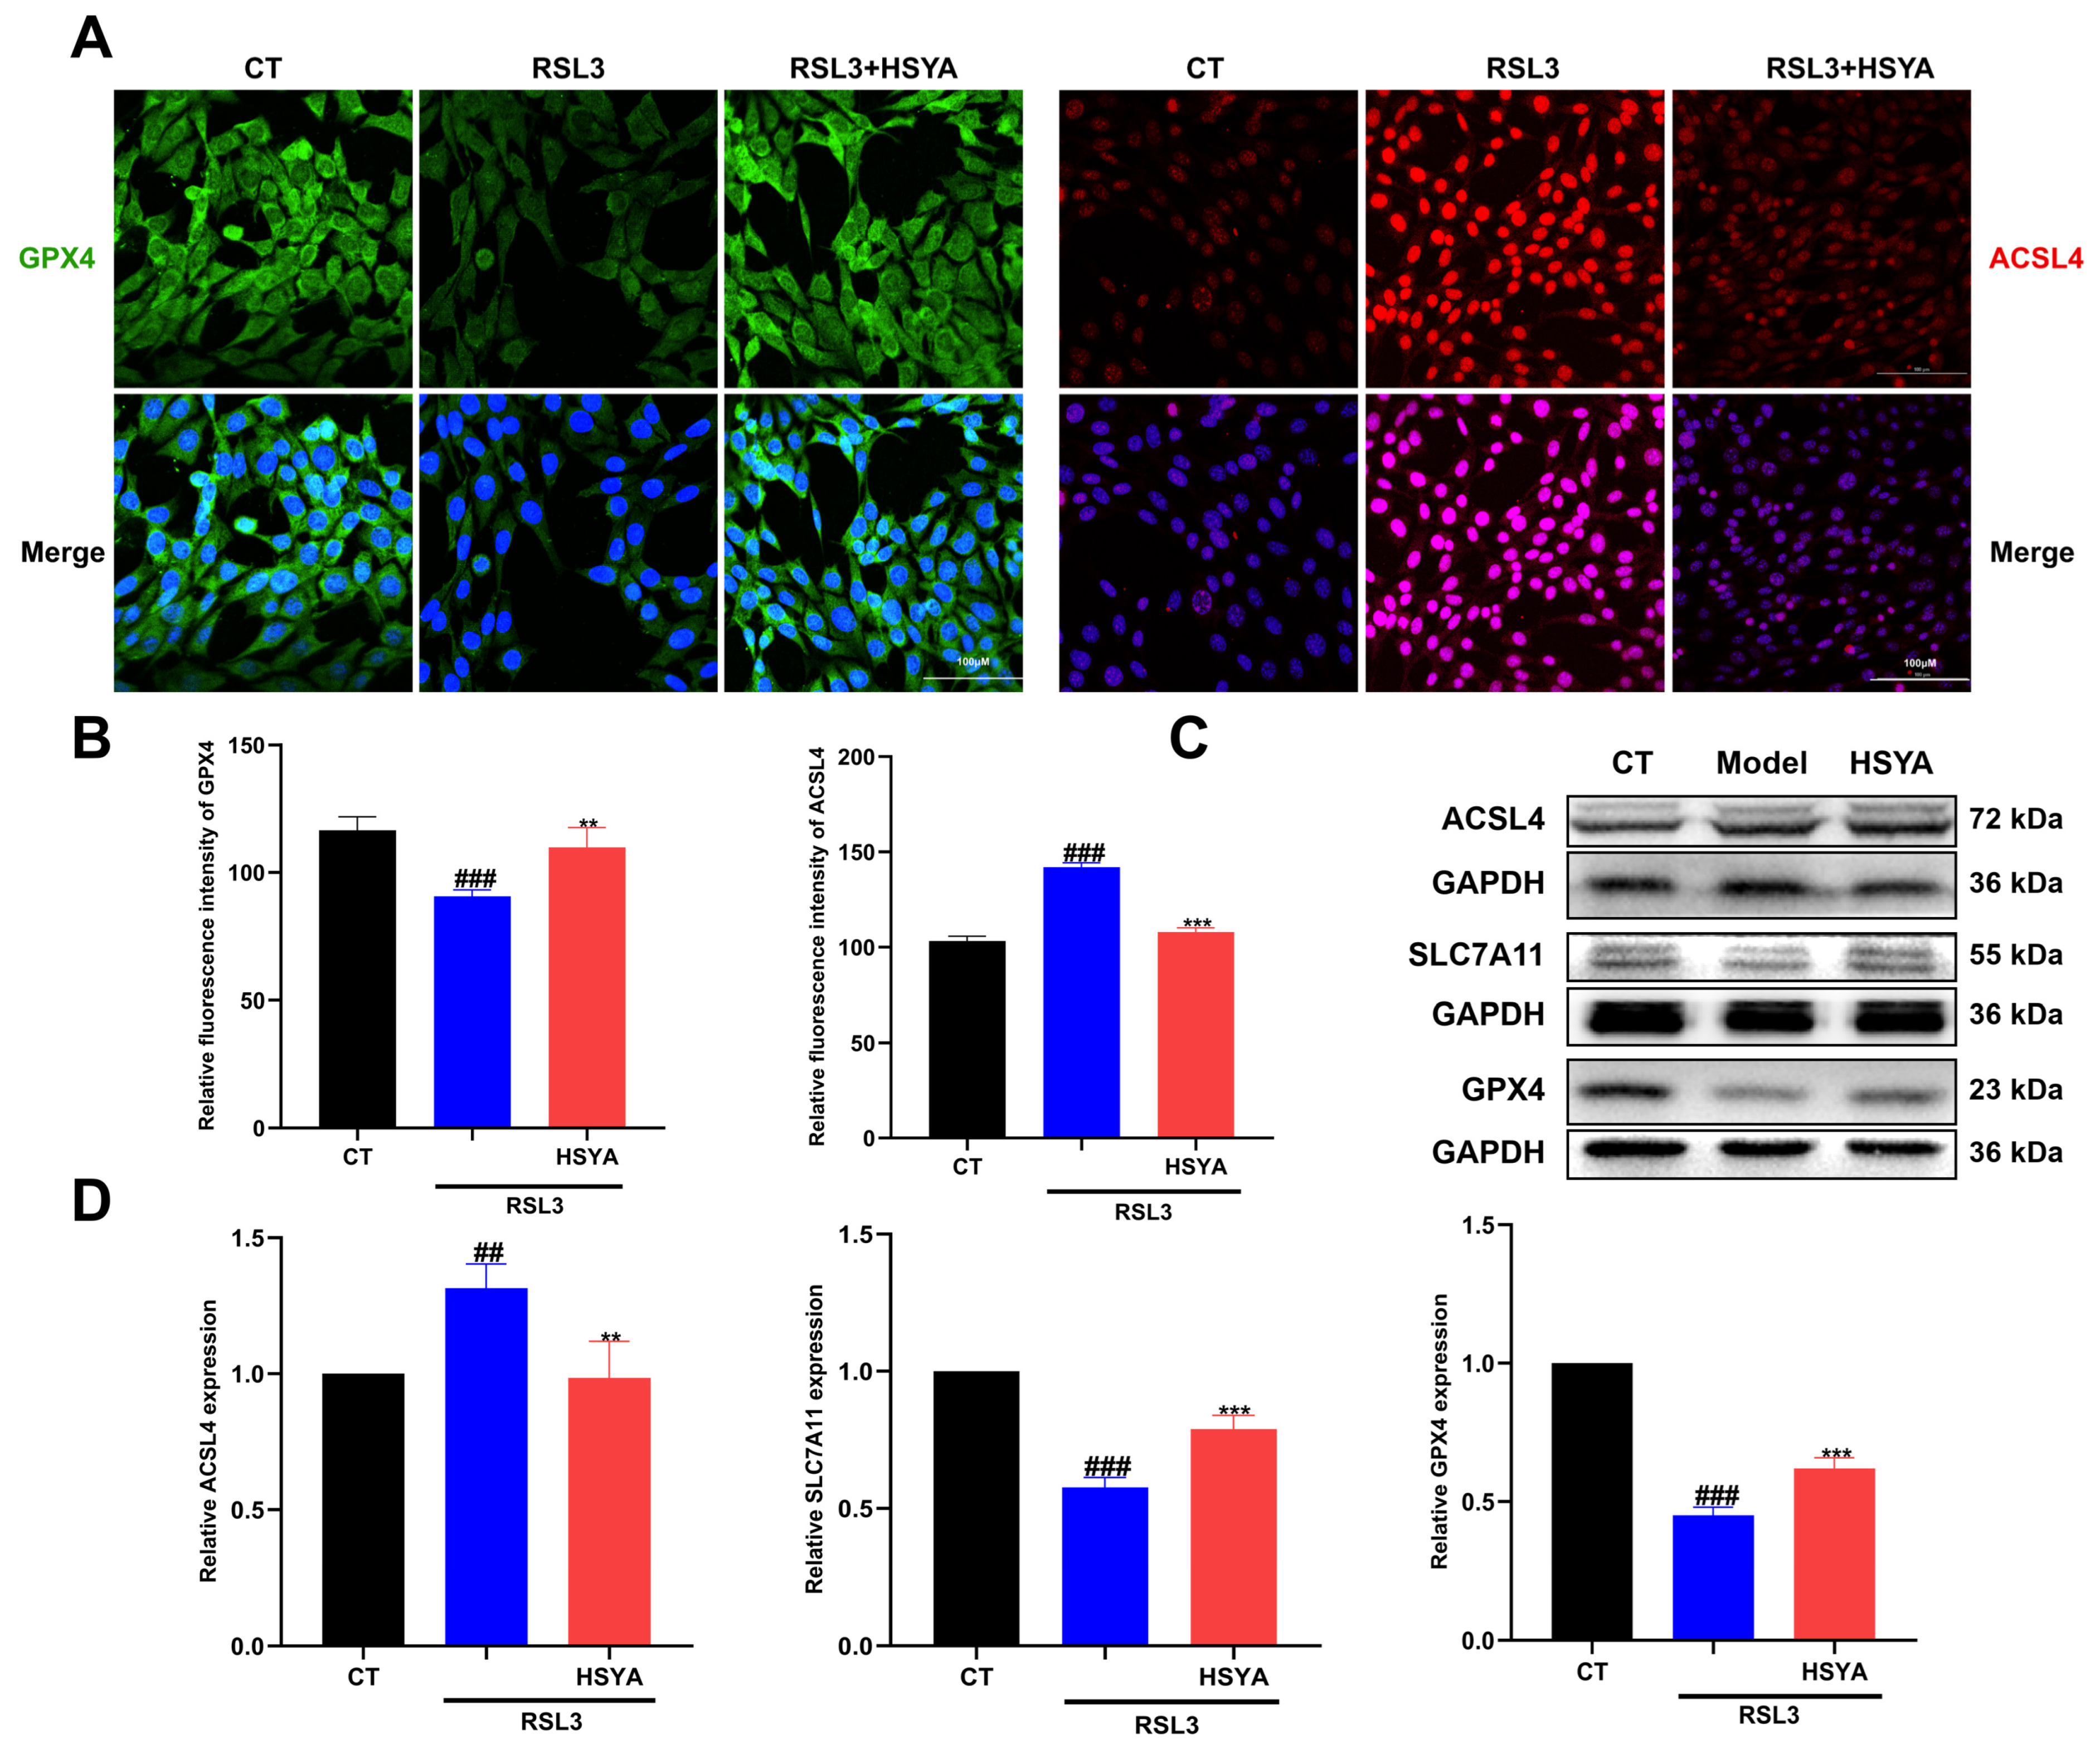
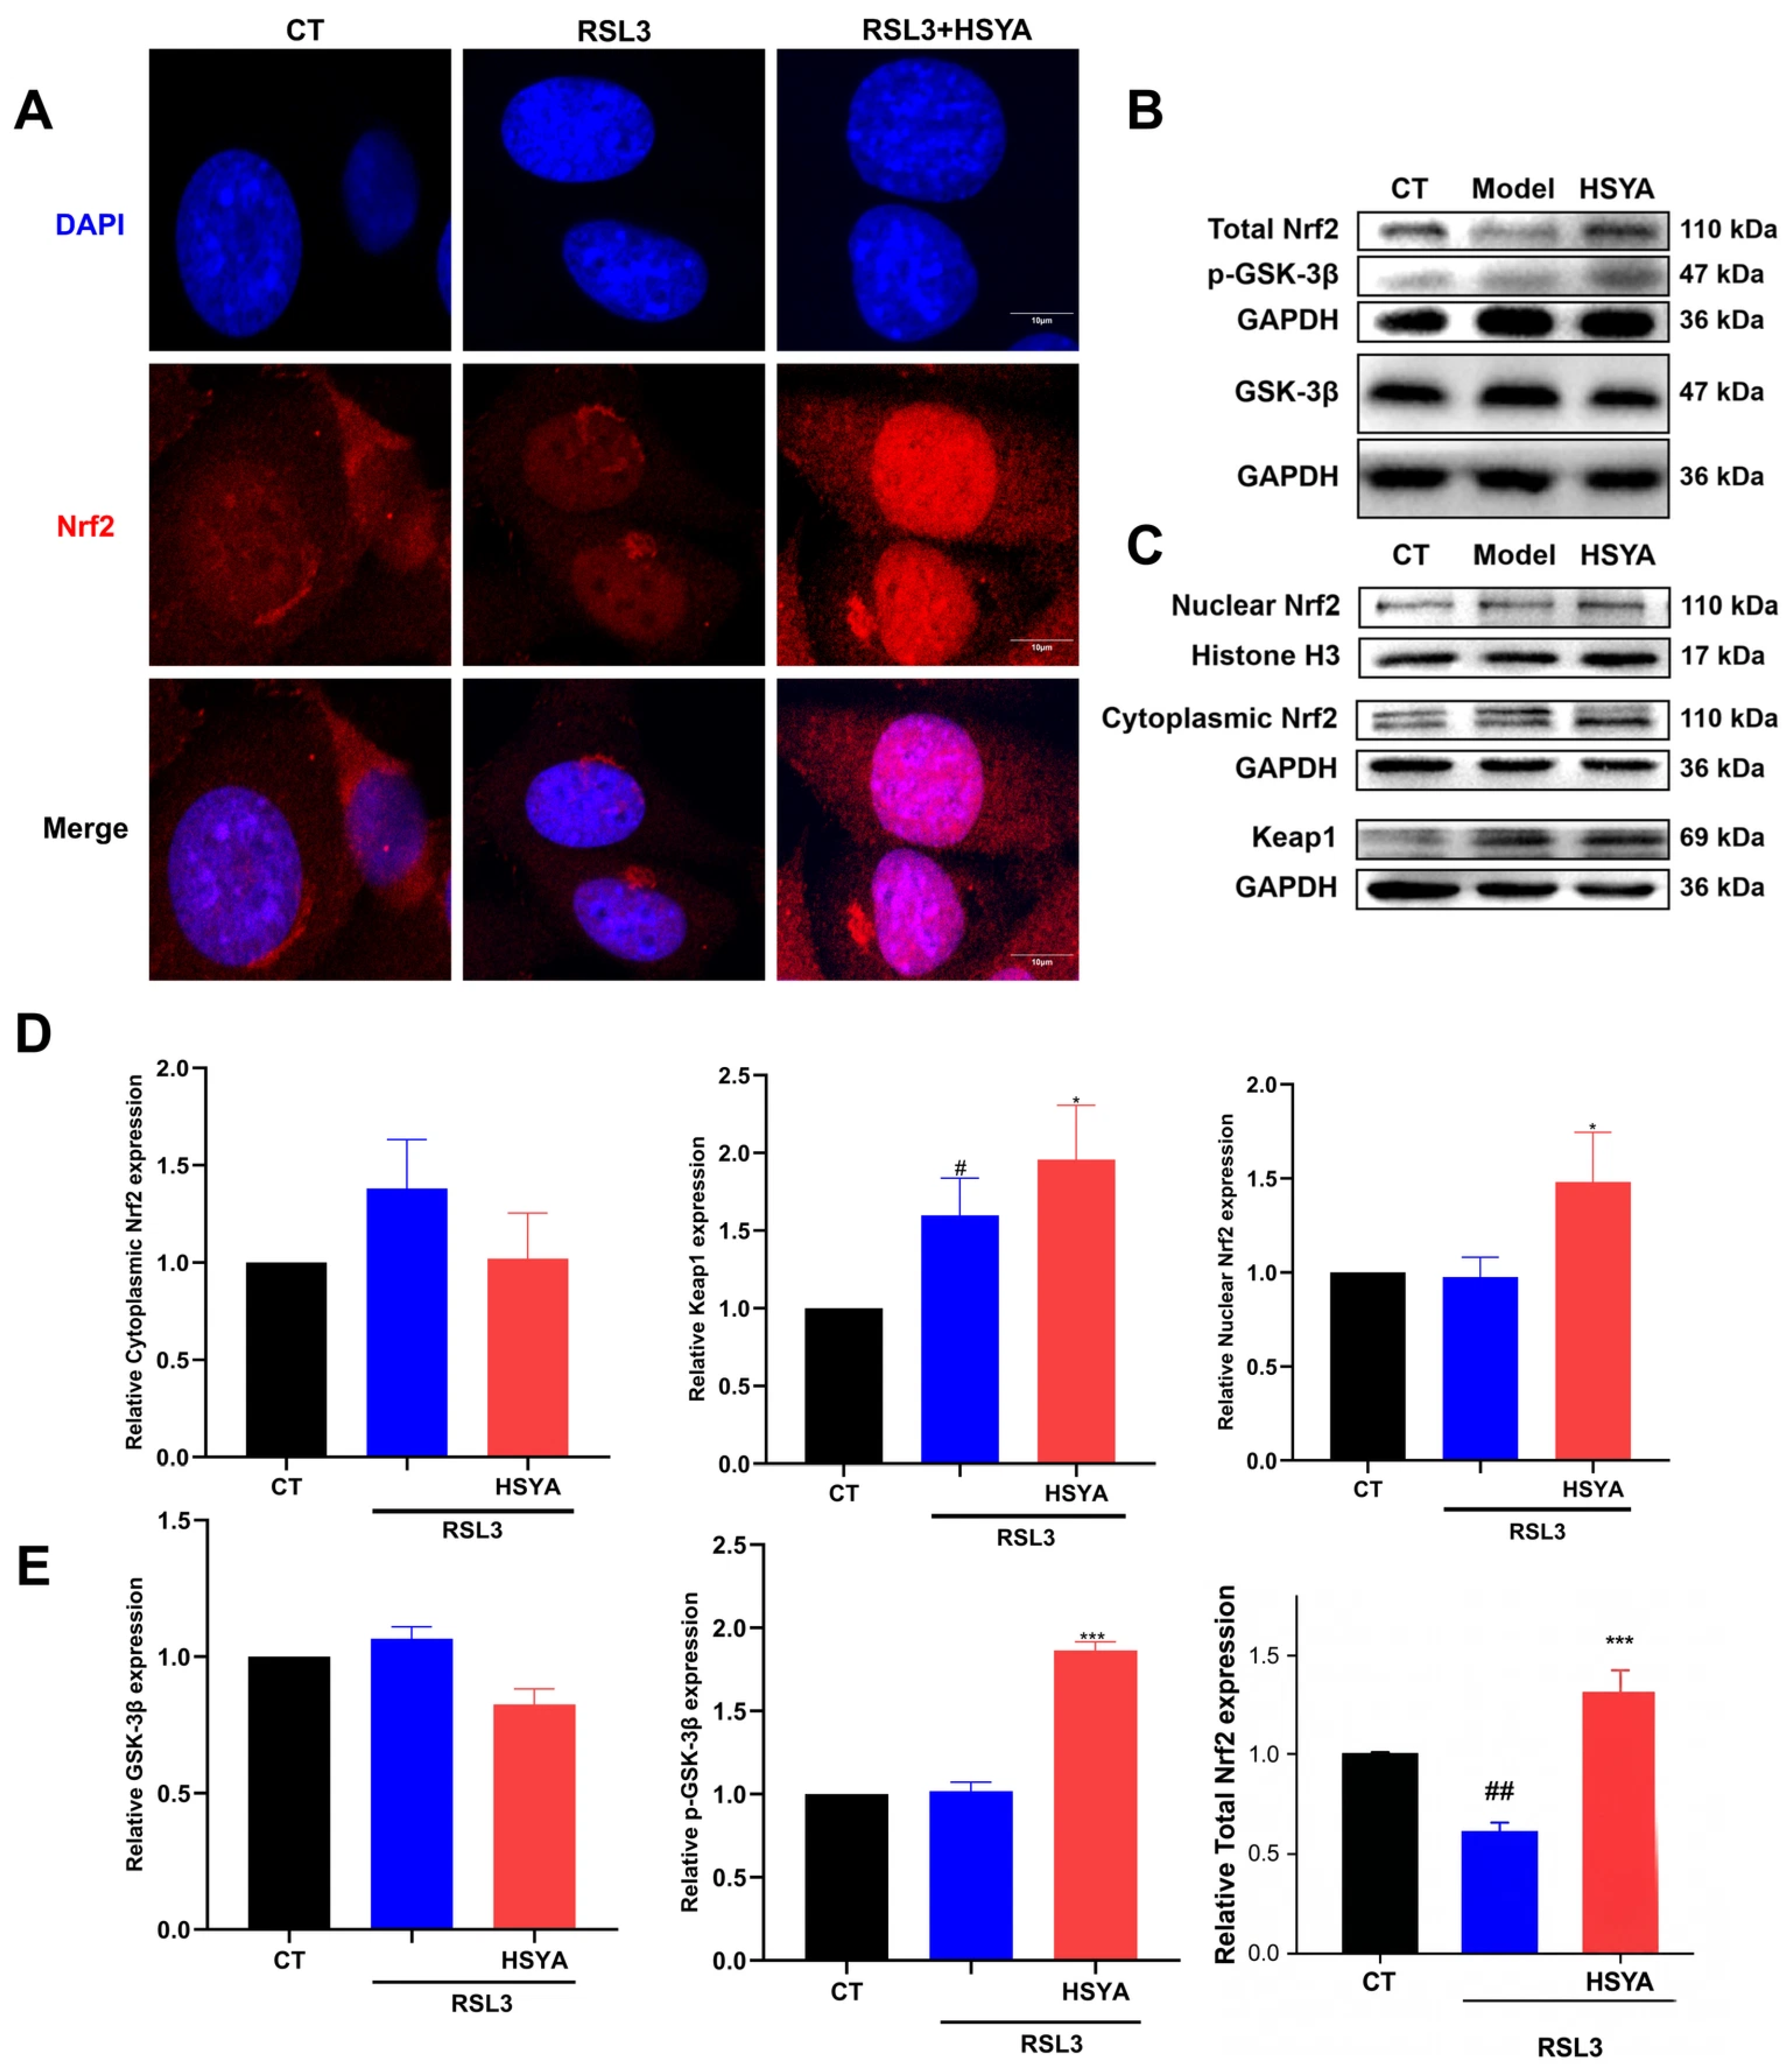
Figure 5.
HSYA treatment was associated with increased nuclear Nrf2 accumulation, Keap1 abundance, and the GAPDH-normalized p-GSK-3β (Ser9) signal in HT22 cells: (A) Nrf2/DAPI immunofluorescence; scale bar, 10 μm. (B) Whole-cell Total Nrf2 and p-GSK-3β (Ser9) share the same membrane GAPDH control; total GSK-3β is paired with its respective GAPDH control. Both GSK-3β signals were normalized to GAPDH; no phospho/total ratio was calculated. (C) Nuclear Nrf2/Histone H3, cytoplasmic Nrf2/GAPDH, and Keap1/GAPDH. The GAPDH control for cytoplasmic Nrf2 is also displayed for GPX4 in Figure 4C. (D) Cytoplasmic Nrf2, Keap1, and nuclear Nrf2 densitometry, from left to right. (E) Total GSK-3β, p-GSK-3β, and whole-cell Total Nrf2 densitometry, from left to right. CT, untreated control; Model, RSL3; HSYA, RSL3 + HSYA. For (D,E), n = 3 independent biological experiments per group, except for Total Nrf2 (n = 4 across two runs). Nuclear and cytoplasmic fractions were paired preparations from the same three biological samples. Technical measurements were averaged within samples. Data are mean ± SEM; one-way ANOVA with Tukey’s test. Total Nrf2: F(2, 9) = 24.54, p < 0.001; Tukey-adjusted p = 0.0095 for Model versus CT, p < 0.001 for HSYA versus Model, and p = 0.0300 for HSYA versus CT. * p < 0.05, *** p < 0.001 versus RSL3; # p < 0.05, ## p < 0.01. Total Nrf2 marks only Model versus CT (##) and HSYA versus Model (***); HSYA versus CT is reported without a symbol. Note: The GPX4 immunoblots in Figure 4C and the Keap1 immunoblots in Figure 5C were derived from the same batch of samples and resolved on the same biological membrane; therefore, they share the same GAPDH loading control.
3. Results
3.1. Network Pharmacology and Bioinformatics Analysis Identified Ferroptosis-Related HSYA Targets
Fourteen human-annotated targets overlapped among HSYA predictions, AD-associated genes, and ferroptosis-related genes (Figure 1A). The 14 PPI-network nodes were NFE2L2, HMOX1, GPX4, SLC7A11, FTH1, NQO1, NOS2, JUN, BRD4, RB1, PPARG, AKT1, EGFR, and AKR1C1 (Figure 1B). Enrichment included ferroptosis (count = 5, raw p = 7.94 × 10⁻⁸, FDR = 2.71 × 10⁻⁶; Figure 1C) and the KEAP1–NFE2L2 pathway (count = 8, raw p = 3.98 × 10⁻⁹, FDR = 6.53 × 10⁻⁸; Figure 1D); values for all terms displayed in Figure 1 are listed in Supplementary Table S1. KEAP1 was not an intersection hit; Keap1 was examined on the basis of the pathway annotations and its established role in Nrf2 regulation. The human-derived analysis generated hypotheses for selected protein and interaction assays in mouse HT22 cells, without establishing a causal pathway or an effect on AD pathology.
3.2. HSYA Preserved Cell Viability and Attenuated Mitochondrial Structural Damage in RSL3-Treated HT22 Cells
We first examined whether HSYA protected HT22 cells against RSL3-induced cytotoxicity. HSYA alone at 1–50 μM did not significantly affect cell viability (Figure 2B). RSL3 treatment (0.5 μM, 24 h) reduced cell viability to approximately 40% of the control level (p < 0.001; Figure 2D). Pretreatment with HSYA at 10 or 30 μM, followed by continued co-incubation with RSL3, increased viability to 81.3% and 92.7%, respectively (both p < 0.001 vs. RSL3 alone). HSYA at 30 μM was therefore selected for subsequent cell-protection and signaling experiments.
HSYA also attenuated RSL3-induced mitochondrial injury. RSL3-treated cells exhibited shrinkage, rounding, and detachment, whereas HSYA treatment helped cells remain attached and retain their spindle-shaped morphology (Figure 2C). Transmission electron microscopy showed mitochondrial shrinkage, increased electron density, and reduced or disrupted cristae after RSL3 exposure. These alterations were less pronounced in the HSYA-treated group (Figure 2E).
3.3. HSYA Reduced Iron Accumulation, Oxidative Stress, and Lipid Peroxidation
RSL3 exposure increased intracellular labile Fe2+ and ROS signals, while C11-BODIPY images qualitatively showed greater oxidized fluorescence in HT22 cells (Figure 3A). HSYA treatment attenuated these changes, with lower Fe2+ and ROS fluorescence intensities than those observed after RSL3 treatment alone (Figure 3B). Biochemical measurements showed reduced MDA levels, an increased GSH/GSSG ratio, and partially restored SOD activity in the HSYA-treated group (Figure 3E). HO-1 densitometry indicated attenuation of the RSL3-induced increase after HSYA treatment (Figure 3D). Mean FTH1/GAPDH abundance was numerically higher in both challenged groups than in CT but was significantly lower in the RSL3 + HSYA group than in the RSL3 group (Tukey-adjusted p = 0.0484; n = 4 per group; Figure 3C,D). Together, these findings indicate that HSYA attenuated oxidative and lipid-peroxidative changes associated with RSL3-induced injury.
3.4. HSYA Increased SLC7A11 and GPX4 Protein Abundance and Reduced ACSL4
We next examined proteins associated with antioxidant defense and ferroptosis susceptibility. HSYA treatment increased GPX4 immunofluorescence and reduced ACSL4 immunofluorescence in RSL3-treated HT22 cells (Figure 4A,B). Western blotting likewise showed increased SLC7A11 and GPX4 protein abundance and reduced ACSL4 abundance relative to RSL3 treatment alone (SLC7A11 and GPX4, p < 0.001; ACSL4, p < 0.01; Figure 4C,D). These findings demonstrate changes in ferroptosis-related protein abundance accompanying the protective effects of HSYA.
3.5. HSYA Increased Nuclear Nrf2 Accumulation and the GAPDH-Normalized p-GSK-3β (Ser9) Signal
To examine molecular changes accompanying HSYA-mediated protection, we assessed Nrf2 localization, Keap1 abundance, and the p-GSK-3β (Ser9) signal. Immunofluorescence showed increased nuclear Nrf2 accumulation after HSYA treatment (Figure 5A), consistent with the increase in nuclear Nrf2 detected by Western blotting (Figure 5C,D). Whole-cell Total Nrf2 was lower after RSL3 and higher after HSYA treatment than after RSL3 alone. The group effect was significant (one-way ANOVA, F(2, 9) = 24.54, p < 0.001); Tukey-adjusted comparisons were significant for CT versus RSL3 (p = 0.0095), CT versus HSYA + RSL3 (p = 0.0300), and RSL3 versus HSYA + RSL3 (p < 0.001; Figure 5B,E). HSYA also increased Keap1 abundance and the GAPDH-normalized p-GSK-3β (Ser9) signal. Because p-GSK-3β was not normalized to total GSK-3β, this result does not quantify the phosphorylated fraction or kinase activity. These observations identify Nrf2-associated signaling changes accompanying HSYA treatment but do not establish a causal relationship among Keap1, GSK-3β, and Nrf2.
3.6. Complementary Assays Provided Exploratory Support for an HSYA–Keap1 Interaction
Molecular docking predicted a possible binding pose of HSYA within a Keap1 pocket, with a docking score of −9.828 kcal/mol (Figure 6A,B). DARTS showed concentration-dependent preservation of Keap1 following Pronase E digestion of HT22 cell lysates incubated with HSYA (Figure 6D). Lysate-based CETSA was consistent with an apparent thermal shift of approximately 7.7 °C for soluble Keap1 after incubation with HSYA (30 μM) relative to the vehicle control, based on the immunoblots and fitted thermal curves (Figure 6D,G). SPR responses increased with HSYA concentration over 0.025–1.56 μM (Figure 6E). An exploratory one-site fit of mean late-association responses gave an apparent KD of approximately 0.4 μM (Figure 6F). The low-amplitude responses and unverified equilibrium plateau limit this estimate; it does not establish a validated binding affinity.
Figure 6.
Complementary assays gave exploratory evidence consistent with an HSYA–Keap1 interaction: (A,B) Docking pose and predicted contacts; the label in (A) reports a computed docking score. (C) DARTS and lysate-based CETSA workflows. (D) Representative Keap1 immunoblots: upper, after Pronase E digestion; lower, soluble protein across temperatures. (E) Retained SPR sensorgram excerpt (approximately −38 to 130 s), including 60 s of association and the first 70 s of dissociation. Concentration labels follow the ordered series (0.025–1.56 μM). (F) One-site fit of mean responses at 52.5, 55, and 57.5 s; apparent KD ≈ 0.4 μM is an exploratory fit parameter because equilibrium was not verified. (G) Fitted CETSA thermal curves. Experiment counts and technical repeats are specified in the Methods section; no between-experiment SEM or inferential statistics are reported for CETSA or SPR.
4. Discussion
HSYA attenuated the RSL3-induced injury phenotype in HT22 cells: viability and mitochondrial morphology were preserved, while labile Fe2+, ROS, lipid oxidation, and MDA were reduced. Increased SLC7A11 and GPX4 and reduced ACSL4 protein abundance are consistent with a lower lipid-peroxidative burden, because these proteins participate in cystine supply, lipid-peroxide detoxification, and incorporation of oxidizable fatty acids into phospholipids, respectively [3,27]. These observations extend previous reports of HSYA-associated protection in PC12 oxygen–glucose deprivation/reoxygenation and ischemic stroke models [13,14] to a defined RSL3 challenge in HT22 cells. Without ferrostatin-1, liproxstatin-1, or iron-chelation rescue in this study, the phenotype is appropriately described as ferroptosis-associated injury rather than definitive ferroptotic cell death.
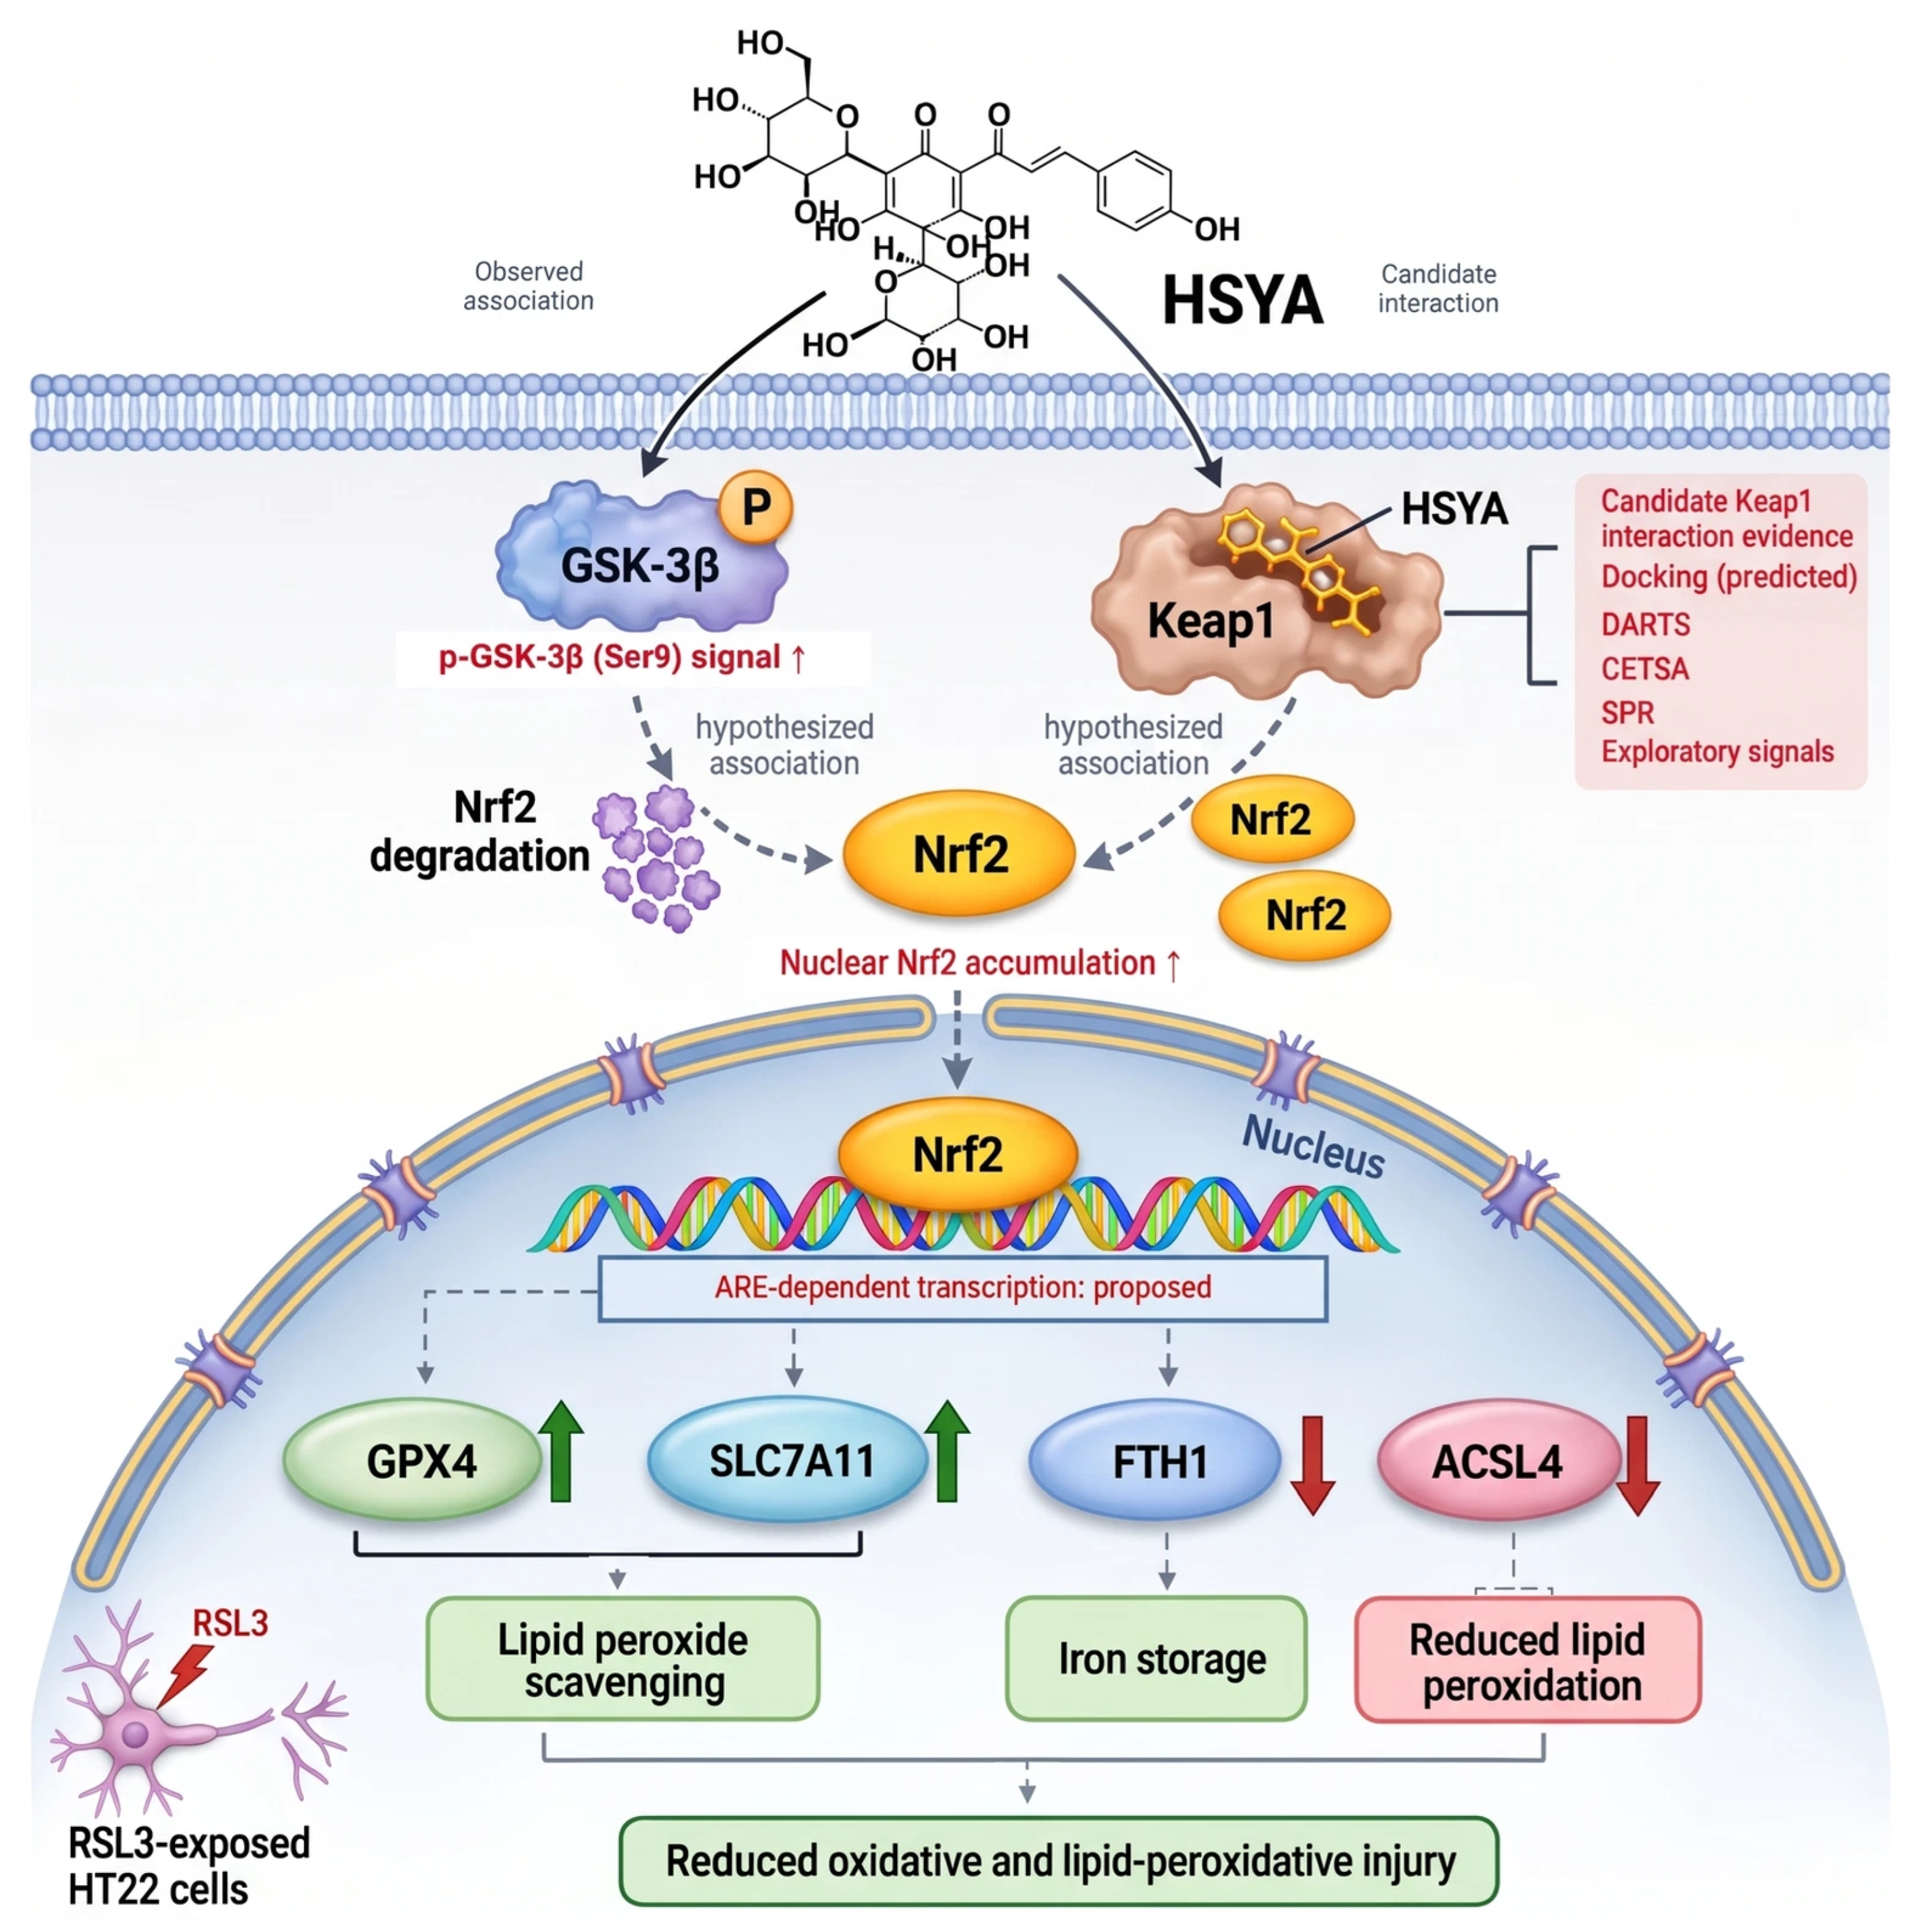
The protein and localization findings suggest antioxidant-response changes without defining a single upstream route. HSYA treatment was accompanied by nuclear Nrf2 accumulation, increased SLC7A11 and GPX4 abundance, attenuation of the RSL3-induced HO-1 increase, a higher GAPDH-normalized p-GSK-3β (Ser9) signal, and higher total Keap1. Whole-cell Total Nrf2 decreased after RSL3 and increased after HSYA relative to RSL3, with significant differences in all pairwise comparisons; these abundance data do not by themselves establish pathway activation or a causal relationship. Because p-GSK-3β was normalized to GAPDH rather than total GSK-3β, it does not quantify relative phosphorylation or kinase activity. Nrf2 can regulate antioxidant and iron-handling programs [7,8], whereas GSK-3β/β-TrCP and Keap1/CUL3 represent distinct routes for Nrf2 turnover [9,10,28]. Thus, the GAPDH-normalized p-GSK-3β signal and Keap1 abundance should be read as parallel observations associated with nuclear Nrf2, not as evidence of a linear Keap1–GSK-3β–Nrf2 cascade (Figure 7). The HO-1 change accompanied reduced oxidative-stress burden; neither its functional contribution nor a causal role in protection was established. Total Keap1 abundance does not measure its substrate-binding or ubiquitin-ligase function. Mean FTH1 abundance remained numerically above CT but was significantly lower after HSYA treatment than after RSL3 alone (Tukey-adjusted p = 0.0484). This treatment-associated change accompanied reduced iron accumulation and oxidative stress, while the functional contribution of FTH1 to protection remains to be established.
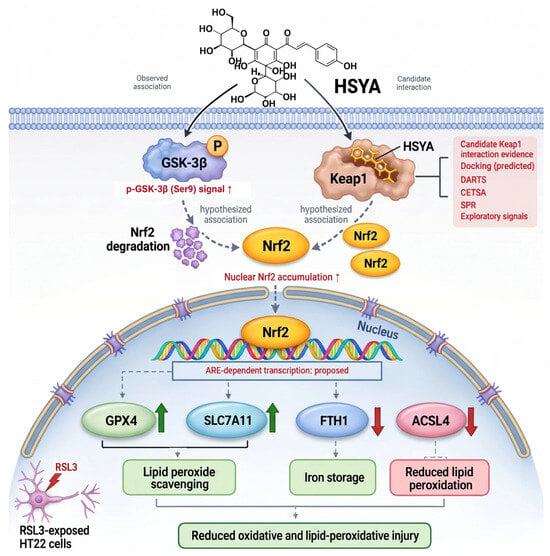
Figure 7.
Working model distinguishing observed changes from proposed relationships. The upward/downward protein symbols denote treatment-associated observations: a higher GAPDH-normalized p-GSK-3β (Ser9) signal, nuclear Nrf2 accumulation, GPX4 and SLC7A11 abundance, and reduced FTH1 and ACSL4 relative to RSL3 alone. The p-GSK-3β signal was not normalized to total GSK-3β and does not represent a measured phosphorylation fraction. ACSL4 is shown as a separate observed protein change without a connection from the ARE box. Reduced oxidative and lipid-peroxidative injury is an observed phenotype. The Keap1 inset summarizes candidate interaction evidence: predicted docking, DARTS, lysate-based CETSA, and exploratory SPR. The two upper solid arrows are labeled as an observed association or candidate interaction, rather than established direct actions. Gray dashed arrows depict proposed regulatory or functional relationships. Nrf2 degradation, nuclear movement, ARE-dependent transcription, and the links from protein changes to protection were not directly established. Direct transcriptional regulation of ACSL4 by Nrf2 was not tested. Keap1 and GSK-3β are shown as separate candidate routes to Nrf2 regulation; the model does not establish a linear cascade or pathway necessity. FTH1 abundance was lower in RSL3 + HSYA than in RSL3 alone (n = 4 biological samples per group). Its dashed link to iron storage denotes proposed functional involvement. Neither a quantitative correlation with injury markers nor FTH1-dependent protection was established.Upward green arrows (↑) indicate promotion or increased expression, whereas downward red arrows (↓) indicate inhibition or decreased expression. Regarding the color scheme: green represents cytoprotective responses or upregulation (e.g., GPX4, SLC7A11, scavenging, and injury reduction); blue represents baseline or intermediate molecular targets (e.g., GSK-3β and nucleus); and red represents pathological challenges, inhibitory signals, or downregulation (e.g., ACSL4, RSL3, degradation, and candidate interactions).
Keap1 is the candidate interaction partner examined here. Docking predicted a possible pose; DARTS showed protection from proteolysis; lysate-based CETSA showed altered soluble Keap1 thermal stability; and SPR yielded concentration-dependent, low-amplitude responses. The exploratory response–concentration fit gave an apparent KD of approximately 0.4 μM. The low response amplitude, unverified equilibrium plateau, and limited independent replication preclude interpreting this parameter as a validated binding affinity. Docking is predictive, and lysate stability does not establish functional necessity in intact cells [29,30,31]. Neither Keap1-dependent protection nor altered Nrf2 ubiquitination was established.
The interpretation remains bounded by the model and missing perturbations. Human-annotated network predictions were compared with selected protein and interaction readouts in mouse-derived HT22 cells; orthology does not ensure equivalent expression or pathway behavior across species. The RSL3 model captures ferroptosis-associated features but does not reproduce the cellular environment of AD. Ferroptosis-inhibitor rescue, Keap1 or Nrf2 loss-of-function, Keap1–Nrf2 binding and ubiquitination assays, and stronger orthogonal affinity measurements would test the proposed links directly. The original HSYA target-prediction query and enrichment background universe were not available for independent verification, so those computational results remain hypothesis-generating. Until then, the Figure 7 model separates observed treatment-associated changes from inferred regulatory relationships.
In summary, HSYA attenuated ferroptosis-associated injury in HT22 cells, with exploratory evidence for Keap1 interaction. Nuclear Nrf2 accumulation and the GAPDH-normalized p-GSK-3β (Ser9) signal were associated observations; the latter does not quantify phosphorylation relative to total GSK-3β or kinase activity. Neither Keap1 engagement nor an Nrf2 regulatory route was shown to be required for protection.
Supplementary Materials
The following supporting information can be downloaded at https://www.mdpi.com/article/10.3390/antiox15111466/s1, Table S1: Enrichment results for the KEGG and Reactome terms displayed in Figure 1.
Author Contributions
Conceptualization, Y.Y. and Z.W.; methodology, Z.W.; formal analysis, Z.W.; investigation, L.W. (Lujuan Wang), H.T. and Z.W.; visualization, Y.C. and L.W. (Laiyimei Wei); writing—original draft preparation, Z.W.; writing—review and editing, Z.W. and Y.Y.; supervision, Y.Y.; funding acquisition, Y.Y. All authors have read and agreed to the published version of the manuscript.
Funding
This research was funded by the High-level Talent Scientific Research Start-up Project of Shihezi University, grant number RCZK202562; the 2025 Talent Development Fund—Tianchi Talent Program, grant number CZ000950; and the Major Science and Technology Project of Xinjiang Uygur Autonomous Region, grant number 20261151636. The APC was funded by the High-level Talent Scientific Research Start-up Project of Shihezi University (RCZK202562).
Institutional Review Board Statement
Not applicable.
Informed Consent Statement
Not applicable.
Data Availability Statement
Data supporting this study are included in the article and its Supplementary Materials. Additional raw data supporting the conclusions of this article will be made available by the corresponding author upon reasonable request.
Conflicts of Interest
The authors declare no conflicts of interest. The funders had no role in the design of the study; in the collection, analyses, or interpretation of data; in the writing of the manuscript; or in the decision to publish the results.
References
- Ashraf, A.; So, P.-W. Spotlight on Ferroptosis: Iron-Dependent Cell Death in Alzheimer’s Disease. Front. Aging Neurosci. 2020, 12, 196. [Google Scholar] [CrossRef] [Scilit]
- Greenough, M.A.; Camakaris, J.; Bush, A.I. Metal dyshomeostasis and oxidative stress in Alzheimer’s disease. Neurochem. Int. 2013, 62, 540–555. [Google Scholar] [CrossRef] [Scilit]
- Dixon, S.J.; Lemberg, K.M.; Lamprecht, M.R.; Skouta, R.; Zaitsev, E.M.; Gleason, C.E.; Patel, D.N.; Bauer, A.J.; Cantley, A.M.; Yang, W.S.; et al. Ferroptosis: An iron-dependent form of nonapoptotic cell death. Cell 2012, 149, 1060–1072. [Google Scholar] [CrossRef] [Scilit]
- Jiang, X.; Stockwell, B.R.; Conrad, M. Ferroptosis: Mechanisms, biology and role in disease. Nat. Rev. Mol. Cell Biol. 2021, 22, 266–282. [Google Scholar] [CrossRef] [Scilit]
- Hambright, W.S.; Fonseca, R.S.; Chen, L.; Na, R.; Ran, Q. Ablation of ferroptosis regulator glutathione peroxidase 4 in forebrain neurons promotes cognitive impairment and neurodegeneration. Redox Biol. 2017, 12, 8–17. [Google Scholar] [CrossRef] [Scilit]
- Anandhan, A.; Dodson, M.; Schmidlin, C.J.; Liu, P.; Zhang, D.D. Breakdown of an Ironclad Defense System: The Critical Role of NRF2 in Mediating Ferroptosis. Cell Chem. Biol. 2020, 27, 436–447. [Google Scholar] [CrossRef] [Scilit]
- Dodson, M.; Castro-Portuguez, R.; Zhang, D.D. NRF2 plays a critical role in mitigating lipid peroxidation and ferroptosis. Redox Biol. 2019, 23, 101107. [Google Scholar] [CrossRef] [Scilit]
- Xiang, Y.; Song, X.; Long, D. Ferroptosis regulation through Nrf2 and implications for neurodegenerative diseases. Arch. Toxicol. 2024, 98, 579–615. [Google Scholar] [CrossRef] [Scilit]
- Cuadrado, A. Structural and functional characterization of Nrf2 degradation by glycogen synthase kinase 3/β-TrCP. Free Radic. Biol. Med. 2015, 88, 147–157. [Google Scholar] [CrossRef] [Scilit]
- Rada, P.; Rojo, A.I.; Chowdhry, S.; McMahon, M.; Hayes, J.D.; Cuadrado, A. SCF/β-TrCP promotes glycogen synthase kinase 3-dependent degradation of the Nrf2 transcription factor in a Keap1-independent manner. Mol. Cell. Biol. 2011, 31, 1121–1133. [Google Scholar] [CrossRef] [Scilit]
- Chen, L.; Xiang, Y.; Kong, L.; Zhang, X.; Sun, B.; Wei, X.; Liu, H. Hydroxysafflor yellow A protects against cerebral ischemia-reperfusion injury by anti-apoptotic effect through PI3K/Akt/GSK3β pathway in rat. Neurochem. Res. 2013, 38, 2268–2275. [Google Scholar] [CrossRef] [Scilit]
- Lv, Y.; Qian, Y.; Fu, L.; Chen, X.; Zhong, H.; Wei, X. Hydroxysafflor yellow A exerts neuroprotective effects in cerebral ischemia reperfusion-injured mice by suppressing the innate immune TLR4-inducing pathway. Eur. J. Pharmacol. 2015, 769, 324–332. [Google Scholar] [CrossRef] [Scilit]
- Chen, G.; Li, C.; Zhang, L.; Yang, J.; Meng, H.; Wan, H.; He, Y. Hydroxysafflor yellow A and anhydrosafflor yellow B alleviate ferroptosis and parthanatos in PC12 cells injured by OGD/R. Free Radic. Biol. Med. 2022, 179, 1–10. [Google Scholar] [CrossRef] [Scilit]
- Wu, Y.; Yin, L.; Wang, Z.; Yuan, S.; Ma, D.; Wen, C.; Tian, H.; Xiao, B.; Ma, C.; Song, L. Hydroxysafflor yellow A inhibits neuronal ferroptosis and ferritinophagy in ischemic stroke. Biochim. Biophys. Acta Mol. Basis Dis. 2025, 1871, 167867. [Google Scholar] [CrossRef] [Scilit]
- Kim, S.; Chen, J.; Cheng, T.; Gindulyte, A.; He, J.; He, S.; Li, Q.; Shoemaker, B.A.; Thiessen, P.A.; Yu, B.; et al. PubChem 2019 update: Improved access to chemical data. Nucleic Acids Res. 2019, 47, D1102–D1109. [Google Scholar] [CrossRef] [Scilit]
- Daina, A.; Michielin, O.; Zoete, V. SwissTargetPrediction: Updated data and new features for efficient prediction of protein targets of small molecules. Nucleic Acids Res. 2019, 47, W357–W364. [Google Scholar] [CrossRef] [Scilit]
- Ru, J.; Li, P.; Wang, J.; Zhou, W.; Li, B.; Huang, C.; Li, P.; Guo, Z.; Tao, W.; Yang, Y.; et al. TCMSP: A database of systems pharmacology for drug discovery from herbal medicines. J. Cheminform. 2014, 6, 13. [Google Scholar] [CrossRef] [Scilit]
- Stelzer, G.; Rosen, N.; Plaschkes, I.; Zimmerman, S.; Twik, M.; Fishilevich, S.; Stein, T.I.; Nudel, R.; Lieder, I.; Mazor, Y.; et al. The GeneCards suite: From gene data mining to disease genome sequence analyses. Curr. Protoc. Bioinform. 2016, 54, 1.30.1–1.30.33. [Google Scholar] [CrossRef] [Scilit]
- Zhou, N.; Bao, J. FerrDb: A manually curated resource for regulators and markers of ferroptosis and ferroptosis-disease associations. Database 2020, 2020, baaa021. [Google Scholar] [CrossRef] [Scilit]
- Szklarczyk, D.; Kirsch, R.; Koutrouli, M.; Nastou, K.; Mehryary, F.; Hachilif, R.; Gable, A.L.; Fang, T.; Doncheva, N.T.; Pyysalo, S.; et al. The STRING database in 2023: Protein–protein association networks and functional enrichment analyses for any sequenced genome of interest. Nucleic Acids Res. 2023, 51, D638–D646. [Google Scholar] [CrossRef] [Scilit]
- Yu, G.; Wang, L.-G.; Han, Y.; He, Q.-Y. clusterProfiler: An R package for comparing biological themes among gene clusters. OMICS 2012, 16, 284–287. [Google Scholar] [CrossRef] [Scilit]
- Yang, J.; Wang, M.; Zheng, S.; Huang, R.; Wen, G.; Zhou, P.; Wang, W.; Zhou, S.; Jiang, X.; Liu, S.; et al. Mesoporous polydopamine delivering 8-gingerol for the target and synergistic treatment to the spinal cord injury. J. Nanobiotechnol. 2023, 21, 192. [Google Scholar] [CrossRef] [Scilit]
- Wang, X.; Ma, Z.; Fu, Z.; Gao, S.; Yang, L.; Jin, Y.; Sun, H.; Wang, C.; Fan, W.; Chen, L.; et al. Hydroxysafflor yellow A protects neurons from excitotoxic death through inhibition of NMDARs. ASN Neuro 2016, 8, 1759091416642345. [Google Scholar] [CrossRef] [Scilit]
- Ma, H.-H.; Wen, J.-R.; Fang, H.; Su, S.; Wan, C.; Zhang, C.; Lu, F.-M.; Fan, L.-L.; Wu, G.-L.; Zhou, Z.-Y.; et al. Hydroxysafflor yellow A exerts neuroprotective effect by reducing Aβ toxicity through inhibiting endoplasmic reticulum stress in oxygen–glucose deprivation/reperfusion cell model. Rejuvenation Res. 2023, 26, 57–67. [Google Scholar] [CrossRef] [Scilit]
- Pap, E.H.W.; Drummen, G.P.C.; Winter, V.J.; Kooij, T.W.A.; Rijken, P.; Wirtz, K.W.A.; Op den Kamp, J.A.F.; Hage, W.J.; Post, J.A. Ratio-fluorescence microscopy of lipid oxidation in living cells using C11-BODIPY581/591. FEBS Lett. 1999, 453, 278–282. [Google Scholar] [CrossRef] [Scilit]
- Drummen, G.P.C.; van Liebergen, L.C.M.; Op den Kamp, J.A.F.; Post, J.A. C11-BODIPY581/591, an oxidation-sensitive fluorescent lipid peroxidation probe: (micro)spectroscopic characterization and validation of methodology. Free Radic. Biol. Med. 2002, 33, 473–490. [Google Scholar] [CrossRef] [Scilit]
- Doll, S.; Proneth, B.; Tyurina, Y.Y.; Panzilius, E.; Kobayashi, S.; Ingold, I.; Irmler, M.; Beckers, J.; Aichler, M.; Walch, A.; et al. ACSL4 dictates ferroptosis sensitivity by shaping cellular lipid composition. Nat. Chem. Biol. 2017, 13, 91–98. [Google Scholar] [CrossRef] [Scilit]
- Rada, P.; Rojo, A.I.; Evrard-Todeschi, N.; Innamorato, N.G.; Cotte, A.; Jaworski, T.; Tobón-Velasco, J.C.; Devijver, H.; García-Mayoral, M.F.; Van Leuven, F.; et al. Structural and functional characterization of Nrf2 degradation by the glycogen synthase kinase 3/β-TrCP axis. Mol. Cell. Biol. 2012, 32, 3486–3499. [Google Scholar] [CrossRef] [Scilit]
- Jafari, R.; Almqvist, H.; Axelsson, H.; Ignatushchenko, M.; Lundbäck, T.; Nordlund, P.; Martinez Molina, D. The cellular thermal shift assay for evaluating drug target interactions in cells. Nat. Protoc. 2014, 9, 2100–2122. [Google Scholar] [CrossRef] [Scilit]
- Lomenick, B.; Jung, G.; Wohlschlegel, J.A.; Huang, J. Target identification using drug affinity responsive target stability (DARTS). Curr. Protoc. Chem. Biol. 2011, 3, 163–180. [Google Scholar] [CrossRef] [Scilit]
- Tran, K.T.; Pallesen, J.S.; Solbak, S.M.Ø.; Narayanan, D.; Baig, A.; Zang, J.; Aguayo-Orozco, A.; Carmona, R.M.C.; Garcia, A.D.; Bach, A. A Comparative Assessment Study of Known Small-Molecule Keap1-Nrf2 Protein-Protein Interaction Inhibitors: Chemical Synthesis, Binding Properties, and Cellular Activity. J. Med. Chem. 2019, 62, 8028–8052. [Google Scholar] [CrossRef] [Scilit]
Disclaimer/Publisher’s Note: The statements, opinions and data contained in all publications are solely those of the individual author(s) and contributor(s) and not of MDPI and/or the editor(s). MDPI and/or the editor(s) disclaim responsibility for any injury to people or property resulting from any ideas, methods, instructions or products referred to in the content. |
© 2026 by the authors. Licensee MDPI, Basel, Switzerland. This article is an open access article distributed under the terms and conditions of the Creative Commons Attribution (CC BY) license.