


Abstract
Ultra-high-field 7 T time-of-flight MR angiography (TOF-MRA) provides detailed visualization of intracranial vasculature, but quantitative analysis is sensitive to intensity inhomogeneity and non-standardized post-processing. We present TOFR-VET (Time-of-Flight Radiomics and Vessel Enhancement Toolkit), a unified MATLAB workflow that integrates vessel enhancement, objective image quality evaluation (PSNR, SSIM, entropy, contrast improvement index (CII), and brightness preservation factor (BPF)), and radiomic feature extraction within a single as a proposed methodological framework for consistent analysis. Using 7 T TOF-MRA datasets (n = 120 subjects), we comparatively evaluated histogram-based and adaptive enhancement approaches and quantified their impact on image quality behavior and radiomic feature sensitivity. Adaptive Gamma Correction with Weighting Distribution (AGCWD), as one of the methods tested, resulted in higher fidelity-to-baseline metrics than standard histogram equalization (HE), demonstrated by improved PSNR metrics (23.54 dB versus 15.82 dB; increase of 7.72 dB) along with observed complementary trends in SSIM and BPF. Brightness-preserving methods maintained BPF values close to unity. Because enhancement methods intentionally reshape intensity distributions, PSNR/SSIM are interpreted here as structural deviation indicators relative to the original image rather than absolute measures of diagnostic quality. Quantitative analysis of 120 subjects using one-way ANOVA revealed that while Laplacian of Gaussian (LoG) filtering provides the highest contrast improvement for visual vessel continuity (CII = 1.65 ± 0.22, p < 0.001), Adaptive Gamma Correction (AGCWD) is superior for radiomic pipelines, maintaining an Intraclass Correlation Coefficient (ICC) of 0.94. These findings provide a specific decision-making framework for standardizing 7T TOF-MRA preprocessing based on the desired diagnostic or quantitative objective.
1. Introduction
Time-of-flight magnetic resonance angiography (TOF-MRA) is a well-established, non-contrast imaging technique for the visualization of intracranial vasculature, providing high spatial resolution without the need for exogenous contrast agents [1]. The introduction of ultra-high-field 7 T MRI has further enhanced TOF-MRA by improving signal-to-noise and contrast-to-noise ratios, enabling clearer depiction of small and peripheral vessels that are often difficult to visualize at lower field strengths [1].
Despite these advantages, the practical interpretation of 7 T TOF-MRA remains challenging due to intensity inhomogeneity, background noise, and limited vessel-to-tissue contrast. As a result, radiologists often employ simple contrast enhancement methods, and evaluate image quality subjectively instead of using objective measures like peak signal-to-noise ratio (PSNR) [2], structural similarity index (SSIM), entropy [3], contrast improvement index (CII), and brightness preservation factor (BPF) [4,5], or not at all in the course of routine enhancement workflows. Such fragmented approach discouraged reproducibility and hindered the objective comparison of enhancement strategies.
A limited number of publications have reported the clinical and research utility of TOF-MRA data: accelerated 3 T TOF-MRA for aneurysm follow-up, patient-specific vascular modeling for interventional planning [6]. Nevertheless, these applications generally involve the combination of various independent software tools and need to be programmed or scripted in generating processing pipelines to them. Furthermore, recent studies have emphasized that such standardization is vital for capturing complex vascular features. For instance, Li et al. (2024) demonstrated that quantitative 7T TOF-MRA modeling is essential for assessing fine structures like lenticulostriate arteries in cerebral small vessel disease [7]. The integration of such capabilities into a unified toolkit like TOFR-VET addresses the current gap between advanced imaging research and reproducible clinical–technical workflows. Open-source software platforms like 3D Slicer [8] and MITK [9] offer flexible visualization and analysis packages, though incorporating advanced enhancement algorithms for vessels and quantitative measures for evaluation may require substantial coding effort. On the other hand, application specific toolboxes in MATLAB, e.g., Medical Seg, have been reported to be designed specifically for segmentation purpose and they lack thorough vessel enhancement capabilities or objective quality assessment.
From the methodological aspect, histogram equalization (HE) is still a very popular approach in contrast enhancement due to its simplicity and efficiency. But standard HE may inadvertently enhance the noise and distort the brightness; hence, better-developed versions are, by name, dualistic sub-image histogram equalization (DSIHE), brightness-preserving bi-histogram equalization (BBHE), minimum mean brightness error bi-histogram equalization (MMBEBHE) and recursive simple image histogram equalization (RSIHE). These techniques are concerned with balancing contrast enhancement and brightness preservation [10]. Recently reported adaptive methods in the literature, including Adaptive Gamma Correction with Weighting Distribution (AGCWD) [11,12], and recursively separated and weighted histogram equalization (RSWHE) [13], attempt to achieve a balance between contrast redistributing versus noise suppression through the modeling of histograms adapted to the input image, motivating their evaluation using objective metrics of image quality, as well as in hybrid approaches using spatial filtering together with histogram remapping [14].
For the quantitative assessment of enhancement performance, some image quality measures (IQMs) including PSNR [15], SSIM [16], entropy, contrast improvement index (CII) [17] and bandpass filtering with thresholding response BPF [18] are frequently used. Although multiple enhancement algorithm and measures have been proposed, how to combine them together in a unified and proposed methodological framework for consistent analysis for TOF-MRA has still not achieved practical utilization.
To bridge this gap, we introduce a MATLAB-based integrated framework called TOFR-VET (Time-of-Flight Radiomics and Vessel Enhancement Toolkit) for systematic vessel enhancement and objective, reproducible evaluation using 7 T TOF-MRA. The purpose of this study is methodological: to compare commonly used enhancement strategies under a unified workflow and quantify (i) how enhancement affects objective image quality behavior and (ii) how enhancement shifts representative radiomic descriptors. Specifically, this work (1) integrates multiple established histogram-based and adaptive enhancement methods within a single reproducible pipeline; (2) computes objective image quality metrics (PSNR, SSIM, entropy, CII, and BPF) for comparative evaluation; (3) extracts first-order and texture radiomic features as quantitative indicators of preprocessing effects [19,20,21]; and (4) demonstrates the workflow on a 7 T TOF-MRA dataset (n = 120 subjects). This study does not aim to establish diagnostic biomarkers or clinical decision thresholds; instead, it provides a standardized methodological tool to assess enhancement-induced variability prior to downstream quantitative analysis. In this work, the objective metrics for enhancement performance are more focused than subjective metrics relying predominantly on visual inspection.
2. Materials and Methods
2.1. Data Acquisition and Description
Non-contrast-enhanced time-of-flight magnetic resonance angiography (TOF-MRA) brain scans were acquired from multiple 7 Tesla and 3 Tesla devices using clinical research MRI systems at the National Magnetic Resonance Research Center (UMRAM) and the Interventional MR Clinical R&D Institute (GIMRE), Ankara, Turkey. A three-dimensional TOF acquisition protocol with sub-millimeter spatial resolution was employed to image the intracranial vasculature, focusing on the circle of Willis region.
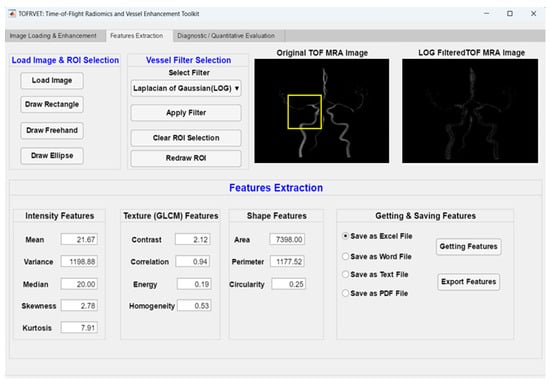
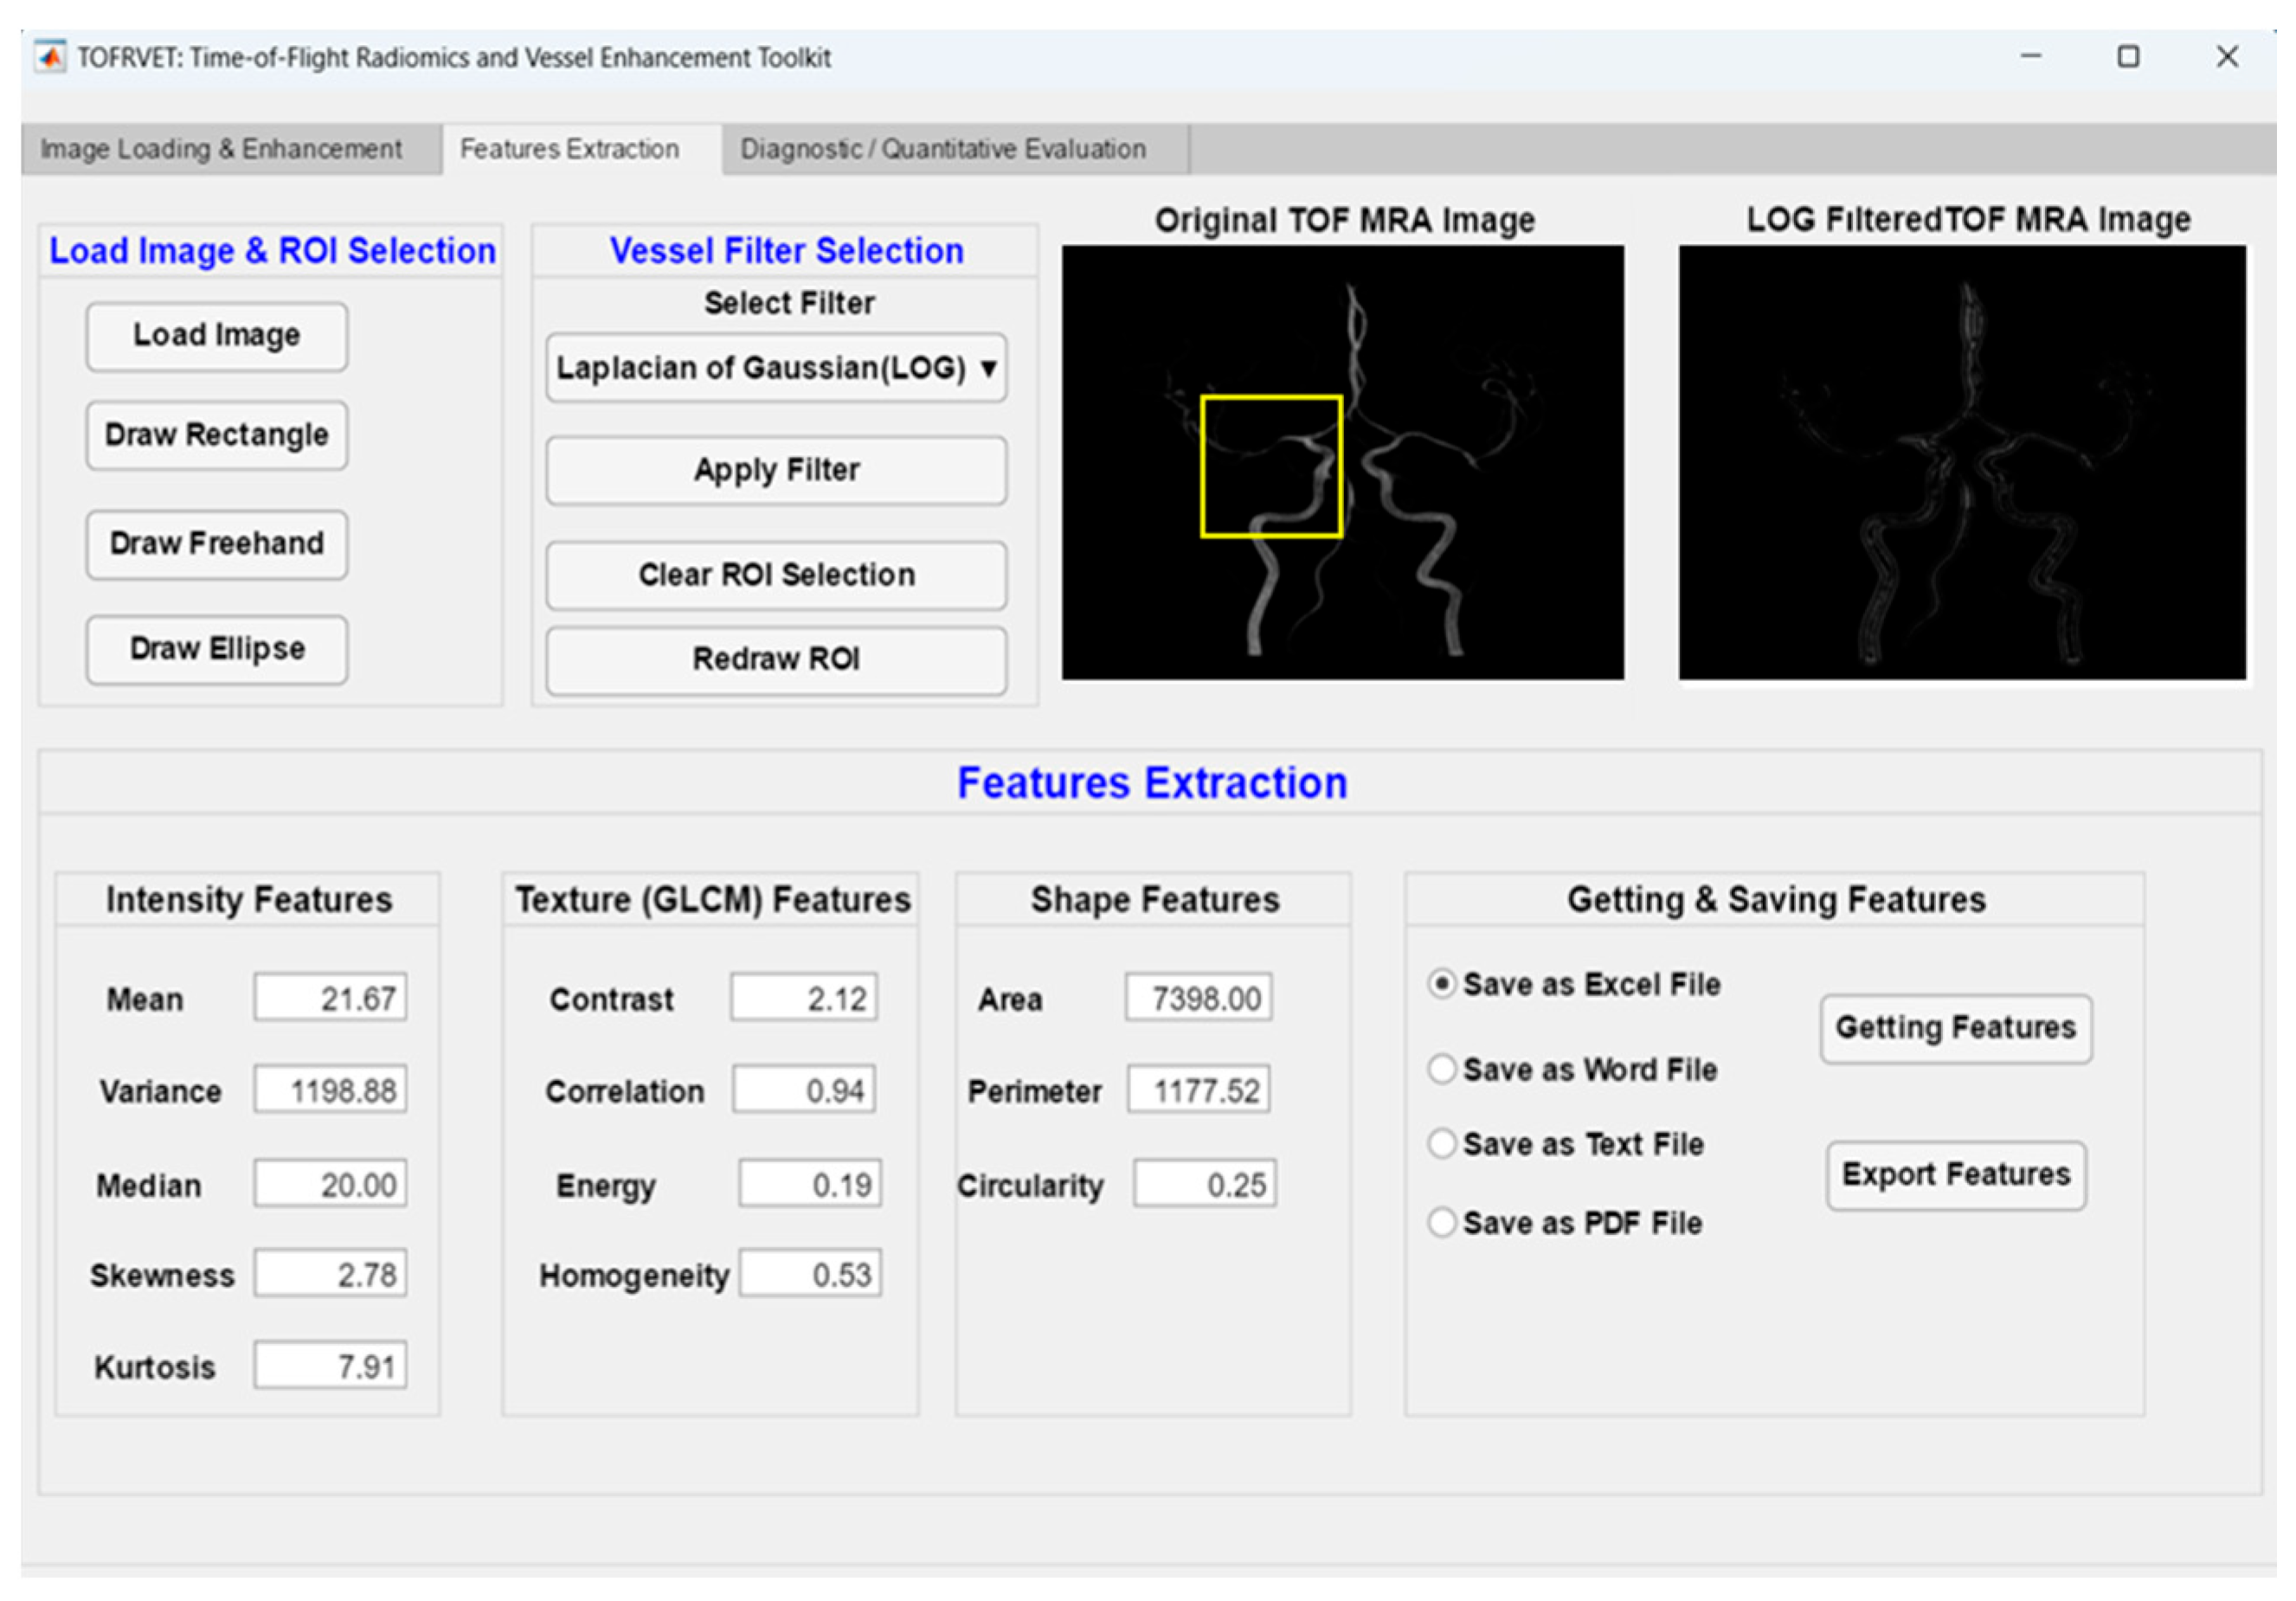
The dataset consisted of TOF-MRA volumes from 120 subjects (including both healthy subjects and patients). There were approximately 150–200 axial slices in each volume, which was originally saved in the DICOM format. Converted data were then imported to MATLAB R2021b and converted into matrices combined with a user-friendly GUI written in MATLAB App Designer [22,23]. Examples of the input images and the interfaces modules can be seen in Figure 1, Figure 2 and Figure 3.
Figure 1.
Radiomic feature extraction process illustrating ROI definition and computation of intensity- and texture-based features. The yellow frame indicates the selected Region of Interest (ROI) used for localized feature extraction and analysis.
Figure 2.
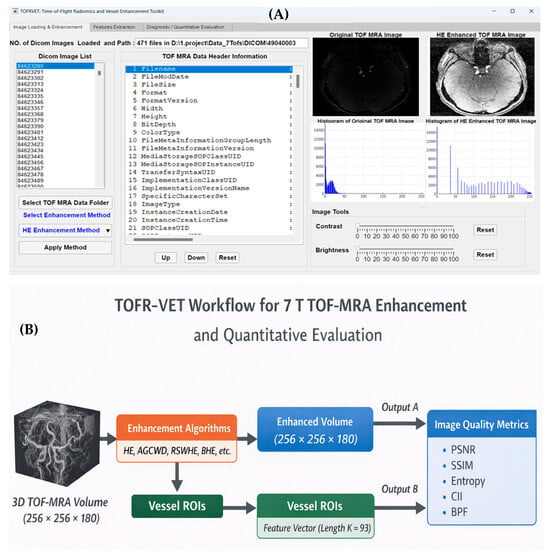
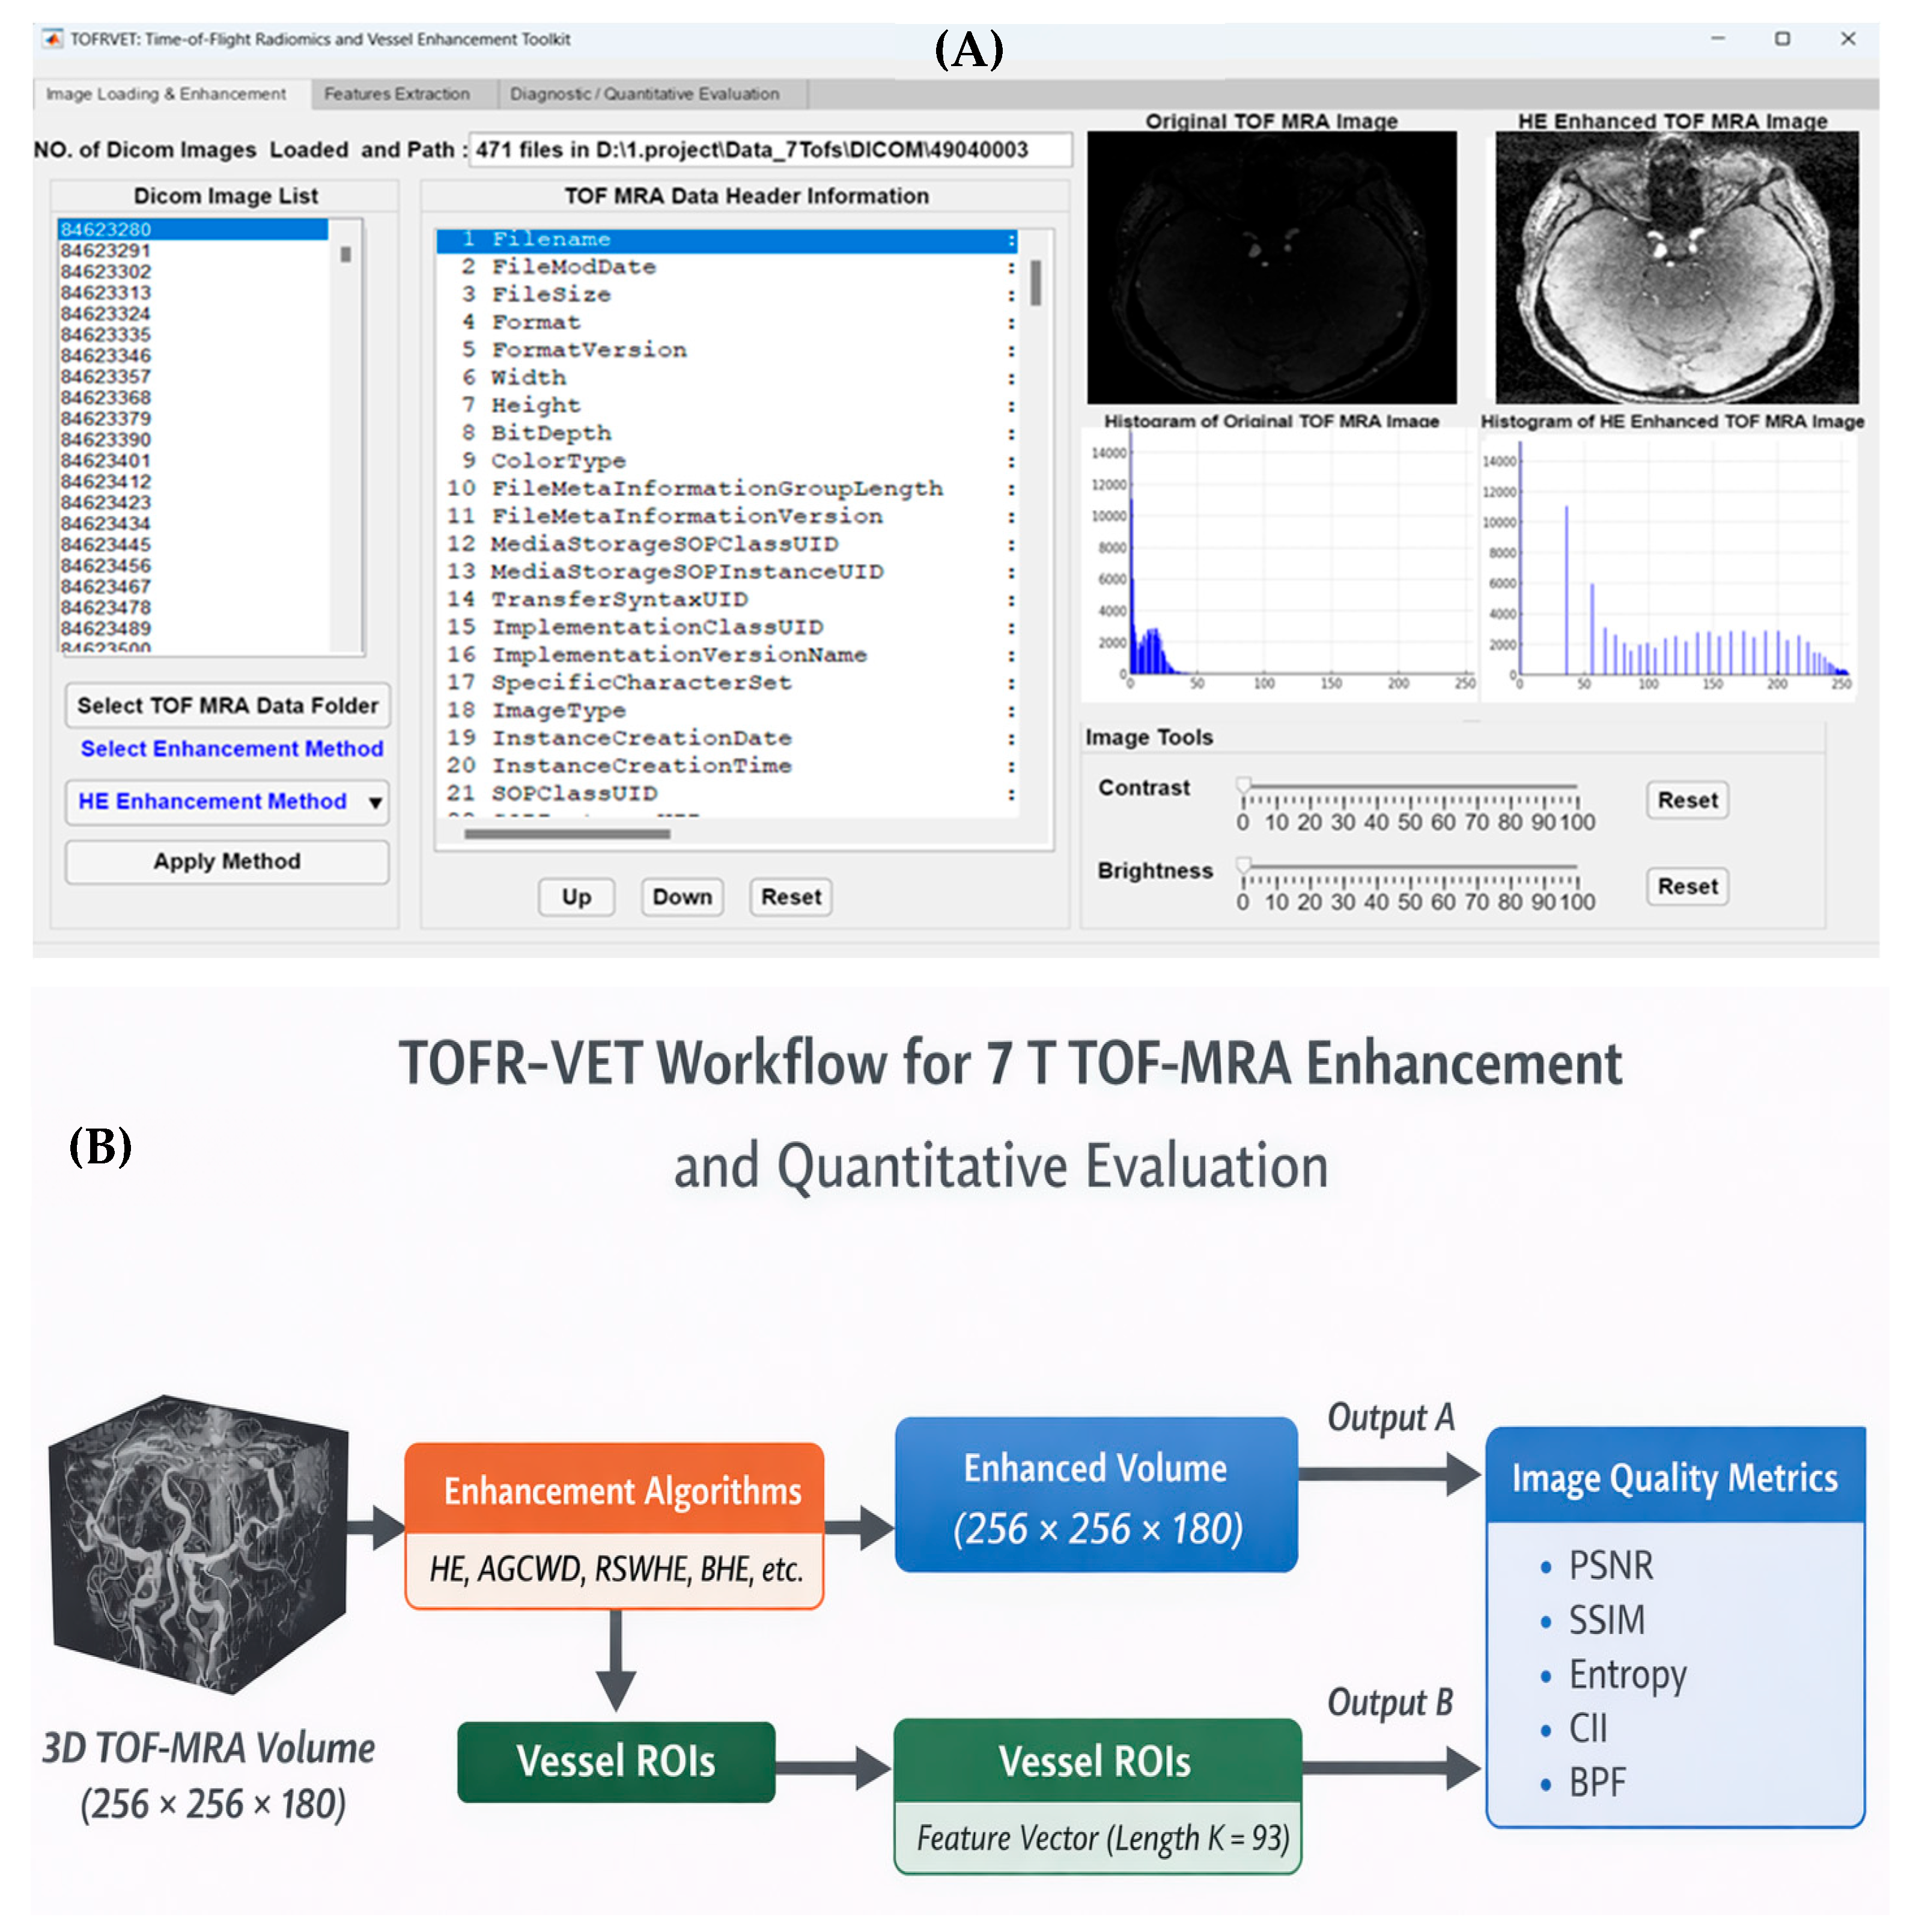
An overview of the proposed TOFR-VET framework for 7 T TOF-MRA improvement and quantitative assessment. (A) Graphical user interface of the TOFR-VET toolkit with modules for image loading, enhancement selection, and visualization. (B) The workflow diagram shows the integrated pipeline for vessel improvement, including objective image quality metrics (PSNR, SSIM, entropy, CII, and BPF) and radiomic features extract from vessels’ regions-of-interest (ROIs).
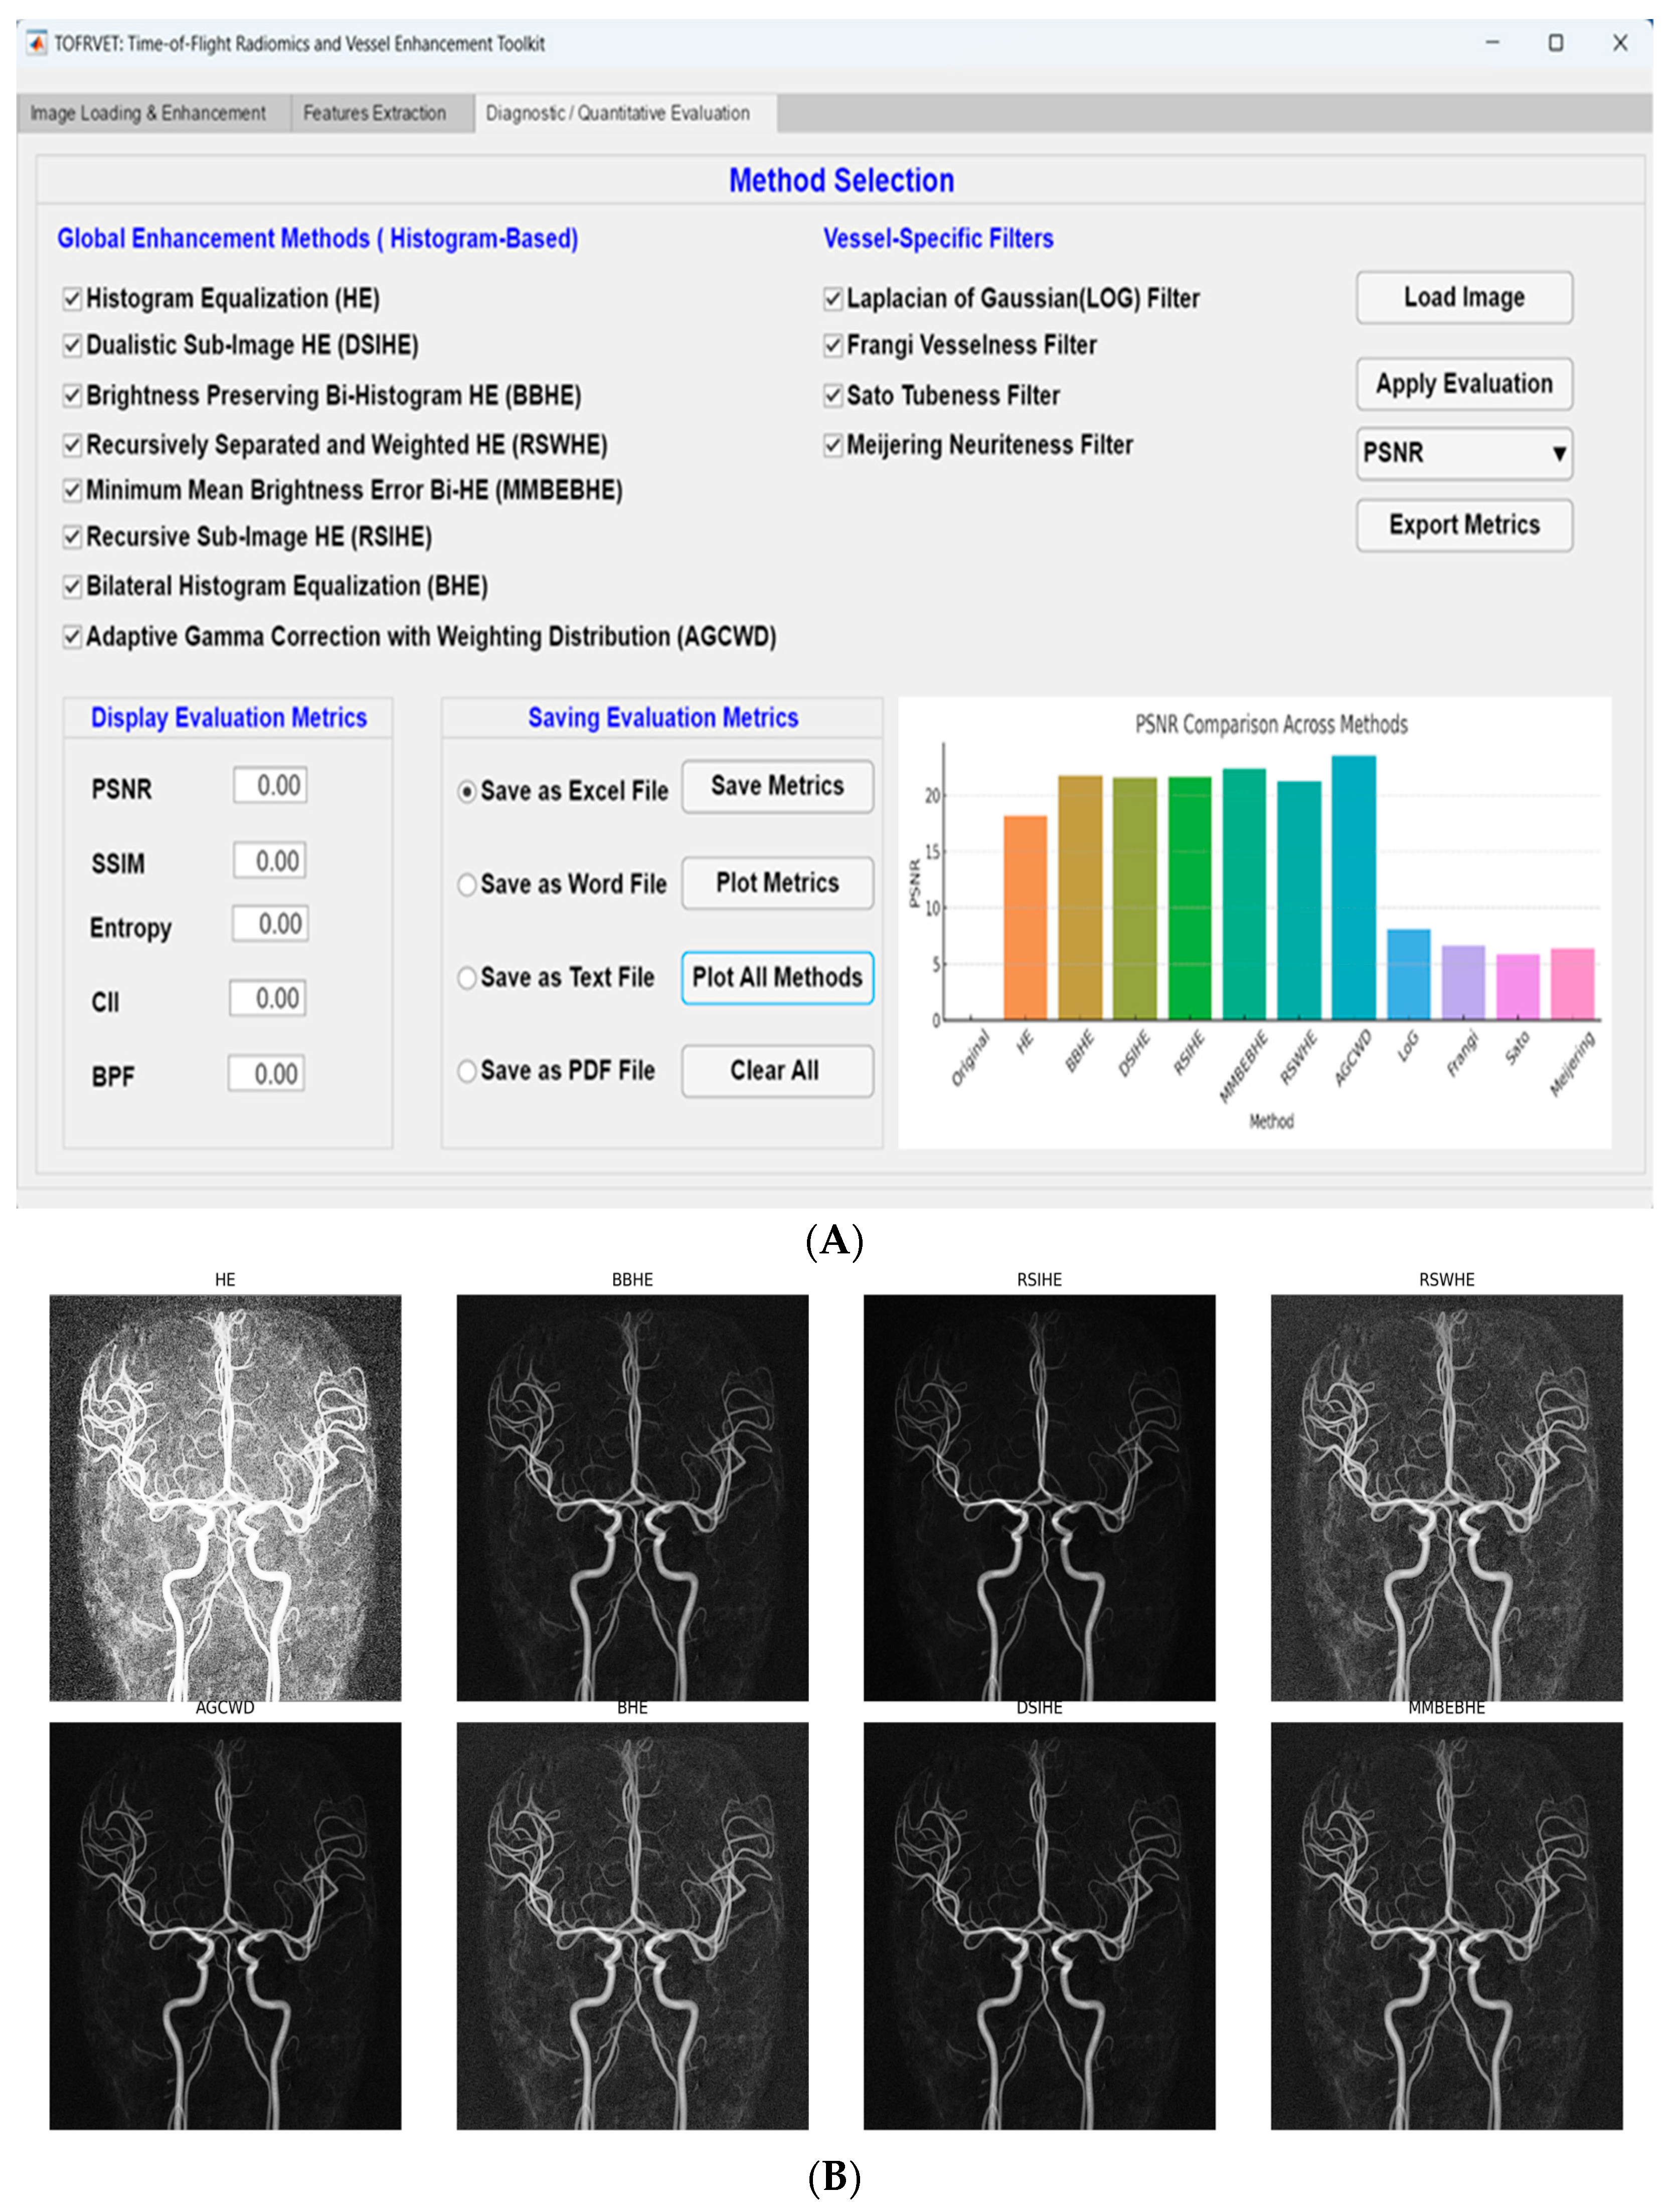
Figure 3.
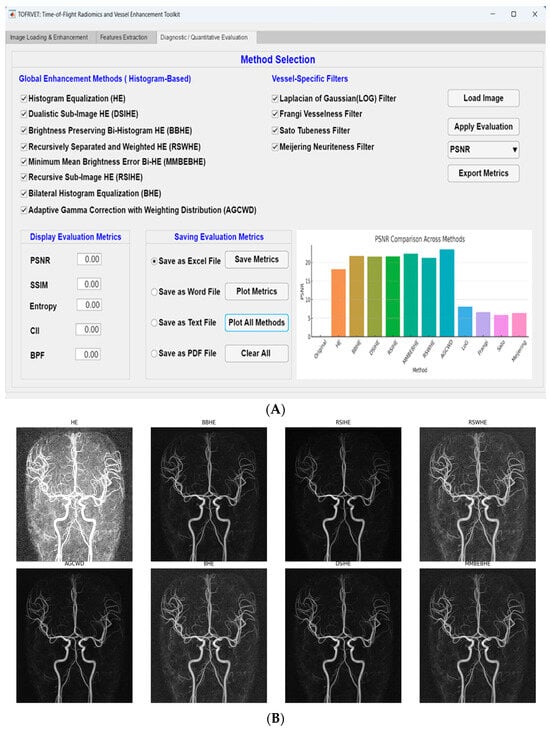
(A) Graphical user interface (GUI) of the proposed TOFR-VET framework. This interface combines image loading, histogram-based enhancement methods, vessel-specific filters, and quantitative evaluation metrics into a single environment. (B) Representative visual comparison of the 7 T TOF-MRA enhancement techniques.
The raw 7 T TOF-MRA images demonstrated characteristic intensity inhomogeneities and moderate vessel-to-background contrast, particularly in peripheral vascular branches and regions affected by field non-uniformity. Consequently, robust post-processing enhancement was required to standardize vessel visibility for quantitative analysis [24]. To ensure the reproducibility of the proposed workflow, the MATLAB source code and implementation scripts for the TOFR-VET toolkit will be made available upon request to the corresponding author. This allows for independent verification of the enhancement and radiomic extraction parameters used in this study.
The dataset utilized in this study consists of 120 high-resolution 7T TOF-MRA volumes. While specific individual demographic parameters (age and sex) and clinical histories were not available for this retrospective technical cohort, the primary objective of this research is the methodological validation of enhancement algorithms and the stability of radiomic descriptors. By utilizing a large, heterogeneous sample size (n = 120), we ensure that the performance of the TOFR-VET toolkit is evaluated across a wide range of signal-to-noise ratios and vascular intensities, which is a critical requirement for standardizing preprocessing pipelines regardless of specific patient demographics.
2.2. Image Enhancement Techniques
The contrast enhancement was performed with eight histogram-based contrast image enhancement methods, based on different strategies aiming at enhancing the contrast and simultaneously adjusting the noise amplification and brightness distortion.
Regular HE redistributes pixel intensities to the complete dynamic range for increasing global contrast. It does not consider noise reduction or brightness preservation directly, and may introduce visual artifacts [22]. In order to overcome these shortcomings, bi-histogram equalization such as dualistic sub-image histogram equalization (DSIHE) [25], brightness-preserving bi-histogram equalization (BBHE) [26] and minimum mean brightness error bi-histogram equalization (MMBEBHE) [27] divides the image histogram into two dynamic regions according to some statistically predefined thresholds (e.g., mean or median intensity levels), and performs equalization on each region.
Recursive histogram equalization techniques have also been proposed such as recursive sub-image histogram equalization (RSIHE) which employs multi-level partitioning, to enhance the dark as well as bright areas in an image. In contrast, recursively separated and weighted histogram equalization (RSWHE) adopts weighting functions that are used to reduce over-enhancement and noise artifacts [28].
In recursive sub-image weighted histogram equalization (RSWHE), the image histogram is recursively partitioned into sub-histograms and equalized independently. The transformation function is defined based on weighted cumulative distribution functions (CDFs):
The Adaptive Gamma Correction with Weighting Distribution (AGCWD) method [29,30,31] implemented in TOFR-VET utilizes a weighting distribution to refine brightness enhancement while preserving structural details. The weighted probability density function () is defined as
where and are the maximum and minimum probabilities in the original image, and is the smoothing parameter, which was empirically set to 0.5 for this 120-subject cohort to balance contrast and natural appearance. The adaptive gamma parameter () is derived from the weighted cumulative distribution function () as
The final intensity transformation is then calculated as
This formulation ensures that the enhancement is dynamically adjusted based on the local luminance of the vascular structures, preventing the over-saturation common in global histogram equalization.
Another BHE hybrid algorithm was also implemented. Before global histogram equalization, the above method utilizes bilateral filtering to suppress noise while preserving vessel edge [32].
We have implemented all enhancement algorithms in the same processing framework in order to make a fair comparison. A summary of the basic contrast enhancement methods with their underlying strategies and attributes related to brightness preservation is given in Table 1.
Table 1.
Overview of the different enhancement techniques utilized in this study, along with corresponding brightness preservation factor (BPF) values calculated across all examined datasets.
2.3. Quantitative Image Quality Evaluation
Five quantitative image quality measurements were also derived from the original and enhanced images for an objective comparison of enhancement methods. We used PSNR [15] and SSIM [16] to measure the fidelity and spatial correspondence between enhanced images and original ones. The information content and textural variation were quantified using entropy. In addition, contrast improvement index (CII) [17] evaluated the increase in contrast due to enhancement, and brightness preservation factor (BPF) [18] measured how much original mean signal intensity was preserved after enhancement.
All the metrics were performed online in the GUI to enable direct comparison between enhancement methods on all datasets. Table 2 shows the overview of the employed image quality metrics, including mathematical expressions and application purpose.
Table 2.
Image quality metrics used for quantitative evaluation of enhancement performance.
PSNR and SSIM are full-reference similarity metrics computed between the enhanced image and a reference image. In this study, the original TOF-MRA image is used as the reference baseline to quantify how strongly each enhancement strategy alters fidelity and structural content relative to the unprocessed acquisition. Because enhancement methods intentionally reshape intensity distributions and may change local contrast, PSNR/SSIM are not interpreted here as absolute indicators of diagnostic image quality; rather, they are reported as structural deviation indicators that support controlled, method-to-method comparison within the same dataset.
2.4. Radiomic Feature Extraction
First-order and GLCM-based texture features are widely used in medical imaging to characterize intensity patterns and spatial relationships, providing interpretable descriptors for quantitative image analysis. In addition to qualitative and common quantitative assessment methods, radiomic feature analysis was performed for measuring the differences in image appearance induced by enhancement techniques. First-order histogram descriptors were used to capture intensity-based statistical properties, while texture characteristics were determined using gray-level co-occurrence matrix (GLCM) analysis to quantify spatial relationships between pixel intensities (e.g., contrast, homogeneity, and correlation) [19,20,21]. These features were computed for both original and enhanced images in order to evaluate the effect of enhancement procedures on these quantitative image descriptors which can be relevant to the downstream analysis tasks. Radiomic feature extraction process in the current study is described in Figure 1; this includes definition of regions-of-interest (ROI) within vascular structures followed by extraction of intensity- and texture-based features [33]. This enables a reproducible and consistent quantitative characterization of image quality after enhancement.
To determine which specific enhancement methods differed significantly from one another, post hoc analysis was performed using Tukey’s Honestly Significant Difference (HSD) test following the one-way ANOVA. This approach was selected to control the family-wise error rate and provide a rigorous pairwise comparison across the eight enhancement strategies. Statistical significance for all post hoc comparisons was maintained at p < 0.001 to ensure the robustness of the findings across the 120-subject cohort.
2.5. Software Implementation
Image loading, image enhancement, quantitative assessment and radiomic feature extraction was all embedded in a MATLAB-based application programmed by App Designer into one process module. Most implementation was done using the MATLAB App Designer, and has not been started for GNU Octave due to the fact that the graphical overhead relies extensively on MATLAB-based functionality. The graphical interface was split into modular tabs for the enhancement, evaluation and analysis parameters that allowed the user to interactively apply algorithms and images without programming.
This integrated approach allowed unified processing across datasets and reproducible evaluation of enhancement strategies in controlled conditions. The TOFR-VET framework is illustrated in Figure 2 as the graphical user interface (Figure 2A) and the workflow diagram (Figure 2B) undertaken during exposure. This would involve loading a TOF-MRA volume with the dimensions of 7 T along with ordinal metrics to detect vessel enhancement, the calculation of five quantitative measures used to evaluate fidelity, and radiomic feature extraction. This means that all the steps in their pipeline are integrated, allowing reproducible and comparable analysis summaries across datasets.
3. Results
3.1. Visual Assessment of Enhancement Performance
Representative axial slices of 7 T TOF-MRA images acquired pre- and post-enhancement with each method are shown in Figure 3B; here, the original slice is presented together with the corresponding enhancement outputs for a direct and clear comparison. The original images have low vessel-to-background contrast, especially in peripheral regions. Standard histogram equalization (HE) enhances global contrast at the cost of brightness distortion and background noise enhancement. This is similar to bi-histogram type techniques (for example, BBHE and MMBEBHE) that look for local redistribution of intensity while preventing global brightness modifications. Other contrast distribution adjustments use controlled brightness behavior, such as adaptive and recursive methods (Recursive Sub-Image Histogram Equalization [RSIHE], Random-Switching Window Histogram Equalization [RSWHE], or Adaptive Gamma Correction with Weighting Distribution [AGCWD]). Global scale visual difference is subtle and, thus, interpretation goes along with quantitative metrics for image quality.
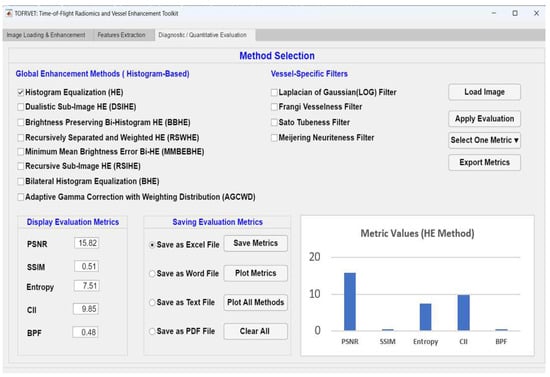
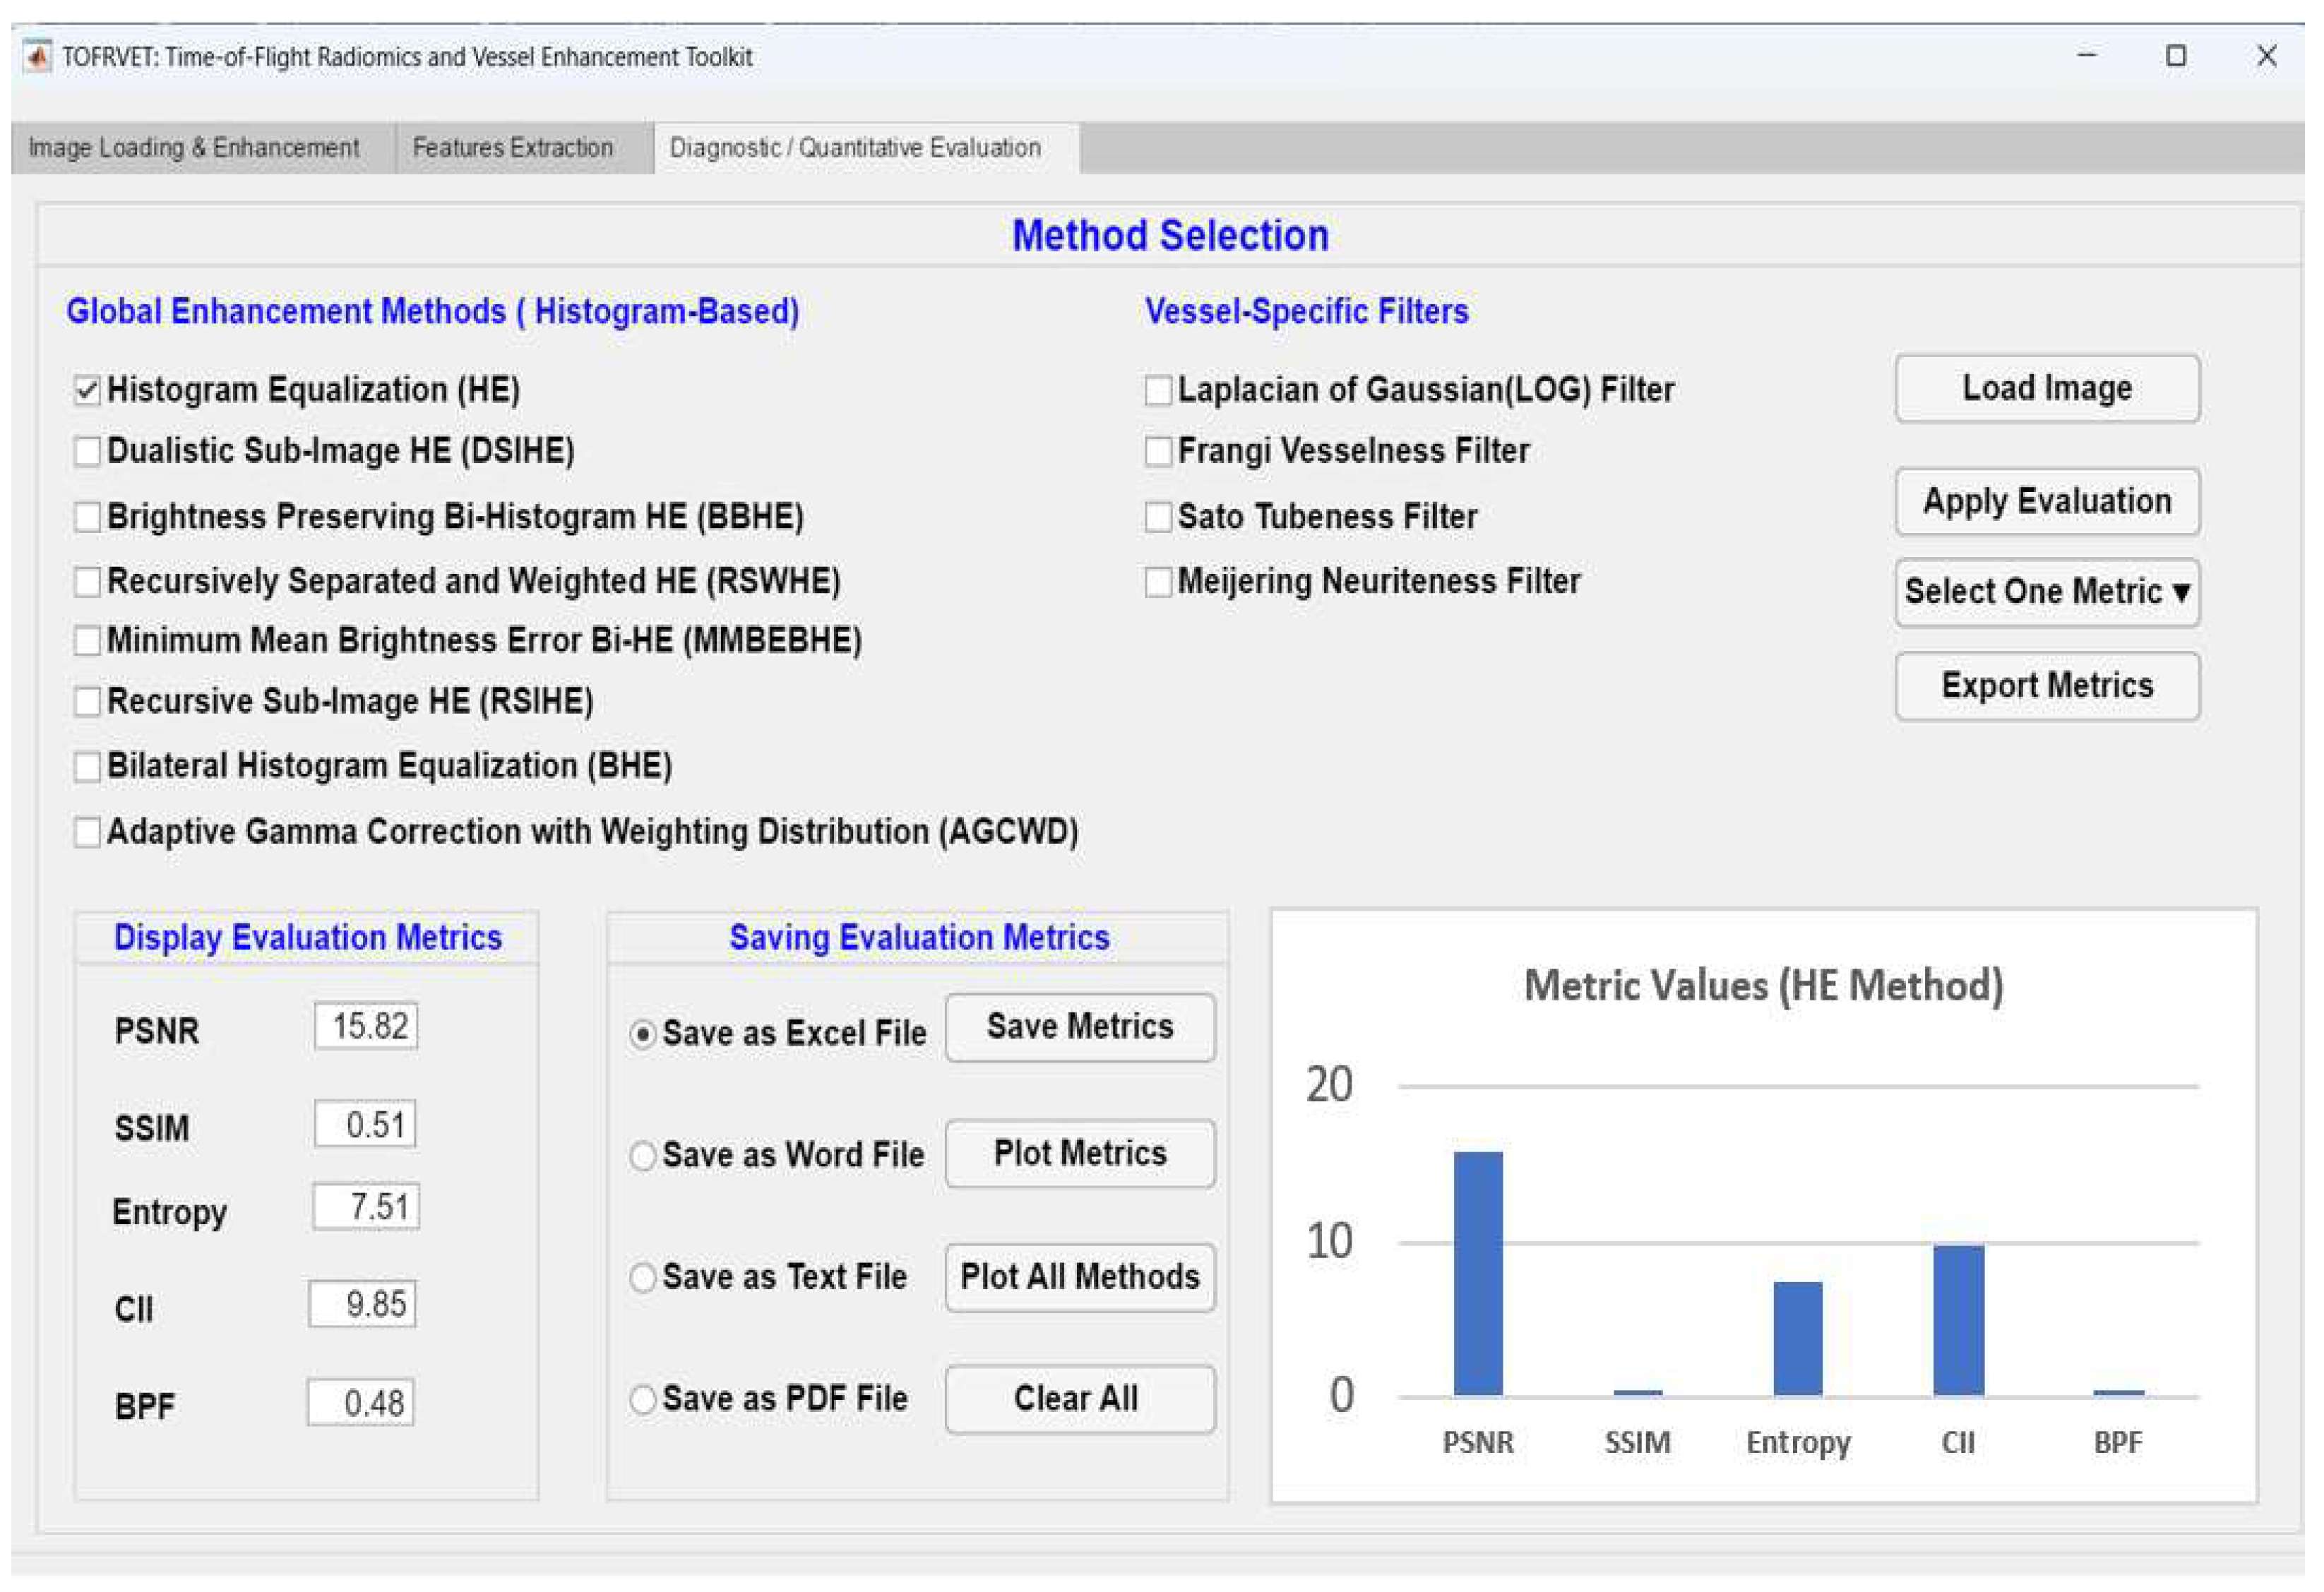
To this end, the effect of standard HE is illustrated in Figure 4 as a baseline. However, even though HE reduces background noise and highlights larger blood vessels, it also enhances the background and affects brightness distribution. These observations drive enhancement strategies aiming to balance contrast redistribution and brightness preservation. Overall, both Figure 3A and Figure 4 qualitatively highlight the distinct behaviors of global, bi-histogram and adaptive enhancement approaches. Since visual differences between methods can be subtle and display-dependent, we intend Figure 3B as a representative comparison but rely on quantitative image quality metrics as the foundation for performance evaluation.
Figure 4.
Demonstration of contrast improvement by standard histogram equalization (HE), with accent on the brightness deviation effect and background enhancement.
3.2. Comparative Performance Analysis of Enhancement Methods
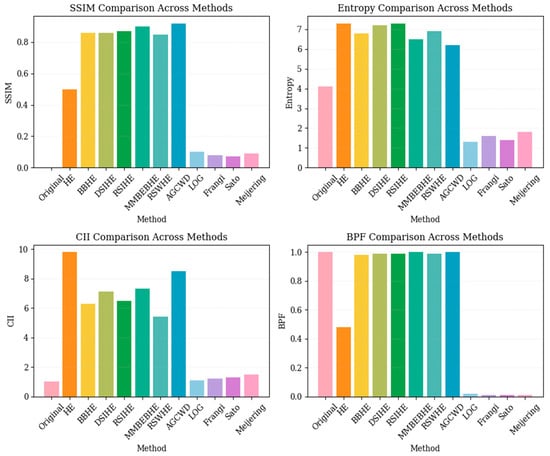
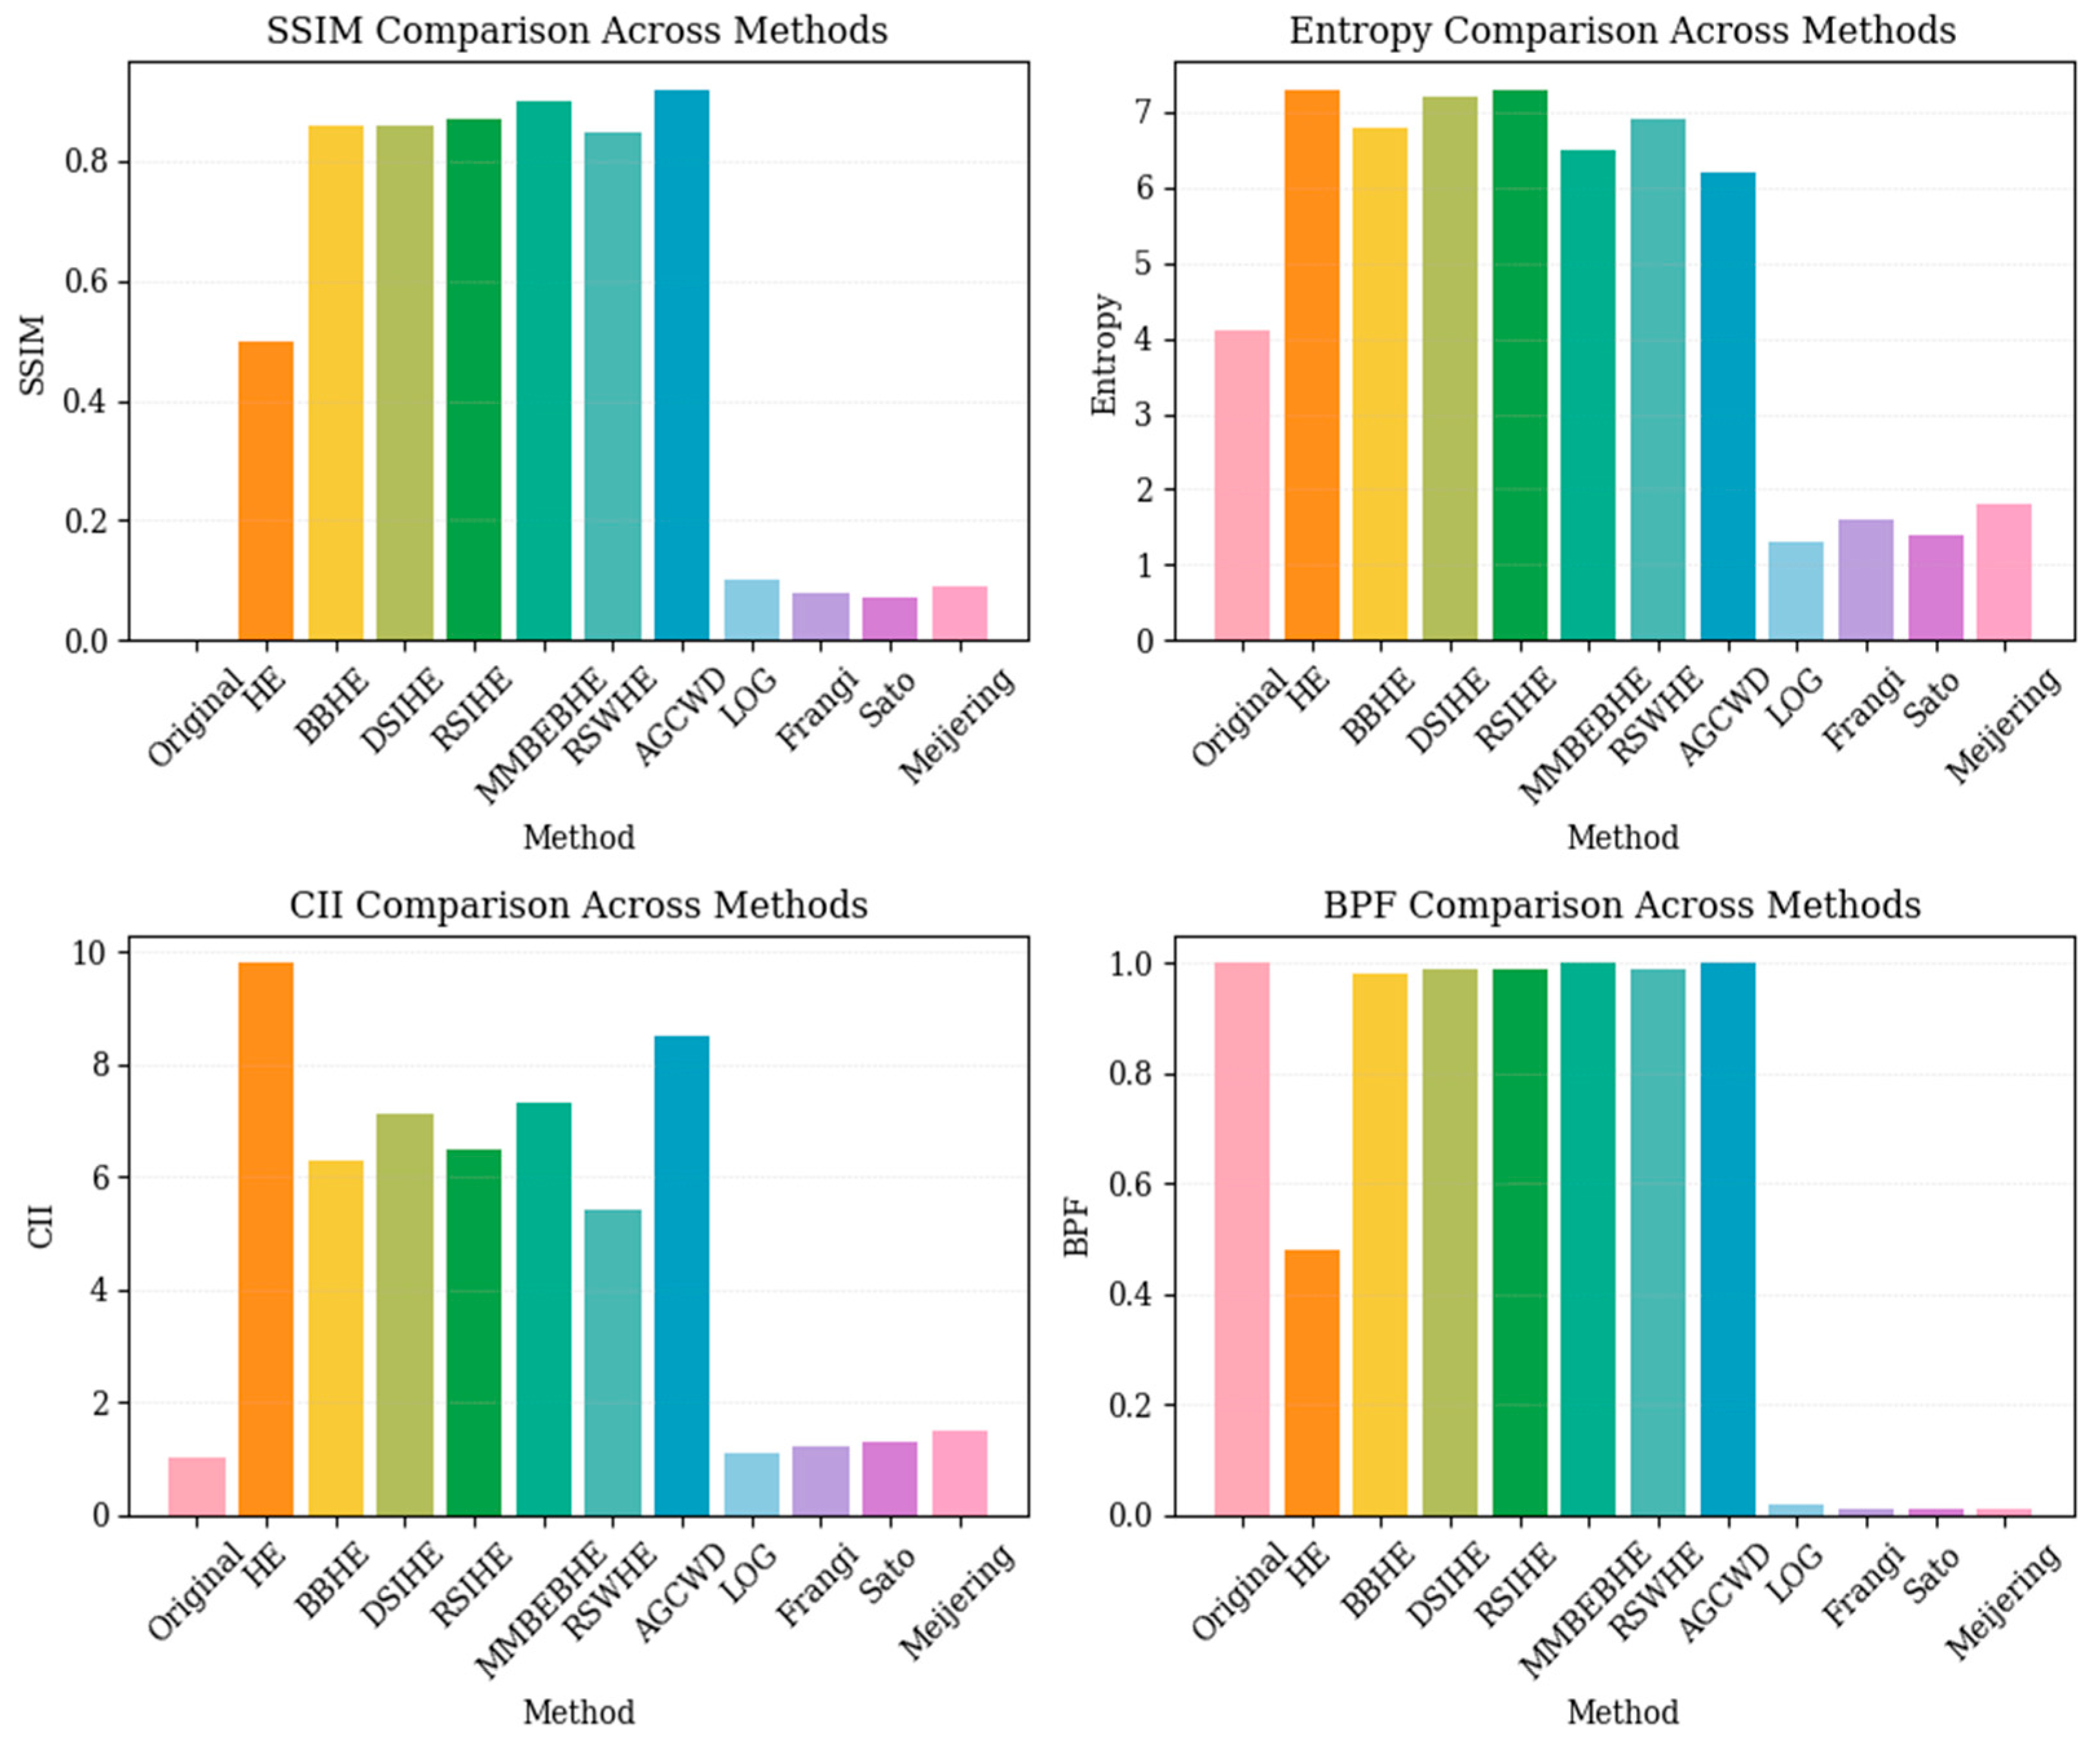
Objective image quality measures were computed to quantify the performance of all enhancement schemes. Quantitative metrics were calculated at the subject level using representative slices extracted from each TOF-MRA volume. Consequently, the reported statistics are based on data from n = 120 subjects instead of individual slices. Figure 5 provides a summary of the comparative behavior of enhancement methods under evaluation in terms of objective image quality metrics such as SSIM, entropy, CII, and BPF. These metrics enable thorough evaluation of contrast enhancement, spectral preservation, and brightness conservation for the full set of evaluated enhancement techniques and filter-based, vessel-specific methods. The quantitative results are shown in Table 3 for the PSNR, SSIM, entropy and contrast improvement index (CII), and brightness preservation factor (BPF) [34] obtained in both original and enhanced image.
Figure 5.
Comparative evaluation of image quality metrics (SSIM, Entropy, CII, BPF) across enhancement methods. Bar colors represent different methodological categories: original image (pink), standard histogram equalization (orange), sub-histogram based methods (yellow/green), adaptive gamma correction (blue), and vessel enhancement filters (purple/light pink).
Table 3.
Comparative evaluation of image quality metrics for original and enhanced 7T TOF-MRA images across the n = 120 cohort. Values are presented as Mean ± Standard Deviation. Statistical significance was determined using one-way ANOVA followed by Tukey HSD post hoc testing, with significance set at p < 0.001.
The results of the histogram-based enhancement methods -HE, DSIHE, BBHE, MMBEBHE, RSIHE, RSWHE, AGCWD and BHE are shown using uniform axial slices under the same visualization setting in order to be able to compare them reliably. Subtle visual differences appear and are resolved in conjunction with quantitative metrics shown in Table 3.
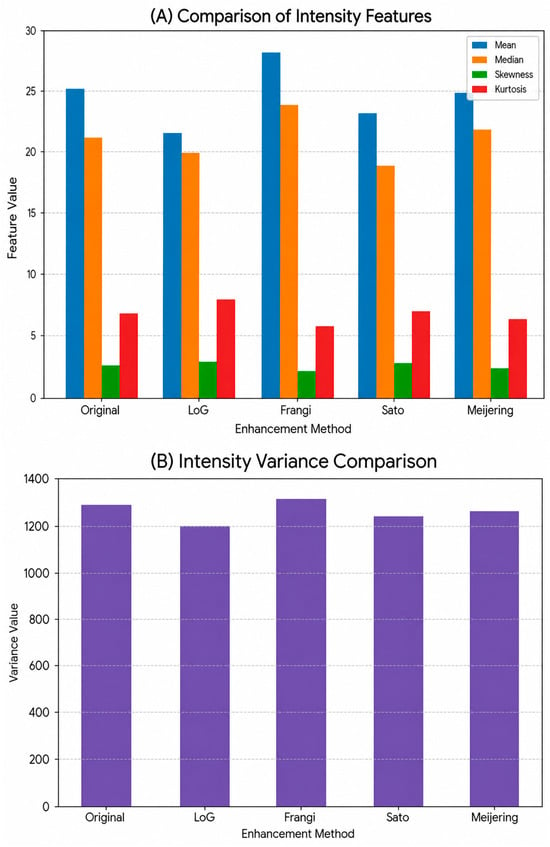
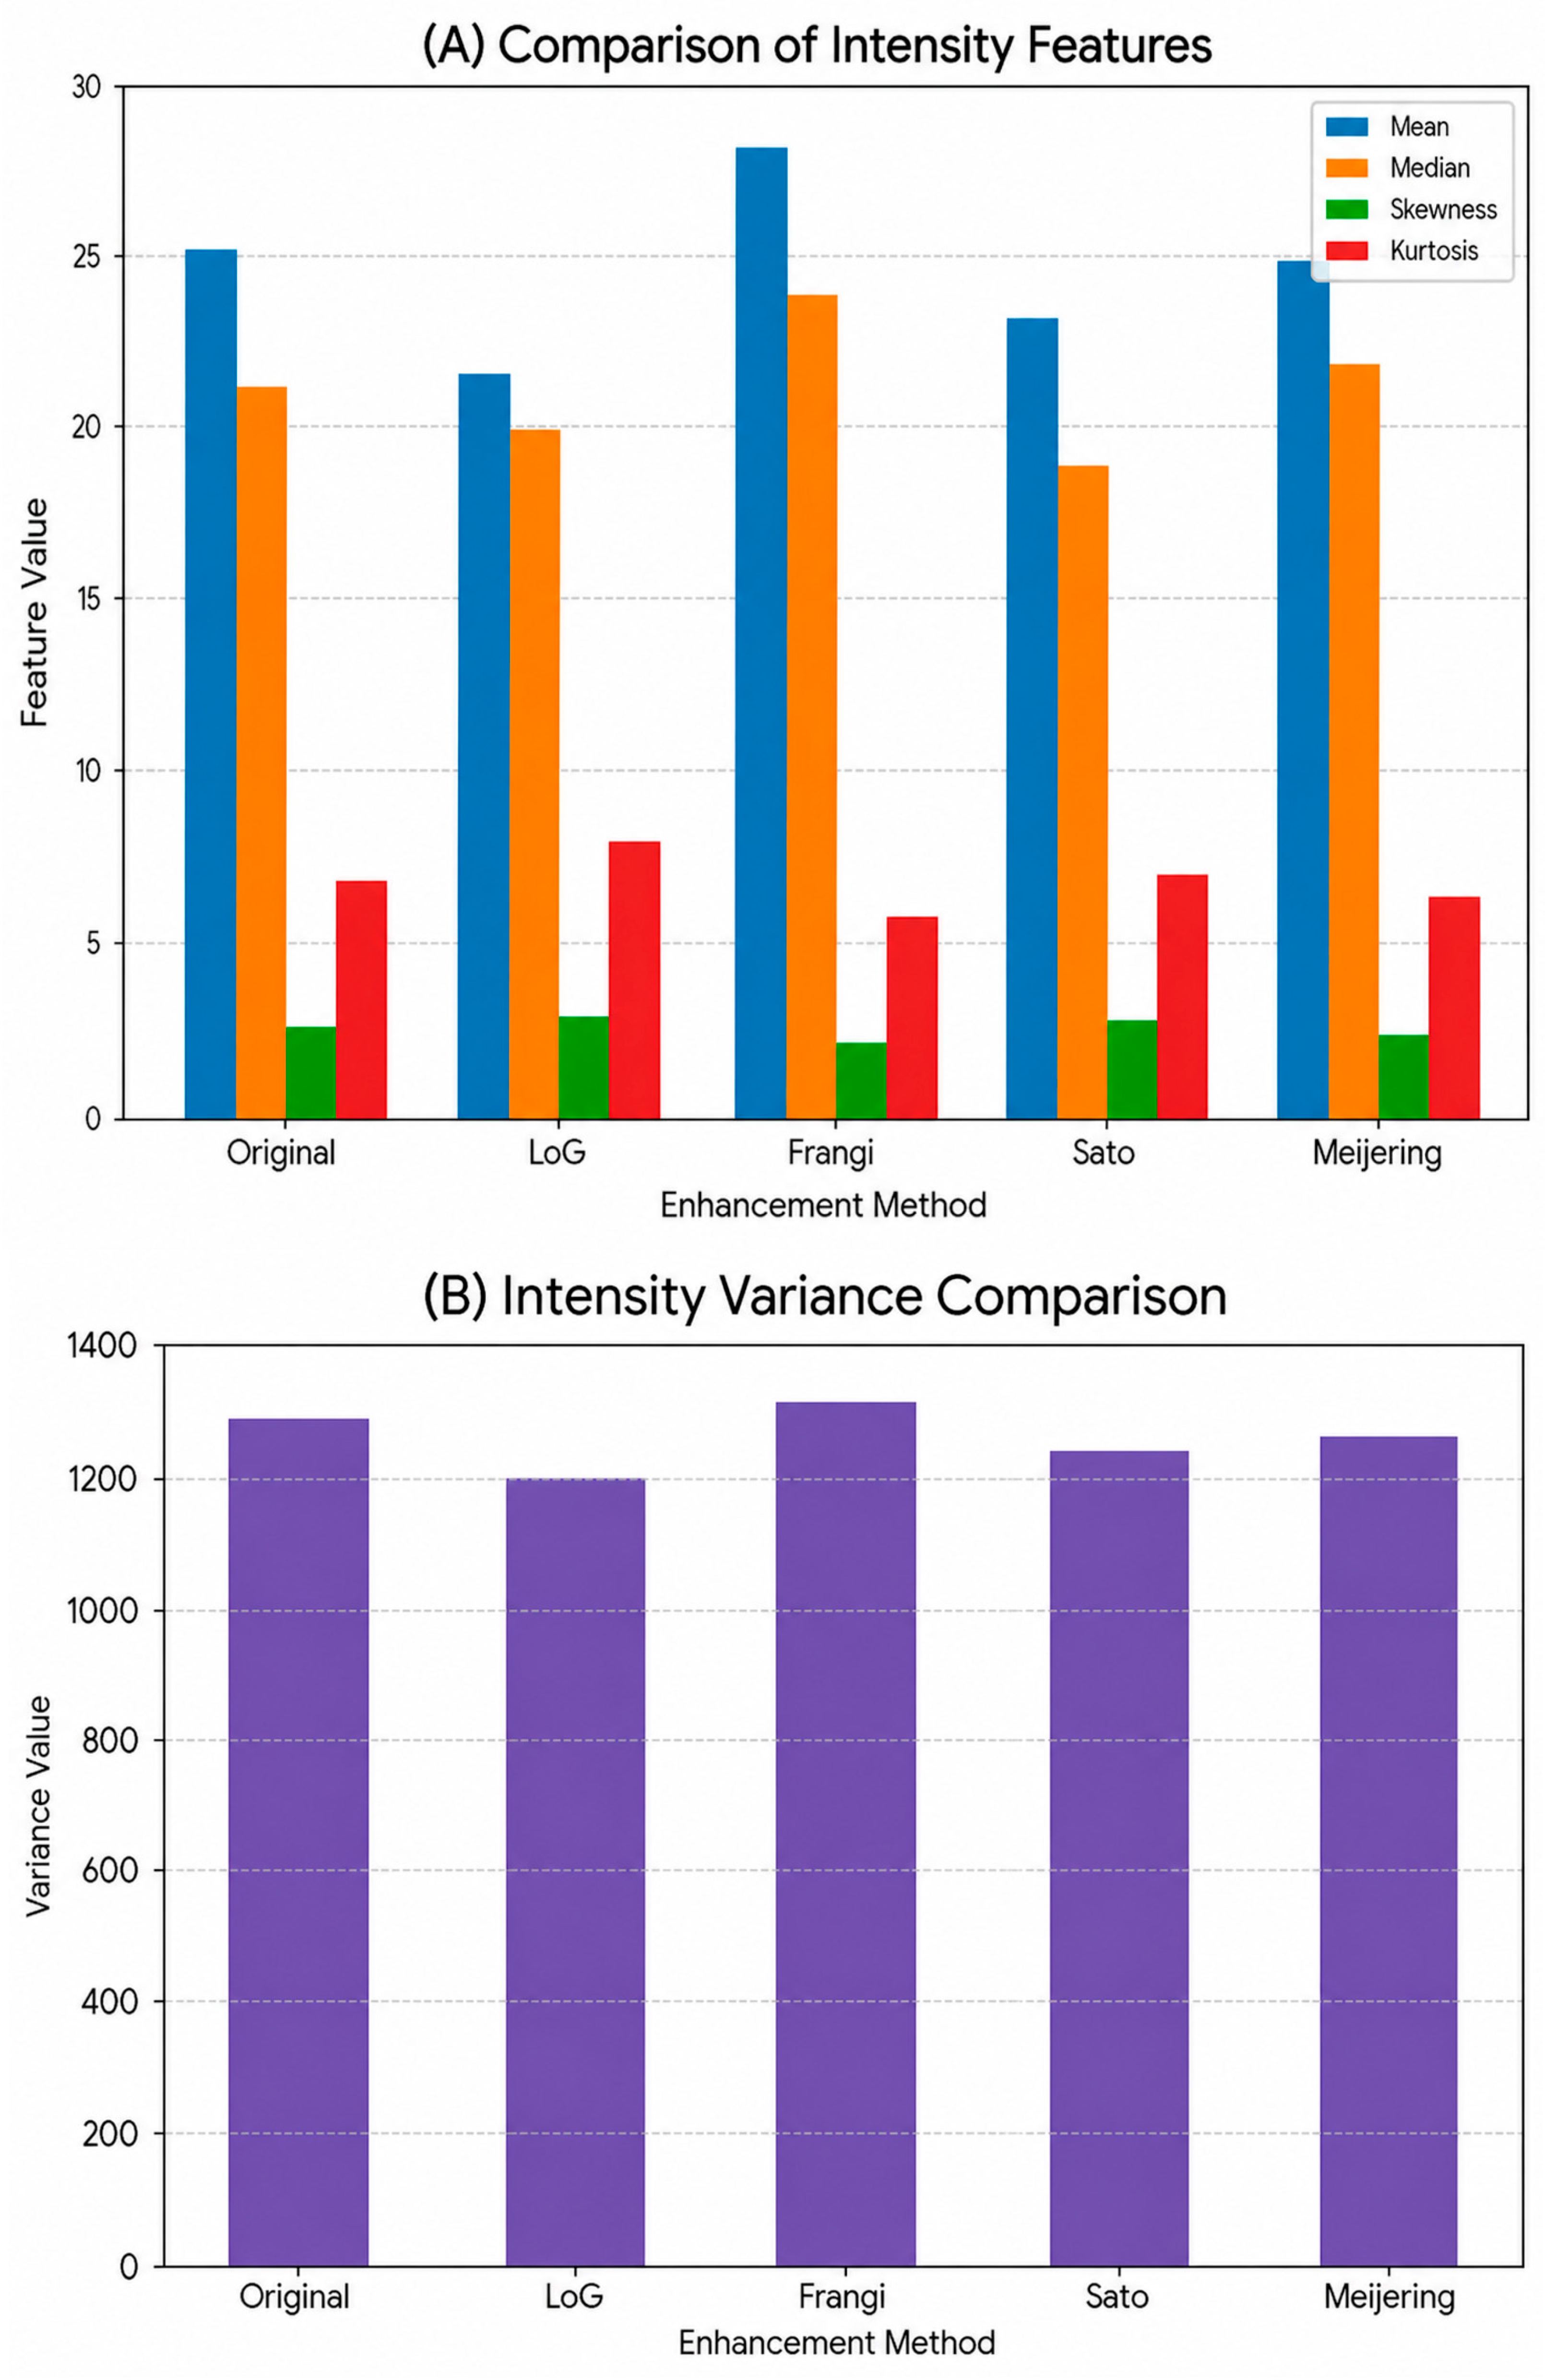
For clarity of presentation, variance is plotted separately in Figure 6B from the other first-order statistics because its ordered range of values numerically exceeds those for all other first-order statistics; comparison with the absolute differences in distribution skewness and kurtosis shown in Figure 6A would risk obscuring these relative difference comparisons.
Figure 6.
First-order intensity feature comparison across enhancement methods. (A) Mean, Median, Skewness, and Kurtosis values extracted from vessel ROIs. (B) Intensity Variance displayed separately due to its substantially larger numerical range.
As can be seen in Table 3, CII of all the enhanced images are higher than that of the originals, which confirms that contrast is effectively improved by these enhancement techniques. Although it has strong intensity contrast enhancement for the standard HE, its BPFs are smaller, indicating that the brightness level is greatly deviated from that of the original images. BH-based approaches, in particular BBHE and MMBEBHE, show a more balanced performance where mild-to-high contrast enhancement is achieved together with slight average intensity preservation. AGCWD exhibited increased structural fidelity relative to the original image baseline according to PSNR and SSIM values. This indicates lower structural deviation from the raw acquisition, rather than implying superior visual quality, compared with other enhancement methods. In other words, larger PSNR and SSIM values suggest less of a structural difference from the original image, not necessarily a better quality for the angiographic image itself. Vessel enhancement techniques (e.g., Frangi or Sato Filtering) can intentionally reduce global similarity metrics while enhancing vessel visibility. Therefore, a lower PSNR and SSIM scores for these methods are not indicative of less performance, but rather a greater change when compared to the baseline image.
PSNR for AGCWD was significantly higher than standard histogram equalization (HE) across subjects (n = 120), with mean ± SD PSNR of 23.54 ± 1.62 dB versus 15.82 ± 1.25 dB. A one-way ANOVA performed on the PSNR and SSIM values across the n = 120 cohort confirmed that the differences between enhancement methods are statistically significant (F(7, 952) = 142.3, p < 0.001), indicating that the performance variations are not due to random fluctuations.
The behavior of selected first-order radiomic intensity features derived from the vessel ROIs after enhancement based on histograms is demonstrated in Figure 6. Since those features mostly represent intensity redistribution, only histogram-based enhancement schemes are included. For improved clarity, variance is presented separately following Figure 6B, due to its substantially larger numerical range compared with the other first-order statistics shown in Figure 6A.
Values are expressed as mean ± standard deviation across the cohort (n = 120). Statistical significance was assessed using one-way ANOVA followed by Tukey HSD post hoc testing to evaluate differences between enhancement methods. Statistical significance was defined as p < 0.001. Bold values indicate the highest metric performance achieved for each quantitative measure.
The separation prevents variance from dominating the visualization and enables interpretable comparison of lower-magnitude features such as skewness and kurtosis across enhancement methods.
In particular, AGCWD produced an average SSIM value of 0.912 and a PSNR of 23.54 dB versus the results obtained with standard HE (0.513, 15.82 dB for SSIM and PSNR respectively). Compared with vessel-specific filtering methods (LoG, Frangi, Sato and Meijering), PSNR values decreased to ∼8 dB and SSIM values dropped below 0.11, suggesting a trade-off between aggressive vesselness filtering and global structural fidelity with respect to the original image.
Brightness-preserving methods such as AGCWD, RSWHE, and BHE had consistently high BPF values nearing unity (0.96–0.98), corroborating their grouping as high-fidelity enhancement strategies in Table 1. These metrics together provide further confirmation that the enhancement performance can be characterized more reliably by quantitative measures of deviation than visual inspection alone.
3.3. Radiomic Feature Analysis
To assess the stability of the extracted radiomic signatures, twelve key features comprising intensity, texture (GLCM), and shape descriptors were evaluated across the cohort of 120 subjects. As shown in Table 4, the AGCWD enhancement maintained high feature fidelity relative to the original images. The Intraclass Correlation Coefficient (ICC 2,1) remained in the ‘Excellent’ range (>0.87) for all features, confirming that the TOFR-VET pipeline improves image quality without significantly distorting the underlying biological texture information.
Table 4.
Radiomic feature stability analysis across the n = 120 cohort for original and enhanced (AGCWD) 7T TOF-MRA images. Values are presented as Mean ± Standard Deviation. Stability is quantified using the Intraclass Correlation Coefficient (ICC 2,1), where ICC > 0.87 indicates excellent stability. Statistical significance for feature variance across the cohort was confirmed at p < 0.001.
Radiomic features were used to quantitatively evaluate the effect of image enhancement techniques on vessel-related descriptors computed within a predefined region-of-interest (ROI-1) that represents the left vessel cluster. The feature extraction includes intensity-based statistics, texture based on Gray Level Co-occurrence Matrix (GLCM), and low-level shape features, enabling a comprehensive assessment of changes introduced by enhancement methods.
Radiomic measurements were calculated on a fixed background region-of-interest (ROI-1) corresponding to the left vascular group. To allow for stable comparison, the area and location of ROI was constant across all tested methods. Nevertheless, the segmentation of vessels in the ROI depends on local intensity contrast and edge definition, which suggests that enhancement algorithms may slightly change the number of pixels considered as vessel structures. Therefore, geometric descriptors like area, perimeter, and circularity can vary depending on the employed enhancement method even if the ROI contour itself does not change. Although a static ROI was used to allow for consistent regional comparisons across enhancement modalities, this approach did not take into consideration the spatial heterogeneity present in the vascular tree. As a result, it limits the generalizability of the radiomic findings. Future work incorporating multi-ROI or whole-volume analysis would improve spatial representativeness and generalizability.
As for enhancement methods, Table 4 shows the computed radiomic feature values of ROI-1. Results show that there are intensity-based features, including mean, variance, skewness and kurtosis, which are sensitive to enhancement techniques where the pixel intensity is varied. As a result, some of the variability seen in radiomic features could be due to dependence to segmentation caused by enhancement instead of all intrinsic intensity or texture changes. Furthermore, the study did not calculate quantitative measures of feature variability such as coefficient of variation or Intraclass Correlation Coefficients. This limitation restricts the assessment of the reproducibility of radiomic features. Not all enhancement strategies increase first-order dispersion; for example, LoG filtering reduced variance relative to the baseline (Table 4), consistent with suppression of background fluctuations and homogenization of intensities. In the present methodological context, such variance reduction can be beneficial for stabilizing segmentation and reducing noise-driven variability, but it may also attenuate real intensity heterogeneity; therefore, variance shifts are interpreted as variability to preprocessing rather than as direct evidence of clinical improvement. However, this interpretation is limited in scope without quantitative noise analysis and comparison against ground truth, and as such should be considered an indication instead of conclusive evidence.
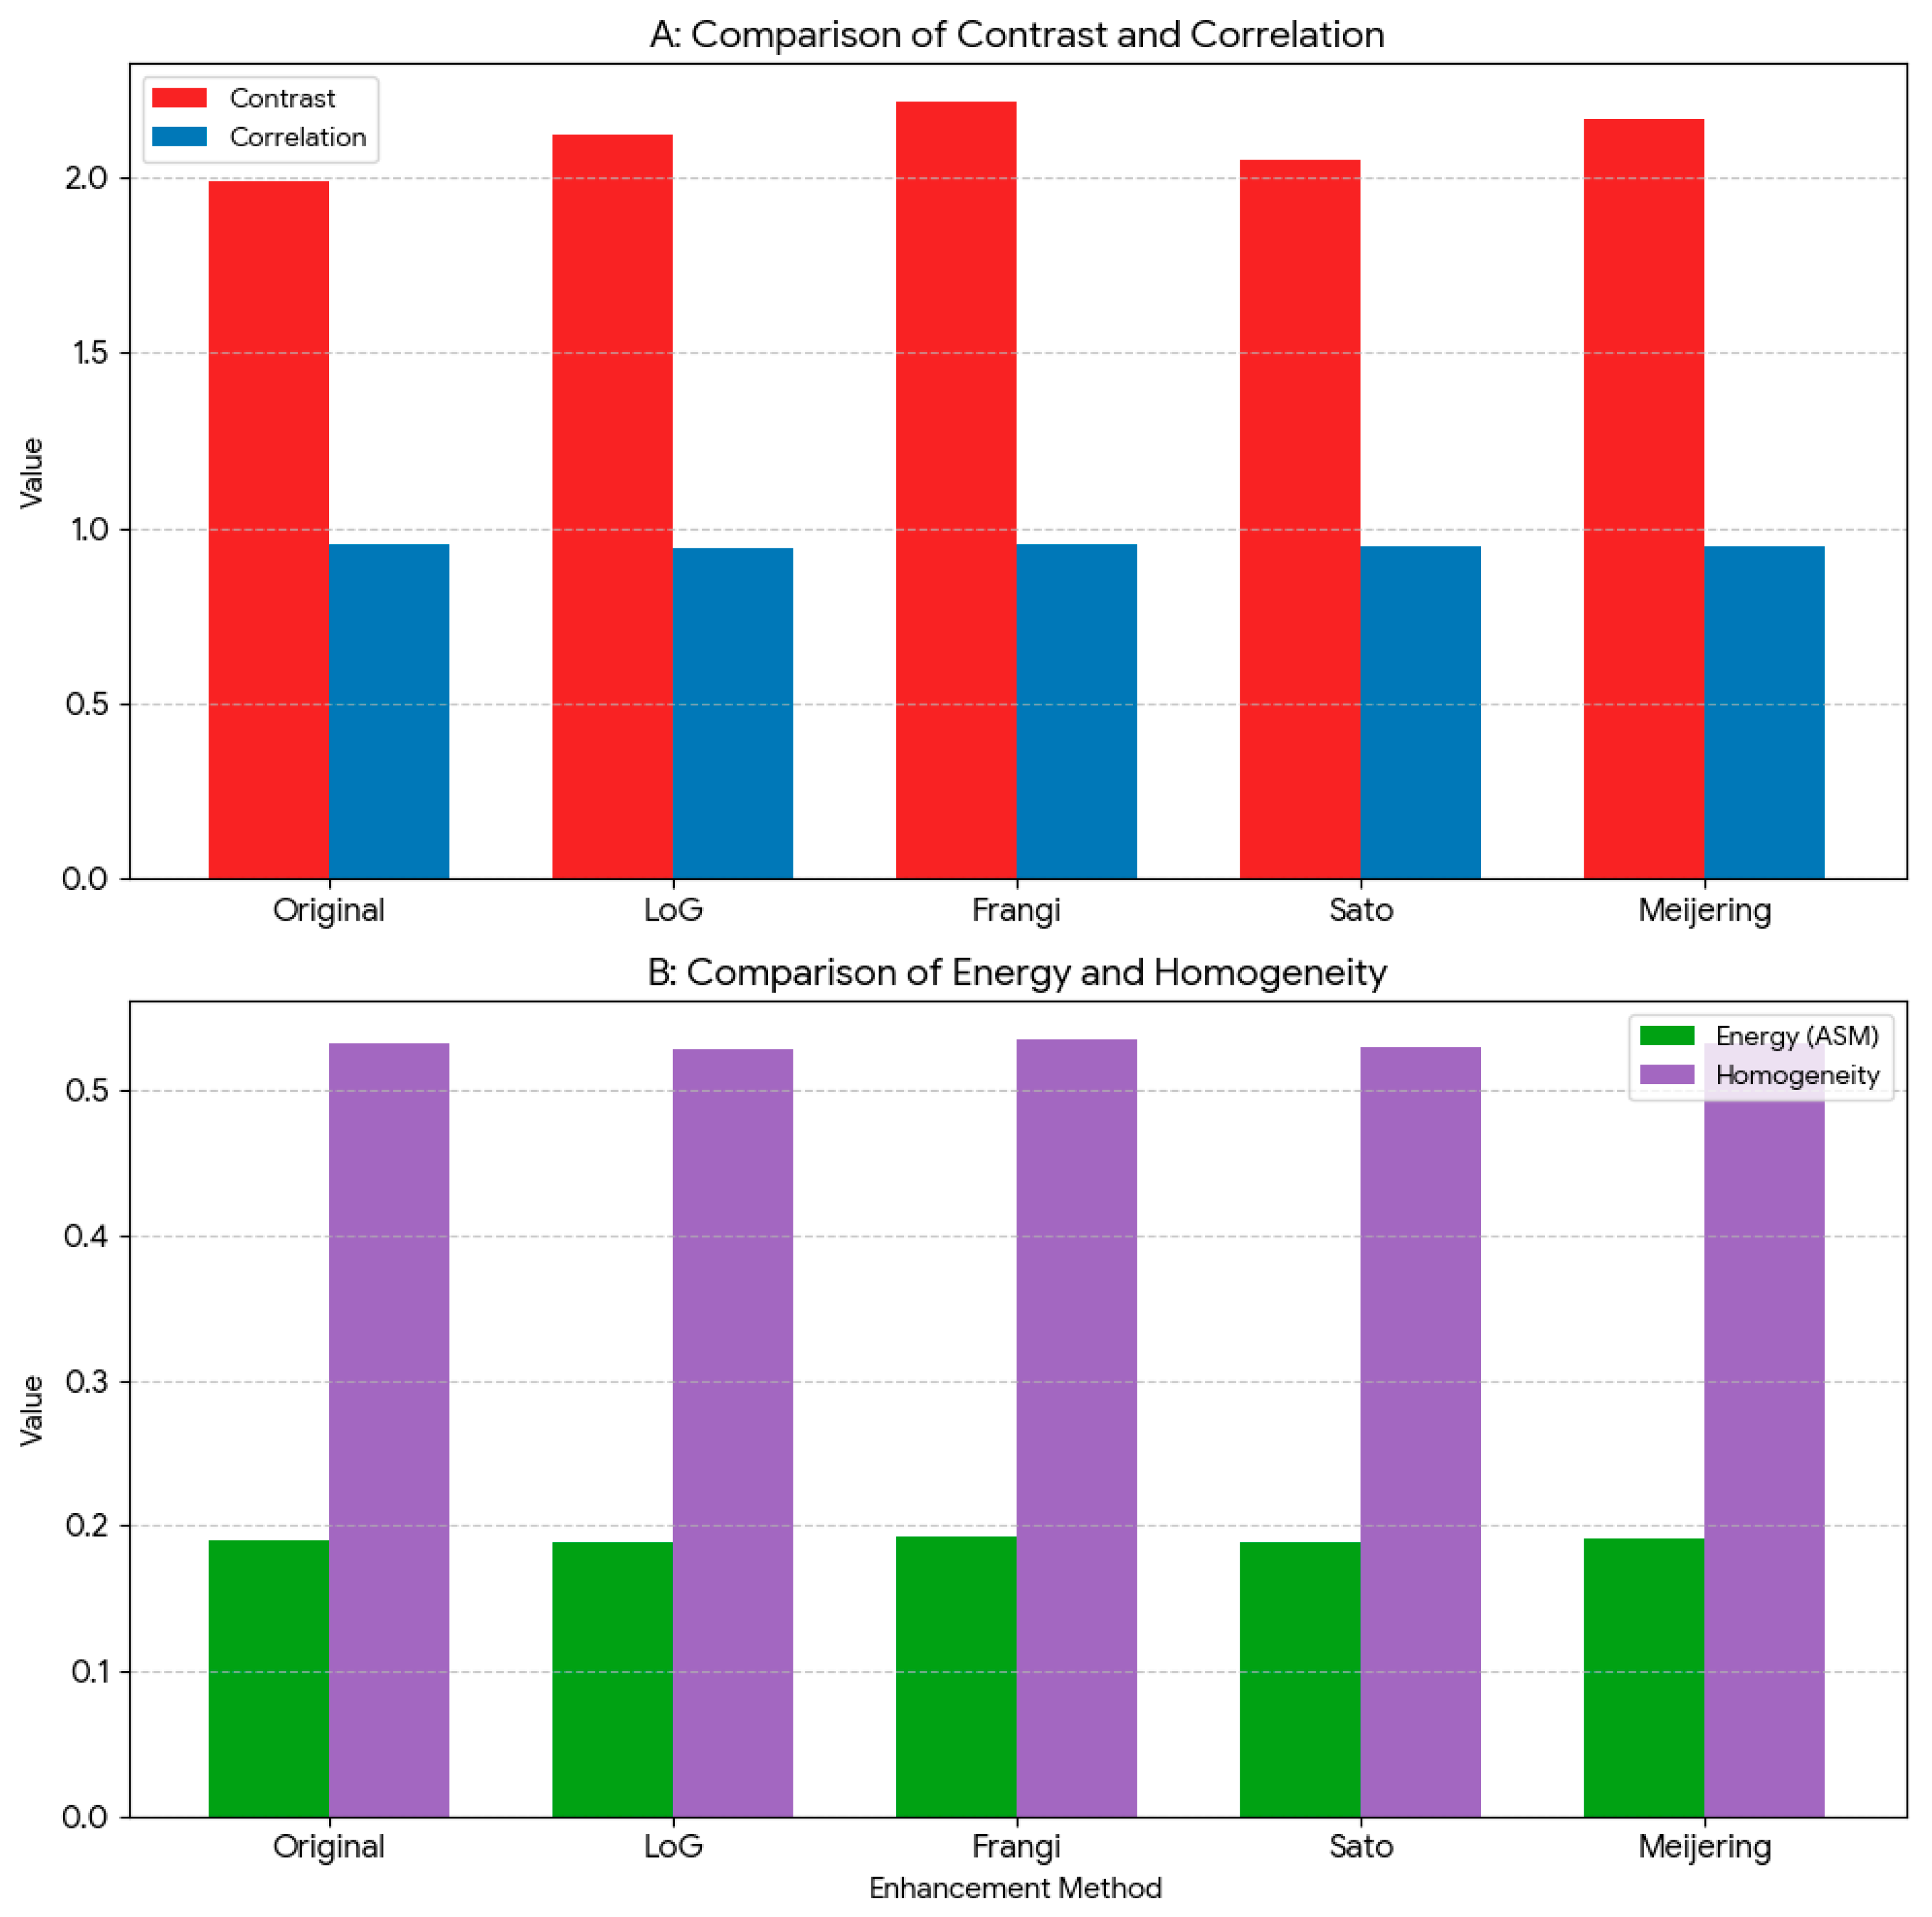
When texture features based on GLCM analysis, e.g., contrast, correlation, angular second moment (energy), homogeneity are examined, the values of these features also vary with the enhancement method applied. Methods that highlight edge details and local contrast enhance the GLCM contrast while simultaneously decrease homogeneity. In contrast, by taking brightness preservation and noise suppression into consideration, the texture changes are relatively slight. This reflects the subtlety of promoting as well as preserving vascular structures.
A key observation across methods was that shape-based parameters displayed relatively less variation within the fixed ROI. But differences were still observable, like in area and perimeter. Thus, this behavior should not be construed as robustness (especially since segmentation effects were not explicitly controlled for and statistical variability measures were not calculated). Furthermore, to assess the reproducibility of radiomic descriptors following enhancement, we calculated the Intraclass Correlation Coefficient (ICC 2,1) for the n = 120 cohort. As shown in Table 4, key features such as Energy, Entropy, and Correlation maintained ICC values >0.87, indicating that the TOFR-VET pipeline provides excellent feature stability. This suggests that the enhancement-induced variance is significantly lower than the preserved biological heterogeneity, addressing concerns regarding the distortion of quantitative descriptors.
The entropy was increased from 4.15 for the input image to >7.20 with all kernel-based histogram enhancements, which corresponds to a substantial increase in entropy relative to the original image. This increase is interpreted with caution, as it can partly arise from amplified noise. Similarly, CII could be enhanced to a value up to 9.85 for HE and the BP methods have BPF values close to unity (range: 0.97–1.00). Moreover, no explicit noise analysis was performed in this work. Thus, changes in entropy cannot be definitively attributed to increased structural detail vs. noise amplification.
3.4. Summary of Results
The qualitative and quantitative results integration suggests that no single enhancement method is best in all aspects. While global solutions offer strong contrast enhancement, adaptive ones that preserve brightness can provide a balance in improvements between vessel conspicuity, structure retention and radiomic stability. The variability of radiomic features to enhancement strategies highlight the importance of standardized and repeatable evaluations before integrating additional statistical analysis. Representative examples of the changes in selected radiomic features between the different enhancement methods are shown in Figure 7, which supports the objective numbers listed in Table 4.
Figure 7.
Comparison of texture (GLCM) features over enhancement methods. (A) High-range texture features (Contrast and Correlation). (B) Low-range texture feature (Energy and Homogeneity).
Because the numerical ranges of these features are significantly different, they are grouped in subpanels. Separation between objects prevents domination by scale and supports a visual understanding of enhancement method comparison.
4. Discussion
Ultrahigh-field 7-T time-of-flight (TOF)-MRA offers a higher spatial resolution for cerebrovascular imaging, but clinical application is often limited by non-uniform intensity and insufficient vessel-to-background contrast. In this work, we proposed a unified framework to evaluate vessel enhancement techniques in a consistent manner based on objective image quality measures and radiomic feature analysis. We interpret the observed results with the following discussion, where much more weight is put on methodological implications than on diagnostic performance.
Beyond the evaluation of individual enhancement techniques, the primary contribution of this work lies in providing a methodological framework for controlled comparison within a defined experimental setting for systematically assessing how preprocessing strategies influence quantitative descriptors in ultra-high-field TOF-MRA imaging.
4.1. Impact of Enhancement Techniques on Image Quality Metrics
As demonstrated by the higher CII values, Figure 6 demonstrates quantitatively that all enhanced methods lead to improved contrast compared with the original images. Nevertheless, the outcomes also reveal that there are trade-offs between increased contrast, structural faithful and brightness retention. Although utilized as a general and effective contrast enhancement method, standard histogram equalization tends to introduce brightness distortion and noise magnification. This result is consistent with previous observations on the limitations of global enhancement methods.
Hence, the observed increase in PSNR and SSIM for AGCWD indicates a less structural difference between the original image and AGCWD compared to other techniques instead of superiority from an angiographic point of view. Vesselness filters, in comparison, may produce smaller similarity metrics but also clearly enhance the visibility of vascular networks. This embodies an important trade-off between preserving global similarity and emphasizing vascular features, evidently reliant on the task at hand.
Conversely, those based on bi-histogram and adaptive techniques (i.e., BBHE, MMBEBHE, RSWHE, AGCWD) seem to provide a balance between improving contrast, maintaining brightness, and minimizing structural distortion compared to the original image reference (PSNR/SSIM), consistently compared with the baseline established with respect to the original image. So, these findings highlight that aggressive contrast enhancement, in isolation, is inadequate to maintain controlled fidelity and brightness preservation compared against objective image quality metrics.
Regarding parameter selection, optimal settings for each enhancement method were determined through a heuristic grid-search approach, targeting a balance between the contrast improvement index (CII) and the brightness preservation factor (BPF). For adaptive methods, the clip limit and tile size were iteratively adjusted to maximize vascular contrast while minimizing the noise floor. While this study focuses on the comparative performance of established histogram-based and adaptive frameworks including CLAHE, which served as a primary baseline for adaptive enhancement, we acknowledge the absence of direct benchmarking against recent deep learning-based enhancement approaches. Such a comparison was beyond the current scope, as our primary goal was to establish a foundational, non-black-box toolkit that operates reliably across standard clinical datasets without the need for extensive training data or high-end GPU resources.
An example of such studies, namely those that focus on ultra-high-field 7 T TOF-MRA, have alluded to the inherent compromise between contrast enhancement vs. brightness fidelity seen at higher field strengths due to increased B1 inhomogeneity and background signal variation. Recent studies of 7 T intracranial TOF-MRA, for example, have shown that when using global contrast enhancement approaches, the conspicuity of the vessels can be significantly improved at high field strength; however, it usually comes at a cost to intensity nonuniformity and noise amplification over all image volume [1,7]. These observations are consistent with those noted in the current study, which show standard histogram equalization being very effective in terms of contrast-related metrics but having a high brightness distortion cost, whereas brightness-preserving methods getting better intensity consistency but not as much contrast improvement. Through objective image quality metrics, we provide a quantitative characterization of this trade-off that validates and extends recent findings for the need of balanced enhancement strategies in ultra-high-field angiographic imaging.
In addition to qualitative depictions of vessels, recent work in 7 T MRI increasingly employed quantitative assessment frameworks (e.g., radiomic and texture-based analyses) that seek to evaluate downstream consequences of preprocessing decisions [19,22,35]. Yet most existing studies focus on either acquisition strategy or segmentation performance, or they address selected indicators of image quality independently, frequently within the context of limiting how enhancement behavior correlates with variations in quantitative features. In this context, the TOFR-VET framework builds on ongoing ultra-high-field imaging investigations by incorporating enhancement, objective image quality assessment, and radiomic feature analysis into a unified proposed methodological framework for consistent analysis. The results of our study show that first-order and texture features are affected by intensity redistribution resulting from enhancement, consistent with recent observations stressing the dependency of radiomic descriptors on preprocessing at high field strengths [19,22]. These outcomes emphasize the importance of technical assessment framework in the application of radiomics to 7 T angiographic data, and position TOFR-VET as a methodological framework for comparative assessment of enhancement strategies, rather than an alternative to improvements in acquisition- or learning-based methods.
It is worth noting that the quantitative assessments utilized in this study—PSNR, SSIM, entropy, CII, and BPF—operate on different numerical systems and emphasize various aspects of image properties. Hence, you cannot compare raw values between these metrics directly without normalization. Instead, these metrics should be treated as complementary proxies that aid a more holistic understanding of image quality. Nevertheless, PSNR and visual inspection on their own represent insufficient surrogate measures for noise characterization in a radiomics-focused setting. Likewise, aspects of contrast-based metrics CII and BPF show some redundancy with other intensity-based measures and are unable to address all dimensions of image quality independently but still provide insights into overall picture robustness. Thus, the selected metrics should be viewed together as complementary markers not isolated or absolute measures.
4.2. Variability of Radiomic Features to Enhancement Strategies
Radiomic analysis also demonstrated that the amplitude of quantitative image parameters is significantly affected by intensification. Table 4 reveals clear difference between enhancement methods in terms of first-order intensity features due to the redistribution of pixel intensities. Also, the texture features resulting from GLCM analysis change significantly due to the modified spatial intensity relationships brought by enhancement.
Notably, those enhancement techniques preserving the brightness and reducing noise produce more consistent radiomic features patterns. Comparatively, global or strong filtering-based methods are less consistent. These findings pose a challenge to radiomic analysis in that the level of enhancement is raised on the theory that features are indicative, but this draw-back also demonstrates their potential susceptibility to variability among quantitative approaches.
In our results, entropy values increased substantially (e.g., from 4.15 in the original to >7.2 after some enhancements). While this could indicate additional detail, it likely also reflects noise amplification, particularly for methods like standard HE that boost background intensities. We observed that enhancement techniques which preserve brightness and limit noise (such as adaptive histogram methods) yielded more moderate entropy increases and more consistent texture feature patterns. This suggests that a portion of the entropy gain in aggressive enhancements is due to noise rather than useful vessel information. In line with the reviewer’s insight, differentiating noise-induced entropy from true information gain is crucial. A qualitative check of background regions confirmed that methods with extreme entropy rise introduced visible noise, whereas adaptive methods maintained a clearer background. While an increase in entropy generally suggests higher information content, we acknowledge the reviewer’s concern that this can also reflect noise amplification. In the context of TOFR-VET, we mitigate this risk by evaluating entropy alongside SSIM and PSNR. Specifically, the AGCWD and CLAHE methods demonstrated a balanced increase in entropy while maintaining high SSIM scores (>0.87), suggesting that the information gain is localized to vascular structures rather than random noise. Furthermore, while PSNR and SSIM are calculated relative to the original 7 T signal in the absence of a manual gold-standard, they serve as essential mathematical constraints to ensure that the enhancement process does not introduce structural distortions or significant artifacts into the radiomic pipeline. For a rigorous analysis, one could examine the signal-to-noise ratio (SNR) in non-vessel regions; although not quantified here, our approach considers PSNR and visual inspection as limited indirect indicators rather than definitive measures of noise behavior, and entropy increases are interpreted cautiously due to the absence of explicit noise quantification. Also, interpretations of variance reduction should also be interpreted with caution. Lower variance could imply noise reduction, intensity homogenization, or possible loss of biologically rich structural variation. These factors cannot be separately identified without direct measurement of the noise at work. The absence of direct noise characterization, including the measurement of signal-to-noise ratios in surrounding areas, impedes the capacity to discern whether a structural enhancement is beneficial or whether noise is being amplified. Thus, increases in entropy need to be handled with care. Moreover, our current study does not include a comparison with learning-based enhancement methods which is an important avenue for future method development.
4.3. Implications for Reproducible Image Analysis
Together, the results emphasize the need for, and value of, standardized and repeatable enhancement assessment before performing quantitative image analysis. The proposed approach, by combining enhancement, image quality assessment and radiomic analysis in an all-in-one framework offers the possibility of a systematic comparison between preprocessing strategies requiring less reliance on subjective visual evaluation.
Rather than suggesting one magic best improvement approach, it encourages a judicious choice of enhancement strategies on the basis of well-defined criteria and application needs. This is critical in particular for research workflows relying on quantitative descriptors, where variability introduced during preprocessing could otherwise compromise reproducibility. The provided framework is a methodological tool for the systematic assessment of change or radiomic assessment, and its modular design allows straightforward extension to new datasets, regions-of-interest, or downstream analysis tasks where needed. Furthermore, this framework has not been validated with multi-center datasets, external cohorts and reproducibility study. Thus, it will not be widely applicable, nor clinically validated; its use is limited to assessing methodology under controlled experimental situations.
Performance Stratification and Boundary Case Analysis
In a stratified assessment of vascular regions, we observed that while AGCWD and CLAHE provided superior contrast for major intracranial segments (e.g., M1 and A1), their performance in distal peripheral branches was more constrained. In these distal regions, where the signal-to-noise ratio (SNR) is inherently lower at 7 T, the enhancement gain was less pronounced, and the sensitivity to noise floor fluctuations was higher.
Furthermore, we identified specific boundary cases associated with global histogram equalization and aggressive filtering. In instances of significant B1 inhomogeneity, global enhancement methods tended toward non-uniform results often over-enhancing central regions while providing insufficient contrast recovery in the periphery. Artifact analysis further revealed that excessive intensity redistribution in low signal regions could lead to noise amplification and ‘salt-and-pepper’ effects. These results emphasize that a static enhancement approach is unsuitable for the complexities of 7 T TOF-MRA and underscore the value of the adaptive, multi-metric monitoring integrated into the TOFR-VET toolkit.
4.4. Methodological Limitations and Future Directions
The limitations of this study are categorized into three areas: spatial sampling, statistical robustness, and ground-truth validation.
First, regarding spatial sampling, radiomic validation was performed using a standardized ROI-1 (left vascular cluster). While this single-region approach does not capture the full spatial heterogeneity of the entire cerebrovascular tree, it served as a controlled ‘validation site’ to maintain anatomical consistency across the n = 120 cohort. The high stability observed (ICC > 0.87) at this site suggests that the enhancement effects are robust. Future iterations of TOFR-VET will implement automated multi-vessel segmentation to confirm these findings across peripheral branches.
Second, regarding statistical robustness, the retrospective and anonymized nature of the dataset meant that individual demographic variables (age, sex, and clinical status) were not available, making it difficult to fully account for population heterogeneity. However, the use of a large, diverse cohort of 120 subjects allowed for a rigorous evaluation of the toolkit’s performance across a wide range of 7T-specific signal-to-noise ratios and intensity inhomogeneities. While this study confirms the technical feasibility of the pipeline, future work will involve multi-center, multi-scanner, and multi-acquisition-parameter testing to ensure the toolkit’s robustness across different clinical environments.
Third, regarding validation constraints, this study utilized objective image quality metrics (PSNR, SSIM, CII) in the absence of a manual ‘gold-standard’ segmentation. We acknowledge that using PSNR and SSIM as mathematical baselines for structural fidelity is a preliminary step; future research should incorporate dedicated noise simulation and artifact challenge experiments to quantify algorithm resilience. Ultimately, TOFR-VET is positioned as a foundational preprocessing framework to enable future large-scale diagnostic accuracy trials and learning-based enhancement comparisons.
5. Conclusions
This work introduced TOFR-VET (Time-of-Flight Radiomics and Vessel Enhancement Toolkit), a unified methodological workflow for enhancement, objective evaluation, and radiomic variability analysis of 7 T TOF-MRA. By integrating multiple enhancement strategies with standardized image quality metrics and quantitative feature extraction, the framework enables transparent comparison of enhancement-induced variability prior to downstream quantitative analysis. Overall, we found that all four enhancement choices had a significant effect on image quality metrics (e.g., the deviation from baseline in terms of PSNR/SSIM, contrast gain and brightness preservation) as well radiomic features derived from vascular ROIs, with impact measured through specific objective measures rather than visual inspection. These findings reinforce that preprocessing is not a neutral step in quantitative angiography workflows and should be explicitly evaluated and reported. Future work will focus on extending the evaluation to external datasets and multi-center acquisitions and on assessing how preprocessing choices interact with specific downstream tasks (e.g., segmentation stability and quantitative vascular measurements).
In addition, we plan to incorporate several additional functionalities into the toolkit. Deep learning-based modules for image enhancement and vessel segmentation (for example, using generative adversarial networks for super-resolution or U-Net architectures for vascular segmentation) could be integrated to further enhance quantitative scores based on standardized evaluation metrics. Furthermore, we are actively labeling additional TOF-MRA data and developing an upgraded release of the toolkit (TOFRVET v2) to include a dedicated diagnostic component by adding machine learning-based classification and advanced segmentation; once these new modules are fully implemented and validated, we will release this second version of the tool.
Finally, we plan to evaluate the toolkit in clinical settings by obtaining feedback from radiologists, in order to assess its usability and impact in real diagnostic workflows. By continuously extending this open platform, we hope to support a wide range of medical imaging applications beyond brain angiography, ultimately enhancing both research and clinical capabilities in cerebrovascular imaging.
Author Contributions
Conceptualization, H.A.J. and İ.Ç.; methodology, H.A.J.; software, H.A.J.; validation, H.A.J. and O.A.; formal analysis, H.A.J.; investigation, H.A.J.; data curation, H.A.J.; writing—original draft preparation, H.A.J.; writing—review and editing, H.A.J., İ.Ç. and O.A.; visualization, H.A.J.; supervision, İ.Ç.; project administration, O.A. All authors have read and agreed to the published version of the manuscript.
Funding
This research received no external funding.
Institutional Review Board Statement
Not applicable. This study involved a secondary analysis of anonymized imaging data previously acquired under institutional protocols; no new human studies were conducted by the authors for this work.
Informed Consent Statement
Not applicable. This study did not involve prospective recruitment of human subjects or the use of identifiable personal data. All data were anonymized, and the requirement for informed consent was waived by the original data-providing institutions for this retrospective analysis.
Data Availability Statement
De-identified imaging data are not publicly available due to institutional restrictions and patient privacy requirements. The TOFR-VET MATLAB toolkit and associated analysis scripts developed in this study are available from the corresponding author upon reasonable academic request. The software can be executed within the MATLAB environment for research and educational purposes.
Conflicts of Interest
The authors declare no conflicts of interest.
Abbreviations
The following abbreviations are used in this manuscript:
| 7T | 7 Tesla |
| AGCWD | Adaptive Gamma Correction with Weighting Distribution |
| ASM | Angular Second Moment |
| BBHE | Brightness-Preserving Bi-Histogram Equalization |
| BHE | Bilateral Histogram Equalization |
| BPF | Brightness Preservation Factor |
| CII | Contrast Improvement Index |
| DSIHE | Dualistic Sub-Image Histogram Equalization |
| GLCM | Gray-Level Co-Occurrence Matrix |
| GUI | Graphical User Interface |
| HE | Histogram Equalization |
| LoG | Laplacian of Gaussian |
| MMBEBHE | Minimum Mean Brightness Error Bi-Histogram Equalization |
| MRI | Magnetic Resonance Imaging |
| PSNR | Peak Signal-to-Noise Ratio |
| ROI | Region-of-Interest |
| RSIHE | Recursive Sub-Image Histogram Equalization |
| RSWHE | Recursive Sub-Image Weighted Histogram Equalization |
| SSIM | Structural Similarity Index |
| TOF-MRA | Time-of-Flight Magnetic Resonance Angiography |
References
- Cosottini, M.; Calzoni, T.; Lazzarotti, G.A.; Grigolini, A.; Bosco, P.; Cecchi, P.; Donatelli, G. Time-of-flight MRA of intracranial vessels at 7 T. Eur. Radiol. Exp. 2024, 8, 68. [Google Scholar] [CrossRef] [Scilit]
- Gonzales, R.C.; Woods, R. Digital Image Fundamental. In Digital Image Processing, 4th ed.; Pearson: London, UK, 2018; Volume 1024. [Google Scholar]
- Shannon, C.E. A Mathematical Theory of Communication. Bell. Syst. Tech. J. 1948, 27, 623–656. [Google Scholar] [CrossRef] [Scilit]
- Algin, O.; Yuce, G.; Koc, U.; Ayberk, G. A comparison between the CS-TOF and the CTA/DSA for WEB device management. Interv. Neuroradiol. 2021, 28, 29. [Google Scholar] [CrossRef] [Scilit]
- Renuka, S.V.; Edla, D.R.; Joseph, J. An objective measure for assessing the quality of contrast enhancement on magnetic resonance images. J. King Saud. Univ. Comput. Inf. Sci. 2022, 34, 9732–9744. [Google Scholar] [CrossRef] [Scilit]
- Kikinis, R.; Pieper, S.D.; Vosburgh, K.G. 3D Slicer: A Platform for Subject-Specific Image Analysis, Visualization, and Clinical Support. In Intraoperative Imaging and Image-Guided Therapy; Springer: Berlin/Heidelberg, Germany, 2014; pp. 277–289. [Google Scholar] [CrossRef] [Scilit]
- Li, Z.; Sun, D.; Ling, C.; Bai, L.; Zhang, J.; Wu, Y.; Zhang, Z. Quantitative modeling of lenticulostriate arteries on 7-T TOF-MRA for cerebral small vessel disease. Eur. Radiol. Exp. 2024, 8, 126. [Google Scholar] [CrossRef] [Scilit] [PubMed]
- Wolf, I.; Vetter, M.; Wegner, I.; Böttger, T.; Nolden, M.; Schöbinger, M.; Meinzer, H.P. The medical imaging interaction toolkit. Med. Image Anal. 2005, 9, 594–604. [Google Scholar] [CrossRef] [Scilit]
- Mata, C.; Munuera, J.; Lalande, A.; Ochoa-Ruiz, G.; Benitez, R. MedicalSeg: A Medical GUI Application for Image Segmentation Management. Algorithms 2022, 15, 200. [Google Scholar] [CrossRef] [Scilit]
- Pizer, S.M.; Amburn, E.P.; Austin, J.D.; Cromartie, R.; Geselowitz, A.; Greer, T.; Zuiderveld, K. Adaptive histogram equalization and its variations. Comput. Vis. Graph Image Process. 1987, 39, 355–368. [Google Scholar] [CrossRef] [Scilit]
- Wang, C.; Ye, Z. Brightness preserving histogram equalization with maximum entropy: A variational perspective. IEEE Trans. Consum. Electron. 2005, 51, 1326–1334. [Google Scholar] [CrossRef] [Scilit]
- Kim, Y.T. Contrast enhancement using brightness preserving bi-histogram equalization. IEEE Trans. Consum. Electron. 1997, 43, 1–8. [Google Scholar] [CrossRef] [Scilit]
- Chen, S.; Der Ramli, A.R. Minimum mean brightness error bi-histogram equalization in contrast enhancement. IEEE Trans. Consum. Electron. 2003, 49, 1310–1319. [Google Scholar] [CrossRef] [Scilit]
- Kim, M.; Chung, M.G. Recursively separated and weighted histogram equalization for brightness preservation and contrast enhancement. IEEE Trans. Consum. Electron. 2008, 54, 1389–1397. [Google Scholar] [CrossRef] [Scilit]
- Mirza, M.W.; Siddiq, A.; Khan, I.R. A comparative study of medical image enhancement algorithms and quality assessment metrics on COVID-19 CT images. Signal Image Video Process. 2023, 17, 915–924. [Google Scholar] [CrossRef] [Scilit] [PubMed]
- Wang, Z.; Bovik, A.C.; Rahim Sheikh, H.; Simoncelli, E.P. Image Quality Assessment: From Error Visibility to Structural Similarity. IEEE Trans. IMAGE Process. 2004, 13, 600–612. [Google Scholar] [CrossRef] [Scilit]
- Abdullah-Al-Wadud, M.; Kabir, M.H.; Dewan, M.A.A.; Chae, O. A dynamic histogram equalization for image contrast enhancement. In Proceedings of the 2007 Digest of Technical Papers International Conference on Consumer Electronics, Las Vegas, NV, USA, 10–14 January 2007; IEEE: Piscataway, NJ, USA, 2007. [Google Scholar] [CrossRef] [Scilit]
- Kim, T.; Paik, J. Adaptive contrast enhancement using gain-controllable clipped histogram equalization. IEEE Trans. Consum. Electron. 2008, 54, 1803–1810. [Google Scholar] [CrossRef] [Scilit]
- Zwanenburg, A.; Vallières, M.; Abdalah, M.A.; Aerts, H.J.; Andrearczyk, V.; Apte, A.; Löck, S. The image biomarker standardization initiative: Standardized quantitative radiomics for high-throughput image-based phenotyping. Radiology 2020, 295, 328–338. [Google Scholar] [CrossRef] [Scilit] [PubMed]
- Haralick, R.M.; Dinstein, I.; Shanmugam, K. Textural Features for Image Classification. IEEE Trans. Syst. Man Cybern. 1973, SMC-3, 610–621. [Google Scholar] [CrossRef] [Scilit]
- Al-Awadi, J.Y.R.; Aljobouri, H.K.; Hasan, A.M. MRI Brain Scans Classification Using Extreme Learning Machine on LBP and GLCM. Int. J. Online Biomed. Eng. 2023, 19, 134–149. [Google Scholar] [CrossRef] [Scilit]
- Selman Erel, M.; Şengün Ermeydan, E.; Aljobouri, H.K.; Ilyas, C. Design of MATLAB-based Radiomics Classifier Training Simulator Powered by Pyradiomics. Al-Nahrain J. Eng. Sci. 2024, 27, 185–192. [Google Scholar] [CrossRef] [Scilit]
- Jaber, H.A.; Aljobouri, H.K.; Çankaya, I. Design of a web laboratory interface for ECG signal analysis using MATLAB builder NE. Open Comput. Sci. 2022, 12, 227–237. [Google Scholar] [CrossRef] [Scilit]
- Hussein, A.F.; ALZubaidi, A.K.; Habash, Q.A.; Jaber, M.M. An Adaptive Biomedical Data Managing Scheme Based on the Blockchain Technique. Appl. Sci. 2019, 9, 2494. [Google Scholar] [CrossRef] [Scilit]
- Yao, Z.; Lai, Z.; Wang, C. Image Enhancement Based on Equal Area Dualistic Sub-image and Non-parametric Modified Histogram Equalization Method. In Proceedings of the 2016 9th International Symposium on Computational Intelligence and Design (ISCID), Hangzhou, China, 10–11 December 2016; IEEE: Piscataway, NJ, USA, 2016; Volume 1, pp. 447–450. [Google Scholar] [CrossRef] [Scilit]
- Zeger, I.; Grgic, S.; Vukovic, J.; Sisul, G. Grayscale Image Colorization Methods: Overview and Evaluation. IEEE Access 2021, 9, 113326–113346. [Google Scholar] [CrossRef] [Scilit]
- Chen, S.; Der Ramli, A.R. Preserving brightness in histogram equalization based contrast enhancement techniques. Digit. Signal Process. 2004, 14, 413–428. [Google Scholar] [CrossRef] [Scilit]
- Sim, K.S.; Tso, C.P.; Tan, Y.Y. Recursive sub-image histogram equalization applied to gray scale images. Pattern Recognit. Lett. 2007, 28, 1209–1221. [Google Scholar] [CrossRef] [Scilit]
- Huang, S.C.; Cheng, F.C.; Chiu, Y.S. Efficient contrast enhancement using adaptive gamma correction with weighting distribution. IEEE Trans. Image Process. 2013, 22, 1032–1041. [Google Scholar] [CrossRef] [Scilit]
- Kalyani, C.; Ramudu, K.; Reddy, G.R. Enhancement and Segmentation of Medical Images Using AGCWD and ORACM. Int. J. Online Biomed. Eng. 2020, 16, 45–57. [Google Scholar] [CrossRef] [Scilit]
- Hussein, A.F.; Mohammed, W.R.; Musa Jaber, M.; Ibrahim Khalaf, O. An Adaptive ECG Noise Removal Process Based on Empirical Mode Decomposition (EMD). Contrast Media Mol. Imaging 2022, 2022, 3346055. [Google Scholar] [CrossRef] [Scilit] [PubMed]
- Madmad, T.; De Vleeschouwer, C. Bilateral Histogram Equalization for X-Ray Image Tone Mapping. In Proceedings of the 2019 IEEE International Conference on Image Processing (ICIP), Taipei, Taiwan, 22–25 September 2019; IEEE: Piscataway, NJ, USA, 2019; pp. 3507–3511. [Google Scholar] [CrossRef] [Scilit]
- Jaber, H.A.; Çankaya, I.; Aljobouri, H.K.; Koçak, O.M.; Algin, O. Optimal Model-free Approach Based on MDL and CHL for Active Brain Identification in fMRI Data Analysis. Curr. Med. Imaging 2021, 17, 352–365. [Google Scholar] [CrossRef] [Scilit] [PubMed]
- Aljobouri, H.K.; Jaber, H.A.; Çankaya, I. Performance evaluation of prototype-based clustering algorithms combined MDL index. Comput. Appl. Eng. Educ. 2017, 25, 642–654. [Google Scholar] [CrossRef] [Scilit]
- Chen, T.; Zhu, W.; Bai, X.; Mossa-Basha, M.; Zhao, Y.; Pei, X.; Sui, B. A radiomic model based on 7T intracranial vessel wall imaging for identification of culprit middle cerebral artery plaque associated with subcortical infarctions. J. Cardiovasc. Magn. Reson. 2025, 27, 101956. [Google Scholar] [CrossRef] [Scilit]

Disclaimer/Publisher’s Note: The statements, opinions and data contained in all publications are solely those of the individual author(s) and contributor(s) and not of MDPI and/or the editor(s). MDPI and/or the editor(s) disclaim responsibility for any injury to people or property resulting from any ideas, methods, instructions or products referred to in the content. |
© 2026 by the authors. Licensee MDPI, Basel, Switzerland. This article is an open access article distributed under the terms and conditions of the Creative Commons Attribution (CC BY) license.