


Featured Application
This work can be applied to data augmentation pipelines for autonomous driving perception systems, enabling robust 3D object detection under snowy conditions without collecting real adverse-weather data.
Abstract
LiDAR-based 3D object detection is critical for autonomous driving perception. Ensuring robust sensing under adverse weather is essential for safe deployment. Current physics-based simulation methods focus on atmospheric effects but offer limited ground-level modeling, leading to domain gaps between simulated and real-world snowy data. Ground-level effects are challenging to model due to diverse physical interactions: wet surface reflectivity changes, vehicle-induced spray, and multi-layer snow scattering. This paper proposes a simulation method with more comprehensive ground-effect modeling for snowfall scenarios. Our approach introduces two modules: (i) an extended spray model with precipitation-controlled parameters that jointly models spray noise and wet ground attenuation, and (ii) a multi-layer dual-mode backscattering model that captures both diffuse and specular reflections on snow-covered ground. Both modules share a unified precipitation-driven parameterization. Higher snowfall rates simultaneously control spray generation, wet surface reflectivity, and snow accumulation depth. This design ensures physical consistency and makes the approach applicable across diverse LiDAR systems without sensor-specific tuning. Experiments on the STF dataset demonstrate consistent improvements over four state-of-the-art methods under both heavy and light snowfall. Clear-weather performance is preserved. Evaluations on roadside LiDAR further confirm generalizability to infrastructure-based scenarios.
1. Introduction
LiDAR-based 3D object detection has advanced rapidly in recent years. It has become a critical component of both vehicle-side and infrastructure-based perception systems for autonomous driving [1]. Despite providing accurate depth measurements, LiDAR sensors are highly sensitive to adverse weather such as rain, snow, and fog [2,3,4]. Even moderate degradation can lead to unstable detection in safety-critical scenarios. Ensuring robust sensing under all weather conditions is therefore essential for safe human–vehicle interaction and dependable autonomous transportation systems.
From a physical perspective, the received signal power of a LiDAR system can be described by the classical range equation , where denotes the target reflectivity, is the incident angle, R is the range, and represents the atmospheric transmittance determined by the extinction coefficient along the beam path [5,6]. Under clear conditions, the atmosphere is nearly transparent () and depends solely on the target material. Under adverse weather conditions, both terms are degraded, with the underlying mechanisms broadly categorized into two types of physical interactions.
For atmospheric effects, extensive studies have shown that suspended particles along the beam path increase extinction and reduce [7,8]. Sun et al. [3] showed that snowfall intensity critically affects LiDAR measurements, while Kilic et al. [5] demonstrated that adverse weather reduces signal-to-noise ratio (SNR), degrading ranging accuracy.
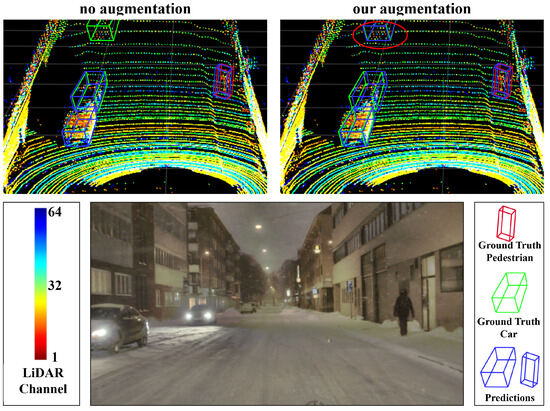
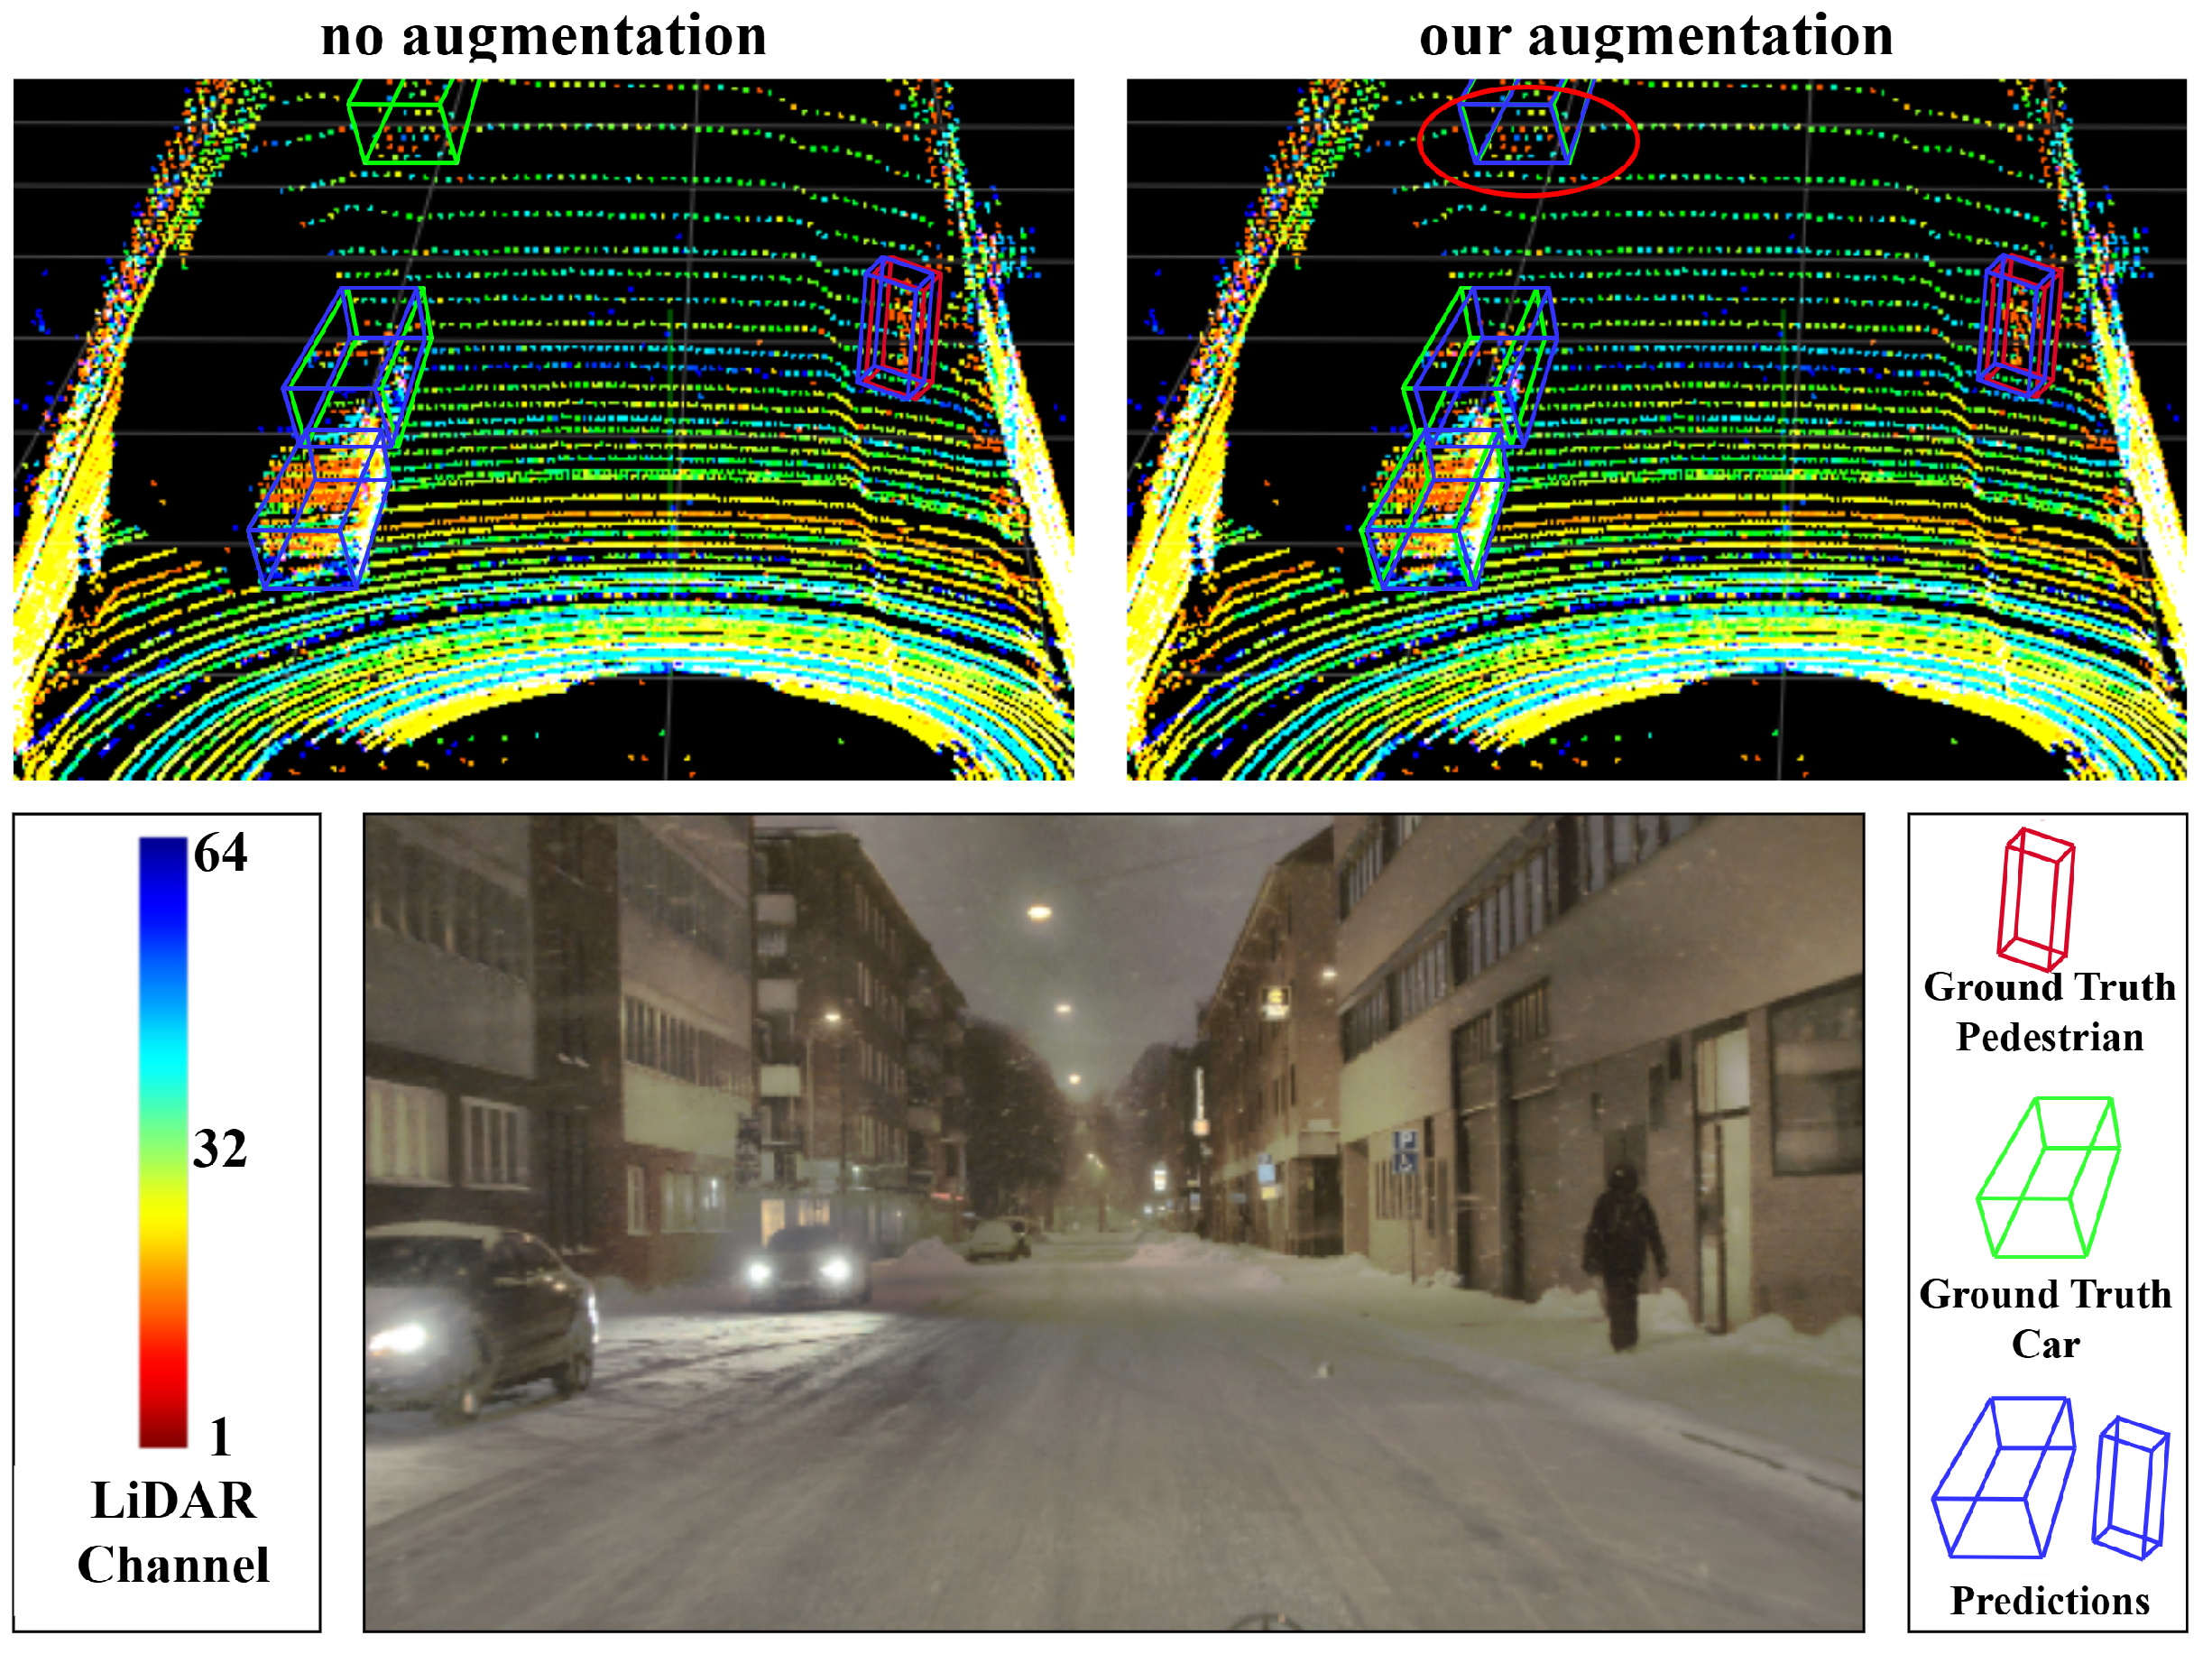
For ground-level effects, surface changes alter and introduce additional degradation. For wet ground formed during rain or snowfall, Hahner et al. [6] and Shin et al. [9] reported that water layers enhance specular reflections via Fresnel effects. Huang et al. [10] observed that wet ground introduces false reflections as precipitation intensity increases. Walz et al. [11] and Shearman et al. [12] demonstrated that vehicle-induced spray generates spurious returns that severely degrade LiDAR performance. For snow-covered ground, Radecki et al. [13] showed that snow layers significantly modify surface reflectance, potentially leading to phantom obstacles. These factors collectively introduce a substantial domain gap between simulated and real-world data. Models trained on clear-weather benchmarks therefore underperform in snowy environments [14], as illustrated in Figure 1.
Figure 1.
3D object detection results on snow-covered ground. (Top left): trained without augmentation. (Top right): trained with our augmentation. (Bottom): RGB reference image.
The scarcity of annotated adverse-weather data further exacerbates this domain gap, as collecting and labeling LiDAR data under adverse conditions is costly, time-consuming, and difficult to scale across diverse weather scenarios. Recent studies [5,6,14,15] have explored physics-based simulation methods to generate adverse-weather LiDAR data from existing clear-weather datasets, offering a cost-effective alternative for training robust perception models. As illustrated in Table 1, representative methods include LISA [5], Snow-sim [6], and LAWA [14]. LISA adopts a Monte Carlo strategy to estimate backscattered power using Mie theory. Snow-sim improves realism by modeling beam divergence and particle–target occlusion. LAWA introduces controllable precipitation density and distance noise. However, these methods primarily focus on atmospheric particle interactions. The modeling of ground-level effects under snowy conditions remains limited.
Table 1.
Comparison of adverse-weather simulation approaches. Checkmarks indicate included modules; multiplication signs indicate excluded modules.
In real snowy environments, ground-level interactions also significantly influence LiDAR measurements. Wet ground formed by melting snow can generate vehicle-induced spray and alter surface reflectivity. Accumulated snow modifies reflectance through multi-layer scattering mechanisms. Comprehensively modeling these effects is challenging for several reasons. Wet ground involves coupled reflectivity changes and spray generation dependent on precipitation intensity and vehicle dynamics. Snow-covered ground requires capturing the vertical heterogeneity of snow layers with varying density and grain properties. Maintaining physical consistency between atmospheric and ground-level effects under a common parameterization further complicates the design. In this paper, we propose a physics-based simulation method with more comprehensive ground-effect modeling under snowy conditions.
In summary, our contributions are listed as follows:
- We propose a multi-layer dual-mode backscattering model for snow-covered ground that captures both diffuse volume scattering and specular interface reflections via recursive reflectivity computation. To the best of our knowledge, this is the first physics-based model of snow-covered ground reflectance specifically designed for LiDAR adverse-weather simulation.
- We extend existing spray and wet ground models by linking them through a unified precipitation-driven parameterization, where a single precipitation rate simultaneously controls atmospheric scattering density, water film thickness, spray generation, and snow accumulation depth. This design ensures physical consistency across all modules without sensor-specific tuning.
- Extensive experiments on STF and DAIR-V2X-I datasets demonstrate consistent improvements over four state-of-the-art methods across six detectors, along with comparison against a diffusion-based generative method, validating robustness across vehicle-side and infrastructure-based scenarios.
2. Related Work
This section reviews three areas of research relevant to our work. We first describe LiDAR-based 3D object detection architectures, as the robustness of these detectors under adverse conditions is the central motivation for this study. We then discuss the physical mechanisms by which adverse weather degrades LiDAR sensing. Finally, we review existing simulation methods designed to bridge the gap between clear-weather training data and real-world adverse conditions.
2.1. LiDAR-Based 3D Object Detection
LiDAR-based 3D object detection has become a core capability for autonomous driving perception systems [16,17]. Diverse architectural paradigms have been developed. Point-based methods such as PointNet [18] operate directly on raw coordinates but face scalability challenges. Voxel-based methods (VoxelNet [19], SECOND [20], Voxel R-CNN [21]) discretize point clouds into regular grids for efficient processing. Pillar-based methods (PointPillars [22], CenterPoint [23]) simplify 3D voxelization to 2D columns, achieving favorable speed–accuracy trade-offs. Hybrid methods such as PV-RCNN [24] integrate voxel-based and point-based features for refined detection. More recently, Transformer-based methods such as DSVT [25] replace sparse convolution with dynamic sparse window attention, achieving state-of-the-art performance on standard benchmarks. Despite rapid architectural progress, robustness under adverse weather remains a critical concern, as detectors trained on clear-weather data can suffer substantial performance degradation in rain, fog, or snow [6,14]. Understanding this degradation requires examining how adverse weather physically affects LiDAR sensing, as discussed next.
2.2. Effects of Adverse Weather on LiDAR
Adverse weather degrades LiDAR performance through two primary categories of physical interactions [4,7]: atmospheric effects along the beam path and ground surface effects at the point of reflection.
Atmospheric degradation arises from interactions between laser beams and suspended particles. Sun et al. [3] showed that snowfall intensity critically affects LiDAR measurements by establishing quantitative relationships between precipitation rates and sensor degradation metrics. Kilic et al. [5] demonstrated that adverse weather reduces signal-to-noise ratio (SNR), degrading ranging accuracy. Filgueira et al. [8] quantified the influence of rainfall on ranging accuracy across different sensor configurations. Kutila et al. [2] characterized LiDAR performance degradation under Arctic conditions. To mitigate particle-induced noise, Heinzler et al. [26] proposed a CNN-based point cloud de-noising approach, and Charron et al. [27] developed the DROR algorithm for filtering snowfall-corrupted point clouds.
While atmospheric effects have been extensively studied, ground surface conditions introduce a distinct and equally important category of degradation. These effects manifest through two types of surface states commonly encountered during snowfall. First, wet ground formed by melting snow or accumulated precipitation modifies LiDAR returns through both reflectivity changes and spurious near-field echoes. Hahner et al. [6] and Shin et al. [9] reported that water layers enhance specular reflections via Fresnel effects, while Huang et al. [10] observed that wet ground introduces false reflections as precipitation intensity increases. Vehicle-induced spray further compounds this degradation: Walz et al. [11] and Shearman et al. [12] demonstrated that spray generates spurious returns that severely degrade LiDAR performance, and the SemanticSpray++ dataset [28] together with Jokela et al. [29] provides systematic characterization of spray-related degradation patterns. Second, snow-covered ground fundamentally alters surface reflectance properties through multi-layer scattering. Radecki et al. [13] showed that accumulated snow significantly modifies surface reflectance, potentially leading to phantom obstacle detections.
These atmospheric and ground-level degradation mechanisms collectively degrade detection performance. However, collecting real-world LiDAR data under diverse adverse conditions is costly and difficult to scale. This motivates the development of simulation methods that can generate realistic adverse-weather data from existing clear-weather datasets, as reviewed below.
2.3. Adverse-Weather Simulation Methods
Physics-based simulation provides a cost-effective alternative to real-world adverse-weather data collection. As summarized in Table 1, existing methods primarily focus on atmospheric particle interactions, with varying degrees of ground-level modeling.
Hahner et al. [30] pioneered physically valid fog simulation for LiDAR point clouds. For snowfall simulation, LISA [5] adopts a Monte Carlo strategy to estimate backscattered power using Mie theory. Snow-sim [6] improves realism by modeling beam divergence and particle–target occlusion, and additionally models wet ground intensity attenuation using geometric optics. LAWA [14] introduces controllable precipitation density and distance noise to better approximate real-world measurement uncertainty. For vehicle-induced spray, Yang et al. [15] developed a realistic simulation within the CARLA simulator, and Linnhoff et al. [31] proposed spray modeling based on detection clusters. Beyond precipitation, Lian et al. [32] addressed dusty weather simulation.
In addition to physics-based methods, data-driven approaches have emerged for adverse-weather augmentation. Vargas Rivero et al. [33] investigated augmentation strategies for automotive LiDAR without explicit physical modeling. Zhang et al. [34] applied conditional generative models to synthesize adverse-weather effects. WeatherGen [35] introduced a unified diffusion-based framework for diverse weather generation. While these approaches can produce visually plausible results, they typically require paired or large-scale adverse-weather training data, which limits their applicability when such data is scarce.
In summary, existing simulation methods exhibit a common limitation regarding ground-level effects. Some works [5] model atmospheric scattering but omit ground-level interactions entirely. Others [6,14] partially address wet ground attenuation but do not consider spray noise or snow-covered ground reflectance (Table 1). This paper addresses the general case where both wet ground and snow-covered ground effects are comprehensively modeled and coupled with atmospheric scattering under a unified precipitation-driven parameterization.
3. Materials and Methods
3.1. Overview
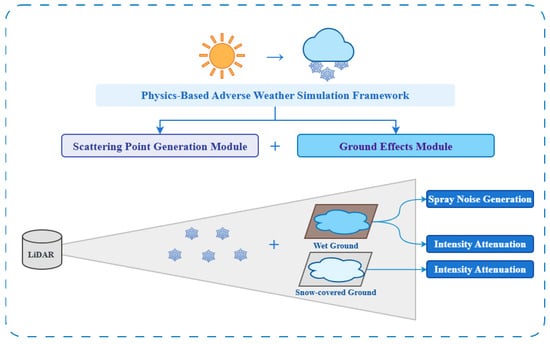
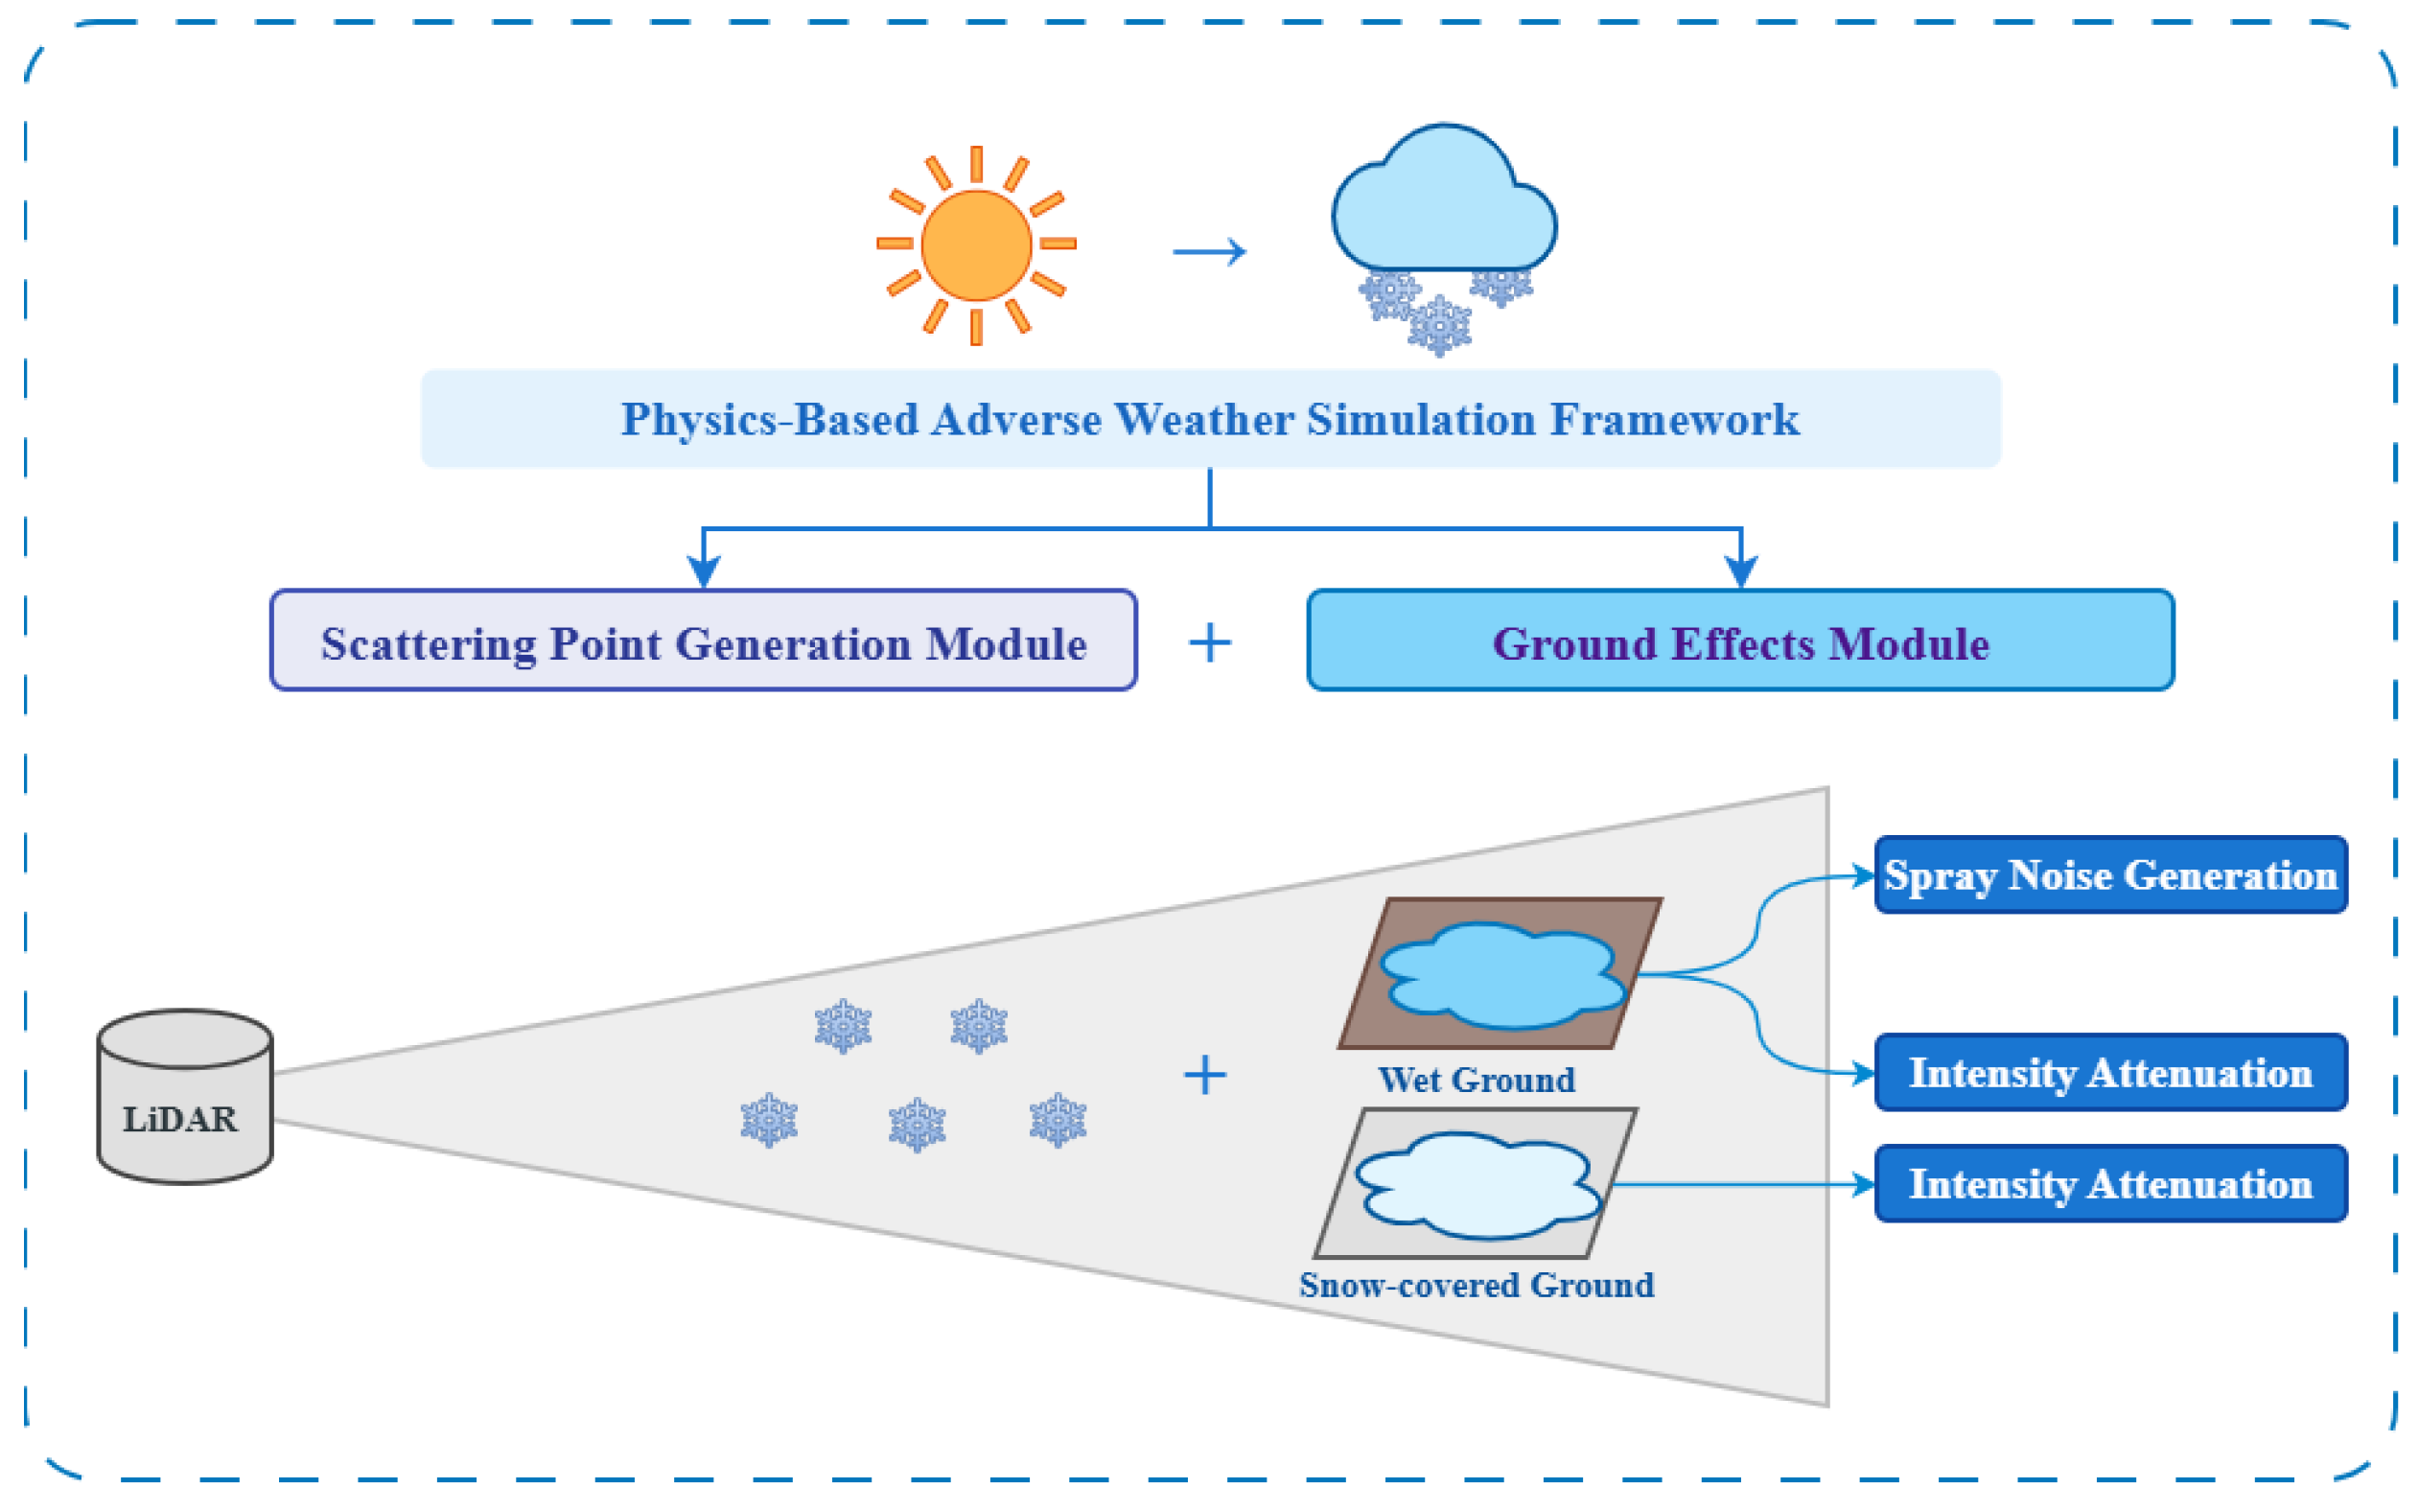
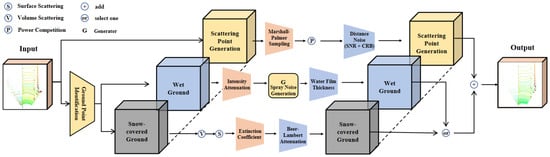
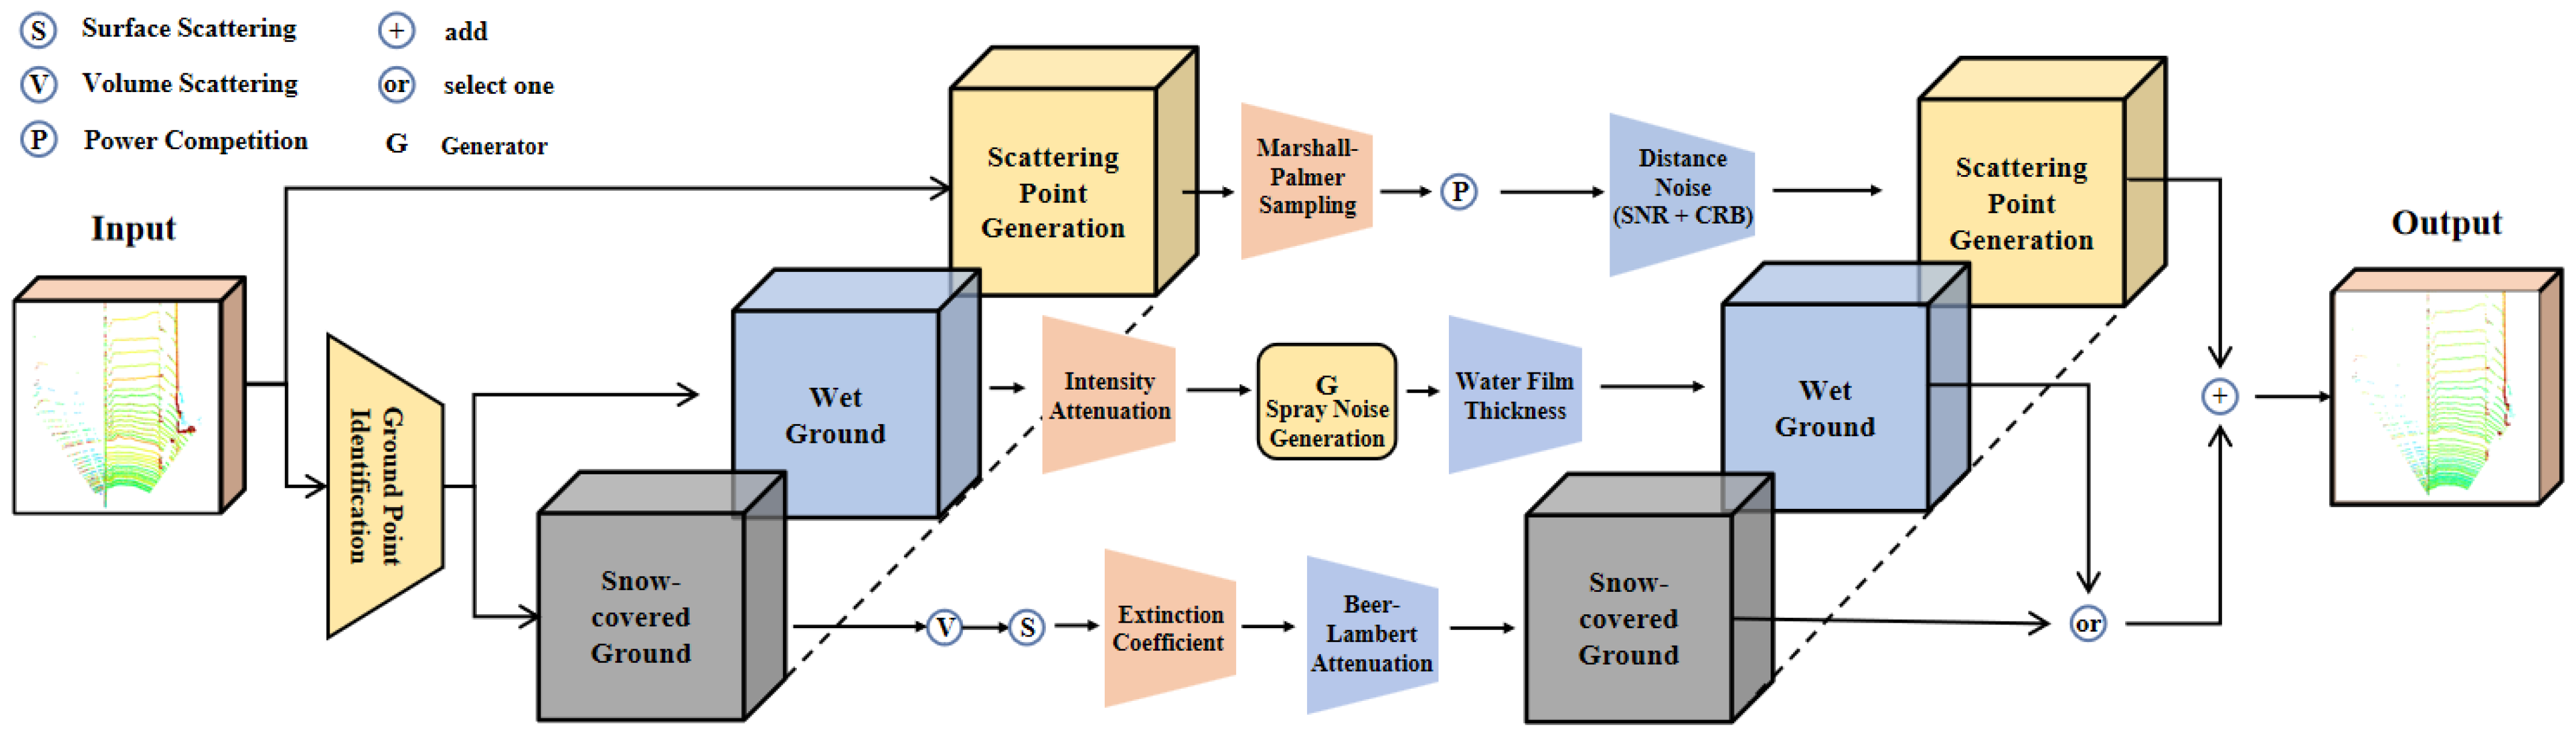
Our goal is to synthesize realistic LiDAR degradation patterns that enable detectors to generalize to real snowy conditions. As shown in Figure 2, the proposed method comprises a scattering point generation module and a ground effects module. Figure 3 details the computational pipeline from clear-weather input to augmented output.
Figure 2.
Modular structure of the proposed method, comprising a scattering point generation module for atmospheric effects and a ground effects module addressing wet and snow-covered surface conditions.
Figure 3.
Data processing pipeline from clear-weather LiDAR point cloud input to adverse-weather augmented data output.
The modular architecture allows for each physical effect to be independently parameterized and composed. The scattering module adopts established physics-based modeling [5,6] to modify point positions and intensities through atmospheric particle interaction. The ground effects module is our primary methodological contribution; it operates on ground-segmented points, applying reflectivity modifications for wet and snow-covered surfaces. Specifically, we extend the wet ground model by linking spray generation and intensity attenuation through a precipitation-dependent water film thickness, and we propose a novel multi-layer dual-mode backscattering model for snow-covered ground. All modules share a unified precipitation rate parameter—higher snowfall rates simultaneously increase atmospheric scattering density, wet ground water film thickness, and snow accumulation depth. This reproduces the correlated degradation patterns observed in real adverse weather.
3.2. Scattering Point Generation Module
Snowfall particles suspended in the atmosphere interact with LiDAR beams and cause three primary effects: (i) spurious points generated by particle backscattering, (ii) target occlusion when particles block the beam path, and (iii) ranging noise due to reduced SNR. We adopt established physics-based modeling [5,6] to simulate these effects.
Received Power Model. For cost-effective LiDAR systems, pulse propagation in free space can be modeled using geometric optics [6]. After the transmitter emits a laser pulse with power , the pulse is reflected by solid targets with reflectivity . The received power for extended targets is calculated as follows:
where is a system constant independent of distance and time, is the incident angle, and R is the target distance. In adverse weather, the optical medium contains particles smaller than the beam diameter, requiring accurate modeling of their spatial distribution [5].
Particle Modeling. We use the Marshall–Palmer distribution [5] to model particle size and density as a function of precipitation rate. The particle size distribution is , where is the initial density parameter and depends on the snowfall rate. The total particle number density is obtained by integration: . The LiDAR beam scans a conical region defined by beam divergence . The scanning volume is
Under the small-angle approximation (), the expected particle count within the beam volume becomes
Spatial Sampling. To determine the spatial distribution of scattering particles, we employ inverse transform sampling. Since the beam cross-sectional area grows as , the distance-based cumulative distribution function ensuring uniform volumetric distribution is . Given a uniform random number , each particle distance is sampled as .
Power Competition. For each beam, the system evaluates the received power of both original target points and candidate scatter points. Three outcomes are possible [6]: (1) if the original target point has the highest received power, it is retained as an attenuated point; (2) if a scatter point dominates, it replaces the original point (complete occlusion); (3) if all points fall below the detectable threshold, all points are removed. The complete scattering procedure is summarized in Algorithm 1.
| Algorithm 1 Scattering Point Generation. |
|
Distance Noise. Adverse weather reduces SNR, degrading ranging accuracy [36]. The effective received signal power is , where is the observed intensity and is the atmospheric extinction coefficient. The system noise equivalent power is calibrated by the maximum detection distance: . The SNR is then
where is the noise scaling factor. Following the Cramér–Rao bound [5], ranging uncertainty is , where is pulse width-limited resolution. We inject Gaussian noise to each point’s radial distance while preserving angular coordinates.
3.3. Ground Effects Module
While existing methods [5,6,14] focus on atmospheric scattering, ground surface effects constitute a significant yet neglected source of detection degradation in snowy conditions [12,13]. In real-world snowy environments, ground surfaces often exhibit complex physical states; wet surfaces formed by melting snow coexist with snow-covered regions, each producing distinct LiDAR signal characteristics. We address both types of ground effects below.
3.3.1. Wet Ground
Under light precipitation or during snow melting periods, wet ground surfaces significantly affect LiDAR measurements through two mechanisms: reduced reflectivity from water layer absorption and Fresnel effects, and spray noise from moving vehicles introducing spurious near-field returns.
Intensity Attenuation. We adopt the geometric optics-based modeling from Snow-sim [6], where wet ground reflectivity is computed as a weighted combination of dry reflectivity and water layer transmittance:
where depends on water depth , is total transmittance, and is incident angle. The complete wet ground simulation procedure is given in Algorithm 2.
| Algorithm 2 Wet Ground Simulation. |
|
Spray Noise. We adopt the tire hydrodynamics model by Yang et al. [15]. Spray is generated via two mechanisms: tread groove ejection () and lateral wave displacement (). Here V is vehicle speed and is water film thickness. Droplet intensities are computed using the Cook–Torrance microfacet model. We extend this model by linking to precipitation rate via the empirical road surface formula
where is road surface texture, is drainage path length, and is road slope. This links spray generation to precipitation intensity for unified parameter control.
3.3.2. Snow-Covered Ground
Intensity Attenuation. Accumulated snow significantly alters ground reflectivity due to its porous structure and layered composition. Snow behaves as a complex scattering medium. LiDAR signals interact with both ice grains within the volume and interfaces between layers. We propose a multi-layer dual-mode backscattering model based on established snow optics theory [37]. This model captures both diffuse reflection from volume scattering and specular reflection from layer interfaces.
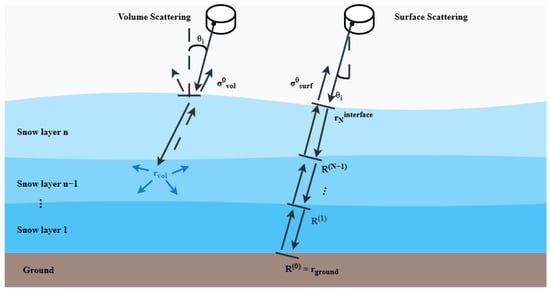
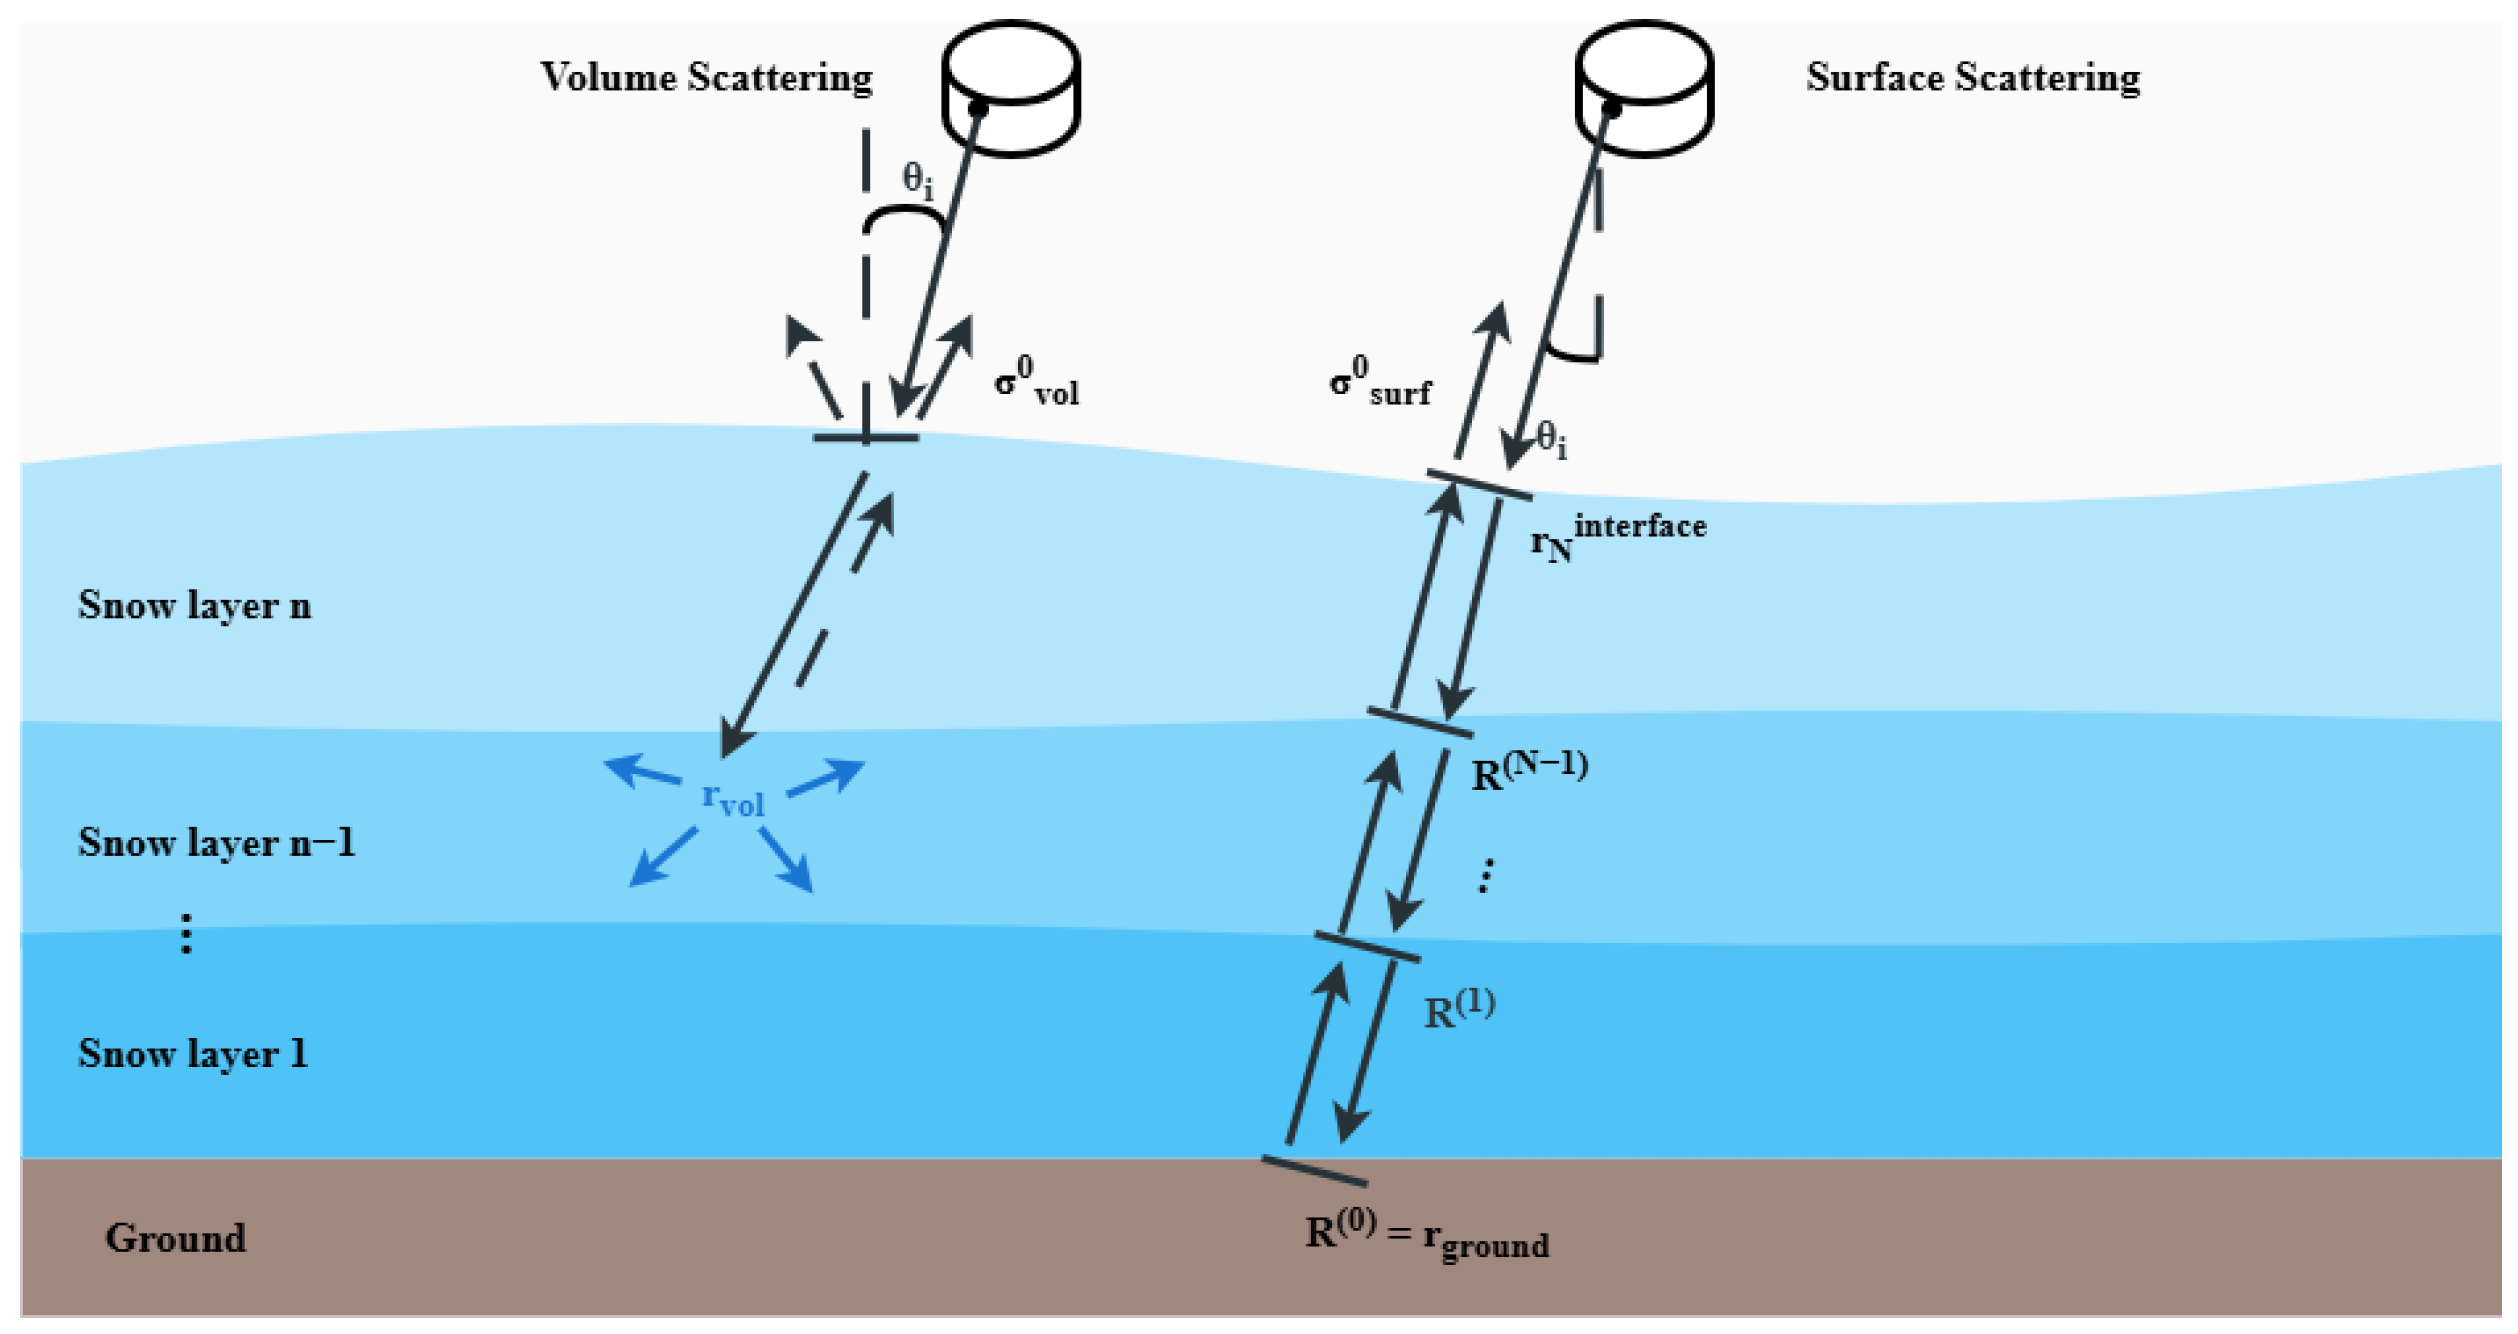
As illustrated in Figure 4, total backscattering comprises two components:
Figure 4.
Dual-mode backscattering model for multi-layer snow-covered ground. Volume scattering () arises from diffuse grain scattering, while surface scattering () results from Fresnel reflection at layer interfaces with recursive reflectivity computation.
The volume component arises from diffuse scattering by ice grains and follows Lambert’s law:
where is the volume scattering coefficient and is the effective extinction coefficient. The surface component represents specular reflection at layer interfaces and depends on incident angle and surface slope variance .
Natural snow often exhibits vertical non-uniformity, which we capture through recursive reflectivity computation. For N layers, equivalent reflectivity is calculated from bottom to top, starting from ground reflectivity :
where is Fresnel reflectivity at layer k interface, and are transmission coefficients, and is intra-layer attenuation.
The complete simulation procedure is given in Algorithm 3. The effective extinction coefficient combines scattering and absorption, computed via the Improved Born Approximation (IBA) [37]. We set the LiDAR wavelength to nm, typical for automotive sensors. The refractive indices are and , with ice density kg/m3. The ice volume fraction is . For the scattering coefficient, we distinguish between the Rayleigh regime () and the geometric optics regime (). Here is the free-space wavenumber and is the grain radius (default 0.5 mm).
| Algorithm 3 Snow-Covered Ground Simulation. |
|
For the volume scattering component, we incorporate the single scattering albedo and compute
To capture the vertical non-uniformity of natural snow, the multi-layer model uses gradient profiles for both snow density and grain radius across N layers. The density varies linearly from at the bottom (compacted layer) to at the top (fresh snow). The grain radius varies from (larger grains due to metamorphism) to (smaller surface grains). These gradients reflect well-documented snow stratigraphy characteristics.
Following the Beer–Lambert law, the final attenuated intensity is
where is incident intensity, is snow depth, and is incident angle. The default snow parameters are layers, ground reflectivity , grain radius mm, and snow depth sampled uniformly from m. The output intensity values are clipped to to match the 8-bit dynamic range of standard LiDAR sensors.
- Notation summary. R: target distance; : precipitation rate; : maximum detection range; r: particle or grain radius; : recursive layer reflectivity.
4. Results and Discussion
4.1. Experimental Settings
Dataset. We conduct experiments on the STF dataset [36]. It provides 12,997 annotated LiDAR frames with 3D bounding boxes for cars, pedestrians, and cyclists under clear weather, fog, and snow conditions. Following the original splits, 3469 clear-weather frames are used for training and 3916 snow frames for evaluation. Since vehicle-induced spray effects are category-dependent, we focus on the car category. Following prior work [6], snow samples are divided into heavy and light subsets using the Dror algorithm [27], resulting in 1404 heavy snow samples and 2512 light snow samples.
Evaluation Metrics. We adopt the KITTI 3D object detection evaluation protocol [38]. Since weather effects are distance-dependent [3,6,15], we report distance-stratified average precision (AP) within 0–30 m, 30–50 m, and the full 0–50 m range. AP is computed at 40 recall positions [6,15]. In addition, we report fine-grained AP within five 10 m intervals (Section 4.2) and the intensity-distribution KL divergence between real and simulated snow (Section 4.3) to provide spatially resolved and distribution-level fidelity evaluations.
Detection Methods. We evaluate using six representative 3D detectors implemented in OpenPCDet: PV-RCNN [24], Voxel-RCNN [21], CenterPoint [23], SECOND [20], PointPillars [22], and DSVT [25]. These span diverse architectures: point–voxel fusion, voxel-based two-stage, anchor-free center-based, voxel-based single-stage, pillar-based single-stage, and Transformer-based methods. All have demonstrated sensitivity to adverse-weather augmentation [6].
Augmentation Parameters. Models are trained on clear-weather STF data augmented by different methods. We compare against LISA [5], Snow-sim [6], Spray [15], and LAWA [14]. Sensor parameters are m, rad, and . Following standard practice [5,6], augmentation is applied to every 10th training sample. Snowfall rates are sampled from mm/h. For wet ground, is sampled from mm using exponential distribution, with mm and m.
Training Repetitions. Each detector and augmentation configuration is trained three times with different random seeds. All reported AP and mAP values are the mean across these three runs.
Implementation Environment. Detector training and evaluation are performed on NVIDIA RTX 3090 GPUs. The augmentation pipeline runs on CPU; all timing measurements reported in Section 4.5 are obtained from a single CPU thread.
4.2. Quantitative Results
Table 2 reports 3D AP for medium-sized vehicles across three test splits: heavy snow (1404 samples), light snow (2512 samples), and clear weather (1816 samples). We denote our module variants as follows: “Ours-wet” uses the scattering module with the wet ground module, “Ours-snow” uses the scattering module with the snow ground module, and “Ours-snow+wet” combines all three. The upper rows compare against state-of-the-art methods, while the lower rows show ablation results for individual modules. Overall, the proposed method achieves consistent improvements across different snowfall intensities while preserving clear-weather accuracy.
Table 2.
3D AP (%) comparison on STF under different weather conditions. Bold: best result per detector–split combination; underlined: second best.
Under heavy snowfall, Ours-snow+wet achieves the highest 3D AP among the four baselines (LISA, Snow-sim, Spray, and LAWA) across all six detectors for the 0–50 m Car moderate setting. With PV-RCNN, it reaches 49.42% (0–50 mAP), improving over the baseline by 1.68%. Similar improvements are observed for Voxel-RCNN (+1.05%), CenterPoint (+1.32%), SECOND (+0.92%), PointPillars (+0.78%), and DSVT (+1.50%). The ablation analysis shows that the snow-covered ground module is the dominant contributor under heavy snow: Ours-snow alone yields AP improvements of 1.82% (PV-RCNN), 1.42% (Voxel-RCNN), 1.24% (CenterPoint), 0.96% (SECOND), 0.70% (PointPillars), and 1.60% (DSVT). Table 2 also shows that Ours-snow+wet does not always exceed Ours-snow on 0–50 mAP. We attribute this to distribution interference between the two ground-effect modules: the wet ground module introduces near-field spray noise and diffuse intensity changes concentrated at close range (<15 m), while the snow-covered ground module modifies reflectance more uniformly across all distances. When combined, the superposition of these distinct noise patterns can shift the augmented data distribution away from the optimal training regime for specific detector architectures. This effect is most pronounced with architectures that rely on local feature aggregation (e.g., PV-RCNN’s keypoint set abstraction), where conflicting near-field statistics may degrade feature quality. In contrast, pillar-based methods like PointPillars that aggregate features globally are less sensitive to this interference, as reflected by their more consistent gains with the combined model.
Despite this, we report Ours-snow+wet as the default configuration for two reasons. First, it represents the full proposed pipeline under the unified precipitation parameterization and covers both wet and snow-covered road conditions that coexist in real snowy environments. Second, across all detectors and snow splits, Ours-snow+wet consistently outperforms all four prior baselines, confirming its overall effectiveness even if individual ablation variants occasionally achieve higher AP on specific splits. An adaptive weighting mechanism that dynamically balances the two modules based on precipitation intensity could further mitigate this interference and represents a promising direction for future work.
Under light snowfall, Ours-snow+wet improves AP by 1.08% with PV-RCNN, surpassing LAWA by 0.33%. The wet ground module becomes the primary contributor. Ours-wet achieves AP gains across all detectors (e.g., 1.60% for PV-RCNN, 0.62% for SECOND, 1.00% for DSVT). This aligns with the expectation that light precipitation creates wet surfaces with spray effects rather than significant snow accumulation. Although Ours-wet occasionally achieves higher 0–50 mAP than Ours-snow+wet for individual detectors under light snow (Table 2), Ours-snow+wet consistently outperforms all four baselines across most light-snow splits. We adopt Ours-snow+wet as the default configuration because it unifies both ground-effect types under a single precipitation-driven parameterization.
Under clear-weather conditions, performance variations remain within 0.30% of the baseline for all six detectors (PV-RCNN: −0.23%, Voxel-RCNN: −0.28%, CenterPoint: −0.25%, SECOND: −0.20%, PointPillars: −0.16%, DSVT: −0.17%). This demonstrates that our simulation improves adverse-weather robustness without degrading normal-condition accuracy. The consistent improvements observed with DSVT [25], a Transformer-based backbone, further confirm that the performance gains are not limited to CNN-based architectures.
Across all configurations in Table 2, the median standard deviation over three training runs is 0.28% AP, and all reported improvements of Ours-snow+wet over the baselines exceed twice the combined standard deviation, indicating that these gains are statistically reliable.
We further observe that the distance-stratified evaluation reveals nuanced performance characteristics: the 0–30 m range consistently shows the largest improvements, as ground-level effects are most pronounced at closer ranges where LiDAR beams interact with the ground surface at steep incident angles. In contrast, the 30–50 m range shows more modest gains, reflecting the reduced ground point density and lower signal power at greater distances. Overall, the proposed method achieves consistent performance improvements across different snowfall intensities, with more pronounced gains in the 0–30 m range, while preserving detection accuracy under clear-weather conditions.
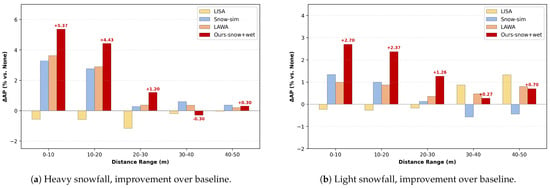
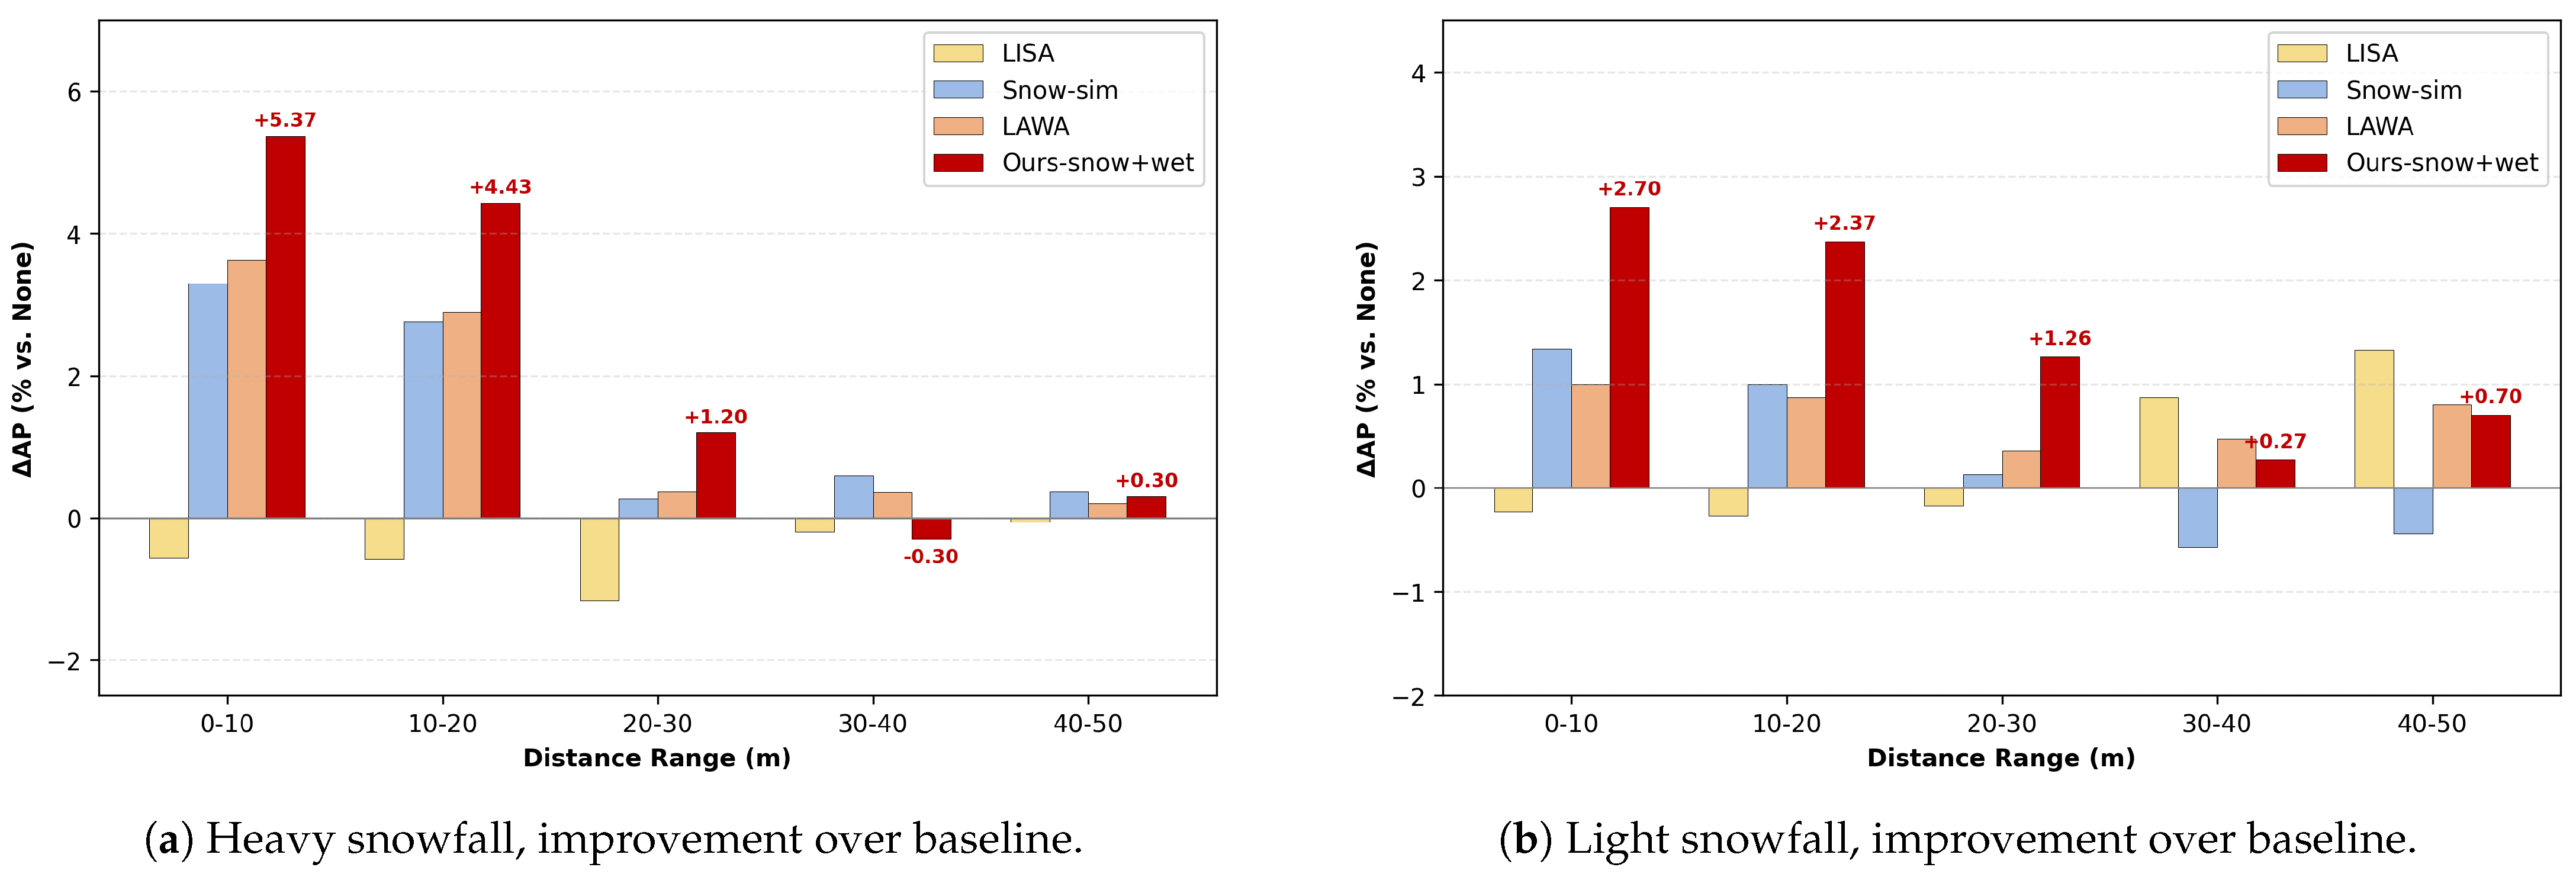
To provide a more detailed analysis, we further evaluate 3D AP for PV-RCNN across five 10 m distance intervals, reporting absolute AP in Table 3 and the improvement over the unaugmented baseline in Figure 5. The results show that the gains of Ours-snow+wet are concentrated in the 0–20 m safety-critical range, reaching up to +5.37% AP at 0–10 m under heavy snowfall and +2.70% AP under light snowfall. The improvements decrease to around +1.2% AP in the 20–30 m range and remain within ±0.30% AP of the baseline beyond 30 m.
Table 3.
3D AP (%) of PV-RCNN across distance intervals on STF. Bold indicates the proposed default configuration.
Figure 5.
Distance-wise 3D AP improvement over the baseline on STF using PV-RCNN. (a) Heavy snowfall. (b) Light snowfall.
4.3. Case Study
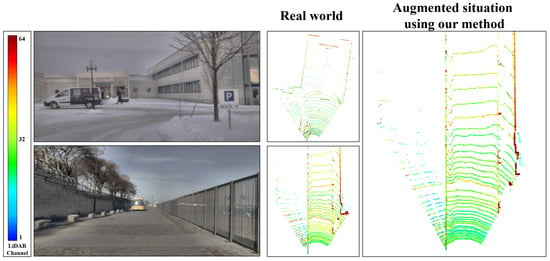
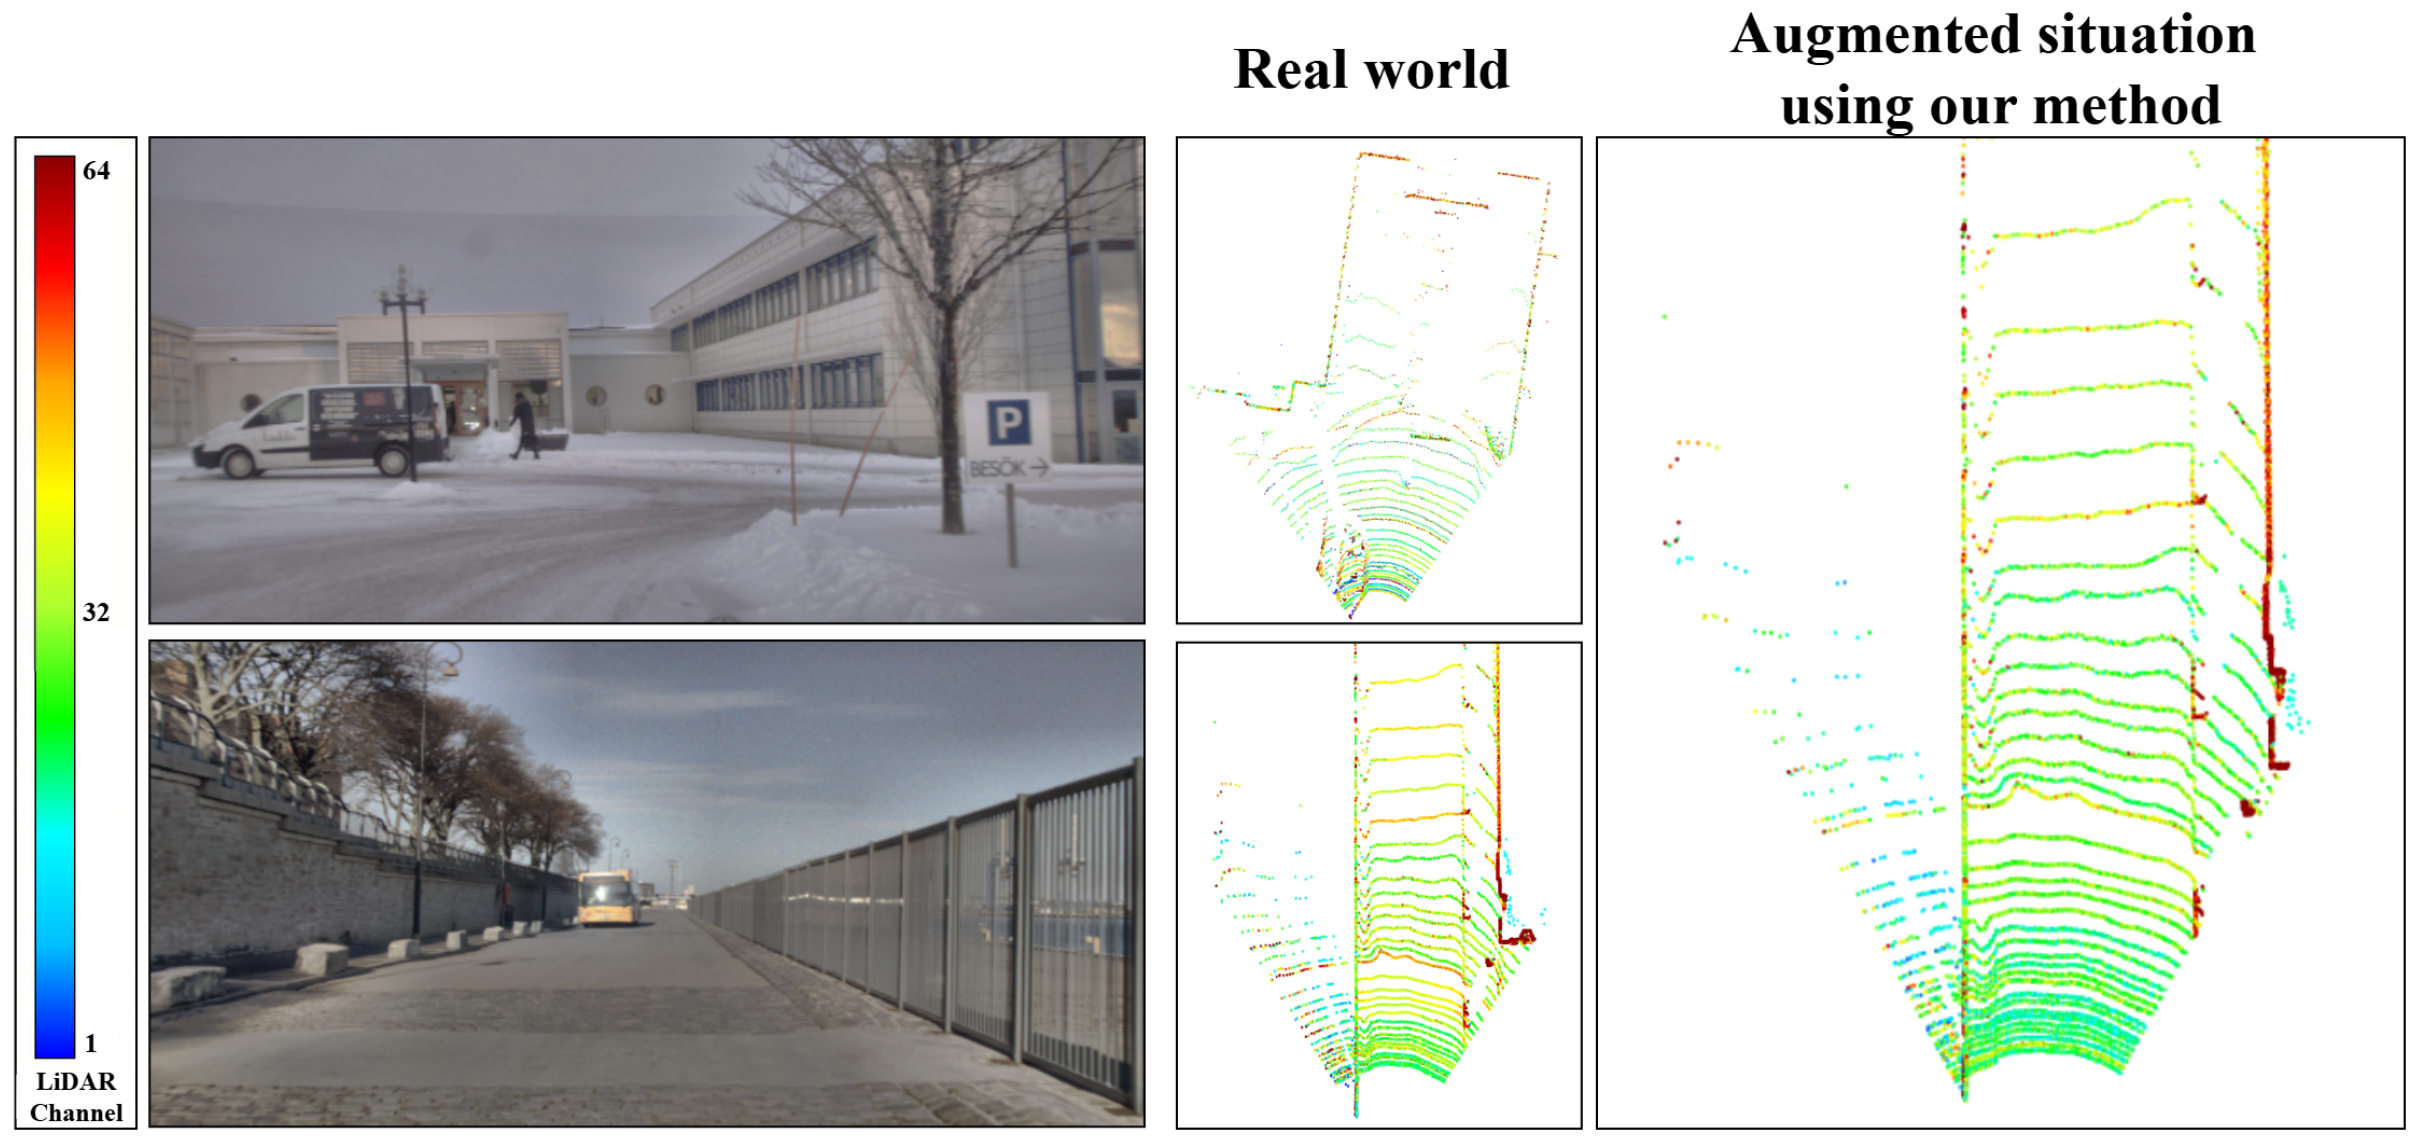
To further investigate the proposed method, Figure 6 presents a representative case study, visually comparing real snowy scenes with the augmented LiDAR point clouds generated by our approach. The selected scenes share flat ground surfaces, as the comparison focuses on the physical phenomenon of snow-induced intensity attenuation governed by the optical properties of the snow layer. As shown in the figure, real snow-covered ground exhibits noticeable attenuation in ground return intensity. Our simulation reproduces similar attenuation patterns, with comparable spatial distributions, indicating consistent modeling of snow-induced ground effects.
Figure 6.
Qualitative comparison of real and simulated snow-covered ground effects. Left column: RGB reference images under snowy (top) and clear weather (bottom). Middle column: real-world LiDAR point clouds under corresponding conditions. Right column: augmented point clouds using our simulation method applied to the corresponding clear-weather data (bottom), compared with real snow data (top). Color indicates LiDAR intensity.
We compute the total intensity reduction over identical ground regions to further support this observation. Real snow-covered ground shows a 16.8% reduction compared to clear-weather conditions, while the simulated snow-covered ground exhibits a comparable 18.4% reduction, indicating that our method closely matches real snow-induced ground intensity attenuation. Furthermore, the spatial distribution of attenuated regions in the simulated data aligns well with the real data: both exhibit stronger attenuation in near-range areas where LiDAR beams strike the ground at steeper angles, consistent with the angle-dependent backscattering predicted by our dual-mode model.
To quantify simulation fidelity across the entire dataset, we compute the KL divergence between the normalized ground-point intensity histograms of real snow and each simulation method, yielding KL = 0.031 for our method, 0.089 for Snow-sim [6], and 0.142 for LISA [5]. These dataset-wide statistics provide objective evidence of simulation fidelity independent of any specific scene pair.
4.4. Parameter Sensitivity Analysis
We investigate the sensitivity of detection performance to key ground-effect parameters using PV-RCNN on the STF heavy snow split. PV-RCNN is selected as the representative detector because it achieves strong baseline performance and exhibits high sensitivity to ground-effect augmentation (Table 2). The heavy snow split is chosen because the snow-covered ground module contributes most significantly under this condition, enabling clearer observation of parameter effects. Three parameters are varied independently while others are held at default values (Table 4).
Table 4.
Parameter sensitivity analysis on STF heavy snow (PV-RCNN, 3D AP %, mean over three runs). Default parameters: m, , mm. Bold indicates the best result within each parameter group.
Snow Depth . Table 4 (top) shows AP under different snow depth sampling ranges. Shallow depths ( m) produce insufficient augmentation variety, resulting in only moderate improvement over the baseline (48.83% vs. 47.74%). Excessive depths ( m) introduce overly aggressive intensity attenuation through the exponential decay in Equation (12), pushing the augmented data distribution too far from real snow characteristics and reducing AP to 48.47%. The default range m achieves the best balance (49.42%), covering the realistic accumulation depths observed in mild-to-moderate snowfall on the STF dataset.
Number of Snow Layers N. Table 4 (middle) compares single-layer and multi-layer configurations. The single-layer model () treats snow as homogeneous, achieving 48.91% AP. This is 0.51% lower than the default (49.42%), confirming that capturing the compacted-bottom-to-fresh-top density gradient via recursive reflectivity (Equation (9)) is important for realistic augmentation. Further increasing to yields no significant gain (49.39%), suggesting that three layers sufficiently capture the dominant vertical heterogeneity with minimal computational overhead.
Grain Radius . Table 4 (bottom) varies the ice grain radius. At nm, all tested radii satisfy and fall within the geometric optics regime, where . Smaller grains (0.3 mm) produce stronger scattering and more aggressive attenuation (AP: 48.97%), overshooting real snow characteristics. Larger grains (1.0 mm) produce weaker scattering and insufficient augmentation (AP: 48.72%). The default value 0.5 mm, typical for fresh-to-moderately aged snow, yields the best performance (49.42%), providing the closest match to real STF snow data.
Overall, the method exhibits moderate sensitivity to parameter choices, with the default configuration yielding the best or near-best results across all settings. Performance degrades gracefully when parameters deviate from defaults, indicating robustness to imprecise parameterization in practical deployments.
4.5. Computational Efficiency Analysis
To evaluate the computational performance of the proposed method, two sets of experiments are conducted on the STF training set, including a module-wise analysis and a method-level comparison.
The results of the module-wise analysis are presented in Table 5. As shown in the table, the total processing time of the proposed pipeline is 0.36 s per frame. Scattering point generation accounts for the largest portion at 0.14 s, while the wet-ground and snow-covered ground modules add 0.11 s and 0.09 s, respectively. Ground segmentation requires only 0.02 s as a preprocessing step.
Table 5.
Computational cost of each module.
Table 6 compares the total per-frame augmentation time against four representative physics-based baselines. The proposed method demonstrates a clear advantage in computational efficiency over Snow-sim [6], whose processing time is mainly associated with its per-frame 2D histogram-based intensity-estimation step. Owing to its more comprehensive modeling of physical effects, the proposed method incurs a slightly higher computational cost than LISA [5], Spray [15], and LAWA [14], while achieving higher detection accuracy within a comparable runtime range. These results indicate that the proposed method achieves a favorable trade-off between computational cost and modeling capability. The O(n) complexity and frame-level parallelism further support efficient scaling to large-scale point cloud datasets.
Table 6.
Comparison of average per-frame augmentation time across methods.
4.6. Comparison with Generative Weather Simulation
To further validate the effectiveness of the proposed physics-based approach, we include a comparison with a recent generative method, WeatherGen [35]. Following its original protocol, a comparable proportion of generated data (7.4%) is used to ensure similar exposure to adverse-weather conditions during training. Table 7 reports the comparison on STF using PV-RCNN, covering detection accuracy under heavy snow, light snow, and clear weather, together with per-frame augmentation time and pre-training requirement. Focusing on the heavy snowfall scenario as a representative case, our method reaches 49.42% AP (0–50 m), outperforming WeatherGen by 1.00%. Under light snowfall, our method reaches 51.59% AP, outperforming WeatherGen by 0.71%, and clear-weather performance is also better preserved (54.01% vs. 53.55%). These results suggest that explicitly modeling snow-specific ground-level effects helps represent LiDAR degradation under snowfall conditions more effectively. In addition, our method requires no pre-training and can be efficiently executed on a CPU, whereas WeatherGen relies on GPU-based diffusion inference along with large-scale pre-training and domain-specific fine-tuning, resulting in substantially higher computational cost.
Table 7.
Comparison with generative weather simulation on STF using PV-RCNN (3D AP %). Bold indicates the best snow-condition AP.
4.7. Generalization Validation on Roadside Dataset
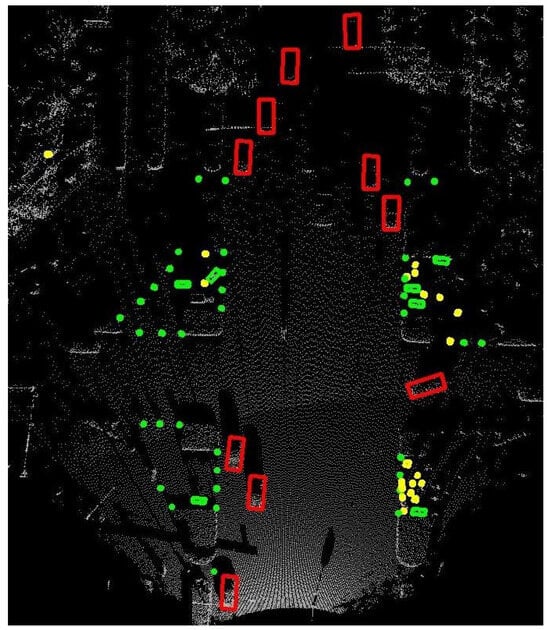
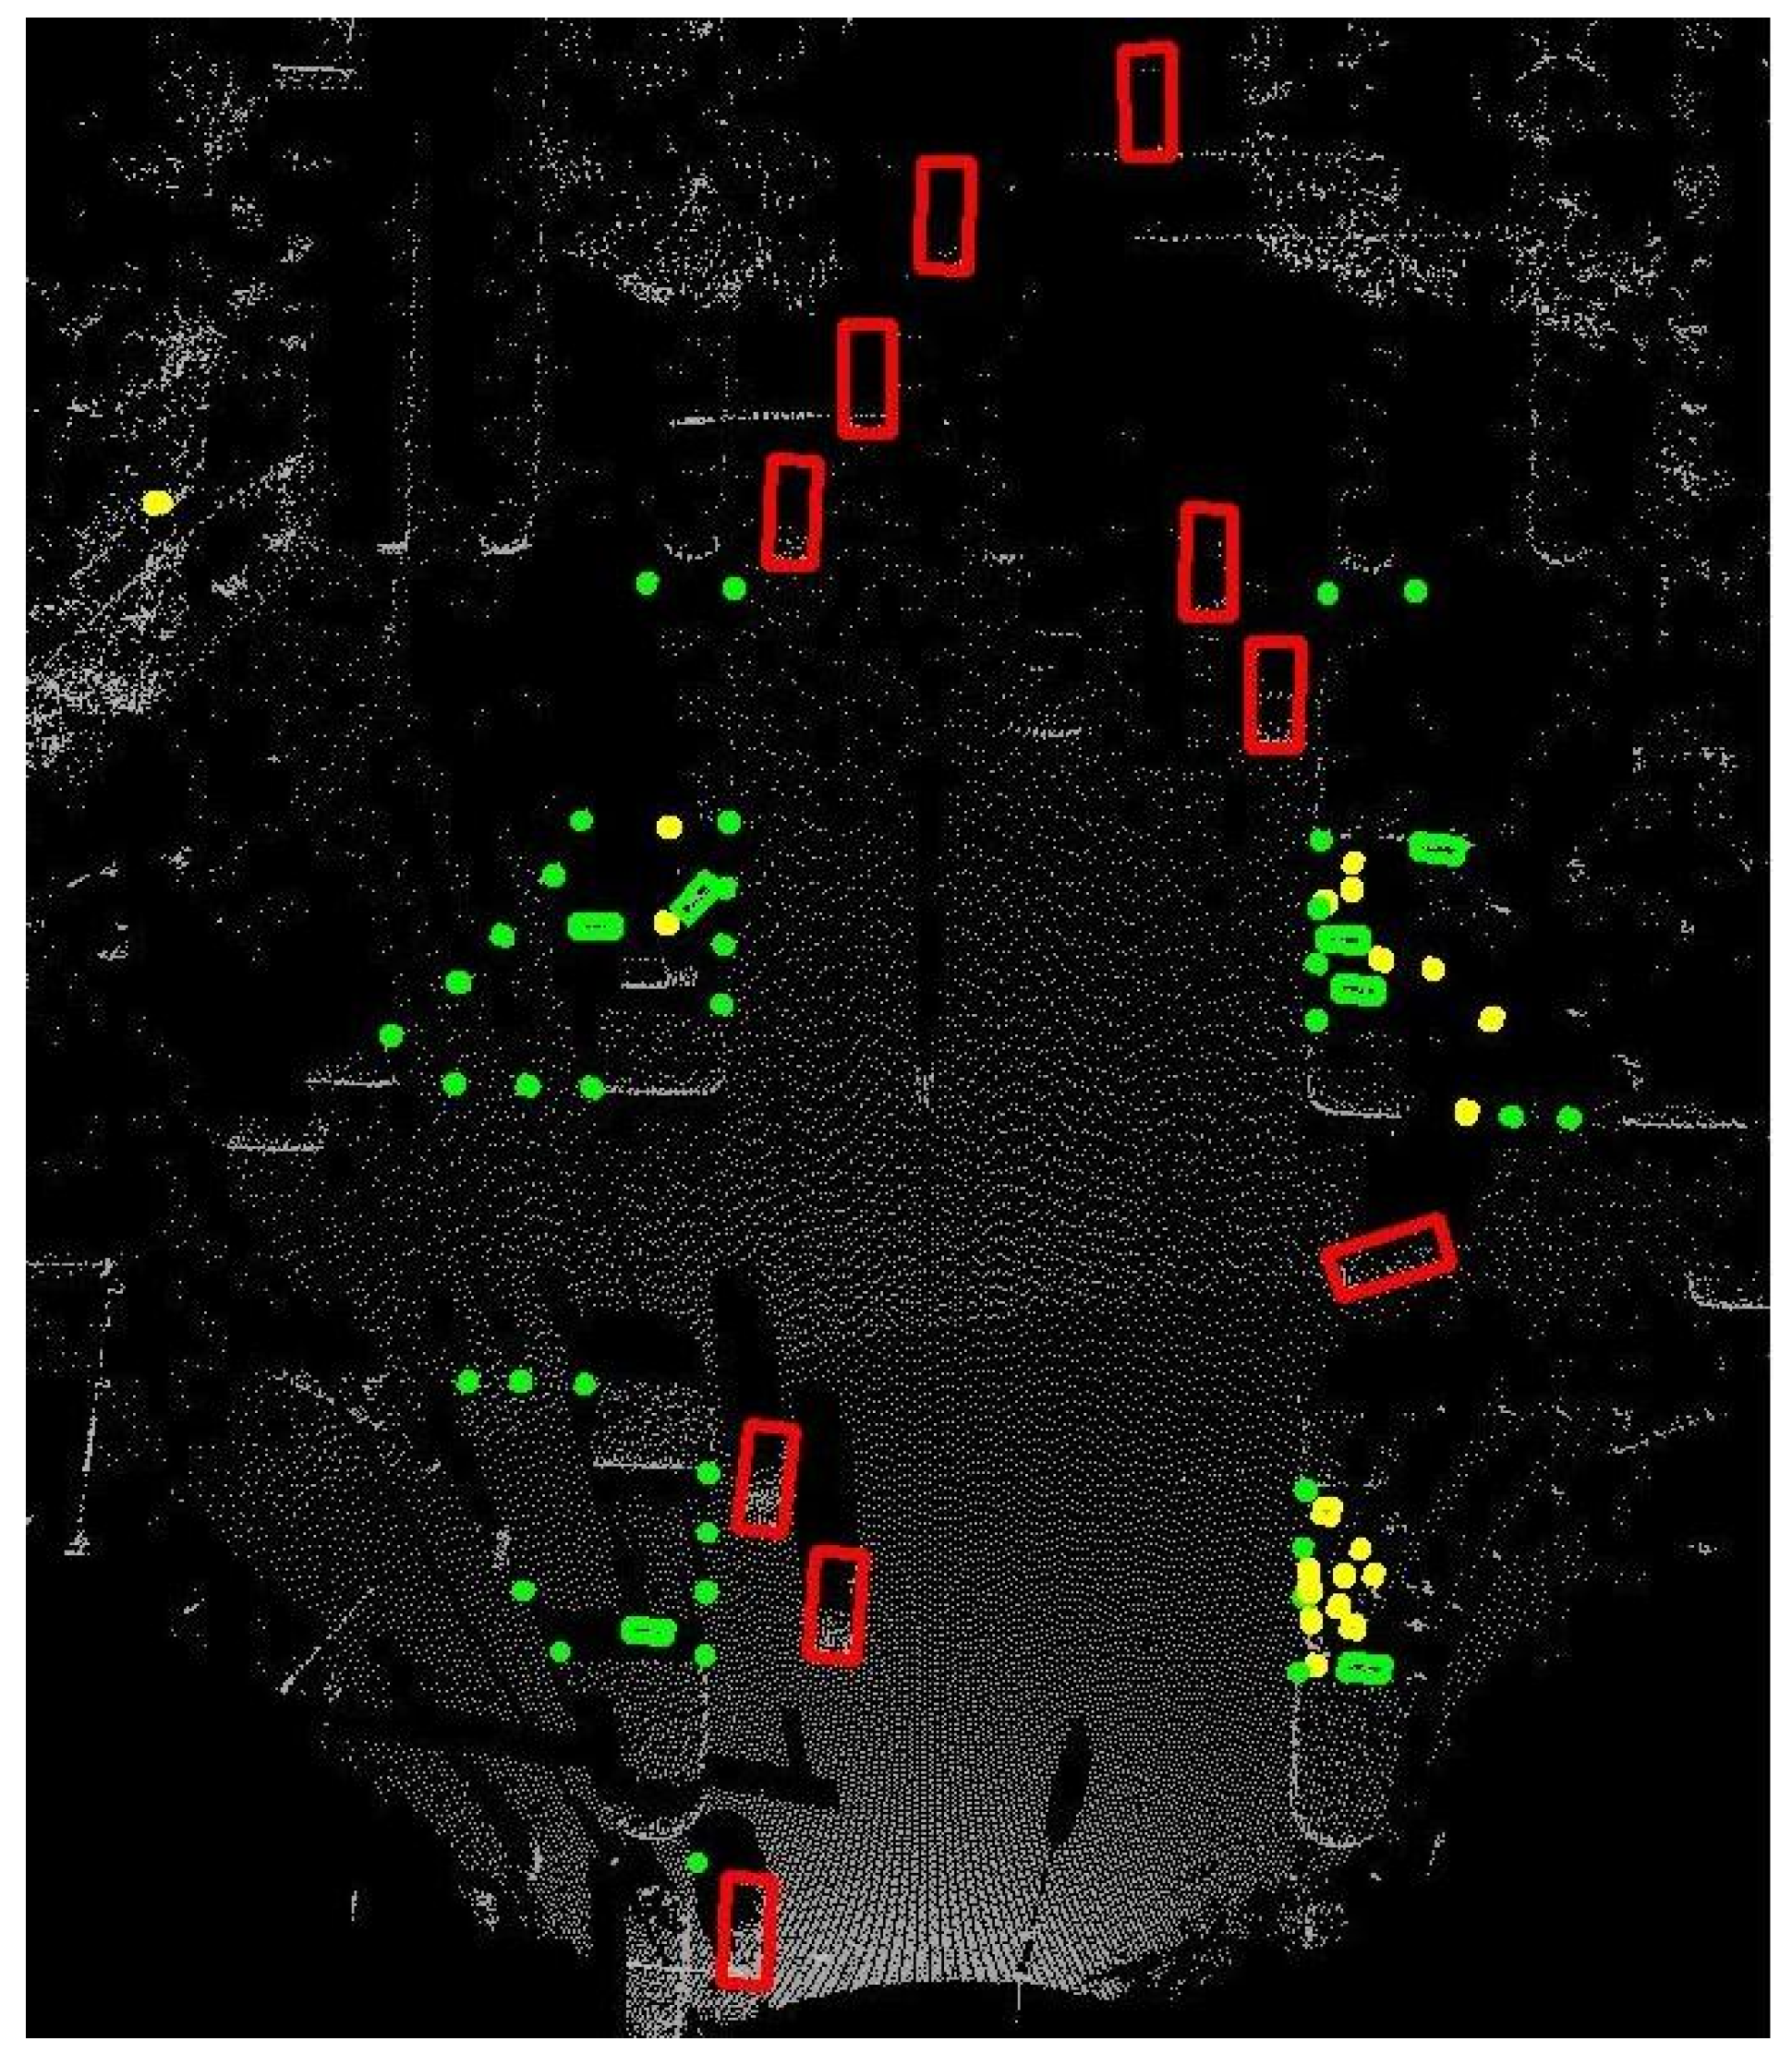
To assess the generalizability of the proposed simulation beyond vehicle-side perception, we evaluate on the DAIR-V2X-I roadside dataset [39] using PV-RCNN. This dataset features infrastructure-mounted LiDAR sensors with different mounting heights and viewing angles compared to vehicle-mounted sensors, providing a rigorous test of cross-platform transferability. The DAIR-V2X-I dataset includes frames captured across diverse weather conditions, including winter snowfall periods. We classify the test frames into precipitation-rate categories using the Dror algorithm [27], consistent with the STF evaluation protocol. Figure 7 shows a typical roadside LiDAR point cloud from DAIR-V2X-I, where multiple object categories (cars, pedestrians, cyclists, and traffic cones) must be reliably detected under varying weather conditions.
Figure 7.
Example of 3D object detection from roadside LiDAR point clouds on DAIR-V2X-I. Detected objects: cars (red), pedestrians (green), cyclists (yellow), and traffic cones.
Table 8 compares detection performance under different train–test settings. Training on clear-weather data alone leads to substantial degradation under snow: mAP decreases by 7.23% under light snowfall (0–1 mm/h) and by 11.26% under heavy snowfall (>2.5 mm/h). Incorporating simulated snow data during training mitigates this degradation. The performance drop reduces to 3.54% under light snow (51% relative reduction) and 6.91% under heavy snow (39% relative reduction). Clear-weather performance remains largely unchanged (mAP variation of −0.46%). These results demonstrate that the simulation captures real snow-induced degradation and generalizes to infrastructure-based LiDAR systems, suggesting that the underlying physical models capture fundamental snow–LiDAR interaction mechanisms rather than sensor-specific artifacts.
Table 8.
Generalization validation on DAIR-V2X-I: augmentation mitigates snow-induced degradation.
4.8. Summary of Findings
The above experiments yield several key findings. First, consistent improvements across all six detectors, spanning CNN-based and Transformer-based architectures, confirm that ground-level effects play a critical role in LiDAR degradation under snowy conditions. Second, the ablation analysis reveals a weather-intensity-dependent contribution pattern: the snow-covered ground module dominates under heavy snowfall, while the wet ground module is more effective under light snowfall. This aligns with physical expectations, as heavy snow accumulation primarily alters surface reflectance, while light precipitation creates wet surfaces with spray effects. When both modules are combined, distribution interference can occur due to the distinct noise patterns from wet ground (near-field spray) and snow-covered ground (uniform reflectance changes). Despite this, the default full configuration (Ours-snow+wet) consistently outperforms all prior baselines across detectors and snow splits, confirming its practical effectiveness. Third, the pipeline remains efficient, processing each frame in 0.36 s on a single CPU thread. Fourth, under comparable 7.4% generated-data exposure, the WeatherGen comparison suggests that explicitly modeling snow-specific ground-level effects better captures LiDAR degradation under snowfall. Fifth, the DAIR-V2X-I validation demonstrates effective transfer to infrastructure-based LiDAR systems without sensor-specific tuning.
These findings also suggest directions for improvement. An adaptive weighting mechanism that dynamically balances the two modules based on precipitation intensity could further mitigate distribution interference. Incorporating more sophisticated snow metamorphism models and extending the framework to additional weather conditions such as mixed rain–snow events represent natural next steps.
5. Conclusions
This paper addresses the limited modeling of ground-level effects in existing LiDAR adverse-weather simulation methods. Ground-level interactions constitute a significant yet overlooked source of LiDAR degradation under snowy conditions. We propose two physics-based ground-effect modules. The first is an extended spray model with precipitation-controlled parameters that jointly models spray noise and wet ground attenuation. The second is a multi-layer dual-mode backscattering model that captures both diffuse volume scattering and specular interface reflections on snow-covered ground. Both modules share a unified precipitation-driven parameterization ensuring physical consistency across all modules without sensor-specific tuning. The method can work with any existing atmospheric scattering module.
Experiments on the STF dataset demonstrate consistent improvements over four state-of-the-art methods across six detectors under both heavy and light snowfall. AP gains reach up to 1.82% without degrading clear-weather performance. The ablation analysis reveals a weather-intensity-dependent contribution pattern. The snow-covered ground module dominates under heavy snowfall, while the wet ground module is more effective under light snowfall. Compared with WeatherGen, the proposed method achieves higher snow-condition AP through explicit ground-effect modeling while requiring no pre-training or GPU-based diffusion inference. Generalization experiments on the DAIR-V2X-I roadside dataset confirm effective transfer to infrastructure-based systems, reducing snow-induced degradation by up to 51%. In addition, the proposed method is formulated based on general physical quantities and does not rely on specific sensor geometry, making it applicable to both traditional spinning mechanical LiDARs and emerging solid-state LiDARs.
A limitation of the current work is that it does not yet model dynamic snow accumulation over time or the transitionary surface states among wet slush, black ice, and dry snow, which will be addressed in future work.
Author Contributions
Conceptualization, X.J. and Z.X.; methodology, X.J. and R.Z.; software, X.J.; validation, X.J., Y.X. and J.L.; formal analysis, X.J.; investigation, R.Z.; resources, Z.X. and S.L.; data curation, X.J.; writing—original draft preparation, X.J.; writing—review and editing, F.F. and S.L.; visualization, X.J.; supervision, Z.X. and F.F.; project administration, F.F.; funding acquisition, Z.X. and S.L. All authors have read and agreed to the published version of the manuscript.
Funding
This research was funded by the National Natural Science Foundation of China under Grant No. 42371420.
Institutional Review Board Statement
Not applicable.
Informed Consent Statement
Not applicable.
Data Availability Statement
The code is available at https://github.com/open-Simulation/LiDAR-snow-sim (accessed on 26 April 2026). The STF dataset is publicly available at https://github.com/princeton-computational-imaging/SeeingThroughFog (accessed on 26 April 2026). The DAIR-V2X-I dataset is available at https://air.tsinghua.edu.cn/DAIR.htm (accessed on 26 April 2026).
Acknowledgments
The authors would like to thank the anonymous reviewers for their valuable comments and suggestions.
Conflicts of Interest
The authors declare no conflicts of interest.
References
- Sun, P.; Sun, C.; Wang, R.; Zhao, X. Object detection based on roadside LiDAR for cooperative driving automation: A review. Sensors 2022, 22, 9316. [Google Scholar] [CrossRef] [Scilit] [PubMed]
- Kutila, M.; Pyykönen, P.; Jokela, M.; Gruber, T.; Bijelic, M.; Ritter, W. Benchmarking Automotive LiDAR Performance in Arctic Conditions. In Proceedings of the 2020 IEEE 23rd International Conference on Intelligent Transportation Systems (ITSC), Rhodes, Greece, 20–23 September 2020; pp. 1–8. [Google Scholar] [CrossRef] [Scilit]
- Sun, C.; Sun, P.; Wang, J.; Guo, Y.; Zhao, X. Understanding LiDAR Performance for Autonomous Vehicles Under Snowfall Conditions. IEEE Trans. Intell. Transp. Syst. 2024, 25, 16462–16472. [Google Scholar] [CrossRef] [Scilit]
- Rasshofer, R.H.; Spies, M.; Spies, H. Influences of Weather Phenomena on Automotive Laser Radar Systems. Adv. Radio Sci. 2011, 9, 49–60. [Google Scholar] [CrossRef] [Scilit]
- Kilic, V.; Hegde, D.; Cooper, A.B.; Patel, V.M.; Foster, M. LiDAR Light Scattering Augmentation (LISA): Physics-based Simulation of Adverse Weather Conditions for 3D Object Detection. In Proceedings of the ICASSP 2025—2025 IEEE International Conference on Acoustics, Speech and Signal Processing (ICASSP), Hyderabad, India, 6–11 April 2025; pp. 1–5. [Google Scholar] [CrossRef] [Scilit]
- Hahner, M.; Sakaridis, C.; Bijelic, M.; Heide, F.; Yu, F.; Dai, D.; Van Gool, L. LiDAR Snowfall Simulation for Robust 3D Object Detection. In Proceedings of the 2022 IEEE/CVF Conference on Computer Vision and Pattern Recognition (CVPR), New Orleans, LA, USA, 18–24 June 2022; pp. 16343–16353. [Google Scholar] [CrossRef] [Scilit]
- Dreissig, M.; Scheuble, D.; Piewak, F.; Boedecker, J. Survey on LiDAR Perception in Adverse Weather Conditions. In Proceedings of the 2023 IEEE Intelligent Vehicles Symposium (IV), Anchorage, AK, USA, 18–24 June 2023; pp. 1–8. [Google Scholar] [CrossRef] [Scilit]
- Filgueira, A.; González-Jorge, H.; Lagüela, S.; Díaz-Vilariño, L.; Arias, P. Quantifying the Influence of Rain in LiDAR Performance. Measurement 2017, 95, 143–148. [Google Scholar] [CrossRef] [Scilit]
- Shin, J.; Park, H.; Kim, T. Characteristics of laser backscattering intensity to detect frozen and wet surfaces on roads. J. Sens. 2019, 2019, 8973248. [Google Scholar] [CrossRef] [Scilit]
- Huang, H.; Yan, X.; Yang, J.; Cao, Y.; Zhang, X. LIDSOR: A filter for removing rain and snow noise points from LiDAR point clouds in rainy and snowy weather. Int. Arch. Photogramm. Remote Sens. Spat. Inf. Sci. 2023, XLVIII-1/W2-2023, 733–740. [Google Scholar] [CrossRef] [Scilit]
- Walz, S.; Bijelic, M.; Kraus, F.; Ritter, W.; Simon, M.; Doric, I. A benchmark for spray from nearby cutting vehicles. In Proceedings of the 2021 IEEE International Intelligent Transportation Systems Conference (ITSC), Indianapolis, IN, USA, 19–22 September 2021; pp. 188–195. [Google Scholar] [CrossRef] [Scilit]
- Shearman, E.; Hoare, E.; Hutton, A. Trials of automotive radar and lidar performance in road spray. In Proceedings of the IEE Colloquium on Automotive Radar and Navigation Techniques (Ref. No. 1998/230), London, UK, 9 February 1998; pp. 10/1–10/7. [Google Scholar] [CrossRef] [Scilit]
- Radecki, P.; Campbell, M.; Matzen, K. All Weather Perception: Joint Data Association, Tracking, and Classification for Autonomous Ground Vehicles. arXiv 2016, arXiv:1605.02196. [Google Scholar] [CrossRef] [Scilit]
- Kang, H.; Lee, J.; Ha, J.; Kim, S.; Jo, K. LAWA: LiDAR Adverse Weather Augmentation for Robust Point Cloud Semantic Segmentation. IEEE Sens. J. 2025, 25, 30186–30196. [Google Scholar] [CrossRef] [Scilit]
- Yang, D.; Cai, X.; Liu, Z.; Jiang, W.; Zhang, B.; Yan, G.; Gao, X.; Liu, S.; Shi, B. Realistic rainy weather simulation for lidars in CARLA simulator. In Proceedings of the 2024 IEEE/RSJ International Conference on Intelligent Robots and Systems (IROS), Abu Dhabi, United Arab Emirates, 14–18 October 2024; pp. 951–957. [Google Scholar] [CrossRef] [Scilit]
- Mao, J.; Shi, S.; Wang, X.; Li, H. 3D Object Detection for Autonomous Driving: A Comprehensive Survey. Int. J. Comput. Vis. 2023, 131, 1909–1963. [Google Scholar] [CrossRef] [Scilit]
- Guo, Y.; Wang, H.; Hu, Q.; Liu, H.; Liu, L.; Bennamoun, M. Deep Learning for 3D Point Clouds: A Survey. IEEE Trans. Pattern Anal. Mach. Intell. 2021, 43, 4338–4364. [Google Scholar] [CrossRef] [Scilit] [PubMed]
- Qi, C.R.; Su, H.; Mo, K.; Guibas, L.J. PointNet: Deep Learning on Point Sets for 3D Classification and Segmentation. In Proceedings of the 2017 IEEE Conference on Computer Vision and Pattern Recognition (CVPR), Honolulu, HI, USA, 21–26 July 2017; pp. 652–660. [Google Scholar] [CrossRef] [Scilit]
- Zhou, Y.; Tuzel, O. VoxelNet: End-to-End Learning for Point Cloud Based 3D Object Detection. In Proceedings of the 2018 IEEE/CVF Conference on Computer Vision and Pattern Recognition (CVPR), Salt Lake City, UT, USA, 18–23 June 2018; pp. 4490–4499. [Google Scholar] [CrossRef] [Scilit]
- Yan, Y.; Mao, Y.; Li, B. SECOND: Sparsely Embedded Convolutional Detection. Sensors 2018, 18, 3337. [Google Scholar] [CrossRef] [Scilit] [PubMed]
- Deng, J.; Shi, S.; Li, P.; Zhou, W.; Zhang, Y.; Li, H. Voxel R-CNN: Towards high performance voxel-based 3D object detection. In Proceedings of the AAAI Conference on Artificial Intelligence, Vancouver, BC, Canada, 2–9 February 2021; Volume 35, pp. 1201–1209. [Google Scholar] [CrossRef] [Scilit]
- Lang, A.H.; Vora, S.; Caesar, H.; Zhou, L.; Yang, J.; Beijbom, O. PointPillars: Fast Encoders for Object Detection from Point Clouds. In Proceedings of the 2019 IEEE/CVF Conference on Computer Vision and Pattern Recognition (CVPR), Long Beach, CA, USA, 15–20 June 2019; pp. 12697–12705. [Google Scholar] [CrossRef] [Scilit]
- Yin, T.; Zhou, X.; Krahenbuhl, P. Center-based 3D Object Detection and Tracking. In Proceedings of the 2021 IEEE/CVF Conference on Computer Vision and Pattern Recognition (CVPR), Nashville, TN, USA, 20–25 June 2021; pp. 11784–11793. [Google Scholar] [CrossRef] [Scilit]
- Shi, S.; Guo, C.; Jiang, L.; Wang, Z.; Shi, J.; Wang, X.; Li, H. PV-RCNN: Point-Voxel Feature Set Abstraction for 3D Object Detection. In Proceedings of the 2020 IEEE/CVF Conference on Computer Vision and Pattern Recognition (CVPR), Seattle, WA, USA, 13–19 June 2020; pp. 10526–10535. [Google Scholar] [CrossRef] [Scilit]
- Wang, H.; Shi, S.; Yang, Z.; Fang, R.; Qian, Q.; Li, H.; Schiele, B.; Wang, L. DSVT: Dynamic Sparse Voxel Transformer with Rotated Sets. In Proceedings of the 2023 IEEE/CVF Conference on Computer Vision and Pattern Recognition (CVPR), Vancouver, BC, Canada, 17–24 June 2023; pp. 13520–13529. [Google Scholar] [CrossRef] [Scilit]
- Heinzler, R.; Piewak, F.; Schindler, P.; Stork, W. CNN-based LiDAR point cloud de-noising in adverse weather. IEEE Robot. Autom. Lett. 2020, 5, 2514–2521. [Google Scholar] [CrossRef] [Scilit]
- Charron, N.; Phillips, S.; Waslander, S.L. De-noising of LiDAR point clouds corrupted by snowfall. In Proceedings of the 2018 15th Conference on Computer and Robot Vision (CRV), Toronto, ON, Canada, 8–10 May 2018; pp. 254–261. [Google Scholar] [CrossRef] [Scilit]
- Piroli, A.; Dallabetta, V.; Kopp, J.; Walessa, M.; Meissner, D.; Dietmayer, K. SemanticSpray++: A Multimodal Dataset for Autonomous Driving in Wet Surface Conditions. In Proceedings of the 2024 IEEE Intelligent Vehicles Symposium (IV), Jeju Island, Republic of Korea, 2–5 June 2024; pp. 1–8. [Google Scholar] [CrossRef] [Scilit]
- Jokela, M.; Kutila, M.; Pyykönen, P. Testing and Validation of Automotive Point-Cloud Sensors in Adverse Weather Conditions. Appl. Sci. 2019, 9, 2341. [Google Scholar] [CrossRef] [Scilit]
- Hahner, M.; Sakaridis, C.; Dai, D.; Van Gool, L. Fog Simulation on Real LiDAR Point Clouds for 3D Object Detection in Adverse Weather. In Proceedings of the 2021 IEEE/CVF International Conference on Computer Vision (ICCV), Montreal, QC, Canada, 10–17 October 2021; pp. 15283–15292. [Google Scholar] [CrossRef] [Scilit]
- Linnhoff, C.; Scheuble, D.; Bijelic, M.; Elster, L.; Rosenberger, P.; Ritter, W.; Dai, D.; Winner, H. Simulating Road Spray Effects in Automotive LiDAR Sensor Models. In Proceedings of the 2024 IEEE Intelligent Vehicles Symposium (IV), Jeju Island, Republic of Korea, 2–5 June 2024; pp. 1–8. [Google Scholar] [CrossRef] [Scilit]
- Lian, H.; Peng, R.; Feng, R.; Li, Z.; Wang, B.; Zhang, H. LIDAR Point Cloud Augmentation for Dusty Weather Based on a Physical Simulation. Mathematics 2024, 12, 141. [Google Scholar] [CrossRef] [Scilit]
- Vargas Rivero, J.R.; Gerbich, T.; Buschardt, B.; Chen, J. Data Augmentation of Automotive LIDAR Point Clouds under Adverse Weather Situations. Sensors 2021, 21, 4503. [Google Scholar] [CrossRef] [Scilit] [PubMed]
- Zhang, Y.; Ding, M.; Yang, H.; Niu, Y.; Ge, M.; Ohtani, K.; Zhang, C.; Takeda, K. LiDAR Point Cloud Augmentation for Adverse Conditions Using Conditional Generative Model. Remote Sens. 2024, 16, 2247. [Google Scholar] [CrossRef] [Scilit]
- Wu, Y.; Zhu, Y.; Zhang, K.; Qian, J.; Xie, J.; Yang, J. WeatherGen: A unified diverse weather generator for LiDAR point clouds via spider mamba diffusion. In Proceedings of the Computer Vision and Pattern Recognition Conference, Nashville, TN, USA, 10–17 June 2025; pp. 17019–17028. [Google Scholar] [CrossRef] [Scilit]
- Bijelic, M.; Gruber, T.; Mannan, F.; Kraus, F.; Ritter, W.; Dietmayer, K.; Heide, F. Seeing Through Fog Without Seeing Fog: Deep Multimodal Sensor Fusion in Unseen Adverse Weather. In Proceedings of the 2020 IEEE/CVF Conference on Computer Vision and Pattern Recognition (CVPR), Seattle, WA, USA, 13–19 June 2020; pp. 11679–11689. [Google Scholar] [CrossRef] [Scilit]
- Proksch, M.; Mätzler, C.; Wiesmann, A.; Lemmetyinen, J.; Schwank, M.; Löwe, H.; Schneebeli, M. MEMLS3&a: Microwave Emission Model of Layered Snowpacks adapted to include backscattering. Geosci. Model Dev. 2015, 8, 2611–2626. [Google Scholar] [CrossRef] [Scilit]
- Geiger, A.; Lenz, P.; Urtasun, R. Are we ready for autonomous driving? The KITTI vision benchmark suite. In Proceedings of the 2012 IEEE Conference on Computer Vision and Pattern Recognition, Providence, RI, USA, 16–21 June 2012; pp. 3354–3361. [Google Scholar] [CrossRef] [Scilit]
- Yu, H.; Luo, Y.; Shu, M.; Huo, Y.; Yang, Z.; Shi, Y.; Guo, Z.; Li, H.; Hu, X.; Yuan, J.; et al. DAIR-V2X: A Large-Scale Dataset for Vehicle-Infrastructure Cooperative 3D Object Detection. In Proceedings of the 2022 IEEE/CVF Conference on Computer Vision and Pattern Recognition (CVPR), New Orleans, LA, USA, 18–24 June 2022; pp. 21329–21338. [Google Scholar] [CrossRef] [Scilit]

Disclaimer/Publisher’s Note: The statements, opinions and data contained in all publications are solely those of the individual author(s) and contributor(s) and not of MDPI and/or the editor(s). MDPI and/or the editor(s) disclaim responsibility for any injury to people or property resulting from any ideas, methods, instructions or products referred to in the content. |
© 2026 by the authors. Licensee MDPI, Basel, Switzerland. This article is an open access article distributed under the terms and conditions of the Creative Commons Attribution (CC BY) license.