Article

Assessing Baseline Soil Carbon, Organic Matter, and Nitrogen Content Associated with Different Rangeland Management Practices in Oregon, USA


by
Carlos G. Ochoa
1,
Mohamed A. B. Abdallah
1,*,
María Jose Iglesias Thome
1,
Daniel G. Gómez
1 and
Ricardo Mata-González
2
1
Ecohydrology Lab, College of Agricultural Sciences, Oregon State University, Corvallis, OR 97331, USA
2
Unidad Regional Universitaria de Zonas Áridas, Universidad Autónoma Chapingo, Bermejillo 35230, Durango, Mexico
*
Author to whom correspondence should be addressed.
Appl. Sci. 2026, 16(9), 4212; https://doi.org/10.3390/app16094212
Submission received: 19 March 2026 / Revised: 20 April 2026 / Accepted: 21 April 2026 / Published: 25 April 2026

Abstract

Understanding how land management influences soil carbon (C) and nitrogen (N) dynamics is critical for improving ecosystem resilience and carbon sequestration potential in semiarid rangelands. This study used classical field- and laboratory-based methods to assess soil organic carbon (SOC), organic matter (OM), and N content at 13 sites across four ecological provinces in eastern Oregon, USA. Treated sites—where traditional rangeland restoration and management practices had been applied to them (i.e., juniper removal, sagebrush removal, post-fire grass seeding, and land conversion to pasture)—were paired with adjacent untreated control sites. Soil samples were collected at two depths, 0 to 10 cm and 15 to 25 cm and analyzed for C, N, OM, bulk density (BD), soil volumetric water content (SVWC), porosity, and texture. Soil C and N stocks were calculated on an area basis (t ha−1), and statistical analyses were conducted using one-way ANOVA and correlation tests. Treated sites generally exhibited higher soil C, N, and OM content compared to untreated sites, particularly in the upper 10 cm of soil. Data obtained from the two soil depths (0 to 10 cm and 15 to 25 cm) were averaged and assumed to represent the top 30 cm of the soil profile, corresponding to the effective rooting zone at each field. The site where sagebrush removal was followed by grass seeding exhibited the highest soil C and N stocks (115.8 t C ha−1 and 9.2 t N ha−1, respectively). This site also had the highest OM content (9.53%), which was observed in the topsoil layer (0 to 10 cm) across all sites and depths. Strong positive correlations between C and N were detected across all sites (mean r = 0.92), while negative correlations were observed between soil C and bulk density at several locations. Results suggest that vegetation management practices such as woody plant removal and grass establishment can enhance soil C storage and nutrient retention in semiarid rangeland ecosystems. These findings provide baseline data to inform land management strategies aimed at improving soil health and carbon sequestration potential in the Pacific Northwest region in the USA.

1. Introduction

Rangelands encompass 40% to 50% of Earth’s ice-free terrestrial surface and represent a significant land-use category, covering vast areas worldwide [1,2]. These diverse landscapes range from coastal prairies to arid high-desert regions and are distinguished by their unique climatic conditions, varied vegetation types, and tailored land management practices [3]. Due to their global distribution and potential for high carbon (C) sequestration rates, properly managed rangeland ecosystems can serve as an important C sink [4,5]. Rangelands currently store between 10% and 30% of terrestrial C [6,7], with a substantial portion as SOC [8,9].
Rangelands tend to be nitrogen (N)- limited [10], which can affect C sequestration by constraining plant growth (aboveground and belowground) and reducing conversion to soil organic matter (OM) [9,11]. While biomass from standing vegetation in rangeland ecosystems can store significant amounts of C [12,13,14] and N [15], these aboveground pools are considered unstable and often transient due to their susceptibility to rapid loss from environmental stressors such as drought and wildfires [16,17]. Conversely, soils in rangeland ecosystems can serve as more stable, long-term reservoirs of C and N, with higher sequestration potentials than their aboveground counterparts [18,19,20]. As global interest in climate mitigation intensifies, understanding the role of rangeland soils in long-term carbon storage becomes increasingly vital.
Soil C and N content, particularly C:N ratios, are important indicators of soil health, as they influence microbial activity, OM decomposition, and nutrient availability [21,22]. Rangeland soils typically have a C:N ratio between 10:1 and 12:1 [23], agricultural soils tend to be lower, around 8:1 to 10:1 [24], while forest soils, especially those with high litterfall, can exceed 20:1 due to slower decomposition rates and higher lignin content [25]. Similarly, soil C and N content vary across the soil profile [26,27]. Characterizing soil C and N stocks within the top 0.30 m is important because this depth represents the effective root zone for most rangeland vegetation and is where most microbial activity and nutrient cycling occur [28,29]. It is also the minimum depth specified by the Intergovernmental Panel on Climate Change for measuring soil C stocks [30].
Several factors, including climate, vegetation cover, soil properties, and management practices, influence the capacity of rangeland soils to sequester carbon [31,32,33]. The compounding effect of these factors is variable. For example, woody plant invasion in grasslands and shrublands may lead to either a reduction [34,35], an increase [26,36], or no change [14,15] in soil C and N content. This depends on vegetation species composition and the level of encroachment [37,38]. Some studies have shown that management practices, such as reseeding, can increase soil C and N content by adding root biomass [5,39,40]. Despite some progress in documenting correlations between land use and the carbon cycle, there remains a need for more information on the effects of land management practices on rangeland soil C and N content [31].
In addition to classical field- and laboratory-based methods for measuring soil C, OM, and N, recent advances have incorporated remote sensing, digital soil mapping, and machine learning techniques to improve large-scale soil C assessment [41,42,43]. These approaches, including spectral analysis and AI-based models, show strong potential for predicting SOC across landscapes [44]. However, the reliability of these models depends on high-quality, representative ground-based measurements for calibration and validation. Therefore, robust baseline soil datasets remain essential for supporting model development, reducing uncertainty, and improving predictions of soil C and OM dynamics across different land management practices.
Understanding the relationships between soil physical properties and C and N stocks, as influenced by land-improvement practices, is essential for developing sustainable land management strategies that preserve rangeland integrity, maintain soil health, support biodiversity, and promote site productivity and ecosystem resilience. This research examined the variability in soil C and N content across rangelands in central and eastern Oregon, where different land management practices have been implemented. The study objectives were to: (1) compare SOC and N concentrations, along with other parameters of interest (i.e., C:N ratio, OM content, bulk density (BD), soil volumetric water content (SVWC), porosity (PS), and soil texture), and (2) examine SOC and N content at two depths, 0 to 10 cm and 15 to 25 cm, in the effective rooting zone (top 30 cm of soil profile) in rangeland areas where different land management practices (i.e., juniper removal, sagebrush removal, land conversion to pasture, post-fire grass seeding) have occurred versus control sites.

2. Materials and Methods

2.1. Study Sites

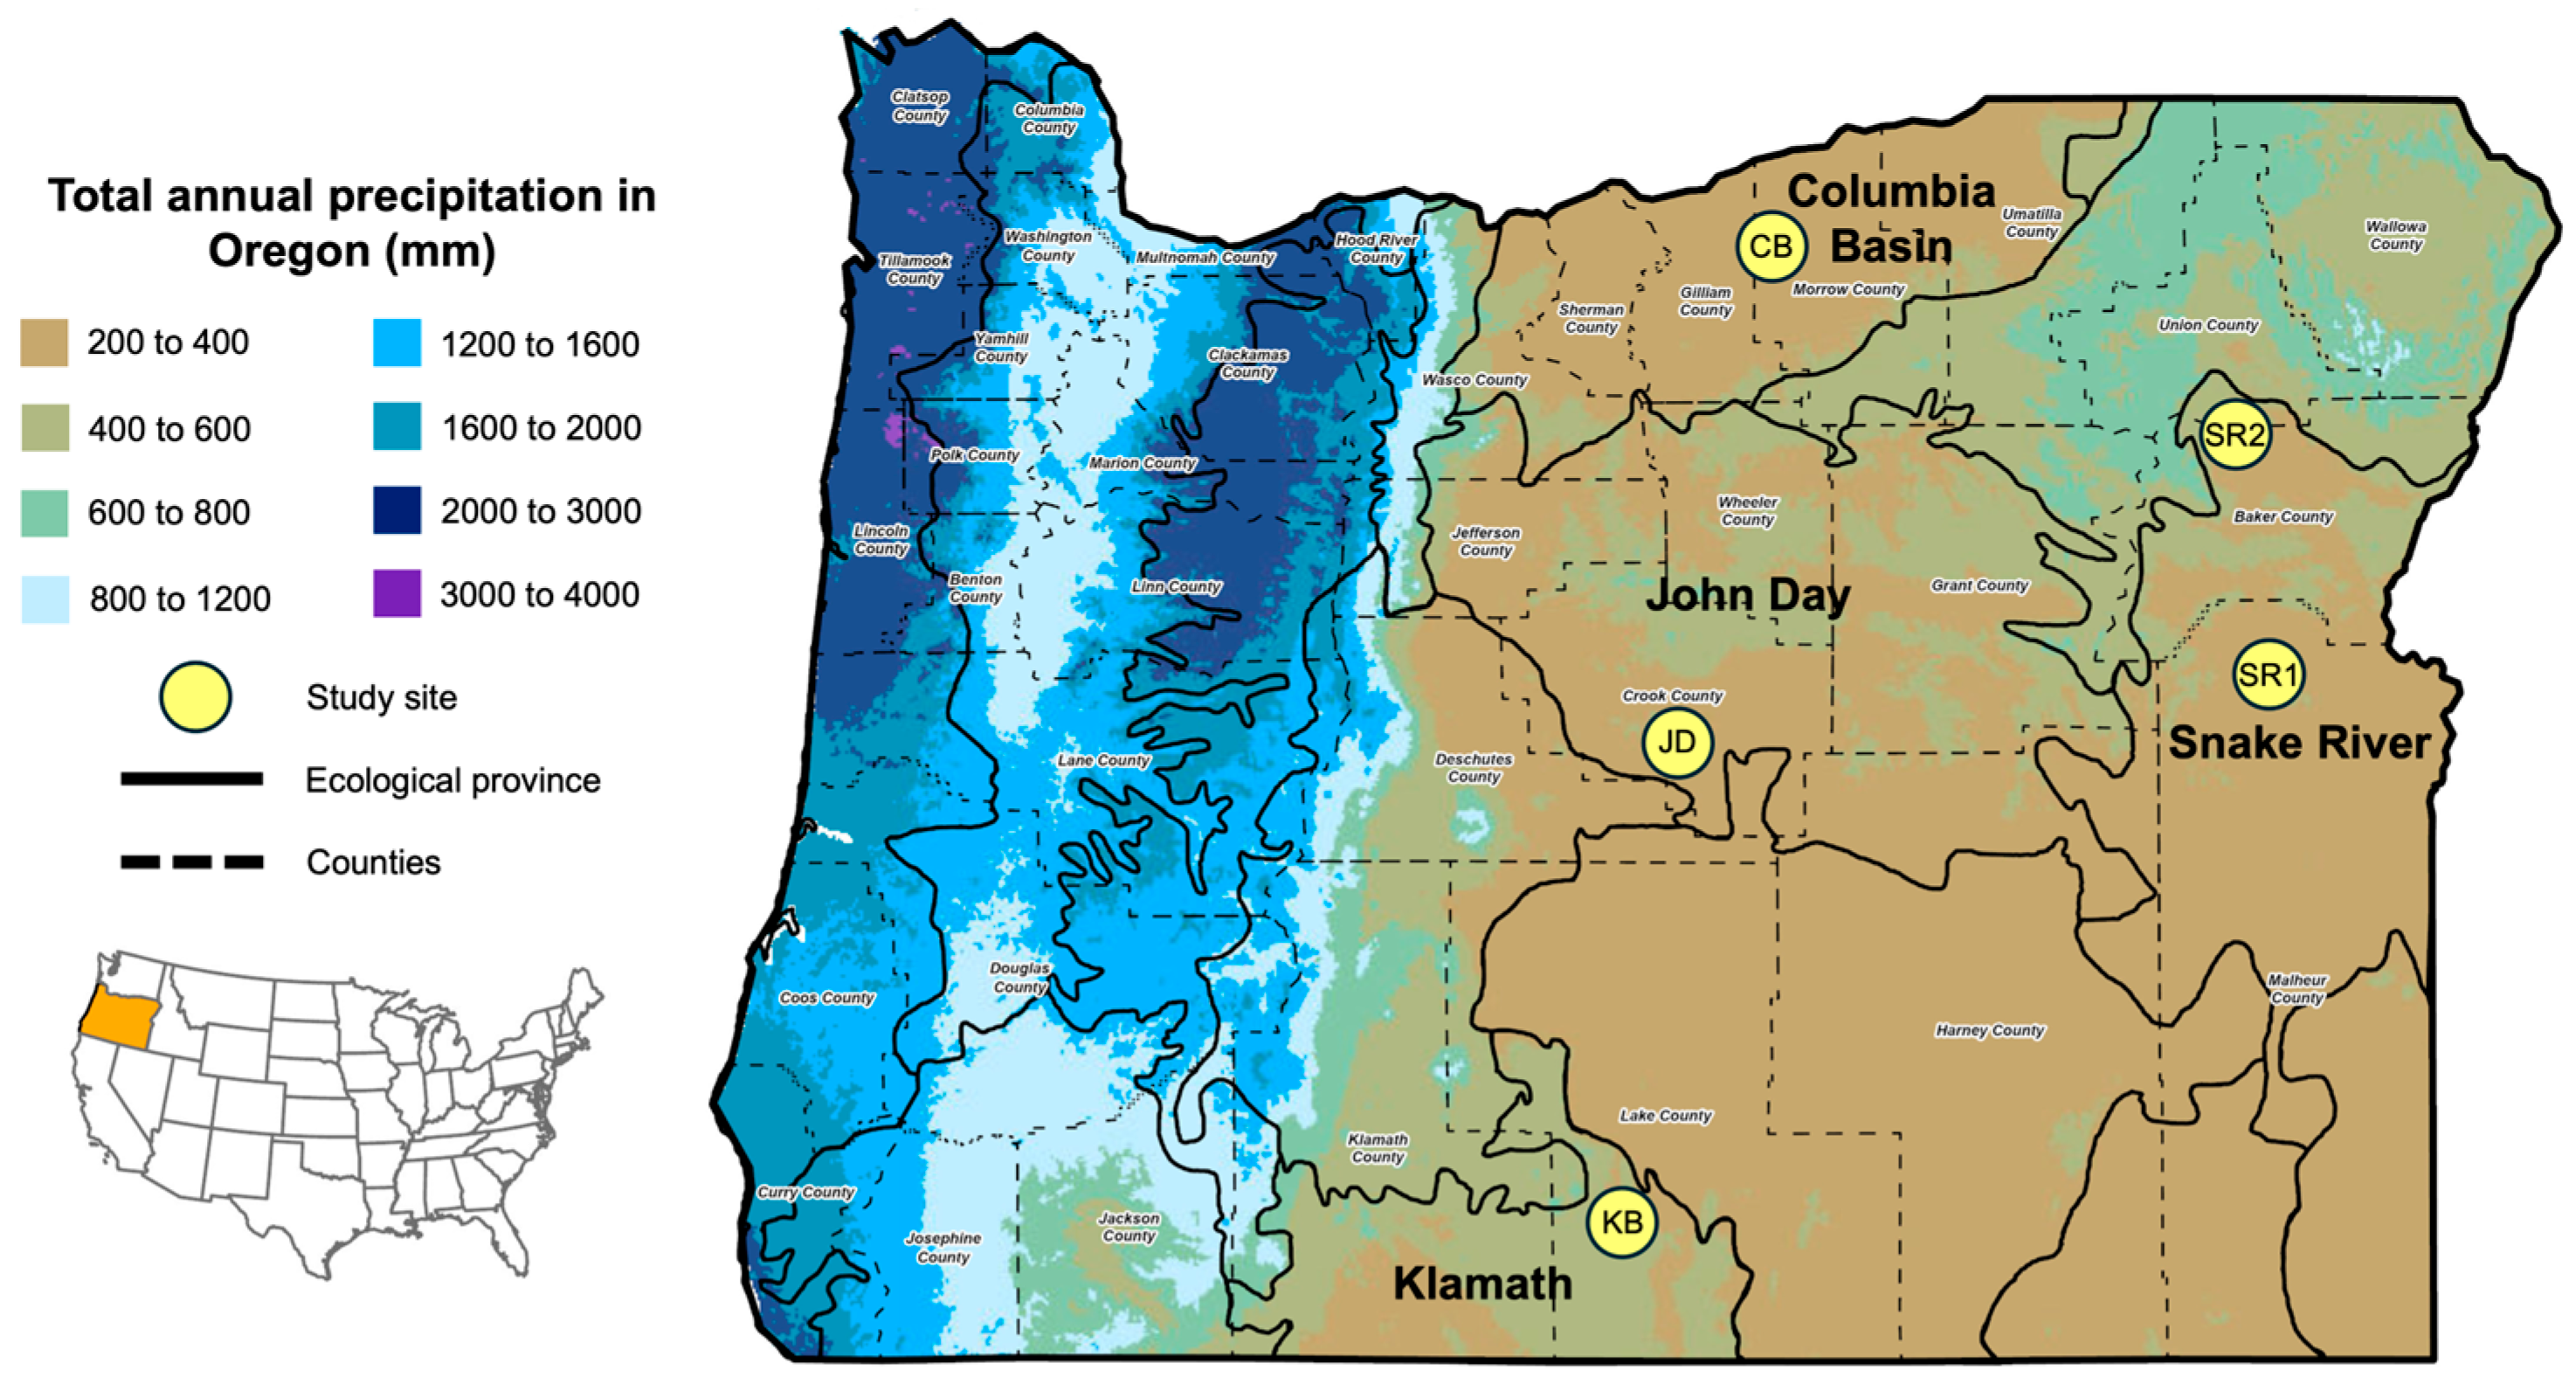
This study was conducted at thirteen field sites spanning four ecological provinces in central and eastern Oregon, USA (Figure 1). The sites were selected based on the distribution of rangelands across the state and ongoing collaborations that facilitated access for data collection. The field sites were named according to their locations within Oregon’s ecological provinces, as defined by Anderson et al. [45]. They include two sites in the John Day (JD) province, two in the Columbia Basin (CB), three in the Snake River (SR), and six in the Klamath (KB) ecological province. Typical of much of Oregon and many parts of the Pacific Northwest Region in the USA, soils at the study sites are primarily derived from basaltic and tuffaceous parent materials and are classified within the World Reference Base (WRB) system as Cambisols, Regosols, and Andosols, with additional Luvisol-like soils occurring in more developed forested areas, based on regional soil survey information and site characteristics [46]. The land cover in these four provinces is typical of high desert drylands in eastern Oregon, comprising grasslands, sagebrush steppe, juniper woodlands, and mixed-conifer forests. Land cover at the individual study sites ranged from grassland (various grass species) to sagebrush (Artemisia tridentata) steppe to conifer-dominated landscapes (including Pinus ponderosa and Juniperus occidentalis). Land use at all but the two sites in the CB ecological province was spring- or fall-season cattle grazing at light-to-moderate stocking rates. The two sites in CB were a sagebrush conservation area, adjacent to a former sagebrush steppe area converted to dryland farming, where a winter annual grass, triticale—a hybrid of wheat (Triticum aestivum) and rye (Secale cereale) is grown for livestock feed. Mean annual precipitation from onsite (JD sites, 322 mm) or nearby weather stations was 272 mm for the KB sites [47], 316 mm for the CB sites [48], 257 mm for SR1 [49], and 287 mm for SR2 [50]. Mean elevation in meters above mean sea level (mASL) for the various study sites was 366 mASL for the CB site, 1038 mASL for SR1, 1480 mASL for JD, 1673 mASL for SR2, and a range of elevation values from 1600 to 1835 mASL for the KB sites.
The field sites were paired into treated (T) and untreated fields (U). Treated sites included those fields where land management practices typical for rangeland ecosystems in the region, including sagebrush removal, western juniper removal, post-wildfire grass seeding, or conversion to cropland, had occurred. All treated fields were paired with adjacent untreated fields, which served as comparative control sites, except for one field (SR1_T, juniper removed) that lacked a control site. The study areas ranged from 2 to 14 ha across most sites, except at the JD location, where the untreated site was 96 ha, and the treated site was 116 ha. For most sites, a grass-mix seeding application followed the disturbance, whether due to wildfire or sagebrush removal, to improve site productivity and overall ecological health. No seeding but rather natural regeneration of shrubs and grasses (various spp.) occurred at two sites (JD_T and SR1_T) where dense stands of western juniper had been removed (Table 1).

2.2. Field Data Collection

2.2.1. Soil Physical Properties

A total of 245 soil samples were collected at depths of 0 to 10 cm and 15 to 25 cm from all sites using a soil core sampler (50 mm × 100 mm) (Art’s Manufacturing & Supply, Inc.; American Fall, ID, USA). Sample sizes varied by soil depth and vegetation cover. The samples were sieved (2 mm mesh), oven-dried at 105 °C for 24 h, and analyzed to determine bulk density (BD; g cm−3), soil volumetric water content (SVWC; cm3 cm−3), soil porosity (PS, %), and soil texture. BD was calculated as the ratio of the oven-dried soil sample mass to the core volume. SVWC was calculated using the gravimetric water content and BD. Soil porosity was determined using the formula:
%PS = 100 (1 − BD/PD)
where PD = particle density of 2.65 g cm−3 [52]. Soil texture was determined using the hydrometer method [53]. Soil samples were collected between fall 2023 and summer 2024. All samples for the KB sites were collected in May 2024. Samples for the JD sites were collected in April and May 2024. Samples for the SR and CB sites were collected in November 2023.

2.2.2. Soil Carbon, Nitrogen, and Organic Matter

Subsamples from each of the soil samples collected at all sites were sent to the Oregon State University Soil Health Laboratory for analysis of soil C, N, and OM. Soil C and N were determined using dry combustion (Thermolyne F-A1730, Thermo Fisher Scientific Inc.; Waltham, MA, USA). The OM content was calculated as 2 times the SOC [54]. The ratio of soil C and N (C:N) was determined for each location to characterize each site’s potential for plant growth and microbial activity.

2.3. Data Analysis

Statistical analyses were conducted using a one-way analysis of variance (ANOVA) to evaluate differences in soil C and N stocks among soil depths, management practices, and vegetation cover. Although soil properties are influenced by multiple interacting factors, one-way ANOVA was utilized to analyze each factor separately, isolating the single effect of that specific variable, which was our objective. Prior to analysis, the data were checked for normality and homogeneity of variance to confirm that the assumptions required for parametric analysis were met. The analysis compared soil C and N stocks at the two sampling depths (0 to 10 cm and 15 to 25 cm) and at their average, which was assumed to represent the effective rooting zone of 0 to 30 cm at each site. Percent C and N content, along with BD data, were used to calculate soil C and N stocks on a ton per hectare (t ha−1) basis for each site. Additionally, comparisons were made across major land classifications based on dominant vegetation covers, including juniper woodland, sagebrush steppe, rangeland grass and shrub, and triticale. To evaluate overall treatment effects across sites, independent-sample t-tests were also conducted to compare mean C and N stocks between treated and untreated rangelands at each sampling depth.
The correlation between C and several variables of interest (i.e., %N, BD, and %Clay content) was estimated using all data collected within the 0 to 30 cm profile for each site, using Pearson or Spearman correlation coefficients, depending on whether the data were uniformly distributed. This analysis focused on %C as the primary variable of interest because it is central to evaluating rangeland C sequestration and enables targeted interpretation of key soil controls. Additional pairwise relationships were not explored in detail, as they were beyond the scope of this study. All statistical analyses were performed using SigmaPlot (Version 15.0, Grafiti LLC; Palo Alto, CA, USA) with a significance level of α = 0.05.

3. Results

3.1. Soil Properties

The results showed that soil C and N were generally higher at the treated sites than at the untreated sites at both the 0 to 10 cm and 15 to 25 cm depths (Table 2). The exception was the CB_T site, where soil C at 15 to 25 cm was higher at the untreated site (CB_UT). Overall, the CB_T and CB_UT sites exhibited the lowest C, N, and OM values among all the evaluated sites. The mean values for soil C, N, C:N ratio, and OM at all sites were higher in the treated sites at both the 0 to 10 cm and 15 to 25 cm depths. The mean value of soil C (%) was 2.73% at the 0 to 10 cm depth and 1.7% at the 15 to 25 cm depth for treated sites. For untreated sites, mean soil C was 1.7% for the 0 to 10 cm layer and 1.3% for the 15 to 25 cm layer.
Mean SVWC values were higher at the treated sites at depths of 0 to 10 cm, but not at 15 to 25 cm. The coarser soils were found at the JD location, whereas finer-textured soils were located at the KB location (Table 2). Fine-textured soils, such as loam, clay loam, and sandy clay loam, at sites SR2_T, KB2_T, and KB3_UT showed higher C and N concentrations at both depths, especially in the 0 to 10 cm range. In contrast, intermediate to fine-textured silt loam soils had the lowest C and N levels, as observed at CB_T and CB_UT. Bulk density was generally lower in fine-textured soils, particularly loam and sandy clay loam. The lowest BD values were seen at SR2_T (0.93 g cm−3 at 0 to 10 cm, loam), KB2_T (0.97 g cm−3 at 0 to 10 cm, loam), and KB2_T (0.89 g cm−3 at 15 to 25 cm, sandy clay loam). Conversely, coarser soils such as JD_T, CB_T, and CB_UT had higher BD values at both depths, indicating less pore space. The PS values ranged from 44.99% to 66.41%, with higher porosity observed at finer-textured soils at deeper layers, including SR2_T (loam), KB1_UT (sandy clay loam), KB2_T (sandy clay loam), and KB3_UT (clay loam). In contrast, the lowest PS values were found in silt loam soils at CB_T and CB_UT across both depths (Table 2).

3.2. Soil Depth, Land Cover, and Management Effects on Soil Carbon and Nitrogen Stocks

3.2.1. Soil Depth Effect on C and N Stocks

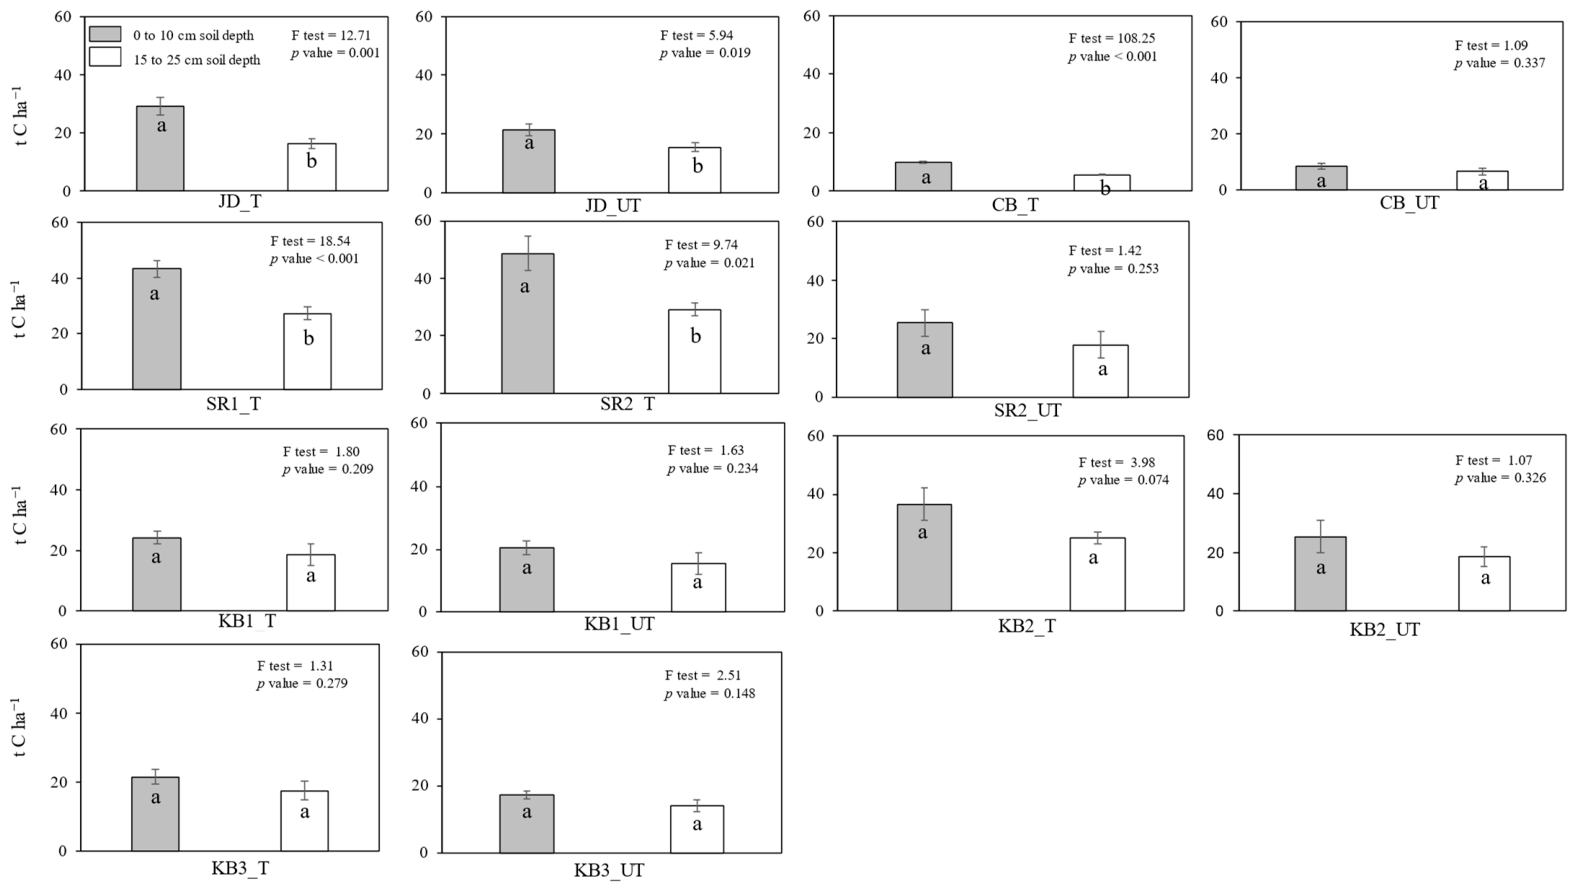
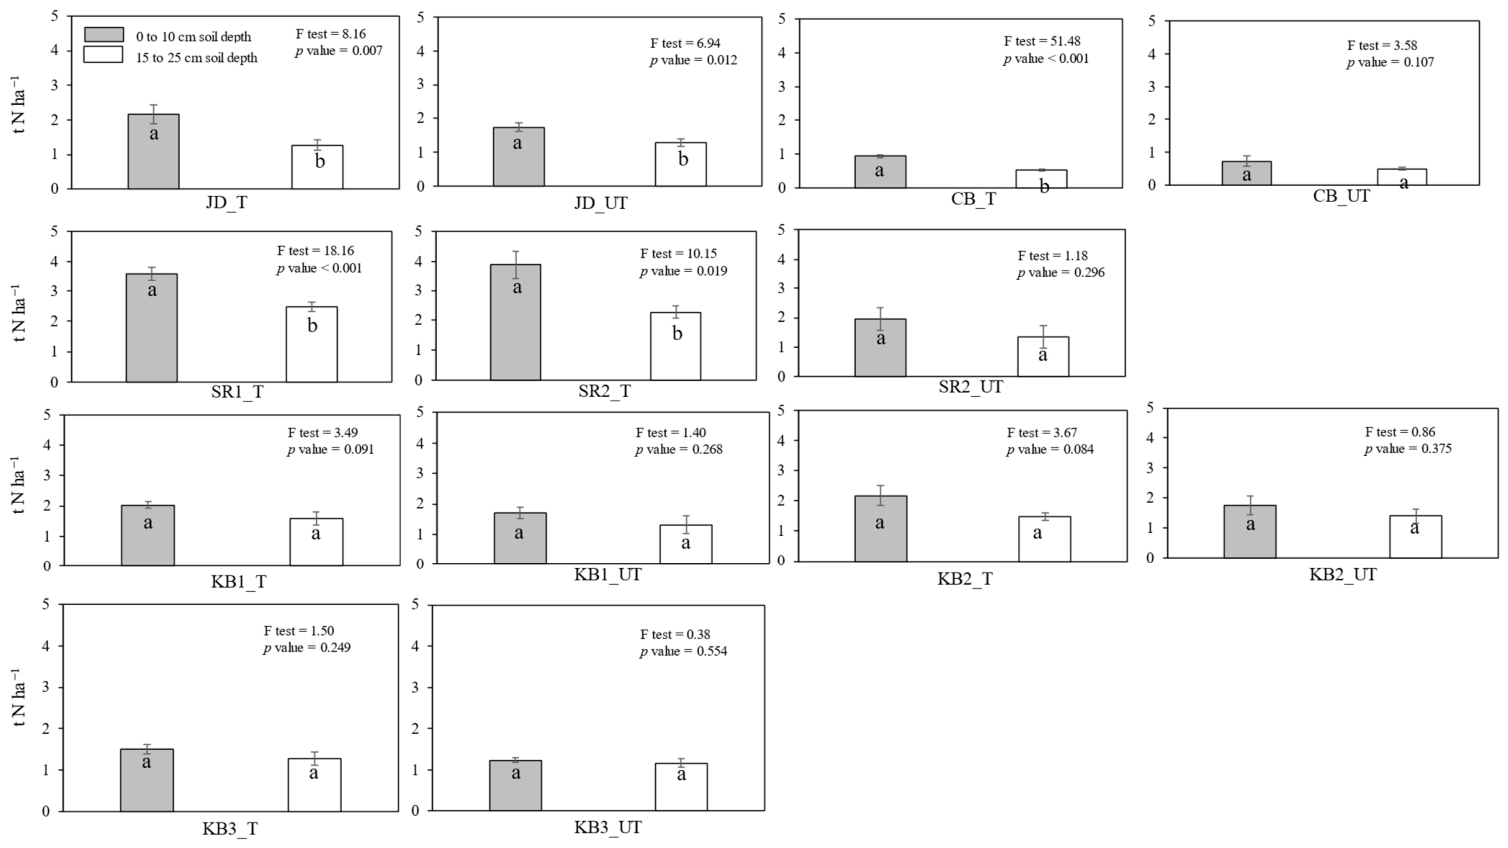
Soil C and N stocks (t ha−1) were higher at 0 to 10 cm than at 15 to 25 cm for all sites, when compared by soil depth (Figure 2 and Figure 3). However, only five sites showed statistically significant differences (p ≤ 0.05) in mean C and N values between the 0 to 10 cm and 15 to 25 cm depths. The highest C and N stocks for the 0 to 10 cm depth were obtained at the SR2_T site (48.7 t C ha−1 and 3.9 t N ha−1), followed by the SR1_T (43.4 t C ha−1 and 3.6 t N ha−1), and the JD_T (29.3 t C ha−1 and 2.2 t N ha−1) sites.

3.2.2. Soil C and N Stocks in Treated vs. Untreated Sites

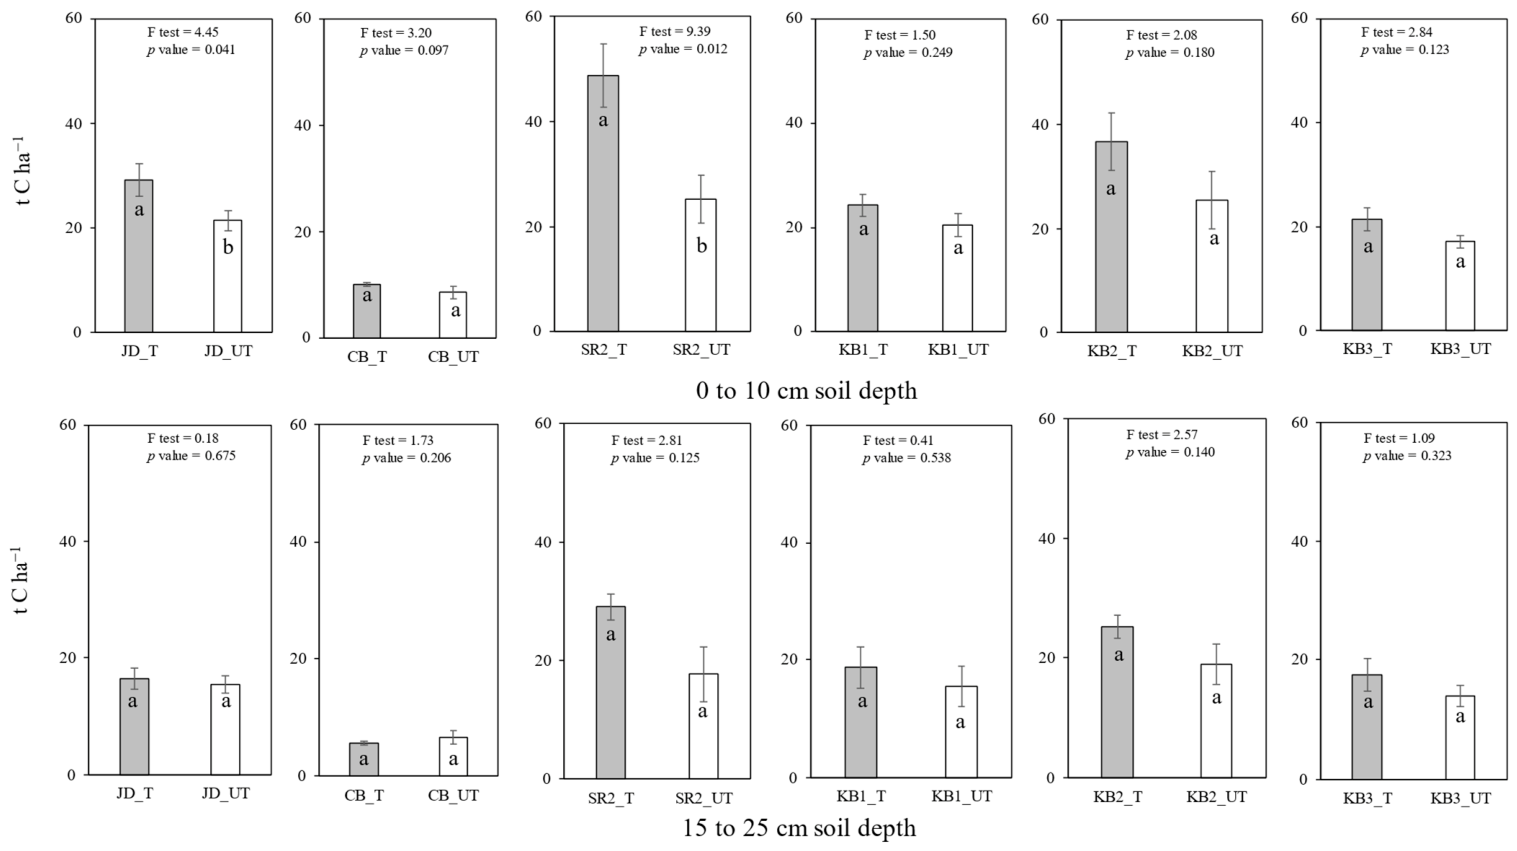
Overall, soil C stocks were higher in treated sites compared to their untreated counterparts; however, statistically significant differences (p ≤ 0.05) were observed only at two sites in the topsoil layer (0 to 10 cm) (Figure 4). Specifically, at this depth, treated sites (JD_T, 29.3 t C ha−1, sagebrush-dominated with 19 years post-juniper removal, and SR2_T, 48.7 t C ha−1, grass-dominated with 5 years post-sagebrush removal) exhibited significantly greater (p ≤ 0.05) soil C stocks compared to their respective untreated areas (JD_UT, 21.5 t C ha−1, juniper-dominated, and SR2_UT, 25.3 t C ha−1, sagebrush-dominated). The remaining sites (CB and KB locations) showed no significant treatment effects (p > 0.05), although some exhibited numerically higher values in treated areas at the same depth (0 to 10 cm) (e.g., KB2_T 36.6 t C ha−1 vs. 25.5 t C ha−1 in KB2_UT; KB1_T 24.3 vs. 20.5 t C ha−1; KB3_T 21.5 vs. 17.2 t C ha−1).
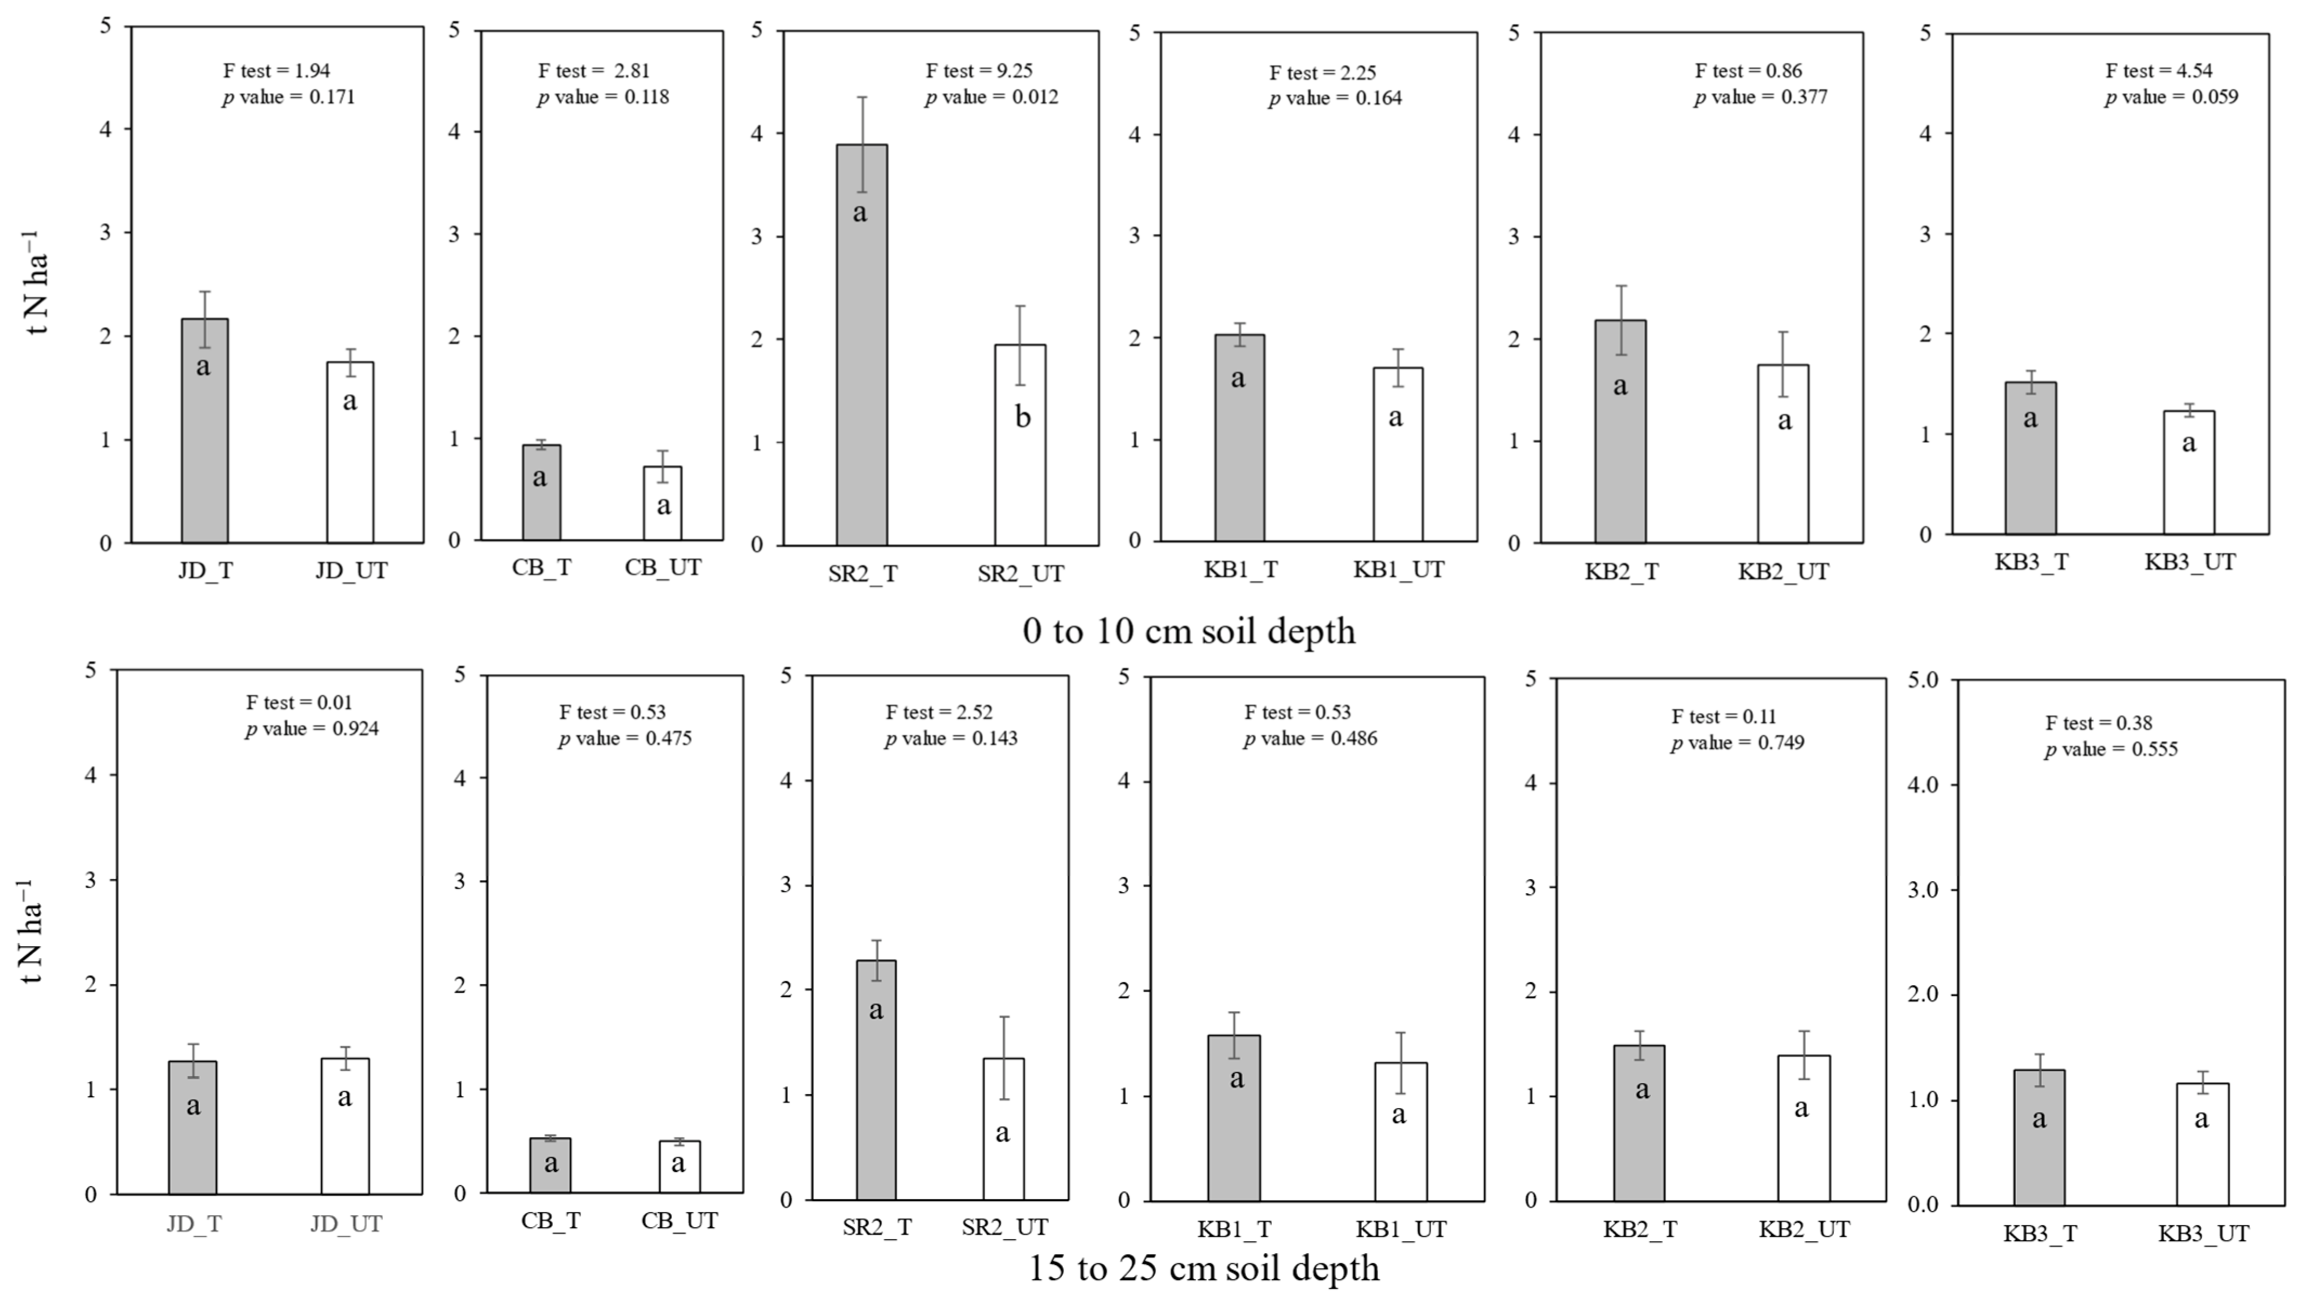
Soil N stocks followed a similar general pattern, with higher mean values in treated sites at several locations (Figure 5). However, significant differences (p ≤ 0.05) were observed only at SR2 in the 0 to 10 cm depth, where SR2_T (3.9 t N ha−1) had greater N stocks than SR2_UT (1.9 t N ha−1). All other treated-vs.-untreated comparisons showed no significant differences (p > 0.05) at either depth, although treated sites were often numerically higher at 0 to 10 cm soil depth (e.g., JD_T, 2.2 t N ha−1 vs. JD_UT, 1.7 t N ha−1; KB2_T, 2.2 t N ha−1 vs. KB2_UT, 1.8 t N ha−1). At the deeper soil layer (15 to 25 cm), no statistically significant differences in soil C and N stocks were detected between treated and untreated sites across all locations, with values generally lower than surface soils (e.g., C stocks ranging 5.6 to 28.9 t C ha−1 and N stocks 0.5 to 2.3 t N ha−1 across sites).
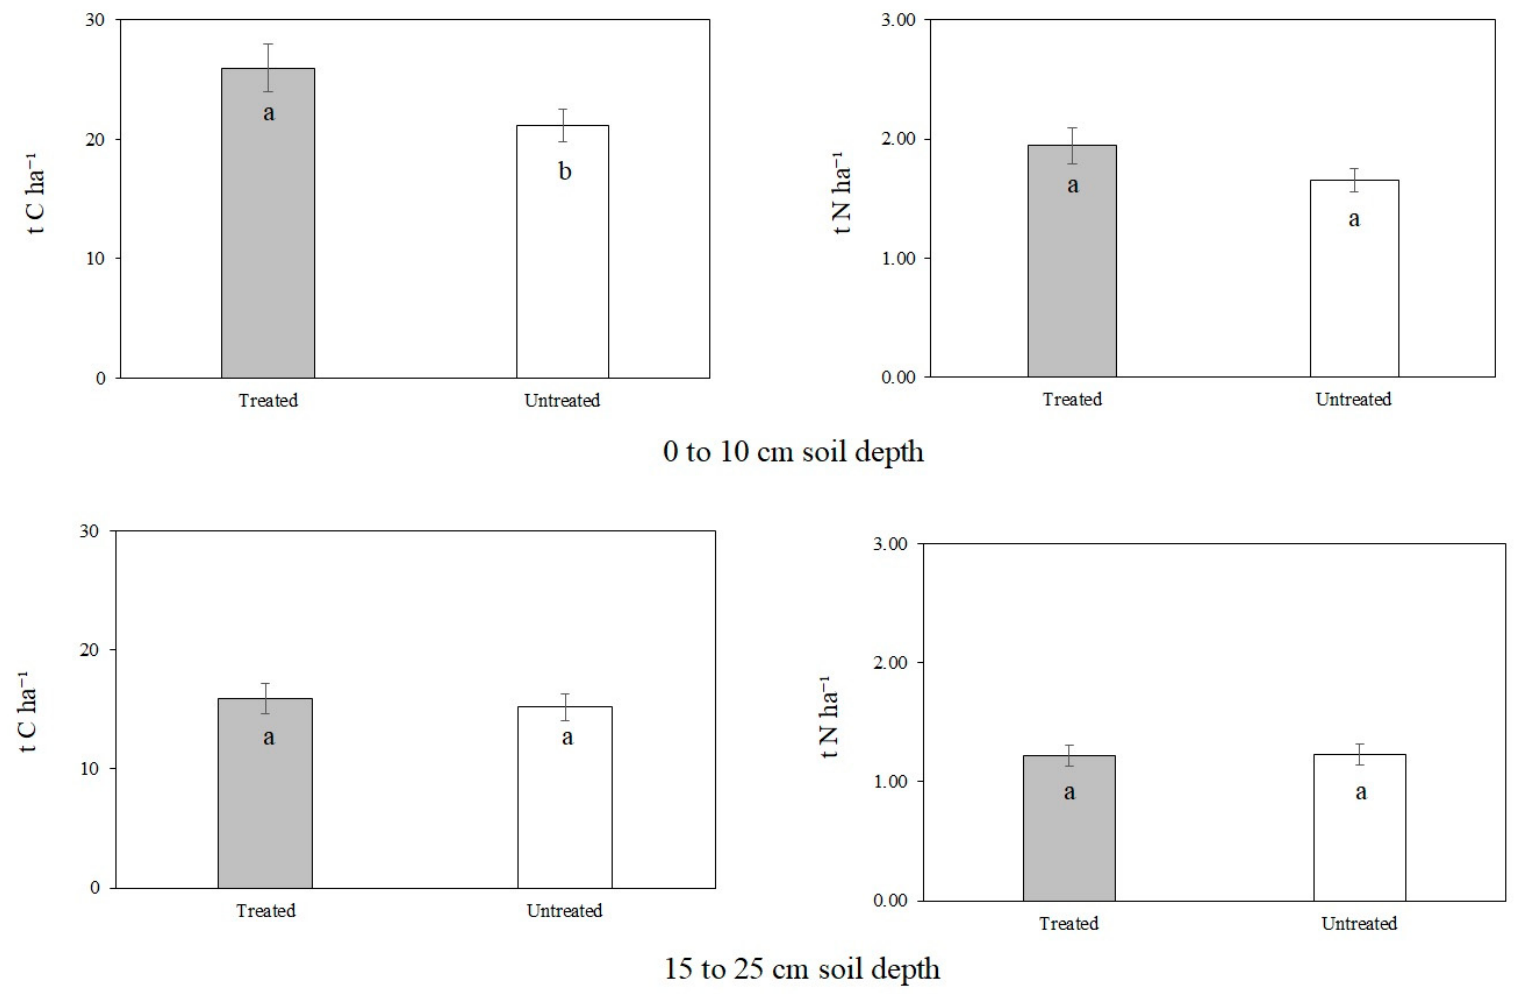
Mean soil C stocks differed between management treatments at the 0 to 10 cm depth (Figure 6). Treated rangelands had higher mean soil C stocks (25.94 t ha−1) than untreated rangelands (21.2 t ha−1), and this difference was marginally significant (t = 1.97, df = 96, p = 0.052). In contrast, no significant difference in soil C stocks was observed at the 15 to 25 cm depth, where treated and untreated sites averaged 15.9 and 15.2 t ha−1, respectively (t = 0.44, df = 108, p = 0.664). Mean soil N stocks did not differ significantly between treatments at either depth. At 0 to 10 cm, treated sites had slightly higher mean N stocks (1.94 t ha−1) compared to untreated sites (1.65 t ha−1), but the difference was not significant (t = 1.59, df = 94, p = 0.115). Similarly, at 15 to 25 cm, N stocks were nearly identical between treated (1.22 t ha−1) and untreated (1.22 t ha−1) rangelands (t = −0.07, df = 108, p = 0.945).

3.2.3. Soil C and N Stocks Across Different Vegetation Covers

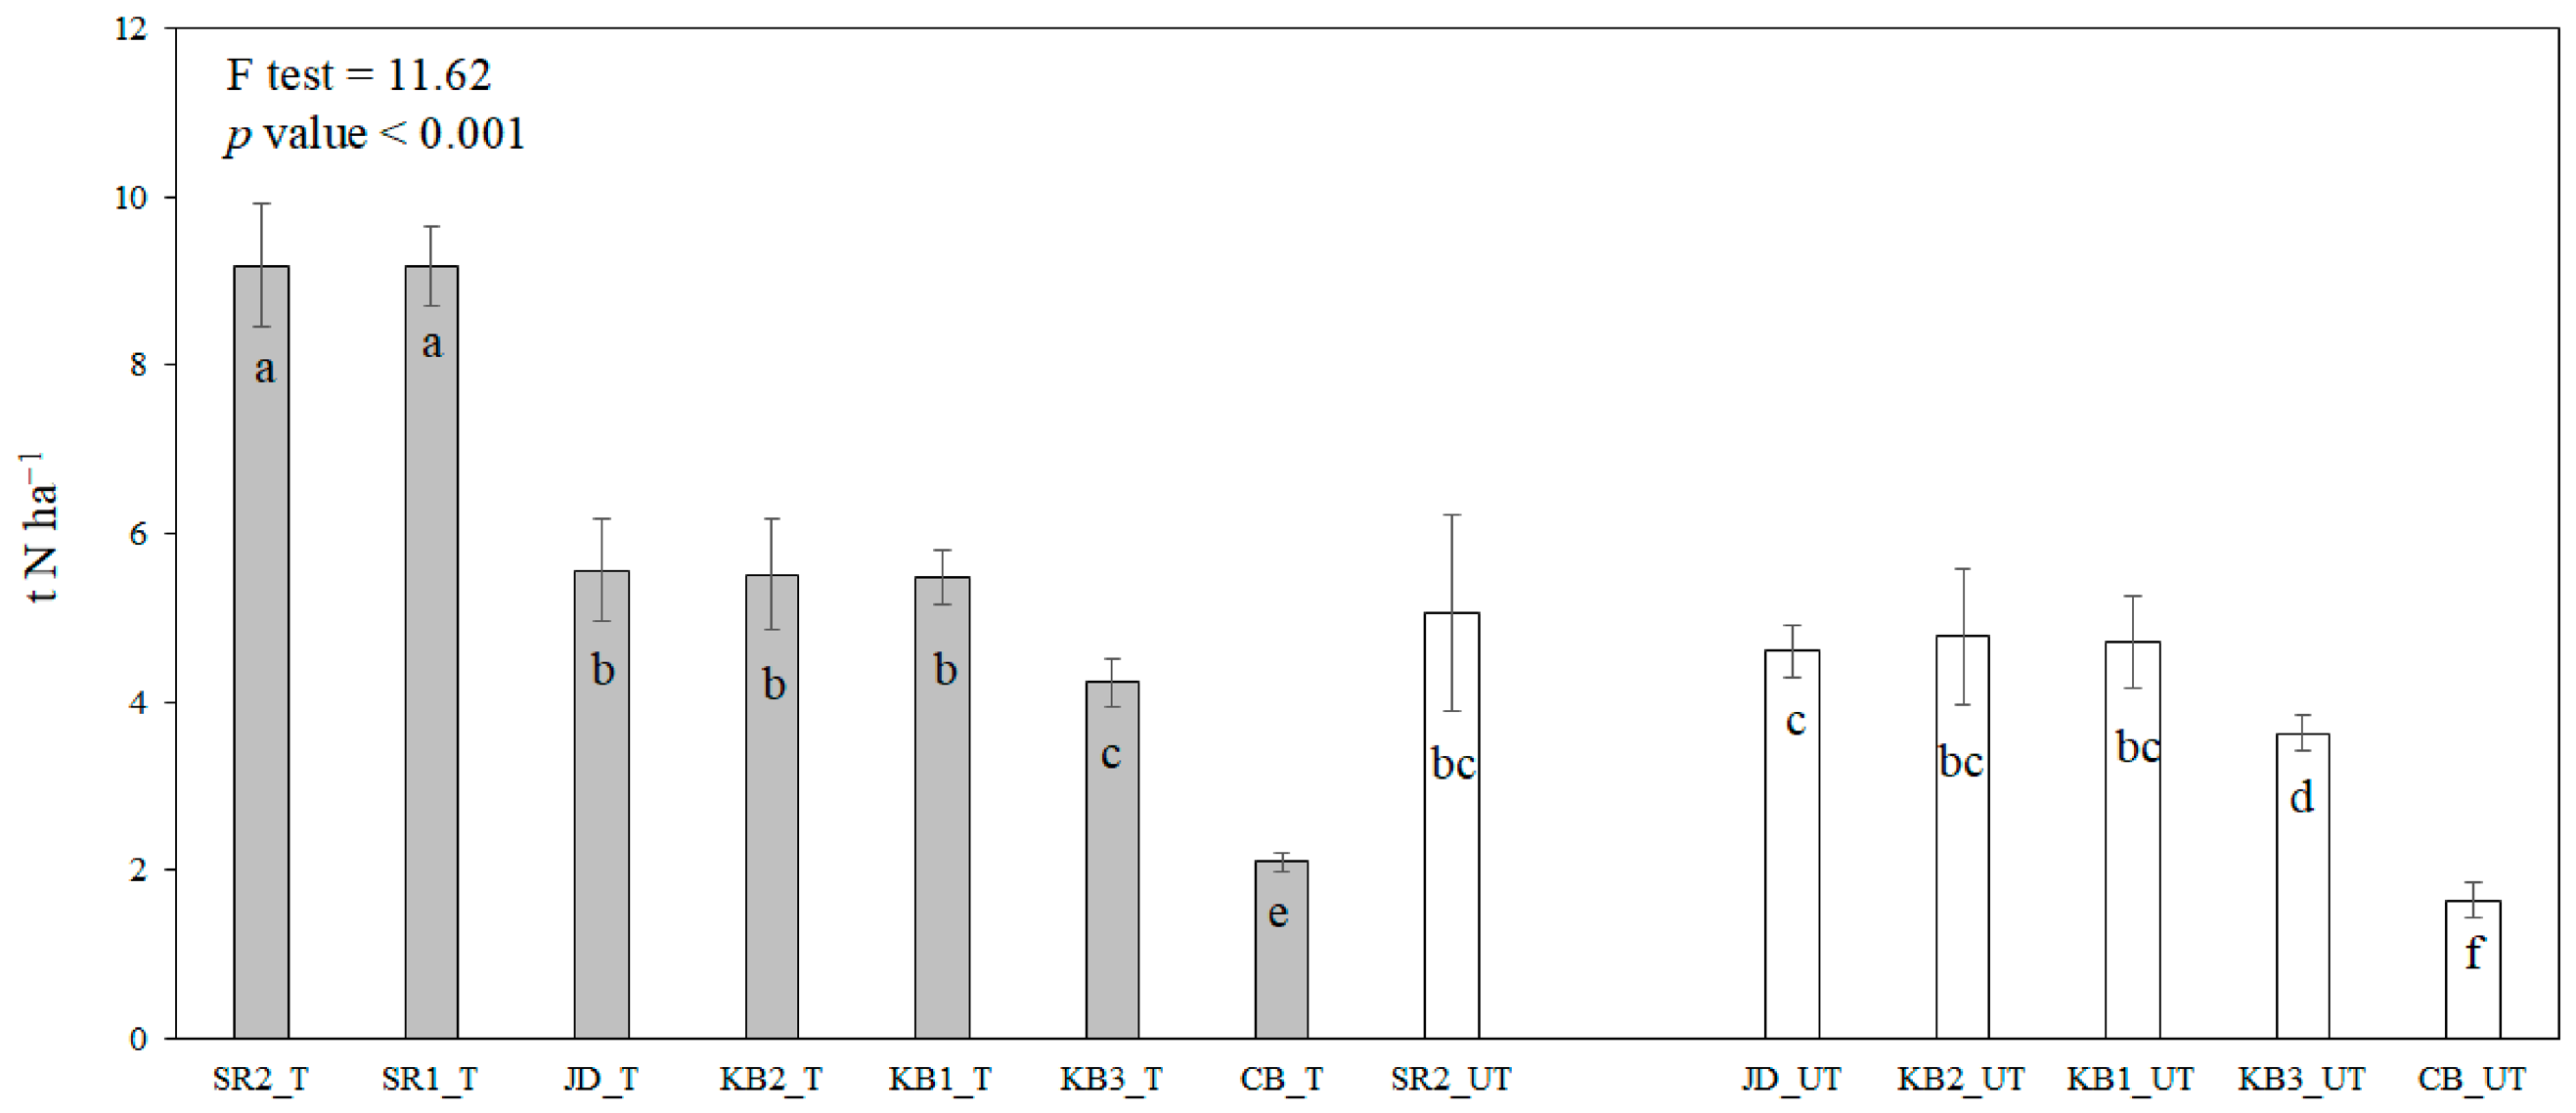
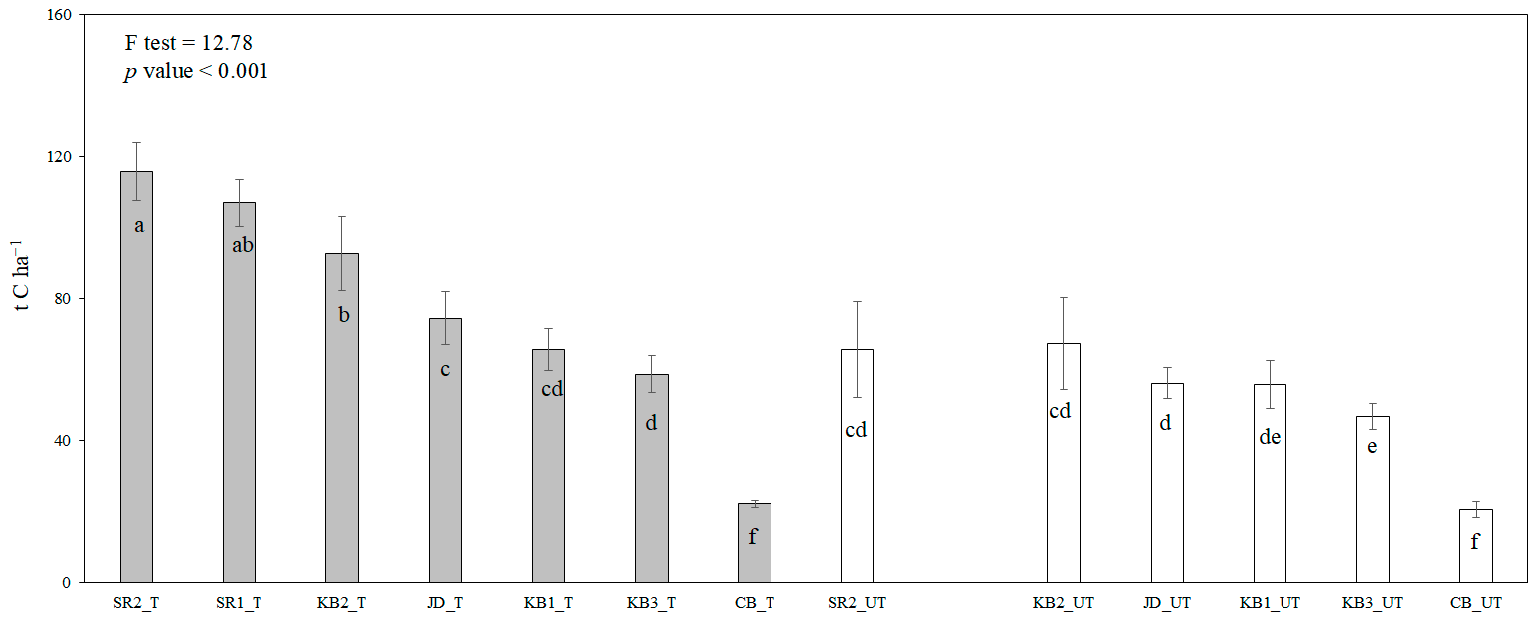
When looking at the aggregated results for the top 0 to 30 cm profile, the highest values for soil C stocks were obtained in the treated sites, with the highest of 115.8 t C ha−1 for SR2_T (grass-dominated, 5-year post-sagebrush removal), followed by 107.0 t C ha−1 for SR1_T (2-year post-juniper removal), and 92.8 t C ha−1 for KB2_T (grass seeding 3-year post-fire) (Figure 7). Similarly, the highest soil N stocks, 9.2 t N ha−1, were observed at both the SR1_T and SR2_T sites (Figure 8). In contrast, the lowest soil C and N stocks were found at the CB_UT site, with 20.7 t C ha−1 and 1.6 t N ha−1, respectively.
Overall, the correlation analysis revealed a very strong correlation (r ≥ 0.70) for %C versus %N for all treated and most untreated sites (Table 3). The exceptions were site CB_UT, which showed no significant differences, and site KB3_UT, where a moderate correlation (r = 0.67) was observed. Negative correlations were observed for %C versus BD at one treated site (JD_T) and three untreated sites (JD_UT, SR2_UT, and KB1_UT), with correlations ranging from low to moderate to strong. The correlation analysis for %C versus SVWC yielded mixed results, with r-values indicating moderate to strong relationships; however, some sites exhibited a positive trend, while others showed a negative one. A correlation was observed between %C and %Clay content at two sites (CB_T and SR1_T) (Table 3).

4. Discussion

This study successfully employed standard field sampling techniques and laboratory analyses to examine soil C, OM, and N content under various vegetation cover and management practices across several semiarid range-land ecosystems in eastern Oregon, in the Pacific Northwest Region of the USA.
As in other studies [55,56,57,58,59], soil and vegetation conditions at the treated locations have improved following restoration. The management practices implemented in this study increased soil C and N content, particularly in the top 10 cm soil profile, as evidenced at sites where vegetation treatments, such as juniper removal, sagebrush removal, and perennial grass seeding, had been applied. The 5-year post-sagebrush-removal site with grass seeding (SR2_T) had the highest soil C and N contents among all sites. Also, it had the highest soil OM content, which is crucial for enhancing soil fertility [60,61]. Soil texture has been cited as a major control of OM dynamics [62]. The SR2_T site had loam-textured soil with low dry bulk density and high porosity, which have been associated with improved root growth, water infiltration, and nutrient availability, all of which are beneficial for plant growth [63,64,65]. This combination of favorable soil physical conditions suggests that soil texture not only influences OM dynamics directly but also modulates the stabilization and persistence of SOC, consistent with global evidence that fine-textured soils enhance SOC protection through organo-mineral interactions and aggregate formation [66,67].
Conversely, the untreated site (CB_UT), dominated by sagebrush with poor understory vegetation cover, exhibited low soil C and N concentrations, especially in the topsoil. This site also had the lowest OM content at all depths. The lack of understory vegetation likely contributed to the poor soil quality observed. Treated sites where woody vegetation was removed, such as JD_T and SR2_T, displayed higher soil C stocks than untreated counterparts, JD_UT and SR2_UT. This suggests that removing juniper and sagebrush may increase soil C content by allowing other vegetation, such as grasses, to grow and contribute additional OM inputs. However, not all studies report consistent increases in SOC following woody plant removal. For example, a global meta-analysis reported highly variable responses across ecosystems, with neutral or even reductions in C sequestration and other soil-related ecosystem services depending on biome, encroachment stage, and removal method [68]. These contrasting findings indicate that SOC response is highly site-specific and strongly influenced by post-treatment vegetation recovery, soil properties, and climatic conditions [69,70,71]. In the present study, the positive response is likely driven by successful grass establishment and increased root biomass inputs. Although C content was higher in sites where woody vegetation was removed, continued monitoring is needed to determine the persistence of this C and the long-term effects of woody plant removal on SOC stocks.
Previous studies report increased sagebrush presence after juniper cutting [15,72,73,74] and increased grass abundance after sagebrush removal [75,76,77], resulting in greater soil OM. It has been noted that woody vegetation invasion does not increase long-term soil C pools in grasslands because of negative effects on site productivity [78]. All our study sites have been dominated by woody vegetation—ponderosa pine, western juniper, or sagebrush—either currently or in the past. We found that sites where woody vegetation had been removed, whether by mechanical removal or natural wildfires, had higher overall C stocks than their untreated counterparts due to greater grass abundance. Our findings underscore the importance of targeted vegetation management strategies, such as the removal of sagebrush and juniper, to enhance soil health and mitigate nutrient losses in Oregon rangelands.
Results from this study showed a strong correlation between C and N (mean for all sites, r = 0.92). This is in line with previous studies in arid sites following years of land management and plant succession [5,79]. This finding is also consistent with the results of a meta-analysis conducted by Liu et al. [80], which revealed a strong correlation between C and N levels in arid and semiarid ecosystems. The C:N ratio observed at all our treated (13:1) and untreated (12.8:1) sites was higher than the typical range (10:1–12:1) reported for rangeland soils by Waters et al. [23]. Overall, the highest C:N ratios were observed in the higher-elevation rangeland sites with conifer and grass vegetation cover, while the lower C:N ratios were obtained for the lower-elevation sites dominated by shallow soils and sagebrush or dryland agriculture cover. The KB2_T site, located in a ponderosa pine forest that was seeded with a perennial grass mix after a severe wildfire, exhibited the highest C:N ratio (16.9:1) while the dryland cultivated field site with triticale (CB_T) showed the lowest ratio (10.6:1), which nonetheless is close to the 10:1 ratio that indicates a condition of desired equilibrium in agricultural soils, as discussed in USDA NRCS Soil Tech Note 23A [81].
As in other studies [82,83,84,85], we found a negative correlation between soil C content and bulk density. A recent mixed-effects modeling of forest soil datasets from the Czech Republic showed a significant inverse relationship between soil organic carbon and bulk density [85]. Bulk density was also negatively correlated with soil C following afforestation of temperate grasslands in Uruguay [86].
Study results showed variations in soil C and N content across different vegetation cover within the 0 to 30 cm soil depth. The SR2_T site (grass, 5 years post-sagebrush removal) had the highest soil C and N stocks, suggesting that grass-dominated systems enhance soil OM and nutrient retention [87]. Grasslands tend to have higher belowground OM inputs due to continuous vegetation cover and stable root systems [88], which are more likely to be incorporated into SOC [35]. Conversely, the CB_UT site (untreated, sagebrush-dominated) had the lowest C and N stocks.
Limitations of this study included differences in plot size and the number of soil samples taken at some sites, which may not allow for a strong comparison of similar dominant vegetation types, such as those found in sagebrush-dominated landscapes. Beyond differences attributable to site selection and study design, we are confident that this study’s findings provide important baseline data on soil OM, C, and N content in Oregon rangelands. Although with limitations, this study has the strong advantage of including control (untreated sites), which can be very difficult, especially in large-scale experiments involving land management over time. The findings from this study can help inform land management decisions, such as rehabilitating degraded landscapes through practices like brush control and seeding. Similarly, the baseline data generated can inform policy regarding the potential of rangeland ecosystems in Oregon to sequester carbon, accrue nitrogen, and regulate nutrient cycling under different land management practices. Study results are applicable to similar semiarid landscapes in the western USA and other regions worldwide. Future research will investigate the inter-annual variability in soil C stocks and assess differences in soil C and N levels between above- and belowground biomass in treated and untreated sites, as affected by other management practices, such as prescribed fire and grazing intensity and duration. The critical baseline information obtained from this study can inform remote sensing- and machine learning-based techniques to improve large-scale assessment of soil C, OM, and N dynamics in other similar dryland ecosystems.

5. Conclusions

This study provides baseline information on how vegetation type and management practices influence SOC, OM, and soil N stocks in semiarid rangeland ecosystems of Oregon. Across 13 sites, treated fields in which sagebrush or juniper were removed consistently exhibited higher soil C, N, and OM than untreated control sites.
Although site variability and sampling limitations constrain direct comparisons, the findings demonstrate that targeted brush removal and seeding can enhance soil fertility, nutrient retention, and resilience in rangeland systems. These results contribute valuable baseline data for land managers and policymakers seeking to rehabilitate degraded landscapes and improve carbon sequestration potential in semiarid regions. Continued monitoring will be essential to assess the persistence of these gains and the long-term impacts of management practices on soil C and N stocks.

Author Contributions

Conceptualization, C.G.O., M.A.B.A., M.J.I.T. and D.G.G.; methodology, C.G.O., M.A.B.A., M.J.I.T. and D.G.G.; formal analysis, C.G.O., M.A.B.A., M.J.I.T. and D.G.G.; investigation, C.G.O., M.A.B.A., M.J.I.T. and D.G.G.; resources, C.G.O.; data curation, C.G.O., M.A.B.A., M.J.I.T. and D.G.G.; writing—original draft preparation, C.G.O., M.A.B.A., R.M.-G., M.J.I.T. and D.G.G.; writing—review and editing, C.G.O., M.A.B.A., M.J.I.T. and D.G.G.; visualization, C.G.O., M.A.B.A., R.M.-G., M.J.I.T. and D.G.G.; supervision, C.G.O.; project administration, C.G.O.; funding acquisition, C.G.O. All authors have read and agreed to the published version of the manuscript.

Funding

This research was partially funded by the Oregon Watershed Enhancement Board (grants #223-4030-23034 and #223-4029-22979), the USDA NRCS grant #NR230436, and the Oregon Beef Council, OBC-FY2023.

Institutional Review Board Statement

Not applicable.

Informed Consent Statement

Not applicable.

Data Availability Statement

Most of the data presented in this study are available in the article. Additional information is available upon request.

Acknowledgments

The authors gratefully acknowledge the support of multiple landowners who graciously allowed field data collection at their properties. We also want to thank the many OSU students and volunteers who participated in various field data-collection activities for this research.

Conflicts of Interest

The authors declare no conflicts of interest.

References

  1. Sayre, N.F. The Politics of Scale: A History of Rangeland Science; University of Chicago Press: Chicago, IL, USA, 2017. [Google Scholar]
  2. Robinson, N.P.; Allred, B.W.; Naugle, D.E.; Jones, M.O. Patterns of rangeland productivity and land ownership: Implications for conservation and management. Ecol. Appl. 2019, 29, e01862. [Google Scholar] [CrossRef]
  3. Busby, F.E.F.; Thacker, E.T.; Kohl, M.T.; Mosley, J.C. Rangeland ecoregions of western North America. In Rangeland Wildlife Ecology and Conservation; Springer: Cham, Switzerland, 2023; pp. 9–48. [Google Scholar]
  4. Bai, Y.; Cotrufo, M.F. Grassland soil carbon sequestration: Current understanding, challenges, and solutions. Science 2022, 377, 603–608. [Google Scholar] [CrossRef]
  5. Valliere, S.W.; Prado-Tarango, D.E.; Moore, J.M.; Ates, S.; Mata-González, R. Conservation management on an Oregon livestock ranch supports net soil carbon and nitrogen storage. Agric. Ecosyst. Environ. 2026, 399, 110182. [Google Scholar] [CrossRef]
  6. Derner, J.D.; Boutton, T.W.; Briske, D.D. Grazing and ecosystem carbon storage in the North American Great Plains. Plant Soil 2006, 280, 77–90. [Google Scholar] [CrossRef]
  7. Booker, K.; Huntsinger, L.; Bartolome, J.W.; Sayre, N.F.; Stewart, W. What can ecological science tell us about opportunities for carbon sequestration on arid rangelands in the United States? Glob. Environ. Change 2013, 23, 240–251. [Google Scholar] [CrossRef]
  8. Sarkar, R.; Corriher-Olson, V.; Long, C.; Somenahally, A. Challenges and potentials for soil organic carbon sequestration in forage and grazing systems. Rangel. Ecol. Manag. 2020, 73, 786–795. [Google Scholar] [CrossRef]
  9. Henry, B.; Allen, D.; Badgery, W.; Bray, S.; Carter, J.; Dalal, R.C.; Hall, W.; Harrison, M.T.; McDonald, S.E.; McMillan, H. Soil carbon sequestration in rangelands: A critical review of the impacts of major management strategies. Rangel. J. 2024, 46, RJ24005. [Google Scholar] [CrossRef]
  10. Risch, A.C.; Zimmermann, S.; Ochoa-Hueso, R.; Schütz, M.; Frey, B.; Firn, J.L.; Fay, P.A.; Hagedorn, F.; Borer, E.T.; Seabloom, E.W.; et al. Soil net nitrogen mineralisation across global grasslands. Nat. Commun. 2019, 10, 4981. [Google Scholar] [CrossRef]
  11. Wu, M.; Chen, L.; Chen, S.; Chen, Y.; Ma, J.; Zhang, Y.; Pang, D.; Li, X. Soil Microbial Carbon and Nitrogen Limitation Constraints Soil Organic Carbon Stability in Arid and Semi-Arid Grasslands. J. Environ. Manag. 2025, 373, 123675. [Google Scholar] [CrossRef] [PubMed]
  12. Campbell, J.L.; Kennedy, R.E.; Cohen, W.B.; Miller, R.F. Assessing the carbon consequences of western juniper (Juniperus occidentalis) encroachment across Oregon. Rangel. Ecol. Manag. 2012, 65, 223–231. [Google Scholar] [CrossRef]
  13. Throop, H.L.; Lajtha, K. Spatial and temporal changes in ecosystem carbon pools following juniper encroachment and removal. Biogeochemistry 2018, 140, 373–388. [Google Scholar] [CrossRef]
  14. Abdallah, M.A.; Mata-González, R.; Noller, J.S.; Ochoa, C.G. Ecosystem carbon in relation to woody plant encroachment and control: Juniper systems in Oregon, USA. Agric. Ecosyst. Environ. 2020, 290, 106762. [Google Scholar] [CrossRef]
  15. Abdallah, M.A.; Mata-González, R.; Noller, J.S.; Ochoa, C.G. Effects of western juniper (Juniperus occidentalis) control on ecosystem nitrogen stocks in central Oregon, USA. J. Plant Ecol. 2021, 14, 1073–1089. [Google Scholar] [CrossRef]
  16. Liu, L.; Wang, X.; Lajeunesse, M.J.; Miao, G.; Piao, S.; Wan, S.; Wu, Y.; Wang, Z.; Yang, S.; Li, P.; et al. A cross-biome synthesis of soil respiration and its determinants under simulated precipitation changes. Glob. Change Biol. 2016, 22, 1394–1405. [Google Scholar] [CrossRef] [PubMed]
  17. Zhang, M.; Li, Z.; Zhang, B.; Zhang, R.; Xing, F. Planting grass enhances relations between soil microbes and enzyme activities and restores soil functions in a degraded grassland. Front. Microbiol. 2024, 15, 1290849. [Google Scholar] [CrossRef]
  18. Davis, M.R.; Alves, B.J.R.; Karlen, D.L.; Kline, K.L.; Galdos, M.; Abulebdeh, D. Review of soil organic carbon measurement protocols: A US and Brazil comparison and recommendation. Sustainability 2018, 10, 53. [Google Scholar] [CrossRef]
  19. Liu, L.; Sayer, E.J.; Deng, M.; Li, P.; Liu, W.; Wang, X.; Yang, S.; Huang, J.; Luo, J.; Su, Y.; et al. The grassland carbon cycle: Mechanisms, responses to global changes, and potential contribution to carbon neutrality. Fundam. Res. 2023, 3, 209–218. [Google Scholar] [CrossRef]
  20. Waterhouse, H.; Aburto, F.; Rees, G.; Griffin-LaHue, D.E.; Salls, W.B.; Rippner, D.A.; Tian, Z.; Scow, K.; O’Geen, A.T. Diversified vegetation types on rangelands promote multiple soil-based ecosystem services. Land Degrad. Dev. 2024, 35, 1011–1028. [Google Scholar] [CrossRef]
  21. Cotrufo, M.F.; Lavallee, J.M.; Zhang, Y.; Hansen, P.M.; Paustian, K.H.; Schipanski, M.; Wallenstein, M.D. In-N-Out: A hierarchical framework to understand and predict soil carbon storage and nitrogen recycling. Glob. Change Biol. 2021, 27, 4465–4468. [Google Scholar] [CrossRef] [PubMed]
  22. Ikram, M.; Mehran, M.; Minhas, A.; ur Rehman, H.; Bakash, M.Z.M.; Khan, M.W.; Khan, M.M.S.; El Sabagh, A.; Rasheed, H. C:N ratio and its importance in developing effective bioenergy crops. In Forage Crops in the Bioenergy Revolution: From Fields to Fuel; Springer: Singapore, 2025; pp. 259–276. [Google Scholar]
  23. Waters, C.M.; Melville, G.J.; Orgill, S.E.; Alemsaged, Y. The relationship between soil organic carbon and soil surface characteristics in the semi-arid rangelands of southern Australia. Rangel. J. 2015, 37, 297–307. [Google Scholar] [CrossRef]
  24. Kweseltken Agriculture Guide. Carbon to Nitrogen Ratios in Cropping Systems; Thompson Rivers University: Kamloops, BC, Canada, 2021. [Google Scholar]
  25. Cools, N.; Vesterdal, L.; De Vos, B.; Vanguelova, E.; Hansen, K. Tree species is the major factor explaining C:N ratios in European forest soils. For. Ecol. Manag. 2014, 311, 3–16. [Google Scholar] [CrossRef]
  26. Silver, W.L.; Ryals, R.; Eviner, V. Soil carbon pools in California’s annual grassland ecosystems. Rangel. Ecol. Manag. 2010, 63, 128–136. [Google Scholar] [CrossRef]
  27. Mudge, P.L.; Millar, J.; Pronger, J.; Roulston, A.; Penny, V.; Fraser, S.; Eger, A.; Caspari, T.; Robertson, B.; Mason, N.W.; et al. Impacts of irrigation on soil C and N stocks in grazed grasslands depends on aridity and irrigation duration. Geoderma 2021, 399, 115109. [Google Scholar] [CrossRef]
  28. Franzluebbers, A.J.; Van Vliet, S.; Young, S.; Poore, M.H. Soil health and root-zone enrichment characteristics between paired grassland and cropland fields in the southeastern United States. Grassl. Res. 2023, 2, 299–308. [Google Scholar] [CrossRef]
  29. Moore, E.B.; De, M.; Nunes, M.R.; Saha, D.; Jin, V.; Li, L.; Johnson, J.M.; Karlen, D.L.; McDaniel, M.D. Connections between roots and soil health across agriculture management practices. Plant Soil 2025, 514, 131–151. [Google Scholar] [CrossRef]
  30. IPCC. 2006 IPCC Guidelines for National Greenhouse Gas Inventories; IPCC: Geneva, Switzerland, 2006. [Google Scholar]
  31. Sanderman, J.; Hengl, T.; Fiske, G.J. Soil carbon debt of 12,000 years of human land use. Proc. Natl. Acad. Sci. USA 2017, 114, 9575–9580. [Google Scholar] [CrossRef]
  32. Ngaba, M.J.Y.; Uwiragiye, Y.; Zhou, J. Patterns and controlling factors of soil carbon sequestration in nitrogen-limited and -rich forests in China—A meta-analysis. PeerJ 2023, 11, e14694. [Google Scholar] [CrossRef] [PubMed]
  33. Rotich, B.; Szegi, T.; Gelsleichter, Y.A.; Fuchs, M.; Ocansey, C.M.; Phenson, J.N.; Abdulkadir, M.; Kipkulei, H.; Wawire, A.; Mutuma, E.; et al. Variation in soil organic carbon and total nitrogen stocks across elevation gradients and soil depths in the Mount Kenya East forest. Land 2025, 14, 1217. [Google Scholar] [CrossRef]
  34. McCulley, R.L.; Jackson, R.B. Conversion of tallgrass prairie to woodland: Consequences for carbon and nitrogen cycling. Am. Midl. Nat. 2012, 167, 307–321. [Google Scholar] [CrossRef]
  35. Jackson, R.B.; Lajtha, K.; Crow, S.E.; Hugelius, G.; Kramer, M.G.; Piñeiro, G. The ecology of soil carbon: Pools, vulnerabilities, and biotic and abiotic controls. Annu. Rev. Ecol. Evol. Syst. 2017, 48, 419–445. [Google Scholar] [CrossRef]
  36. Connell, R.K.; O’Connor, R.C.; Nippert, J.B.; Blair, J.M. Spatial variation in soil microbial processes as a result of woody encroachment depends on shrub size in tallgrass prairie. Plant Soil 2021, 460, 359–373. [Google Scholar] [CrossRef]
  37. Zhou, Y.; Boutton, T.W.; Wu, X.B. Woody plant encroachment amplifies spatial heterogeneity of soil phosphorus to considerable depth. Ecology 2018, 99, 136–147. [Google Scholar] [CrossRef]
  38. Pillay, T.; Ward, D.; Mureva, A.; Cramer, M. Differential effects of nutrient addition and woody plant encroachment on grassland soil, litter and plant dynamics across a precipitation gradient. Pedobiologia 2021, 85, 150726. [Google Scholar] [CrossRef]
  39. Shang, Z.H.; Cao, J.J.; Guo, R.Y.; Long, R.J.; Deng, B. The response of soil organic carbon and nitrogen 10 years after returning cultivated alpine steppe to grassland by abandonment or reseeding. Catena 2014, 119, 28–35. [Google Scholar] [CrossRef]
  40. Čížková, B.; Woś, B.; Pietrzykowski, M.; Frouz, J. Development of soil chemical and microbial properties in reclaimed and unreclaimed grasslands in heaps after opencast lignite mining. Ecol. Eng. 2018, 123, 103–111. [Google Scholar] [CrossRef]
  41. Hengl, T.; de Jesus, J.M.; Heuvelink, G.B.M.; Gonzalez, M.R.; Kilibarda, M.; Blagotić, A.; Shangguan, W.; Wright, M.N.; Geng, X.; Bauer-Marschallinger, B.; et al. SoilGrids250m: Global gridded soil information based on machine learning. PLoS ONE 2017, 12, e0169748. [Google Scholar] [CrossRef] [PubMed]
  42. Wadoux, A.M.C.; Minasny, B.; McBratney, A.B. Machine learning for digital soil mapping. Earth Sci. Rev. 2020, 210, 103359. [Google Scholar] [CrossRef]
  43. Kalambukattu, J.G.; Kumar, S.; Das, B.; Roy, T. Digital mapping of soil organic carbon in the hilly and mountainous landscape of Indian Himalayan region employing machine-learning techniques. Discov. Soil 2025, 2, 35. [Google Scholar] [CrossRef]
  44. Padarian, J.; Minasny, B.; McBratney, A.B. Machine learning and soil sciences. Geoderma 2020, 366, 114210. [Google Scholar]
  45. Anderson, W.E.; Borman, M.M.; Krueger, W.C. The Ecological Provinces of Oregon, SR 990; Oregon Agricultural Experiment Station: Corvallis, OR, USA, 1998; p. 138. [Google Scholar]
  46. IUSS Working Group WRB. World Reference Base for Soil Resources: International Soil Classification System for Naming Soils and Creating Legends for Soil Maps, 4th ed.; International Union of Soil Sciences (IUSS): Vienna, Austria, 2022. [Google Scholar]
  47. Western Regional Climate Center. Climate Summary for Paisley, OR; Desert Research Institute: Reno, NV, USA, 2010. [Google Scholar]
  48. Western Regional Climate Center. Climate Summary for Ione, OR; Desert Research Institute: Reno, NV, USA, 2012. [Google Scholar]
  49. Western Regional Climate Center. Climate Summary for Baker City Municipal Airport, OR; Desert Research Institute: Reno, NV, USA, 2016. [Google Scholar]
  50. Western Regional Climate Center. Climate Summary for Ironside 2 W, OR; Desert Research Institute: Reno, NV, USA, 2004. [Google Scholar]
  51. Hijmans, R.J.; Cameron, S.E.; Parra, J.L.; Jones, P.G.; Jarvis, A. Very high resolution interpolated climate surfaces for global land areas. Int. J. Climatol. 2005, 25, 1965–1978. [Google Scholar] [CrossRef]
  52. Tian, Z.; Gao, W.; Kool, D.; Ren, T.; Horton, R.; Heitman, J.L. Approaches for estimating soil water retention curves at various bulk densities with the extended van Genuchten model. Water Resour. Res. 2018, 54, 5584–5601. [Google Scholar] [CrossRef]
  53. Gee, G.W.; Bauder, J.W. Particle-size analysis. In Methods of Soil Analysis, Part 1; ASA and SSSA: Madison, WI, USA, 1986; pp. 383–411. [Google Scholar]
  54. Pribyl, D.W. A critical review of the conventional SOC to SOM conversion factor. Geoderma 2010, 156, 75–83. [Google Scholar] [CrossRef]
  55. Davies, K.W.; Bates, J.D.; Nafus, A.M. Vegetation response to mowing dense mountain big sagebrush stands. Rangel. Ecol. Manag. 2012, 65, 268–276. [Google Scholar] [CrossRef]
  56. Davies, K.W.; Bates, J.D. Attempting to restore herbaceous understories in Wyoming big sagebrush communities with mowing and seeding. Restor. Ecol. 2014, 22, 608–615. [Google Scholar] [CrossRef]
  57. Ochoa, C.G.; Caruso, P.; Ray, G.; DeBoodt, T.; Jarvis, W.T.; Guldan, S.J. Ecohydrologic connections in semiarid watershed systems of central Oregon, USA. Water 2018, 10, 181. [Google Scholar] [CrossRef]
  58. Chambers, J.C.; Urza, A.K.; Board, D.I.; Miller, R.F.; Pyke, D.A.; Roundy, B.A.; Schupp, E.W.; Tausch, R.J. Sagebrush recovery patterns after fuel treatments mediated by disturbance type and plant functional group interactions. Ecosphere 2021, 12, e03450. [Google Scholar] [CrossRef]
  59. Dittel, J.W.; Sanchez, D.; Ellsworth, L.M.; Morozumi, C.N.; Mata-Gonzalez, R. A case for adaptive management of rangelands’ wicked problems. Rangel. Ecol. Manag. 2023, 91, 105–111. [Google Scholar] [CrossRef]
  60. Gerke, J. The central role of soil organic matter in soil fertility and carbon storage. Soil Syst. 2022, 6, 33. [Google Scholar] [CrossRef]
  61. Sakin, E.; Yanardağ, H.I.; Fırat, Z.; Çelik, A.; Beyyavaş, V.; Cun, S. Some indicators for the assessment of soil health: A mini review. MAS J. Appl. Sci. 2024, 9, 297–310. [Google Scholar]
  62. Wiesmeier, M.; Urbanski, L.; Hobley, E.; Lang, B.; von Lützow, M.; Marin-Spiotta, E.; van Wesemael, B.; Rabot, E.; Ließ, M.; Garcia-Franco, N.; et al. Soil organic carbon storage as a key function of soils—A review of drivers and indicators at various scales. Geoderma 2019, 333, 149–162. [Google Scholar] [CrossRef]
  63. Schoonover, J.E.; Crim, J.F. An introduction to soil concepts and the role of soils in watershed management. J. Contemp. Water Res. Educ. 2015, 154, 21–47. [Google Scholar] [CrossRef]
  64. Chakraborty, K.; Mistri, B. Importance of soil texture in sustenance of agriculture: A study in Burdwan-I CD Block, West Bengal. East. Geogr. 2015, 21, 475–482. [Google Scholar]
  65. Pandao, M.R.; Thakare, A.A.; Choudhari, R.J.; Navghare, N.R.; Sirsat, D.D.; Rathod, S.R. Soil health and nutrient management. Int. J. Plant Soil Sci. 2024, 36, 873–883. [Google Scholar] [CrossRef]
  66. Das, A.; Purakayastha, T.J.; Ahmed, N.; Das, R.; Biswas, S.; Shivay, Y.S.; Sehgal, V.K.; Rani, K.; Trivedi, A.; Tigga, P.; et al. Influence of clay mineralogy on soil organic carbon stabilization under tropical climate, India. J. Soil Sci. Plant Nutr. 2023, 23, 1003–1018. [Google Scholar] [CrossRef]
  67. Tang, Y.; Tran, T.K.A.; Minasny, B.; Bakhshandeh, S.; Du, M.; Francos, N.; Huang, Y.C.; Jang, H.J.; Ng, W.; Xue, P.; et al. SOC stabilisation shifts from carbon accumulation in temperate soils to mineral association in subtropical soils. Soil Biol. Biochem. 2026, 215, 110101. [Google Scholar] [CrossRef]
  68. Ding, J.; Eldridge, D.J. Ecosystem service trade-offs resulting from woody plant removal vary with biome, encroachment stage and removal method. J. Appl. Ecol. 2024, 61, 236–248. [Google Scholar] [CrossRef]
  69. Gao, F.; Cui, X.; Chen, M.; Sang, Y. Forest conversion changes soil particulate organic carbon and mineral-associated organic carbon via plant inputs and microbial processes. Forests 2023, 14, 1234. [Google Scholar] [CrossRef]
  70. Wang, J.; Hu, X. Woody plant reduces soil organic carbon controlled by precipitation. J. Environ. Manag. 2025, 377, 124581. [Google Scholar] [CrossRef]
  71. Ren, Z.; Li, C.; Wang, S.; Zhou, W.; Stringer, L.C.; Fu, B. Effects of land-use change on soil total carbon pool: A meta-analysis. Agric. Ecosyst. Environ. 2026, 396, 110021. [Google Scholar] [CrossRef]
  72. Bates, J.D.; Svejcar, T.; Miller, R.; Davies, K.W. Plant community dynamics 25 years after juniper control. Rangel. Ecol. Manag. 2017, 70, 356–362. [Google Scholar] [CrossRef]
  73. Dittel, J.W.; Sanchez, D.; Ellsworth, L.M.; Morozumi, C.N.; Mata-González, R. Vegetation response to juniper reduction and grazing exclusion in sagebrush-steppe habitat in eastern Oregon. Rangel. Ecol. Manag. 2018, 71, 213–219. [Google Scholar] [CrossRef]
  74. Ray, G.; Ochoa, C.G.; DeBoodt, T.; Mata-González, R. Overstory–understory vegetation cover and soil water content observations in western juniper woodlands: A paired watershed study in central Oregon, USA. Forests 2019, 10, 151. [Google Scholar] [CrossRef]
  75. Swanson, S.R.; Swanson, J.C.; Murphy, P.J.; McAdoo, J.K.; Schultz, B. Mowing Wyoming big sagebrush cover effects across northern and central Nevada. Rangel. Ecol. Manag. 2016, 69, 360–372. [Google Scholar] [CrossRef]
  76. Johnston, A.N.; Beever, E.A.; Merkle, J.A.; Chong, G. Vegetation responses to sagebrush-reduction treatments measured by satellites. Ecol. Indic. 2018, 87, 66–76. [Google Scholar] [CrossRef]
  77. Davies, K.W.; Bates, J.D.; O’Connor, R. Long-term evaluation of restoring understories in Wyoming big sagebrush communities with mowing and seeding native bunchgrasses. Rangel. Ecol. Manag. 2021, 75, 81–90. [Google Scholar] [CrossRef]
  78. Gan, L.; Hu, X. Woody plant encroachment allocated more photosynthetic carbon belowground through soil pores in grasslands. Catena 2025, 258, 109303. [Google Scholar] [CrossRef]
  79. Contreras-Cisneros, A.J.; Mata-González, R.; Trejo-Calzada, R.; Pedroza-Sandoval, A.; Prado-Tarango, D.; Abdallah, M.A.B. Carbon and nitrogen stocks through time in abandoned croplands of the Comarca Lagunera, Mexico. Agric. Ecosyst. Environ. 2022, 327, 107828. [Google Scholar] [CrossRef]
  80. Liu, X.; Yang, T.; Wang, Q.; Huang, F.; Li, L. Dynamics of soil carbon and nitrogen stocks after afforestation in arid and semi-arid regions: A meta-analysis. Sci. Total Environ. 2018, 618, 1658–1664. [Google Scholar] [CrossRef]
  81. USDA Natural Resources Conservation Service. Soil Tech Note 23A: Carbon:Nitrogen Ratio (C:N); USDA NRCS: Washington, DC, USA, 2001. [Google Scholar]
  82. Fowler, A.F.; Basso, B.; Millar, N.; Brinton, W.F. A simple soil mass correction for a more accurate determination of soil carbon stock changes. Sci. Rep. 2023, 13, 2242. [Google Scholar] [CrossRef] [PubMed]
  83. Guo, J.; Xiong, W.; Qiu, J.; Wang, G. Linking soil organic carbon mineralization to soil physicochemical properties and bacterial alpha diversity at different depths following land use changes. Ecol. Process. 2023, 12, 39. [Google Scholar] [CrossRef]
  84. Hou, C.J.; Lu, Y.H.; Tseng, Y.C.; Tsai, Y.C.; Huang, W.L.; Juang, K.W. Using a comprehensive model for cropland types in relationships between soil bulk density and organic carbon to predict site-specific carbon stocks. J. Soils Sediments 2024, 24, 2584–2598. [Google Scholar] [CrossRef]
  85. Kučera, A.; Vavříček, D.; Drápela, K.; Zouhar, V.; Friedl, M.; Vranová, V. Defining the relationship between bulk density and organic carbon content in forest soils using generalised linear mixed-effect models. Carbon Balance Manag. 2025, 20, 36. [Google Scholar] [CrossRef] [PubMed]
  86. Céspedes-Payret, C.; Bazzoni, B.; Gutiérrez, O.; Panario, D. Soil organic carbon vs. bulk density following temperate grassland afforestation. Environ. Process. 2017, 4, 75–92. [Google Scholar] [CrossRef]
  87. Nyameasem, J.K.; De Los Rios, J.; Kluß, C.; Reinsch, T.; Poyda, A.; Taube, F.; Loges, R. Incorporating leys in arable systems as a mitigation strategy to reduce soil organic carbon losses during land-use change. Front. Environ. Sci. 2024, 12, 1399197. [Google Scholar] [CrossRef]
  88. Li, D.; Niu, S.; Luo, Y. Global patterns of the dynamics of soil carbon and nitrogen stocks following afforestation: A meta-analysis. New Phytol. 2012, 195, 172–181. [Google Scholar] [CrossRef]
Figure 1. Map of the state of Oregon showing the gradient of yearly precipitation and the study site locations with their corresponding ecological province, i.e., Columbia Basin (CB), John Day (JD), Snake River (SR), and Klamath (KB). Figure modified from [51].
Applsci 16 04212 g001
Figure 2. Soil C stocks (t C ha−1) by depth (0 to 10 cm, 15 to 25 cm) at all sites. Data are presented as means ± standard error. Different letters indicate statistically significant (p ≤ 0.05) differences in mean values across sites.
Applsci 16 04212 g002
Figure 3. Soil N stocks (t N ha−1) by depth (0 to 10 cm, 15 to 25 cm) at all sites. Data are presented as means ± standard error. Different letters indicate statistically significant (p ≤ 0.05) differences in mean values across sites.
Applsci 16 04212 g003
Figure 4. Soil C stocks (t C ha−1) by management practices (treated vs. untreated) at different soil depths (0 to 10 cm, 15 to 25 cm) across sites. Data are presented as means ± standard error. Different letters indicate statistically significant (p ≤ 0.05) differences in mean values across sites.
Applsci 16 04212 g004
Figure 5. Soil N stocks (t N ha−1) by management practices (treated vs. untreated) at different soil depths (0 to 10 cm, 15 to 25 cm) across sites. Data are presented as means ± standard error. Different letters indicate statistically significant (p ≤ 0.05) differences in mean values across sites.
Applsci 16 04212 g005
Figure 6. Mean soil C and N stocks (t ha−1) for treated and untreated rangelands at two soil depths (0 to 10 cm and 15 to 25 cm), averaged across all study sites. Values represent means ± standard error. Different letters denote statistically significant differences (p ≤ 0.05) between management treatments within each depth.
Applsci 16 04212 g006
Figure 7. Soil C stocks (t C ha−1) by vegetation cover in treated vs. untreated sites at 0 to 30 cm soil depth. Data are means ± standard error. Different letters indicate statistically significant (p ≤ 0.05) differences in mean values across sites.
Applsci 16 04212 g007
Figure 8. Soil N stocks (t N ha−1) by vegetation cover in treated vs. untreated sites at 0 to 30 cm soil depth. Data are means ± standard error. Different letters indicate statistically significant (p ≤ 0.05) differences in mean values across sites.
Applsci 16 04212 g008
Table 1. Field sites in each ecological province, showing dominant vegetation cover, treatment, area of each field, and number (n) of soil samples collected at each site.
Field SiteDominant
Vegetation Cover
TreatmentArea (ha)n
John Day Ecological Province
JD_TSagebrushJuniper removal–natural regeneration (2005)11645
JD_UTJuniperNone9646
Columbia Basin Ecological Province
CB_TTriticaleDryland crop1426
CB_UTSagebrushNone 28
Snake River Ecological Province
SR1_TShrub-grassJuniper removal–natural regeneration (2022)826
SR2_TGrasslandSagebrush removal & grass seeding–broadcast (2019)28
SR2_UTSagebrushNone216
Klamath Ecological Province
KB1_TShrub-grassGrass mix seeding–aerial (2021)312
KB1_UTShrub-grassNone311
KB2_TPonderosa pineGrass mix seeding–aerial (2021)312
KB2_UTJuniperNone312
KB3_TShrub-grassGrass mix seeding–aerial (2021)312
KB3_UTShrub-grassNone311
Table 2. Soil properties across study sites by soil depth. Soil properties include carbon (C), nitrogen (N), and organic matter (OM) content, as well as the carbon and nitrogen ratio (C:N), bulk density (BD), soil volumetric water content (SVWC), soil porosity (PS), and soil texture based on particle size analysis.
Field SiteSoil DepthCNC:NOMBDSVWCPSSoil Texture
(cm)(%)(%)Ratio(%)(g cm−3)(%)(%)
JD_T0 to 102.610.1913.545.221.3322.3352.10Sandy Loam
JD_UT0 to 101.900.1512.473.811.1722.7757.68Sandy Loam
JD_T15 to 251.260.1012.852.511.3817.9547.80Sandy Loam
JD_UT15 to 251.270.1111.892.531.2418.1053.11Sandy Clay Loam
CB_T0 to 100.690.0610.701.371.4617.8545.02Silt Loam
CB_UT0 to 100.590.0511.731.171.459.1645.19Silt Loam
CB_T15 to 250.390.0410.540.781.435.6045.96Silt Loam
CB_UT15 to 250.450.0313.240.901.459.2144.99Silt Loam
SR1_T0 to 103.220.2712.076.441.3618.0248.82Sandy Loam
SR1_T15 to 252.130.1911.324.261.4113.5046.89Sandy Loam
SR2_T0 to 104.760.3812.539.531.0631.3859.82Loam
SR2_UT0 to 102.260.1812.914.521.2132.3854.27Sandy Loam
SR2_T15 to 253.360.2712.386.730.9323.5264.75Loam
SR2_UT15 to 251.440.1113.122.891.3730.0448.44Sandy Loam
KB1_T0 to 102.210.1812.054.421.1313.0557.27Loam
KB1_UT0 to 101.850.1512.043.691.1813.8055.60Loam
KB1_T15 to 251.730.1511.953.471.1117.7558.20Loam
KB1_UT15 to 251.750.1511.683.501.0215.7261.64Sandy Clay Loam
KB2_T0 to 103.780.2316.817.560.9713.5163.30Loam
KB2_UT0 to 102.160.1514.534.311.207.1754.74Sandy Clay Loam
KB2_T15 to 252.830.1716.985.660.8917.4766.41Sandy Clay Loam
KB2_UT15 to 251.570.1213.643.141.259.7852.81Sandy Clay Loam
KB3_T0 to 101.820.1314.143.631.199.2455.05Loam
KB3_UT0 to 101.410.1013.902.831.2212.4953.77Clay Loam
KB3_T15 to 251.490.1113.552.981.1814.9455.48Clay Loam
KB3_UT15 to 251.310.1111.922.621.0220.2961.48Clay Loam
Table 3. Correlations (r) between soil percent carbon (C) and percent nitrogen (%N), bulk density (BD), soil volumetric water content (SVWC), and percent clay (%Clay). The Spearman r test was used for non-uniformly distributed data.
Site%NBDSVWC%ClayTest
JD_T0.98−0.720.50**Spearman
CB_T0.90**0.850.44Spearman
SR1_T0.99**0.48−0.46Spearman
SR2_T0.99******Spearman
KB1_T0.96**−0.61**Spearman
KB2_T0.96**−0.62**Pearson
KB3_T0.75******Spearman
JD_UT0.92−0.310.06**Spearman
CB_UT********Spearman
SR2_UT1.00−0.59−0.69**Spearman
KB1_UT0.99−0.74−0.70**Pearson
KB2_UT0.97**−0.69**Spearman
KB3_UT0.67******Spearman
** No significant difference (p > 0.05).
Disclaimer/Publisher’s Note: The statements, opinions and data contained in all publications are solely those of the individual author(s) and contributor(s) and not of MDPI and/or the editor(s). MDPI and/or the editor(s) disclaim responsibility for any injury to people or property resulting from any ideas, methods, instructions or products referred to in the content.