


Abstract
Proton exchange membrane fuel cell vehicles (PEMFCVs) have attracted widespread attention in recent years. However, there are many challenges existing in the development, such as the durability and economy of the fuel cell system (FCS). In this investigation, a fuzzy energy management strategy based on Grey Bernoulli Prediction (FEMS-GBP) is proposed to mitigate these two issues. Grey Bernoulli Prediction (GBP) is used to predict the FCS short-term future power demand with a low calculation amount, which is suitable for real-time on-board applications in PEMFCVs. Therefore, FEMS-GBP can proactively adjust FCS output power to reduce large load change times during PEMFCV operation, thereby improving FCS durability. Fuzzy control is employed to accomplish the energy management task between the FCS and the battery for better fuel economy. Numerical simulations and experiments under different vehicle driving cycles are carried out to evaluate the performance of FEMS-GBP. By comparing it with two other conventional energy management strategies, FEMS-GBP is demonstrated to be feasible and effective, as it achieves favorable performance in balancing durability and economy, especially under practical driving conditions.
1. Introduction
As a new type of clean energy vehicle, the proton exchange membrane fuel cell vehicle (PEMFCV) has attracted widespread attention in recent years. Its core technology lies in proton exchange membrane fuel cells (PEMFCs), which can directly convert hydrogen and oxygen into electrical energy through electrochemical reactions with zero emissions. Compared with conventional internal combustion engines, PEMFCs have a significant advantage in energy conversion efficiency, with well-to-wheel efficiency that 30% higher than that of conventional internal combustion engines [1]. The typical efficiency of a PEMFC ranges from 40% to 60% [2]. Hu et al. [3] conducted an experiment on a fuel cell-powered hybrid city bus, where a maximum efficiency of 49% was achieved at 15 kW load. Additionally, with fast hydrogen refueling and long endurance ability, PEMFCV is suitable for both long-distance travel and urban transportation.
Currently, PEMFC can reach a high mass power density of 1000 W·kg−1, and the power density of the PEMFC stack with end plates has exceeded 4.4 kW·L−1 [2]. The stack volume power density is expected to reach 6 kW L−1 in a few years, with the working current density and cell voltage increasing to 3–4 A·cm−2 and 0.7–0.8 V, respectively. Furthermore, an ultimate stack target of 9 kW·L−1 may be achieved with further developments, with cell operating points raised to even higher levels, such as 4–5 A·cm−2 and 0.8–0.9 V [4]. However, many challenges still exist in its development, such as durability and economy [5]. Specifically for durability, working conditions such as frequent start-stop, large load change and extreme environments will accelerate fuel cell system (FCS) degradation. And for fuel economy, the hydrogen price and FCS efficiency during vehicle operation are the main influencing factors, and the market promotion is seriously affected by the high total cost of ownership (TCO). In order to improve the economy and durability of PEMFCV, improvements need to be made in terms of energy management and durability control methods.
A durability research method at the FCS scale was exhibited in [6], which conducted experimental studies on FCS failure modes. It was found that the FCS dry operation, start-stop cycle, and gas diffusion layer (GDL) flooding are typical failure modes of FCS. To address the degradation issue affecting the FCS durability, a compound energy management strategy was proposed in [7]. This strategy combined a sliding average filter with fuzzy and switching control. It effectively reduced start-stop cycles and low-load conditions, and FCS durability under frequent load changes is improved. In ref. [8], the FCS performance changes under load cycling conditions were investigated using an orthogonal experimental method. The study concluded that load cycling should be avoided in the initial stage after FCS is put into operation. In ref. [9], an interpretable data-driven framework for predicting FCS degradation under dynamic conditions was proposed. System parameters were used to construct virtual voltages, serving as health indicators for degradation forecasting. In ref. [10], a new dynamic health indicator, the relative power loss rate (RPLR), was proposed to represent the degradation state under load changes. In ref. [11], a neural network optimized by genetic algorithms was proposed. The network was designed to avoid unnecessary start-stop cycles and rapid load changes. However, the above literature primarily addresses the durability of FCS, with limited consideration given to FCS fuel economy.
Recent research has made substantial progress in developing a health-aware energy management strategy (EMS) that can balance FCS durability and fuel economy of PEMFCV. In ref. [12], the FCS start-stop state was treated as a state variable, with an idle transition period introduced to enable adaptive control of start-stop intervals. The FCS performance degradation index represented durability cost, while vehicle energy consumption reflected economic cost. A joint cost function is then constructed. In ref. [13], an energy management strategy for FCS buses was designed based on the Pontryagin Minimum Principle (PMP). Here, FCS power was treated as the control variable, energy consumption was minimized as the objective function, and FCS durability was included as a constraint. In ref. [14], to address the durability and efficiency challenges of heavy-duty long-haul transportation, a health-conscious EMS was proposed with a dual-stage predictive control structure and the multi-objective optimization of fuel consumption, fuel cell degradation, and battery degradation. In ref. [15], a degradation-considering adaptive equivalent consumption minimization strategy (D-ECMS) was employed to improve the economy and durability of the fuel cell vehicle. The particle swarm optimization (PSO) algorithm was used to optimize the penalty factor under different vehicle speed conditions, and a BP neural network was used to identify real-time conditions to form an adaptive equivalent consumption minimum strategy. In ref. [16], an online model predictive control (MPC)-based EMS with adaptive weighting factors was introduced, which incorporated two objectives: minimizing total operating cost and reducing the degradation disparity between the fuel cell and battery. In ref. [17], a reinforcement learning energy management strategy based on driving condition recognition was proposed. In this method, an unsupervised clustering strategy was used for the classification of vehicle driving conditions, and then driving conditions were employed to train different agents in deep Q-network learning. The deep Q-network learning strategy with a reward value function that integrates fuel consumption and fuel cell life decay was developed. In ref. [18], the EMS based on double-delay deep deterministic policy gradient (TD3) deep reinforcement learning, which considers energy degradation, economic efficiency, and driving conditions, was introduced. The results showed that the EMS not only achieved a reduction in the FC system degradation but also lowered overall operational costs. In ref. [19], a health-aware fuzzy logic (FL) EMS aimed to improve energy efficiency and extend fuel cell system lifespan was introduced. The FL-based EMS was developed using vehicle power demand and battery state of charge (SOC) as inputs, with the FCS power change rate as the output, aiming to mitigate degradation induced by abrupt load transitions. Meanwhile, another health-aware hierarchical EMS (HH-EMS) with a two-layer fuzzy control structure was proposed to jointly optimize energy source-durability and vehicle energy consumption in ref. [20].
In this paper, considering the real-time requirements and highly fluctuating loads of on-board vehicle applications, a fuzzy control energy management strategy based on Grey Bernoulli Prediction (FEMS-GBP) will be proposed, which also simultaneously considers both fuel economy and durability. Fuzzy control is used to efficiently distribute power between the FCS and the lithium battery, ensuring the FCS operates within a high-efficiency range, thereby improving its fuel economy. The Grey Bernoulli Prediction (GBP) model predicts FCS power demand for the next cycle with a low calculation amount, as few as four data points, enabling preemptive adjustment of FCS output to avoid large load changes and extend FCS lifetime.
Grey prediction has been successfully applied to various prediction tasks, including electricity consumption forecasting [21,22], trend prediction of public health emergencies [23], GDP forecasting [24], grain production prediction [25], and so forth. The GM(1,1) model is the most widely utilized model in grey prediction. Compared with the GM(1,1) model, the GBP model can better adapt to complex and nonlinear data variations by introducing a nonlinear parameter [26]. The GBP model is built based on the Bernoulli differential equation, and the GM(1,1) model is the special form of the GBP model when being 0. In the GBP model, the original data sequence should be non-negative or transformed into a non-negative sequence through data processing methods, such as data shifting. And after one-time accumulated generating operation (1-AGO), the model exhibits an approximate exponential trend. serves as an adjustable parameter that endows the GBP model with excellent flexibility. If the exponent could be selected properly, the flexibility and prediction accuracy of the GBP model are enhanced, making it suitable for scenarios with large fluctuations. It has been successfully employed to forecast power generation in China, South Korea, and India [27], and applied to traffic flow prediction [26], among other applications. Since grey prediction can achieve reliable forecasting with a small dataset and adapt to varying operating conditions and environmental changes, it is also suitable for real-time online applications in vehicle power demand prediction [28,29].
The remainder of this paper is organized as follows. Section 2 analyzes the degradation factors of FCS and the indicators used for evaluating performance degradation in this study. Section 3 introduces the topology and model of the FCS. Section 4 presents and explains FEMS-GBP. Section 5 introduces the experimental method, and the experimental results are analyzed.
2. Analysis of FCS Performance Degradation
The main reason for FCS performance degradation is attributed to harsh working conditions, such as frequent start-stop cycles, temperature fluctuations, humidity changes, and load variations. These factors collectively present multiple challenges for FCS during actual operation. The study of FCS performance degradation can be simplified by analyzing degradation mechanisms under four severe conditions: start-stop cycles, idle operation, load changes, and high loads [30].
2.1. FCS Performance Degradation Factors
FCS start-stop cycles significantly impact performance and accelerate degradation [31]. In actual operation, frequent start-stop cycles in PEMFCVs result in a substantial reduction of platinum mass and surface area in the catalyst layer, causing severe temperature variations and current density fluctuations in both the catalyst and the proton exchange membrane. These effects accelerate catalyst deactivation and membrane degradation, ultimately reducing electrochemical activity [32]. High transient output voltage is considered the main factor contributing to the aforementioned performance degradation [33]. In ref. [34], the degradation mechanisms of PEMFC during start-stop were analyzed, summarizing three key mitigation strategies for start-stop degradation: disrupting carbon carrier corrosion conditions, reducing the duration of the hydrogen–air boundary at the anode, and limiting the potential of the cathode catalyst layer. In ref. [35], the gas distribution process of FCS during start-stop was analyzed, summarizing the main mechanisms and factors contributing to degradation. Solutions for material improvement and system control were proposed to address PEMFC degradation and extend lifetime, providing a foundation for improving system performance.
The impact of idle operation on FCS lifetime is mainly reflected in the membrane becoming dry and the internal resistance increasing. In ref. [36], a new accelerated testing method was proposed to evaluate membrane electrode assembly (MEA) durability under actual fuel cell vehicle conditions, including idle operation. Experimental results showed that this method effectively degrades the membrane electrode in a short time, thereby affecting the long-term performance and FCS lifetime under idle conditions.
Frequent load changes are the main reason for FCS performance degradation [37]. These changes force FCS to switch repeatedly between different loads, resulting in significant fluctuations in electrochemical reaction rates and temperature. These fluctuations degrade the catalyst layer and membrane electrode, ultimately reducing the overall lifetime of FCS. In ref. [38], a new method was developed to describe FCS voltage changes and reactant gas distribution under steady-state and dynamic conditions. This method serves as a reference for optimal control and structural design of FCS high dynamic response.
High load conditions typically increase internal cell temperature and decrease reactant concentration, accelerating catalyst degradation and membrane loss, ultimately shortening FCS lifetime. In ref. [39], it was pointed out that high load conditions cause Pt cluster migration and local hot spots, leading to membrane perforation. The degradation of FCS under high load conditions was investigated in [40] through accelerated stress testing, revealing significant catalyst degradation.
As mentioned above, the FCS degradation process is complex, and physical modeling of fuel cell degradation is challenging. Some scholars have proposed an empirical model that evaluates the voltage degradation of fuel cells in automotive applications in previous studies [14,18,41].
where is the voltage degradation; , , , are the performance degradation rates resulting from start-stop cycling, idle operation, high load operation, and dynamic loading, separately; , , , are the number of start-stop cycles, the idle operating time, the time operating at high load, and the dynamic load changing cycle times; is the ratio of the voltage degradation of the real driving cycle and the voltage degradation of the tested driving cycle in the lab.
2.2. Assessment Method of FCS Performance Degradation
Research on FCS durability under various working conditions has broad applicability. It primarily focuses on performance degradation resulting from four key conditions: start-stop, idle, load change, and high load [5]. The most representative method is the accelerated evaluation method for FCS lifetime, as described in Equation (1) proposed in [41], which is developed with data from fuel cell vehicles and laboratory test data from fuel cell stacks. This model evaluated FCS performance degradation rates under four conditions: start-stop, idle, load changes, and high load. The results indicated that varying load conditions and start-stop cycles are the main factors for FCS degradation, with one-third attributed to start-stop cycles and 56% due to load changes, particularly large load changes. In the period of start-stop cycling, the fuel cell degradation is related to the high open-circuit voltage. The effect of start-stop cycling on the fuel cell lifetime is much less, which can almost be ignored, while the fuel cell voltage remainder is dispelled betimes after every start-stop cycle [41]. In ref. [15], it is pointed out that in actual driving conditions, the demand power of the vehicle always fluctuates frequently, and it spends much more time in dynamic load changing conditions than in the other three unfavorable conditions. Therefore, the dynamic load changing condition has the greatest impact on the durability decline of fuel cells, followed by the start-stop process, idle operation, and high-power conditions. Huo et al. [18] also indicate that the high transient power requirements of FCS can accelerate degradation and lead to premature breakdown.
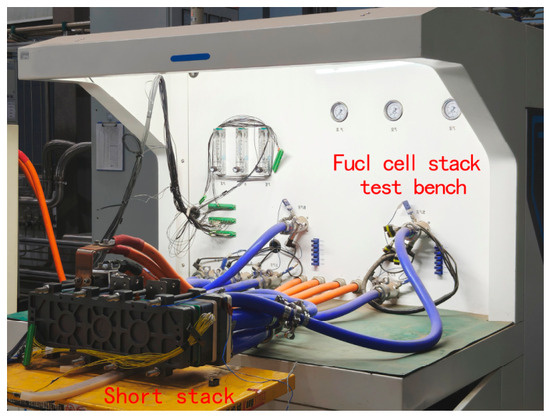
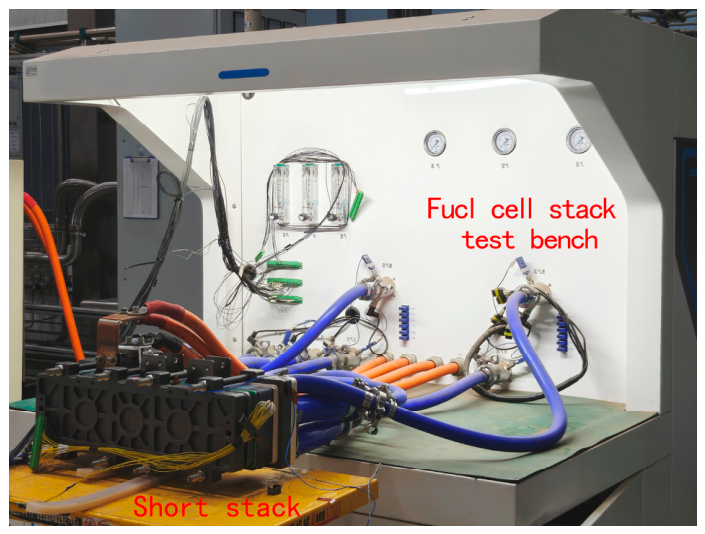
To verify the effect of dynamic load variation conditions on fuel cell durability, a load cycling test was conducted on a short stack consisting of the same single cells as the FCS studied behind. The experimental setup is shown in Figure 1.
Figure 1.
Experimental setup of the load cycling test.
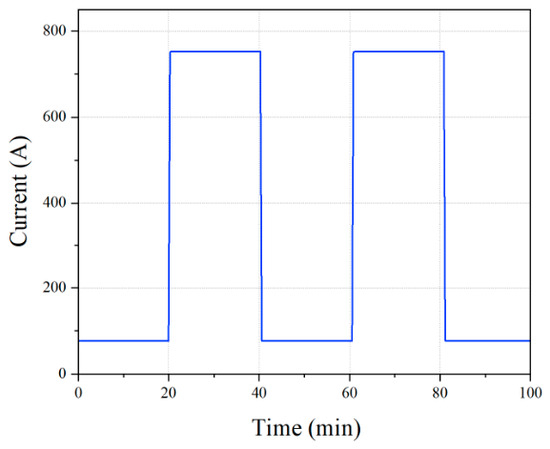
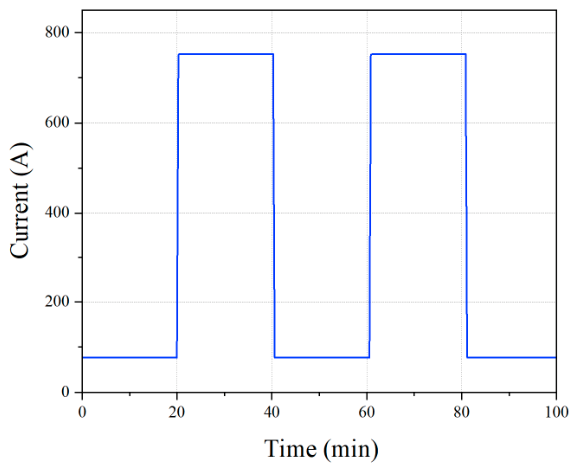
During the test, the load cycled between 76 A and 760 A, with a load variation range of 90% of the rated power, and the load variation profile is presented in Figure 2. To investigate the influence of high transient power demands on durability, two loading rates, namely 40 A·s−1 and 10 A·s−1, were adopted, and 50 h tests consisting of approximately 75 cycles were performed sequentially at these two rates.
Figure 2.
The load variation profile.
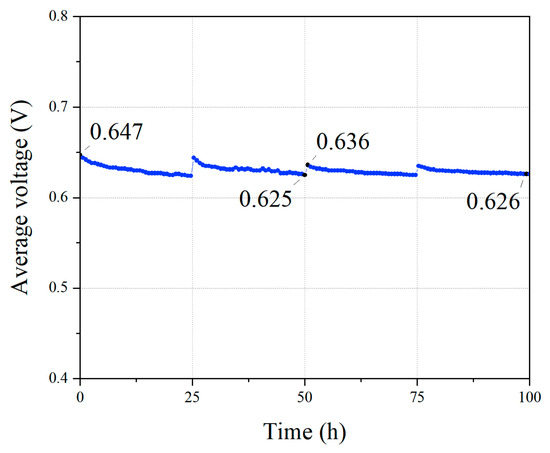
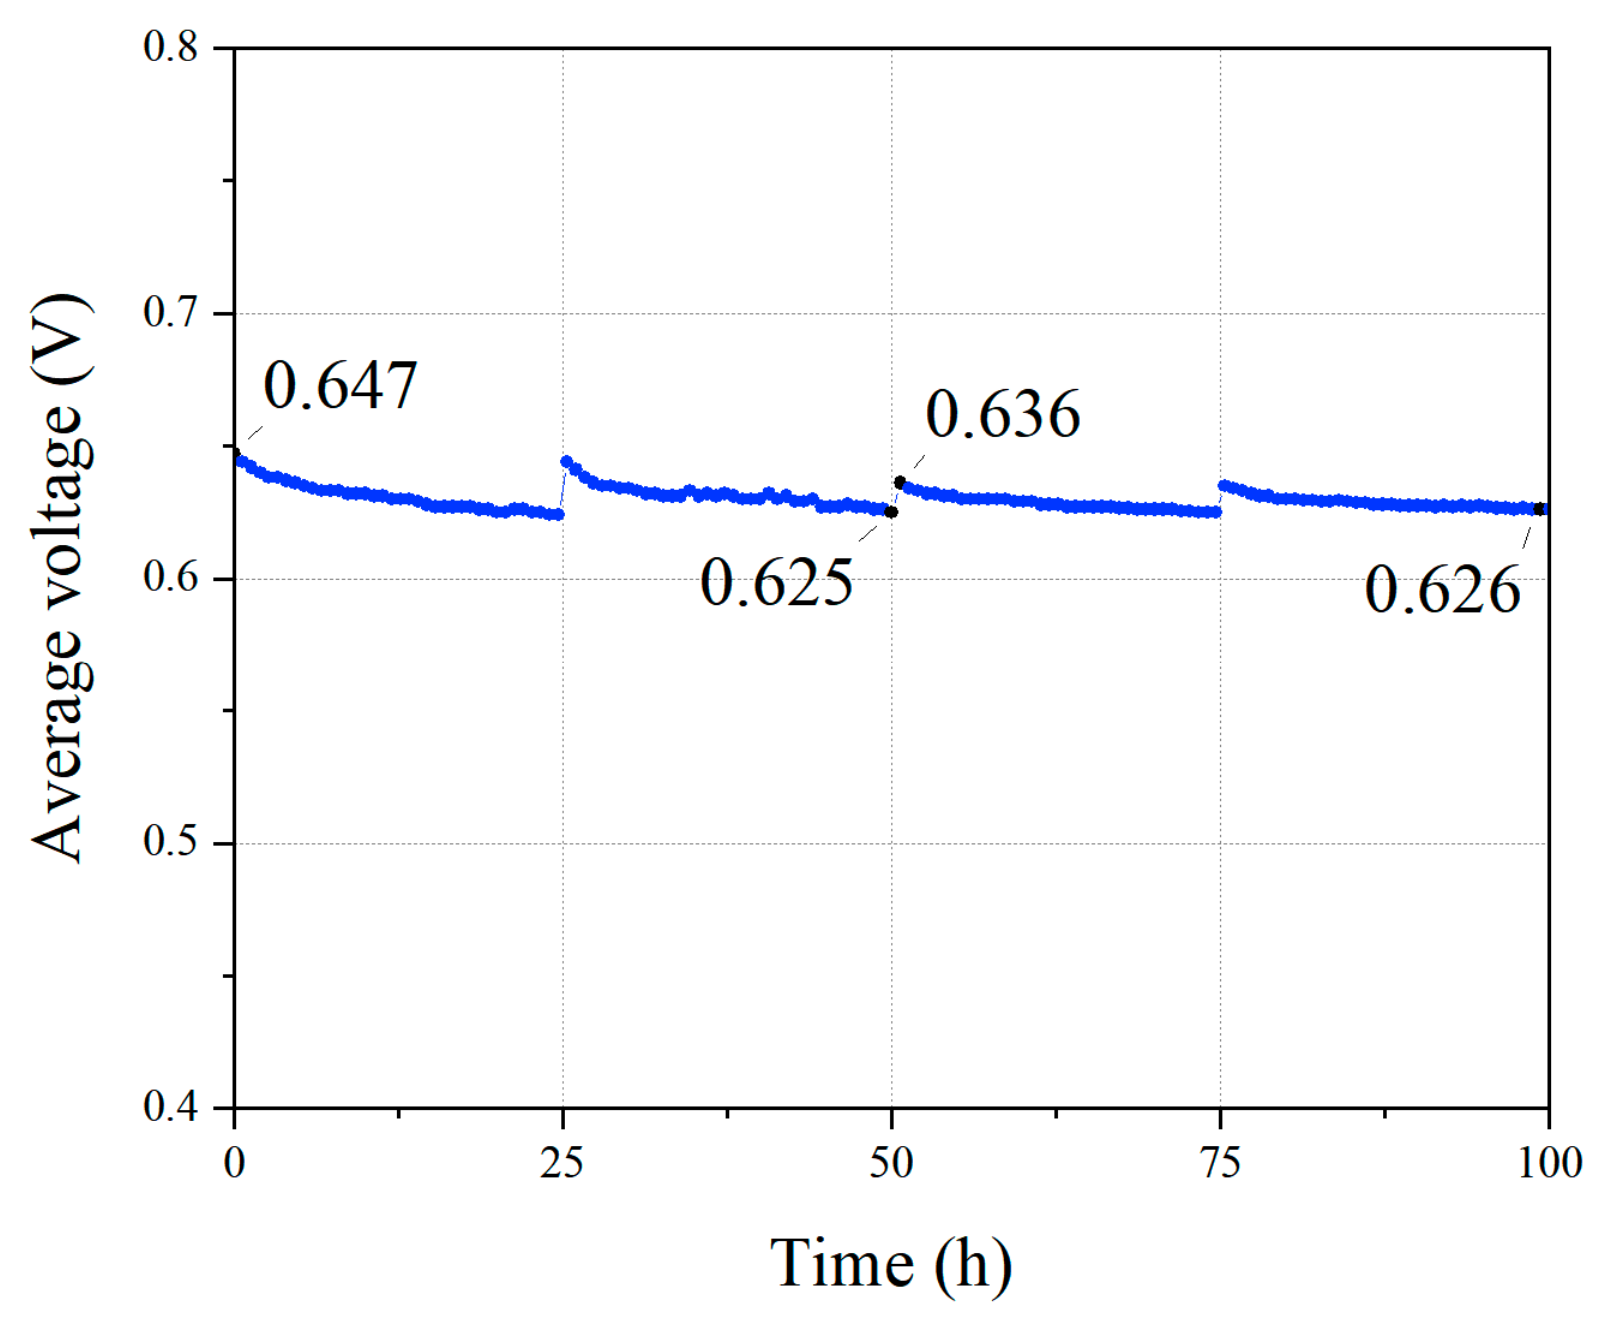
The performance was evaluated at the current of 760 A, as illustrated in Figure 3. Breakpoints in the curve in Figure 3 were caused by start-stop operations. The initial average cell voltage was 0.647 V. After 50 h of cycling at 40 A·s−1 loading rate, the average voltage decreased from 0.647 V to 0.625 V, corresponding to a degradation rate of 293.3 μV·cycle−1, as the parameter described by Equation (1). Following an additional 50 h of cycling at 10 A·s−1, the average voltage dropped from 0.636 V to 0.626 V, with a degradation rate of 133.3 μV·cycle−1. In this experiment, the performance degradation rate at 40 A·s−1 was significantly higher than that at 10 A·s−1, indicating that high transient power demands of the FCS can accelerate performance degradation. Therefore, reducing large dynamic load changes can significantly extend FCS lifetime, and this paper primarily evaluates FCS performance degradation, focusing on high transient power demands.
Figure 3.
Performance degradation at a current of 760 A in the load cycling test.
3. Powertrain of Fuel Cell Vehicle
3.1. FCV Powertrain Topology
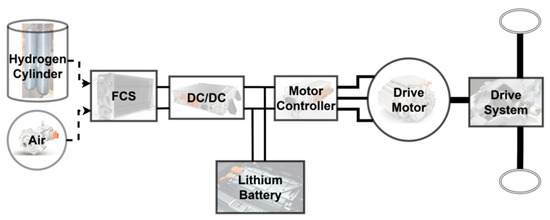
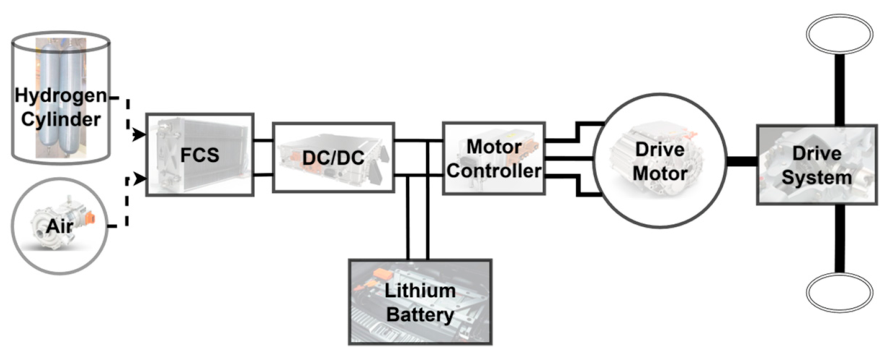
The fuel cell vehicles studied in this paper are primarily commercial fuel cell vehicles, utilizing FCS as the main power source and a lithium battery as an auxiliary power source to form a hybrid power system. This topology design expands the working range of the power system and increases the opportunities for hybrid power systems to operate in efficient regions. The powertrain topology is illustrated in Figure 4. FCS and lithium battery work together to power the vehicle, effectively avoiding fluctuations in FCS load. When additional power is required or a temporary improvement of acceleration performance is needed, the lithium battery can supplement power in a timely manner. Additionally, the lithium battery can recover braking energy, thereby improving energy efficiency.
Figure 4.
Powertrain topology.
3.2. Modeling
During the PEMFCV steady-state driving process, there exists a dynamic equilibrium relationship between the driving force and the running resistance acting on the vehicle. The driving force is provided by the Drive Motor, shown in Figure 4, which is mainly powered by FCS with the lithium battery serving as an auxiliary energy source. And the vehicle is subjected to multiple types of resistance during driving, including air resistance, acceleration resistance, slope resistance, and rolling resistance. Therefore, the calculation method for the PEMFCV required power is expressed as [42]
where is power for the vehicle; is air resistance; is slope resistance; is rolling resistance; is acceleration resistance; is speed. When the vehicle is stably driving on a smooth road surface, the rolling resistance and air resistance are the main considerations.
Air resistance expressed as [42]
where is the air resistance coefficient; is the windward area; is air density.
Rolling resistance expressed as [42]
where is the rolling resistance coefficient; is vehicle mass; is the angle of slope.
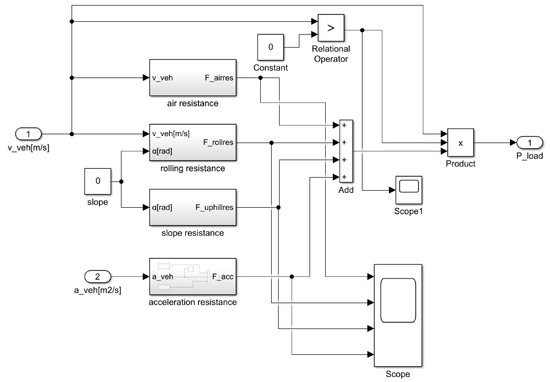
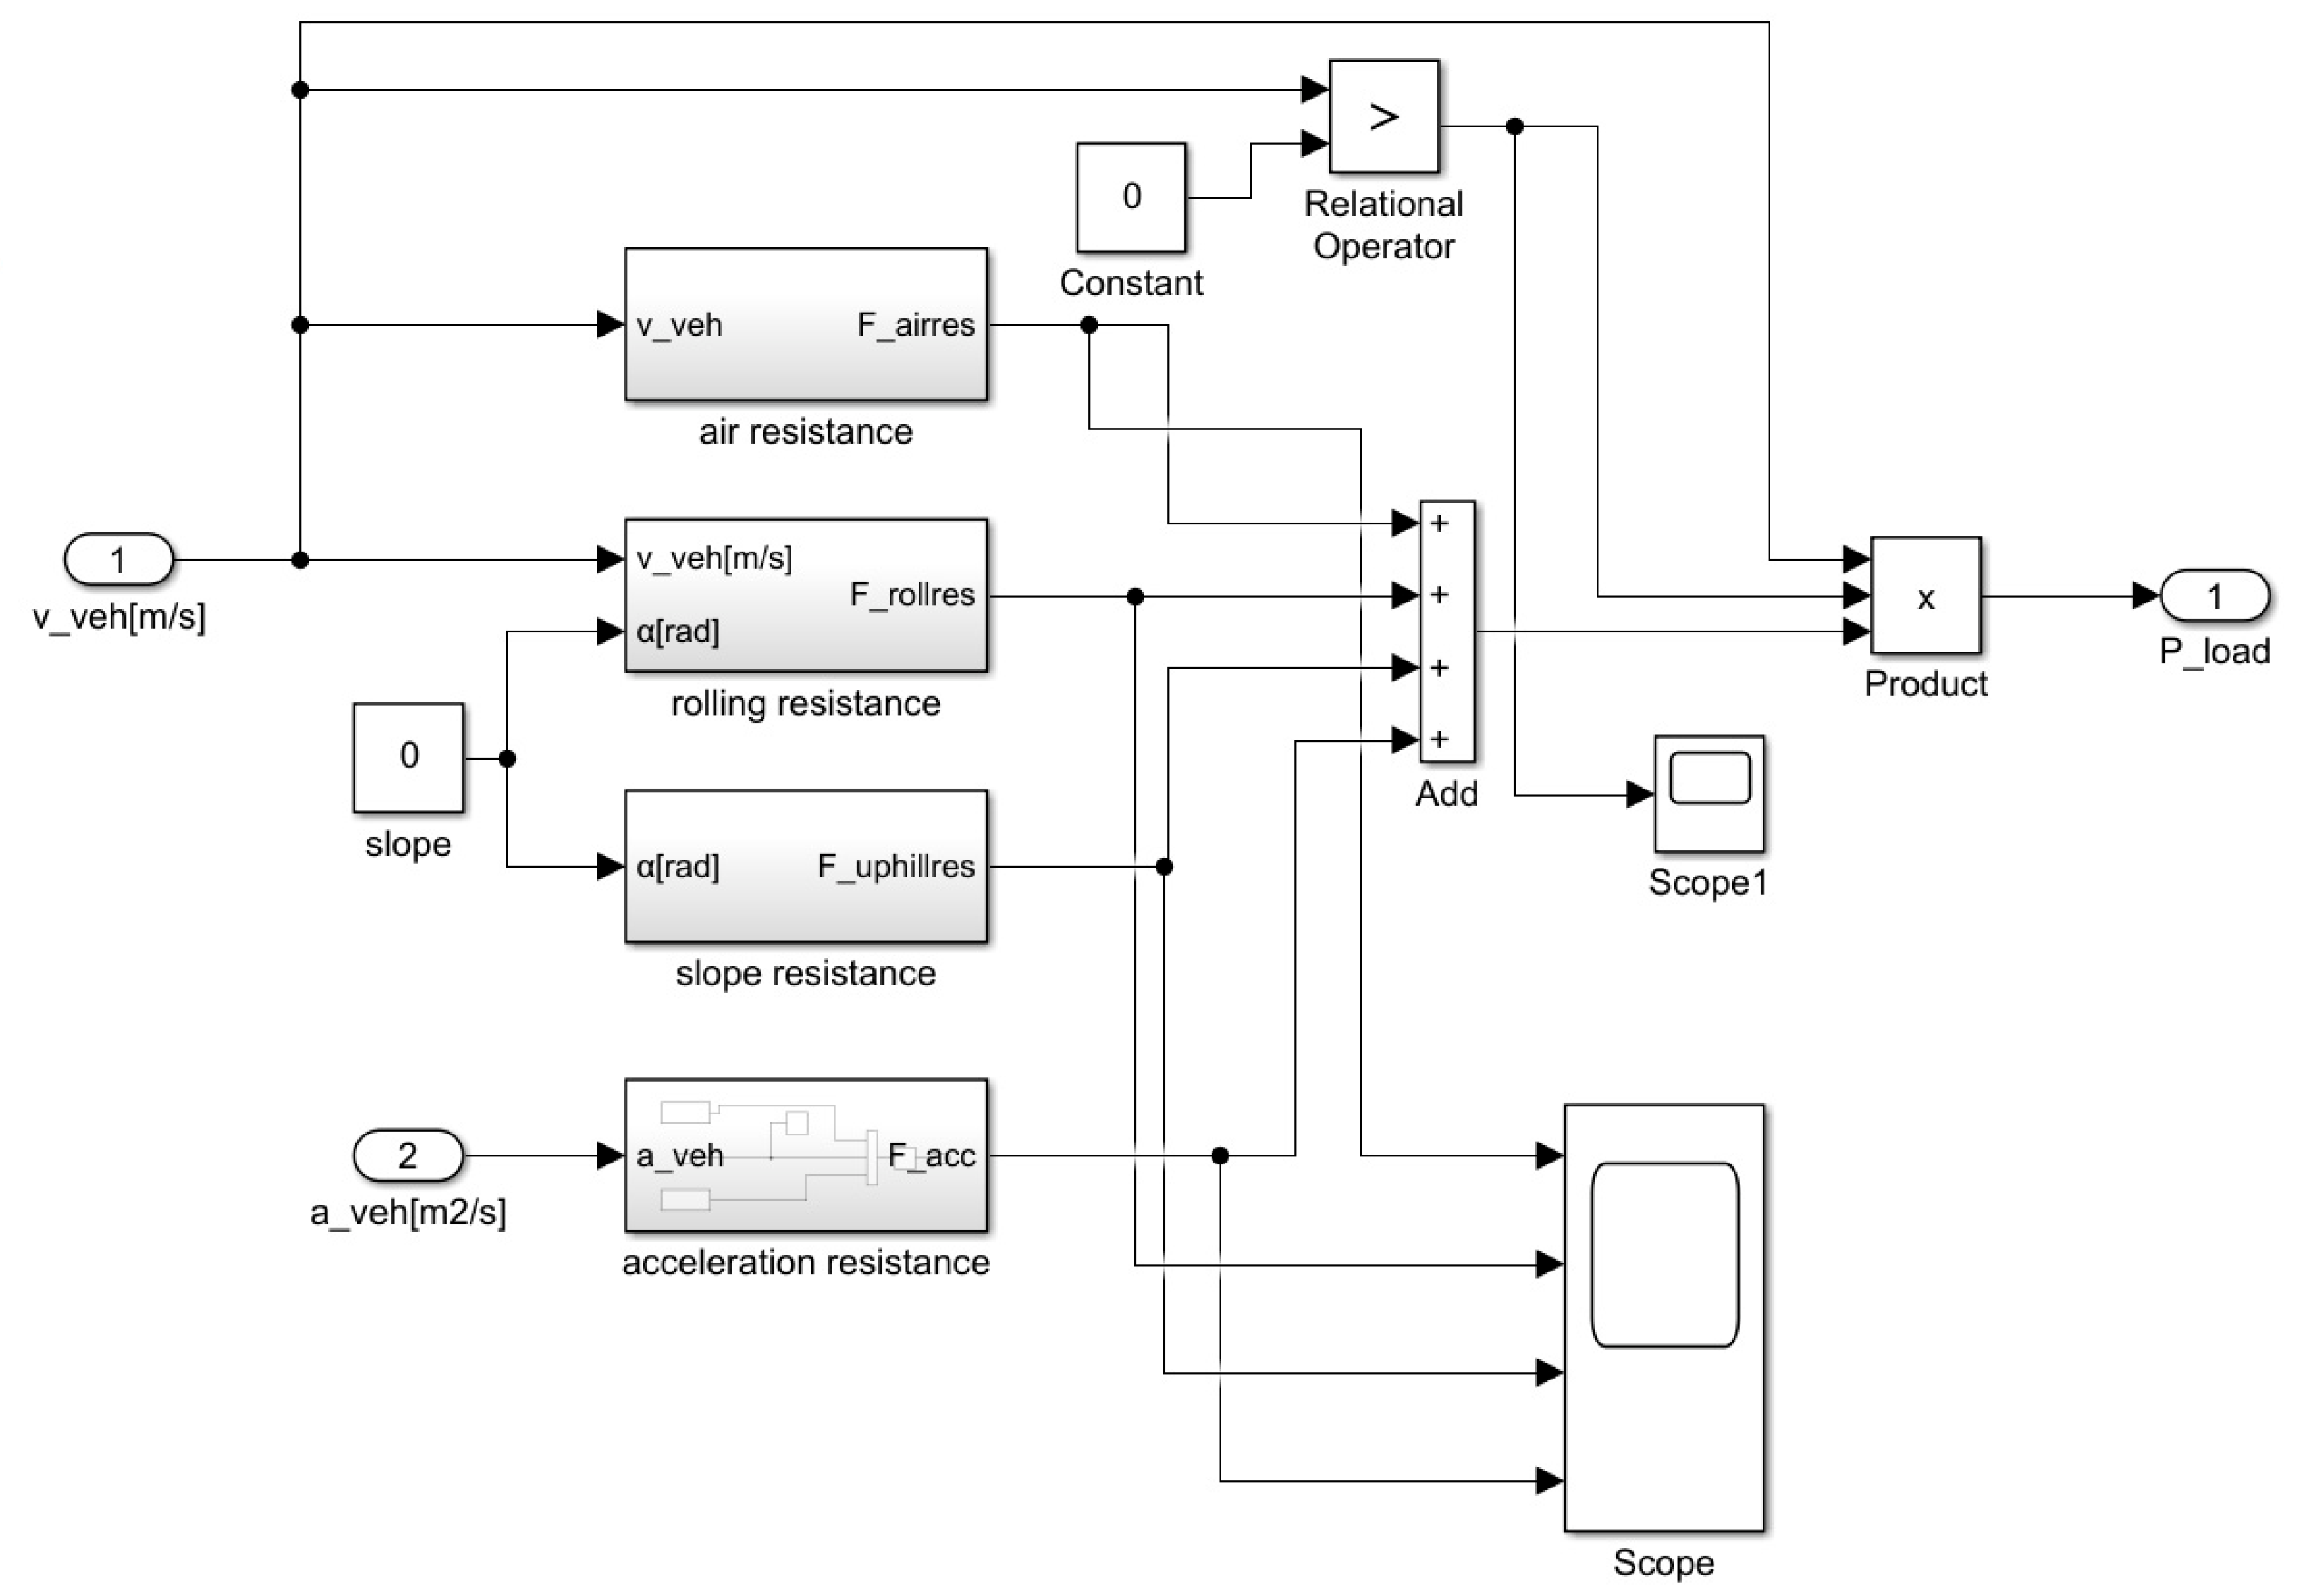
Based on the dynamics analysis introduced above, a vehicle dynamics model is constructed, which is shown in Figure 5. In the figure, the “air resistance” block corresponds to the air resistance model, described by Equation (3), and the “rolling resistance” block corresponds to the rolling resistance model, described by Equation (4). The two other blocks, “slope resistance” block and “acceleration resistance” block, correspond to the slope resistance model and the acceleration resistance model, respectively.
Figure 5.
Vehicle dynamics model.
When heavy-duty trucks operate in mountainous, hilly, or high-altitude regions, road grade significantly affects vehicle power demand, especially for sustained grades greater than 6%. In ref. [43], a 44T PEMFC heavy-duty long-haul truck was used to verify hill-climb driving cycles, and the results showed that the FCS ramps up to a higher power before the coolant exceeds temperature limits. However, considering that the research object of this paper is mainly applied to urban roads in China, where the maximum longitudinal grade of expressways generally does not exceed 3–5%, and long continuous steep grades are rare, we would neglect the influence of road grade. When vehicles travel at a constant speed on a slightly undulating road, the positive and negative fluctuations of grade resistance tend to cancel each other out in a time-averaged sense. Fan et al. [44] demonstrated that, when heavy-duty trucks operate on a typical freight highway in eastern plain areas of China, where the average road grade is close to zero, the influence of grade variations on energy consumption is relatively small and limited within 5% under flat road conditions. Therefore, under such specific scenarios, the model error introduced by neglecting road grade remains within an engineering acceptable range. Nevertheless, the limitations of this simplification must be clearly stated. For applications involving mountainous transport, mining operations, or other scenarios with large sustained grades, the grade must be explicitly incorporated into the model.
In the vehicle dynamics model, when the slope angle is 0, the main inputs are vehicle speed and acceleration. Then, calculate air resistance, rolling resistance, slope resistance, and acceleration resistance accordingly, and with Equation (2), the total power demand of the vehicle is derived as the output.
The vehicle dynamics model can be used to simulate the PEMFCV required power under different vehicle speeds and accelerations, thereby providing the power demand input for the subsequent vehicle energy management strategy.
4. Energy Management Strategy
4.1. Objectives of Energy Management Strategies
There is a strong relationship between FCS output power and efficiency. Generally, FCS operates more efficiently at low output power (low current density) due to small electrochemical losses, which lead to higher output voltage. As output power increases, electrochemical losses also rise, resulting in decreased output voltage and reduced efficiency. Thus, when FCS operates at high loads, the increased output power comes at the cost of lower efficiency.
The lithium battery lifetime is negatively impacted by high SOC and large Depth of Discharge (DOD) [45]. According to [45], high SOC has severe negative effects on lithium battery aging. A total of 80–90% SOC causes the fastest cycle aging, with much faster capacity fade than lower SOC ranges, and 90% SOC during storage drastically accelerates calendar aging. The benefits of maintaining a low DOD include significantly slower battery capacity degradation, reduced cycle aging, and longer service life [45]. Meanwhile, considering that the lithium battery needs to supply energy to the FCS during FCS startup, especially more energy is required for low-temperature startup, the lithium battery SOC should not be discharged excessively during PEMFCV operation to prevent FCS startup failures.
In summary, the following objectives for the energy management strategy are proposed:
(1) To improve FCS durability, the main factors that degrade its lifetime, such as dynamic load variation, should be minimized [5,15,18,41], which has been demonstrated in Section 2.2. Considering the slow dynamic response of FCS, vehicle peak power demands should be satisfied by the lithium battery [28,46].
(2) From the FCS output characteristics, high current density operation corresponds to relatively lower efficiency [46]. To improve FCS efficiency, power distribution between the FCS and the lithium battery should be optimized to prevent the FCS from operating at high current densities over an extended period.
(3) According to the research results in [45], maintaining the SOC below 80% and a low DOD is beneficial to extending the service life of lithium batteries. Meanwhile, considering the FCS startup requirements, the control target for SOC in this study is to maintain it within the range of 40–80%.
4.2. Fuzzy Energy Management Strategy Based on Grey Bernoulli Prediction
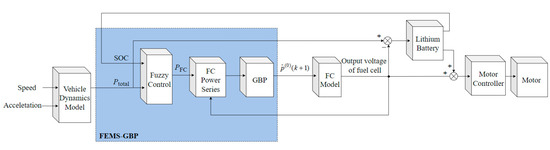
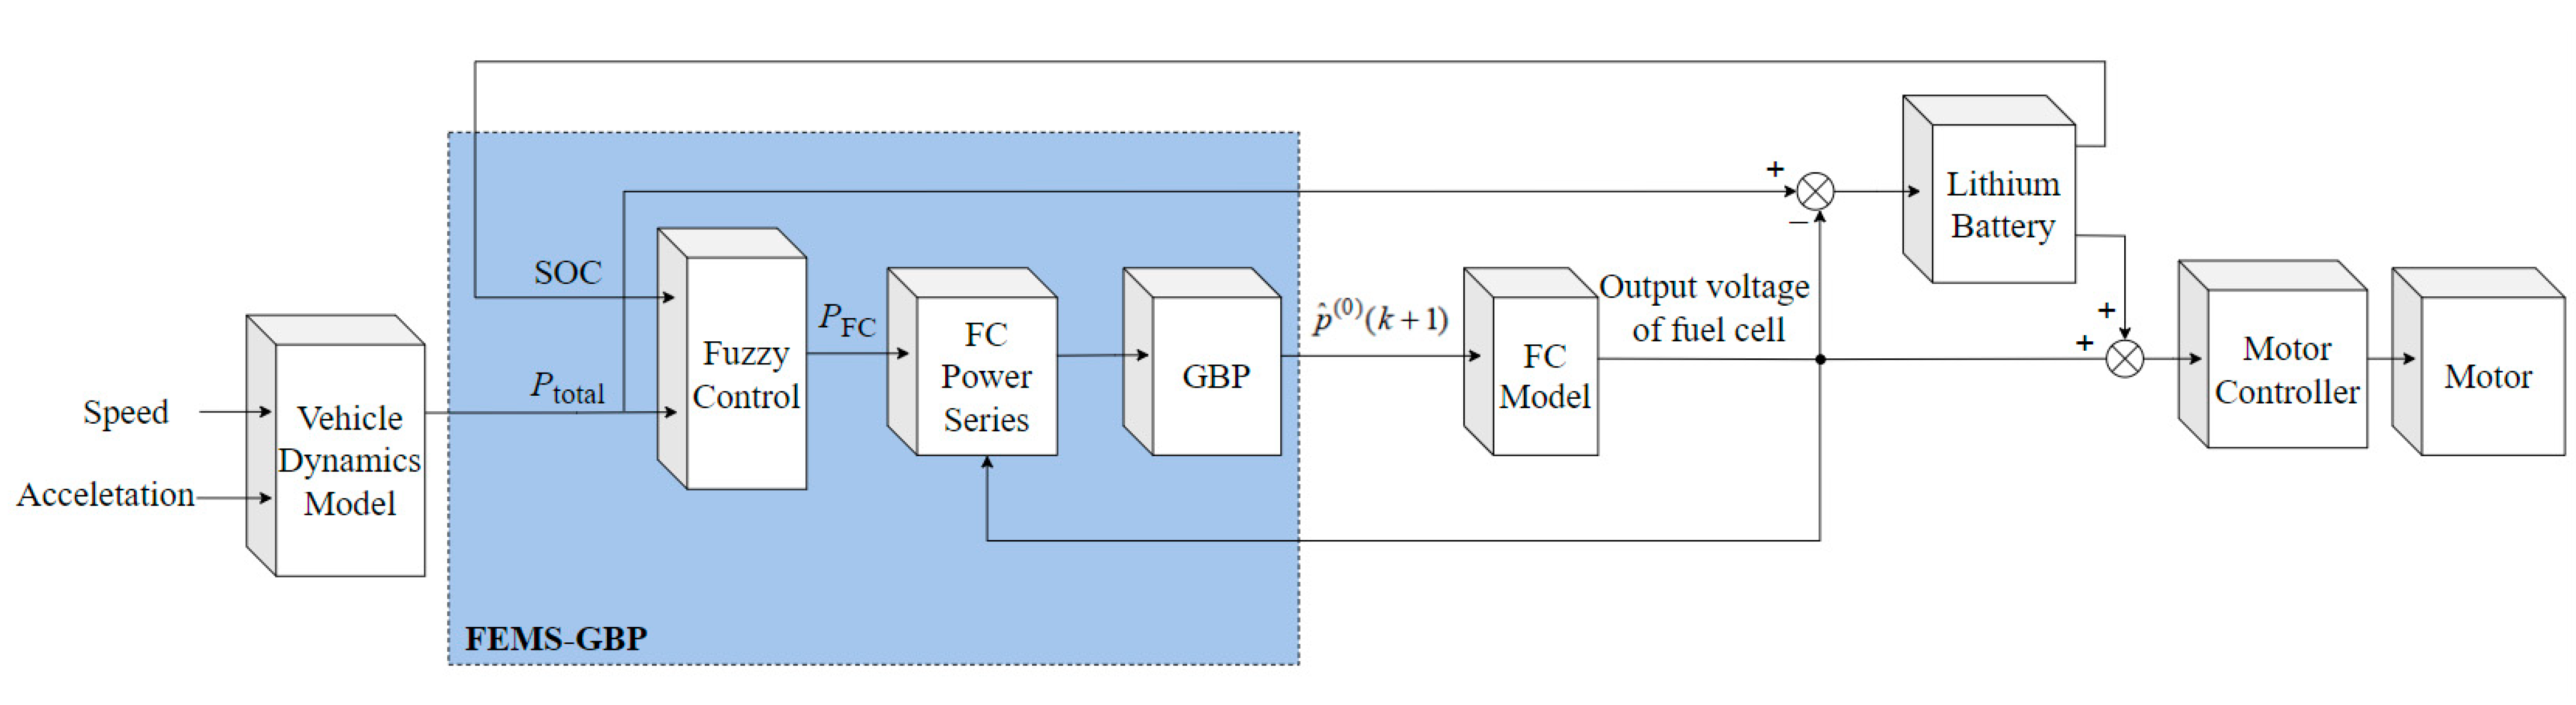
According to the above objectives, a fuzzy energy management strategy based on Grey Bernoulli Prediction is proposed in this paper. FEMS-GBP integrates the Grey Bernoulli Prediction model with fuzzy control, and its structure is shown in the dashed box of Figure 6. Fuzzy control is used to efficiently distribute power between the FCS and the lithium battery, ensuring the FCS operates within a high-efficiency range, thereby improving its fuel economy. The Grey Bernoulli Prediction model predicts FCS power demand for the next cycle, enabling preemptive adjustment of FCS output to avoid large load changes and extend FCS lifetime. The overall structure is shown in Figure 6.
Figure 6.
Overall structure.
The FEMS-GBP module has two inputs, namely the vehicle required power and the lithium battery SOC, and outputs the FCS demand power. The vehicle required power refers to the total power for vehicle driving, which is obtained from the vehicle dynamics model described in detail in Figure 5. The FCS demand power represents the power required to be output by the fuel cell. Since the vehicle power system adopts dual power sources, the power difference between the vehicle required power and the FCS demand power is compensated by the lithium battery. In FEMS-GBP, the output of fuzzy control is fed into the FC power series block shown in Figure 6 to obtain the nonnegative series of FCS demand power , which will be used in the Grey Bernoulli Prediction model to forecast the FCS demand power for the next cycle.
4.2.1. Grey Bernoulli Prediction
Since FCS is an energy output type device, its output power forms a nonnegative time series, which can be directly modeled by the univariate Grey Bernoulli Model. When using the Grey Bernoulli Model to predict the FCS demand power under dynamic driving conditions, the modeling process is as follows [26,47].
Step 1: Assume that the original nonnegative time series of historical FCS demand power with entries is
where is the value of FCS demand power at , .
Step 2: Apply a one-time accumulated generating operation to construct ,
where , .
Step 3: The grey differential equation is defined as
where is the grey derivative, is referred to the background value of the grey derivative, and , are model parameters, is the power exponent. value reflects the variation characteristics of the FCS demand power series and is crucial for the nonlinear performance of the FCS power demand prediction model.
Step 4: Choose the optimal power exponent. Based on the basic principle of information overlap in the grey system, a calculation method for the power exponent is as follows [48]
Step 5: Adopt the least squares method to estimate the model parameters ,
where , .
Step 6: The whitening differential equation has the following form,
and the corresponding particular solution of Equation (11) together with the initial condition is
where represents grey predicted value.
Step 7: Finally, perform the inverse AGO (IAGO) on , and the predicted value of FCS demand power shown in Figure 6 is
and .
4.2.2. Fuzzy Energy Management Strategy
Fuzzy control is a control method based on fuzzy logic. Its core idea is to transform empirical knowledge into fuzzy rules that describe the behavior of the controlled system and then obtain the control output through fuzzy reasoning. It has been widely recognized as an effective method in intelligent control [49] and is commonly used to solve control problems in complex and uncertain systems. As a rule-based method, fuzzy control differs from conventional methods in that it does not require an accurate mathematical model of the system. Compared with conventional approaches, fuzzy control often exhibits superior performance in complex nonlinear systems [50]. By imitating human decision-making, fuzzy control overcomes the limitations of traditional methods in handling nonlinearities and uncertainties via fuzzy set theory.
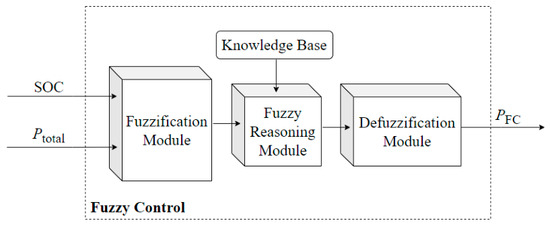
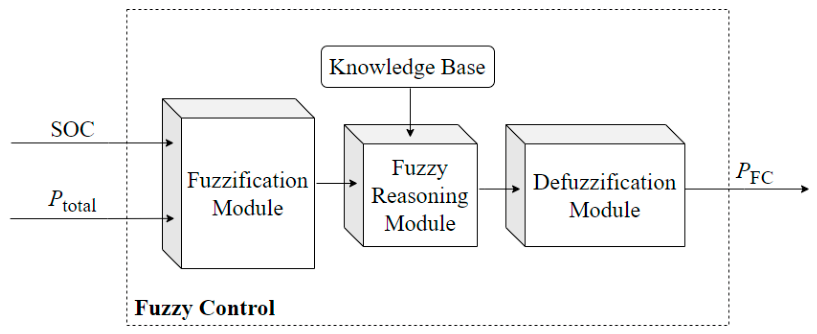
In this study, the fuzzy control model has two inputs (lithium battery SOC and the vehicle required power ) and one output (FCS demand power ), which is also illustrated in Figure 6. The main components of fuzzy control, shown in Figure 7, include a fuzzification module (converts input data into fuzzy values), a knowledge base (stores fuzzy rules), a fuzzy reasoning module (performs reasoning based on the rules), and a defuzzification module (converts inference results into explicit control outputs).
Figure 7.
Workflow of fuzzy control.
- Fuzzification Module
Fuzzification is the process of converting input data into membership functions of fuzzy variables. Using fuzzy sets, actual values are mapped to different membership functions. Each variable obtains a corresponding membership degree, which can better accommodate information with fuzzy boundaries and uncertainties in actual scenes.
In the Fuzzification Module illustrated in Figure 7, the vehicle required power , lithium battery SOC, and FCS demand power are divided into six fuzzy subsets separately, as shown in Table 1.
Table 1.
Fuzzy subset language values of input and output variables.
- Knowledge base
The knowledge base stores fuzzy rules, which consist of conditional statements and conclusion statements. Each rule matches the membership function according to the input data in the conditional statement and then calculates the membership function corresponding to the conclusion statement.
In this study, when creating fuzzy rules for the fuzzy reasoning module, the following requirements need to be met.
(1) The power output from both FCS and lithium battery needs to ensure the energy supply of the vehicle.
(2) The lithium battery SOC needs to be controlled within the specified range, with a target set according to the energy management strategy in this paper, maintaining the SOC between 40% and 80%.
(3) To reduce power fluctuations, the FCS load should be minimized to maintain stable power output.
- Fuzzy reasoning module
The fuzzy reasoning module infers the output states, namely fuzzy control variables, based on the fuzzy control rule base and the current input states. According to the fuzzy subset table and the predefined objects for rule formulation, the fuzzy rule table for the PEMFCV powertrain is established in this study, as presented in Table 2.
Table 2.
Fuzzy rule table for PEMFCV powertrain.
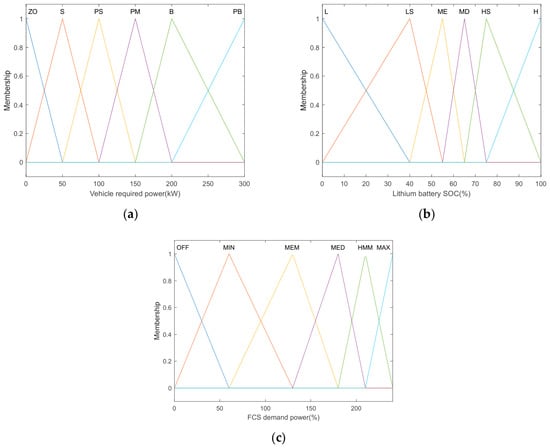
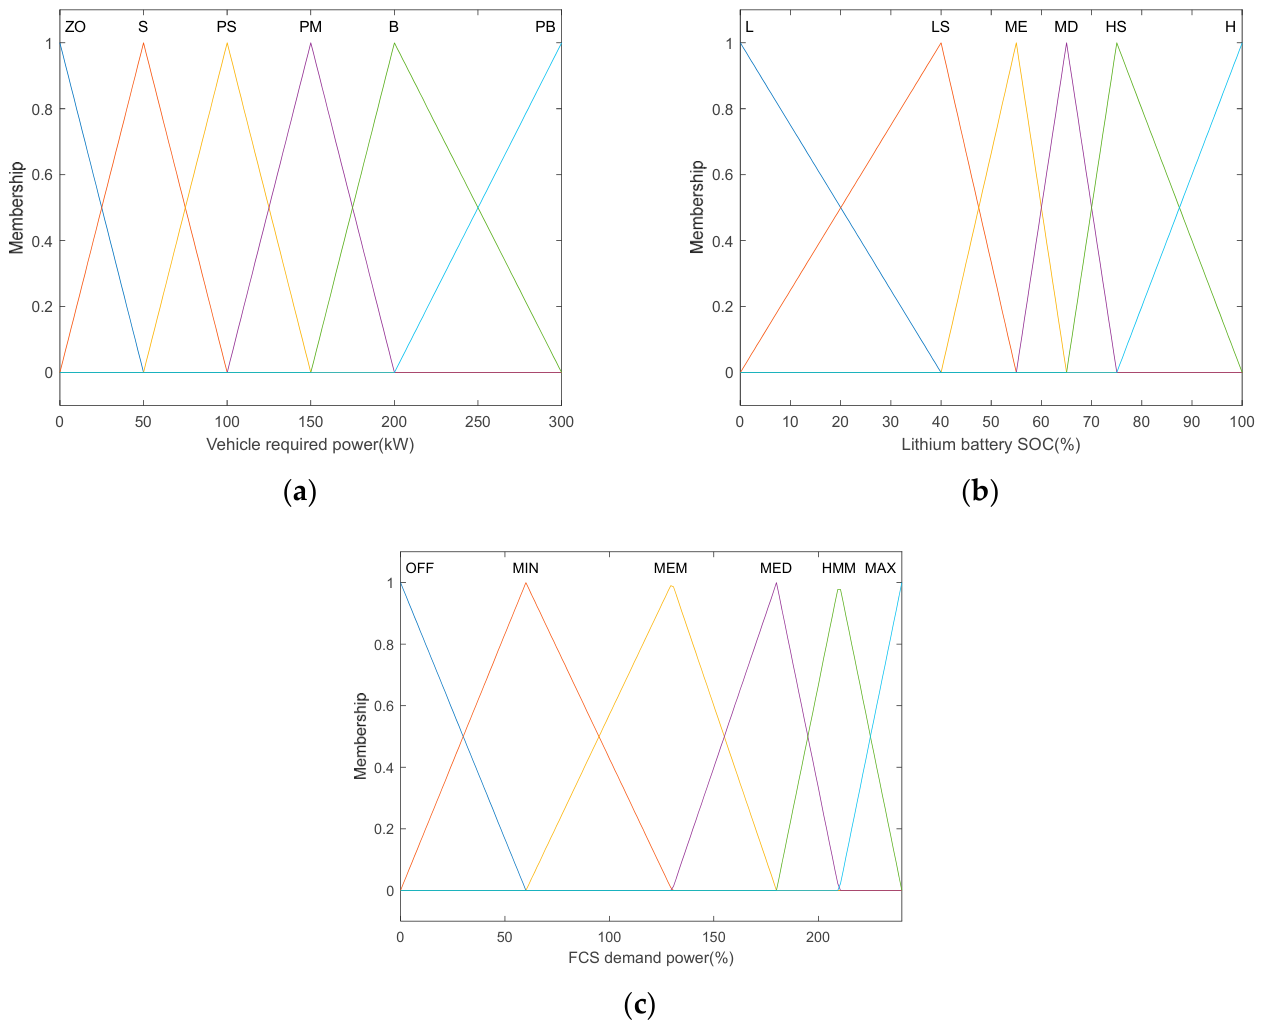
In the formulation of the membership functions for fuzzy energy management strategy, high vehicle demand is rarely observed under most operating conditions. Therefore, the division of the domain in the small to medium power demand range needs to be more refined to ensure FCS can respond promptly to vehicle power needs. For the lithium battery SOC membership function, it is crucial to avoid both high and low SOC extremes. Therefore, the domain division between 40% and 80% SOC needs to be finer, ensuring the SOC remains within an optimal range. For the FCS power membership function, sufficient power must be output when vehicle demand is high, while minimizing idle and start-stop cycles. Therefore, the low-power range of FCS should have a more dispersed domain division. The membership function domain division is shown in Figure 8.
Figure 8.
Division of the membership function domain: (a) Membership function division of vehicle required power; (b) Membership function division of lithium battery SOC; (c) Membership function division of FCS demand power.
5. Numerical Simulations and Experiments
5.1. Experiment Introduction
This study focuses on a 49-ton (49 T) fuel cell truck, with parameters listed in Table 3. Two driving cycles are selected for evaluation. Different initial SOC values for the lithium battery (30%, 70%, and 90%) are set to assess the energy management strategy, considering FCS power output, SOC change, hydrogen consumption, and large load changes. In this paper, a large load change is defined as a power variation exceeding 30 kW·s−1 [51].
Table 3.
Vehicle parameters.
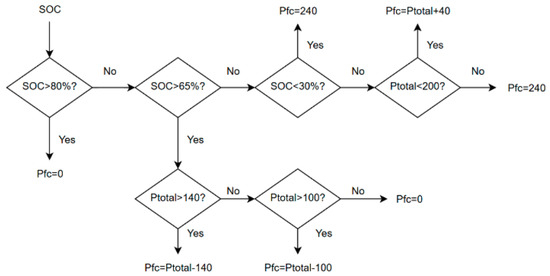
To evaluate the performance of FEMS-GBP, two conventional energy management strategies are compared: the switching control strategy and the power following strategy. The switching control strategy has been widely used in commercial vehicles [46] and is also used in the truck described in Table 3. The power following strategy aims to maintain the target SOC of the lithium battery and avoid extremely low or high SOC conditions for the battery. By comparing these three energy management strategies, performance differences in power distribution can be highlighted, enabling a comprehensive evaluation of the advantages and disadvantages of each strategy in terms of FCS economy and durability. MATLAB R2021b software is employed in this study and implemented on a PC equipped with an Intel(R) Core(TM) i5-12490F (3.00 GHz) processor and 16 GB of RAM. During the simulation, the average computation time is 11.3 milliseconds per second of simulated time.
Table 4 shows the output power levels of FCS in the switching control strategy. The FCS output power is allocated based on the SOC of the lithium battery.
Table 4.
Switching control strategy hierarchy table.
Figure 9 shows the output power of FCS in the power following strategy. The power from both FCS and the lithium battery is allocated based on the vehicle required power and the lithium battery SOC.
Figure 9.
The control flow of the power following strategy.
5.2. CHTC-TT Driving Cycle and Result Analysis
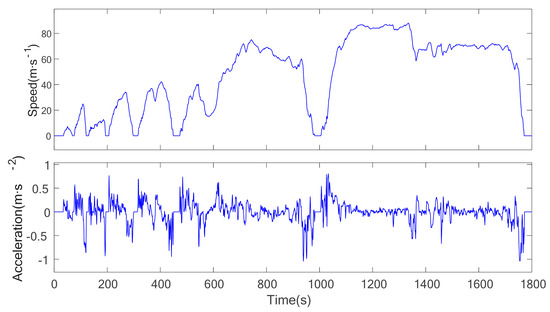
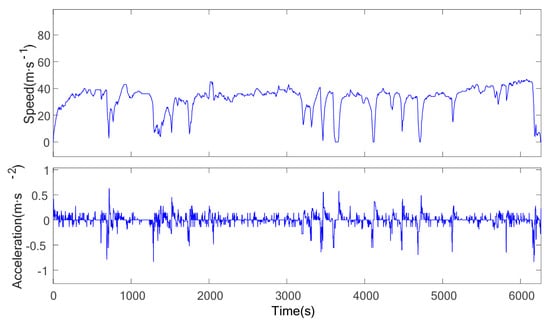
The CHTC-TT driving cycle is a standard cycle for energy consumption in heavy-duty trucks. It consists of two speed intervals, low speed and high speed, with a total duration of 1800 s. The total distance covered is 23.22 km, with 1.92 km in the low-speed segment and 21.30 km in the high-speed segment. This cycle evaluates the fuel consumption of heavy-duty semi-trucks under varying speed conditions, offering a more accurate representation of the actual operating conditions for heavy commercial vehicles in China. The velocity and acceleration curves for this cycle are shown in Figure 10.
Figure 10.
CHTC-TT driving cycle.
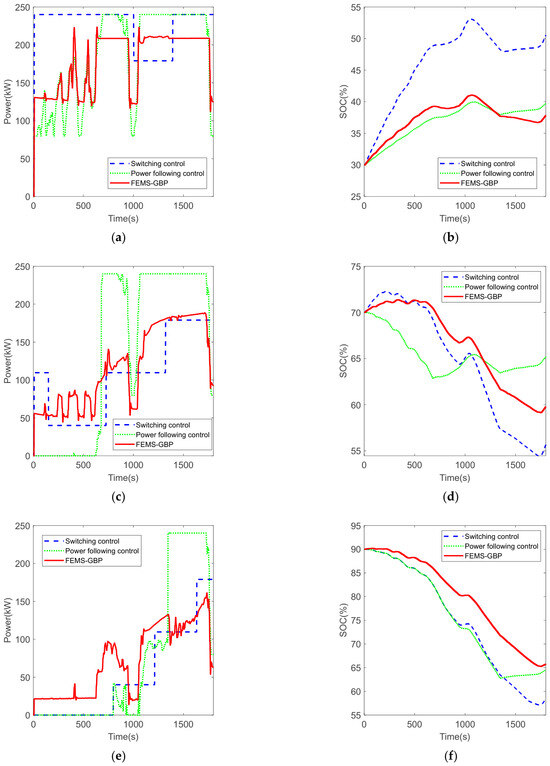
Figure 11 and Table 5 show the control performances of the three energy management strategies under the CHTC-TT cycle at initial SOC conditions of 30%, 70%, and 90%. In Table 5, “FCS hydrogen consumption” refers to the amount of hydrogen directly consumed by the FCS. “Equivalent hydrogen consumption of lithium battery” denotes the hydrogen consumption corresponding to the change in lithium battery capacity. A negative value indicates that the lithium battery is being charged during vehicle operation, while a positive value means the lithium battery is discharging. “Total hydrogen consumption” refers to the total hydrogen consumed by the vehicle, accounting for changes in the lithium battery’s state of charge.
Figure 11.
The control performances of the three energy management strategies under the CHTC-TT cycle: (a) FCS output power under CHTC-TT cycle at 30% initial SOC; (b) Lithium battery SOC change under CHTC-TT cycle at 30% initial SOC; (c) FCS output power under CHTC-TT cycle at 70% initial SOC; (d) Lithium battery SOC change under CHTC-TT cycle at 70% initial SOC; (e) FCS output power under CHTC-TT cycle at 90% initial SOC; (f) Lithium battery SOC change under CHTC-TT cycle at 90% initial SOC.
Table 5.
Performance comparison under CHTC-TT cycle.
By comparing Figure 11a,c,e with the speed curve in Figure 10, it can be seen that both FEMS-GBP and power following control can track the variation in the vehicle required power. In addition, the power regulation of FEMS-GBP is much more stable, without large power adjustments as observed in power following control. In contrast, the regulation of switching control is mainly based on the SOC of the lithium battery, and does not respond to variation in the vehicle required power, which can be clearly observed from the curves. Therefore, due to such control logic, vehicles adopting the switching control strategy may experience insufficient power output under certain high-power demand conditions. Table 5 shows that switching control results in the largest number of large load changes, while FEMS-GBP yields the smallest. Among the three strategies, FEMS-GBP is therefore the most favorable to FCS durability. This indicates that by introducing the Grey Bernoulli Prediction module, FEMS-GBP can effectively reduce large dynamic load changes.
As mentioned in Section 4.1, the target control range for SOC is 40–80%. Figure 11d,f illustrate that at 70% and 90% initial SOC, all three strategies can maintain the SOC within 40–80% during PEMFCV operation. However, at 30% initial SOC, only the switching control regulates the SOC back to the 40–80% range as shown in Figure 11b, since its control target is mainly the lithium battery SOC. In contrast, the control processes of the other two algorithms take into account both the lithium battery SOC and the vehicle required power. Although they fail to regulate the SOC to the 40–80% range, they still ensure an increasing trend in the lithium battery SOC.
The data of total hydrogen consumption in Table 5 shows that at 30% initial SOC, FEMS-GBP exhibits the lowest hydrogen consumption at only 4905.6 g, whereas the switching control strategy yields the highest, reaching 5765.8 g. Taking the hydrogen consumption of FEMS-GBP as the baseline, switching control consumes approximately 17.54% more hydrogen under this condition. At 70% and 90% initial SOC, power following control shows the highest hydrogen consumption, switching control the lowest, and FEMS-GBP remains intermediate in both conditions. These results are also presented in Table 5. Taking the hydrogen consumption of switching control as the baseline, FEMS-GBP consumes approximately 4.38% more hydrogen at 70% initial SOC and 6.38% more at 90% initial SOC. The reason why switching control achieves the lowest hydrogen consumption under high lithium battery SOC conditions is considered to be that the EMS employing this strategy regulates power distribution solely on the basis of lithium battery SOC, allowing the FCS to operate in the low power range for a longer duration, where the FCS exhibits relatively high efficiency.
In summary, FEMS-GBP exhibits the best overall performance in terms of balancing FCS durability and economy. It achieves the lowest hydrogen consumption at low initial SOC, and the increase in hydrogen consumption can be controlled within 7% at medium and high initial SOC levels, while achieving the most favorable durability with the smallest large dynamic load variations under all initial SOC conditions.
5.3. Actual Vehicle Driving Cycle and Result Analysis
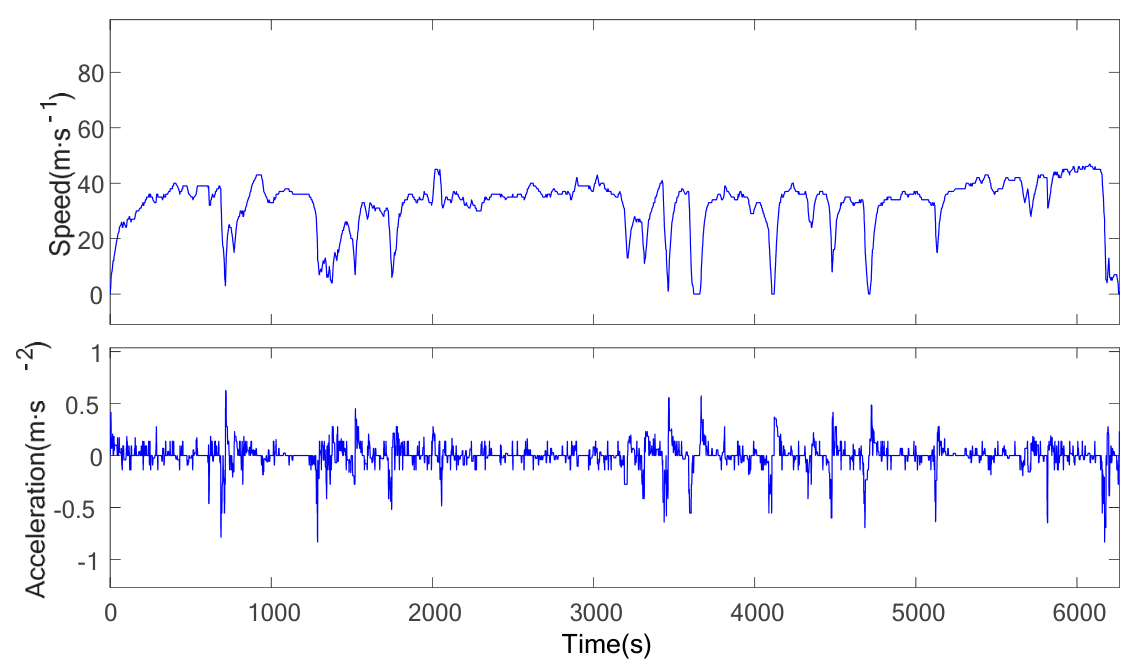
An actual vehicle driving cycle was collected from a fuel cell logistics vehicle during transportation in a steel factory in Tangshan, as shown in Figure 12. This cycle represents an urban transportation route, with a total duration of 6263 s and an average road grade close to zero. The vehicle model described in Figure 5 is therefore applicable to this driving cycle. The vehicle load is the standard 49 tonnes, and the overall vehicle speed during transportation is relatively low, with a maximum speed of 47 km·h−1.
Figure 12.
Actual vehicle driving cycle.
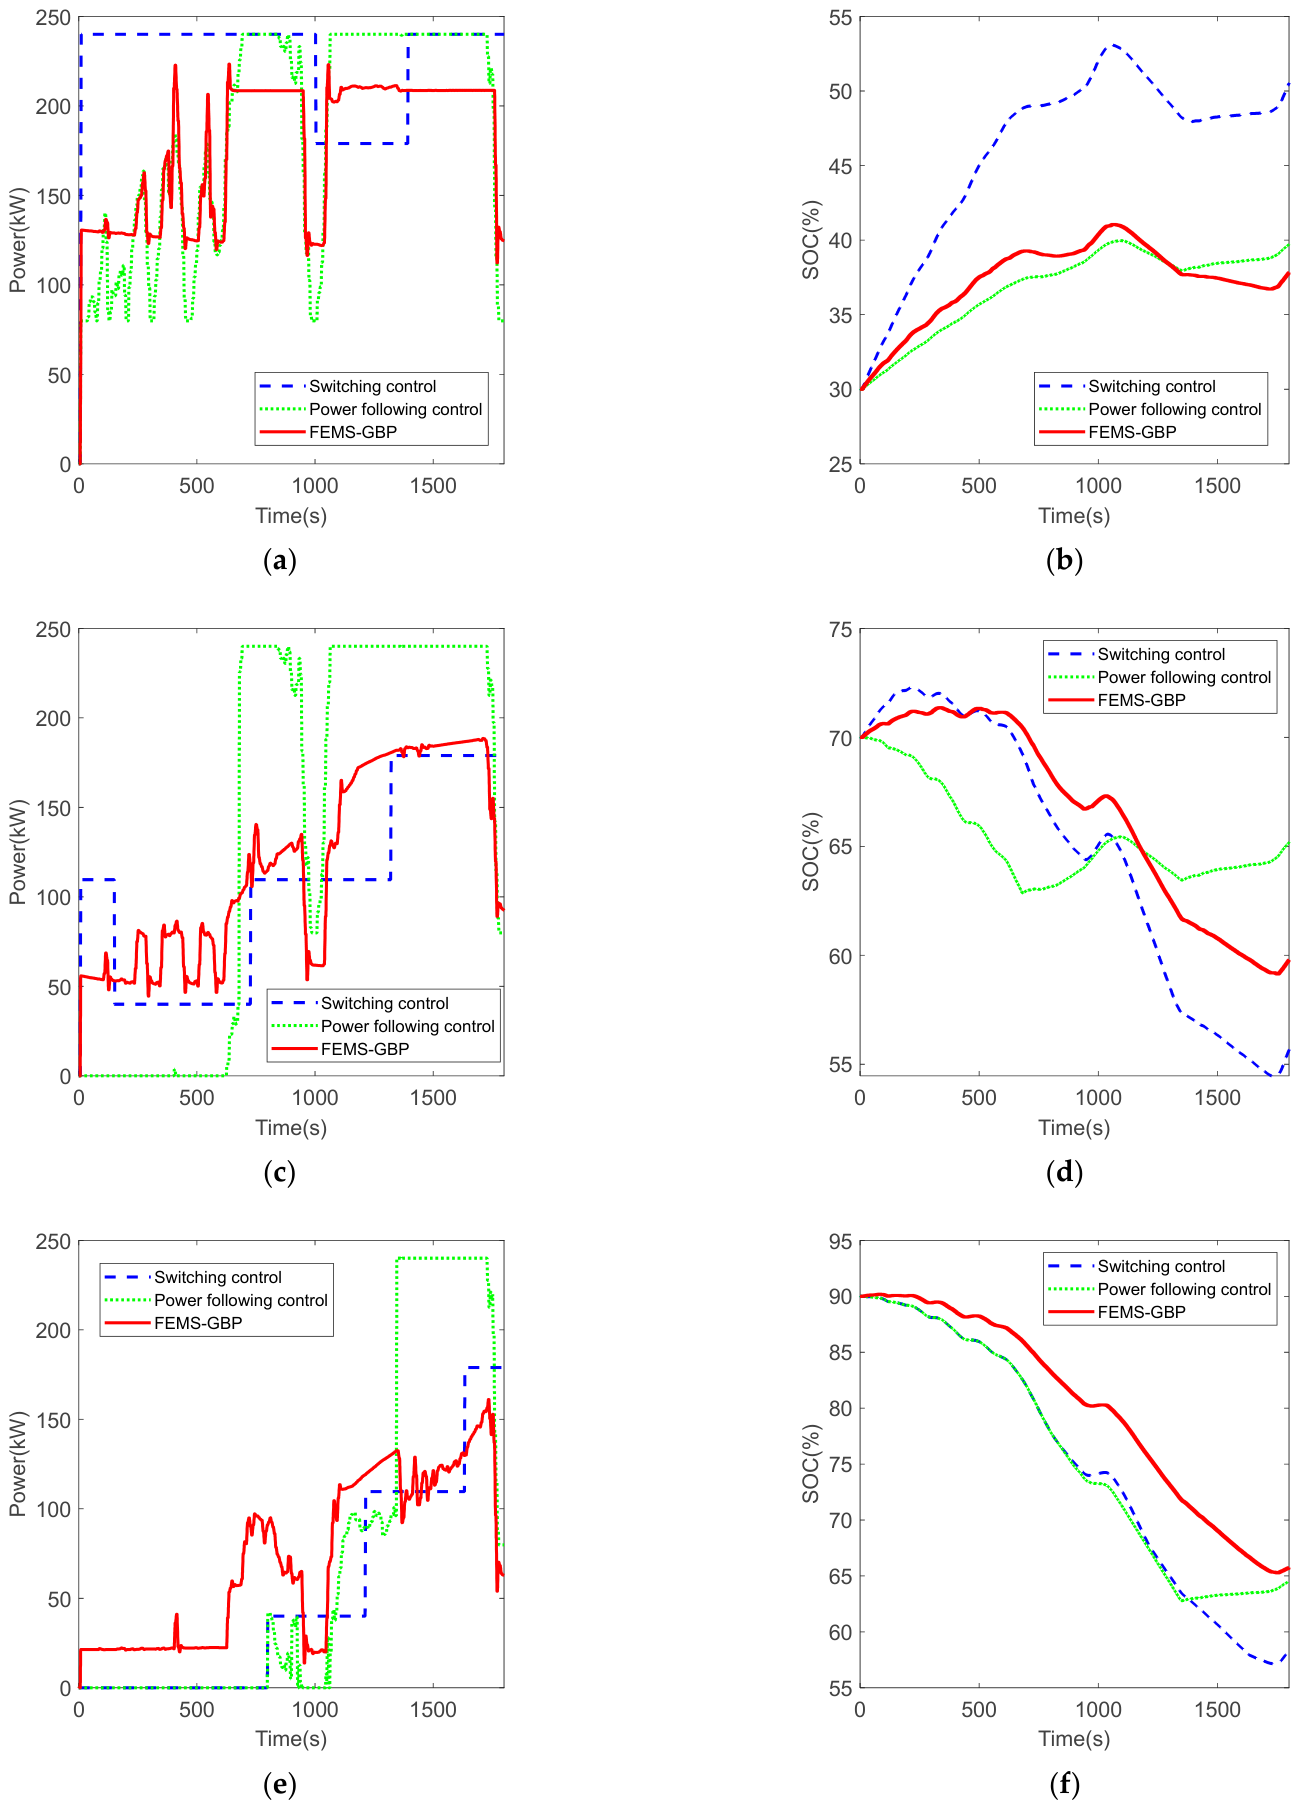
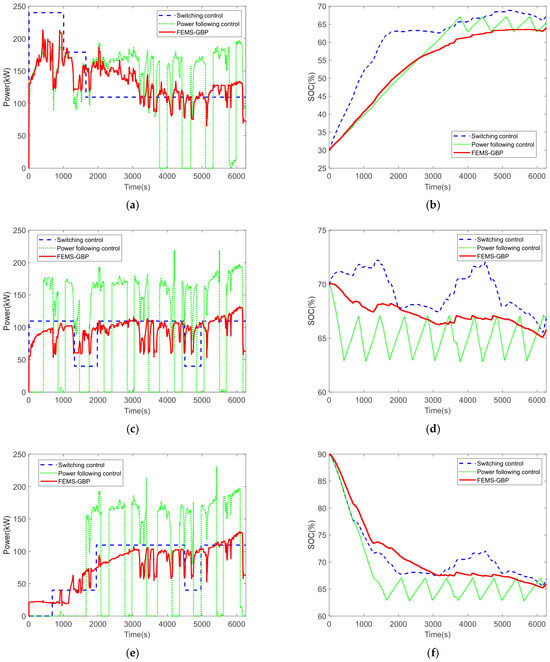
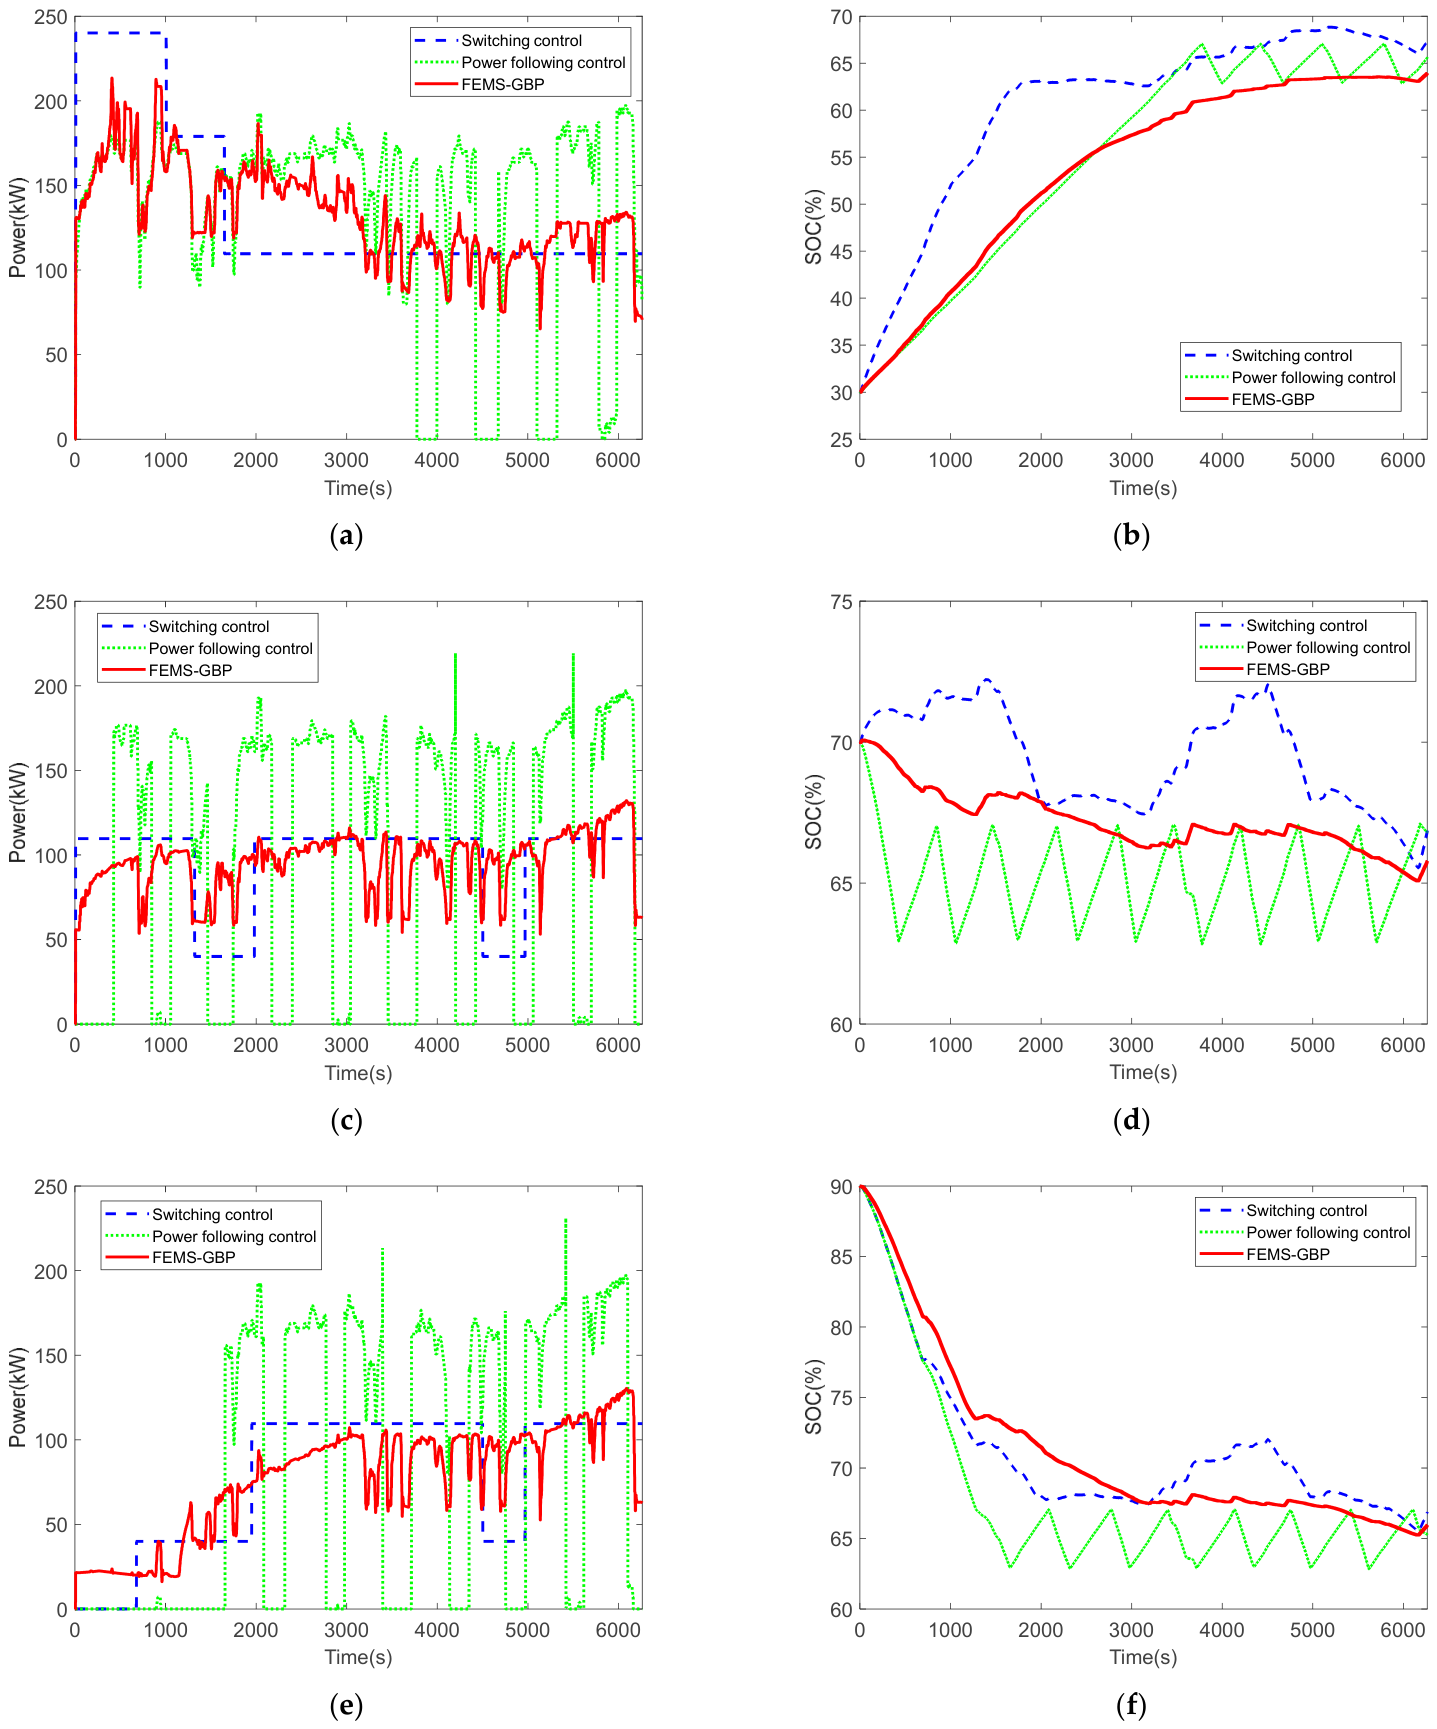
Figure 13 and Table 6 show the control performances of the three energy management strategies under the actual vehicle driving cycle at different initial SOC (30%, 70% and 90%), respectively.
Figure 13.
The control performances of the three energy management strategies under actual vehicle driving cycle: (a) FCS output power under actual vehicle driving cycle at 30% initial SOC; (b) Lithium battery SOC change under actual vehicle driving cycle at 30% initial SOC; (c) FCS output power under actual vehicle driving cycle at 70% initial SOC; (d) Lithium battery SOC change under actual vehicle driving cycle at 70% initial SOC; (e) FCS output power under actual vehicle driving cycle at 90% initial SOC; (f) Lithium battery SOC change under actual vehicle driving cycle at 90% initial SOC.
Table 6.
Performance comparison under the actual driving cycle.
Figure 13a,c,e illustrate that under this actual vehicle driving cycle, power following control exhibits significant fluctuations in FCS output power across all three different initial SOC conditions. As shown in Table 6, the number of large load changes associated with power following control is also considerably higher than that of the other two control strategies. FEMS-GBP regulates the FCS output power relatively softly. While being able to follow the vehicle power demand, only one large load change occurs at 30% initial SOC. For the SOC-based switching control, the number of FCS output power adjustments is relatively small, and FCS tends to operate at a fixed power level for an extended period. However, some large load changes still occur when power adjustments are performed.
Figure 13b,d,f show that under the actual vehicle driving cycle, regardless of whether the initial SOC of the lithium battery is high or low, all three strategies can satisfactorily meet the control requirements for the lithium battery SOC by maintaining it within the range of 40–80% during vehicle operation, as stated in Section 4.1.
According to the total hydrogen consumption data in Table 6, under the actual vehicle driving cycle, FEMS-GBP achieves the lowest hydrogen consumption and the best economic performance at all three different initial SOC levels. The total hydrogen consumption values of FEMS-GBP are 11,148.5 g, 9538.1 g and 8742.5 g at 30%, 70%, 90% initial SOC, respectively. At 30% initial SOC, the hydrogen consumption of switching control is the highest, which is 11,395.8 g, because FCS needs to operate at a relatively high output power to ensure the lithium battery can be charged rapidly during vehicle operation, as shown in Figure 13b. At 70% and 90% initial SOC, power following control results in the highest hydrogen consumption in both cases, which are 9787.2 g and 9007.5 g respectively.
In summary, under the actual vehicle driving cycle, FEMS-GBP achieves the best performance in terms of both durability and economy.
6. Conclusions
In this study, a fuzzy energy management strategy based on Grey Bernoulli Prediction is proposed to improve FCS durability and fuel economy. A PEMFCV model is built in this paper, and the primary factors contributing to FCS performance degradation are analyzed. Verification is carried out with a small stack under dynamic load variation conditions, and the results demonstrate that high transient power demands can accelerate the performance degradation of the fuel cell.
A 49 T fuel cell heavy-duty truck is employed as the research object under the CHTC-TT driving cycle and an actual driving cycle in Tangshan. By comparing with the switching control strategy and the power following control strategy, FEMS-GBP exhibits better comprehensive performance in terms of large load changes and hydrogen consumption. Particularly under the actual driving cycle, FEMS-GBP achieves the best overall performance in both economy and durability. Therefore, FEMS-GBP is demonstrated to be effective and can be used in PEMFCVs, especially in fuel cell heavy-duty trucks, for practical driving operations.
However, there still remain aspects in this paper that require further investigation. For instance, during the vehicle modeling process, this study mainly considers scenarios where the average road grade is close to zero. It is necessary to further analyze the influences of different road grades on vehicle operating power, as well as the impacts of other factors such as ambient conditions and stack aging state. Meanwhile, since health-aware energy management strategies are developing rapidly, and for broader applicability, FEMS-GBP should be compared with other EMS approaches across a wider range of scenarios.
Author Contributions
Conceptualization, J.L.; methodology, Y.L.; software, Y.L.; validation, Y.L. and J.L.; formal analysis, H.Z.; investigation, Y.L. and J.L.; resources, H.Z.; writing—original draft preparation, Y.L. and J.L.; writing—review and editing, J.L.; supervision, H.Z.; funding acquisition, H.Z. All authors have read and agreed to the published version of the manuscript.
Funding
This research was funded by Zhejiang Provincial Science and Technology Plan Project under Grant No. 2026C02A1075, Zhejiang Provincial Natural Science Foundation of China under grant number LY22E050018, and the Key Technology R&D Program of Jinhua under Grant No. 2023-1-002a, and Grant No. 2024-1-006.
Institutional Review Board Statement
Not applicable.
Informed Consent Statement
Not applicable.
Data Availability Statement
The original contributions presented in this study are included in the article. Further inquiries can be directed to the corresponding author.
Conflicts of Interest
Authors Jianshan Lu and Hongbo Zhou were employed by both Jinhua HydroT Technology Company Ltd. and Zhejiang HydroT Technology Company Ltd. The remaining authors declare that the research was conducted in the absence of any commercial or financial relationships that could be construed as a potential conflict of interest.
References
- Bilay, C.; Mandal, A.; Palaniswamy, K.; Devaraj, E.; Ravi, D.; Geca, M.; Rajagopal, T. A review on the role of membrane electrode assembly in the steady-state, transient performance, and durability of proton exchange membrane fuel cells. Ain Shams Eng. J. 2025, 16, 103739. [Google Scholar] [CrossRef] [Scilit]
- Qasem, N.; Abdulrahman, G. A Recent Comprehensive Review of Fuel Cells: History, Types, and Applications. Int. J. Energy Res. 2024, 7271748. [Google Scholar] [CrossRef] [Scilit]
- Hu, Z.; Li, J.; Xu, L.; Song, Z.; Fang, C.; Ouyang, M.; Dou, G.; Kou, G. Multi-objective energy management optimization and parameter sizing for proton exchange membrane hybrid fuel cell vehicles. Energy Convers. Manag. 2016, 129, 108–121. [Google Scholar] [CrossRef] [Scilit]
- Jiao, K.; Xuan, J.; Du, Q.; Bao, Z.; Xie, B.; Wang, B.; Zhao, Y.; Fan, L.; Wang, H.; Hou, Z.; et al. Designing the next generation of proton-exchange membrane fuel cells. Nature 2021, 595, 361–369. [Google Scholar] [CrossRef] [Scilit]
- Yang, L. Research on Energy Management Strategy of Fuel Cell Vehicle Considering Battery Life Degradation. Master’s Thesis, Jilin University, Changchun, China, 2022. [Google Scholar]
- Hou, Z.; Wang, R.; Wang, K.; Shi, W.; Xing, D.; Jiang, H. Failure mode investigation of fuel cell for vehicle application. Front. Energy 2017, 11, 318–325. [Google Scholar] [CrossRef] [Scilit]
- Zhao, Y.; Xie, J.; Shi, J.; Li, H. Energy management strategy of FCHV considering fuel cell durability. Mod. Manuf. Eng. 2020, 4, 70–76. [Google Scholar]
- Cong, M.; Wang, K.; Yao, N.; Ma, T. Study on the degradation of proton exchange membrane fuel cell under load cycling conditions. Int. J. Hydrogen Energy 2022, 47, 38736–38746. [Google Scholar] [CrossRef] [Scilit]
- Xie, R.; Li, C.; Ma, R.; Xu, L.; Zhou, X. An Explainable Data-Driven Framework for Fuel Cell Aging Prediction Under Dynamic Condition. IEEE Trans. Ind. Electron. 2023, 70, 5960–5970. [Google Scholar] [CrossRef] [Scilit]
- Hua, Z.; Zheng, Z.; Pahon, E.; Pera, M.; Gao, F. Multi-Timescale Lifespan Prediction for PEMFC Systems Under Dynamic Operating Conditions. IEEE Trans. Transp. Electrif. 2022, 8, 345–355. [Google Scholar] [CrossRef] [Scilit]
- Min, D.; Song, Z.; Chen, H.; Wang, T.; Zhang, T. Genetic algorithm optimized neural network based fuel cell hybrid electric vehicle energy management strategy under start-stop condition. Appl. Energy 2022, 306, 118036. [Google Scholar] [CrossRef] [Scilit]
- Lv, Q.; Teng, T.; Zhang, B.; Zhang, X.; Xue, Q. Optimal control strategy for economy and durability of extended range fuel cell vehicle. J. Harbin Inst. Technol. 2021, 53, 126–133. [Google Scholar]
- Wang, Z.; Xie, Y.; Zang, P.; Wang, Y. Energy management strategy of fuel cell bus based on Pontryagin’s minimum principle. J. Jilin Univ. (Eng. Technol. Ed.) 2020, 50, 36–43. [Google Scholar]
- Ferrara, A.; Hametner, C.; Jakubek, S. Health-conscious predictive energy management strategy for fuel cell electric trucks. Energy Rep. 2024, 12, 5961–5973. [Google Scholar] [CrossRef] [Scilit]
- Du, C.; Gong, K.; Zhang, H.; Zhang, P.; Wu, D.; Liu, X.; Fu, Y. Degradation-considering adaptive equivalent consumption minimization strategy for fuel cell electric vehicles. Proc. Inst. Mech. Eng. Part D J. Automob. Eng. 2025, 239, 6360–6375. [Google Scholar] [CrossRef] [Scilit]
- He, Q.; Liu, C.; Zhao, X. Adaptive online energy management considering lifespan decay synergy for fuel cell-battery system. Int. J. Hydrogen Energy 2025, 165, 150931. [Google Scholar] [CrossRef] [Scilit]
- Kang, X.; Wang, Y.; Chen, Z. A reinforcement learning energy management strategy for fuel cell hybrid electric vehicles considering driving condition classification. Sustain. Energy Grids Netw. 2024, 38, 101298. [Google Scholar] [CrossRef] [Scilit]
- Huo, W.; Liu, T.; Bing, L. A reinforcement learning-based energy management strategy for fuel cell electric vehicle considering coupled-energy sources degradations. Sustain. Energy Grids Netw. 2024, 40, 101548. [Google Scholar] [CrossRef] [Scilit]
- Du, J.; Zhang, X.; Wang, S.; Liu, X. A Health-Aware Fuzzy Logic Controller Optimized by NSGA-II for Real-Time Energy Management of Fuel Cell Electric Commercial Vehicles. Machines 2025, 13, 1048. [Google Scholar] [CrossRef] [Scilit]
- Wang, H.; Zhu, D.; Chen, B.; Ren, Y.; Ning, S.; Zhao, X. An experimentally validated health-aware hierarchical energy management strategy for fuel cell heavy-duty trucks. Energy 2025, 341, 139416. [Google Scholar] [CrossRef] [Scilit]
- Li, Y.; Jin, T.; Bai, X.; Wang, C.; Liu, B. A novel seasonal lag grey model for forecasting quarterly electricity consumption in China. Grey Syst. Theory Appl. 2025, 15, 620–636. [Google Scholar] [CrossRef] [Scilit]
- Yao, X.; Mao, S. Electric supply and demand forecasting using seasonal grey model based on PSO-SVR. Grey Syst. Theory Appl. 2023, 13, 141–171. [Google Scholar] [CrossRef] [Scilit]
- Zhang, S.; Liu, M.; Li, B. Data-driven dynamic Grey-Verhulst SEIRD Model for public health emergencies forecasting. J. Grey Syst. 2025, 37, 33–46. [Google Scholar]
- Ning, L.; He, F.; Zeng, X.; Mei, Y.; Cang, H. An Exponential-Polynomial Matrix Model based on the accumulation generation of ternary interval number series and its application in forecasting China’s GDP by region. J. Grey Syst. 2023, 35, 34–54. [Google Scholar]
- Chen, Q.; Zhang, C.; Zhang, Z. Grey prediction of China grain production with TEI@I methodology. J. Grey Syst. 2016, 28, 118–126. [Google Scholar]
- Lu, J.; Xie, W.; Zhou, H.; Zhang, A. An optimized nonlinear grey Bernoulli model and its applications. Neurocomputing 2016, 177, 206–214. [Google Scholar] [CrossRef] [Scilit]
- Zhang, Y.; Li, S.; Li, J.; Tang, X. Memory-dependent derivative grey Bernoulli model and its application in electricity generation forecast. Grey Syst. Theory Appl. 2024, 14, 160–184. [Google Scholar] [CrossRef] [Scilit]
- Wang, Y.; Li, Y.; Lu, J.; Zhou, H. Estimation of fuel cell power demand on commercial vehicles based on improved multiple Grey prediction method considering dynamic time window. Appl. Sci. 2025, 15, 1213. [Google Scholar] [CrossRef] [Scilit]
- Wang, Y.; Lu, J.; Zhu, X.; Ye, J.; Kong, Y.; Hao, W. A GM-based energy management strategy of hybrid power system for hydrogen fuel cell buses. J. Adv. Transp. 2023, 2023, 6656612. [Google Scholar] [CrossRef] [Scilit]
- Hu, Z. Durability Modeling and State Estimation for Vehicular Fuel Cell System. Ph.D. Thesis, Tsinghua University, Beijing, China, 2019. [Google Scholar]
- Huang, R.; Peng, Y.; Yang, J.; Xu, X.; Deng, P. Correlation analysis and prediction of PEM fuel cell voltage during start-stop operation based on real-world driving data. Energy 2022, 260, 124930. [Google Scholar] [CrossRef] [Scilit]
- Kim, J.; Cho, E.; Jang, J.; Kim, H.; Lim, T.; Oh, I.; Ko, J.; Oh, S. Effects of Cathode Inlet Relative Humidity on PEMFC Durability during Startup–Shutdown Cycling: II. Diagnostic Study. J. Electrochem. Soc. 2010, 157, B633. [Google Scholar] [CrossRef] [Scilit]
- Yu, Y.; Li, H.; Wang, H.; Yuan, X.; Wang, G.; Pan, M. A review on performance degradation of proton exchange membrane fuel cells during startup and shutdown processes: Causes, consequences, and mitigation strategies. J. Power Sources 2012, 205, 10–23. [Google Scholar] [CrossRef] [Scilit]
- Liu, Z.; Chen, H.; Zhang, T. Review on system mitigation strategies for start-stop degradation of automotive proton exchange membrane fuel cell. Appl. Energy 2022, 327, 120058. [Google Scholar] [CrossRef] [Scilit]
- Zhang, T.; Wang, P.; Chen, H.; Pei, P. A review of automotive proton exchange membrane fuel cell degradation under start-stop operating condition. Appl. Energy 2018, 223, 249–262. [Google Scholar] [CrossRef] [Scilit]
- Tian, T.; Tang, J.; Guo, W.; Pan, M. Accelerated life-time test of MEA durability under vehicle operating conditions in PEM fuel cell. Front. Energy 2017, 11, 326–333. [Google Scholar] [CrossRef] [Scilit]
- Espiari, S.; Aleyaasin, M. Transient response of PEM fuel cells during sudden load change. In 2010 IEEE International Energy Conference (EnergyCon), Manama, Bahrain, 18–21 December 2010; IEEE: Piscataway, NJ, USA, 2010. [Google Scholar]
- He, Y.; Chen, H.; Qu, B.; Zhang, T.; Pei, P.; Liang, C. Analysis of Proton Exchange Membrane Fuel Cell reactant gas dynamic response and distribution quality. Energy Procedia 2018, 152, 667–672. [Google Scholar] [CrossRef] [Scilit]
- Taniguchi, A.; Akita, T.; Yasuda, K.; Miyazaki, Y. Analysis of electrocatalyst degradation in PEMFC caused by cell reversal during fuel starvation. J. Power Sources 2004, 130, 42–49. [Google Scholar] [CrossRef] [Scilit]
- Liu, S.; Rasinski, M.; Rahim, Y.; Zhang, S.; Wippermann, K.; Reimer, U.; Lehnert, W. Influence of operating conditions on the degradation mechanism in high-temperature polymer electrolyte fuel cells. J. Power Sources 2019, 439, 227090. [Google Scholar] [CrossRef] [Scilit]
- Pei, P.; Chang, Q.; Tang, T. A quick evaluating method for automotive fuel cell lifetime. Int. J. Hydrogen Energy 2008, 33, 3829–3836. [Google Scholar] [CrossRef] [Scilit]
- Yu, Z.; Xia, Q.; Zhao, L.; Lun, J.; Liu, W.; Li, K.; Ji, X. Chapter 1 Vehicle dynamic performance. In Automotive Theory, 6th ed.; Feng, C., Wu, J., Eds.; China Machine Press: Beijing, China, 2023; pp. 1–53. [Google Scholar]
- Boβer, C.; Sedarsky, D. Verified PEMFC heavy-duty long-haul truck vehicle model with thermal management limitations of conventional cooling systems. Appl. Therm. Eng. 2025, 280, 128025. [Google Scholar]
- Fan, P.; Song, G.; Zhai, Z.; Boriboonsomsin, K. Road grade and truck weight matter: Investigating link-level energy consumption uncertainty. Transp. Res. Part D 2025, 146, 104900. [Google Scholar] [CrossRef] [Scilit]
- Wikner, E.; Thiringer, T. Extending Battery Lifetime by Avoiding High SOC. Appl. Sci. 2018, 8, 1825. [Google Scholar] [CrossRef] [Scilit]
- Zhu, X. Hydrogen Fuel Cell Bus Hybrid Power System Energy Management Strategy Study. Master’s Thesis, Zhejiang University of Technology, Hangzhou, China, 2021. [Google Scholar]
- Lu, J.; Xie, W.; Zhang, A.; Wang, C. Chaos-based Modified GM(1,1) Power Model in Time Series Prediction. J. Grey Syst. 2014, 26, 32–43. [Google Scholar]
- Wang, Z.; Dang, Y.; Liu, S.; Zhao, J. Solution of GM(1,1) power model and its properties. Syst. Eng. Electron. 2009, 31, 2380–2383. [Google Scholar]
- Hui, W.; Zhang, B.; Yu, L.; Guan, Z. Design Fuzzy Controller Based on Function Self-tuning. In Proceedings of the 2013 International Conference on Advanced Computer Science and Electronics Information (ICACSEI), Beijing, China, 25–26 July 2013; Atlantis Press: Dordrecht, The Netherlands, 2013. [Google Scholar]
- Dan, S.; Ren, K.; Luo, J.; He, C.; Zhang, X. Programme and Simulation of the Fuzzy Control List in Fuzzy Control. In 2010 8th World Congress on Intelligent Control and Automation (WCICA), Jinan, China, 7–9 July 2010; IEEE: Piscataway, NJ, USA, 2010. [Google Scholar]
- Tao, H.; Hu, Z.; Wang, Z.; Li, J.; Xu, L.; Ouyang, M. Working conditions analysis and performance degradation estimation of fuel cell buses based on real road data. In Proceedings of the 2023 7th CAA International Conference on Vehicular Control and Intelligence (CVCI), Changsha, China, 27–29 October 2023; IEEE: Piscataway, NJ, USA, 2023. [Google Scholar]

Disclaimer/Publisher’s Note: The statements, opinions and data contained in all publications are solely those of the individual author(s) and contributor(s) and not of MDPI and/or the editor(s). MDPI and/or the editor(s) disclaim responsibility for any injury to people or property resulting from any ideas, methods, instructions or products referred to in the content. |
© 2026 by the authors. Licensee MDPI, Basel, Switzerland. This article is an open access article distributed under the terms and conditions of the Creative Commons Attribution (CC BY) license.