Article

Chemical Composition and Nutritional Indices of Autochthonous Trifolium repens Populations from Different Origins

by
Vasileios Greveniotis
1,*,
Elisavet Bouloumpasi
2,
Adriana Skendi
2,
Dimitrios Kantas
3 and
Constantinos G. Ipsilandis
4
1
Institute of Industrial and Forage Crops, Hellenic Agricultural Organization Dimitra (ELGO-DIMITRA), GR-41335 Larissa, Greece
2
Department of Viticulture and Oenology, Democritus University of Thrace, GR-66100 Drama, Greece
3
Department of Animal Science, University of Thessaly, Campus Gaiopolis, GR-41500 Larissa, Greece
4
Regional Administration of West Macedonia, GR-50131 Kozani, Greece
*
Author to whom correspondence should be addressed.
Appl. Sci. 2026, 16(9), 4207; https://doi.org/10.3390/app16094207
Submission received: 19 March 2026 / Revised: 21 April 2026 / Accepted: 22 April 2026 / Published: 25 April 2026
(This article belongs to the Special Issue Forage Systems and Sustainable Animal Production)

Abstract

White clover (Trifolium repens L.) is a major legume in Mediterranean agroecosystems. This study systematically evaluates 15 autochthonous white clover populations from the Trikala region of Greece, focusing on chemical composition and derived nutritional indices relevant for germplasm characterization and breeding. Fifteen local populations were evaluated under controlled pot cultivation over two consecutive years. Clonal plants were harvested at the early flowering stage. Key traits—crude protein (CP), Ash, Fat, crude fibre (FIBRE), acid detergent fibre (ADF), neutral detergent fibre (NDF), digestible dry matter (DDM), dry matter intake (DMI), and relative feed value (RFV)—were measured. Combined ANOVA revealed significant differences among populations for all traits (p ≤ 0.001), while genotype × year interactions were present but generally minor compared to genotypic effects. Broad-sense heritability was high across most traits (H2 = 90.8–99.4%), demonstrating strong genetic control. CP showed positive correlations with DDM, DMI, and RFV, whereas ADF and NDF were negatively correlated with intake and digestibility. Canonical and discriminant analyses showed that a reduced set of traits (CP, Ash, FIBRE, RFV) contributed strongly to differentiation among populations. Hierarchical clustering (heatmap) confirmed these groupings based on fibre and digestibility-related traits. Populations such as Dendrochori and Gorgogyri consistently showed favorable chemical and nutritional profiles, while Fiki and Dendrochori showed the highest stability across years. The present study highlights substantial genetic variability among local white clover populations and identifies trait structures of relevance for germplasm characterization. These findings enhance the characterization of genetic diversity in Trifolium repens and support its potential use in future breeding research under Mediterranean environments.

1. Introduction

Trifolium repens L. (white clover) is a perennial forage legume widely distributed from Northern Europe to the Mediterranean and subtropical regions [1,2]. It is commonly used in mixed grass/clover cultivations due to its adaptability, stoloniferous growth habit, and high resistance to grazing, which also confers tolerance to trampling [3,4,5]. White clover is recognized for its high nutritional value, with elevated CP, low structural FIBRE, and excellent digestibility, contributing to superior forage quality compared to companion grasses such as perennial ryegrass [6,7,8,9,10]. Animals grazing on pastures rich in white clover show enhanced liveweight gain and milk production compared to those grazing on monoculture grasses [11,12,13]. The species establishes symbiotic relationships with rhizobial bacteria (Rhizobium leguminosarum sv. trifolii) in its roots, allowing fixation of 75–92% of its nitrogen requirement from the atmosphere, thereby reducing the need for synthetic nitrogen fertilizers [3,14,15,16]. This nitrogen-fixing ability contributes to soil fertility improvement and sustainable pasture management [3,4,5,17]. Additionally, white clover enhances soil biodiversity by increasing earthworm and microorganism activity, while attracting pollinators, providing important environmental benefits beyond forage production [18,19]. Proper harvest timing and the use of disease-resistant cultivars are essential to maintain high-quality forage and minimize losses due to pests or pathogens [20,21,22].
The nutritive value of legume forage crops, including Trifolium repens, is strongly influenced by environmental conditions, plant maturity, and species-specific shoot morphology [23,24,25]. Key indicators of forage quality include CP, non-protein nitrogen, NDF, ADF, and available energy [26,27,28]. As plants mature, there is generally a decline in protein content and digestibility, accompanied by a simultaneous increase in NDF and ADF, which reduces overall feed quality [29,30,31]. Mediterranean environments are characterized by high inter-annual climatic variability, including frequent drought and temperature fluctuations, which further amplify changes in forage quality and persistence of perennial legumes such as Trifolium repens [32,33,34].
Determining the optimal harvest time is crucial for obtaining high-quality roughage, as periods of maximum yield do not always align with periods of maximum forage quality [35]. Species-dependent variation, such as shoot morphology and leaf-to-stem ratio, can further affect forage quality and subsequent animal performance [36,37]. Common analytical methods for evaluating forage quality include raw Ash (indicative of mineral content), total nitrogen for protein estimation, NDF, ADF, and lignin in acid medium [38,39]. These measurements are subsequently used to calculate nutritional value parameters such as RFV, providing a theoretical estimate of feed quality and nutrient content [28,40,41].
There is limited information regarding the performance of autochthonous Trifolium repens populations under long-term evaluation in Mediterranean environments, particularly in terms of the combined assessment of chemical composition and trait stability across years. In addition, most existing studies focus on single-season evaluations, which may not adequately capture temporal variation and the consistency of genotypic performance. Therefore, multi-year assessments under uniform management conditions are necessary to distinguish stable genetic differences from environmental (temporal) effects and to support reliable selection of superior germplasm for forage improvement programs in Mediterranean agroecosystems.
This study evaluates 15 autochthonous Trifolium repens populations from different geographical origins to assess variation in chemical composition traits. Specifically, the study aims to (i) quantify variation in key compositional parameters (CP, Ash, FIBRE fractions), (ii) evaluate trait stability across two consecutive years under controlled conditions, and (iii) identify populations and trait combinations with potential value as genetic resources for future selection and breeding in Mediterranean environments. This approach addresses the limited information available on locally adapted white clover germplasm and the combined evaluation of compositional and stability-related traits.

2. Materials and Methods

2.1. Plant Material Collection

Autochthonous populations of Trifolium repens L. of different origins were collected from 15 geographically distinct sites within the Trikala region, Greece, during 2023. Collection was conducted under authorization from the Ministry of Environment and Energy according to Flora Research Permit Protocol No. ΥΠΕΝ/ΔΠΔ/129149/7625/10-01-2023, ADA 6Ρ9Γ4653Π8-ΖΦΚ. The field survey aimed at the ex situ conservation and evaluation of autochthonous Greek populations with agronomic interest. Collected populations served as mother plants, from which clonal propagules were produced for pot cultivation and subsequent evaluation.
The collection sites, dates, and corresponding administrative units are summarized in Table 1. Four clonal replicates from each population were cultivated in individual pots for subsequent growth and analysis. The 15 collection sites represented heterogeneous agroecological conditions within the Trikala region, including variation in altitude, microclimatic conditions, and vegetation type, which may contribute to the observed differences among populations.
Following collection, all plant material was subjected to a uniform acclimatization period under controlled ex situ conditions prior to clonal propagation, in order to minimize potential maternal effects and differences arising from variation in collection timing and phenological stage.
Clonal propagules were obtained from vegetative stolons of uniform developmental stage, ensuring genetically identical and developmentally comparable replicates for each population.
All pots were maintained outdoors under natural environmental conditions, ensuring uniform exposure to sunlight, rainfall, and wind, so that observed differences among populations could be primarily attributed to genetic variation.

2.2. Pots and Substrate

Clonal plants derived from the collected populations were cultivated in a randomized complete block design (RCBD) with four blocks in each experimental year. Each block contained one replicate of each of the 15 Trifolium repens populations, resulting in a total of 60 pots per year (15 populations × 4 replicates). Pots were randomly allocated within each block to minimize spatial heterogeneity. Each pot corresponded to a single clonal replicate and was considered an independent experimental unit. The experiment was conducted over two consecutive years (2024 and 2025) under identical management conditions. Blocks were spatially separated within the experimental area to minimize potential environmental gradients.
Plants were grown in 10 L plastic pots with drainage holes at the bottom. The substrate consisted of a homogeneous mixture of peat (60%), sand (30%), and perlite (10%). Peat (60%) had high organic matter content (>90%), pH 6.5, and low salt concentration, providing organic matter and enhancing moisture and nutrient availability. Sand (30%) was clean, coarse material free of soil and organic residues, improving drainage and root aeration. Perlite (10%) further enhanced drainage and root aeration, contributing to a structurally stable growth medium. This substrate ensured uniform physical conditions across all experimental units and minimized variability due to growing medium heterogeneity [42]. The peat–sand–perlite mixture was selected to ensure homogeneous physical conditions and low intrinsic nutrient variability, which are essential in pot experiments under controlled conditions aimed at comparing genotypic performance. This combination provides a well-aerated and well-drained medium, minimizing environmental heterogeneity and allowing reliable assessment of genetic differences among populations. The substrate was not sterilized prior to use, allowing natural soil microbial activity, including potential rhizobial symbiosis, to occur under conditions closer to field reality.
A balanced N–P–K (20–20–20) fertilizer was applied to avoid nutrient limitations under pot conditions. This formulation is commonly used in controlled experiments to support balanced vegetative growth while avoiding strong bias in nitrogen availability in legume species where biological nitrogen fixation occurs [43]. A basal application of 1.5 g per pot was applied at transplanting, followed by two top-dress applications of 0.75 g per pot at 30-day intervals during the growing season. This fertilization regime ensured moderate nutrient availability throughout the growth cycle without inducing luxury consumption or suppressing symbiotic nitrogen fixation, and was applied uniformly across all pots and both experimental years.
Irrigation was standardized by applying approximately 400 mL of water per pot per irrigation event, corresponding to maintaining soil moisture close to field capacity [44]. Total weekly water input ranged between 800 and 1200 mL per pot, depending on environmental conditions. Soil moisture was regularly monitored to avoid drought stress or waterlogging, ensuring uniform water availability across all experimental units.
Pots were used to control environmental variability and ensure uniform growth conditions for comparative evaluation of genetic differences among populations.
All pots were maintained outdoors under natural environmental conditions, with uniform exposure to sunlight, rainfall, and wind. Plant development and survival were monitored regularly to ensure uniform establishment and growth. No root or above-ground interactions occurred between pots, ensuring full independence among experimental units.
The chemical composition of the potting substrate was designed to ensure uniform physical and nutrient conditions across all experimental units.

2.3. Planting and Growth Management

Clonal plants were transplanted into pots in March 2024 for the first experiment and in March 2025 for the second experiment. Each experimental year consisted of newly established clonal plants, and no repeated measurements were performed on the same plants across years, ensuring independence of experimental units across years. Pots were watered regularly to maintain adequate soil moisture throughout the experiment. Watering frequency and amount were adjusted according to daily environmental conditions to avoid overwatering, which could cause root damage, and drought stress, which could limit plant growth. Irrigation was applied uniformly across all pots using a manual watering system, ensuring that all experimental units received equal water supply under similar environmental conditions.
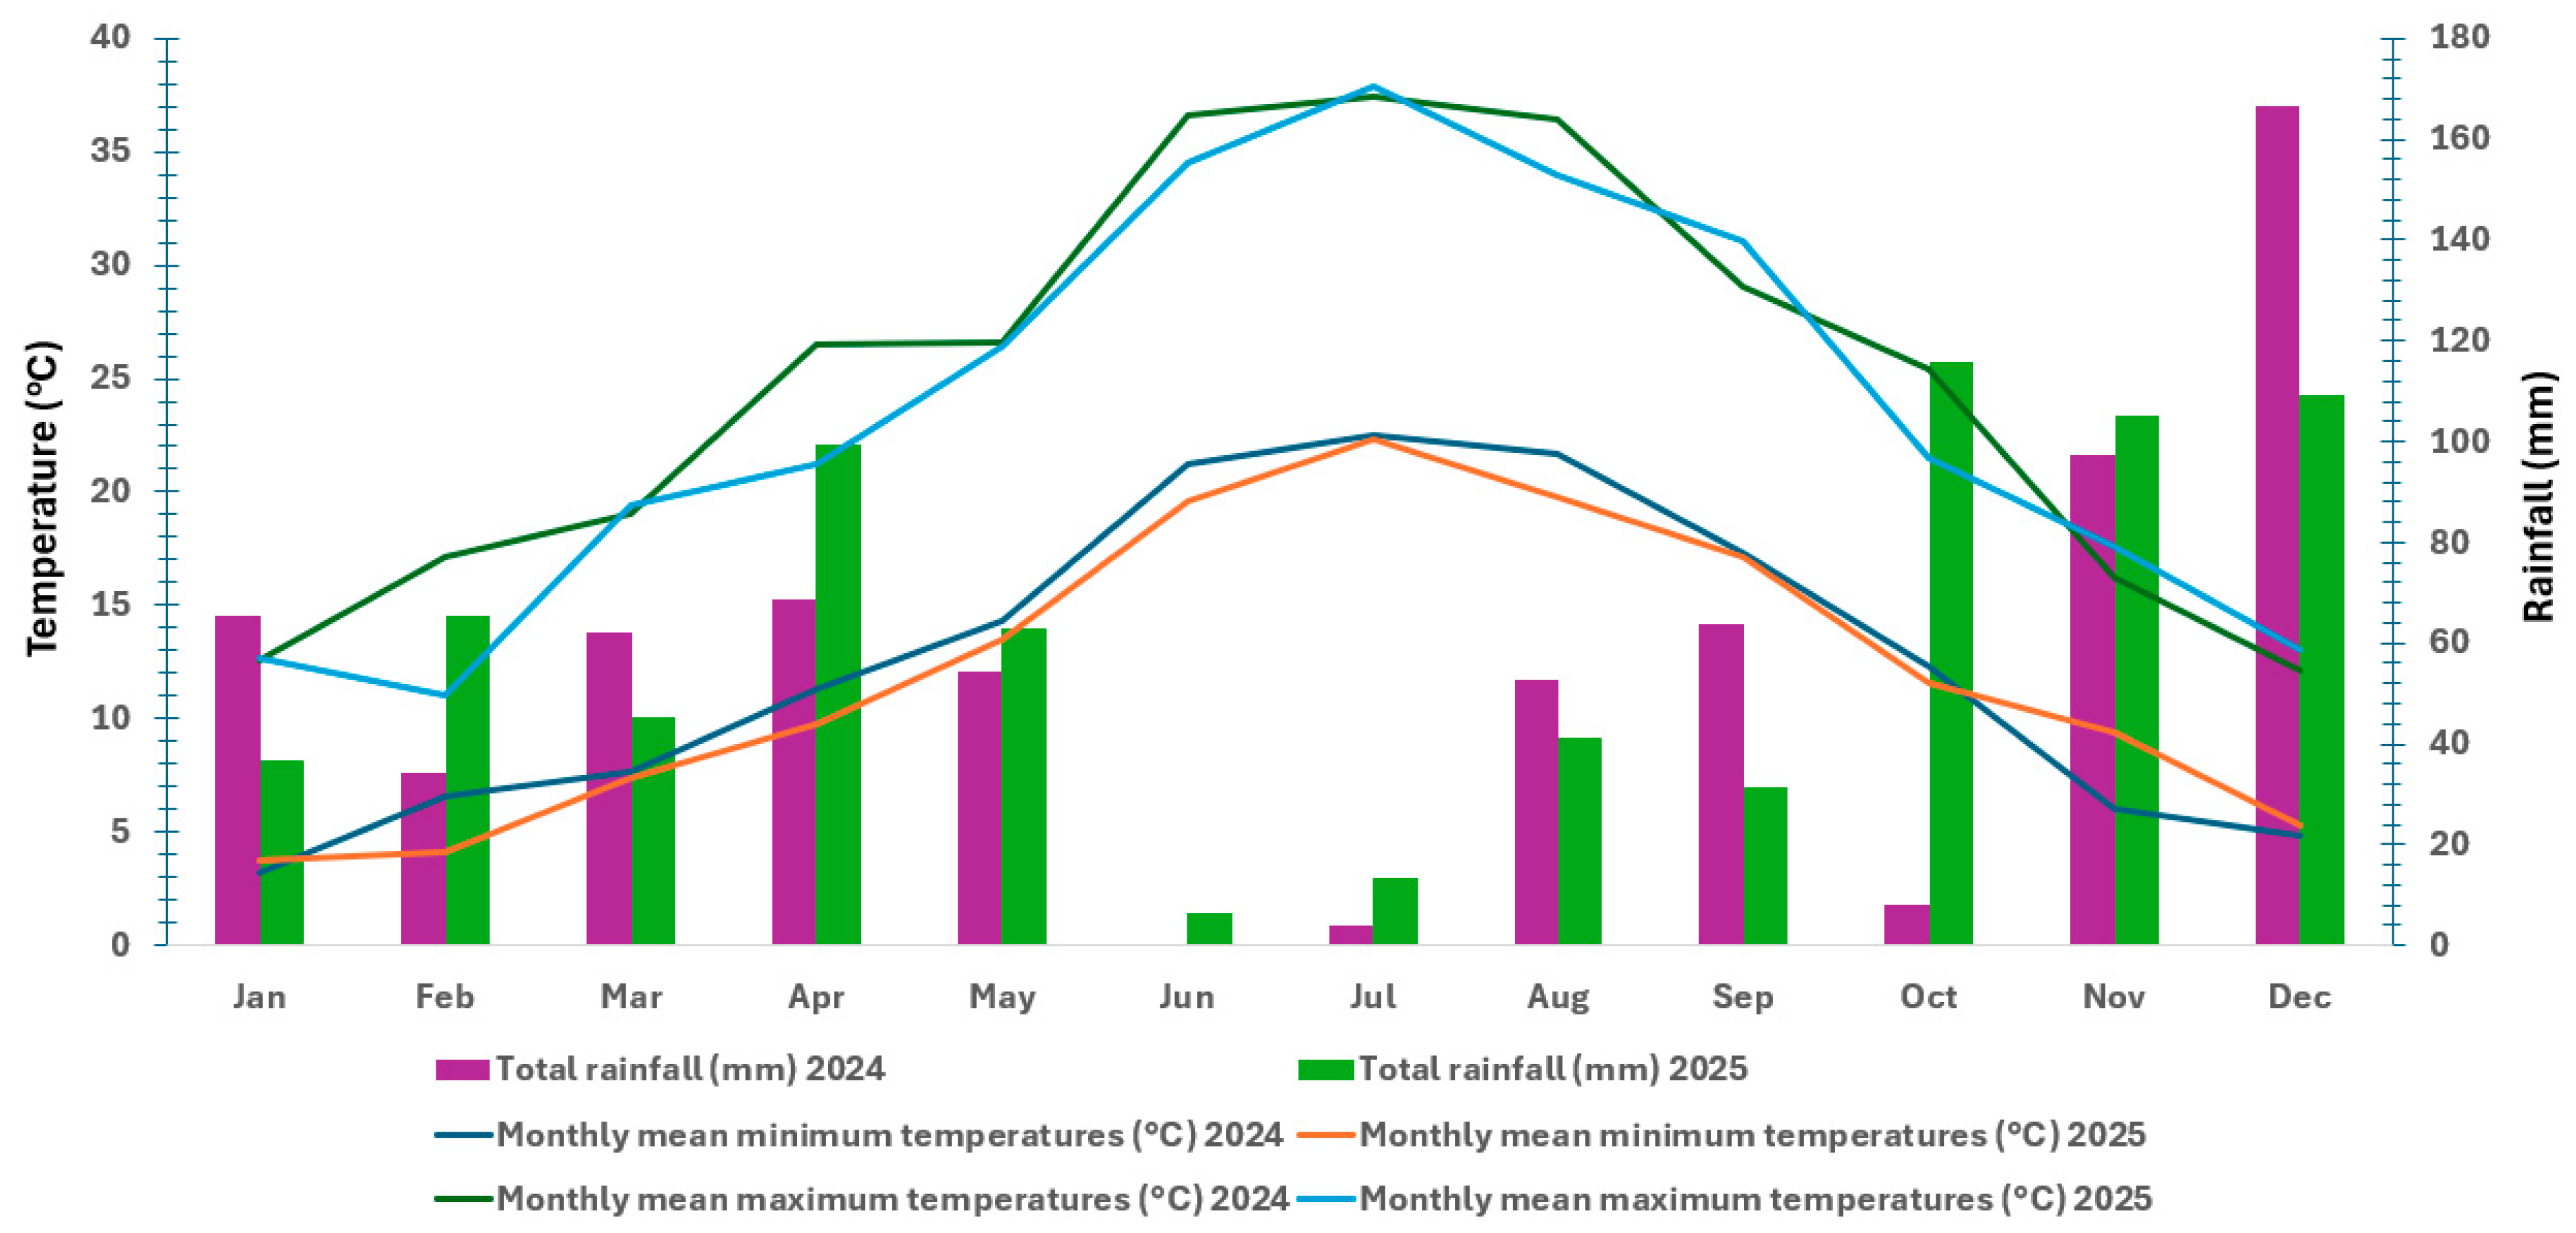
Daily maximum and minimum temperatures, together with monthly rainfall, were recorded throughout each experiment to provide a climatic context for plant growth (Figure 1). Plant development and survival were closely monitored to detect any abnormal growth or mortality, ensuring accurate assessment of population performance. All measures were taken to maintain uniform growth conditions and ensure experimental consistency across all experimental units.

2.4. Harvesting and Analyses

All clonal plants were harvested at the flowering stage, with harvest timing adjusted according to genotype phenology (from early flowering to full bloom), at a cutting height of 3–5 cm from the base of the plant, to ensure comparability of samples and to evaluate chemical composition and derived indices [45]. Harvesting was genotype-specific but conducted at a comparable phenological stage across populations, ensuring similar physiological maturity at sampling. Two cuts were performed in each experimental cycle; the first was used to standardize regrowth among clonal plants, while the second, performed at the flowering stage, was used for all chemical composition and nutritional analyses. Harvesting was based on phenological development rather than calendar date to account for differences among populations. Phenological stage was recorded prior to harvest for each genotype. This approach is consistent with previous findings showing that chemical composition traits (e.g., CP, fibre fractions) are strongly influenced by developmental stage, with progressive changes during flowering [46].
The harvested material was oven-dried until constant weight, following standard procedures recommended by the Association of Official Agricultural Chemists (AOAC) [47]. Drying was performed at a controlled temperature (65 °C) to avoid heat-induced degradation of nitrogenous compounds and structural carbohydrates, as commonly recommended for forage sample preservation in compositional studies.
CP (%) was determined using the Kjeldahl method, where total nitrogen was measured after acid digestion and titration, with protein content calculated using a conversion factor of 6.25 (AOAC, 2005) [48]. FIBRE (%) was analyzed following AOAC method 978.10, which involves sequential acidic and basic digestions, followed by gravimetric determination of the remaining residue (AOAC, 2005) [48]. Ash (%) was determined by incinerating the dried sample at 600 °C for two hours in a muffle furnace, following AOAC method 942.05 (AOAC, 2005) [48]. Fat (%) was extracted using the Soxhlet method (AOAC, 2005) [48] with diethyl ether as extraction solvent for 6 h. ADF (%) and NDF (%) were analyzed according to the procedures of Van Soest et al. [49], using a Velp Scientifica FIWE 6 Fiber Analyzer (VELP Scientifica, Usmate (MB), Italy) under the manufacturer’s standard operating conditions.
DDM (%) was calculated using the equation DDM = 88.9 − (0.779 × ADF%) [45], and DMI (% of body weight) was estimated as DMI = 120/NDF% [45]. RFV was calculated using the equation RFV = (DDM × DMI)/1.29 [29,50,51,52,53] and classified according to the Quality Grading Standard of The Hay Marketing Task Force of the American Forage and Grassland Council. RFV categories for roughages range from prime (>151), premium (151–125), good (124–103), fair (102–87), poor (86–75), to reject (<75). The interpretation of fiber fractions (ADF and NDF) as key indicators of nutritional composition and derived indices is supported by ruminant nutrition theory, where cell wall components strongly determine digestibility and intake potential [25,54].
These indices (DDM, DMI, and RFV) are widely used empirical estimations based on fiber fractions (ADF and NDF) and should therefore be interpreted as indirect indicators of nutritional composition rather than direct measures of nutritive value. It should be noted that DMI and DDM formulas are empirical and were originally developed for other forage species; they have not been validated for Trifolium repens L. RFV is calculated from DDM and DMI, thus representing an estimate derived from other estimates. These indices provide comparative insights but should be interpreted with caution. Although FIBRE was measured for reference, NDF and ADF are considered more robust indicators of fiber content and digestibility, and results are primarily interpreted based on these fractions. To reduce interpretation bias, greater emphasis was placed on structural fiber fractions (ADF and NDF), which are more directly linked to digestibility and intake potential in ruminant nutrition studies.
All measurements were performed in triplicate for each pot replicate (three technical subsamples per replicate), and mean values were used for subsequent statistical analyses to ensure that observed differences primarily reflected genetic variation, rather than environmental or procedural variability. This approach allowed a reliable comparative assessment of chemical composition and derived nutritional indices among autochthonous populations, providing a foundation for identifying superior genotypes for potential inclusion in future forage breeding programs. Previous studies in Trifolium repens have also demonstrated that management and developmental stage can significantly affect chemical composition traits, supporting the interpretation of observed variation in the present study [55].

2.5. Statistical Analysis

All statistical analyses were performed to evaluate variation, relationships, and stability among the assessed chemical composition and nutritional composition traits. A combined (two-way) analysis of variance (ANOVA) was conducted for each trait based on a randomized complete block design (RCBD) over two experimental years (2024 and 2025), considering genotype, year (temporal environment), and genotype × year interaction as fixed effects, and blocks nested within year. Genotypes were considered as fixed effects [56] for the comparison of mean performance and trait variation among populations. Mean differences among genotypes were compared using Duncan’s multiple range test at a significance level of 0.05, implemented in MSTAT-C software, version 2.10 (Michigan State University, East Lansing, MI, USA). This method is widely used in agronomic studies for multiple comparisons among treatment means.
Variance components were estimated from the ANOVA mean squares following McIntosh [57] and were used to derive genetic parameters, including broad-sense heritability (H2), according to Johnson et al. [58] and Hanson et al. [59]. Estimation of variance components was based on the combined RCBD model across the two experimental years (2024–2025), where genotype, year, genotype × year interaction, and error terms were partitioned according to the expected mean squares. In addition, phenotypic coefficient of variation (PCV) and genotypic coefficient of variation (GCV) were calculated based on Singh and Chaudhary [60], providing an indication of the extent of phenotypic and genotypic variability among traits.
H 2 = σ g 2 σ g 2 + σ g x e 2 e + σ r e 2 r x e
GCV ( % ) = σ g 2 x ¯ × 100
PCV ( % ) = σ p 2 x ¯ × 100
For these calculations, the genotypic variance, phenotypic variance, genotype × environment interaction variance, residual error variance, number of replications, number of environments, and overall mean were considered as σ g 2 , σ p 2 , σ g x e 2 , σ r e 2 , r, e, and x ¯ , respectively.
In this study, the term “environment” refers to the two experimental years (2024 and 2025) conducted at the same location under identical management conditions; therefore, it represents a temporal (year) effect rather than distinct environmental locations. Accordingly, genotype × environment interaction should be interpreted as genotype × year interaction.
The Stability Index (SI) for each trait was computed according to Fasoula [61] as follows:
S I = ( x ¯ / s ) 2
where x ¯ is the mean and s is the standard deviation. SI values were calculated based on mean trait performance across the two experimental years (2024–2025), representing temporal (year-to-year) stability at a single location. The SI was used as a descriptive measure of phenotypic stability under uniform management conditions. Higher SI values indicate lower temporal variability and thus greater stability.
Prior to multivariate analyses (PCA, hierarchical cluster analysis, and discriminant analysis), all variables were standardized using the default standardization procedure implemented in JMP Pro 18 (SAS Institute Inc., Cary, NC, USA) to ensure comparability among traits measured in different units and scales.
Discriminant Analysis was employed to determine which of the nine chemical and nutritional traits —CP, Ash, Fat, FIBRE, ADF, NDF, DDM, DMI, RFV—best differentiated the 15 autochthonous Trifolium repens populations. Predictor variables were selected using a Stepwise procedure (F-ratio and p-value criteria). The overall significance of the classification was evaluated via Wilks’ Lambda, Pillai’s Trace, and Roy’s Largest Root, while model fit was assessed using Entropy R-Square and −2 Log-Likelihood statistics. Separation was visualized in a Canonical Plot with 95% confidence ellipses, and standardized scoring coefficients were used to identify the relative contribution of each nutrient to the canonical dimensions.
Discriminant analysis was performed to evaluate multivariate separation among populations based on the measured traits. Classification accuracy was assessed using a resubstitution approach on the original dataset, without applying cross-validation, as the aim was group separation rather than predictive classification. Therefore, results should be interpreted as descriptive of group separation rather than predictive classification performance.
Hierarchical Cluster Analysis (HCA) was conducted using Ward’s minimum variance method and two-way clustering. To account for differing scales, data were standardized. Clustering was performed using Euclidean distance. Relationships were visualized in a heat map and dendrograms using a Distance Scale. Pearson correlation coefficients were calculated to assess relationships among traits, and a correlation colour map with significance circles was used to visualize the strength and direction of these associations. Principal Component Analysis (PCA) was also performed to examine overall patterns among traits. All multivariate statistical analyses were performed in JMP Pro 18 (SAS Institute Inc., Cary, NC, USA), with significance defined at p < 0.05.

3. Results

The Section 3 presents the chemical composition traits and derived nutritional indices of 15 autochthonous Trifolium repens populations evaluated over two consecutive years. Analyses include the effects of genotype, year, and their interaction, as well as variability among populations and relationships among traits.

3.1. Combined ANOVA

The combined ANOVA (Table 2) for the 15 autochthonous Trifolium repens populations revealed significant variation among genotypes (G) for all evaluated chemical composition traits and derived indices, including CP (MS = 19.947, p ≤ 0.001), Ash (MS = 12.156, p ≤ 0.001), Fat (MS = 0.439, p ≤ 0.001), FIBRE (MS = 18.255, p ≤ 0.001), ADF (MS = 33.994, p ≤ 0.001), NDF (MS = 33.655, p ≤ 0.001), DDM (MS = 20.629, p ≤ 0.001), DMI (MS = 0.164, p ≤ 0.001), and RFV (MS = 892.027, p ≤ 0.001).
The effect of year (Y) was significant for CP (MS = 2.634, p ≤ 0.001), Ash (MS = 0.238, p ≤ 0.001), Fat (MS = 0.139, p ≤ 0.001), FIBRE (MS = 0.414, p ≤ 0.001), NDF (MS = 0.255, p ≤ 0.001), DMI (MS = 0.001, p ≤ 0.001), and RFV (MS = 2.483, p ≤ 0.05), while ADF (MS = 0.170) and DDM (MS = 0.102) were not significantly affected by year.
The genotype × year (G × Y) interaction was significant for all evaluated traits, indicating differential responses of genotypes across the two experimental years.
Replication within years was not significant for any trait.

3.2. Stability of Chemical Composition Traits and Derived Indices

The Stability Index (SI) values presented in Table 3 describe the variation in chemical composition traits and derived nutritional indices among the 15 autochthonous Trifolium repens populations over the two experimental years.
Differences in SI values were observed among populations across traits. Fiki, Dendrochori, and Kato Rachi (Neromylos) showed relatively high SI values for RFV and DDM. In contrast, Prodromos, Matsoukeika, and Gorgogyri showed lower SI values for several traits.
CP stability ranged from 4263 in Prodromos to 10,582 in Fiki, while NDF stability varied from 27,483 in Gorgogyri to 67,871 in Pialeia. SI values varied among populations across all evaluated traits.

3.3. Descriptive Statistics

The genetic parameter estimates for the 15 autochthonous Trifolium repens populations are presented in Table 4. Mean CP was 21.44%, ranging from 19.19 to 24.92%, with broad-sense heritability (H2 = 99.0%). Ash content averaged 11.34% (range 9.63–13.36%) with H2 = 98.6%, while Fat content averaged 2.31% (1.79–2.82%) with H2 = 96.8%. FIBRE and ADF showed means of 21.38% and 27.53%, respectively, with H2 = 97.9% for FIBRE and H2 = 90.8% for ADF. NDF averaged 41.85% with H2 = 99.2%.
DDM (%) and DMI (% of body weight) had mean values of 67.45 and 2.87, respectively (H2 = 90.8% and 99.4%), while RFV ranged from 135.77 to 168.33 (mean = 150.39; H2 = 98.5%).
DDM, DMI, and RFV are derived indices calculated from ADF and NDF using established empirical equations and therefore represent secondary indices based on fibre composition.

3.4. Performance of Autochthonous Trifolium repens Populations Based on Duncan’s Multiple Range Test

The mean comparison of 15 autochthonous Trifolium repens populations using Duncan’s multiple range test revealed significant differences among populations for all chemical composition traits and derived indices, averaged over the two experimental years (Table 5).
CP content ranged from 19.52% (Kefalopotamos) to 24.62% (Dendrochori). Ash content varied between 9.855% (Dilofos) and 13.13% (Kefalopotamos). Fat content ranged from 1.854% (Exalofos) to 2.724% (Dendrochori). FIBRE was lowest in Kato Rachi (19.08%) and highest in Pinakas Koziakas (24.68%). ADF values ranged from 25.03% (Dendrochori) to 30.74% (Filyra), while NDF ranged from 38.74% (Gorgogyri) to 44.56% (Prodromos).
DDM ranged from approximately 65% (Pialeia and Filyra) to 69% (Dendrochori, Gorgogyri, Xyloparoiko, and Kefalopotamos). DMI varied from 2.694% of body weight (Prodromos) to 3.099% (Gorgogyri). RFV ranged from 137.8 (Pialeia) to 166.3 (Kefalopotamos).

3.5. Multivariate Analysis and Population Classification

Preliminary ANOVA indicated that the year effect was limited for most of the selected traits used in the multivariate analysis. A reduced set of chemical composition traits and derived nutritional indices—CP, Ash, FIBRE, DDM, and RFV—was sufficient to discriminate among the 15 autochthonous Trifolium repens populations, whereas DMI, NDF, ADF, and Fat were excluded. The model achieved 0% misclassified populations, with an Entropy R2 of 0.9978 and a −2 Log-Likelihood of 1.41551, indicating high classification accuracy and consistent separation among populations with minimal influence of year variation.
Canonical discriminant analysis identified four significant dimensions of variation (p < 0.0001). The first two canonical functions accounted for 80.6% of the total variance, with canonical correlations of 0.996 and 0.993, respectively (Table S1). MANOVA confirmed a highly significant effect of population on the multivariate set of chemical composition traits and derived nutritional indices (Table S2). Roy’s Max Root (134.12) indicated that the first canonical dimension captured the majority of between-population variation, supporting consistent classification and clear group separation.
The standardized scoring coefficients (Table S3) revealed that the first canonical dimension (Canon1; 51.2% of variance) primarily represented a contrast between Ash content and CP, defining a mineral–protein gradient among populations. The second canonical dimension was mainly associated with RFV, reflecting differences in overall nutritive potential as derived from chemical composition. The third dimension was largely driven by FIBRE content, representing structural variation independent of protein and mineral composition.
The first axis separated populations associated with higher CP and lower Ash values from those with lower CP and higher Ash values. The second axis was associated with RFV, while the third axis was associated with structural FIBRE content. Together, these axes described variation among populations based on chemical composition and derived nutritional indices.
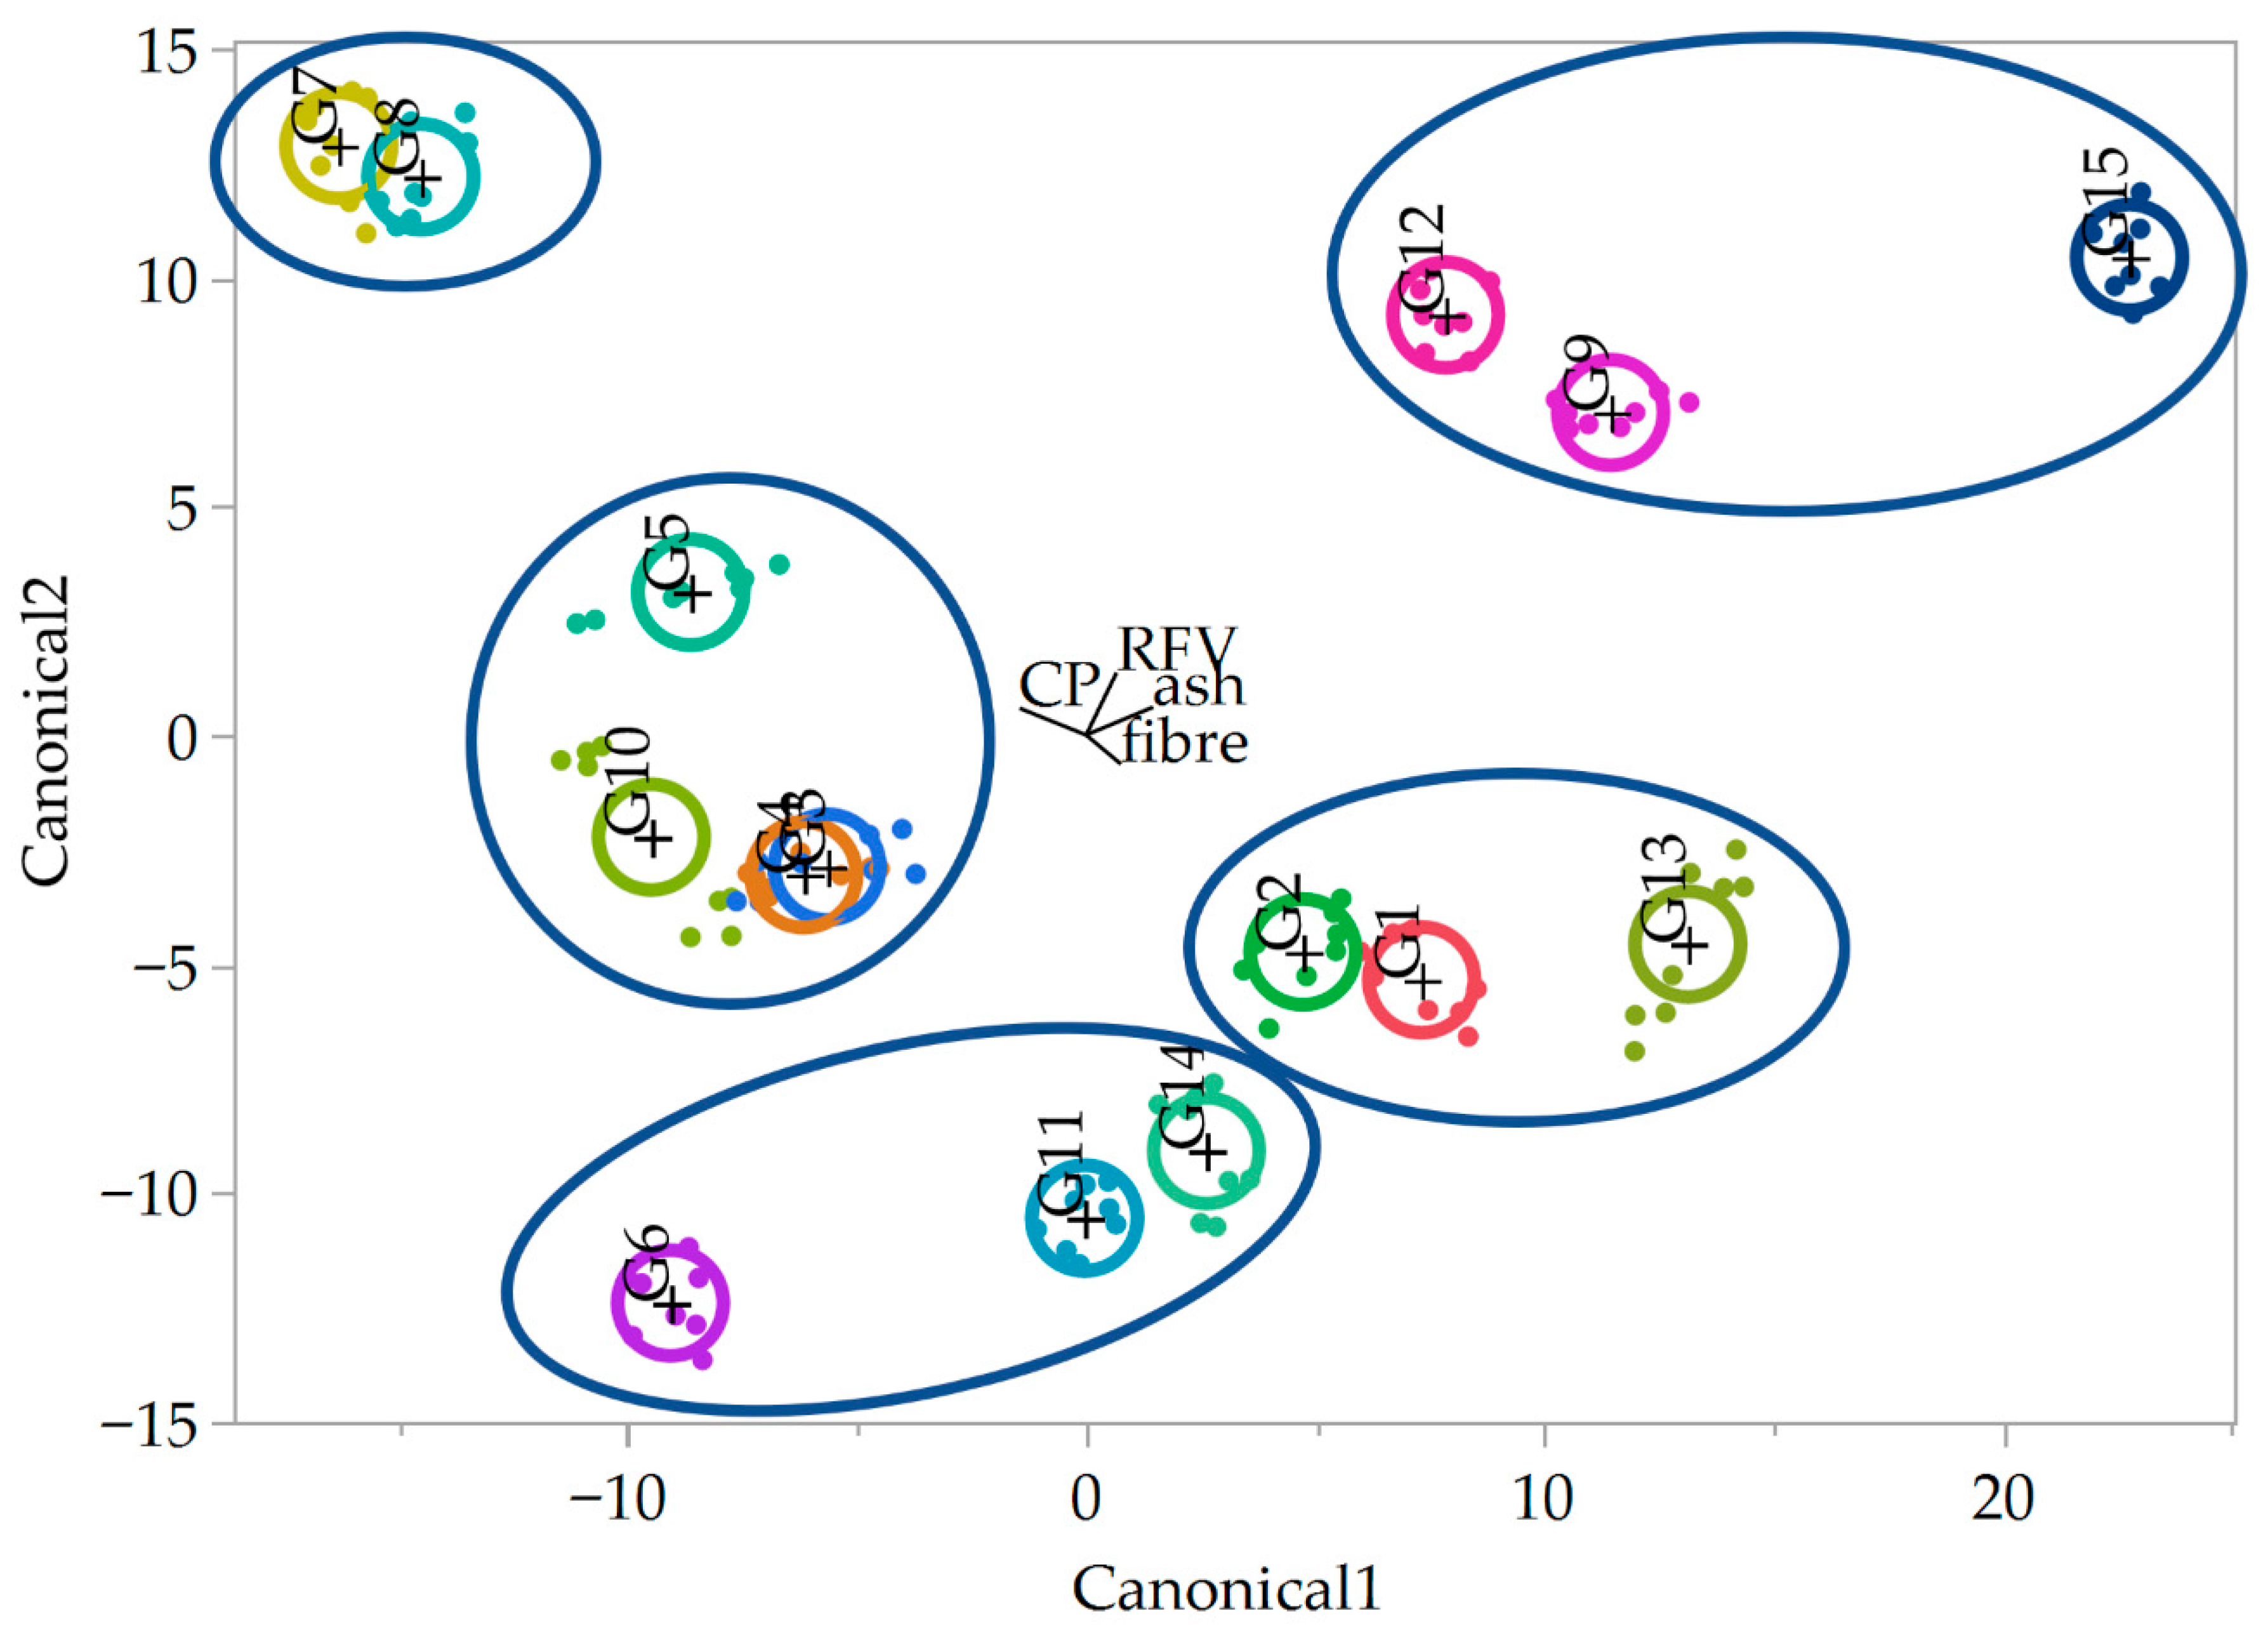
The canonical plot (Figure 2) further illustrated population structure based on these gradients. Populations G7 (Dendrochori) and G8 (Gorgogyri) were positioned in regions associated with high CP and high RFV, indicating superior chemical composition and derived index values. In contrast, G15 (Kefalopotamos), G12 (Xyloparoiko), and G9 (Fiki) were associated with higher Ash and FIBRE content despite relatively high RFV. Intermediate populations, including G5 (Kato Rachi), G10 (Matsoukeika), G4 (Eleftherochori), and G3 (Exalofos), exhibited balanced chemical composition and occupied central positions in the canonical space. Populations G1 (Pialeia), G2 (Filyra), and G13 (Prodromos) showed lower RFV and higher Ash and FIBRE content, while G6 (Dilofos), G11 (Pinakas Koziakas), and G14 (Valtino) were characterized by the lowest CP and RFV values.
Spatial proximity in the canonical space reflected similarity among populations, with G7 (Dendrochori) and G8 (Gorgogyri) clustering closely, as well as G3 (Exalofos) and G4 (Eleftherochori), and G1 (Pialeia) and G2 (Filyra), indicating close grouping based on their multivariate profiles.

3.6. Hierarchical Clustering Heatmap of Chemical Composition Traits and Derived Indices

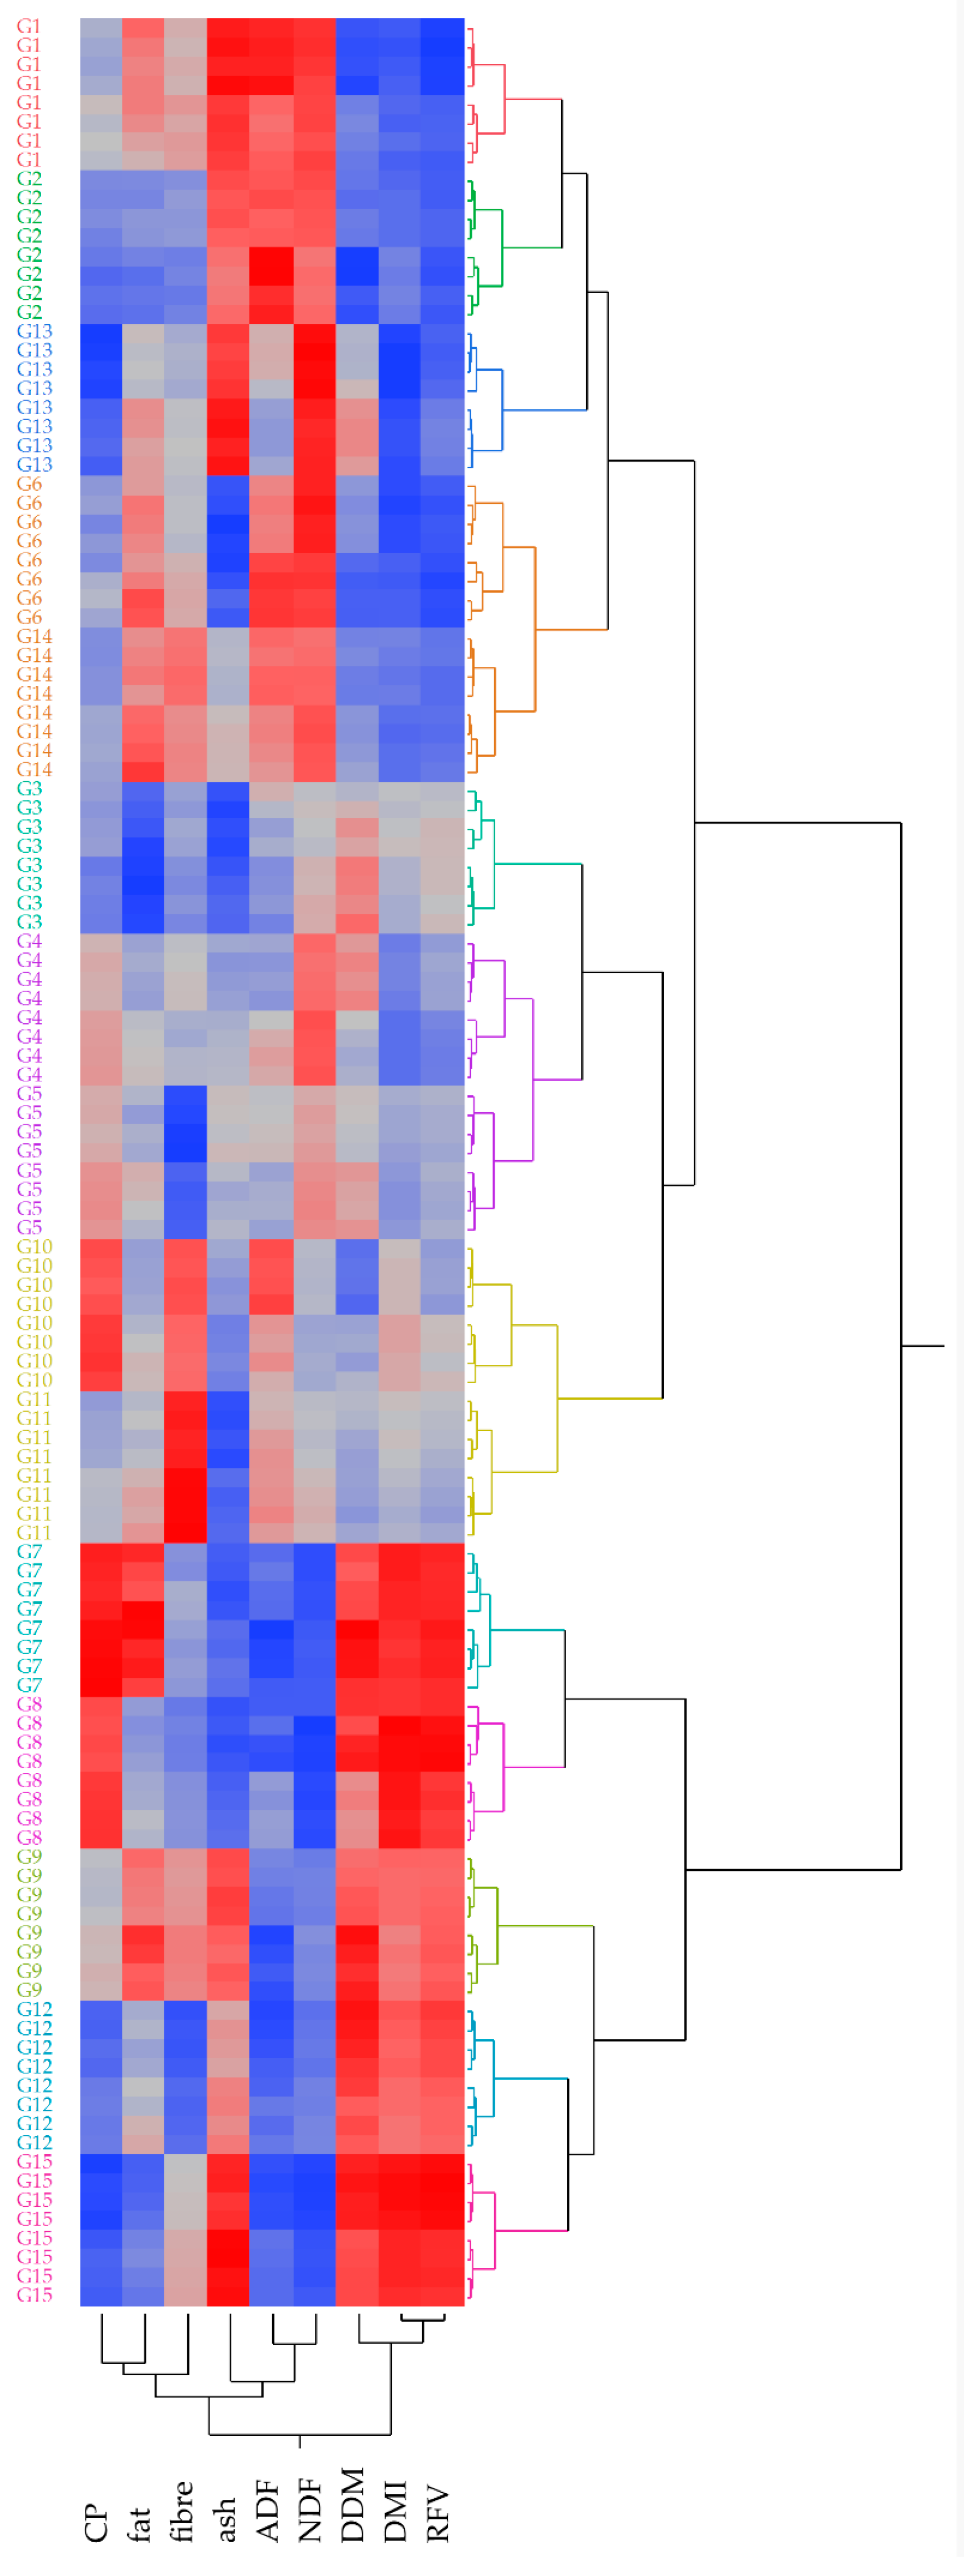
Figure 3 presents a hierarchical clustering heatmap illustrating the distribution of chemical composition traits and derived indices across clonal replicates of the 15 autochthonous Trifolium repens populations. The trait dendrogram shows that ADF and NDF cluster together, while DDM, DMI, and RFV form a separate cluster. CP, Ash, Fat, and FIBRE are grouped outside these clusters.
Clonal replicates within each population cluster closely. The population dendrogram shows separation among populations, forming distinct clusters based on chemical composition traits and derived indices. Two main population groups are observed at the upper hierarchical level.
Dendrochori (G7), Gorgogyri (G8), Fiki (G9), Xyloparoiko (G12), and Kefalopotamos (G15) are grouped together. Other populations form separate clusters with different multivariate profiles. The clustering pattern is consistent with patterns observed in the canonical discriminant analysis.

3.7. Correlation Analysis of Chemical Composition Traits and Derived Indices of Autochthonous Trifolium repens Populations

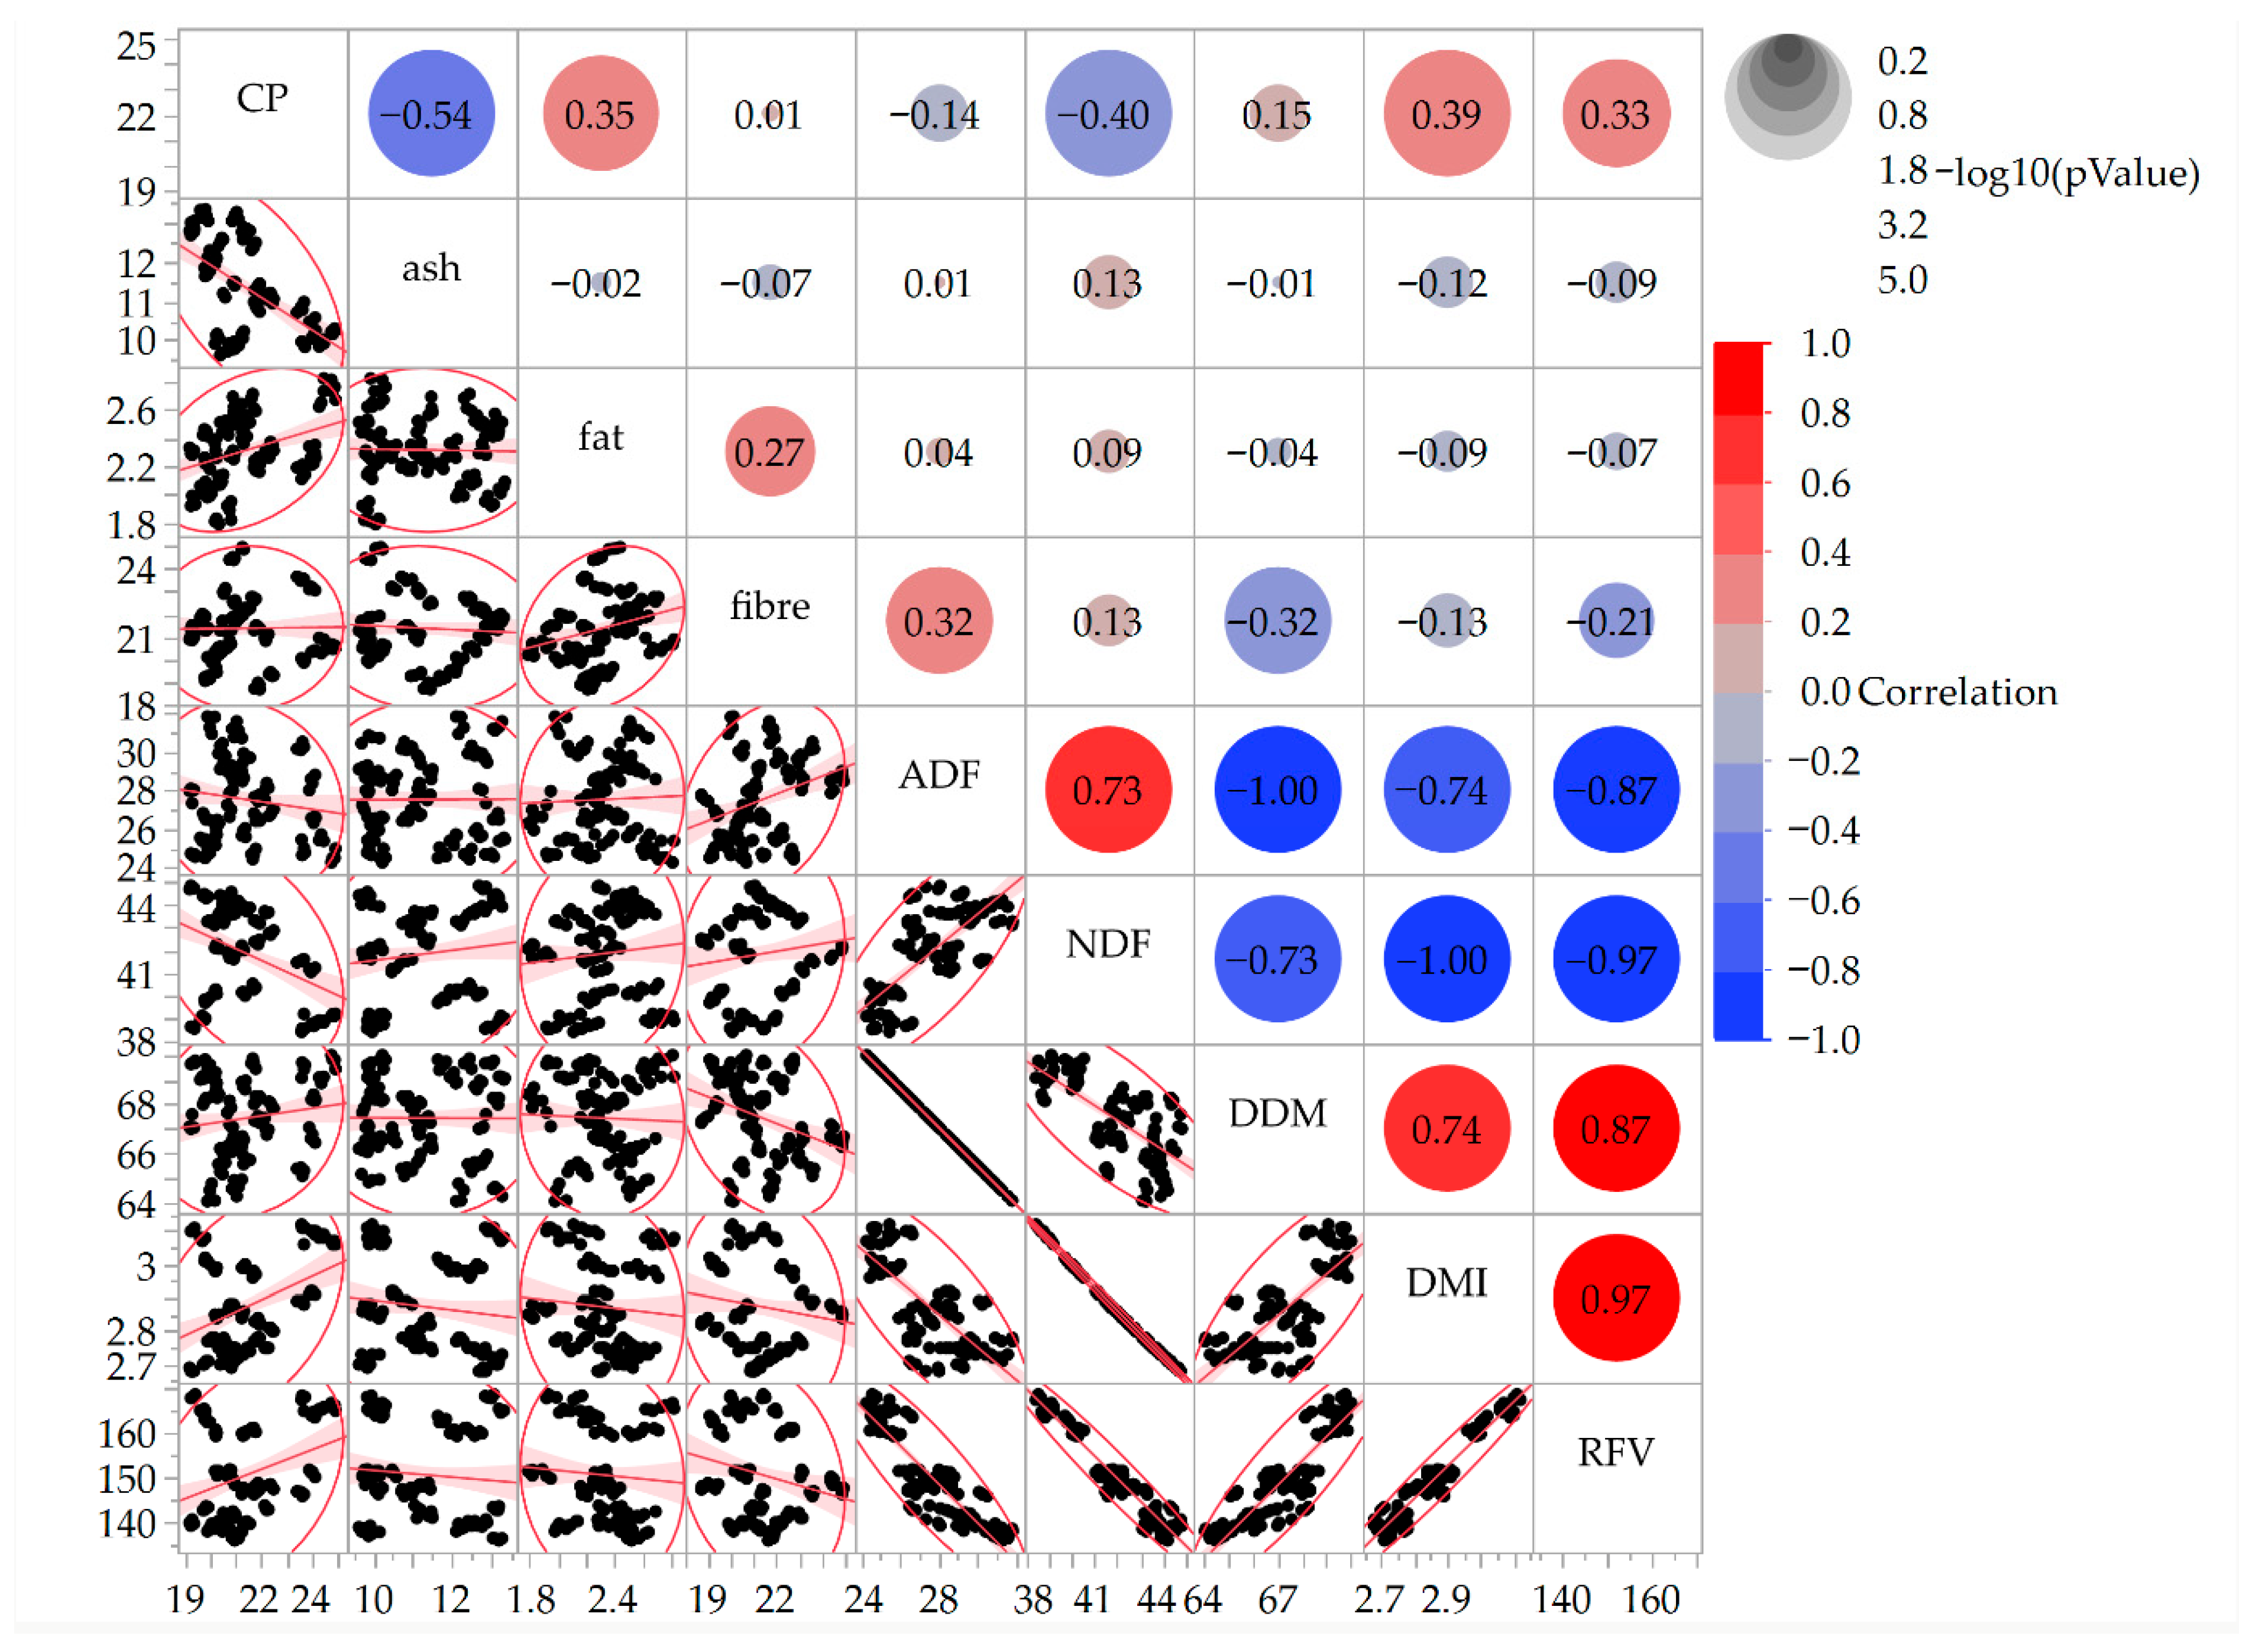
Correlation analysis among chemical composition traits and derived indices of autochthonous Trifolium repens populations revealed several significant relationships (p ≤ 0.05 and p ≤ 0.01) (Figure 4). CP showed a positive correlation with Fat (r = 0.35 **), DMI (r = 0.39 **), and RFV (r = 0.33 **), while it was negatively correlated with Ash (r = −0.54 **) (this negative association may reflect a dilution effect between nitrogen accumulation and mineral concentration in plant tissues) and NDF (r = −0.40 **) (this inverse relationship is consistent with the trade-off between nitrogen concentration and cell wall development during plant maturation). FIBRE was positively correlated with Fat (r = 0.27 **) and ADF (r = 0.32 **), and negatively correlated with DDM (r = −0.32 **) and RFV (r = −0.21 *).
ADF and NDF were positively correlated (r = 0.73 **), and both showed negative correlations with DDM (ADF: r = −1.00 **, NDF: r = −0.73 **) and RFV (ADF: r = −0.87 **, NDF: r = −0.97 **). DDM was positively correlated with DMI (r = 0.74 **) and RFV (r = 0.88 **), while DMI and RFV showed a strong positive correlation (r = 0.97 **).
The correlation between ADF and DDM (r = −1.00) reflects their mathematical relationship, as DDM is directly derived from ADF through a fixed linear equation. Therefore, this correlation is deterministic and does not indicate an independent biological association between traits.

4. Discussion

The present study provides a combined evaluation of chemical composition traits and derived nutritional indices, and stability parameters in autochthonous Trifolium repens populations originating from a Mediterranean environment, contributing to the limited available information on locally adapted germplasm. The significant variation observed among the 15 autochthonous Trifolium repens populations for all chemical composition and derived nutritional traits confirms the presence of substantial genetic diversity within local white clover germplasm. Such intra-specific variability is a well-recognized characteristic of white clover, particularly in populations originating from heterogeneous Mediterranean environments, where natural selection has favored diverse adaptive strategies. Previous studies have highlighted the value of landraces and natural populations of Trifolium species as reservoirs of useful genetic variation for chemical and nutritional composition, persistence, and stress adaptation [62,63]. This diversity is especially relevant for breeding programs targeting sustainable forage production, as genetic improvement in perennial forage legumes relies heavily on the exploitation of broad genetic resources rather than narrow elite pools [64]. Therefore, the variation detected in the present study provides a basis for the identification/selection of genotypes with enhanced chemical composition (CP, Ash, Fat, FIBRE, ADF, NDF) and derived nutritional performance (DDM, DMI, RFV).
The detection of a significant genotype × year (G × Y) interaction for most traits, despite the controlled cultivation conditions, indicates that year-to-year climatic variability contributed to the observed variation in population performance. Such responses are typical of forage legumes, which are known to exhibit strong phenotypic plasticity in relation to temperature and water availability. In Mediterranean and semi-arid environments, G × E interactions are often pronounced and represent a major constraint, but also an opportunity, for forage improvement [65,66]. Several studies have emphasized that adaptation to variable precipitation patterns and seasonal stress is a key breeding target for forage legumes under climate change scenarios [67]. The very high broad-sense heritability estimates observed may be partially attributed to the controlled pot conditions, which reduce environmental variability. Such estimates could be lower under field conditions, where environmental effects are stronger, and this should be considered when extrapolating results to practical breeding applications. The results of the present study therefore reinforce the necessity of multi-year evaluations to reliably identify populations that combine favorable chemical composition and derived nutritional indices with environmental robustness, particularly for Mediterranean agroecosystems characterized by increasing climatic unpredictability. From an applied perspective, the presence of significant G × Y interaction suggests that selection of promising populations should consider both performance and stability across years. In Mediterranean environments characterized by irregular rainfall and temperature variability, populations such as Dendrochori and Fiki that combine high nutritional performance with stability may represent more potential candidates for further evaluation for breeding and cultivation under climate variability.
The comparison of populations based on mean trait performance revealed clear differences in chemical composition and derived nutritional indices, with Dendrochori, and Gorgogyri consistently ranking among the best-performing populations. Although Kefalopotamos exhibited high DDM and RFV values, its relatively lower CP content compared with Dendrochori and Gorgogyri prevented it from being classified as a top-performing population, highlighting the importance of considering both protein content and fiber fractions when ranking populations for forage quality. This superiority is primarily associated with their combined expression of high CP content and reduced fibre fractions (ADF and NDF), which directly enhance digestibility (DDM) [25,68].
It should be noted that RFV is calculated solely from ADF and NDF and does not incorporate CP; therefore, RFV values may not reflect differences in crude protein among populations [69]. Such trait combinations suggest more efficient biomass allocation towards metabolically active tissues rather than structural components, resulting in improved forage quality [66,70]. Higher CP content is considered separately as an important indicator of nutritive value, while lower fibre fractions contribute to higher RFV and digestibility. The inverse relationship between fibre components (ADF and NDF) and digestibility is well established and underpins the use of RFV as a practical index for forage ranking [29,68]. Recent studies have further confirmed that nitrogen-related traits play a central role in driving RFV variation, supporting the patterns observed in the present study [71].
Although RFV has acknowledged limitations, particularly regarding ruminal degradation dynamics, it remains a useful comparative indicator when interpreted alongside individual chemical traits [30,72]. It should be emphasized that RFV is derived empirically from DDM and DMI formulas based on ADF and NDF, which were originally developed for other forage species and have not been validated specifically for Trifolium repens. Thus, these indices should be interpreted as derived nutritional indicators rather than direct biological measures. The observed variation among populations therefore has practical implications for selection, considering CP separately from fibre-derived digestibility indices, allowing identification of genotypes with distinct nutritional profiles.
Stability analyses provided additional insight into population performance across years. Populations such as Fiki and Dendrochori exhibited high Stability Index values for CP, DDM, and RFV, indicating they are less influenced by environmental fluctuations [28,73,74]. This stability is crucial for maintaining consistent chemical composition and derived nutritional indices under variable climatic conditions, and it may indicate a stronger genetic component under controlled conditions of these traits [75]. In contrast, populations with lower stability may be influenced by quantitative inheritance and multi-gene activity, requiring targeted management or being better suited to specific environments [66,75]. It should be noted that the study was conducted under pot conditions over two consecutive years, which may not fully capture the range of field variability. Additionally, the relatively short duration of the experiment may limit the assessment of long-term performance in natural environments.
Furthermore, canonical and discriminant analyses confirmed that the 15 populations have distinct chemical and nutritional profiles (based on measured traits and derived indices) that remain consistent across replicates and are with limited influence of environmental variation under the studied conditions. A reduced set of traits—CP, Ash, FIBRE, DDM, and RFV—was sufficient to clearly separate the populations. The canonical plot also highlighted groups of populations with similar profiles (e.g., Dendrochori ≈ Gorgogyri, Exalofos ≈ Eleftherochori, Pialeia ≈ Filyra), reinforcing the identification of populations with both high chemical composition and derived nutritional performance and stability suitable for Mediterranean breeding programs.
Correlation analyses among traits showed patterns consistent with physiological expectations. CP was negatively correlated with fibre fractions (ADF and NDF) and positively associated with DDM and RFV, indicating that selection for higher protein content may improve digestibility. The negative association between fibre fractions (ADF and NDF) and digestibility-related traits can be attributed to cell wall lignification, which reduces microbial degradation in the rumen [76]. Conversely, higher CP content is generally associated with improved digestibility and intake, as protein-rich tissues are less structurally complex and more readily degraded. The strong negative correlation between NDF and DMI emphasizes the importance of fibre composition in voluntary intake [28,77,78,79]. Overall, these relationships confirm that increasing CP while reducing fibre fractions (ADF, NDF, FIBRE) can enhance derived nutritional performance indicators.
Broad-sense heritability estimates were generally high for most traits, including CP, Ash, Fat, FIBRE, and RFV, indicating that genetic factors largely control the observed variation. This suggests that these traits may be effectively improved through selection under the conditions studied in breeding programs. Traits such as ADF and DDM showed slightly lower heritability, reflecting a combination of genetic control and environmental influence. The relatively lower heritability of ADF and DDM may be attributed to their strong dependence on cell wall composition and lignification processes, which are highly influenced by environmental factors such as temperature and water availability [25,68,70]. Consequently, these traits are more sensitive to environmental fluctuations compared with protein-related traits (CP), which are more directly regulated by genetic factors. Overall, the heritability results support the effectiveness of selecting superior populations for both high chemical composition and derived nutritional indices, as well as stability [70,80,81,82,83]. Stability is generally higher for traits with simpler genetic control, whereas quantitative traits are more strongly affected by environmental variation [84,85,86,87,88,89,90,91].
In conclusion, the integration of chemical composition traits, derived nutritional indices, and multivariate statistical approaches provides useful insight into the characterization and selection of autochthonous Trifolium repens populations in Mediterranean environments. This combined approach allows the identification of populations with distinct and consistent profiles, supporting their potential use in targeted breeding programs aimed at improving key chemical composition and derived nutritional traits.
It should be noted that the present study was conducted under pot conditions, which do not fully represent field environments. Biomass yield and agronomic productivity traits were not assessed, as the objective was to focus on chemical composition and derived nutritional indices under controlled conditions. Restricted root development, absence of inter-plant competition, and reduced environmental variability may have influenced trait expression and contributed to lower environmental variance. Consequently, the high broad-sense heritability estimates observed may be partially overestimated compared with field conditions. In addition, the two-year experimental period may not fully capture long-term climatic variability typical of Mediterranean agroecosystems. Therefore, multi-location and multi-year field trials are required to validate the performance and stability of the identified populations under realistic agronomic conditions.

5. Conclusions

In summary, significant variation was observed among the studied populations for all compositional traits. High heritability values suggest strong genetic control under the applied conditions, while stability analysis identified populations with consistent performance across years. Populations such as Dendrochori and Gorgogyri consistently exhibited favorable chemical and nutritional profiles, while Fiki and Dendrochori demonstrated the highest stability across years.
Correlation patterns among traits indicated that higher CP and lower fibre fractions (ADF, NDF) are associated with improved digestibility-related indices and RFV, highlighting key relationships that can guide selection based on chemical composition and derived nutritional indices. Moreover, a reduced trait set (CP, Ash, FIBRE, and RFV) was sufficient to accurately classify populations, providing a practical tool for differentiation among genotypes based on trait combinations.
These findings provide a basis for the identification of promising genetic material based on chemical composition and derived nutritional indices; however, further validation under field conditions is required before practical breeding application. Overall, the identified populations with favorable trait combinations and temporal stability represent valuable genetic resources for future breeding-related studies based on chemical composition traits and derived indices in Mediterranean agroecosystems.

Supplementary Materials

The following supporting information can be downloaded at: https://www.mdpi.com/article/10.3390/app16094207/s1, Table S1: Canonical results for genotype effect. Eigenvalues and Canonical Correlations; Table S2: Multivariate Tests for genotype effect; Table S3: Standardized Scoring Coefficients of Discriminant Analysis.

Author Contributions

Conceptualization, V.G.; methodology, V.G.; investigation, V.G., E.B., C.G.I. and D.K.; statistical analysis, A.S. and V.G.; writing—original draft preparation, V.G., E.B. and C.G.I.; writing—review and editing, V.G., E.B. and A.S.; visualization, A.S. and V.G.; supervision, V.G.; project administration, V.G. All authors have read and agreed to the published version of the manuscript.

Funding

This research received no external funding.

Institutional Review Board Statement

Not applicable.

Informed Consent Statement

Not applicable.

Data Availability Statement

The original contributions presented in this study are included in the article. Further inquiries can be directed to the corresponding author.

Acknowledgments

The authors gratefully acknowledge the support of the Ministry of Environment and Energy for permitting the collection of autochthonous Trifolium repens populations in the Trikala region, Greece.

Conflicts of Interest

The authors declare no conflicts of interest.

References

  1. Frame, J.; Newbould, P. Agronomy of white clover. In Advances in Agronomy; Elsevier: Amsterdam, The Netherlands, 1986; Volume 40, pp. 1–88. [Google Scholar]
  2. Williams, W.M. Adaptive variation. In White Clover; Baker, M.J., Williams, W.M., Eds.; CAB International: Wallingford, UK, 1987; pp. 299–321. [Google Scholar]
  3. Rysiak, A.; Chabot, W.; Sawicka-Zugaj, W.; Zdulski, J.; Grzywaczewski, G.; Kulik, M. Comparative impacts of grazing and mowing on the floristics of grasslands in the buffer zone of Polesie National Park, eastern Poland. Glob. Ecol. Conserv. 2021, 27, e01612. [Google Scholar] [CrossRef]
  4. Norton, M.R.; Li, G.D.; Xu, B.; Price, A.; Tyndall, P.; Hayes, R.C. Differences in dehydration tolerance affect survival of white clover (Trifolium repens) and alfalfa (Medicago sativa) during a drying cycle. Crop Pasture Sci. 2021, 72, 723–730. [Google Scholar] [CrossRef]
  5. Chu, L.; Gao, Y.; Chen, L.; McCullough, P.E.; Jespersen, D.; Sapkota, S.; Bagavathiannan, M.; Yu, J. Impact of Environmental Factors on Seed Germination and Seedling Emergence of White Clover (Trifolium repens L.). Agronomy 2022, 12, 190. [Google Scholar] [CrossRef]
  6. Thomson, D.J. The role of legumes in improving the quality of forage diets. In Proceedings of the International Meeting on Animal Production from Temperate Grasslands; Taluntais: Wexford, Ireland; An Foras: Dublin, Ireland, 1977; pp. 131–135. [Google Scholar]
  7. Thomson, D.J. Effect of the proportion of legumes in the sward on animal output. In Changes in Sward Composition and Productivity; Charles, A.H., Haggar, R.J., Eds.; Occasional Symposium No. 10; British Grassland Society: Reading, UK, 1979; pp. 101–109. [Google Scholar]
  8. Ulyatt, T.M.H. The feeding value of temperate pasture. In Grazing Animals; Morley, F.H.W., Ed.; Elsevier Scientific Publishing Company: Amsterdam, The Netherlands, 1980; pp. 125–141. [Google Scholar]
  9. Wilkins, R.; Munro, H. The prospects for livestock production from white clover. In Science and Change in Agriculture; Hardcastle, J., Ed.; Agricultural and Food Research Council: London, UK, 1988; pp. 12–13. [Google Scholar]
  10. Lloyd Davies, H. Studies in production of weaned Merino lambs in relation to pasture species during their first summer in southern Australia. In Proceedings of the Sixteenth International Grassland Congress, Nice, France, 4–11 October 1989; pp. 1249–1250. [Google Scholar]
  11. Rogers, G.L.; Porter, R.H.O.; Robinson, I. Comparison of perennial ryegrass and white clover for milk production. In Proceedings of the Conference on Dairy Production Research organized by the New Zealand and Australian Societies of Animal Production, Hamilton, New Zealand, 2–5 February 1982. [Google Scholar]
  12. Thomson, D.J. The nutritive value of white clover. In Forage Legumes; Thomson, D.J., Ed.; Occasional Symposium No. 16; British Grassland Society: Reading, UK, 1984; pp. 78–92. [Google Scholar]
  13. Thomson, D.J.; Beever, D.E.; Haines, M.J.; Cammell, S.B.L.; Evans, R.T.; Dhanoa, M.S.; Austin, A.R. Yield and composition of milk from Friesian cows grazing either perennial ryegrass or white clover in lactation. J. Dairy Res. 1985, 52, 17–31. [Google Scholar] [CrossRef]
  14. Irisarri, P.; Cardozo, G.; Tartaglia, C.; Reyno, R.; Gutiérrez, P.; Lattanzi, F.A.; Rebuffo, M.; Monza, J. Selection of Competitive and Efficient Rhizobia Strains for White Clover. Front. Microbiol. 2019, 10, 768. [Google Scholar] [CrossRef]
  15. Thilakarathna, M.S.; Papadopoulos, Y.A.; Rodd, A.V.; Grimmett, M.; Fillmore, S.A.E.; Crouse, M.; Prithiviraj, B. Nitrogen fixation and transfer of red clover genotypes under legume–grass forage based production systems. Nutr. Cycl. Agroecosystems 2016, 106, 233–247. [Google Scholar] [CrossRef]
  16. Boller, B.C.; Nösberger, J. Symbiotically fixed nitrogen from field-grown white and red clover mixed with ryegrasses at low levels of 15N-fertilization. Plant Soil 1987, 104, 219–226. [Google Scholar] [CrossRef]
  17. Sawicka, B.; Krochmal-Marczak, B.; Sawicki, J.; Skiba, D.; Pszczółkowski, P.; Barbaś, P.; Vambol, V.; Messaoudi, M.; Farhan, A.K. White Clover (Trifolium repens L.) Cultivation as a Means of Soil Regeneration and Pursuit of a Sustainable Food System Model. Land 2023, 12, 838. [Google Scholar] [CrossRef]
  18. Potter, D.A.; Redmond, C.T.; McNamara, T.D.; Munshaw, G.C. Dwarf White Clover Supports Pollinators, Augments Nitrogen in Clover–Turfgrass Lawns, and Suppresses Root-Feeding Grubs in Monoculture but Not in Mixed Swards. Sustainability 2021, 13, 11801. [Google Scholar] [CrossRef]
  19. Van Eekeren, N.; Van Liere, D.; De Vries, F.; Rutgers, M.; De Goede, R.; Brussaard, L. A mixture of grass and clover combines the positive effects of both plant species on selected soil biota. Appl. Soil Ecol. 2009, 42, 254–263. [Google Scholar] [CrossRef]
  20. Ogle, D.; St John, L. Plant Guide—White Clover (Trifolium repens L.); USDA–Natural Resources Conservation Service: Pullman, WA, USA; Idaho Plant Materials Center: West Aberdeen, ID, USA, 2008. Available online: https://plants.usda.gov/DocumentLibrary/plantguide/pdf/pg_trre3.pdf (accessed on 24 January 2026).
  21. Enriquez-Hidalgo, D.; Gilliland, T.J.; Hennessy, D. Herbage and nitrogen yields, fixation and transfer by white clover to companion grasses in grazed swards under different rates of nitrogen fertilization. Grass Forage Sci. 2016, 71, 559–574. [Google Scholar] [CrossRef]
  22. Thers, H.; Jensen, J.L.; Rasmussen, J.; Eriksen, J. Grass–clover response to cattle slurry N-rates: Yield, clover proportion, protein concentration and estimated N2-fixation. Field Crops Res. 2022, 287, 108675. [Google Scholar] [CrossRef]
  23. Warda, M.; Stamirowska-Krzaczek, E. Persistency of Poa pratensis in long-term pasture sward on peat-muck soil. Pol. J. Environ. Stud. 2009, 18, 977–981. [Google Scholar]
  24. Buxton, D.R.; Casler, M.D. Environmental and genetic effects on cell wall composition and digestibility. In Forage Cell Wall Structure and Digestibility; Jung, H.G., Buxton, D.R., Hatfield, R.D., Ralphs, J., Eds.; American Society of Agronomy: Madison, WI, USA, 1993; pp. 685–714. [Google Scholar]
  25. Van Soest, P.J. Nutritional Ecology of the Ruminant, 2nd ed.; Cornell University Press: Ithaca, NY, USA, 1994. [Google Scholar]
  26. Stojanović, B.; Grubić, G.; Đorđević, N.; Božičković, A.; Ivetić, A. Supplementary feeding of grazing dairy cows. In Proceedings of the International Symposium on Animal Science 2014 (ISAS), Belgrade, Serbia, 23–25 September 2014; pp. 265–271. [Google Scholar]
  27. Ball, D.M.; Collins, M.; Lacefield, G.D.; Martin, N.P.; Mertens, D.A.; Olson, K.E.; Putnam, D.H.; Undersander, D.J.; Wolf, M.W. Understanding Forage Quality; Publication 1-01; American Farm Bureau Federation: Park Ridge, IL, USA, 2001. [Google Scholar]
  28. Greveniotis, V.; Bouloumpasi, E.; Skendi, A.; Korkovelos, A.; Kantas, D.; Ipsilandis, C.G. Evaluation and Stability of Red and White Trifolium Species for Nutritional Quality in a Mediterranean Environment. Agriculture 2025, 15, 391. [Google Scholar] [CrossRef]
  29. Rohweder, D.A.; Barnes, R.E.; Jorgensen, N. Proposed hay grading standards based on laboratory analysis for evaluating quality. J. Anim. Sci. 1978, 47, 747–759. [Google Scholar] [CrossRef]
  30. Hackmann, T.J.; Sampson, J.D.; Spain, J.N. Comparing relative feed value with degradation parameters of grass and legume forages. J. Anim. Sci. 2008, 86, 2344–2356. [Google Scholar] [CrossRef]
  31. Cacan, E.; Ozdemir, S.; Kokten, K.; Ucar, R.; Mokhtarzadeh, S.; Ekmekci, M.; Kutlu, M.A. Change of forage yield and quality characteristics of white clover (Trifolium repens L.) at different harvest time. J. Tekirdag Agric. Fac. 2024, 21, 1099–1111. [Google Scholar]
  32. Nichols, P.G.; Norton, M. Improvement of pasture and forage legumes and grasses for Mediterranean climate zones. Options Méditerr. Sér. A. Ecosyst. Serv. Socio-Econ. Benefits Mediterr. Grassl. 2016, 114, 157–168. [Google Scholar]
  33. Hofmann, M.; Isselstein, J. Species enrichment in an agriculturally improved grassland and its effects on botanical composition, yield and forage quality. Grass Forage Sci. 2005, 60, 136–145. [Google Scholar] [CrossRef]
  34. Lüscher, A.; Barkaoui, K.; Finn, J.A.; Suter, D.; Suter, M.; Volaire, F. Using plant diversity to reduce vulnerability and increase drought resilience of permanent and sown productive grasslands. Grass Forage Sci. 2022, 77, 235–246. [Google Scholar] [CrossRef]
  35. Karayilanli, E.; Ayhan, V. Investigation of feed value of alfalfa (Medicago sativa L.) harvested at different maturity stages. Legume Res. 2016, 39, 237–247. [Google Scholar] [CrossRef]
  36. Evers, G.W. Forage legumes: Forage quality, fixed nitrogen, or both. Crop Sci. 2011, 51, 403–409. [Google Scholar] [CrossRef]
  37. Brink, G.E.; Fairbrother, T.E. Forage quality and morphological components of diverse clovers during primary spring growth. Crop Sci. 1992, 32, 1043–1048. [Google Scholar] [CrossRef]
  38. Rocateli, A.; Zhang, H. Forage Quality Interpretations; Soil, Water & Forage Analytical Laboratory, Oklahoma State University: Stillwater, OK, USA, 2017; Available online: https://extension.okstate.edu/fact-sheets/forage-quality-interpretations.html (accessed on 24 January 2026).
  39. Fulgueira, C.L.; Amigot, S.L.; Gaggiotti, M.; Romero, L.A.; Basílico, J.C. Forage Quality: Techniques for Testing. Fresh Prod. Glob. Sci. Books 2007, 1, 121–131. [Google Scholar]
  40. Van Dyke, N.J.; Anderson, P.M. Interpreting a Forage Analysis; Circular ANR-890; Alabama Cooperative Extension: Auburn, AL, USA, 2000. [Google Scholar]
  41. Ertekin, İ. Comparison of chemical composition and nutritive values of some clover species. Int. J. Chem. Technol. 2021, 5, 162–166. [Google Scholar] [CrossRef]
  42. Poorter, H.; Niklas, K.J.; Reich, P.B.; Oleksyn, J.; Poot, P.; Mommer, L. Biomass allocation to leaves, stems and roots: Meta-analyses of interspecific variation and environmental control. New Phytol. 2012, 193, 30–50. [Google Scholar] [CrossRef]
  43. Carlsson, G.; Huss-Danell, K. Nitrogen fixation in perennial forage legumes in the field. Plant Soil 2003, 253, 353–372. [Google Scholar] [CrossRef]
  44. Allen, R.G.; Pereira, L.S.; Raes, D.; Smith, M. Crop Evapotranspiration—Guidelines for Computing Crop Water Requirements—FAO Irrigation and Drainage Paper 56. Irrig. Drain. 1998, 300, D05109. [Google Scholar]
  45. Tucak, M.; Ravlić, M.; Horvat, D.; Cupić, T. Improvement of forage nutritive quality of alfalfa and red clover through plant breeding. Agronomy 2021, 11, 2176. [Google Scholar] [CrossRef]
  46. Ayres, J.F.; Nandra, K.S.; Turner, A.D. A Study of the Nutritive Value of White Clover (Trifolium repens L.) in Relation to Different Stages of Phenological Maturity in the Primary Growth Phase in Spring. Grass Forage Sci. 1998, 53, 250–259. [Google Scholar] [CrossRef]
  47. Association of Official Analytical Chemists (AOAC). Official Methods of Analysis of the Association of Official Analytical Chemists, 21st ed.; Oxford University Press: Washington, DC, USA, 2019. [Google Scholar]
  48. Association of Official Analytical Chemists (AOAC). Official Methods of Analysis, 18th ed.; Association of Official Analytical Chemists (AOAC): Gaithersburg, MD, USA, 2005. [Google Scholar]
  49. Van Soest, P.J.; Robertson, J.B.; Lewis, B.A. Methods for Dietary Fiber, Neutral Detergent Fiber, and Nonstarch Polysaccharides in Relation to Animal Nutrition. J. Dairy Sci. 1991, 7, 3583–3597. [Google Scholar] [CrossRef]
  50. Schroeder, J.W. Interpreting Forage Analysis; Extension Dairy Specialist (NDSU), AS-1080; North Dakota State University: Fargo, ND, USA, 1994; Available online: https://library.ndsu.edu/server/api/core/bitstreams/16e03cb3-623e-4cb2-abac-a9e8d5896fca/content (accessed on 14 February 2026).
  51. Reiné, R.; Ascaso, J.; Barrantes, O. Nutritional quality of plant species in pyrenean hay Meadows of high diversity. Agronomy 2020, 10, 883. [Google Scholar] [CrossRef]
  52. Linn, J.G.; Martin, N.P. Forage Quality Tests and Interpretations (Revised 1989); University of Minnesota, Agricultural Extension Service: Stillwater, MN, USA, 1989; Available online: https://conservancy.umn.edu/bitstreams/8ac6e7dc-4bb0-4d5f-881f-8ff20d04a5e3/download (accessed on 14 February 2026).
  53. Nunes, H.P.B.; Teixeira, S.; Maduro Dias, C.S.A.M.; Borba, A.E.S. Alternative Forages as Roughage for Ruminant: Nutritional Characteristics and Digestibility of Six Exotic Plants in Azores Archipelago. Animals 2022, 12, 3587. [Google Scholar] [CrossRef]
  54. Dewhurst, R.J.; Delaby, L.; Moloney, A.; Boland, T.; Lewis, E. Nutritive value of forage legumes used for grazing and silage. Ir. J. Agric. Food Res. 2009, 48, 167–187. [Google Scholar]
  55. Vásquez, H.V.; Valqui, L.; Valqui-Valqui, L.; Bobadilla, L.G.; Reyna, M.; Maravi, C.; Pajares, N.; Altamirano-Tantalean, M.A. Influence of Nitrogen Fertilization and Cutting Dynamics on the Yield and Nutritional Composition of White Clover (Trifolium repens L.). Plants 2025, 14, 2765. [Google Scholar] [CrossRef]
  56. Steel, R.G.D.; Torrie, H.; Dickey, D.A. Principles and Procedures of Statistics. A Biometrical Approach, 3rd ed.; McGraw-Hill: New York, NY, USA, 1997; p. 666. [Google Scholar]
  57. McIntosh, M.S. Analysis of Combined Experiments. Agron. J. 1983, 75, 153–155. [Google Scholar] [CrossRef]
  58. Johnson, H.W.; Robinson, H.E.; Comstock, R.E. Estimate of genetic and environmental variability in soybean. Agron. J. 1955, 47, 314–318. [Google Scholar] [CrossRef]
  59. Hanson, G.; Robinson, H.F.; Comstock, R.E. Biometrical studies on yield in segregating population of Korean Lespedeza. Agron. J. 1956, 48, 268–274. [Google Scholar] [CrossRef]
  60. Singh, R.K.; Chaudhary, B.D. Biometrical Methods in Quantitative Genetic Analysis; Kalyani Publishers: New Delhi, India, 1977; p. 304. [Google Scholar]
  61. Fasoula, V.A. Prognostic breeding: A new paradigm for crop improvement. Plant Breed. Rev. 2013, 37, 297–347. [Google Scholar]
  62. Abberton, M.T.; Thomas, I. Genetic resources in Trifolium and their utilization in plant breeding. Plant Genet. Resour. Charact. Util. 2011, 9, 38–44. [Google Scholar] [CrossRef]
  63. Annicchiarico, P.; Barrett, B.; Brummer, E.C.; Julier, B.; Marshall, A.H. Achievements and Challenges in Improving Temperate Perennial Forage Legumes. Crit. Rev. Plant Sci. 2015, 34, 327–380. [Google Scholar] [CrossRef]
  64. Abberton, M.T.; Marshall, A.H. Progress in breeding perennial clovers for temperate agriculture. J. Agric. Sci. 2005, 143, 117–135. [Google Scholar] [CrossRef]
  65. Annicchiarico, P.; Thami Alami, I.; Abbas, K.; Pecetti, L.; Melis, R.A.M.; Porqueddu, C. Performance of legume-based annual forage crops in three semi-arid Mediterranean environments. Crop Pasture Sci. 2017, 68, 932–941. [Google Scholar] [CrossRef]
  66. Lüscher, A.; Mueller-Harvey, I.; Soussana, J.F.; Rees, R.M.; Peyraud, J.L. Potential of legume-based grassland–livestock systems in Europe: A review. Grass Forage Sci. 2014, 69, 206–228. [Google Scholar] [CrossRef] [PubMed]
  67. Rognli, O.A.; Pecetti, L.; Kovi, M.R.; Annicchiarico, P. Grass and Legume Breeding Matching the Future Needs of European Grassland Farming. Grass Forage Sci. 2021, 76, 175–185. [Google Scholar] [CrossRef]
  68. McDonald, P.; Edwards, R.A.; Greenhalgh, J.F.D.; Morgan, C.A.; Sinclair, L.A.; Wilkinson, R.G. Animal Nutrition, 7th ed.; Pearson Education: Harlow, UK, 2010; p. 712. [Google Scholar]
  69. Moore, J.E.; Undersander, D. Relative Forage Quality: An Alternative to Relative Feed Value and Quality Index. In Proceedings of the 13th Annual Florida Ruminant Nutrition Symposium, Gainesville, FL, USA, 11–12 January 2002; pp. 16–32. [Google Scholar]
  70. Mertens, D.R. Creating a system for meeting the fiber requirements of dairy cows. J. Dairy Sci. 1997, 80, 1463–1481. [Google Scholar] [CrossRef] [PubMed]
  71. Çeliktaş, N.; Can, E.; Kaya, S.; Hatipoğlu, R.; Ertekin, İ.; Atis, I. New Multivariate Empirical Prediction Equation for Relative Feed Value of Native Grasses. Appl. Ecol. Environ. Res. 2020, 18, 5049–5063. [Google Scholar] [CrossRef]
  72. Tassone, S.; Mabrouki, S.; Barbera, S.; Glorio Patrucco, S. Laboratory Analyses Used to Define the Nutritional Parameters and Quality Indexes of Some Unusual Forages. Animals 2022, 12, 2320. [Google Scholar] [CrossRef]
  73. Greveniotis, V.; Bouloumpasi, E.; Skendi, A.; Korkovelos, A.; Kantas, D.; Ipsilandis, C.G. Stability of Forage Quality Traits in Artificial Meadows Across Greek Environments. Agriculture 2025, 15, 2595. [Google Scholar] [CrossRef]
  74. Nölke, I.; Komainda, M.; Tonn, B.; Feuerstein, U.; Isselstein, J. Including chicory and selecting white clover varieties as strategies to improve temporal stability of forage yield and quality in white-clover-based temporary grassland. Eur. J. Agron. 2021, 130, 126362. [Google Scholar] [CrossRef]
  75. Fasoulas, A.C. The Honeycomb Methodology of Plant Breeding; Department of Genetics and Plant Breeding, Aristotle University of Thessaloniki: Thessaloniki, Greece, 1988; p. 168. [Google Scholar]
  76. Jung, H.G.; Allen, M.S. Characteristics of plant cell walls affecting intake and digestibility of forages by ruminants. J. Anim. Sci. 1995, 73, 2774–2790. [Google Scholar] [CrossRef]
  77. Petkova, M.; Bozhanska, T.; Iliev, M.; Hristova, D. Correlation and Regression Dependences between Productivity, Composition and Energy-Nutritive Value of Grasslands of Perennial Ryegrass and Legume Fodder Crop. Sci. Papers. Ser. A. Agron. 2024, LXVII, 617–625. [Google Scholar]
  78. Lee, M.A. A Global Comparison of the Nutritive Values of Forage Plants Grown in Contrasting Environments. J. Plant Res. 2018, 131, 641–654. [Google Scholar] [CrossRef]
  79. Vasileva, V.; Naydenova, Y.; Stoycheva, I. Nutritive value of forage biomass from sainfoin mixtures. Saudi J. Biol. Sci. 2019, 26, 942–949. [Google Scholar] [CrossRef]
  80. Gesteiro, N.; Malvar, R.A.; Butrón, A.; Holland, J.B.; López-Malvar, A.; Pereira-Crespo, S.; Revilla, P.; Santiago, R. GWAS and Genomic Prediction: Breeding Strategies for Maize Stover Digestibility. J. Agric. Food Res. 2025, 23, 102296. [Google Scholar] [CrossRef]
  81. De Zutter, A.; Piro, M.C.; Maenhout, S.; Maurer, H.P.; De Boever, J.; Muylle, H.; Roldán-Ruiz, I.; Haesaert, G. Genome-Wide Association Study for In Vitro Digestibility and Related Traits in Triticale Forage. BMC Plant Biol. 2024, 24, 223. [Google Scholar] [CrossRef]
  82. Kosev, V.; Naydenova, Y. Heritability of Qualitative Traits in Forage Pea (Pisum sativum L.). OnLine J. Biol. Sci. 2015, 15, 274–281. [Google Scholar] [CrossRef]
  83. Mortenson, J.S.; Waldron, B.L.; Larson, S.R.; Jensen, K.B.; DeHaan, L.R.; Peel, M.D.; Johnson, P.G.; Creech, J.E. Quantitative Trait Loci (QTL) for Forage Traits in Intermediate Wheatgrass When Grown as Spaced-Plants versus Monoculture and Polyculture Swards. Agronomy 2019, 9, 580. [Google Scholar] [CrossRef]
  84. Greveniotis, V.; Bouloumpasi, E.; Skendi, A.; Zotis, S.; Kantas, D.; Ipsilandis, C.G. Genetic Control, Stability, and Multivariate Analysis of Wheat Seed Quality Traits in Elite Pure Lines Under Mediterranean Environments. Agriculture 2026, 16, 444. [Google Scholar] [CrossRef]
  85. Greveniotis, V.; Bouloumpasi, E.; Skendi, A.; Zotis, S.; Kantas, D.; Ipsilandis, C.G. Grain Quality and Stability of Advanced Barley Lines and Local Landraces in Mediterranean Conditions. Agriculture 2026, 16, 366. [Google Scholar] [CrossRef]
  86. Greveniotis, V.; Bouloumpasi, E.; Skendi, A.; Kantas, D.; Ipsilandis, C.G. Evaluating Wheat Seed Quality: Performance, Stability, and Genetic Control Across Six Greek Environments Using Multiple Selection Designs. Agriculture 2026, 16, 476. [Google Scholar] [CrossRef]
  87. Greveniotis, V.; Bouloumpasi, E.; Skendi, A.; Korkovelos, A.; Kantas, D.; Zotis, S.; Ipsilandis, C.G. Modeling Stability of Alfalfa Yield and Main Quality Traits. Agriculture 2024, 14, 542. [Google Scholar] [CrossRef]
  88. Greveniotis, V.; Bouloumpasi, E.; Zotis, S.; Korkovelos, A.; Kantas, D.; Ipsilandis, C.G. Genotype-by-Environment Interaction Analysis for Quantity and Quality Traits in Faba Beans Using AMMI, GGE Models, and Stability Indices. Plants 2023, 12, 3769. [Google Scholar] [CrossRef] [PubMed]
  89. Greveniotis, V.; Sioki, E.; Ipsilandis, C.G. Estimations of fiber trait stability and type of inheritance in cotton. Czech J. Genet. Plant Breed. 2018, 54, 190–192. [Google Scholar] [CrossRef]
  90. Greveniotis, V.; Bouloumpasi, E.; Zotis, S.; Korkovelos, A.; Ipsilandis, C.G. Assessment of Interactions between Yield Components of Common Vetch Cultivars in Both Conventional and Low-Input Cultivation Systems. Agriculture 2021, 11, 369. [Google Scholar] [CrossRef]
  91. Greveniotis, V.; Bouloumpasi, E.; Zotis, S.; Korkovelos, A.; Kantas, D.; Ipsilandis, C.G. Stability Dynamics of Main Qualitative Traits in Maize Cultivations across Diverse Environments regarding Soil Characteristics and Climate. Agriculture 2023, 13, 1033. [Google Scholar] [CrossRef]
Figure 1. Daily maximum and minimum temperatures (°C) and monthly total rainfall (mm) recorded during the 2024 and 2025 experiments, providing a climatic context for plant growth. The left Y-axis represents temperature, and the right Y-axis represents rainfall.
Applsci 16 04207 g001
Figure 2. Canonical plot showing the discrimination of the 15 autochthonous Trifolium repens populations based on key chemical composition traits and derived nutritional indices (CP, Ash, Fibre, DDM, RFV). Population codes are as follows: G1 = Pialeia, G2 = Filyra, G3 = Exalofos, G4 = Eleftherochori, G5 = Kato Rachi (Neromylos), G6 = Dilofos, G7 = Dendrochori, G8 = Gorgogyri, G9 = Fiki, G10 = Matsoukeika, G11 = Pinakas Koziakas, G12 = Xyloparoiko, G13 = Prodromos, G14 = Valtino, G15 = Kefalopotamos.
Applsci 16 04207 g002
Figure 3. Hierarchical clustering heatmap of 15 autochthonous Trifolium repens populations showing chemical composition traits and derived indices.
Applsci 16 04207 g003
Figure 4. Correlation matrix of chemical composition traits and derived indices in autochthonous Trifolium repens populations. The upper triangle of the matrix shows Pearson correlation coefficients for each pair of traits, indicating the strength and direction of the relationships. The lower triangle displays scatterplots with fitted regression lines and 95% confidence ellipses, highlighting trends, clustering, and the variability among populations.
Applsci 16 04207 g004
Table 1. Collection sites and dates of autochthonous Trifolium repens populations in the Trikala region.
IDGenusSpeciesMaterial Ex SituCollection DatePrefectureLocation
G1TrifoliumT. repensplants22 February 2023TrikalaPialeia
G2TrifoliumT. repensplants20 March 2023TrikalaFilyra
G3TrifoliumT. repensplants14 March 2023TrikalaExalofos
G4TrifoliumT. repensplants16 March 2023TrikalaEleftherochori
G5TrifoliumT. repensplants29 March 2023TrikalaKato Rachi (Neromylos)
G6TrifoliumT. repensplants5 April 2023TrikalaDilofos
G7TrifoliumT. repensplants25 April 2023TrikalaDendrochori
G8TrifoliumT. repensplants31 May 2023TrikalaGorgogyri
G9TrifoliumT. repensplants15 June 2023TrikalaFiki
G10TrifoliumT. repensplants3 August 2023TrikalaMatsoukeika
G11TrifoliumT. repensplants3 November 2023TrikalaPinakas Koziakas
G12TrifoliumT. repensplants10 November 2023TrikalaXyloparoiko
G13TrifoliumT. repensplants27 November 2023TrikalaProdromos
G14TrifoliumT. repensplants1 December 2023TrikalaValtino
G15TrifoliumT. repensplants19 December 2023TrikalaKefalopotamos
Table 2. Combined ANOVA for 15 autochthonous Trifolium repens populations evaluated over two experimental years (2024–2025).
Source of VariationdfCPAshFatFIBREADFNDFDDMDMIRFV
m.s.m.s.m.s.m.s.m.s.m.sm.s.m.s.m.s.
Environment (Years)12.634 ***0.238 ***0.139 ***0.414 ***0.170 ns0.255 ***0.102 ns0.001 ***2.483 *
REPS/Years60.016 ns0.015 ns0.003 ns0.018 ns0.036 ns0.010 ns0.022 ns0.00008 ns0.441 ns
Genotype (G)1419.947 ***12.156 ***0.439 ***18.255 ***33.994 ***33.655 ***20.629 ***0.164 ***892.027 ***
Genotype × Year (G × Y)140.193 ***0.170 ***0.014 ***0.381 ***3.122 ***0.258 ***1.895 ***0.001 ***13.299 ***
Error840.011 0.0070.0020.0110.0700.0110.0420.000060.369
Note: m.s. = mean squares. Significance levels: *** p ≤ 0.001; * p ≤ 0.05; ns = not significant. Traits are expressed as CP, Ash, Fat, FIBRE, ADF, NDF, DDM (%), DMI (% of body weight), and RFV (dimensionless). The effective sample size was n = 4 experimental replicates per population; technical replicates were averaged prior to analysis.
Table 3. Stability Index (SI) values for autochthonous Trifolium repens populations.
PopulationCPAshFatFIBREADFNDFDDMDMIRFV
Pialeia7625462413899376120867,871911847,92915,504
Filyra7651417111375601136031,17610,01231,62829,793
Exalofos5435353610117189166534,83617,80936,87640,460
Eleftherochori10,145407911487341107841,13510,85939,57014,998
Kato Rachi (Neromylos)5661420810374080424237,86543,45635,85084,727
Dilofos5022337610404208125831,735999626,41233,760
Dendrochori9366353213967606218460,10927,47266,18985,575
Gorgogyri10,41543741287806688427,48310,39829,38416,863
Fiki10,582607510438499168257,38420,75154,14570,843
Matsoukeika91243073927944686434,048721334,91613,466
Pinakas Koziakas9310321911219821560833,74150,43137,00522,140
Xyloparoiko995939589438211291633,43736,48440,57719,512
Prodromos4263417810269534147143,34414,91642,77413,489
Valtino984243359326495411647,15034,59841,37962,465
Kefalopotamos7811487310256607353829,47444,84339,63919,262
Note: SI values indicate stability across years, with higher values reflecting greater consistency. Traits include CP, Ash, Fat, FIBRE, ADF, NDF, DDM (%), DMI (% of body weight), and RFV (dimensionless). The effective sample size was n = 4 experimental replicates per population; technical replicates were averaged prior to analysis.
Table 4. Genetic parameter estimates for 15 autochthonous Trifolium repens populations.
TraitsMin.Max.MeanSD σ g 2 σ p 2 GCV (%)PCV (%)H2 (%)
CP19.1924.9221.4401.5492.4692.4937.337.3699.0
ASH9.6313.3611.3411.2081.4981.52010.8010.8798.6
FAT1.792.822.3140.2370.0530.0559.9610.1296.8
FIBRE18.6924.9621.3831.4852.2342.2826.997.0797.9
ADF24.2831.8327.5322.1023.8594.2497.147.4990.8
NDF38.4444.8341.8542.0004.1754.2074.884.9099.2
DDM64.1069.9967.4521.6382.3422.5792.272.3890.8
DMI 2.683.122.8730.1400.02040.02054.974.9999.4
RFV135.77168.33150.39110.335109.841111.5036.977.0298.5
Note: Traits include CP, Ash, Fat, FIBRE, ADF, NDF, DDM (all expressed as %), DMI (% of body weight), and RFV (dimensionless). The table presents minimum (Min), maximum (Max), mean, standard deviation (SD), genotypic variance ( σ g 2 ), phenotypic variance ( σ p 2 ), genotypic coefficient of variation (GCV%), phenotypic coefficient of variation (PCV%), and broad-sense heritability (H2%). Τhe effective sample size used in statistical analyses was n = 4 (experimental replicates per population); technical replicates were averaged prior to analysis.
Table 5. Mean comparison of 15 autochthonous Trifolium repens populations using Duncan’s multiple range test.
PopulationCPAshFatFIBREADFNDFDDMDMIRFV
Pialeia21.20 f13.00 b2.480 d21.93 e30.49 a43.97 c65.15 g2.729 j137.8 k
Filyra20.22 j12.38 d2.059 h20.25 k30.74 a43.44 d64.95 g2.761 i139.1 j
Exalofos20.51 i9.940 k1.854 j20.49 j26.73 f41.98 f68.80 b2.857 g150.8 e
Eleftherochori22.02 d11.00 g2.253 f21.21 h27.30 e43.45 d67.63 c2.762 i144.8 h
Kato Rachi (Neromylos)22.14 c11.25 f2.270 f19.08 m27.23 e42.59 e67.69 c2.818 h147.8 g
Dilofos20.80 h9.855 l2.519 cd21.55 g29.92 b44.23 b65.60 f2.712 k138.0 k
Dendrochori24.62 a10.10 i2.724 a20.60 i25.03 h39.03 j69.40 a3.075 c165.4 b
Gorgogyri23.86 b10.04 ij2.195 g20.17 k25.76 g38.74 k68.84 b3.099 a165.3 b
Fiki21.51 e12.55 c2.584 b22.48 d25.25 h40.25 h69.23 a2.982 e160.0 d
Matsoukeika23.78 b10.68 h2.251 f23.35 b29.36 c41.35 g66.03 e2.901 f148.5 f
Pinakas Koziakas21.08 g10.00 jk2.340 e24.68 a28.49 d41.91 f66.70 d2.863 g148.1 fg
Xyloparoiko20.04 k11.91 e2.274 f19.36 l25.11 h40.01 i69.34 a2.997 d161.2 c
Prodromos19.54 l12.97 b2.369 e21.14 h27.24 e44.56 a67.68 c2.694 l141.3 i
Valtino20.75 h11.32 f2.544 bc22.78 c29.28 c43.48 d66.09 e2.759 i141.4 i
Kefalopotamos19.52 l13.13 a1.999 i21.69 f25.06 h38.81 k69.38 a3.091 b166.3 a
Note: Means followed by different letters differ significantly (Duncan’s test, p ≤ 0.05). Traits include CP, Ash, Fat, FIBRE, ADF, NDF, DDM (%), DMI (% of body weight), and RFV (dimensionless). The effective sample size used in statistical analyses was n = 4 (experimental replicates per population); technical replicates were averaged prior to analysis.
Disclaimer/Publisher’s Note: The statements, opinions and data contained in all publications are solely those of the individual author(s) and contributor(s) and not of MDPI and/or the editor(s). MDPI and/or the editor(s) disclaim responsibility for any injury to people or property resulting from any ideas, methods, instructions or products referred to in the content.