


Abstract
Hydraulic rock drill exhibits outstanding attributes of high power and high frequency, but there are some issues including unclear mechanisms governing impact dynamic behaviors and inaccurate evaluation of impact performance. In this study, a dynamic test platform for the hydraulic rock drill was established by employing the terminal velocity method, utilizing a high-frequency non-contact laser displacement sensor to precisely capture the transient kinematics of the impact piston. The quantitative results indicate that as the input pressure rises from 10 MPa to 23 MPa, the impact frequency increases from 50 Hz to 76.9 Hz, and the impact energy increases from 89.9 J to 275 J. A hydraulic rock drill AMESim simulation model incorporating the impact system, collision medium and buffer system was developed and validated. This reveals the operating mechanism of impact piston driven by the equivalent pressure difference between the front and rear chambers. And the stroke reversal interval governs the duration between the deceleration onset and collision of the impact piston. As a result, both excessively large and small stroke reversal intervals will lower the impact power. The 12 mm stroke reversal interval has been identified as the optimal setting for maximizing impact power, at which the impact power reaches 17,561.3 W, which presents an increase of 4.70% and 3.12% compared to the intervals of 7 mm and 17 mm, respectively. This study contributes a reliable theoretical basis and direct data support to the performance evaluation and optimized design of hydraulic shock systems.
1. Introduction
Under the guidance of governmental strategic programs such as the Made in China 2025 initiative, the high-end equipment manufacturing industry, represented by hydraulic rock drills, is rapidly transitioning towards energy conservation and environmental protection [1]. Concurrently, the demands for large-scale and intensive construction in engineering fields such as mineral mining and tunnel excavation have driven the development of advanced rock-breaking machinery with higher power and frequency [1,2]. As the core mechanical equipment for drill-and-blast construction, hydraulic rock drills achieve efficient rock breaking through the combined effects of hydraulic-driven impact, rotation and flushing [3]. However, improving the impact efficiency and minimizing energy consumption remains a significant technical bottleneck. This challenge primarily stems from its core impact system, a typical complex system with a mechanical–hydraulic–pneumatic coupled mechanism consisting of an impact piston, a reversing valve, and a high-pressure accumulator. Currently, the mechanisms governing its impact dynamic behaviors remain unclear, and the evaluation of its impact performance is inaccurate. Therefore, research into the dynamic behavior and performance of impact systems is not only a critical approach to realizing the efficient operation and structural optimization of hydraulic rock drills, but also a critical requirement for sustainable development and green mine construction.
Experimental studies on the impact performance of rock drills are the most effective approach to obtain the dynamic behaviors of impact systems. Experimental methods include the stress wave method [4,5,6,7], cavity pressure method [8] and terminal velocity method [8], which are primarily employed to conduct performance evaluation and mechanism analysis.
Li et al. [9] systematically analyzed the effects of various factors on drilling efficiency by designing orthogonal experiments, optimized the key parameters, and established a regression equation for drilling rate. The final predictive error was controlled within ≤12%, which provides a quantitative basis for parameter matching of rock drills. Li et al. [10] proposed an internal mechanism testing method to optimize the reversing valve clearance, which significantly increased the impact frequency and piston velocity. Chang et al. [11] designed a non-contact experimental system with laser displacement sensors to resolve housing overheating and weak impact forces, successfully increasing the impact energy by 39.3%. Ma et al. [5] focused on the correlation between impact performance and cavitation. Based on the stress wave theory, they derived a formula for piston rebound velocity based on stress wave theory, verifying their proposed model through field drilling experiments.
In addition, numerical simulation methods have also been adopted to analyze the effects of operational and structural parameters of the impact system on the dynamic response and impact performance, emerging as an important tool for theoretical research and design optimization [11,12,13,14,15].
Chang et al. [11] established an impact dynamics model based on Simulink software to optimize the impact system. Yin and Hu [12] established a dynamic simulation model of the impact system using AMESim software and verified the consistency between the model and the actual operation mechanism, thus providing a reliable simulation platform for the analysis of the dynamic characteristics of the impact system. Qin et al. [13] built a model of the hydraulic impact system via AMESim software, taking into account the hydraulic oil leakage under different fit clearances and working pressures. They quantitatively analyzed the influence law of leakage on impact performance, which lays a theoretical foundation for the optimization of sealing structures and leakage control. Yang et al. [14] constructed an AMESim platform specifically for rock drills with sleeve valves, achieving a 17.7% increase in system efficiency. Geng et al. [15] studied the dynamic simulation of double buffer system based on AMESim, which can observe the change in parameters throughout the working period.
In this paper, the research primarily focuses on the dynamic behavior and impact performance of the hydraulic rock drill’s impact system. Firstly, a laser displacement detection-based impact performance testing platform was established to directly obtain dynamic parameters including displacement, velocity and acceleration of the impact piston through impact tests under different input oil pressures. Consequently, the evolution of impact energy and impact frequency with respect to input pressure is thus identified. On this basis, an AMESim simulation model incorporating the impact system, collision medium and buffer system was developed and validated against the test data. Simulation results reveal the motion mechanism of the impact piston and reversing valve under mutual feedback control. Finally, the influence of stroke reversal interval on impact performance is investigated, and the optimal impact conditions are determined. The novelty of this study lies in establishing a comprehensive validation framework that deeply couples non-contact, high-frequency laser displacement measurements with an AMESim dynamic model. This approach not only accurately reveals the transient nonlinear kinematic characteristics of the impact piston but also quantitatively determines the optimal design threshold range for the stroke reversal interval under varying input pressures. Ultimately, it provides direct and reliable guidance for the control and structural optimization of high-end hydraulic rock drills.
2. Experimental Methodology
2.1. Working Principle of the Impact System
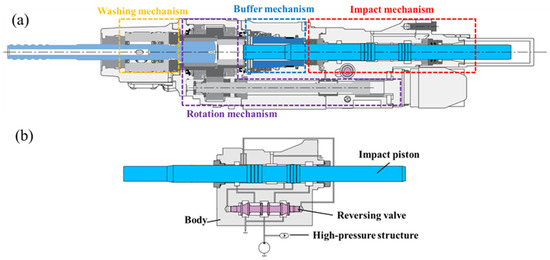
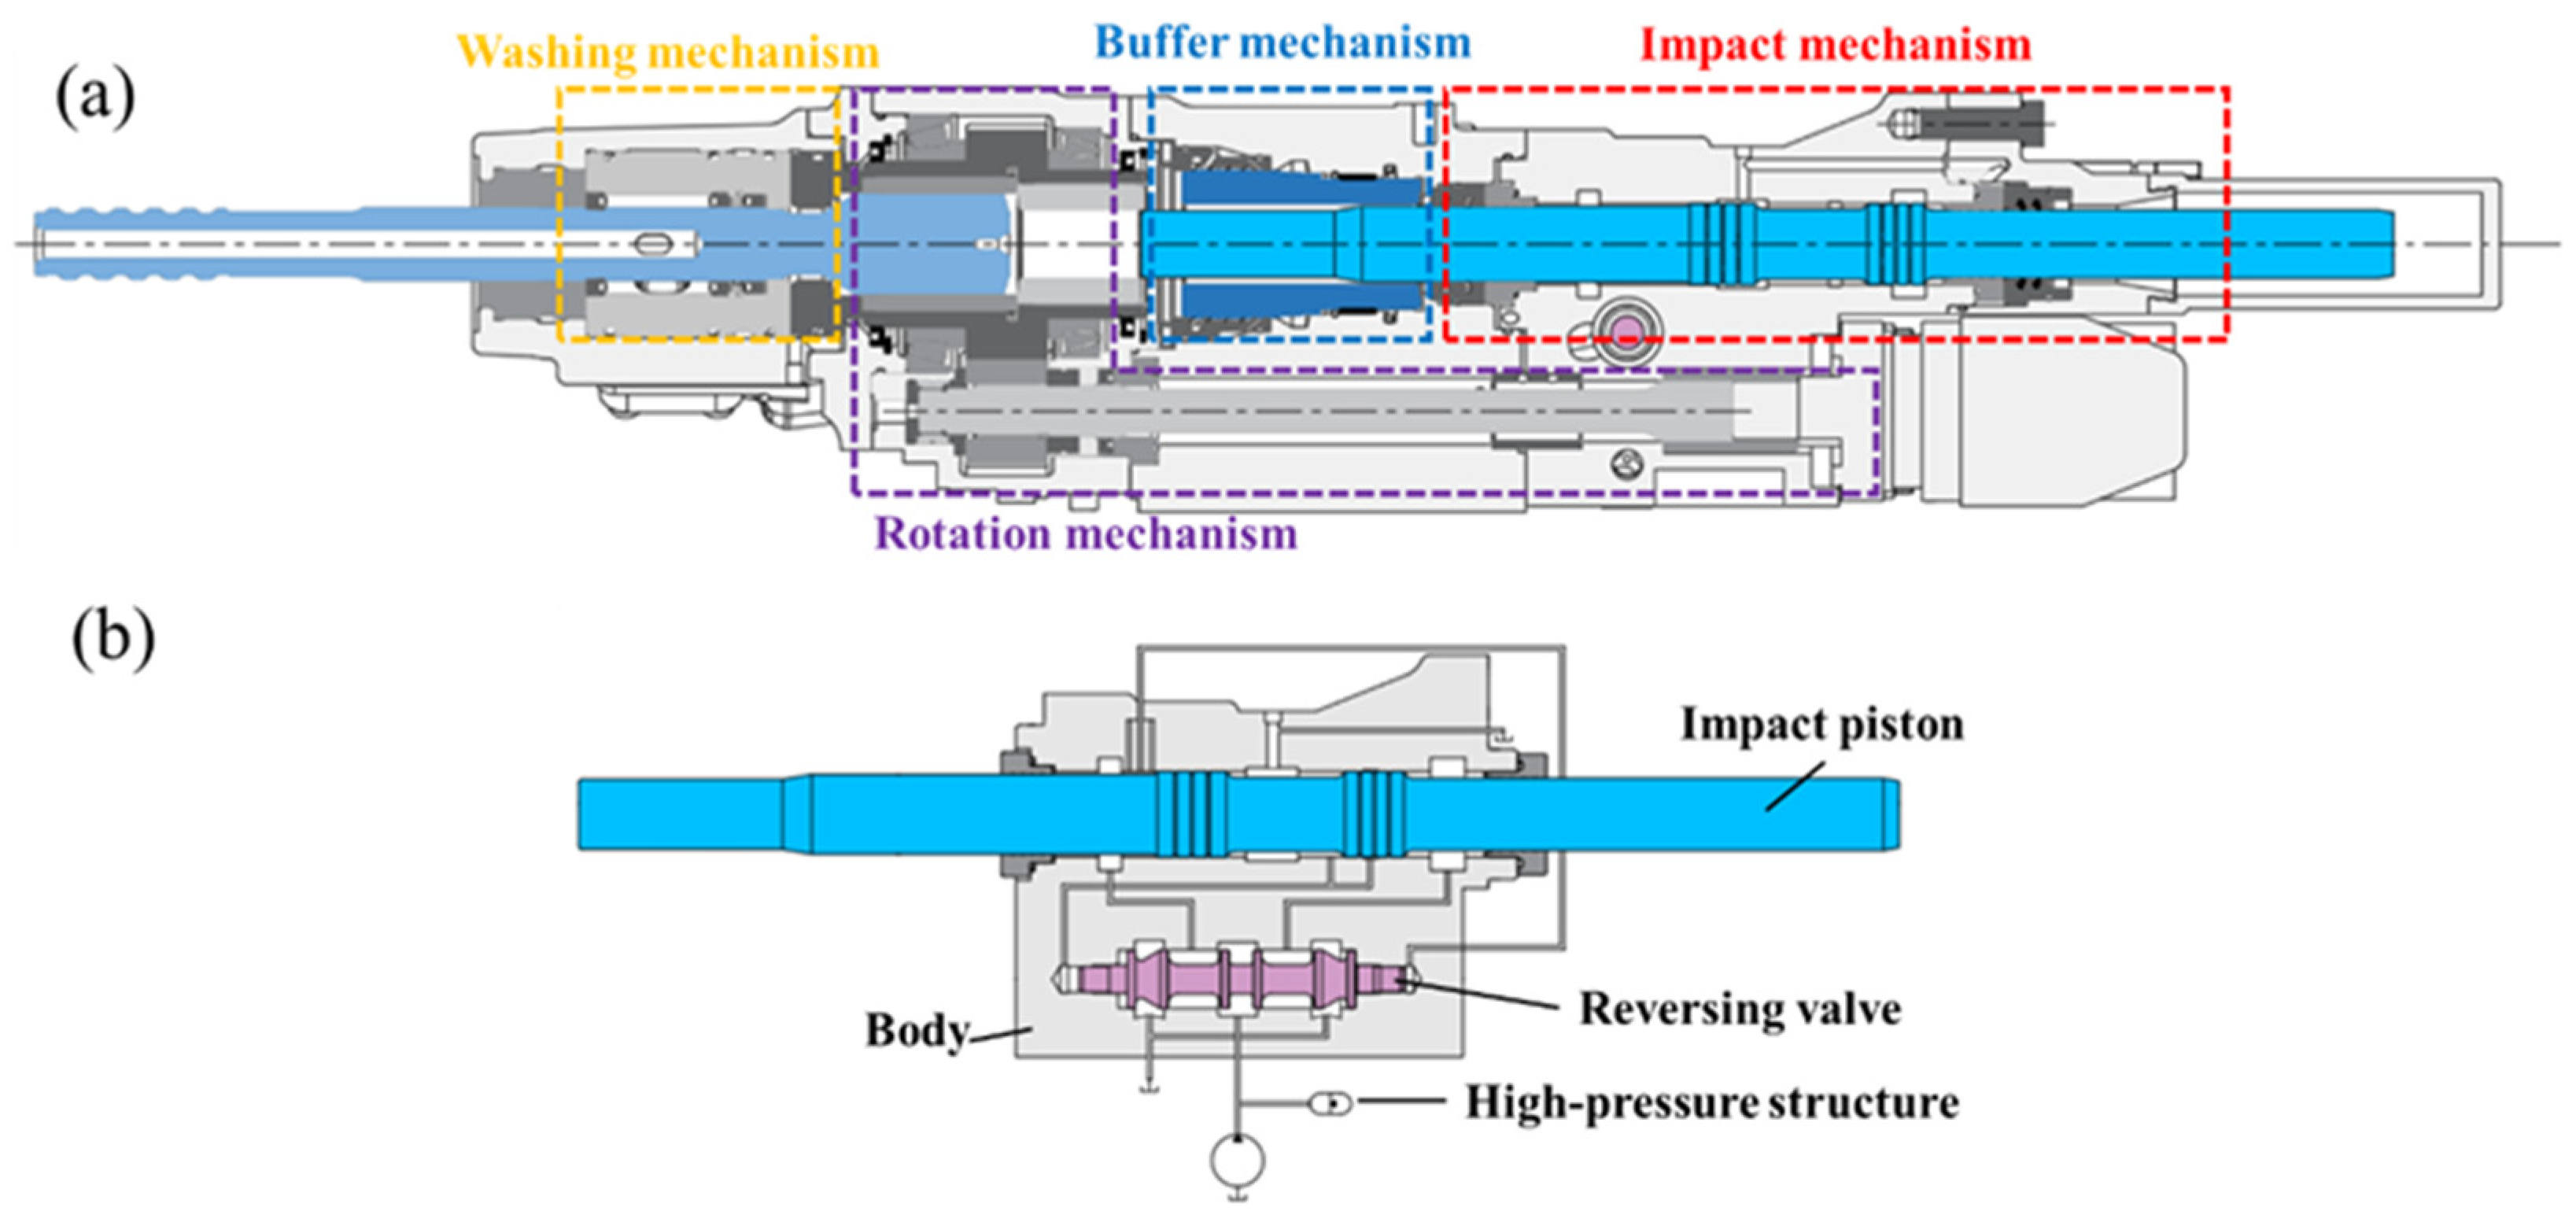
As shown in Figure 1a, the hydraulic rock drill system comprises an impact system, a drill bit rotation system, a flushing system and a buffer system. Its working principle is to provide power through the hydraulic system to drive the coordinated operation of all mechanisms. The impact system generates rock-breaking impact force, the drill rod rotation system drives the drill rod to rotate for continuous drilling, the flushing system removes rock debris via high-pressure water flow, and the buffer system absorbs rebound energy during the impact process. Among these components, as illustrated in Figure 1b, the impact system is the core unit determining drilling performance and plays a key role in converting hydraulic energy into impact energy. The impact system is mainly composed of an impact piston, a reversing valve, and a high-pressure accumulator. The hydraulic driving process is as follows: the hydraulic system delivers high-pressure oil to the impact system, and then the reversing valve controls the oil circuit to enable the impact piston to perform the reciprocating motion. When the reversing valve is in the power stroke position, high-pressure oil enters the rear chamber of the impact piston, pushing the impact piston forward at high velocity. Once the piston reaches the end of the stroke, it triggers the reversing valve switches to the return stroke position. Therefore, high-pressure oil enters the front chamber of the piston, driving the impact piston to return and reset. After finishing the return stroke, the reversing valve is triggered to switch back again, initiating a new power stroke. During the high-velocity movement of the piston, the high-pressure accumulator supplements flow and stabilizes system pressure, ensuring the continuity and stability of the impact process. This mutual feedback mechanism enables the impact piston to achieve reciprocating forward and backward movement, continuously generating periodic impact force that is transmitted to the drill bit through the drill rod, ultimately realizing efficient rock-breaking operations.
Figure 1.
Illustration of the composition and working principle: (a) the hydraulic rock drill and (b) the impact system.
2.2. Experiment Design of Impact Performance
The impact piston is the core executive component of the impact system in a hydraulic rock drill, so its motion characteristics directly determine the dynamic behavior and impact performance of the rock drill. Therefore, more direct and accurate determination of the dynamic response of the impact system and the impact piston, is crucial for impact system analysis and simulation modeling of the rock drill. This study adopts the terminal velocity method based on the laser displacement detection principle, which enables real-time non-contact detection of the displacement and velocity of the impact piston. This method effectively avoids the interference of traditional contact detection on the motion of the impact piston, achieves real-time and high-precision acquisition of the impact piston’s displacement signals, and provides original data support for the analysis and simulation of the hydraulic rock drill. As highlighted in Table 1, the proposed non-contact laser displacement approach overcomes these limitations by providing zero-delay, direct measurement of the piston’s true kinematics without altering its dynamic characteristics, thereby offering higher precision and reliability compared to previous methods.
Table 1.
Critical comparison of experimental testing approaches for hydraulic rock drill impact systems.
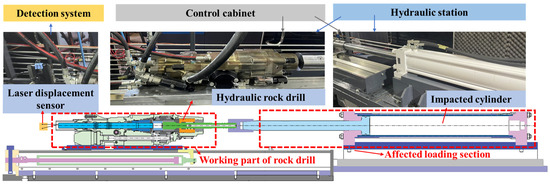
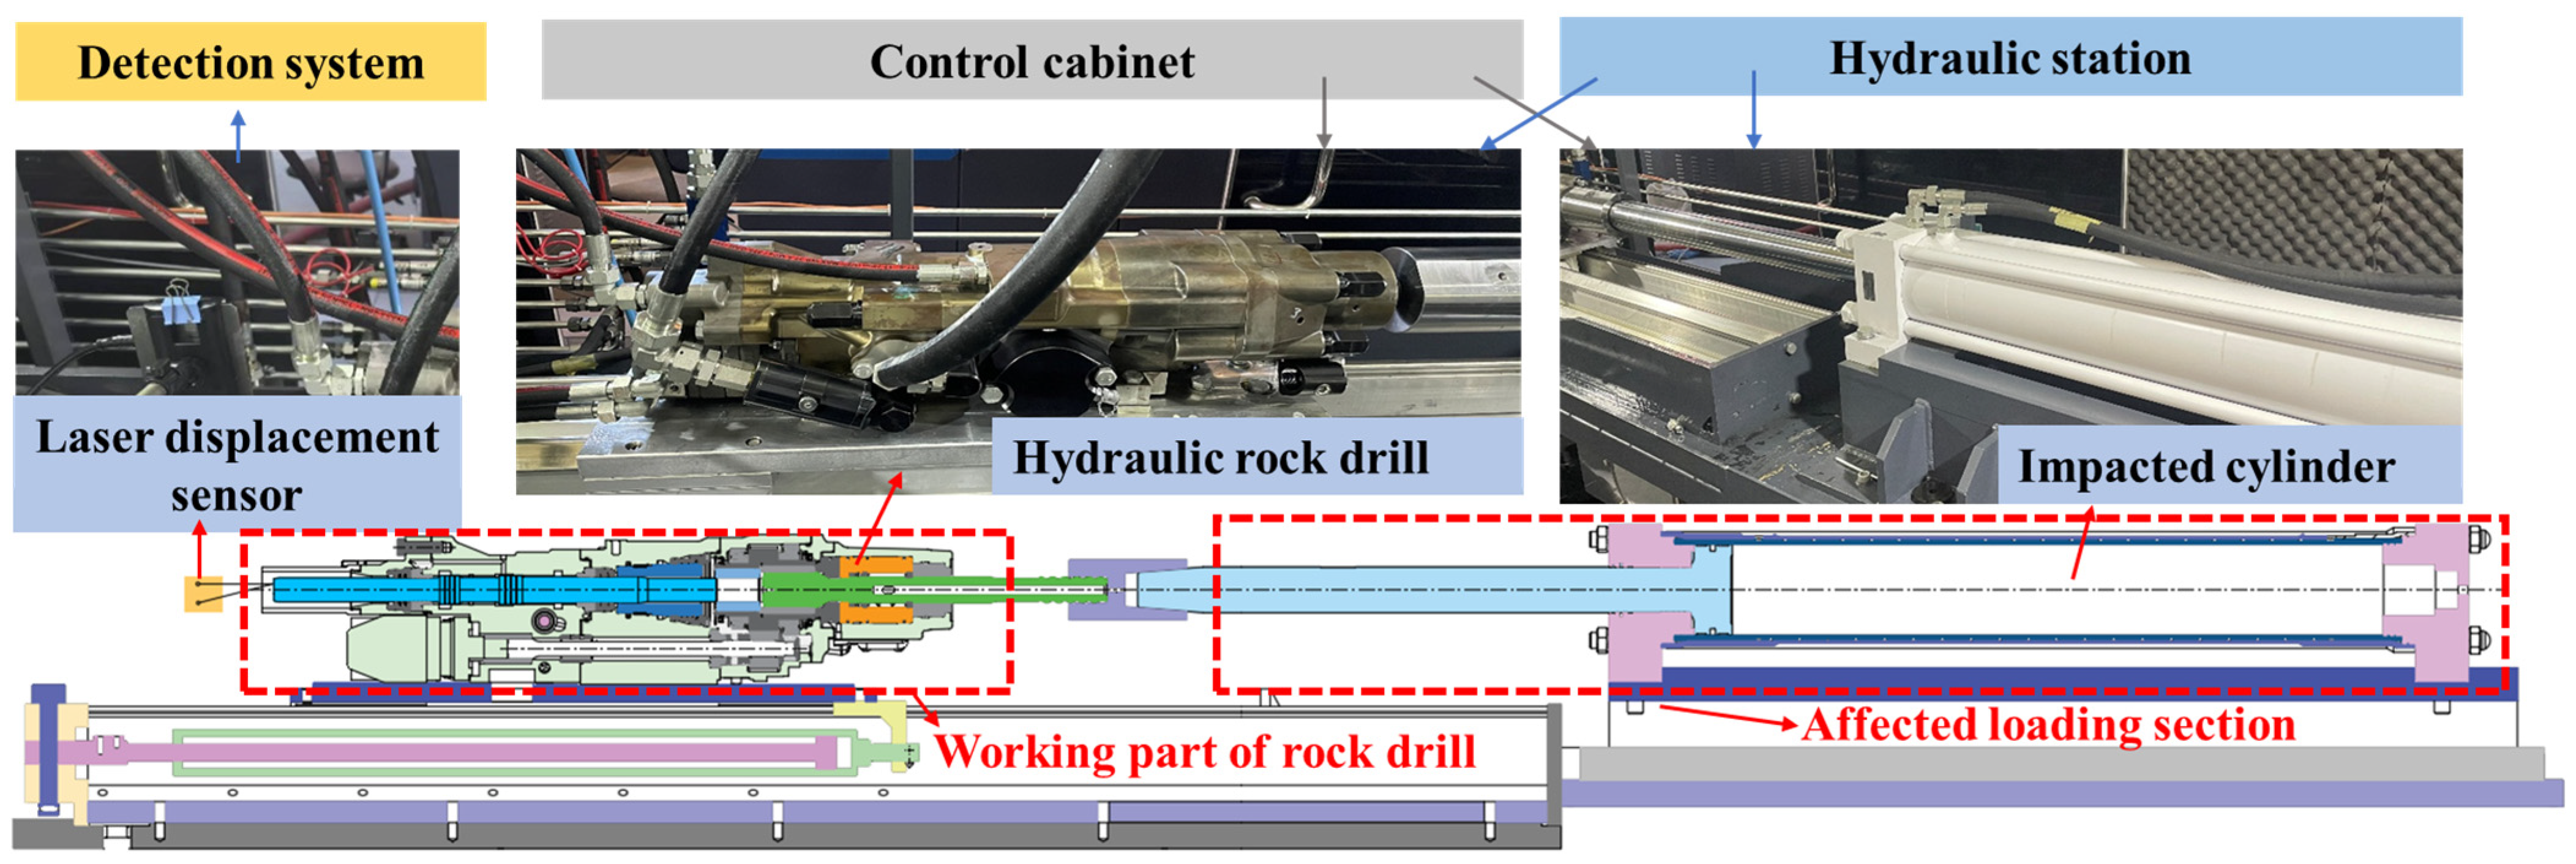
As illustrated in Figure 2, the impact performance test system is composed of a hydraulic station, a hydraulic rock drill, an impacted cylinder, a control cabinet, and a detection system. It enables multi-parameter collaborative testing of the percussion characteristics of high-power hydraulic rock drills. The hydraulic power unit is installed on one side of the test bench, supplying a stable and sufficient high-pressure oil source to meet the flow demand of the impact system’s high-frequency reciprocating motion. The hydraulic rock drill is firmly attached to the test bench, with its impact piston axis coaxially aligned with the laser sensor’s detection axis to minimize measurement errors caused by installation deviations. As the core kinetic component, the tested impact piston has a mass of 4.989 kg and a geometric length of 600 mm. The impacted cylinder is mounted horizontally opposite the rock drill’s impact end, directly bearing the impact load from the piston by simulating variable load stiffness corresponding to rocks with different hardness. The control cabinet is located in a safe area adjacent to the test platform. It integrates power management, pressure regulation, and data acquisition control modules, enabling precise setting for key parameters such as input pressure and propulsion pressure. The laser displacement sensor is aligned with the tail end of the impact piston to synchronously capture displacement data, and all signals are aggregated by the acquisition card before being transmitted to a computer for real-time processing and analysis. Specifically, the laser displacement sensor adopts the Morton MSE-TS803-140/100 model (Quanzhou Morton Machinery Co., Ltd., Quanzhou, China), featuring a maximum sampling rate of 200 × 103 Hz and a system-set sampling rate of 62,500 Hz. Prior to the dynamic tests, the laser displacement sensor was calibrated using a step-translation method with a movable target baffle. By comparing the sensor’s output values against standard reference distances across five discrete position points, the linear measurement deviation was verified to be strictly controlled within 1%. It is worth noting that, despite this rigorous calibration, the primary focus of this measurement lies in capturing the relative dynamic displacement of impact piston. This validated setup guarantees the high-precision acquisition of the piston’s transient motion characteristics.
Figure 2.
Impact performance test system based on laser displacement detection.
The dynamic behavior of the impact system significantly affects the working performance of the hydraulic rock drill [16]. For the detection of impact performance, it is necessary to measure the impact energy and impact frequency and hence calculate the corresponding impact power and energy utilization rate. The motion characteristics of the piston and reversing valve ought to be tested if necessary [17]. This study focused on the dynamic performance test of the impact system in the hydraulic rock drill, so the rotary drilling system was kept closed throughout the test to eliminate interference from rotational motion. In the static load pressure test, the input pressure of the impact system was set to 23 MPa and maintained for 3 min before being released. Subsequently, the equipment was operated continuously at the input pressure of 23 MPa for 30 s to inspect for abnormalities such as leakage, cracks, and looseness. After the equipment inspection was passed, the impact performance test was carried out with the propulsion pressure of 3 MPa and the no-load buffer pressure of 4 MPa. The input pressure adopted four groups of gradient variables, namely 10 MPa, 15 MPa, 20 MPa, and 23 MPa. Each pressure level was operated stably for 30 s, and all tests were repeated three times to ensure data reliability.
2.3. Acquisition of Impact Performance Parameters
Based on the original impact piston displacement data collected by a laser displacement sensor, the relative displacement of the piston’s reciprocating motion was calculated by extracting the maximum and minimum displacement signals within each motion cycle. Subsequently, the original displacement data were smoothed in Origin software (version 2025) using the Savitzky–Golay polynomial fitting method to fit data points within the sliding window [18], thereby eliminating high-frequency noise induced by equipment vibration and environmental interference. Specifically, the Savitzky–Golay smoothing filter was applied with a window size of 100 and a polynomial order of two. These parameters were strictly selected through comparative testing to optimally eliminate high-frequency noise while maximally preserving the true amplitude and phase characteristics of the transient impact displacement and velocity peaks. On this basis, time-domain numerical differentiation was performed on the smoothed displacement data to obtain the motion velocity of the impact piston. Further time-domain numerical differentiation of the velocity data yielded the piston’s motion acceleration, which reflects the dynamic variation laws of velocity and acceleration during the piston’s power stroke and return stroke stages.
By performing Fourier transform on the processed piston displacement signal, the time-domain signal was converted into a frequency-domain signal. The impact frequency was then determined by identifying the peak frequency in the frequency spectrum, enabling rapid and accurate extraction of the impact frequency. Impact energy was calculated based on the kinetic energy theorem: according to the piston velocity at the moment of collision obtained from the velocity curve, the impact energy was determined using the known mass of the impact piston. Impact power was derived as the product of the measured impact energy and impact frequency, which reflects the energy output capacity of the hydraulic rock drill’s impact system per unit time.
3. AMESim Modeling
3.1. Stress Wave Model
Building on the structural features of the rock drill’s impact system, the dynamic equation governing the stroke of the impact piston is formulated as:
where is the mass of impact piston with = 4.989 kg; , represent the acceleration and velocity of the impact piston, respectively; is the oil viscosity resistance coefficient; refers to the seal friction resistance; and are the pressures in the rear cavity and the front cavity of the impact piston, respectively; and and are the effective areas of the rear cavity and the front cavity, respectively. In this paper, the dynamic equation is simplified by neglecting the oil viscous resistance and friction resistance. And the pressure of the front cavity during the stroke is assumed to be zero for analytical simplification. Therefore, the simplified dynamic equation is expressed as:
The impact velocity of the impact piston is defined as:
where is the stroke time of impact piston.
When the impact piston collides with the impacted cylinder, it will produce rebound. The rebound force, rebound velocity and rebound acceleration of the impact piston are estimated by a one-dimensional wave dynamics model [19].
The amplitude of the incident wave generated at the collision contact surface is expressed as:
where is the incident wave force.
The wave impedance of the impact piston and impacted cylinder is defined as:
where and are the density and sectional area of the impact piston, and are the density and sectional area of the impacted cylinder, respectively, and is the wave velocity.
The inherent correlations among wave impedance, stress wave velocity and cross-sectional area are expressed as:
where is the elastic modulus and = 2.06 × 10¹¹ Pa; is the diameter of the impact piston at the impact end and the impacted cylinder and = 36 mm. Here, the material of the piston and the cylinder are identical ( = = = 7850 kg/m3), so wave resistance of the impact piston and the impacted cylinder is considered to be equal, namely = = .
The time-dependent function of incident wave is given by:
The duration of the incident stress wave is calculated as:
where is the length of the impact piston, and = 600 mm.
The force at the drilling end presents an approximately linear correlation with the penetration depth [20], namely,
where is the loading stiffness and = 5 × 10⁷ N/m; is the unloading stiffness and = 7.5 × 10⁷ N/m [21]. denotes the real-time penetration depth, represents the corresponding maximum penetration depth, and refers to the maximum drilling force matched with this maximum penetration depth.
Taking the contact surface between impact piston and impacted cylinder as the research object, according to the wave equation:
where is the reflected wave force.
By combining the above equations, the penetration differential equation can be derived as:
The stress equations of loading section and unloading stage are formulated as:
The penetration function and reflected wave function are obtained as:
Based on conservation of momentum, the rebound velocity of the impact piston is calculated as:
where is the rebound velocity of the impact piston.
Hence, the instantaneous rebound acceleration is obtained as:
3.2. AMESim Modeling of the Hydraulic Rock Drill
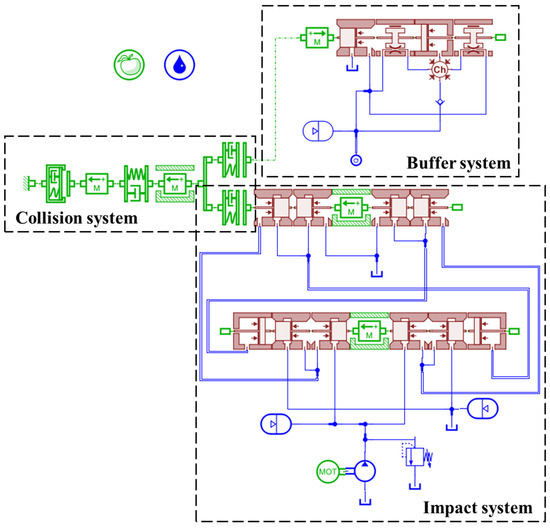
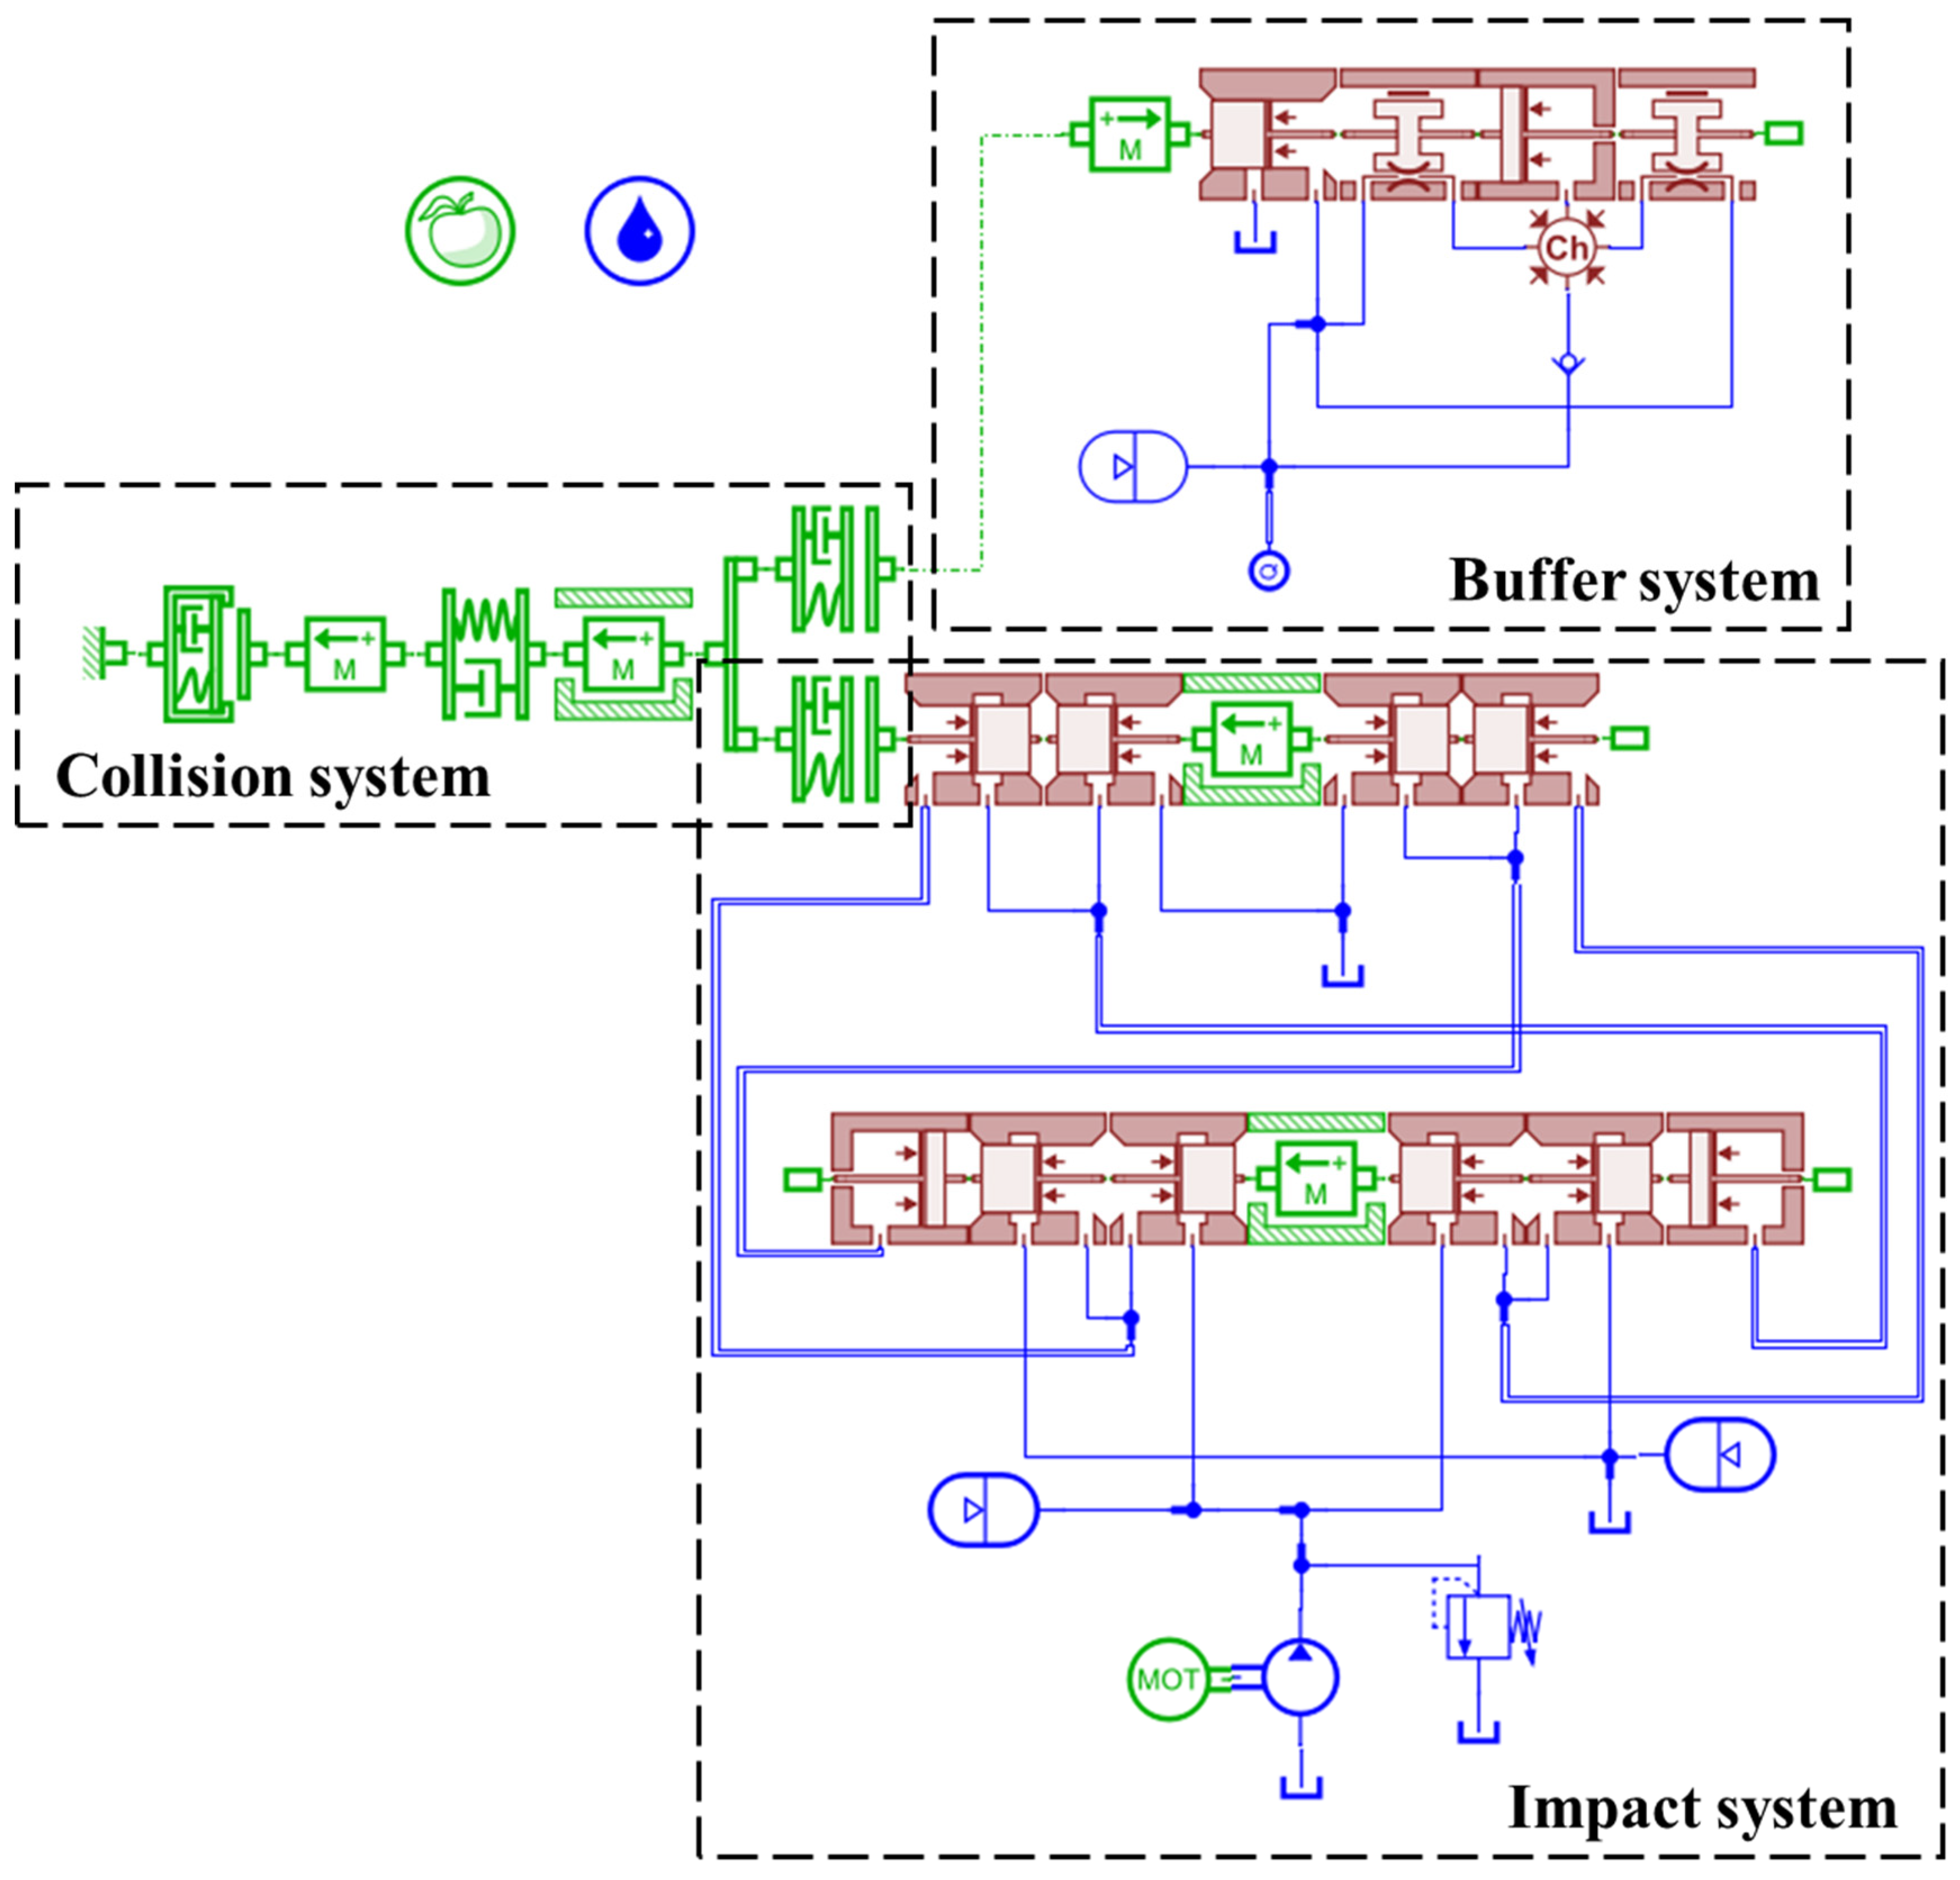
AMESim (version 2020.1) is a multidisciplinary modeling and simulation platform for complex systems, which has been widely adopted for the dynamic modeling such as the impact system of hydraulic rock drills [22,23,24]. Based on the working principle of the impact system of the hydraulic rock drill and the lumped parameter power bond graph theory, a coupled mechanical–hydraulic–pneumatic AMESim simulation model was established to predict the dynamic behavior and performance of the impact system. As shown in Figure 3, the AMESim model is composed of a hydraulic impact module, a buffer module, and a collision module. The hydraulic impact module serves as the core unit of the model, mainly consisting of an impact piston, a reversing valve, and a high-pressure accumulator unit, and is responsible for the conversion and transmission of hydraulic energy to mechanical energy. The buffer module is composed of two buffer chambers and an overflow unit, which is designed to absorb the rebound energy generated after the collision of the drill shank, as well as to suppress system vibration and pressure fluctuations. The collision module is constructed with stiffness and damping units of the drill shank, drill bit, and rock, which is used to simulate the contact and collision processes between the impact piston and the drill shank, as well as between the drill bit and the rock, thereby reproducing the force characteristics of rock breaking in actual operation conditions. The collision system model is built with reference to [3], which consists of three spring-damping modules and two mass blocks.
Figure 3.
AMESim simulation model of hydraulic rock drill.
Oil leakage is inevitable during the operation of the impact piston and reversing valve. Yin et al. [25] conducted dynamic simulations by establishing a mathematical model of drill leakage, which provided guidance for the gap selection and leakage control of the impact system. In this study, given the negligible magnitude of oil leakage, the leakage caused by the fit clearance between components was not considered in the simulation model. Meanwhile, the hydraulic oil was assumed to be an incompressible fluid, and the pressure loss in the system pipeline was negligible. The motion of the impact piston and reversing valve were constrained to the axial direction without radial deviation.
The structural parameters of the simulation model established in this study are consistent with those of the manufactured drilling equipment, mainly including the diameters of the forward and backward push valves of the impact piston, the diameters of the left and right push valves of the reversing valve, the masses of the impact piston and reversing valve, the position of the return signal port, the initial positions of the impact piston and reversing valve in the system, and their distances to each port. In addition, the parameters also include the initial pressure and volume of the accumulator, oil supply flow rate and pressure, stiffness and damping of the collision module, and flow rate of the buffer module. The detailed unit types and parameter settings in the AMESim model of the hydraulic rock drill are listed in the Table 2.
Table 2.
Unit types and parameter settings of AMESim model for hydraulic rock drill.
4. Results
4.1. Experimental Results
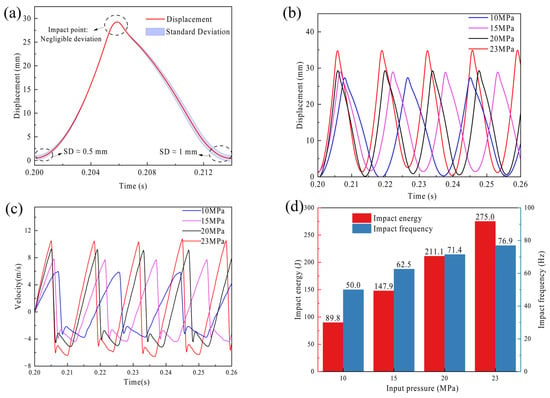
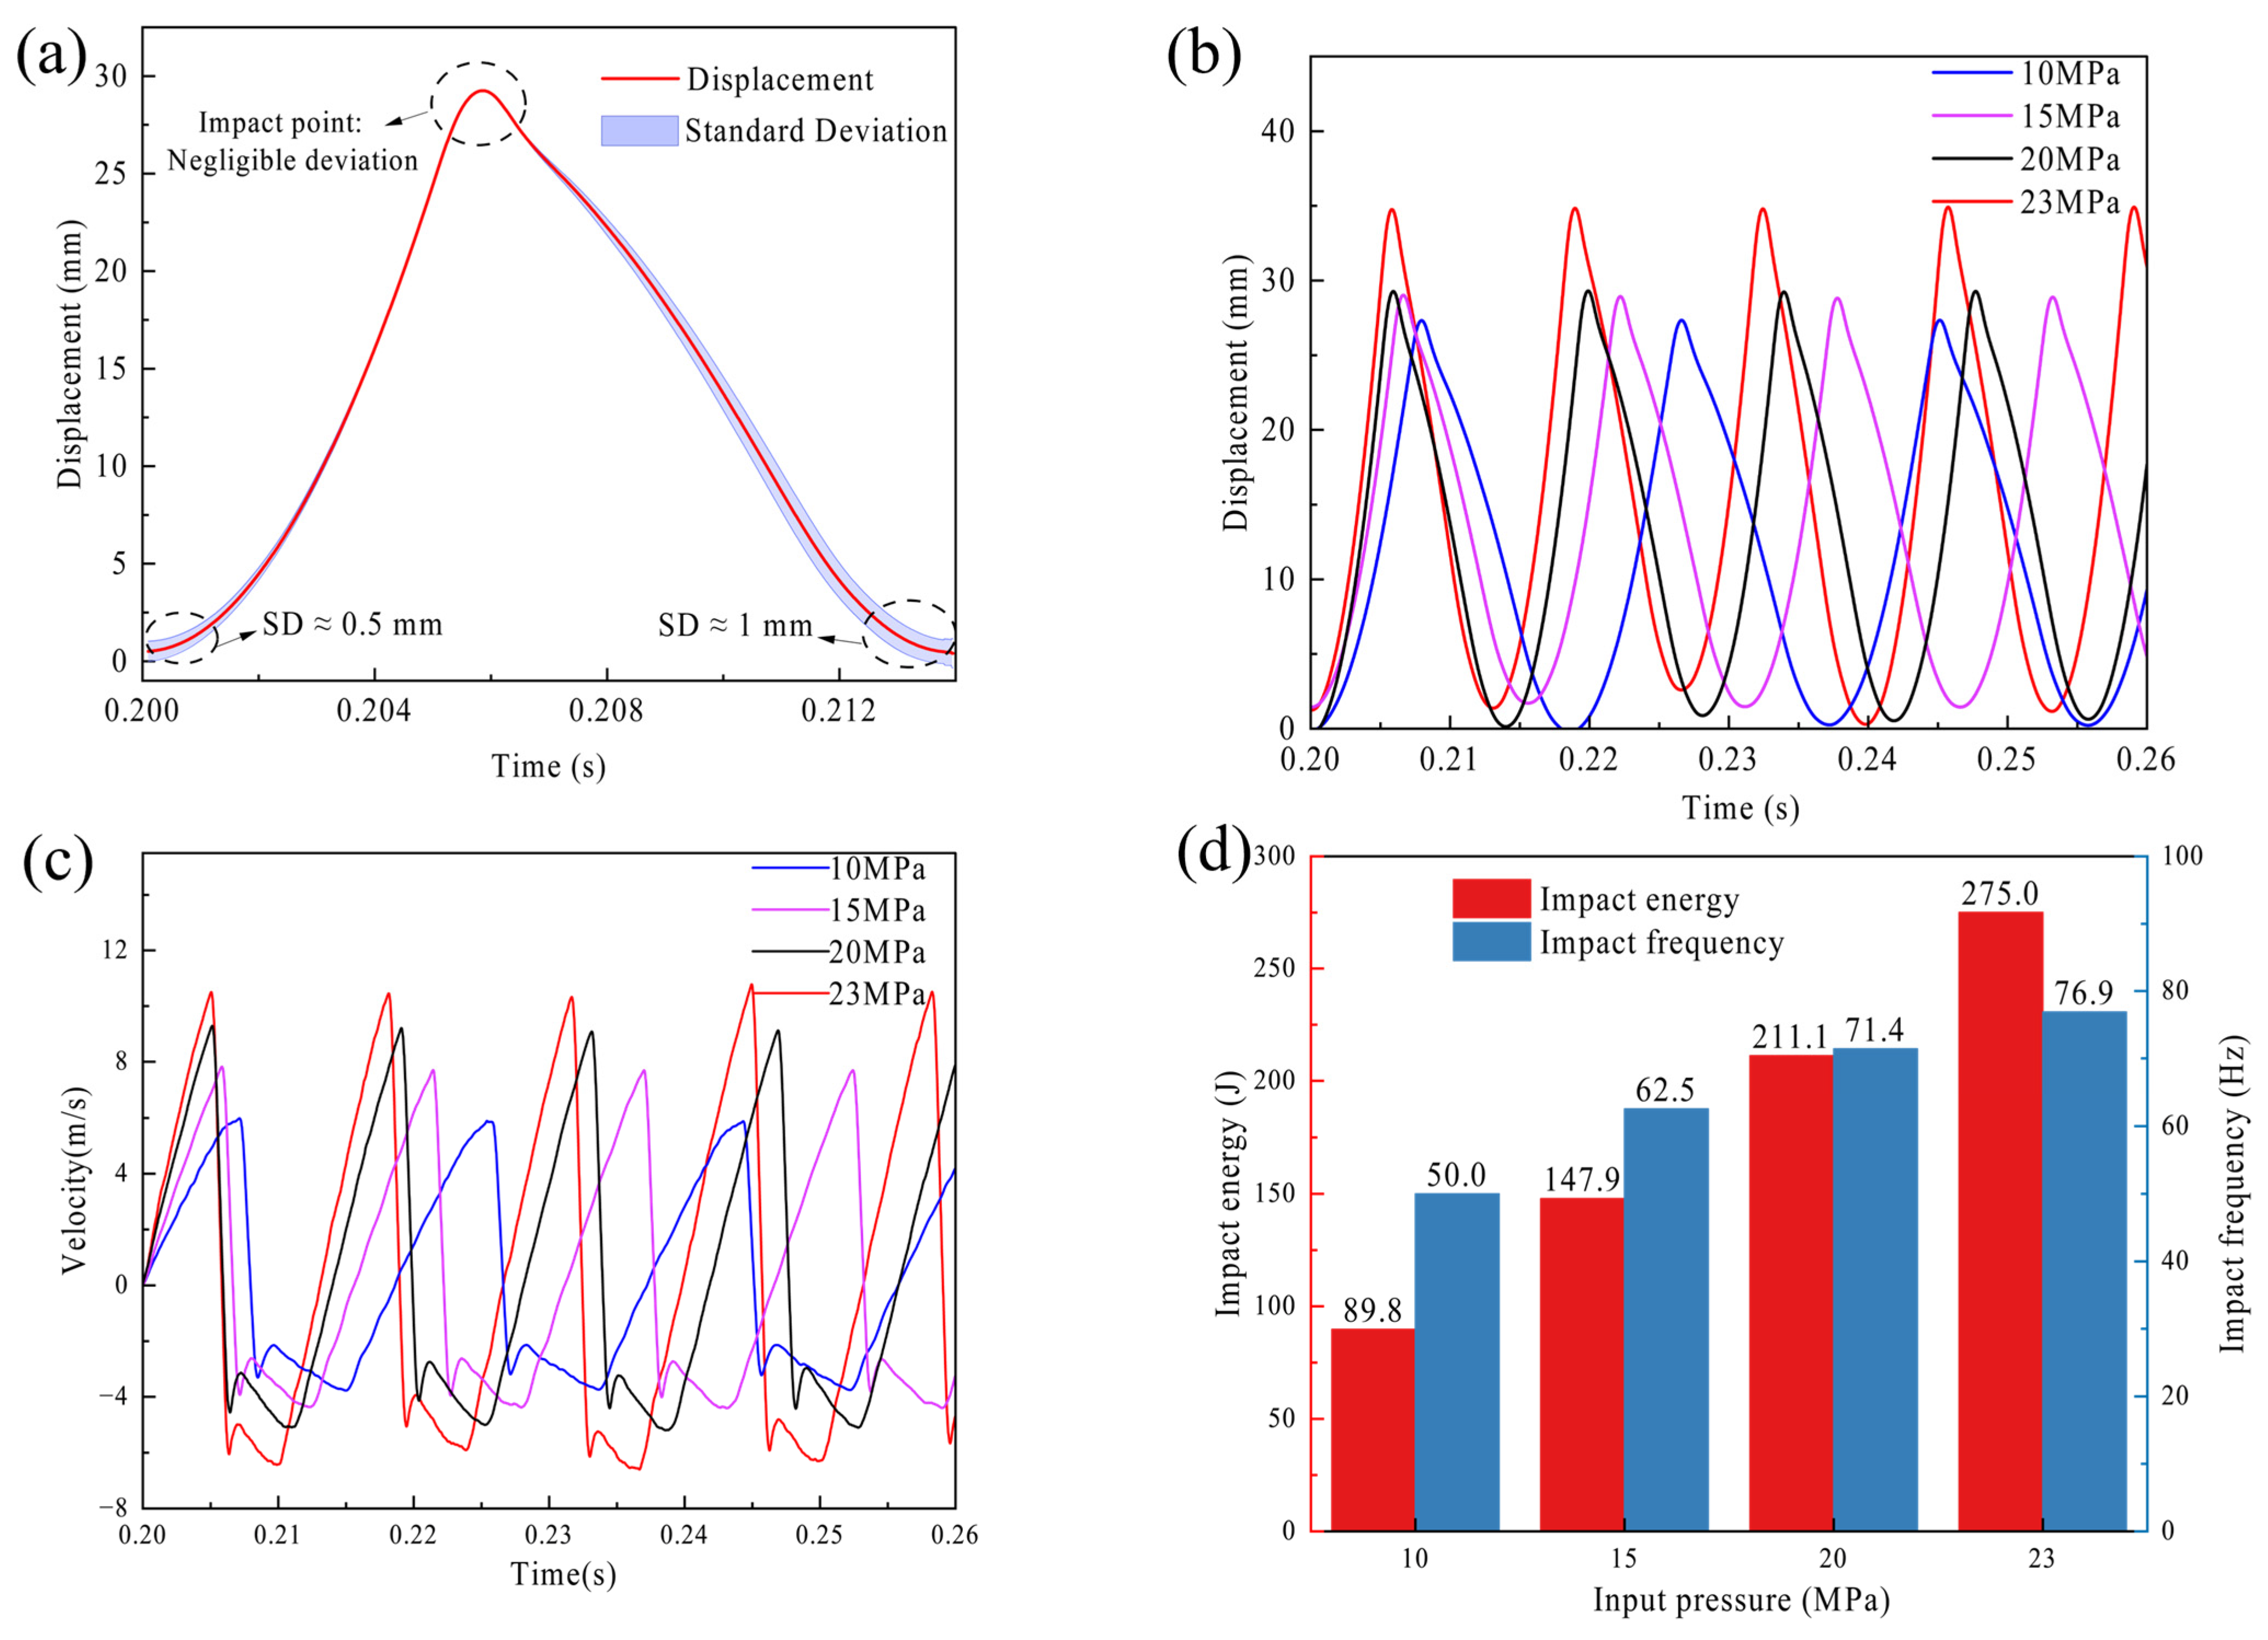
The temporal evolution of the motion characteristics of the impact piston under input pressures of 10 MPa, 15 MPa, 20 MPa, and 23 MPa is illustrated in Figure 4. Prior to analyzing the dynamic variations across different pressures, the cyclic consistency and measurement reliability of the system were evaluated. As depicted in Figure 4a, a representative synchronized displacement cycle over multiple successive impacts is extracted. The red solid line denotes the mean displacement, bounded by a blue shaded area indicating standard deviation (SD). Notably, the deviation is mathematically negligible primarily at the peak impact point, demonstrating excellent striking stability. Although minor variations exist during the commencement of the stroke and the end of the return phase due to the inherent coupling fluctuations of the hydraulic system, overall kinematic errors rigorously remain within high-precision engineering tolerances.
Figure 4.
The motion characteristics of the impact piston under the different input pressures: (a) error band analysis, (b) displacement, (c) velocity, (d) impact frequency and impact energy.
In Figure 4b, the displacement curves exhibit distinct periodic fluctuations, with one peak and one trough observed within each cycle, corresponding to the stroke-to-return reversal and return-to-stroke reversal, respectively. Such periodic fluctuations clearly characterize the reciprocating impact motion of the piston. As the input pressure increases, the amplitude of the displacement curves increases progressively, which indicates that a positive correlation between the reciprocating stroke of the impact piston and the input pressure. Meanwhile, the duration of each cycle shortens with increasing pressure, signifying a rise in the impact frequency as the input pressure elevates.
As shown in Figure 4c, the velocity curves also demonstrate periodic behavior, whose characteristic points correlate with those of the displacement curves. The moments at which the displacement curves of the impact piston reach their peaks and troughs correspond to the positive–negative transition of velocity, indicating the reversal of velocity direction. Notably, the transition from forward to backward piston velocity is almost instantaneous, differing from the smooth transition of the reverse-to-forward process. This instantaneous moment of velocity transition occurs at the maximum stroke displacement. With increasing input pressure, the fluctuation amplitude of the velocity curves increases remarkably, which reflects the enhancement of the piston’s motion velocity with rising pressure. Concurrently, the cycle of the velocity curves shortens, which is consistent with the variation tendency of the displacement curves and further verifies that the impact frequency increases with increasing input pressure.
The impact frequency and impact energy corresponding to input pressures of 10 MPa, 15 MPa, 20 MPa, and 23 MPa are presented in Figure 4d. Here, the impact frequency is obtained through Fourier transform, while the impact energy is determined using the kinetic energy theorem. Both impact energy and impact frequency exhibit a pronounced upward trend with increasing input pressure: as the pressure rises from 10 MPa to 23 MPa, the impact energy increases from 89.8 J to 275 J, and the frequency rises from 50 Hz to 76.9 Hz. This trend stems from the fact that higher input pressure amplifies the chamber pressure difference driving piston motion. This not only accelerates the piston’s reciprocating cycle, thereby increasing impact frequency, but also enhances the piston’s velocity and stroke, resulting in elevated impact energy. The observed increase in impact velocity, impact energy, and impact frequency with input pressure is consistent with the findings of Yang et al. [6], who also identified working pressure as a dominant factor affecting the impact performance of hydraulic rock drills. A detailed mechanistic analysis of this process is presented in the following sections, leveraging a physical model developed in AMESim.
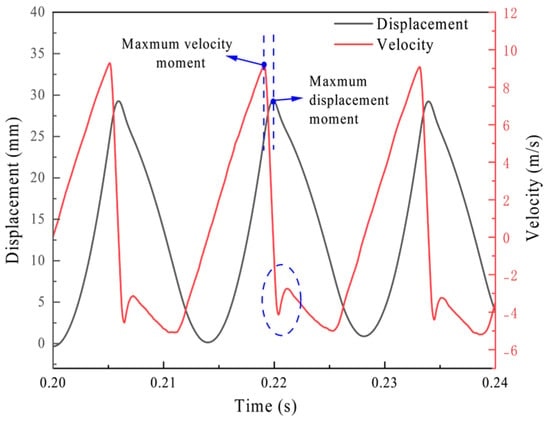
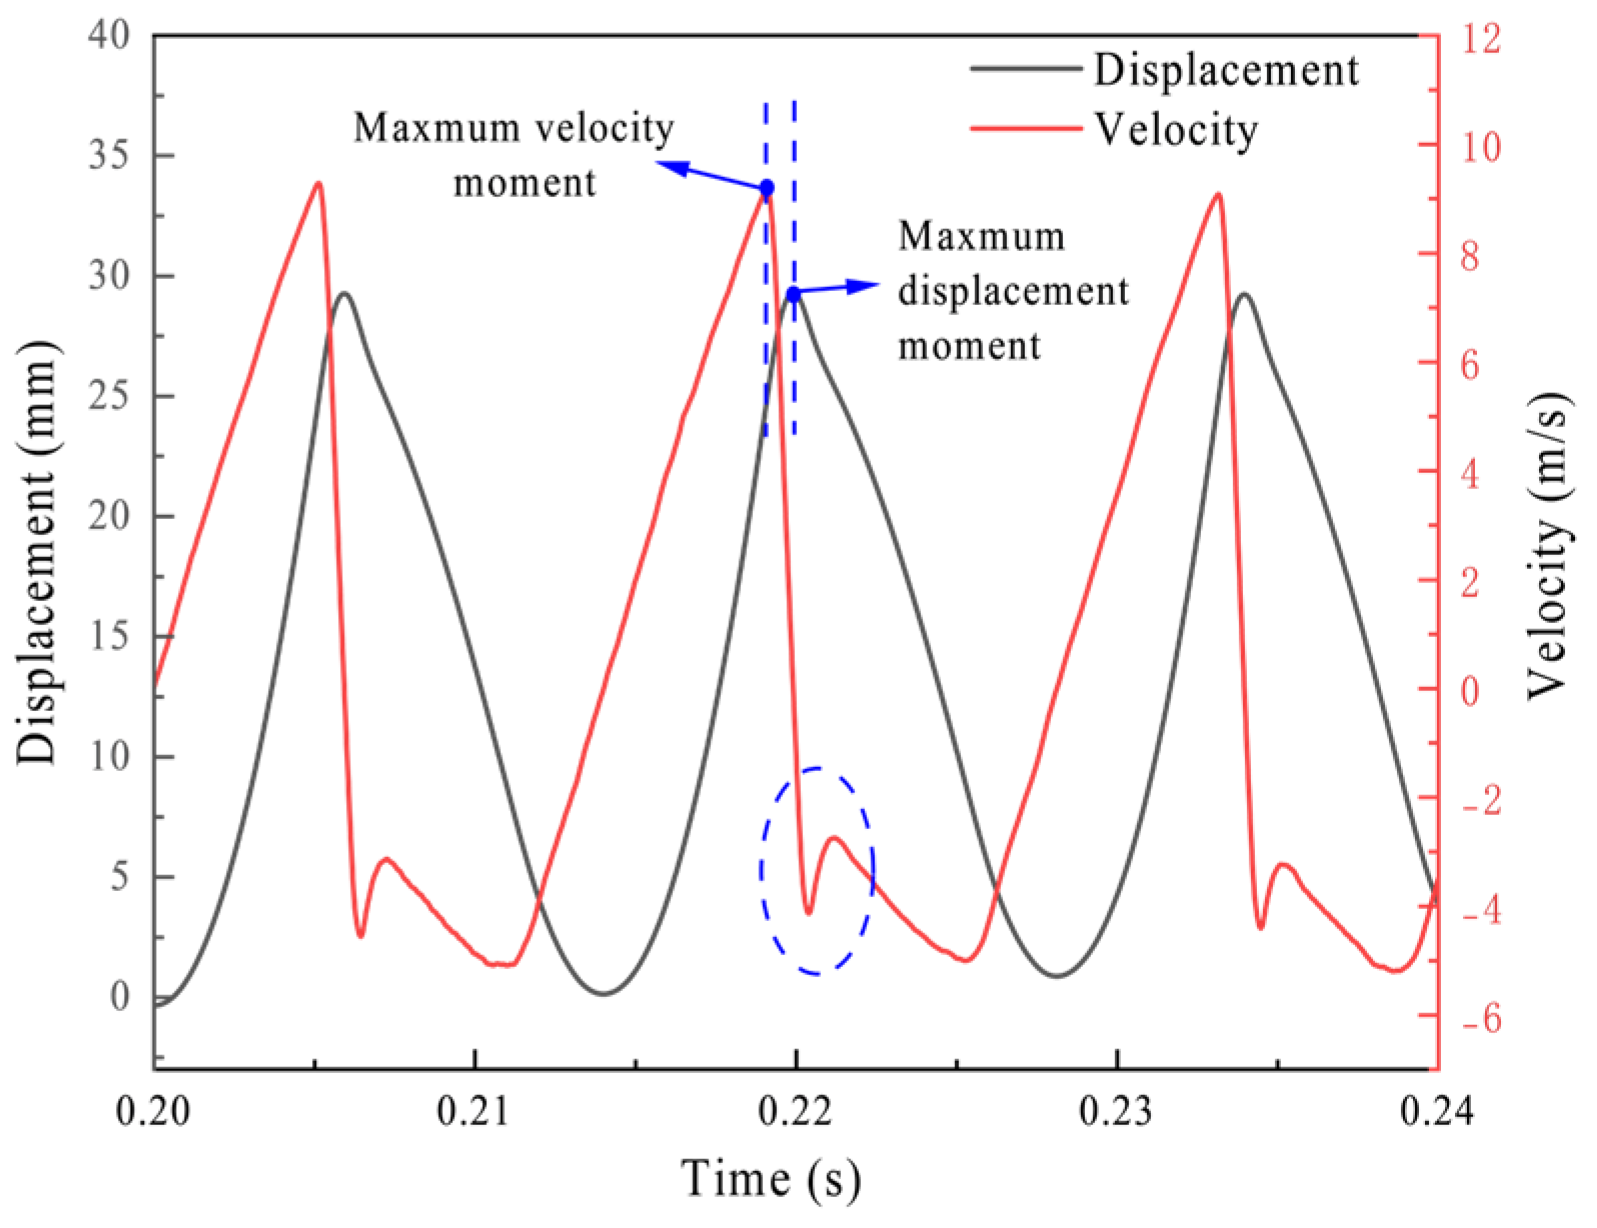
As illustrated in Figure 5, taking an input pressure of 20 MPa as an example, the velocity and displacement curves of the impact piston exhibit a distinct characteristic: the moment when the piston reaches its maximum velocity does not align with the moment when it arrives at the displacement endpoint, resulting in a significant temporal mismatch between the two. Through analysis of these curves, this phenomenon can be attributed to the coupling effect of wave propagation, elastic deformation of the impacted cylinder and damping buffering. When the impact piston collides with the impacted cylinder, the propagation time difference in stress waves ensures that the velocity decay is continuous rather than instantaneous, finally reducing to zero at the moment of maximum displacement. Concurrently, the impacted cylinder’s elasticity induces slight compressive deformation, while its damping characteristic gradually dissipates energy; together, these effects create a buffering system. As a result, the piston does not immediately rebound once its velocity reaches the maximum value but instead continues moving forward for a short distance until its velocity is fully attenuated to zero, after which it initiates the reverse stroke. Additionally, the impact piston does not collide with the impacted cylinder at the moment of maximum velocity, which may be the key reason why the peaks of velocity and displacement do not occur simultaneously. It should be noted that due to the extremely high-frequency nature of the rock drill, this temporal mismatch is extremely brief, approximately 0.00081 s. Given the immense challenge of precisely fitting sub-millisecond transient parameters in macroscopic dynamic simulations, the underlying mechanism governing this temporal mismatch remains to be elucidated via more systematic theoretical analysis and will be further investigated in subsequent numerical simulations focusing on phenomenological mechanisms.
Figure 5.
The mismatch between the impact moment and the maximum velocity of the impact piston (the blue dashed circle refers to a velocity curve ‘spike’ anomaly in the return stroke direction).
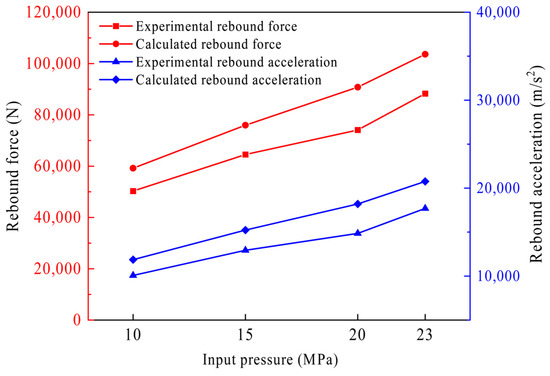
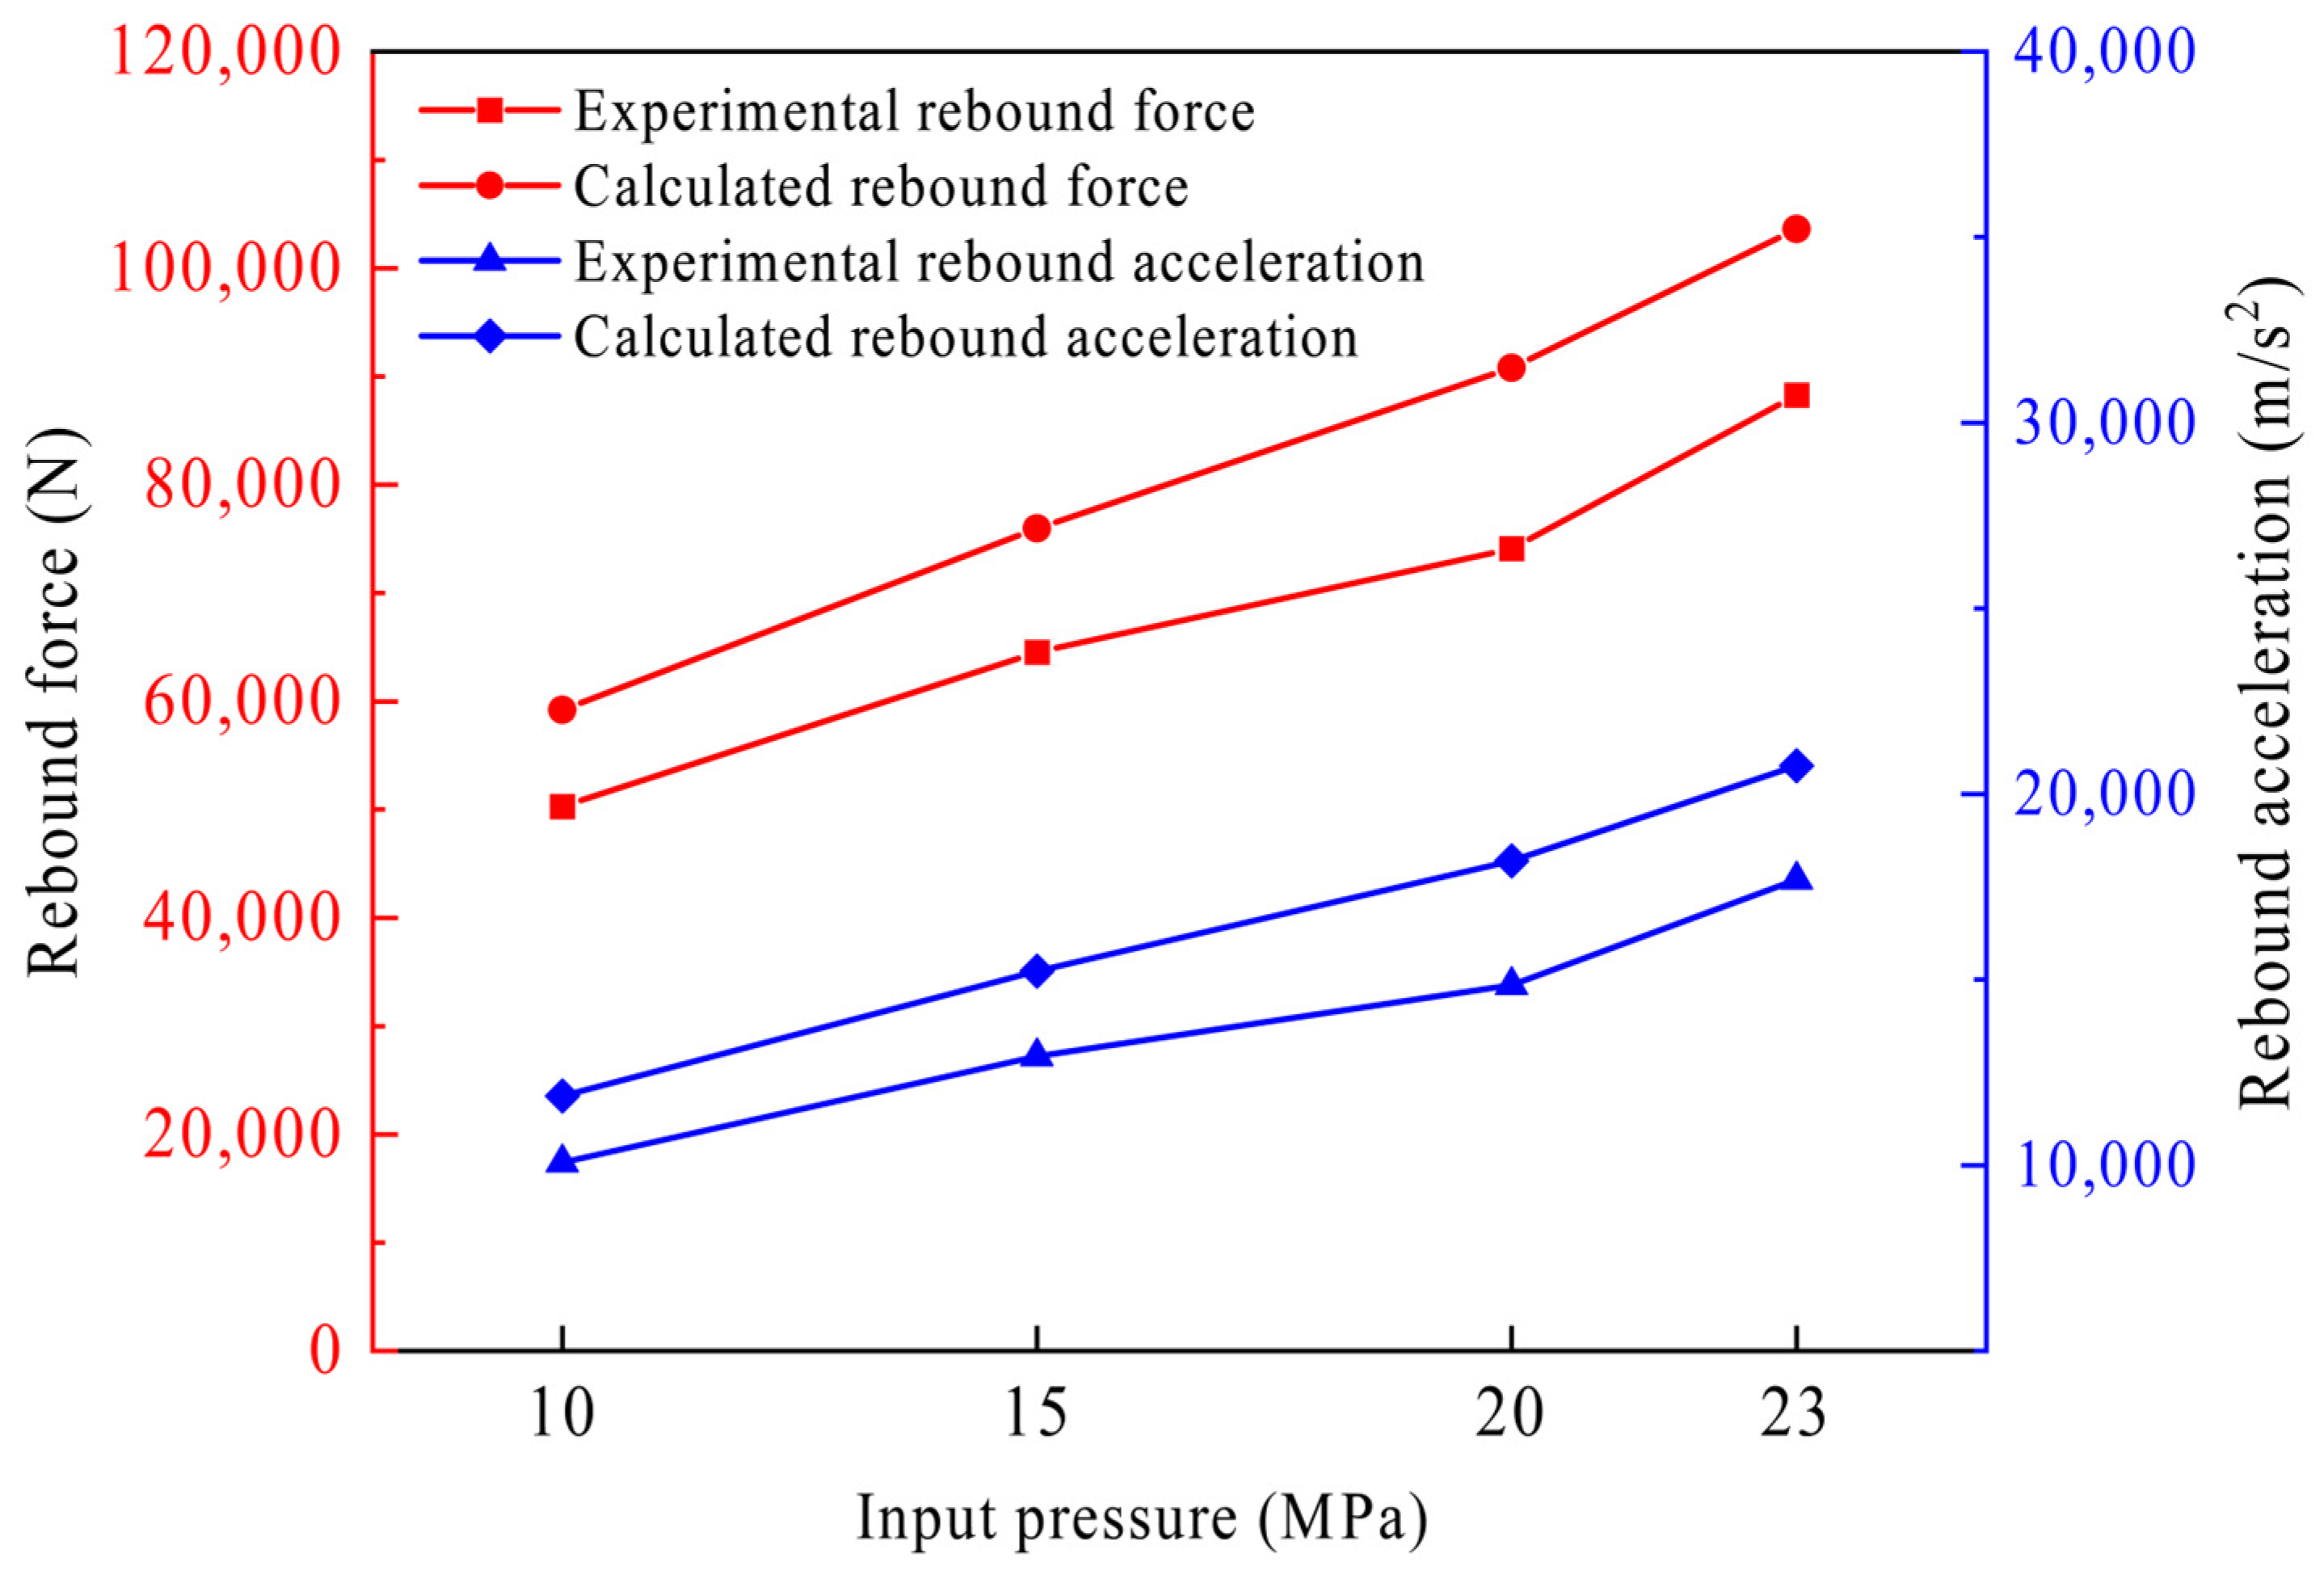
As depicted in Figure 6, the variation trends of the collision rebound force and rebound acceleration, including the theoretically calculated values and experimentally measured results, with input pressure are illustrated. As the input pressure increases, both the collision rebound force and rebound acceleration exhibit a marked upward trend. Meanwhile, the theoretically calculated values of rebound acceleration consistently exceed the experimentally measured ones. This inconsistency arises because the theoretical model does not account for energy losses induced by oil viscous resistance and mechanical friction, which leads to overestimated calculated results relative to the experimental data.
Figure 6.
Comparison of calculated and experimental values of rebound force and acceleration under different input pressures.
4.2. Simulation Results
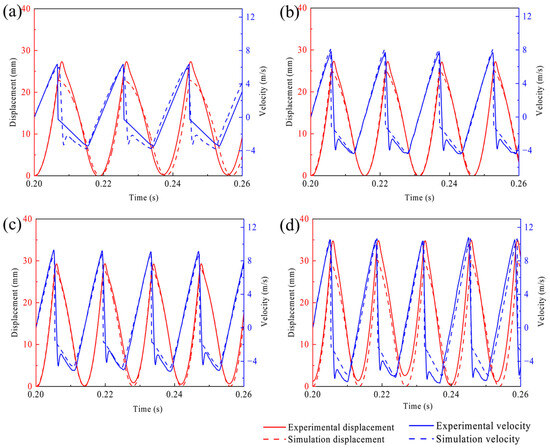
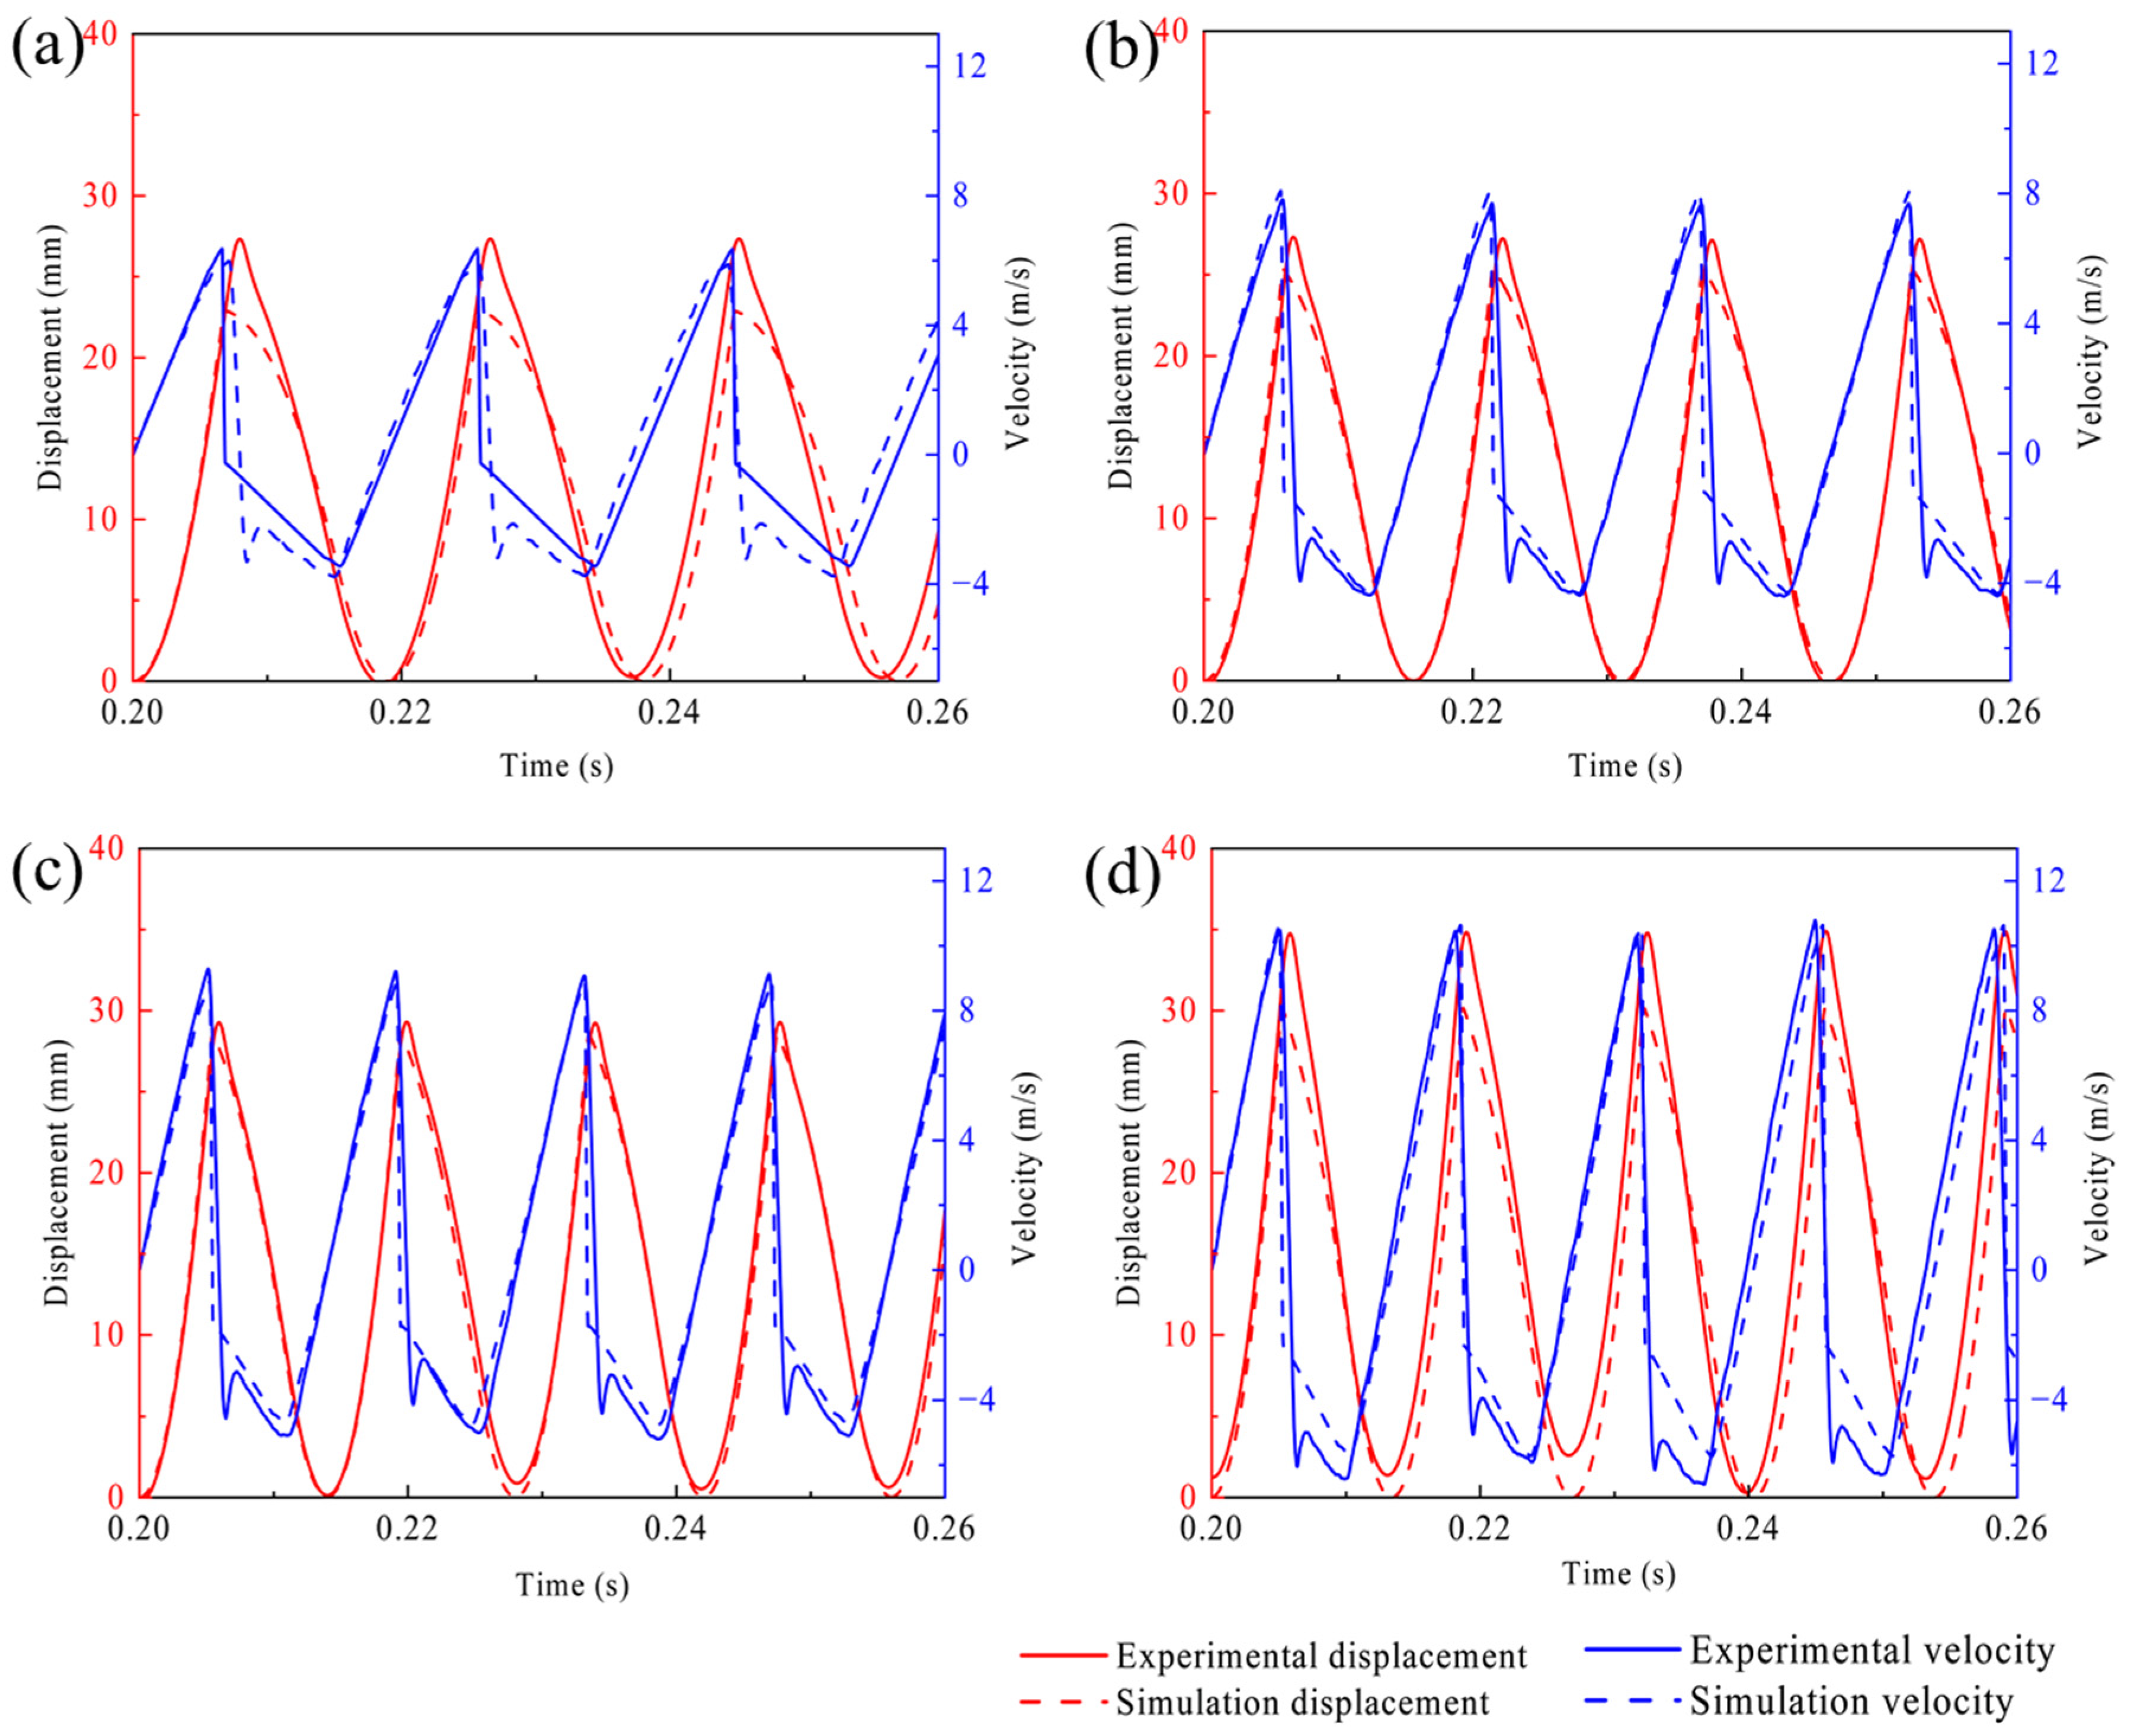
The simulated displacement and velocity of the impact piston at the input pressures of 10 MPa, 15 MPa, 20 MPa, and 23 MPa are compared with the measurement duplicates, as shown in Figure 7. With the increase in input pressure, the peak velocity of the impact piston rises remarkably, accompanied by a slight elevation in the frequency of velocity fluctuations. At all levels of input pressure, the simulated and experimental velocity curves exhibit high consistency in terms of their trends, peak values, and fluctuation frequencies. Correspondingly, as the input pressure climbs, the fluctuation amplitude of the impact piston displacement expands gradually, with the displacement peak increasing synchronously. Across all input pressure conditions, the variation trends of the simulated and experimental displacement curves remain consistent.
Figure 7.
Comparison between experimental and simulated results of the displacement and velocity of the impact piston at the input pressures of (a) 10 MPa, (b) 15 MPa, (c) 20 MPa, (d) 23 MPa.
Nevertheless, owing to the interference of practical factors such as oil temperature fluctuations, ambient disturbances, and mechanical vibration in actual working conditions, the experimental curves fail to overlap perfectly with the simulated counterparts. A detailed comparison of the velocity curves reveals a distinct phenomenon: an extra velocity peak is observed in the experimental curve during the return acceleration stage but absent in the simulated curve. Generally, the formation of this peak is closely associated with the rebound process of the impact piston. When the impact piston reaches its maximum rebound velocity, the velocity curve presents a fluctuation pattern characterized by “a preliminary decrease followed by a subsequent increase”. Specifically, in the initial rebound stage, the rebound inertial force induced by collision exceeds the hydraulic oil pressure in the rear chamber of the impact piston, driving the piston to accelerate in the return stroke. As the oil in the rear chamber is compressed rapidly, a sudden pressure surge occurs, exerting a reverse resistance on the impact piston and thus causing a transient reduction in its velocity, which further contributes to the formation of this fluctuation peak. Subsequently, the reversing valve shifts rightward for adjustment, fully opening the front chamber of the impact piston. At this moment, the pressure difference between the front and rear chambers re-drives the impact piston to accelerate in the return stroke, ultimately forming the velocity peak during the return stage.
In contrast, the simulated curve shows no such evident velocity fluctuation peak during the return stroke, instead demonstrating a stable and continuous acceleration throughout this stage, which is more aligned with the motion characteristics of the impact piston under ideal operating conditions. This discrepancy also indicates that the simulation model can effectively eliminate the adverse effects of interference factors in practical working conditions, including rebound inertial force, abrupt pressure changes in the front and rear chambers, and response lag of the reversing valve. Consequently, it can accurately replicate the theoretical operation principles of the impact system, providing a more reliable theoretical basis for the subsequent optimization of hydraulic system parameters of the rock drill and the enhancement of operational stability during the return stage.
Based on the time-dependent variation results of the impact piston’s motion characteristics, the experimental and simulated data regarding the piston’s impact velocity and impact frequency were extracted, as listed in Table 3. The prediction errors of impact velocity and impact frequency are almost below 5%, which verifies the accuracy and reliability of the established simulation model. The slight discrepancy between the simulated and experimental results mainly occurs during the piston’s return acceleration stage. In this stage, the model neglects the interference effects of rebound inertia force and abrupt pressure changes in the front and rear chambers. These are factors inherent to actual working conditions, and they lead to minor deviations in the velocity fluctuation characteristics.
Table 3.
Comparison of experimental and simulated results (the impact performance parameters from left to right correspond successively to those obtained under input pressures of 10 MPa, 15 MPa, 20 MPa, and 23 MPa).
5. Discussion
To analyze the dynamic behavior of the stroke and return stages, the coupling mechanism between the velocity/displacement of the impact piston, the motion of the reversing valve, and the pressure in the front/rear chambers are elucidated. It further clarifies the collision-triggered stroke reversal and pressure-difference-driven return reversal processes, while characterizing the parameter evolution laws in both stages.
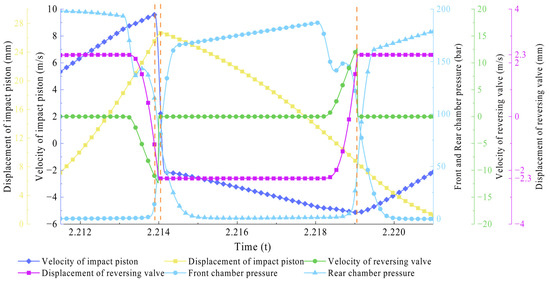
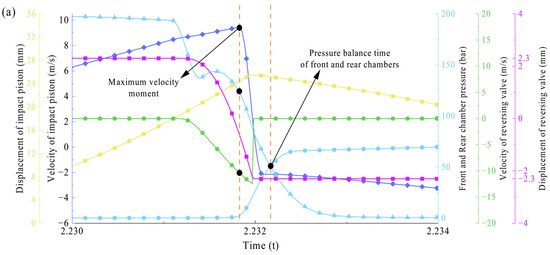
As illustrated in Figure 8, the plot depicts the displacement and velocity curves of the impact piston and reversing valve, as well as the pressure curves of the front and rear chambers. During the collision event, the maximum velocity of the impact piston does not occur at the end of the stroke; instead, the piston travels a short distance further before entering the return stroke. This behavior is associated with the stiffness and damping parameter settings of the collision module and aligns with the experimental observation that the maximum displacement point lags behind the maximum velocity point.
Figure 8.
Displacement and velocity of the impact piston and reversing valve, as well as the pressure of the front chamber and rear chamber (the first orange dashed line represents the velocity peak of the impact piston, the second orange dashed line represents the displacement peak of the impact piston, and the third orange dashed line represents the velocity peak of the reversing valve).
At the end of the stroke stage, the velocity of the impact piston exhibits fluctuations (indicated by the solid dark blue line with diamond markers), which correlate directly with the pressure drop in the rear chamber (indicated by the solid light blue line with triangular markers). At this moment, oil in the rear chamber begins to flow into the left-pushing valve chamber of the reversing valve, pushing the spool to the right and initiating the reversal action. Since the rear chamber pressure remains higher than the front chamber pressure, the impact piston maintains an accelerated state. Notably, the impact piston reaches its velocity peak (indicated by dashed orange lines on the left) before the reversing valve achieves its maximum velocity (indicated by the solid green line with circular markers), and this velocity peak occurs prior to the piston’s displacement peak (indicated by the solid yellow line with square markers). This temporal discrepancy is caused by the residual pressure difference between the front chamber and the rear chamber, which continues to drive the impact piston forward after peak velocity until collision occurs. From the reversing valve’s displacement curve, a negative displacement value at this stage indicates that the rear chamber’s oil inlet passage is sealed, while the front chamber’s passage enters a ready-to-open state. From the impact piston’s velocity peak to its displacement peak, the reversing valve continues moving rightward. Once the impact piston completes the collision, the reversing valve travels to its right limit position and stops. At this point, the front chamber’s oil inlet passage fully opens, and the stroke stage concludes.
At the end of the return stage, the impact piston’s velocity also fluctuates, a phenomenon directly linked to the pressure drop in the front chamber. Here, oil in the front chamber flows into the right-pushing valve chamber of the reversing valve, pushing the spool leftward and triggering the reversal process. As the front chamber pressure remains higher than the rear chamber pressure, the impact piston sustains its return acceleration. Unlike the stroke stage with collision-dependent reversal, the return-stage reversal is driven by the pressure difference between the front and rear chambers. When the impact piston reaches its maximum return velocity, the front and rear chamber pressures tend to equalize; the curve shows that the reversing valve has shifted to the right side, and the front chamber’s oil inlet passage is fully open. Subsequently, the front chamber pressure rises while the rear chamber pressure decreases, causing the impact piston to enter the return deceleration stage. This continues until the piston’s velocity drops to zero, at which point the next stroke stage commences.
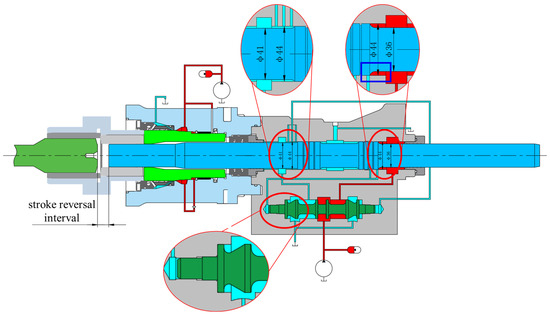
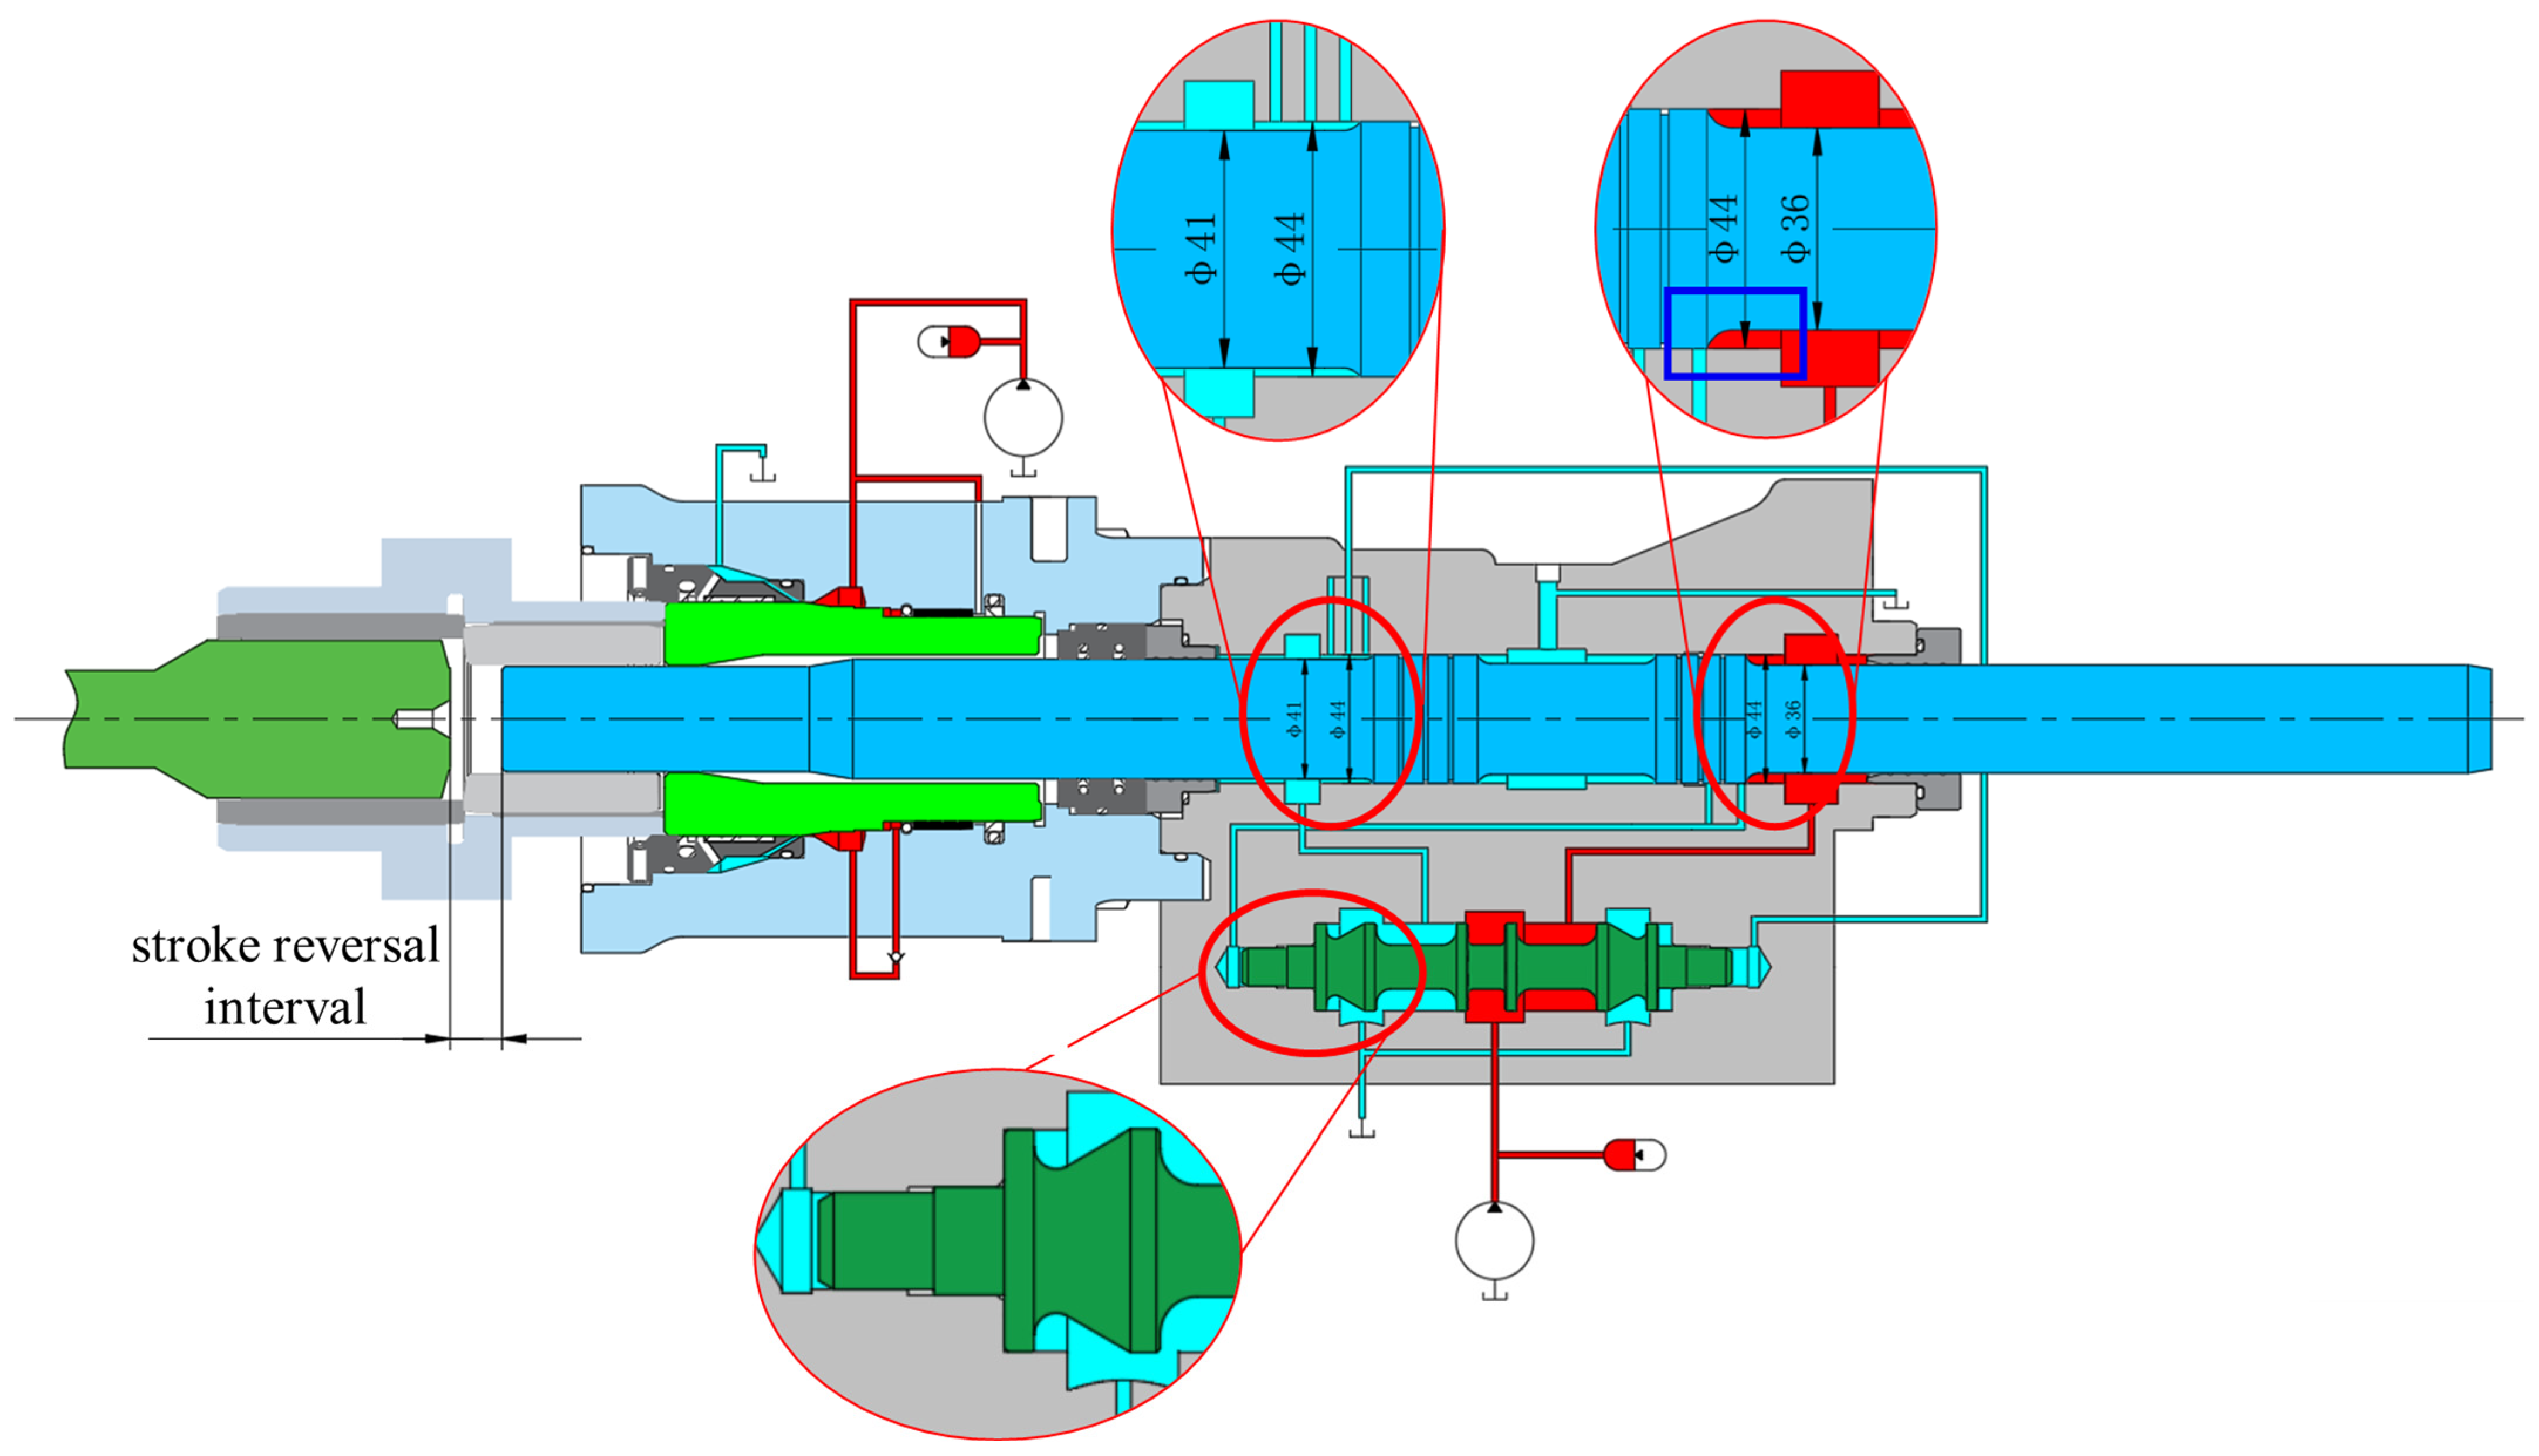
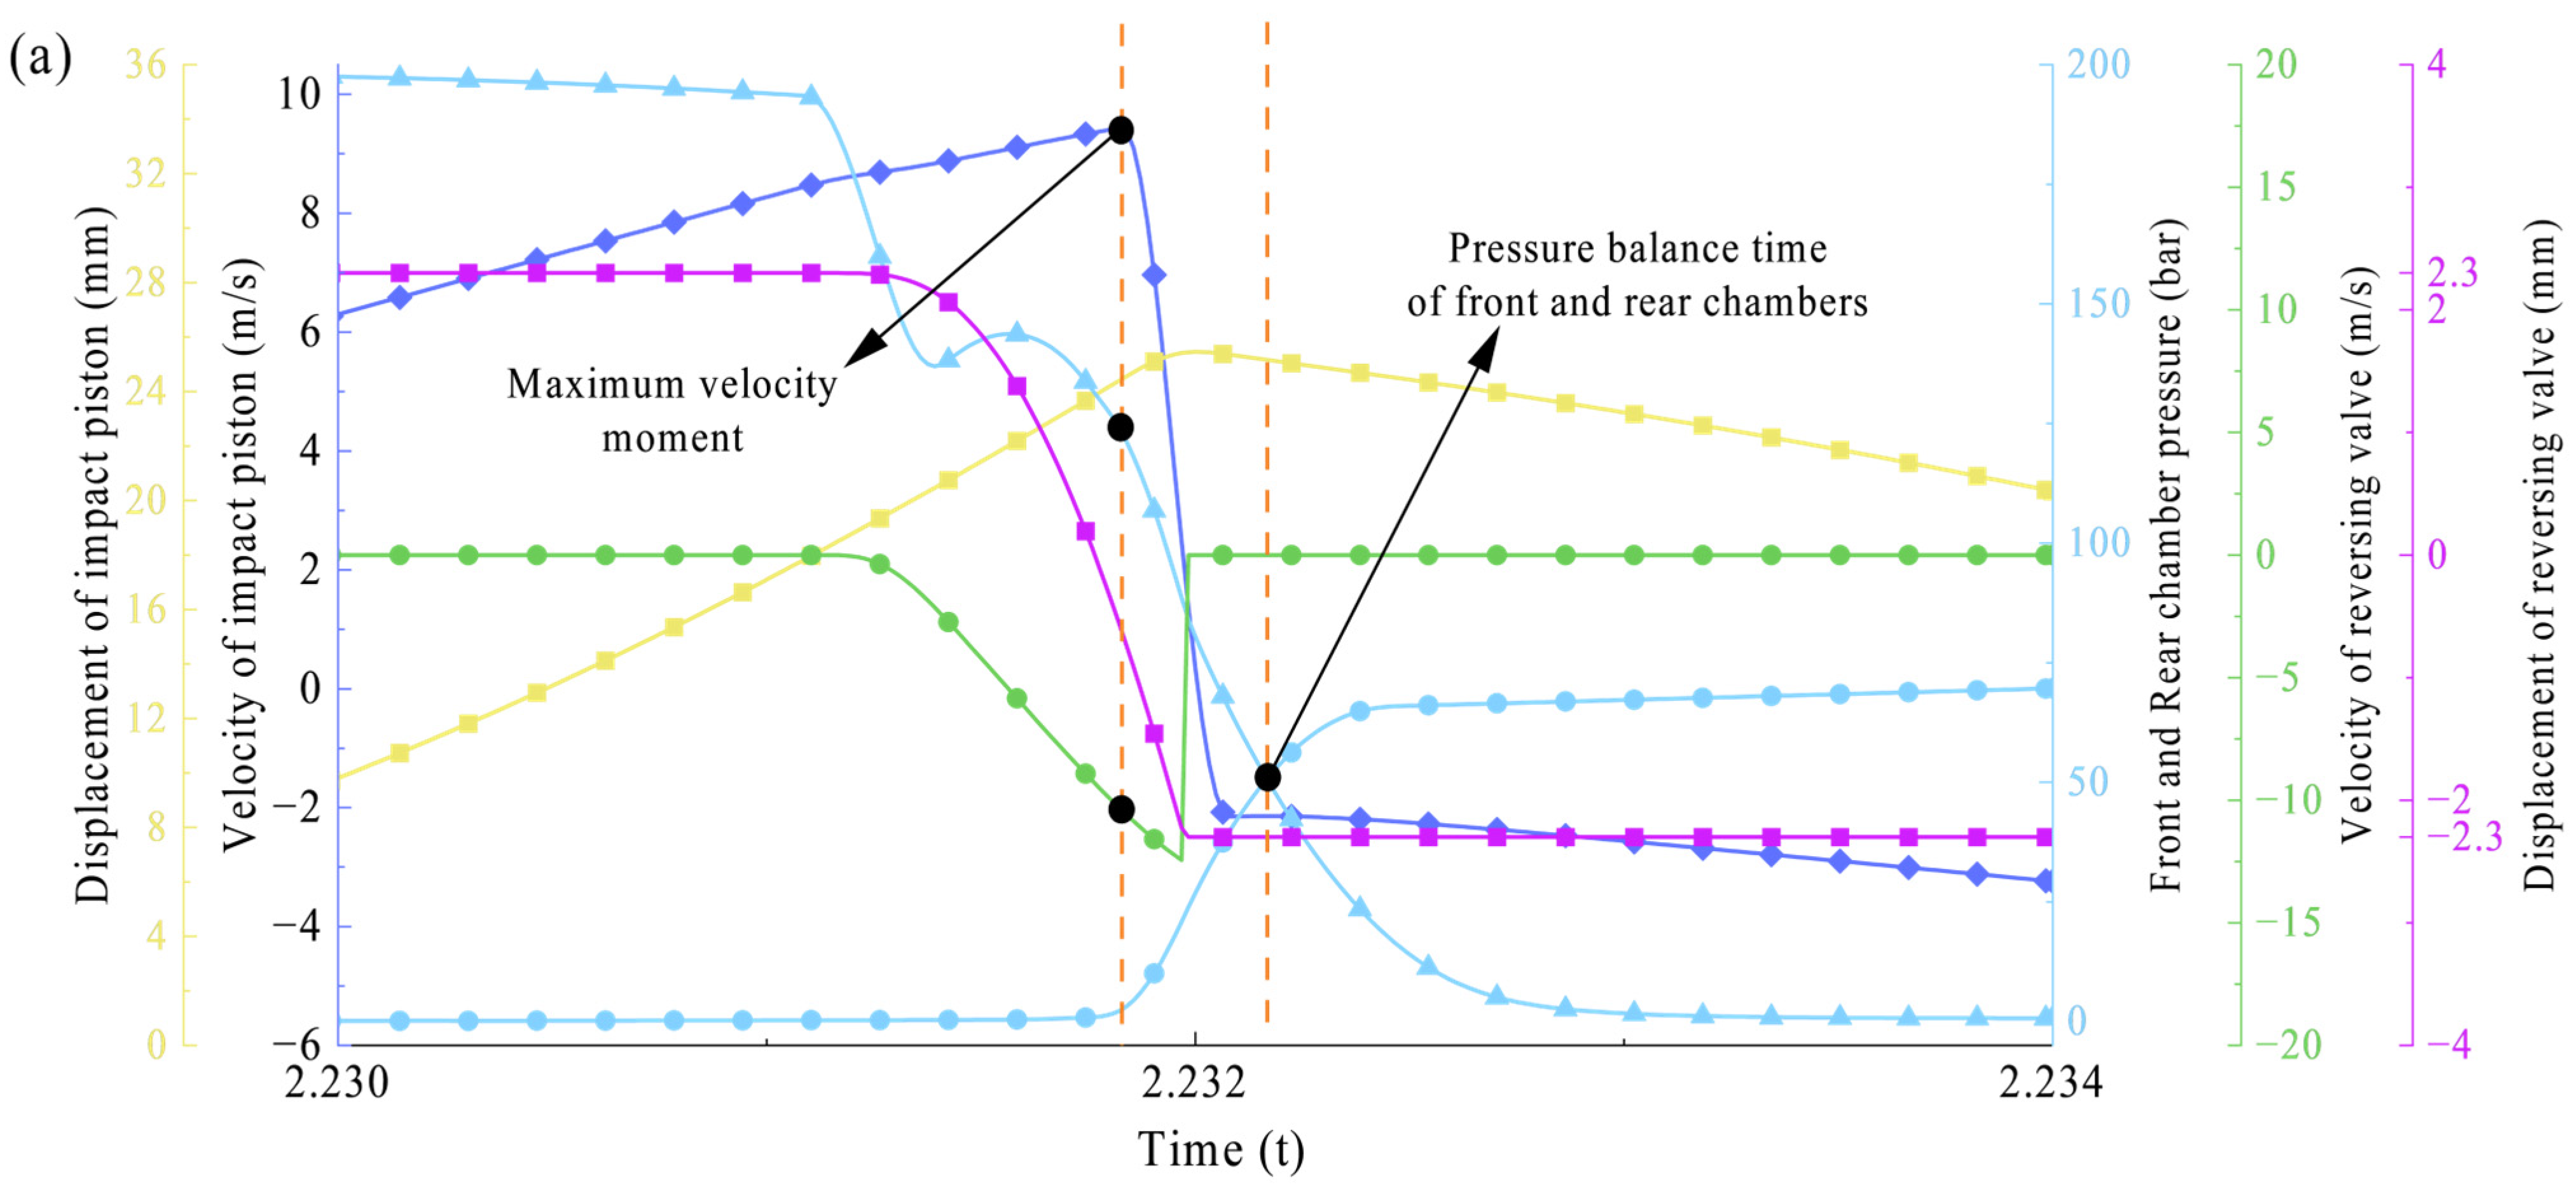
During the movement of the impact piston, it is critical to determine the optimal collision point to minimize energy loss and ensure the piston collides with the drill bit tail at its maximum velocity. A delayed or advanced collision point in the stroke stage will reduce the utilization efficiency of impact energy, which is induced by a deviation in the stroke reversal interval. As illustrated in Figure 9, when the stroke reversing signal port is opened, the reversing valve immediately shifts to switch the oil circuit to the right position. Meanwhile, when the buffer piston is in the balanced position, the distance between the impact piston and the drill bit tail is defined as the stroke reversal interval.
Figure 9.
Illustration of stroke reversal interval.
However, the effective acting areas of the front chamber and the rear chamber are different in Figure 9. Thus, an equivalent calculation needs to be carried out for the pressures in the front and rear chambers, as shown in Equation (21). When the equivalent pressures derived from the equivalent calculation are equal, this point is defined as the force balance point of the front and rear chambers.
where is the effective acting area of the front chamber, is the effective acting area of the rear chamber, and = 2.51.
The equivalent pressure of the front chamber and the rear chamber is thus defined as:
where is the actual pressure of the front chamber and is the actual pressure of the rear chamber.
The stroke reversal interval varies dynamically with the balance position of the buffer piston. An excessively large or small advance will prevent the impact piston from colliding with the drill bit tail at its maximum velocity. Take input pressure of 20 MPa as an example, the characteristics and influence of different interval conditions are analyzed, as shown in Figure 10.
Figure 10.
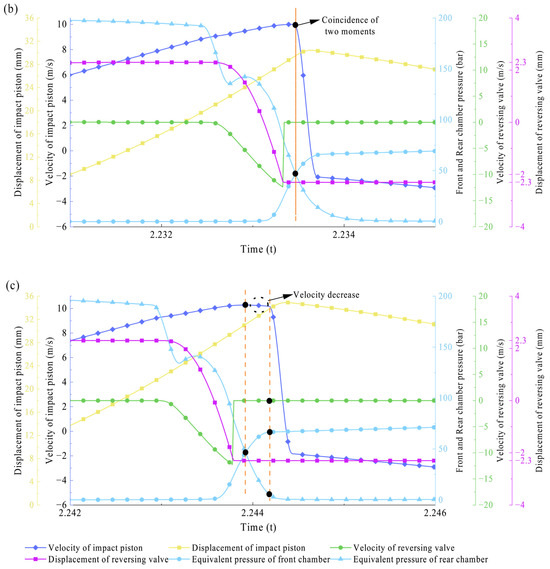
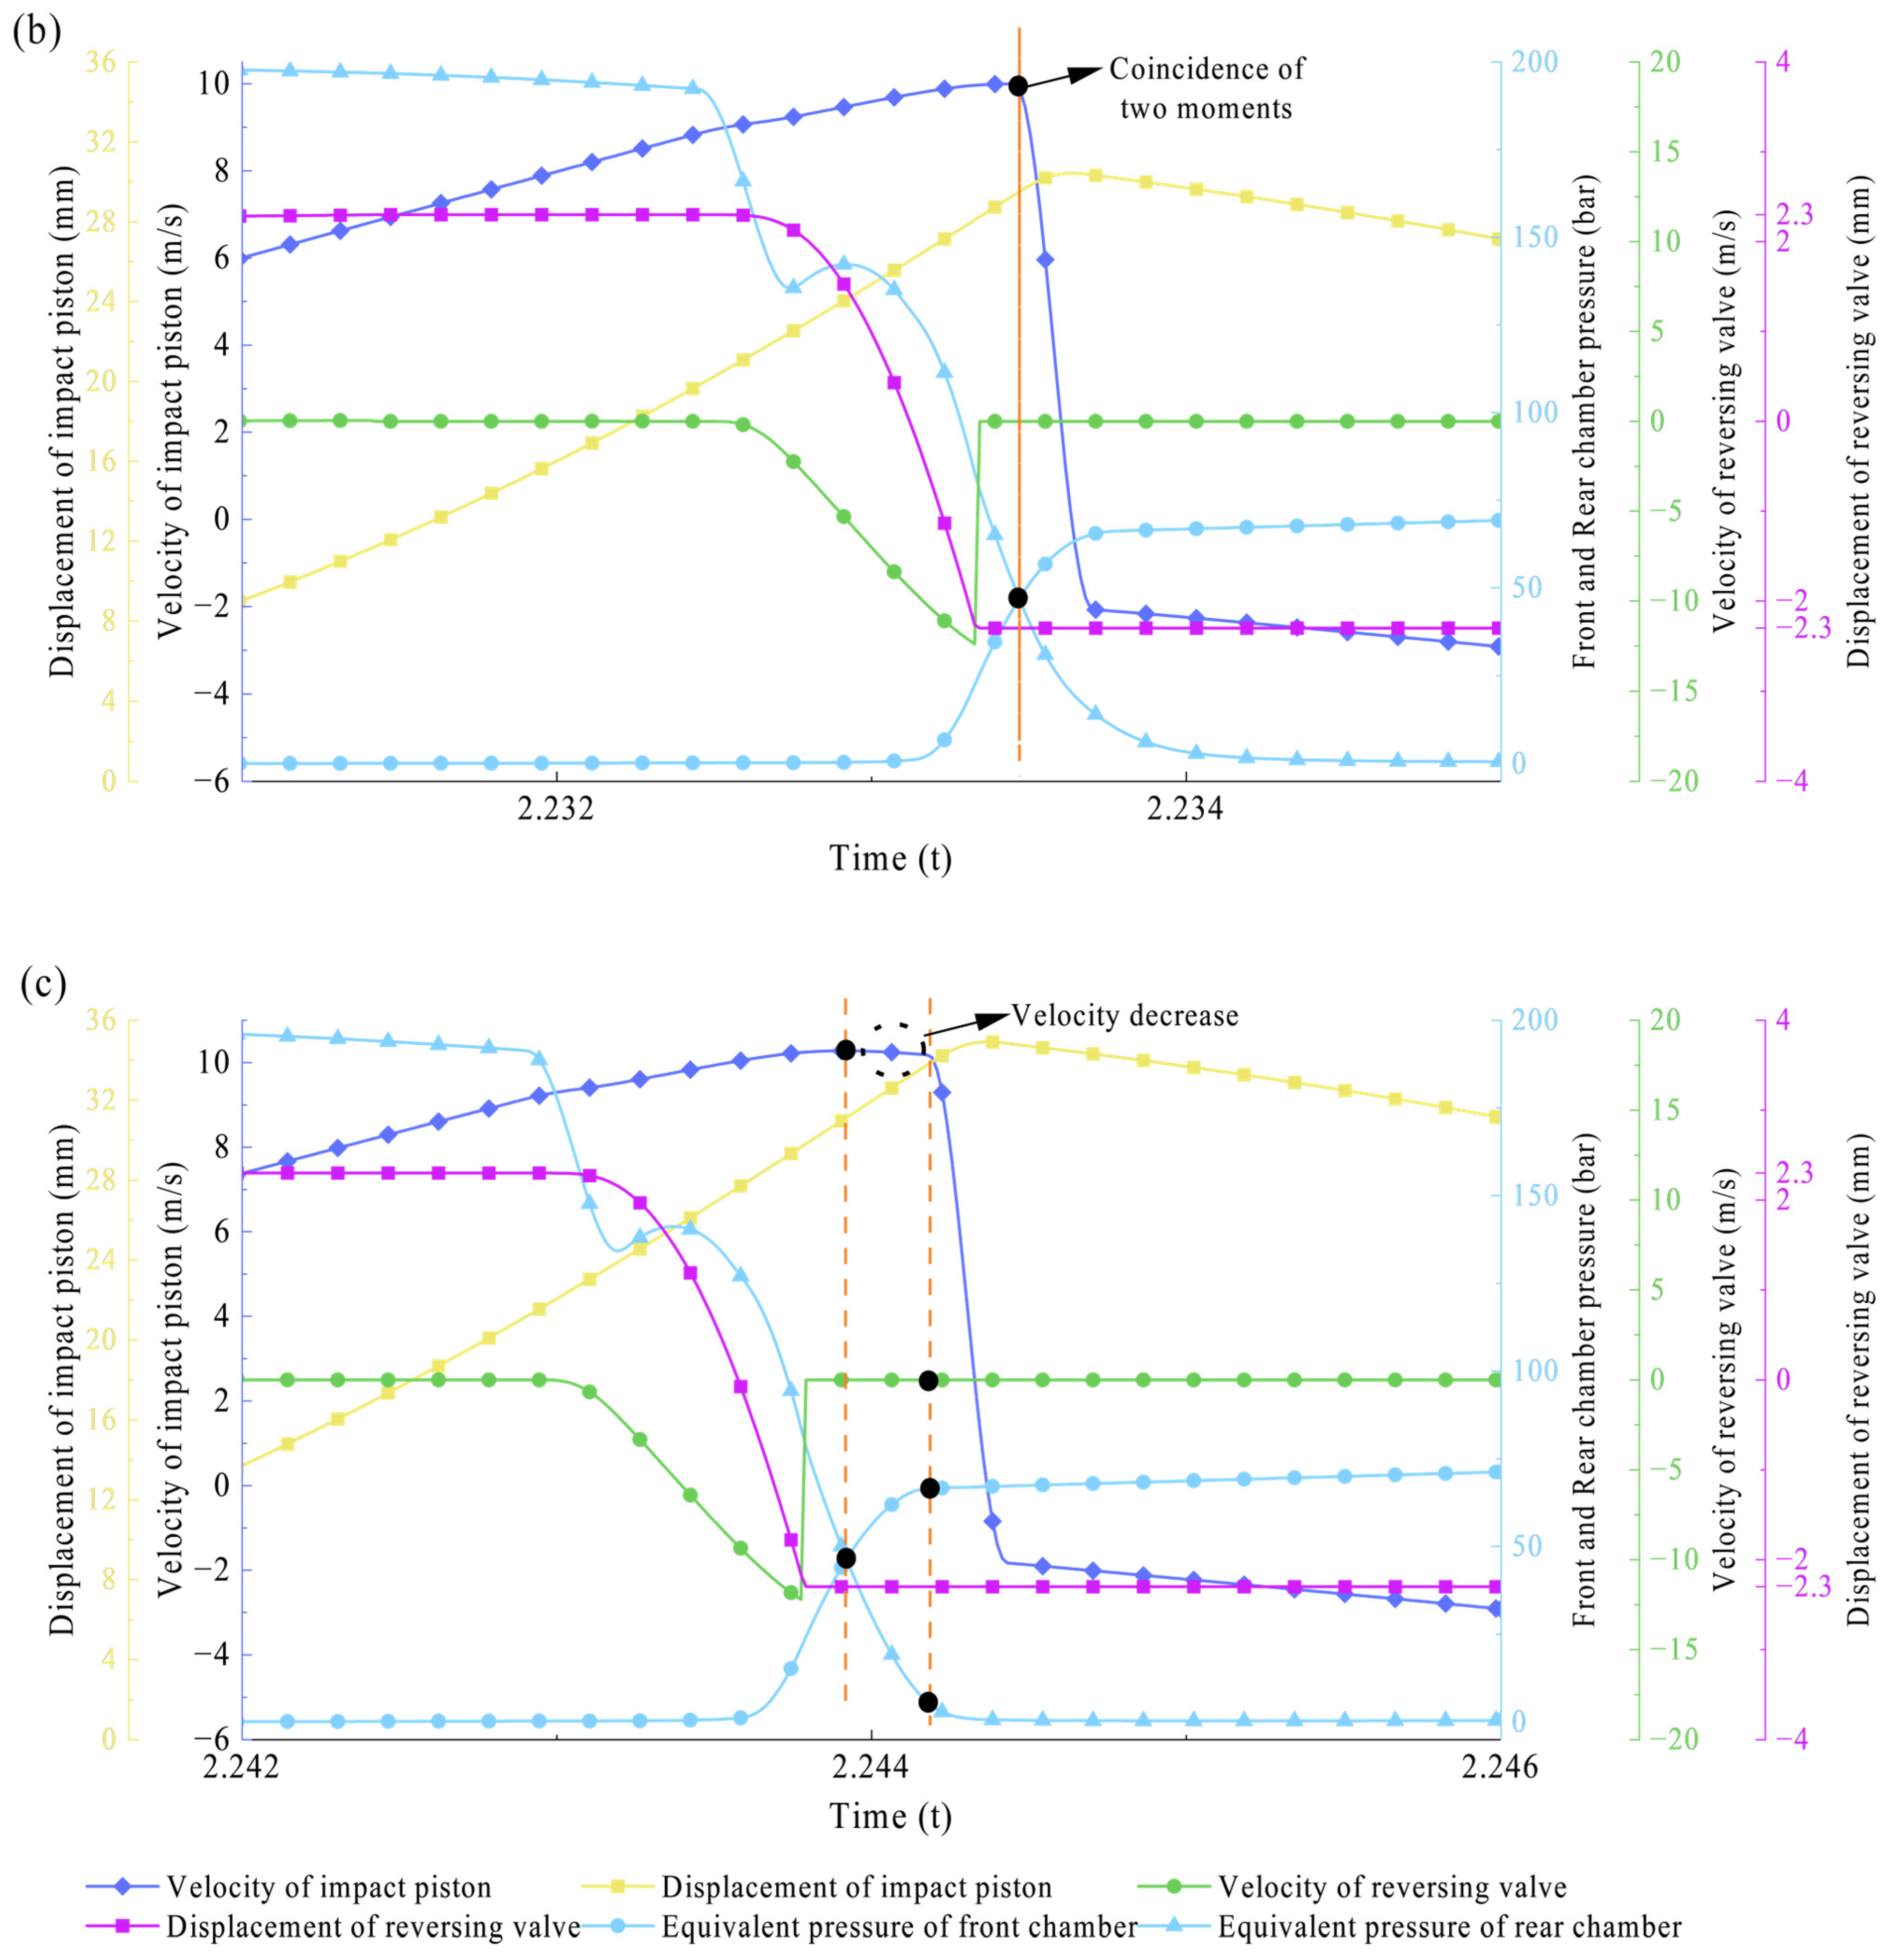
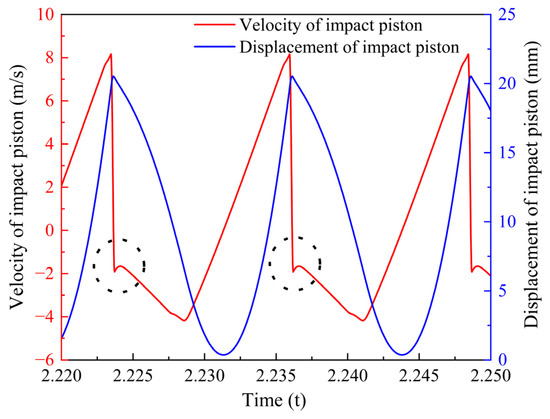
The influence of stroke reversal interval: displacement and velocity of the impact piston and reversing valve, as well as the pressure of the front chamber and rear chamber at (a) the smaller interval (7 mm); (b) right interval (12 mm); (c) the larger interval (17 mm). The orange dashed lines indicate the collision moment and the point where the front and rear chambers are in equilibrium, respectively. Meanwhile, the black dots mark the corresponding chamber pressures, the velocity of the reversing valve, and the displacement of the impact piston at these moments, based on their respective reference axes.
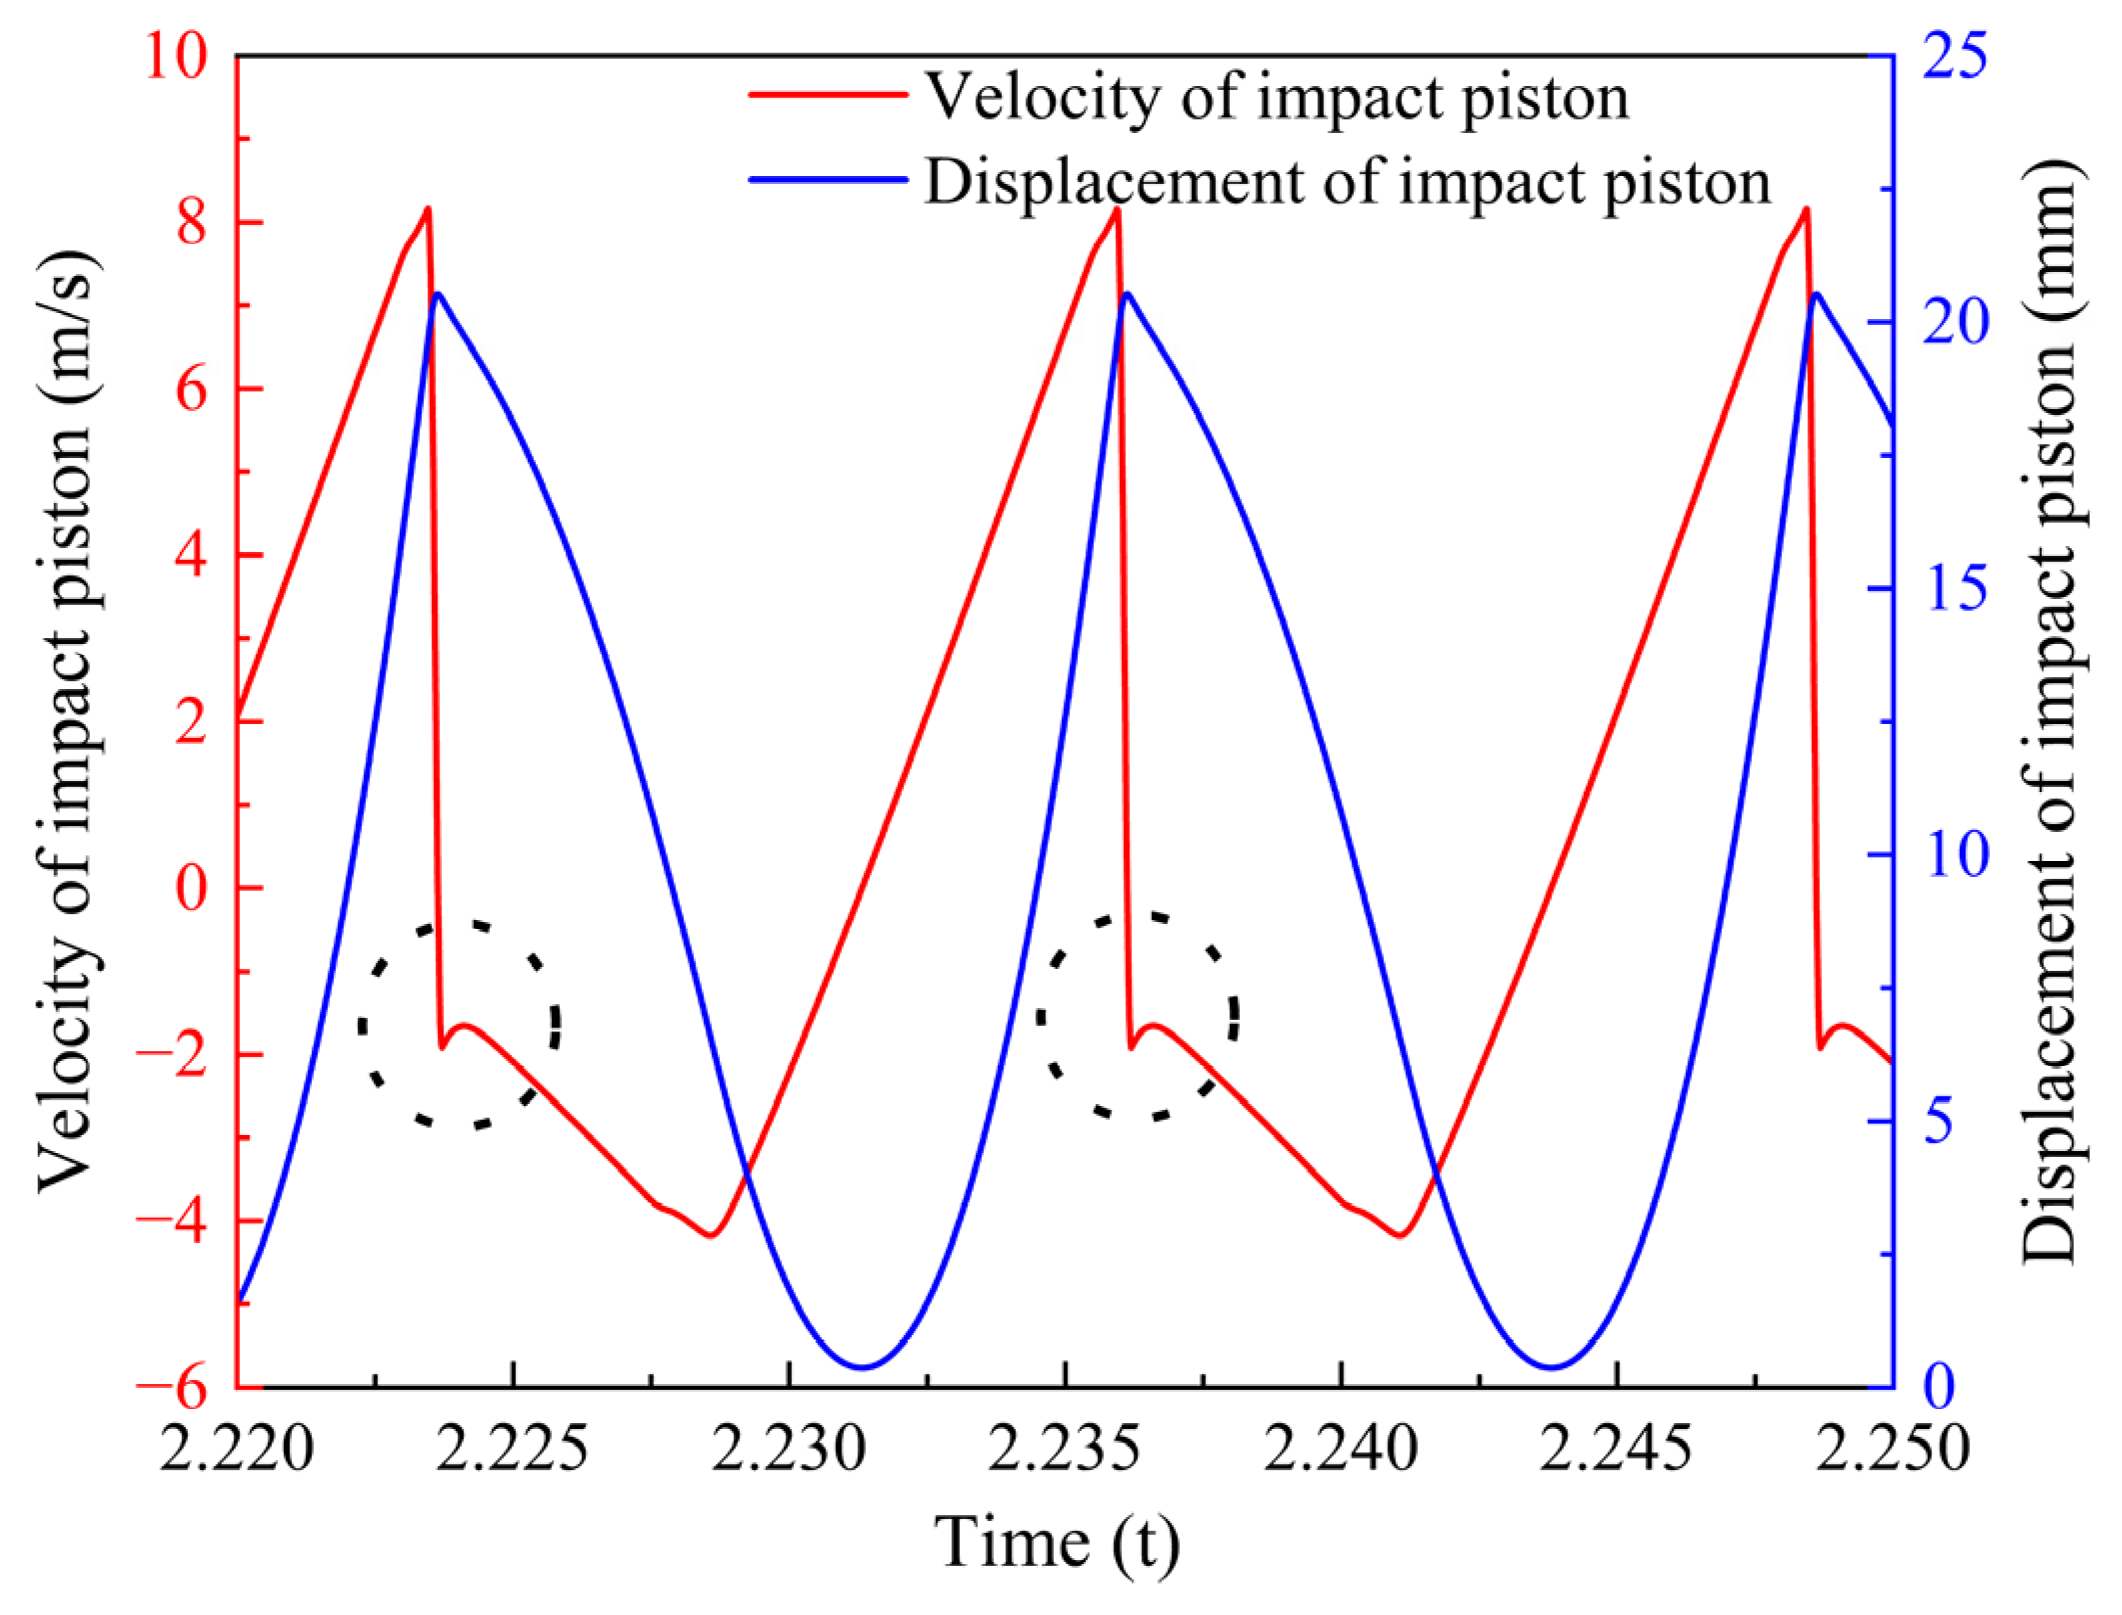
When the stroke reversal interval is 7 mm in Figure 10a, the impact piston reaches a maximum velocity of 9.4 m/s and a maximum displacement of 25.4 mm, but it collides before reaching the maximum velocity. At the moment of collision, the reversing valve remains in a dynamic state, and the port connecting to the front chamber is not opened. Consequently, the pressure in the front chamber is zero, while the rear chamber maintains a relatively high pressure, resulting in the dissipation of high-pressure oil energy. Furthermore, the collision occurs ahead of the force balance point between the front and rear chambers. Meanwhile, after the collision, the rebound inertial force of the impact piston may exceed the rear chamber pressure, giving rise to a velocity curve “spike” anomaly in the return stroke direction. As illustrated in Figure 11 (black dashed circle), this characteristic is consistent with the trend of the impact piston velocity curve obtained from experimental tests, which verifies that the proposed simulation model can effectively interpret the special phenomenon observed in the experiments. Specifically, when the stroke reversal interval is excessively small, the front chamber pressure remains low at the moment of collision, causing the impact piston to complete the collision without reaching the maximum velocity. Under such circumstances, the rebound inertial force of the piston exceeds the rear chamber pressure, inducing a brief reverse movement. However, due to insufficient front chamber pressure, the impact piston cannot be driven to accelerate continuously during the return stroke, which is manifested as local fluctuations in the velocity curve.
Figure 11.
Velocity and displacement curves at the stroke reversal interval of 7 mm.
When the stroke reversal interval is 12 mm in Figure 10b, the motion characteristics of the impact piston reach an optimal state. The maximum velocity of the impact piston increases to 10 m/s, with the maximum displacement expanding to 30.4 mm. At the collision moment, the reversing valve is in a balanced state, and the forces in the front and rear chambers are in equilibrium—with the rear chamber pressure showing a downward trend and the front chamber pressure exhibiting an upward trend. The reversing valve has already completed the reversing action, and the collision moment is essentially coincident with the pressure balance of the front and rear chambers, which is defined as the theoretically optimal collision point. In comparison with the 7 mm interval condition, the impact piston can collide at the maximum velocity under this working condition, leading to the optimal energy utilization efficiency.
When the stroke reversal interval is increased to 17 mm in Figure 10c, the maximum velocity of the impact piston rises to 10.28 m/s, and the maximum displacement further increases to 34.9 mm. Nevertheless, the pressure balance point between the front and rear chambers is reached before the collision occurs, with the maximum velocity point coinciding with the pressure balance point of the two chambers. As the front chamber pressure continues to increase, the impact piston begins to decelerate until the collision takes place. At the collision moment, the reversing valve has come to a complete stop, and the oil inlet port of the front chamber is fully opened, resulting in a higher pressure in the front chamber than in the rear chamber. This pressure difference exerts a reverse resistance on the impact piston during the collision process, which not only reduces the stability of the collision and induces vibration of the equipment body but also significantly impairs the effective utilization efficiency of the impact energy.
When the stroke reversal interval is set at 17 mm, both the maximum velocity and impact velocity of the impact piston are higher than those recorded at the 12 mm interval setting. This is because a larger stroke reversal interval shifts the force balance point between the front and rear chambers of the piston forward during collision, which prolongs the duration of the front chamber pressure exceeding that of the rear chamber in the return stroke stage, thereby extending the acceleration time of the return stroke. The extended return stroke acceleration time not only boosts the piston’s maximum return velocity but also increases the return stroke travel distance. In the subsequent stroke stage, the combined effect of the increased return stroke travel distance and the larger stroke reversal interval further lengthens the stroke acceleration time. Thus, the piston achieves higher maximum velocity and impact velocity under the 17 mm interval condition.
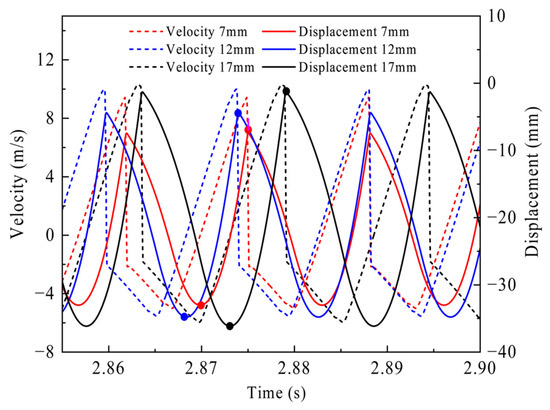
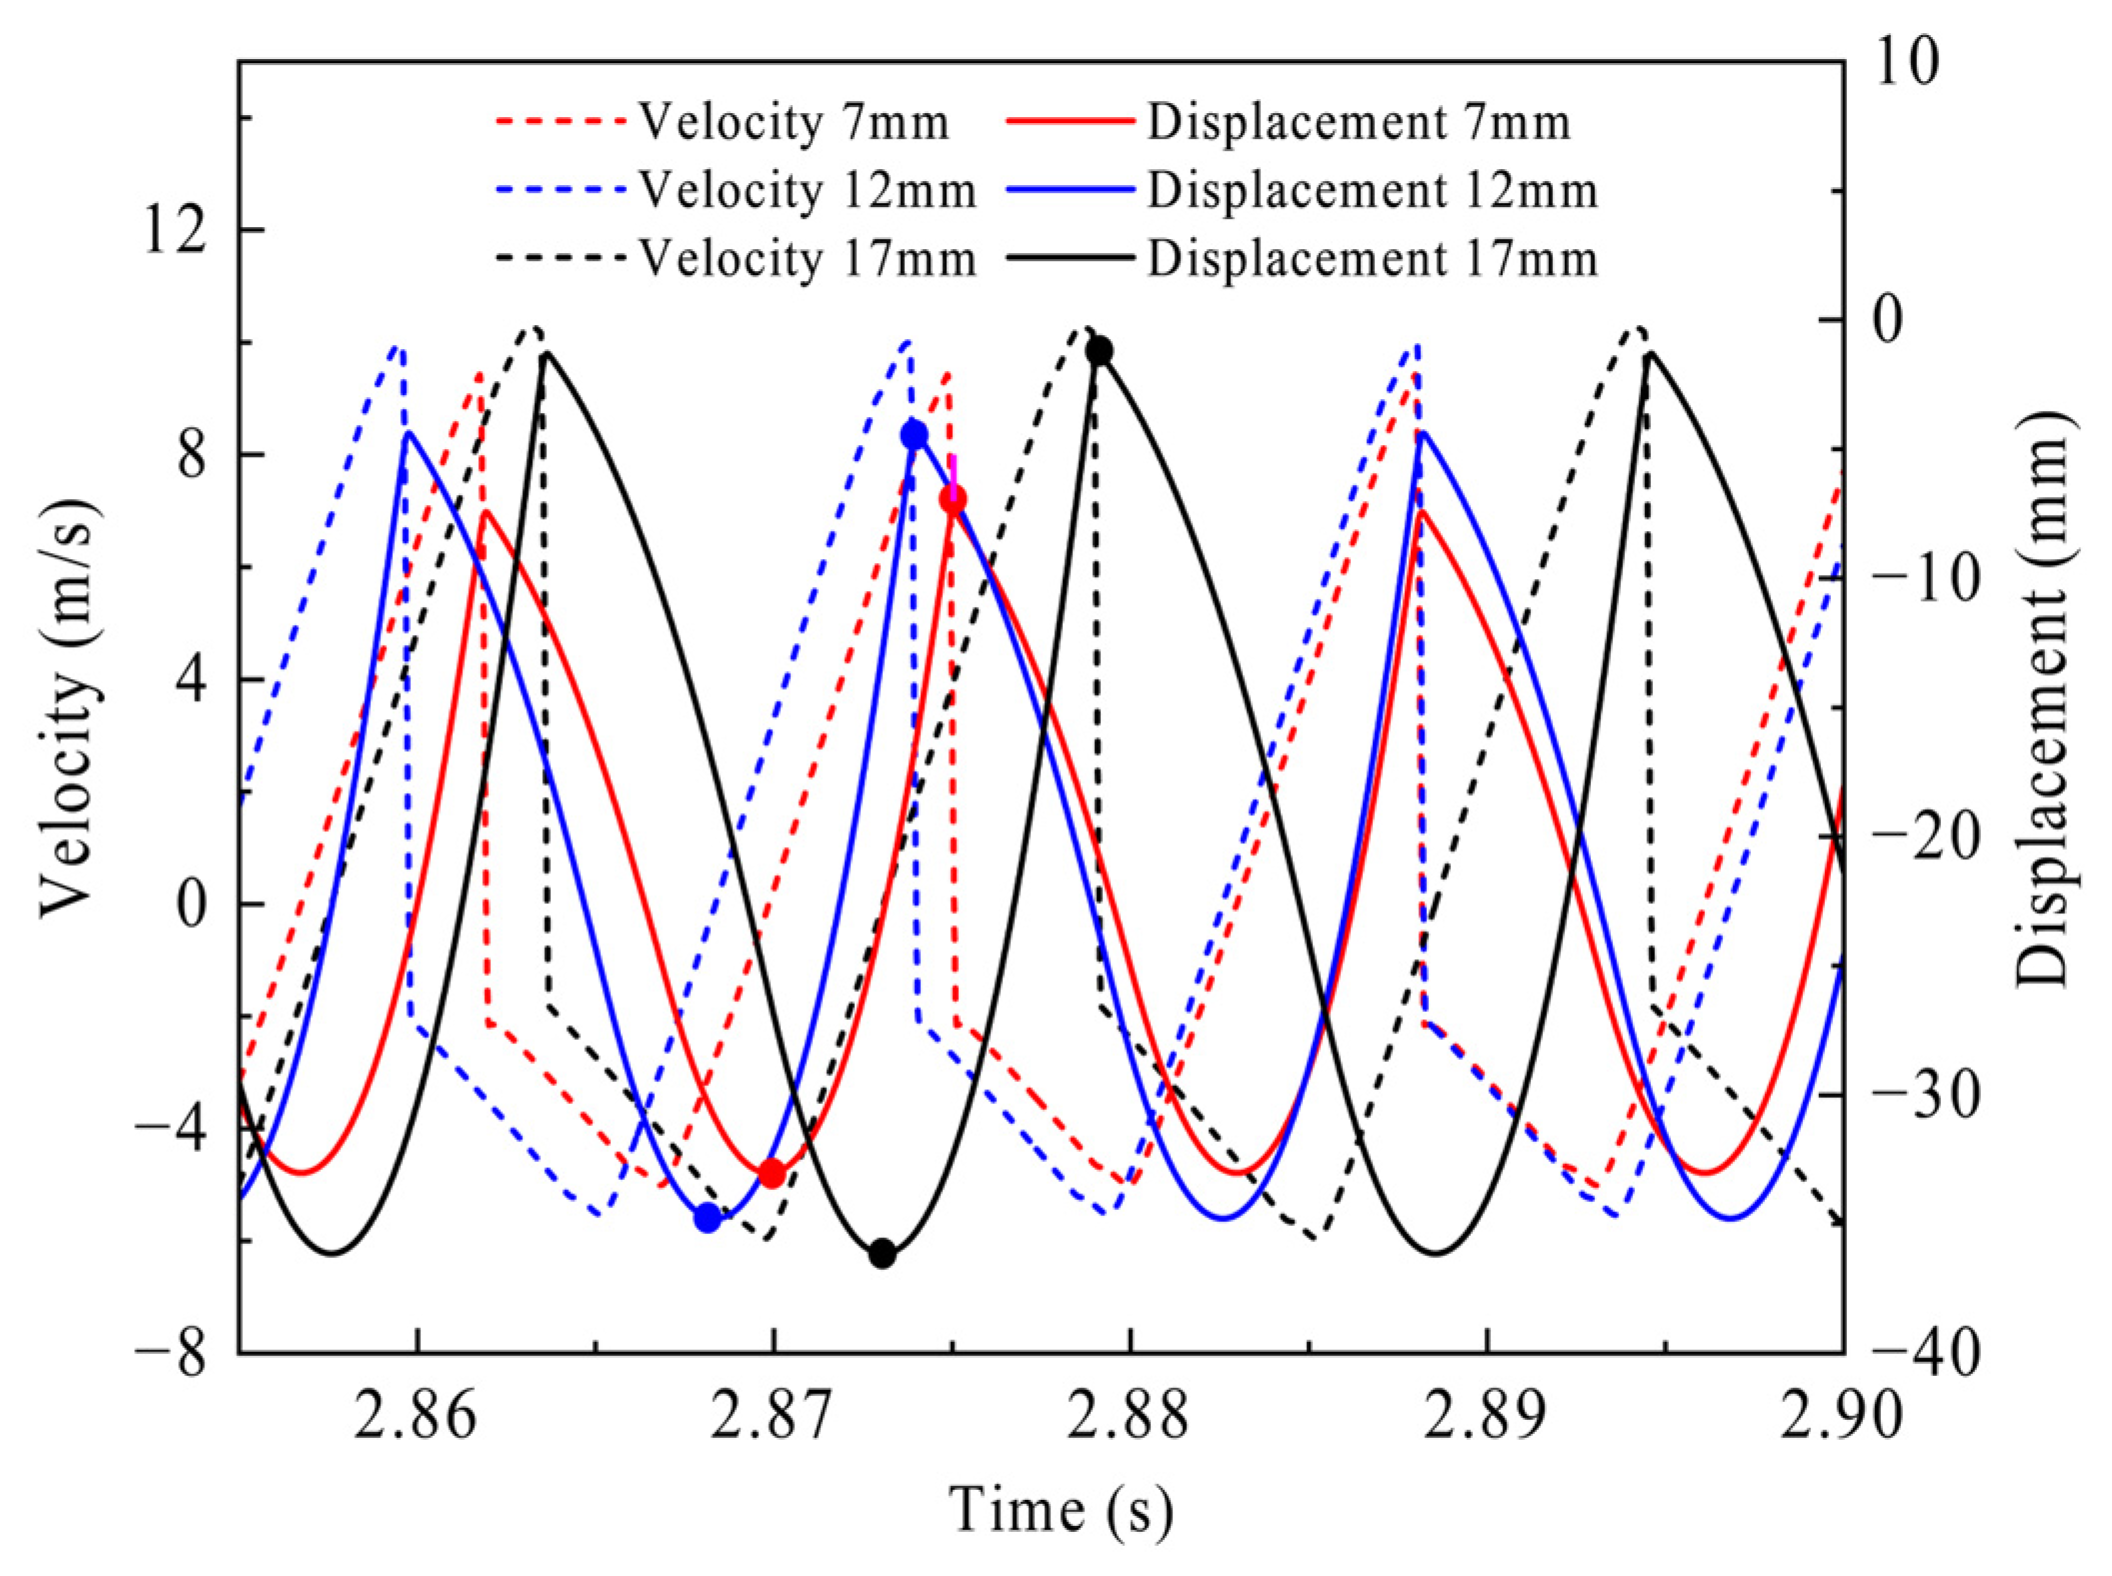
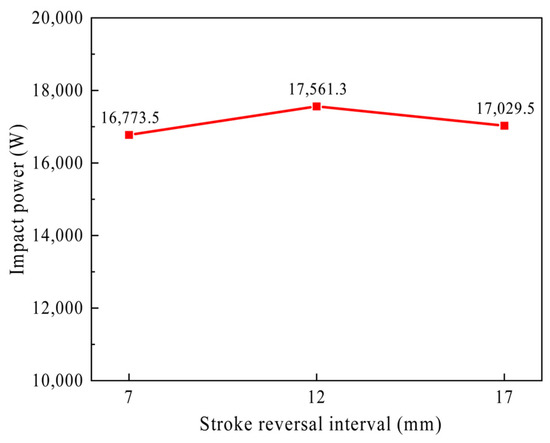
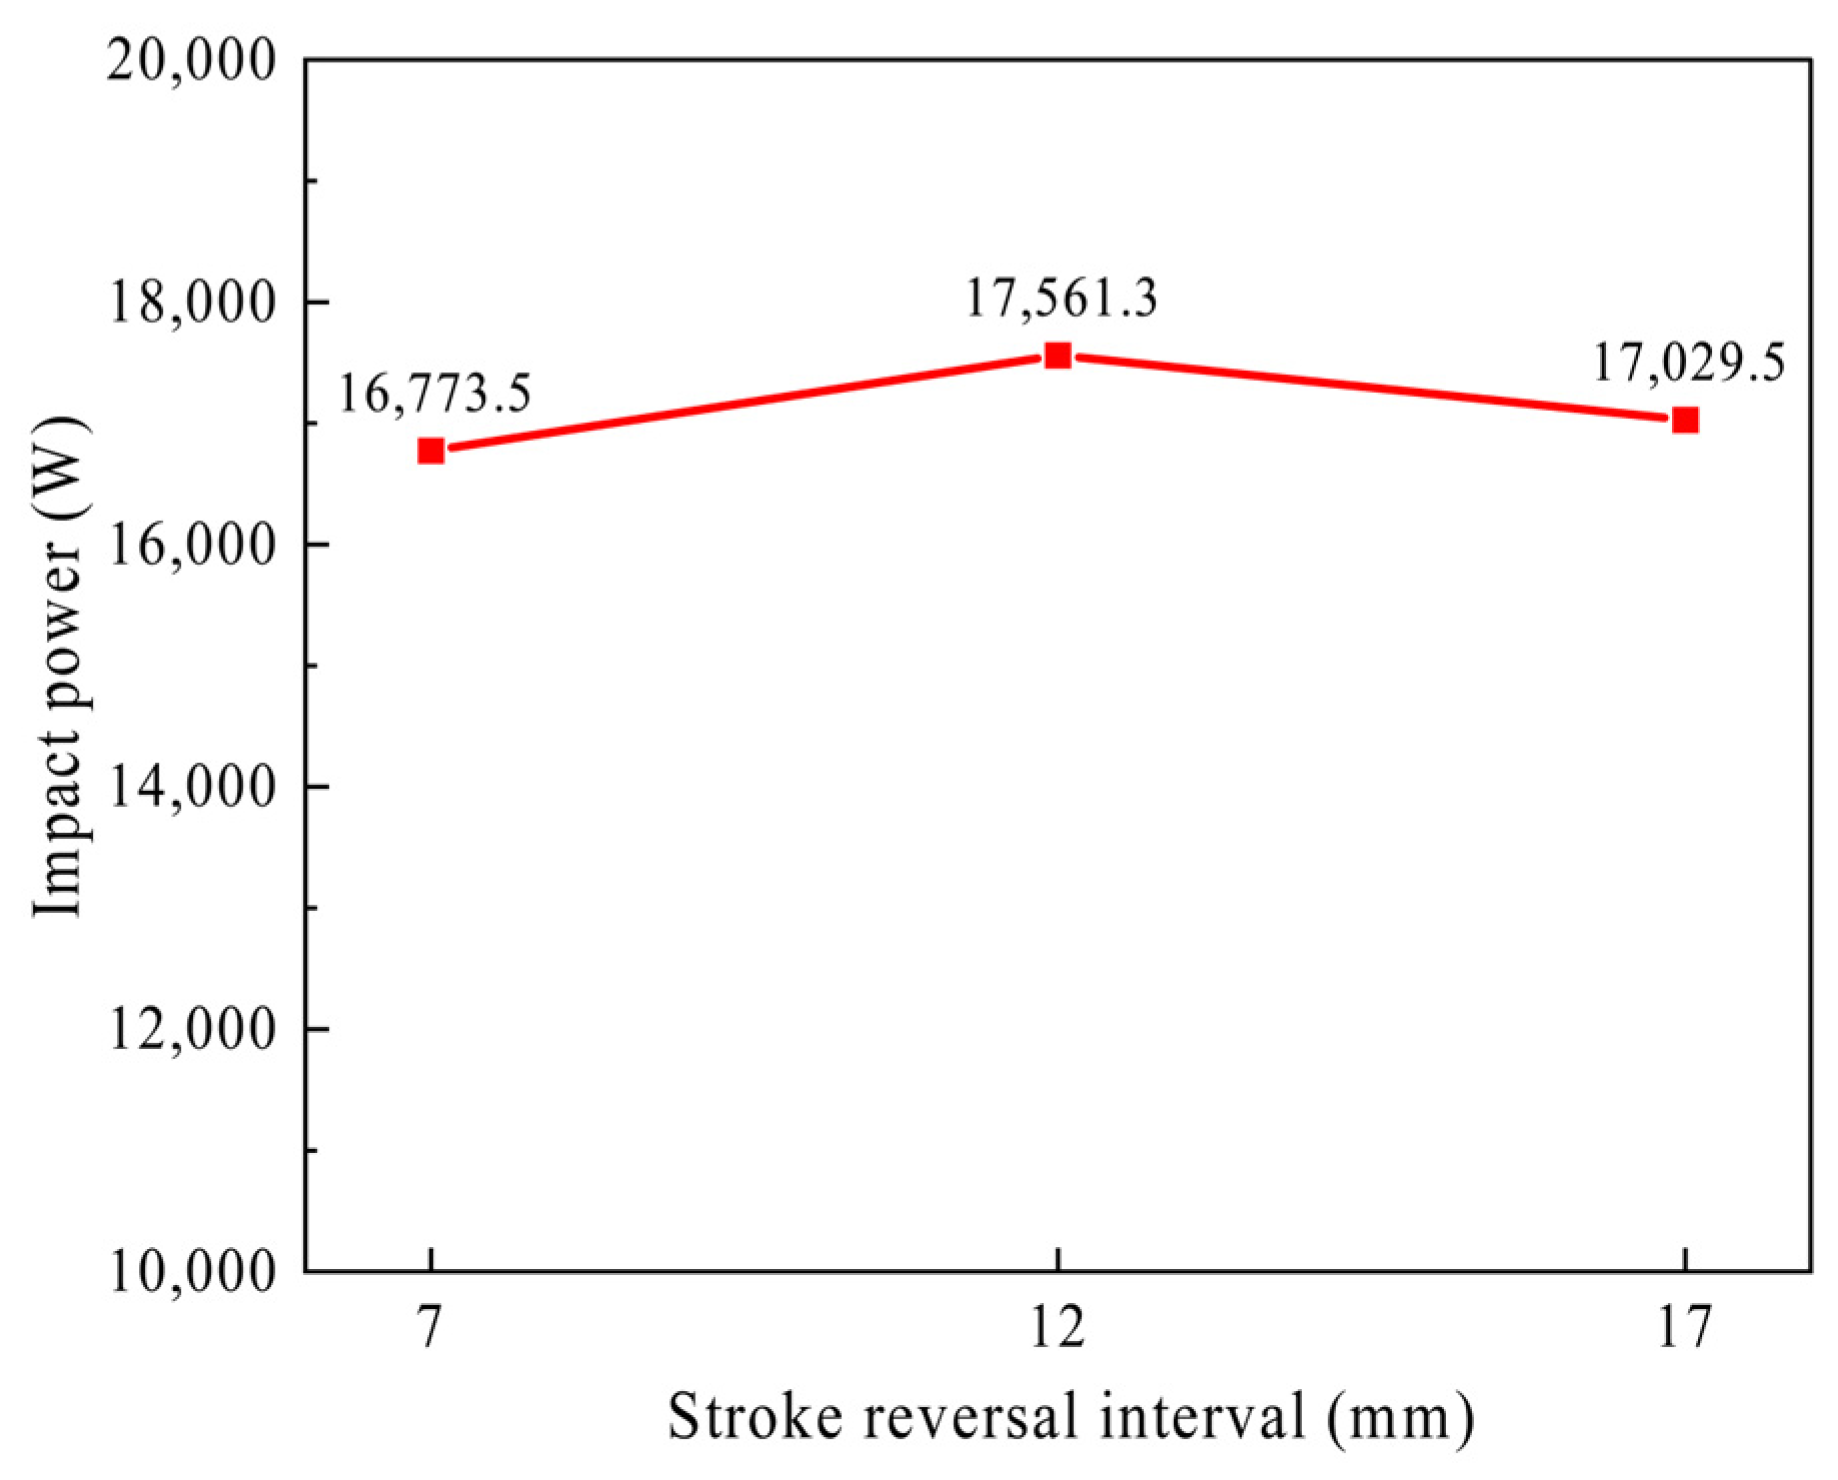
However, the increase in impact velocity is accompanied by a decrease in impact frequency, as illustrated in Figure 12, a comparison of the velocity and displacement curves under different stroke reversal intervals is presented. Calculations show that the impact frequencies corresponding to different stroke reversal intervals are as follows: 76.1 Hz at 7 mm, 70.4 Hz at 12 mm, and 64.6 Hz at 17 mm. It is evident that the impact frequency decreases with the increase in stroke reversal interval. Further calculation of the impact power reveals that the maximum impact power is achieved at the 12 mm interval setting, as illustrated in Figure 13, indicating that the impact system has the highest energy output capability per unit time under this condition. This result is well consistent with the optimal motion characteristics of the system in this working condition. The impact power is 16,773.5 W at 7 mm, reaches a maximum of 17,561.3 W at 12 mm, and then decreases to 17,029.5 W at 17 mm. Compared with the 7 mm case, the impact power at 12 mm is increased by approximately 4.70%. Compared with the 17 mm case, it is still higher by approximately 3.12%. These results quantitatively confirm that 12 mm is the optimal stroke reversal interval among the three tested cases. It should be emphasized that the optimal interval of 12 mm is determined under the present pressure condition and may change slightly when the input pressure varies. At around 20 MPa, this interval gives the best dynamic matching between piston motion and valve reversal timing. Additional simulations under lower input pressure further show that the optimum exhibits only a slight deviation and remains close to 12 mm, indicating that the result is robust within the investigated pressure range. Therefore, 12 mm can be regarded as the optimum near the rated pressure, while under lower-pressure conditions the optimum should be understood as lying in a small neighborhood around this value.
Figure 12.
Comparison of velocity and displacement curves at different stroke reversal intervals (the black, red, and blue dots in the figure represent the peak values of displacement stroke and return stroke).
Figure 13.
Impact power at different stroke reversal intervals.
For the hydraulic rock drill investigated in this study, the stroke reversal intervals design target should be centered near 12 mm, which can be regarded as the preferred stroke reversal interval under the present structural and operating conditions. In practical implementation, this interval can be tuned through structural design parameters such as the relative positions between the impact piston and the signal ports, the distances from the initial piston position to the control ports, and the underlap or overlap characteristics and geometric dimensions of the reversing valve spool. This provides useful guidance for both structural optimization and system calibration of hydraulic rock drills.
6. Conclusions
This study systematically investigates the dynamic behavior of the impact system in hydraulic rock drills using an integrated approach of experimental testing, theoretical calculations, and simulation modeling. It clarifies the evolution laws of impact velocity, impact energy, and impact frequency with input pressure, reveals the kinematic mechanisms underlying the stroke and return stages of the impact system, and examines the influence of stroke reversal interval on impact performance. This research establishes a solid theoretical foundation for the structural improvement and performance optimization of rock drills, while providing valuable support for the development and engineering application of high-performance hydraulic rock drills. The main conclusions are as follows:
An impact performance test platform based on laser displacement detection was established. Utilizing the final velocity method, displacement data of the impact piston were accurately acquired under four input pressures (10 MPa, 15 MPa, 20 MPa, and 23 MPa), as well as key performance parameters including impact velocity, acceleration, impact frequency, and impact energy were further derived and calculated. Experimental results indicate that as the input pressure increases, the impact velocity, reciprocating displacement, impact frequency, and impact energy of the impact piston exhibit a synchronous upward trend, with the acceleration during the return stage also increasing accordingly. Meanwhile, the rebound force and rebound acceleration calculated via the stress wave model also show a significant rising characteristic with increasing input pressure, providing reliable experimental data support for the verification of subsequent simulation models.
Based on the working principle of hydraulic rock drills, an AMESim simulation model coupling mechanical–hydraulic–pneumatic was constructed. Integrating the impact system, buffer system, and collision system, this model can fully reproduce the dynamic operation process of the impact system. Verification results demonstrate that the prediction errors of the model for impact velocity, impact frequency are all almost less than 5%, indicating excellent prediction accuracy. It can effectively reveal the dynamic coupling mechanism among the impact piston, reversing valve, and front/rear chamber pressures during both the stroke and return stages.
The stroke reversal interval exerts a significant regulatory effect on impact performance. An excessively small advance leads to piston collision before reaching the maximum velocity, resulting in high-pressure oil energy waste and abnormal fluctuations in the velocity curve. An excessively large advance causes premature piston deceleration, reducing impact stability and energy utilization efficiency. Taking an input pressure of 20 MPa as an example, 12 mm is the theoretically optimal advance. At this point, the collision moment basically coincides with the force balance moment of the front and rear chambers, and the impact power reaches a maximum of 17,561.3 W. This represents a quantitative power increase of 4.70% and 3.12% compared to the 7 mm and 17 mm intervals, respectively. Furthermore, this optimal threshold of approximately 12 mm exhibits high robustness and remains the optimal design target even when the input pressure varies within the investigated range.
In addition, some practical factors, such as leakage variation, thermal effects, structural wear, and more complex rock–drill interaction conditions, were not considered in detail in the current model. Future work will focus on extending the experimental and simulation ranges, conducting multi-parameter collaborative optimization of the impact piston, reversing valve, and buffer system, and incorporating more realistic operating conditions to further improve the applicability of the model and the reliability of the design guidance.
Author Contributions
Conceptualization, S.X., C.W. and C.S.; methodology, C.W., Y.Z.; software, Y.Z.; validation, Y.Z., C.W. and S.X.; formal analysis, S.X., Y.Z.; investigation, S.X.; resources, K.Z., Z.R.; writing—original draft preparation, Y.Z.; writing—review and editing, Y.Z., C.W.; visualization, K.Z., Z.R.; supervision, C.W.; project administration, C.S.; All authors have read and agreed to the published version of the manuscript.
Funding
This research was funded by Key R&D Projects in Henan Province, grant number 261111221500.
Institutional Review Board Statement
Not applicable.
Informed Consent Statement
Not applicable.
Data Availability Statement
The original contributions presented in this study are included in the article. Further inquiries can be directed to the corresponding author.
Conflicts of Interest
Author Shunhai Xu, Kui Zhang and Zhongyong Ren was employed by the company China Railway Engineering Equipment Group Co., Ltd. The remaining authors declare that the research was conducted in the absence of any commercial or financial relationships that could be construed as a potential conflict of interest.
References
- Guo, X.X. Development of Hydraulic Drills and Hydraulic Drill Rigs. Rock. Drill. Mach. Pneum. Tools 2017, 1, 17–26. [Google Scholar] [CrossRef]
- Zhao, Y.D. Development General Simulation and Trend of Hydraulic Drilling Equipment. Morden Min. 2010, 26, 11–16. [Google Scholar] [CrossRef]
- Cao, A. Research on Parameter Optimization of Hydraulic Rock Drill. Master’s Thesis, Chang’an University, Xi’an, China, 2020. [Google Scholar] [CrossRef]
- Li, Y.L. Research on the Matching of Impact Performance and Collision Coefficient of Hydraulic Rock Drill. Shock. Vib. 2021, 2021, 6651860. [Google Scholar] [CrossRef] [Scilit]
- Ma, W.; Geng, X.G.; Jia, C.Z.; Gao, L.L.; Liu, Y.C.; Tian, X. Percussion characteristic analysis for hydraulic rock drill with no constant-pressurized chamber through numerical simulation and experiment. Adv. Mech. Eng. 2019, 11, 1–11. [Google Scholar] [CrossRef] [Scilit]
- Yang, Z.Y.; Li, J.; Yu, G.Y. Influence of Piston Mass and Working Pressure on the Impact Performance of a Hydraulic Rock Drill Using the Stress Wave Method. Machines 2023, 11, 987. [Google Scholar] [CrossRef] [Scilit]
- Yang, Z.Y.; Gao, B.; Lv, C.; Li, Y.G.; Ji, H.; Gan, H.R. Analysis of Impact Performance for Hydraulic Rock Drill with Long and Short Pistons Using Stress Wave Method. Hydraul. Pneum. Seals 2019, 39, 47–50. [Google Scholar] [CrossRef]
- Tian, X.; Xi, W.H.; Ma, F.; Zhang, Z.H.; Wang, S.Y.; Geng, X.G. Experimental study on impact coupling characteristics of high-pressure accumulator for unconstant-pressurized chamber rock drills. Adv. Mech. Eng. 2024, 16, 1–14. [Google Scholar] [CrossRef] [Scilit]
- Li, H.S.; Liu, S.Y.; Chang, H.H. Experimental research on the influence of working parameters on the drilling efficiency. Tunn. Undergr. Space Technol. 2020, 95, 103174. [Google Scholar] [CrossRef] [Scilit]
- Li, Y.L.; Luo, Y.X.; Wu, X. Fault Diagnosis Research on Impact System of Hydraulic Rock Drill Based on Internal Mechanism Testing Method. Shock. Vib. 2018, 2018, 4928438. [Google Scholar] [CrossRef] [Scilit]
- Chang, S.Y.; Ye, M.; Zhang, D.Q.; Ma, Y.C.; Zhang, J.L. Impact performance optimization for hydraulic rock drill based on stroke and flow compensation factors. Adv. Mech. Eng. 2024, 16, 1–14. [Google Scholar] [CrossRef] [Scilit]
- Yin, Z.J.; Hu, Y.X. Dynamic simulation of impact mechanism of hydraulic rock drill based on AMESim. Min. Mach. 2011, 452–453, 1296–1300. [Google Scholar] [CrossRef] [Scilit]
- Qin, Z.C.; Zhou, Z.H.; Zhou, Z.R.; Ma, X.L. Modeling and Simulation of the Impact of Institutionsof Hydraulic Rock Drill Based on AMESim. Hydraul. Pneum. Seals 2010, 30, 32–34. [Google Scholar] [CrossRef]
- Yang, S.Y.; Ou, Y.B.; Guo, Y.; Wu, X.M. Analysis and optimization of the working parameters of the impact mechanism of hydraulic rock drill based on a numerical simulation. Int. J. Precis. Eng. Manuf. 2017, 18, 971–977. [Google Scholar] [CrossRef] [Scilit]
- Geng, X.G.; Ma, F.; Li, Y.L.; Ma, W.; Wang, S.K. Dynamic Simulation Based on AMESim for Double Damper System of Hydraulic Rock Drill. Chin. Hydraul. Pneum. 2014, 8, 18–22. [Google Scholar] [CrossRef]
- Yang, S.Y.; Zhu, F.; Li, L. Wave dynamics modeling and numerical analysis on impactsystem of hydraulic rock drill. J. Hunan Univ. Sci. Technol. (Nat. Sci. Ed.) 2016, 31, 25–30. [Google Scholar] [CrossRef]
- Liu, Z.; Wu, J.; Li, W. Research on Testing Principles and Methods and Experimental Research on Hydraulic Impact Machine. China Mech. Eng. 2007, 18, 1769–1772+1818. [Google Scholar] [CrossRef]
- Schmid, M.; Rath, D.; Diebold, U. Why and How Savitzky–Golay Filters Should Be Replaced. ACS Meas. Sci. Au 2022, 2, 185–196. [Google Scholar] [CrossRef] [Scilit] [PubMed]
- Liu, D.S.; Yang, X.B. A Mathematic Model on the Design of Impact Stree Waveforms. J. Xiangtan Min. Inst. 1994, 9, 6–10. [Google Scholar]
- Liao, M.L. Nonlinear Dynamics of a Vibro-impact System for Indenter-rock Interaction. J. Mech. Eng. 2020, 727, 56. [Google Scholar] [CrossRef] [Scilit]
- Hustrulid, W.A.; Fairhurst, C. A theoretical and experimental study of the percussive drilling of rock Part II—Force-penetration and specific energy determinations. Int. J. Rock. Mech. Min. Sci. Geomech. Abstr. 1971, 8, 335–356. [Google Scholar] [CrossRef] [Scilit]
- Antoljak, D.; Kuhinek, D.; Korman, T.; Kujundzic, T. Research on Interdependence between Specific Rock Cutting Energy and Specific Drilling Energy. Appl. Sci. 2023, 13, 2280. [Google Scholar] [CrossRef] [Scilit]
- Qiu, K. Simulation Analysis on Anti-jamming Valve of Drill Rig Based on AMESim. Mod. Manuf. Technol. Equip. 2016, 1, 46–49. [Google Scholar] [CrossRef]
- Ling, Y.F.; Wang, X.Q.; Tang, J.R. Dynamic Simulation Model and Performance Optimization of a Pressurized Pulsed Water Jet Device. Appl. Sci. 2024, 14, 6788. [Google Scholar] [CrossRef] [Scilit]
- Yin, Z.J.; Xia, G.T.; Han, T. Leakage Simulation of the Impactor of Hydraulic Rock Drill. Adv. Mater. Sci. Mech. Eng. Manuf. 2013, 744, 113–117. [Google Scholar] [CrossRef] [Scilit]

Disclaimer/Publisher’s Note: The statements, opinions and data contained in all publications are solely those of the individual author(s) and contributor(s) and not of MDPI and/or the editor(s). MDPI and/or the editor(s) disclaim responsibility for any injury to people or property resulting from any ideas, methods, instructions or products referred to in the content. |
© 2026 by the authors. Licensee MDPI, Basel, Switzerland. This article is an open access article distributed under the terms and conditions of the Creative Commons Attribution (CC BY) license.