2.1. Experimental Materials and Instruments
The wax components used in this study were chromatographically pure n-alkanes. All were obtained from Aladdin Reagent Co., Ltd. (Shanghai, China). The specific carbon numbers and purities of these components are listed in
Table 1. n-Dodecane (purity ≥ 99%) was obtained from China National Pharmaceutical Group Chemical Reagent Co., Ltd. (Shanghai, China). It was employed as the solvent to prepare the model wax systems. The model wax systems (C5–C50) were prepared by mixing 7 representative n-alkanes (C5, C10, C15, C20, C30, C40, C50) in equal mass ratios for single-range systems, and in predefined mass ratios (low:medium:high) for mixed systems. The hydrocarbon distribution of each model system was monitored using gas chromatography (GC, Agilent 7890A, Santa Clara, CA, USA) to ensure consistency with the designed composition. The homogeneity of the samples was controlled by stirring at 80 °C for 2 h and verifying no visible stratification after standing at room temperature for 24 h.
All wax components used in the experiments were chromatographically pure n-alkanes, which were purchased from Aladdin Reagent Co., Ltd. (Shanghai, China).
EVA wax inhibitor samples were purchased from Shanghai Macklin Biochemical Co., Ltd., Shanghai, China.
Ethylene-vinyl acetate (EVA) copolymer samples, used as wax inhibitors, were procured from Shanghai McLean Biochemical Technology Co., Ltd. (Shanghai, China). Five EVA samples, exhibiting variations in both vinyl acetate (VA) content and molecular weight, were selected for this investigation [
4]. Their key structural parameters were characterized by independent verification methods: number-average molecular weight (Mn), weight-average molecular weight (Mw), and molecular weight distribution index (Mw/Mn) were determined using gel permeation chromatography (GPC, Agilent GPC-1260) with polystyrene as the standard and tetrahydrofuran as the mobile phase (flow rate: 1.0 mL/min, column temperature: 35 °C). VA content was determined by proton nuclear magnetic resonance (
1H NMR) spectroscopy (Bruker AVANCE III HD 400, Fällanden, Switzerland) using deuterated chloroform (CDCl
3) as the solvent, with the integral ratio of methylene protons in ethylene segments (δ 1.3–1.5 ppm) and methyl protons in VA segments (δ 2.0 ppm) used for calculation (
Table 2).
The primary instruments and equipment employed in this study are listed in
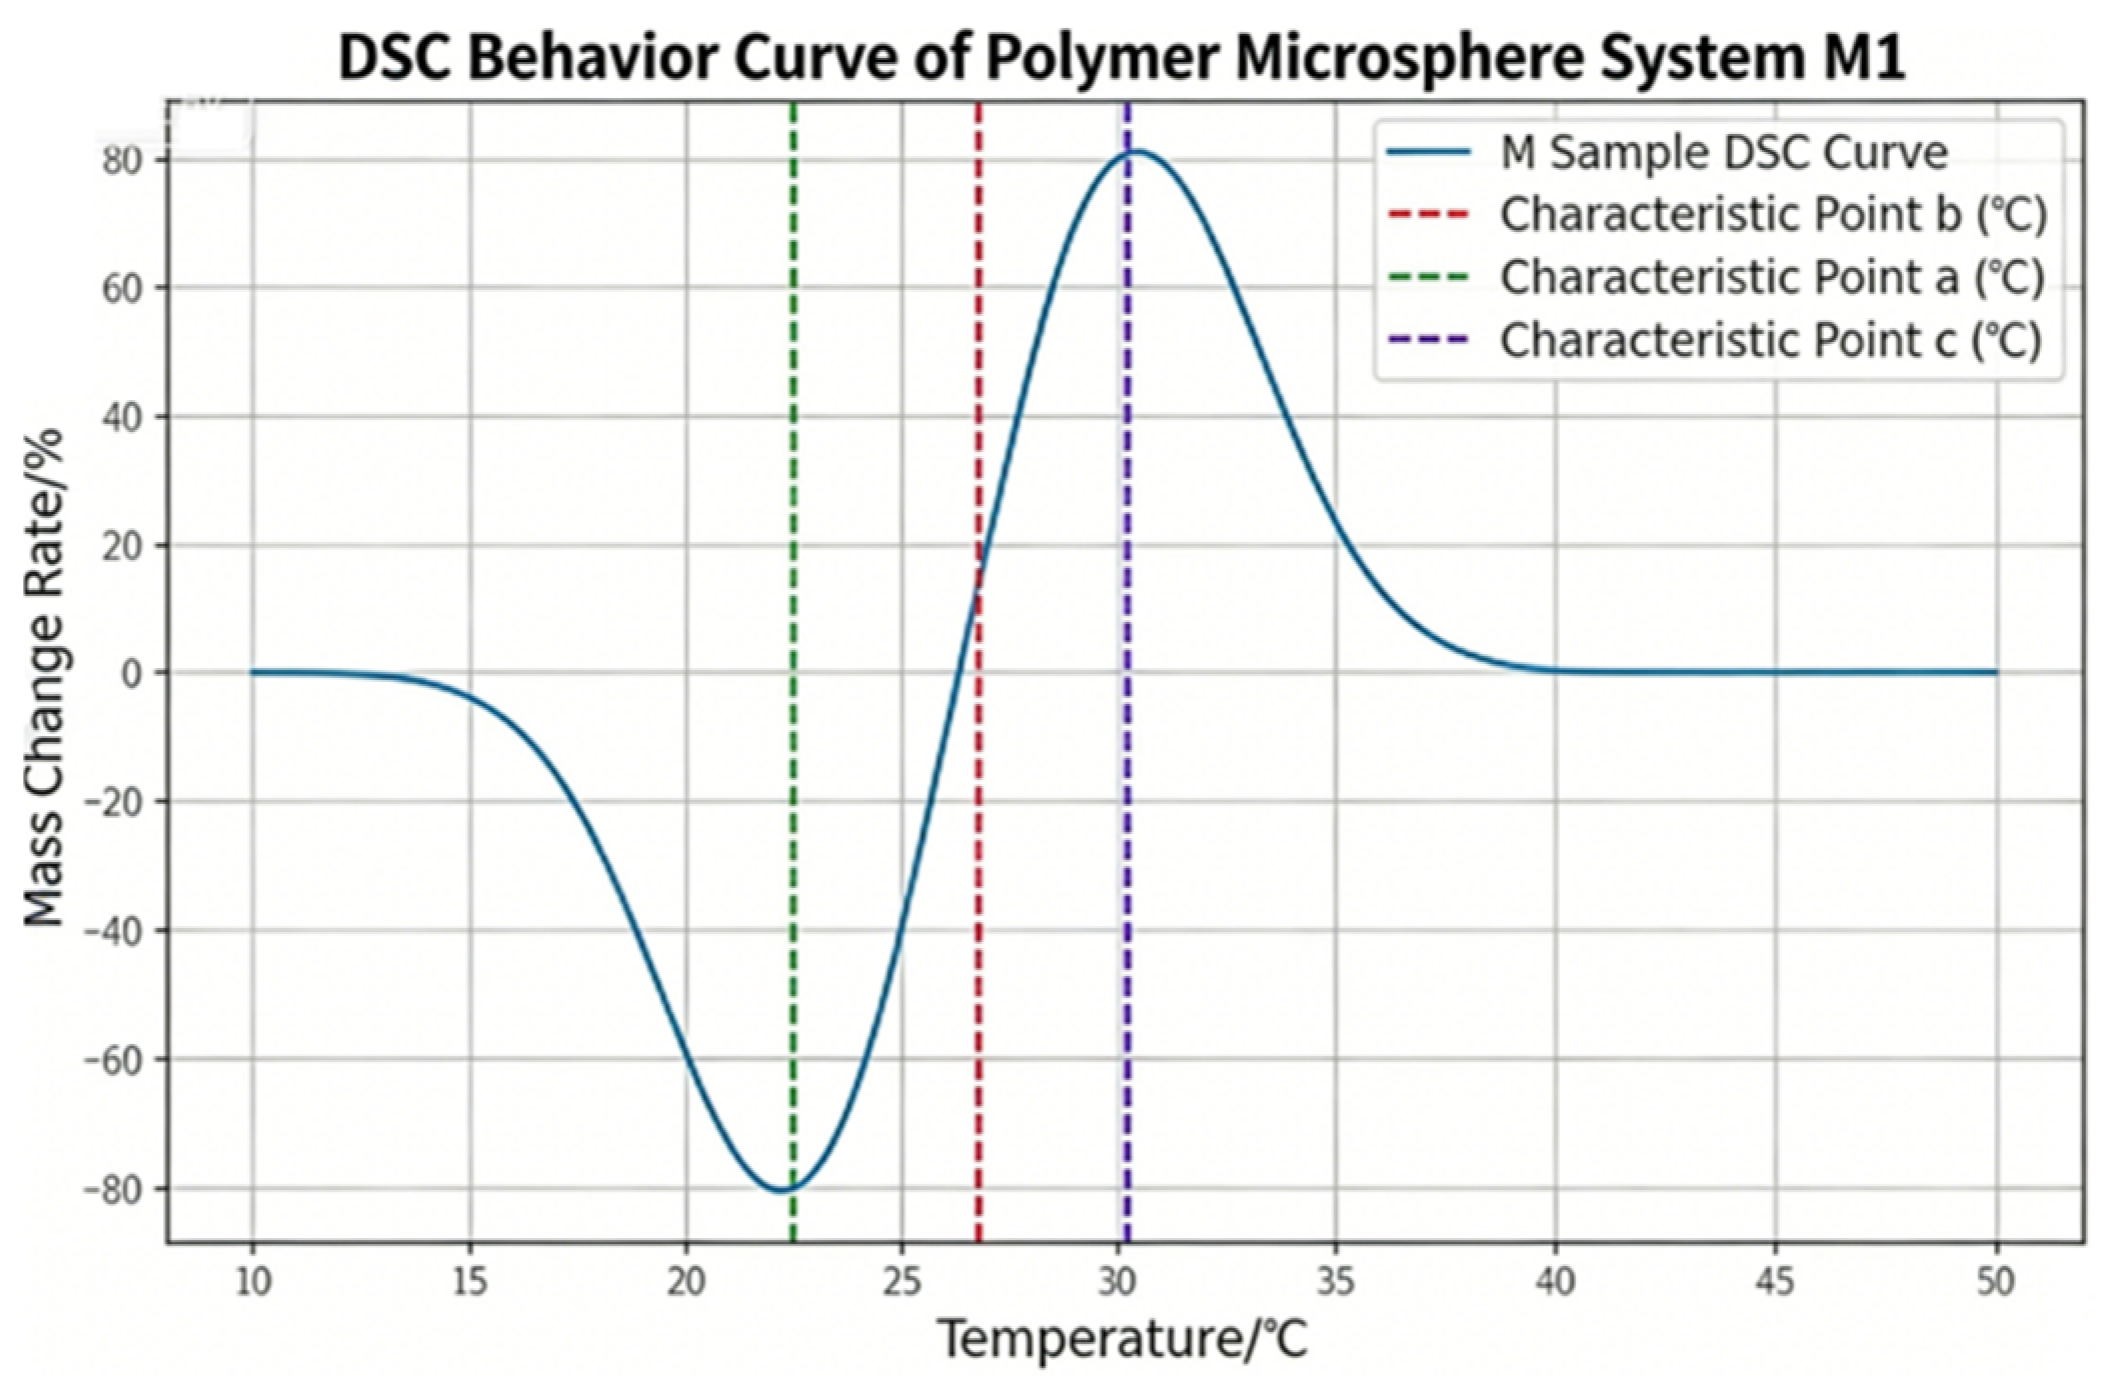
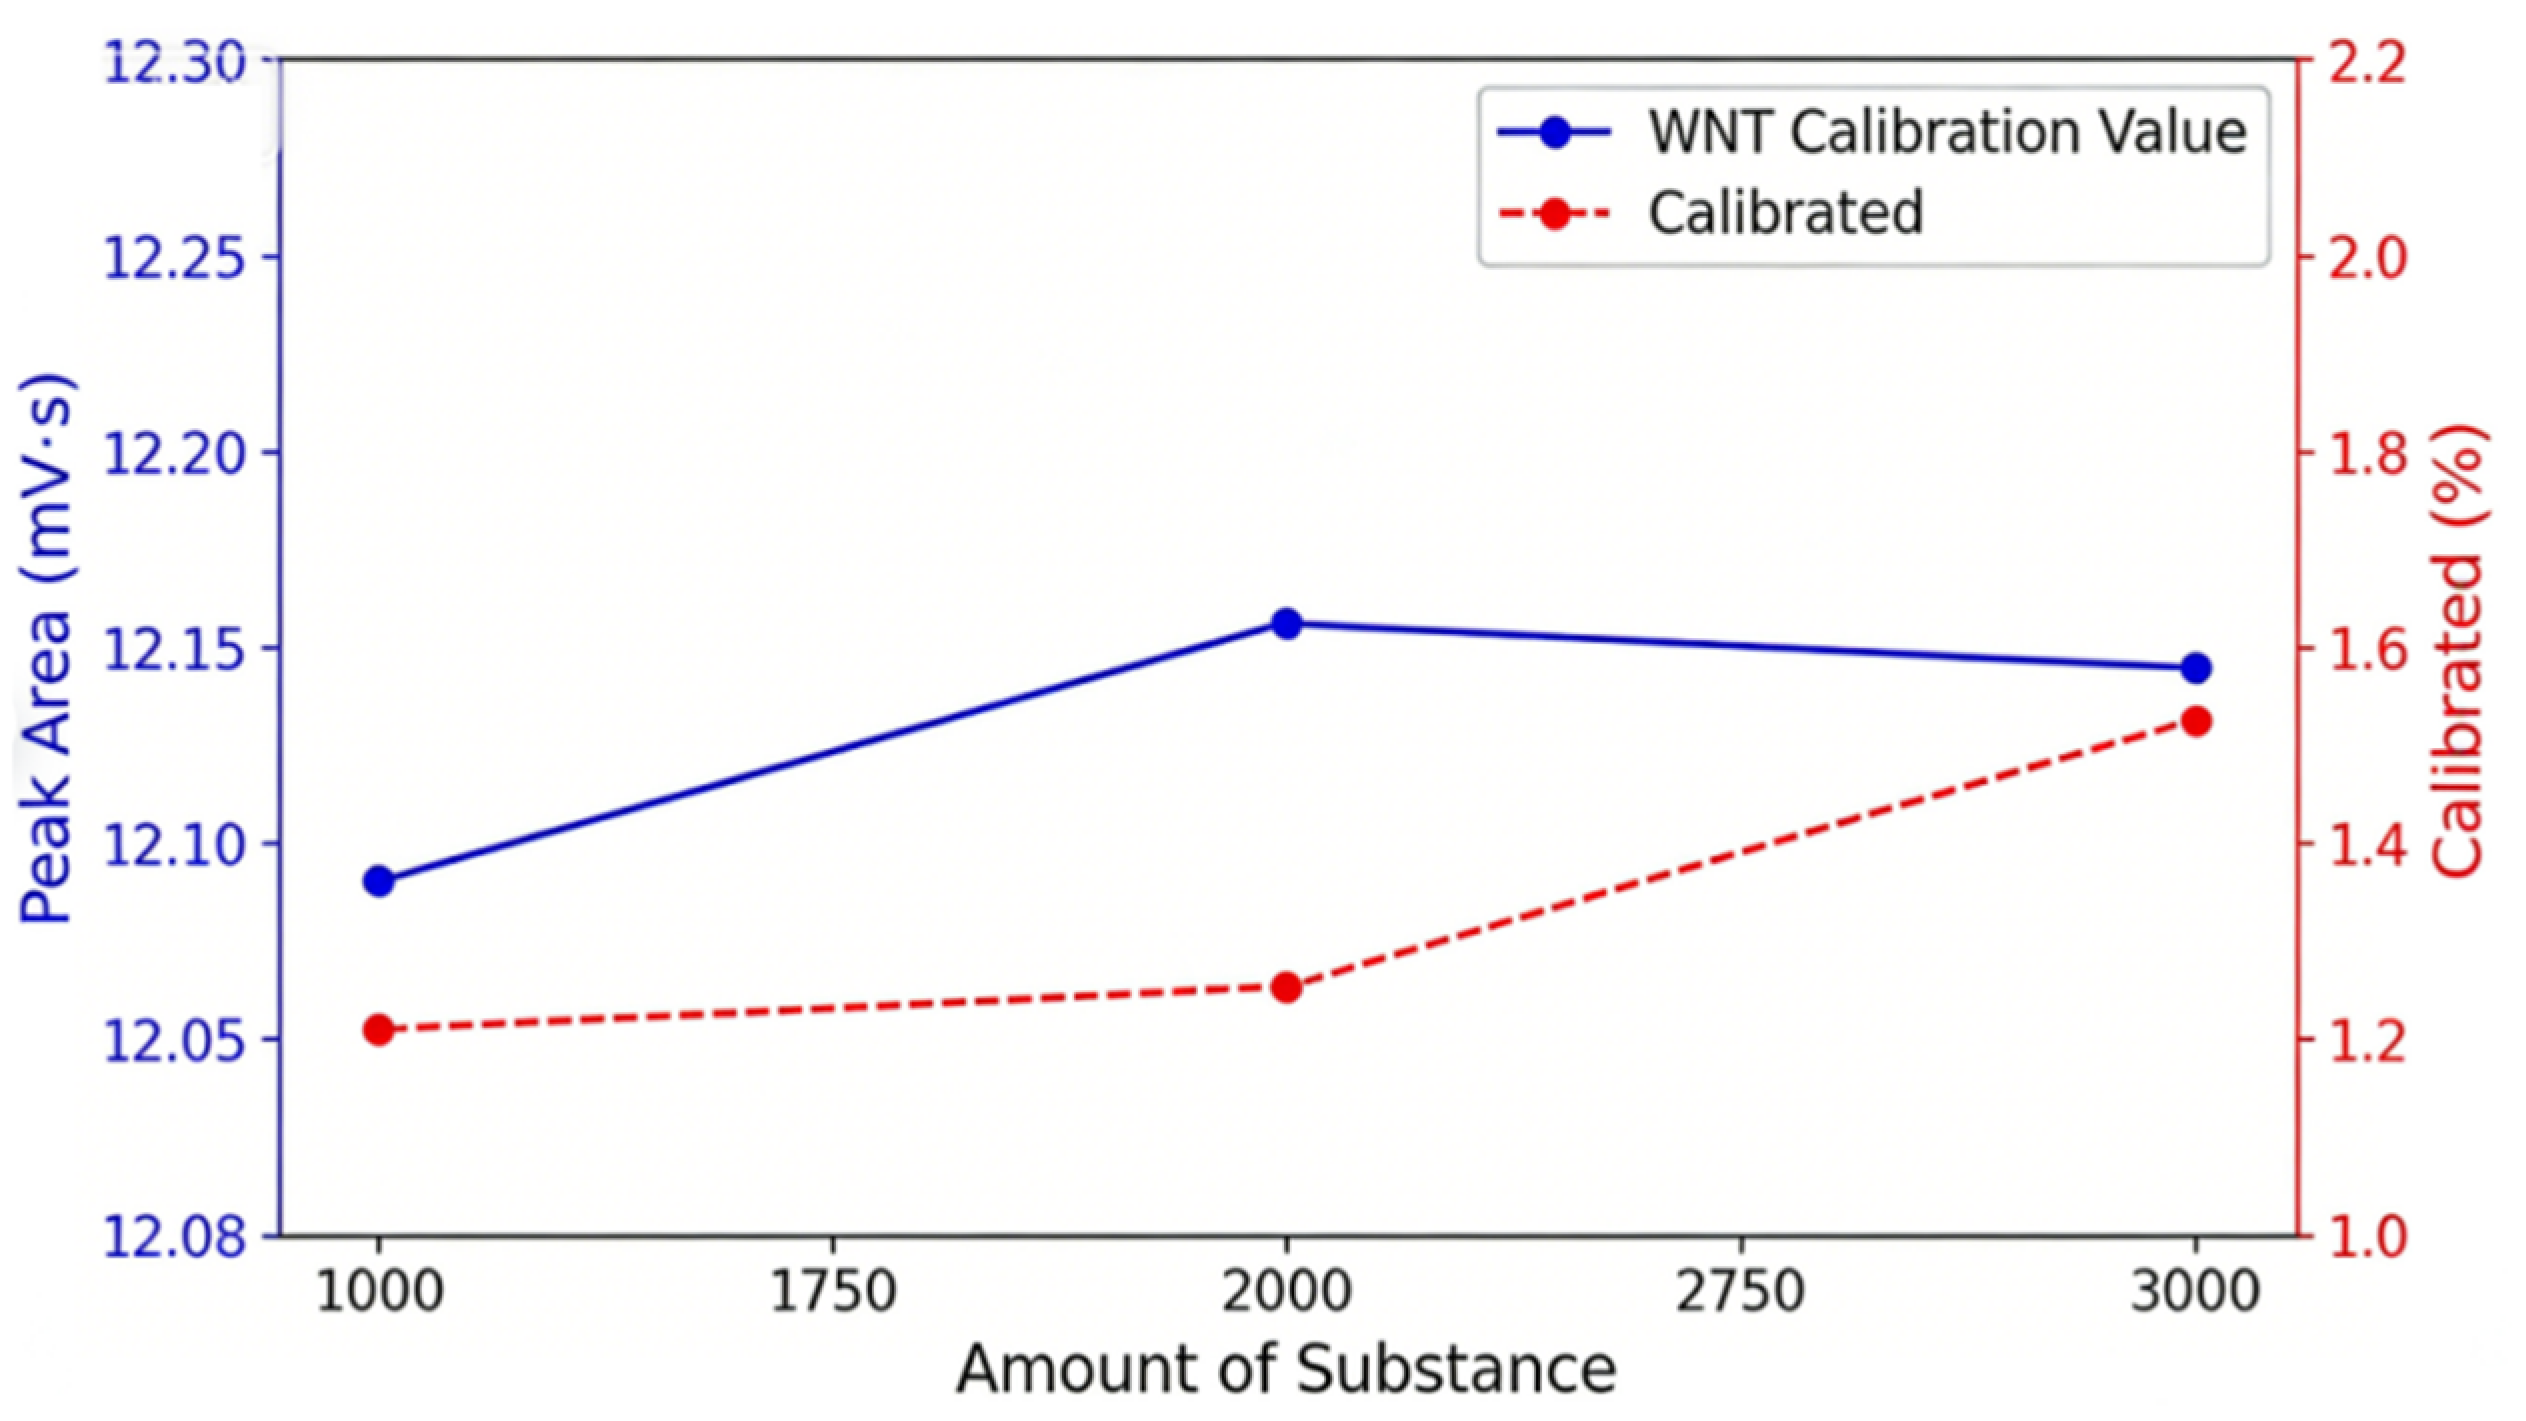
Table 3. Among these, a differential scanning calorimeter (DSC) served as the core analytical instrument. It was used to measure the thermal behavior curves of the wax systems, both with and without EVA addition. Prior to formal experiments, the DSC instrument was calibrated using high-purity indium (melting point: 156.60 °C, enthalpy of fusion: 28.45 J/g) and tin (melting point: 231.93 °C, enthalpy of fusion: 60.41 J/g) standards. The calibration was performed over the temperature range of −20 °C to 80 °C (consistent with the experimental temperature range), with a heating/cooling rate of 5 °C/min. The measurement accuracy for temperature was ±0.1 °C, and for enthalpy was ±0.1 J/g. Gel permeation chromatography (GPC) was utilized to determine the molecular weight and molecular weight distribution of the EVA samples. Proton nuclear magnetic resonance (
1H NMR) spectroscopy was employed to characterize the VA content of the EVA samples. An electronic analytical balance was used for the precise weighing of all experimental samples. A constant-temperature magnetic stirrer was employed to prepare homogeneous model oil solutions of the wax systems. A vacuum drying oven was utilized for sample drying prior to analysis [
5].
2.2. Experimental Scheme Design
2.2.1. DSC Thermal Behavior Study of Basic Wax System
To systematically investigate the effect of carbon number distribution, the C5–C50 n-alkanes were first categorized into three distinct ranges: low (C5–C15), medium (C16–C30), and high (C31–C50). From each range, three representative n-alkanes were selected and combined in equal mass ratios. This was done to prepare model wax systems with a fixed total wax concentration of 20 wt% in n-dodecane. These systems, designated as W1 (C5, C10, C15), W2 (C20, C25, C30), and W3 (C35, C40, C50), represented the low, medium, and high carbon number ranges, respectively. To investigate the influence of mixed carbon number distributions, additional wax systems were prepared with varying compositional ratios. The total wax concentration was maintained at 20 wt%. Four distinct carbon number distribution ratios were designed. They were defined by the mass ratios of low, medium, and high-carbon-number alkanes: 1:1:1 (M1), 2:1:1 (M2), 1:2:1 (M3), and 1:1:2 (M4). Within each designated range, the selected n-alkanes were again combined in equal mass proportions. The thermal behavior of all seven model wax systems during controlled cooling and heating cycles was investigated using DSC. Three parallel tests were conducted for each sample, and the average value ± standard deviation (SD) was taken as the final experimental result. Reproducibility was assessed by calculating the relative standard deviation (RSD) of the parallel measurements; all RSD values were less than 2%, indicating good reproducibility. From the resulting thermograms, key phase change parameters were extracted. These included the wax appearance temperature (WAT), crystallization peak temperature, melting peak temperature, and total phase transition enthalpy.
2.2.2. Study on the Influence of EVA Wax Inhibitor on the Thermal Behavior of Wax System
Using the mixed-carbon wax system M1 as a baseline, the influence of EVA-2 concentration (200, 400, 600, 800, and 1000 ppm) on its thermal behavior was first investigated. EVA stock solutions (10,000 ppm) were prepared by dissolving a precise mass of EVA in n-dodecane at 80 °C, followed by constant volume dilution to obtain working solutions of different concentrations. The dosing accuracy was verified by weighing the prepared solutions (precision: 0.1 mg), with a relative error of less than 1.5% for all concentrations (200–1000 ppm). Systematic errors associated with low-concentration dosing were minimized by using a micro-pipette (precision: 1 μL) for volume transfer and calibrating the pipette prior to use. Subsequently, to examine the effect of VA content, experiments were conducted using EVA samples with varying VA contents (5% for EVA-1, 10% for EVA-2, and 15% for EVA-3). A constant EVA concentration of 800 ppm and a number-average molecular weight of 10,000 g/mol were maintained [
6]. Next, with a fixed EVA concentration of 800 ppm and a VA content of 10%, the influence of number-average molecular weight was investigated. EVA-2 (10,000 g/mol), EVA-4 (20,000 g/mol), and EVA-5 (30,000 g/mol) were used. Finally, to assess the differential effects of EVA across various wax systems, EVA-2 (10% VA, 10,000 g/mol) was selected. With its concentration fixed at 800 ppm, its influence on the thermal behavior of the W1, W2, W3, M2, M3, and M4 systems was systematically examined. Three parallel tests were conducted for each experimental condition, with results reported as average ± SD.
2.2.3. Validation of the Phase Model
To validate the predictive capability of the developed phase model, the M1 wax system was selected. EVA-2 was added at concentrations of 200, 400, 600, 800, and 1000 ppm. For each concentration, phase transition enthalpy data as a function of temperature were obtained via DSC. The amount of wax precipitated was then calculated using the constructed phase model. The accuracy of the model was subsequently verified by comparing these calculated values with the experimentally determined enthalpy data [
7]. The model accuracy was quantitatively evaluated using three metrics: mean relative error (MRE), root mean square error (RMSE), and coefficient of determination (R
2). These were calculated using the following formulas: MRE = (1/n)Σ|(Xcalc − Xexp)/Xexp| × 100%, RMSE = √[(1/n)Σ(Xcalc − Xexp)
2], R
2 = 1 −[Σ(Xexp − Xcalc)
2/Σ(Xexp − Xexp,avg)
2], where Xcalc is the model-predicted wax precipitation amount, Xexp is the experimental wax precipitation amount, and Xexp,avg is the average experimental value. To further assess its general applicability, the validated model was also tested on the W2, M3, and M4 wax systems under the same experimental conditions.