


Abstract
While check dams are crucial for debris flow mitigation, they face increasing failure risks under extreme weather and seismic activities. Their collapse can severely amplify debris flow magnitude, yet quantitative understanding of this amplification mechanism remains limited. Based on field investigations in southern Gansu, China, and a total of 12 flume experiments (comprising 11 distinct scenarios and 1 representative repeatability test), this study quantitatively assesses the amplification effect of dam breaches under varying channel slopes, check dam types, and bed conditions. Results indicate that dam-breach debris flow evolution comprises three stages: material initiation and deposition, breaching and material release, and recession. Crucially, dam breaching shifts the initiation mode from progressive retrogressive erosion to a near-instantaneous release of mass and potential energy. Compared to no-dam scenarios, breaches amplified peak discharge, erosion rate, and downstream inundated area by factors of 1.65–3.04, 1.44–1.55, and 2.14–2.77, respectively. This amplification is driven by the rapid initial release of material and energy, compounded by erosional entrainment during the transport phase. Furthermore, check dam type and channel slope act as key controlling factors. By revealing how check dams transition from protective structures to hazard sources, this study provides quantitative experimental evidence for optimizing dam design and advancing resilient disaster risk reduction strategies in mountainous regions.
1. Introduction
Debris flows are among the most destructive geological hazards in mountainous regions, posing a significant threat to human lives and infrastructure worldwide [1,2,3]. The construction of check dams is the primary engineering measure to control these hazards [4]. By intercepting sediment, reducing the channel slope, and stabilizing the channel bed, they can effectively regulate the dynamic characteristics and sediment transport processes of debris flows [5,6,7,8]. However, with the increasing intensity and frequency of debris flow events caused by global climate change and extreme rainfall [9], the long-term effectiveness of these structures is facing severe challenges [10]. Recurrent impacts and scouring by debris flows can cause structural damage and deterioration, diminishing the load-bearing capacity and stability of the dam [11]. Coupled with inadequate maintenance [12], the risk of their structural failure is significantly increased [13]. Once a check dam fails, the large volume of sediment trapped behind it is rapidly released, potentially leading to a disaster far more severe than what would occur in a no-dam scenario [14,15].
Disasters exacerbated by check dam failures are reported globally, often with catastrophic consequences. For instance, during the 2010 catastrophic Zhouqu debris flow in China, the cascading failure of nine check dams has been identified as a key factor in amplifying its destructive power, ultimately resulting in 1765 fatalities [16,17]. Similar disaster amplification events have also been documented in the Italian Alps in 2018 and Tehran, Iran, in 2022 [18,19]. This demonstrates that the conventional wisdom that check dams invariably reduce disaster magnitude does not always hold true [20]. The mitigation performance of these structures is transient, diminishing over time with increasing sedimentation. When confronted with large-scale debris flows, they can even transform from “protective shields” into “hazard sources”, exerting significant adverse effects [21,22].
Researchers worldwide have investigated the amplification mechanisms of check dam and landslide dam failures through field investigations, physical modeling, and numerical simulations [16,23]. Field investigations, relying on post-disaster geomorphic evidence and empirical formulas, have provided rapid estimations of peak discharge, but their results are often constrained by scale effects and parameter uncertainties [9,16,24]. Physical model tests have predominantly focused on landslide dams. Chen et al. [25] and Jiang et al. [26,27] revealed two primary breaching modes, progressive overtopping failure and sudden instability failure, and systematically explored the decisive influence of the breaching mode on peak discharge [28]. Subsequent research has expanded the focus from single dams to cascading dam systems [24,29], finding that regardless of the material composition of the downstream dam, its failure mode was consistently overtopping, and that a linear relationship exists between the flow amplification of a cascading breach and the time interval between the failures of two consecutive dams [30]. Hu et al. explained the intrinsic mechanism of this cascading amplification from an energy perspective using seismic signals [28]. In contrast, physical model experiments on artificial check dams have primarily focused on their sediment-trapping and flow-regulating efficiency under normal operational conditions [31,32]. Numerical simulations have made it possible to quantify the scale amplification effect of debris flows from dam breaches at the watershed scale. Baggio and D’Agostino used the r.avaflow model for detailed reconstructions and multi-scenario simulations of case studies, revealing that a check dam breach can act as a “trigger” to initiate intense channel bed erosion [33]. Chong et al. employed the BASEMENT model to quantify the amplification of debris flow magnitude by cascading check dam failures, and elucidated the transformation of failed dams from mitigation structures into “sources of material” and “sources of energy” that exacerbate the hazard [34].
While the aforementioned studies have laid a foundation for understanding the amplification effects triggered by dam failures, a critical gap remains in quantifying the specific physical mechanisms driven by engineered structures. On the one hand, numerical reconstructions inherently rely on empirical rheological laws and parameterization schemes, making it difficult to realistically reproduce the complex, internal hydro-mechanical mechanisms within the impounded sediments at the exact instant of a dam breach [33,34]. Specifically, a dam breach involves a rapid transition of the impounded water–sediment mixture from a pressurized state to a sudden free-surface release. Treated as an auxiliary analogy, studies on transient flow in porous media indicate that such rapid depressurization drastically alters the internal stress field [35]. This instantaneous phase transition is a complex micro-mechanical process that depth-averaged numerical models and empirical parameterizations often struggle to explicitly resolve. On the other hand, existing experimental studies on dam breaches mostly focus on natural landslide dams, while research on artificial check dams emphasizes conventional mitigation benefits [31,32], leaving a distinct lack of quantitative investigation into the catastrophic amplification processes following structural failure. To avoid underestimating the potential consequences of such failures, it is crucial to address two core scientific questions: (1) To what extent does check dam breaching amplify the dynamic characteristics and transport processes of debris flows [16,34]? (2) How do key controlling factors regulate this amplification process? Addressing these questions is a necessary prerequisite for developing more reliable risk assessment frameworks and optimizing disaster mitigation strategies.
In this study, we integrate physical modeling experiments with field investigations of in-service check dams in the mountainous region of southern Gansu, China, to quantitatively analyze the amplification effect of check dam breaches on debris flows. By comparing scenarios with different dam types and channel slopes against a no-dam control case, we performed a multi-dimensional quantitative analysis based on three key parameters: peak discharge (Q), erosion rate (E), and downstream inundated area (S). The results are expected to provide quantitative experimental evidence for optimizing check dam design and developing more robust risk assessment frameworks.
2. Field Investigations
2.1. Study Area
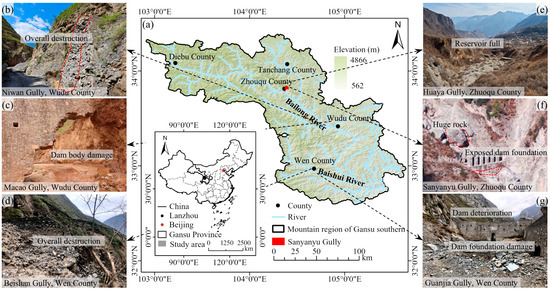
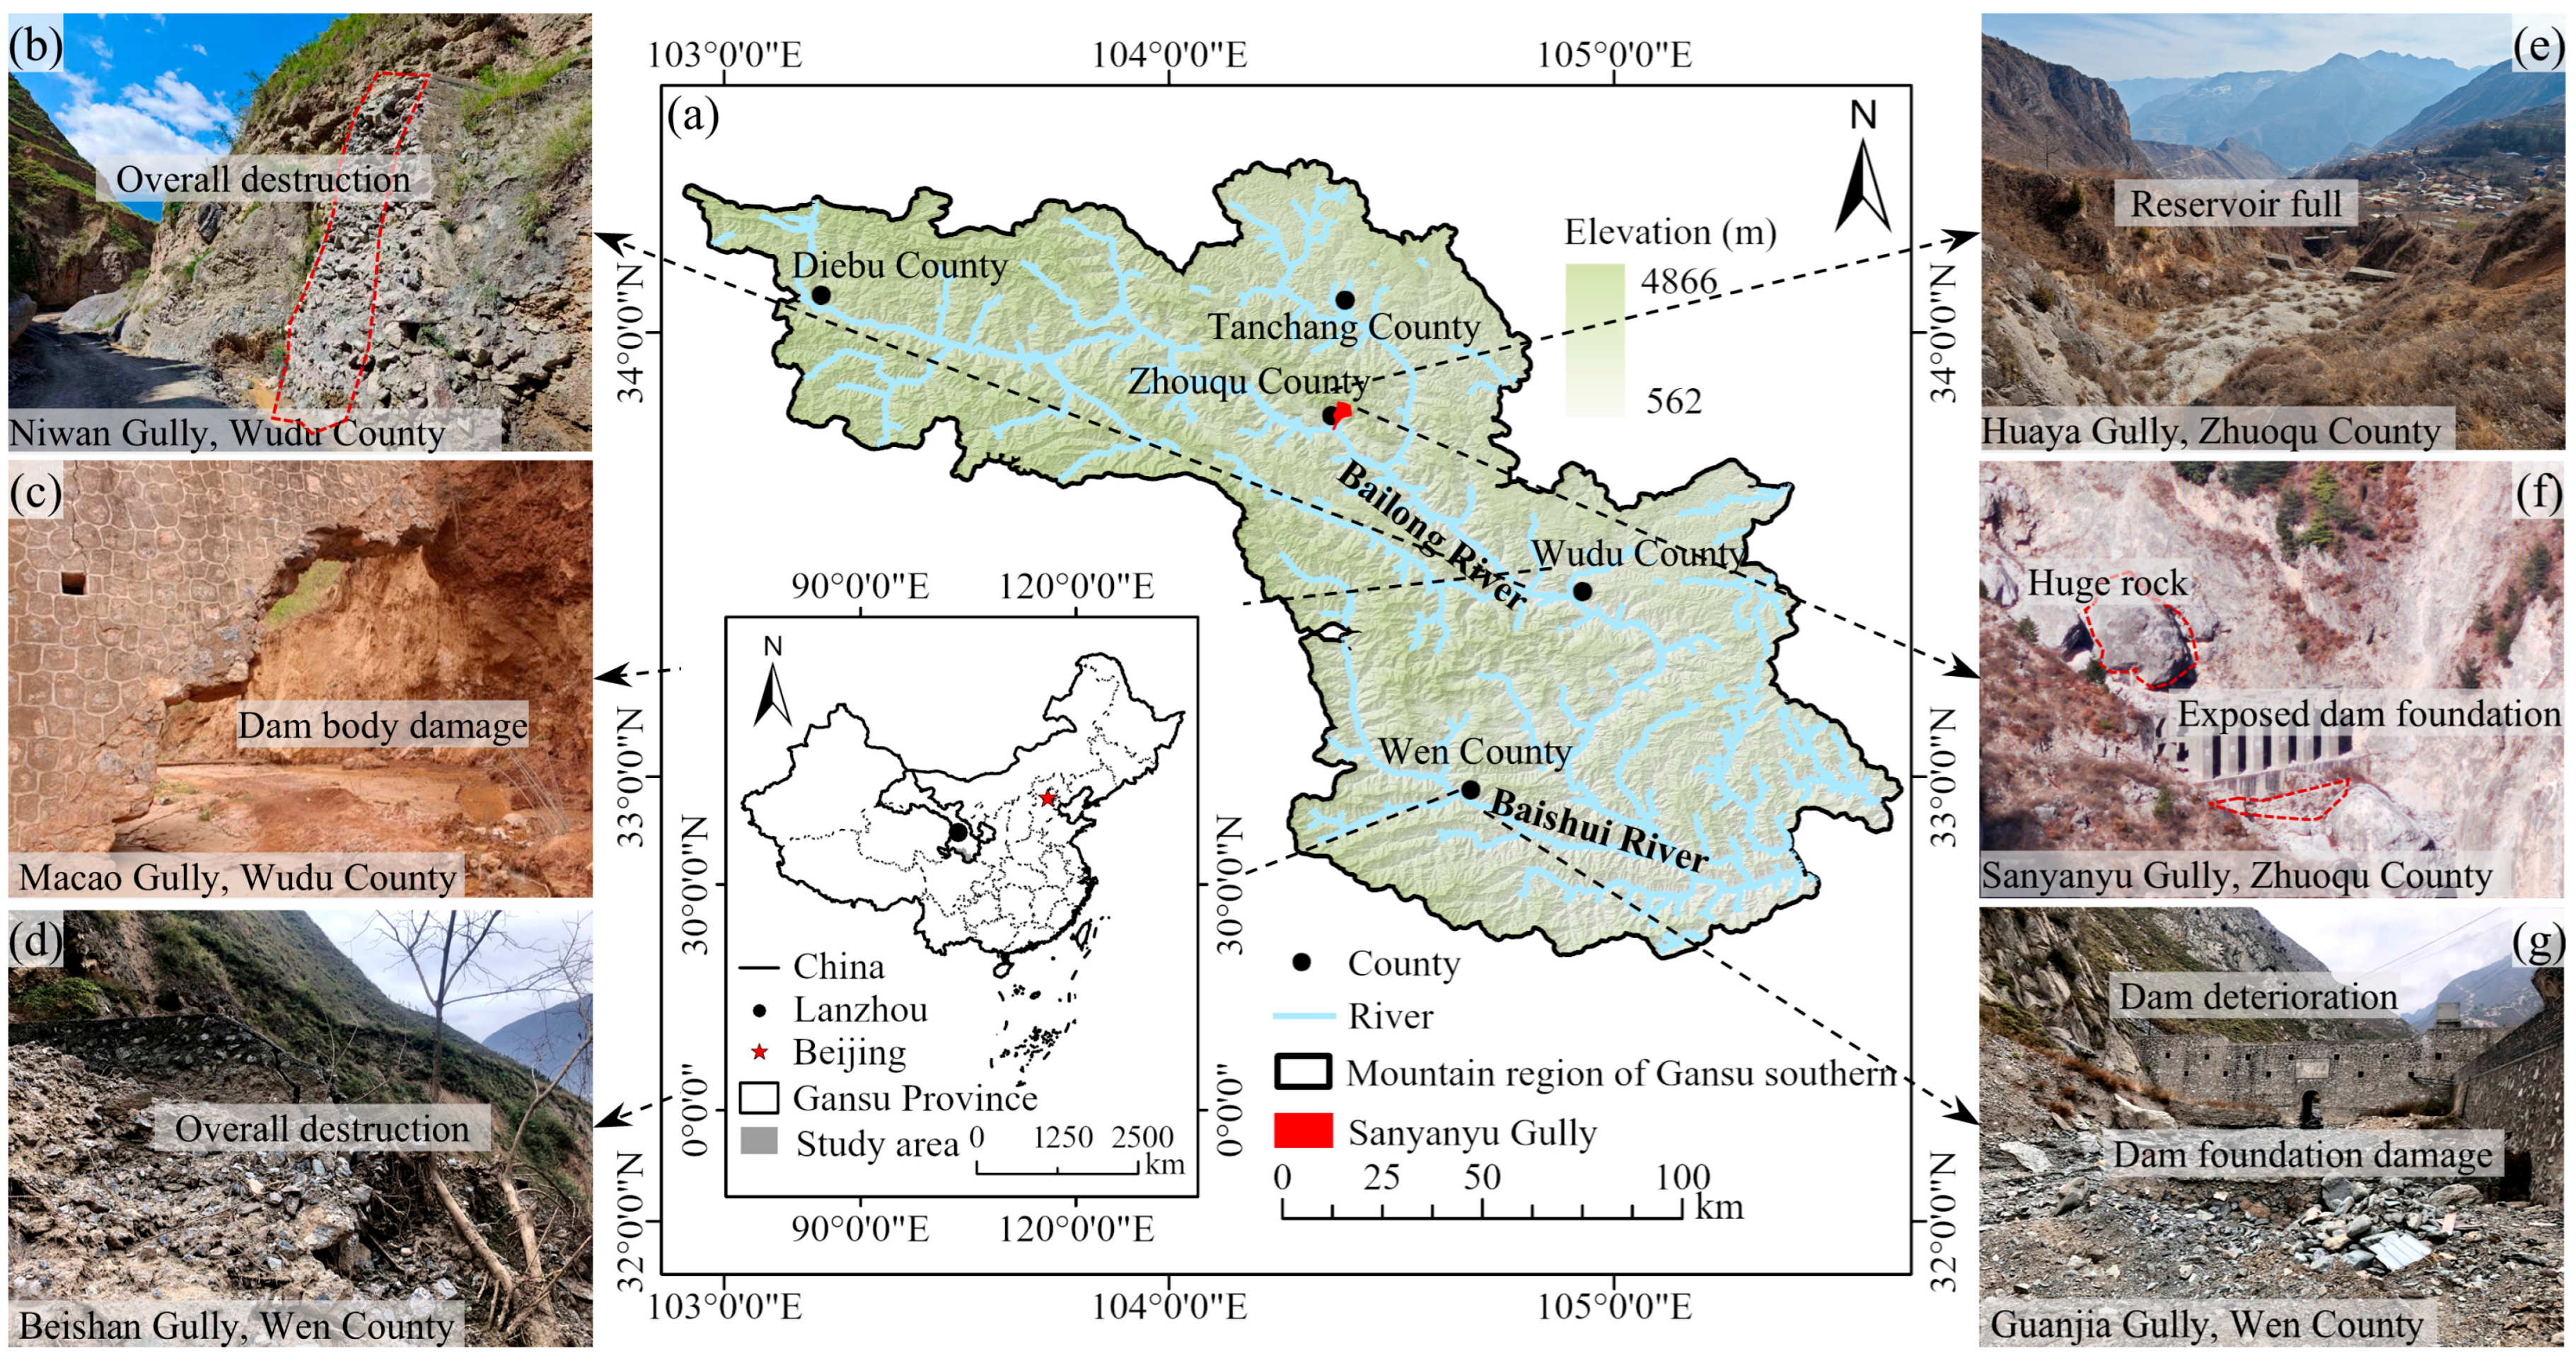
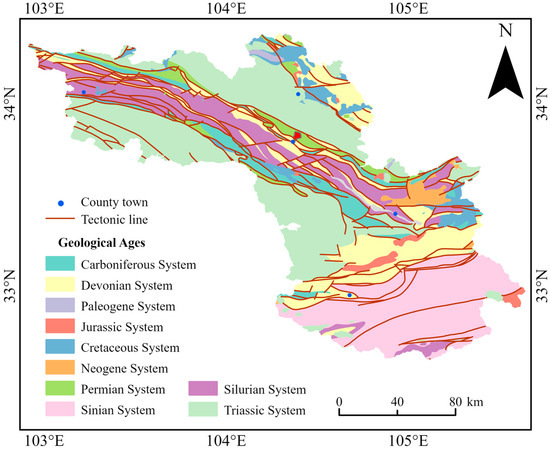
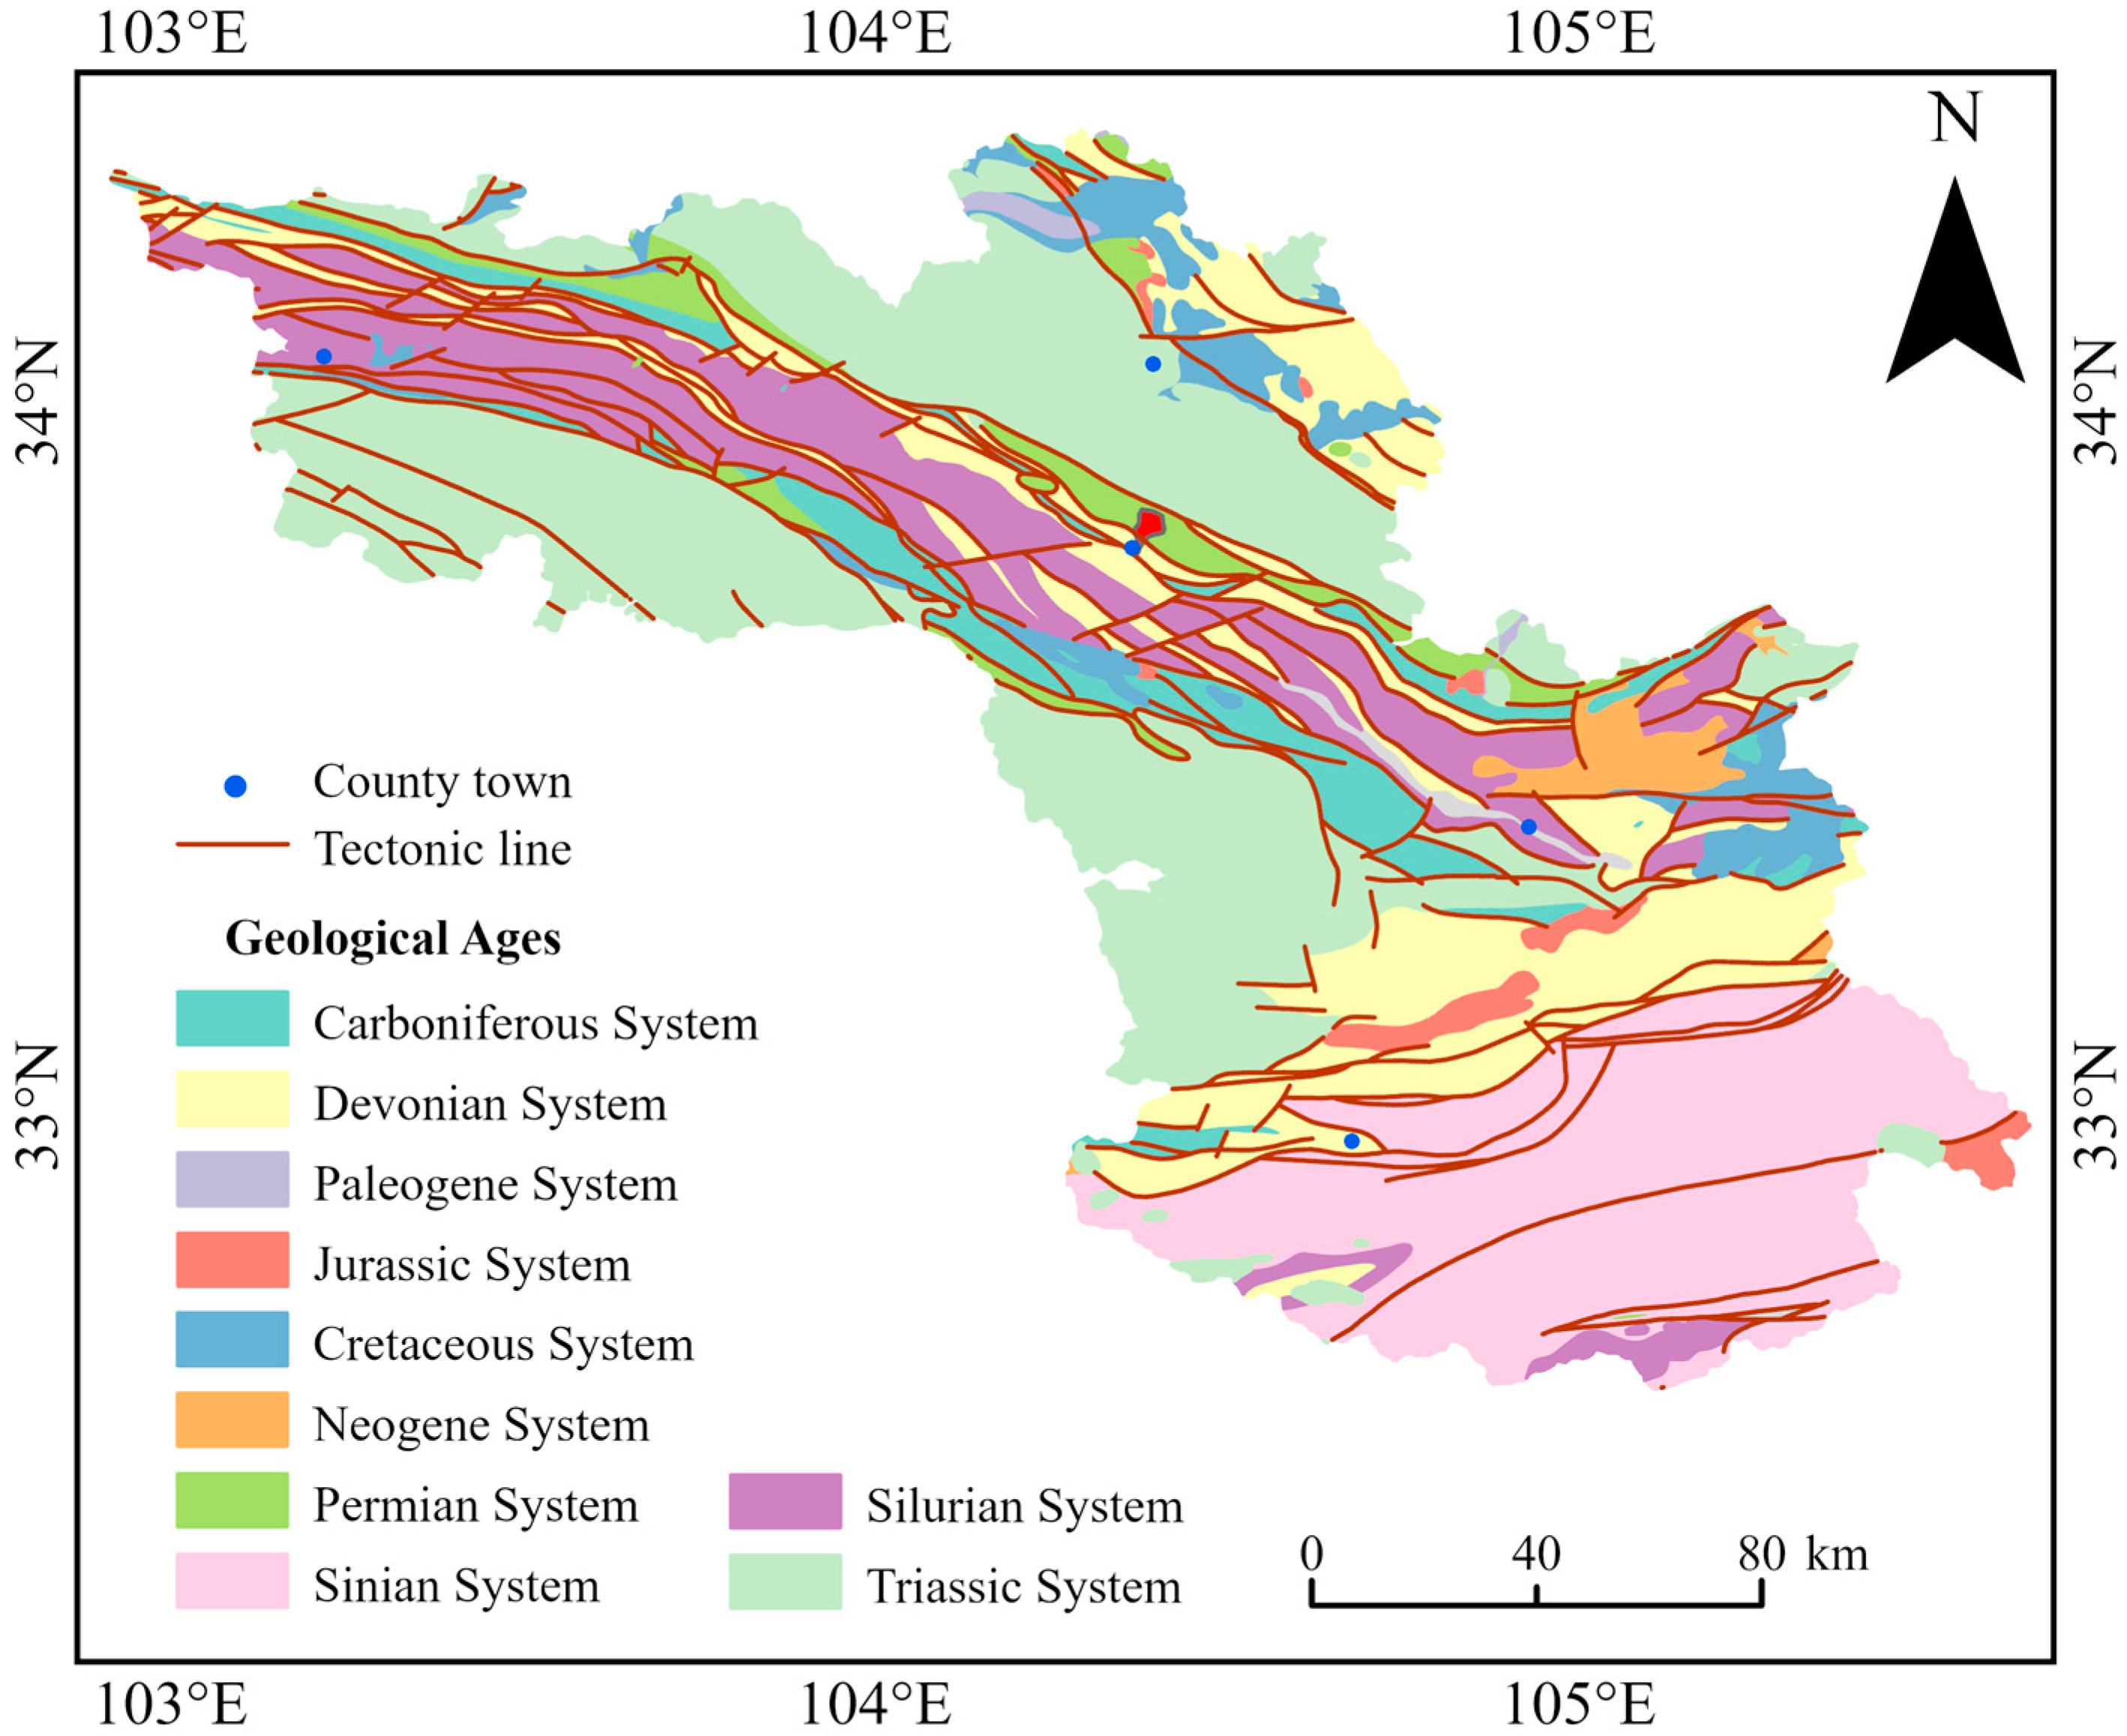
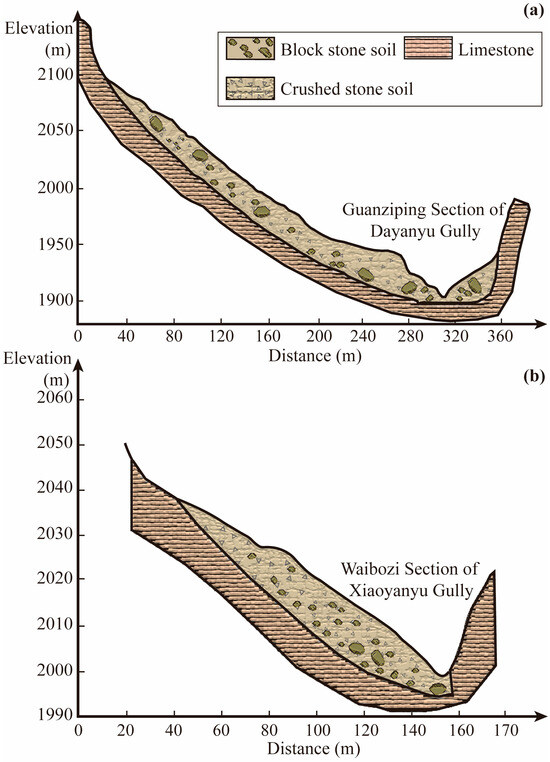
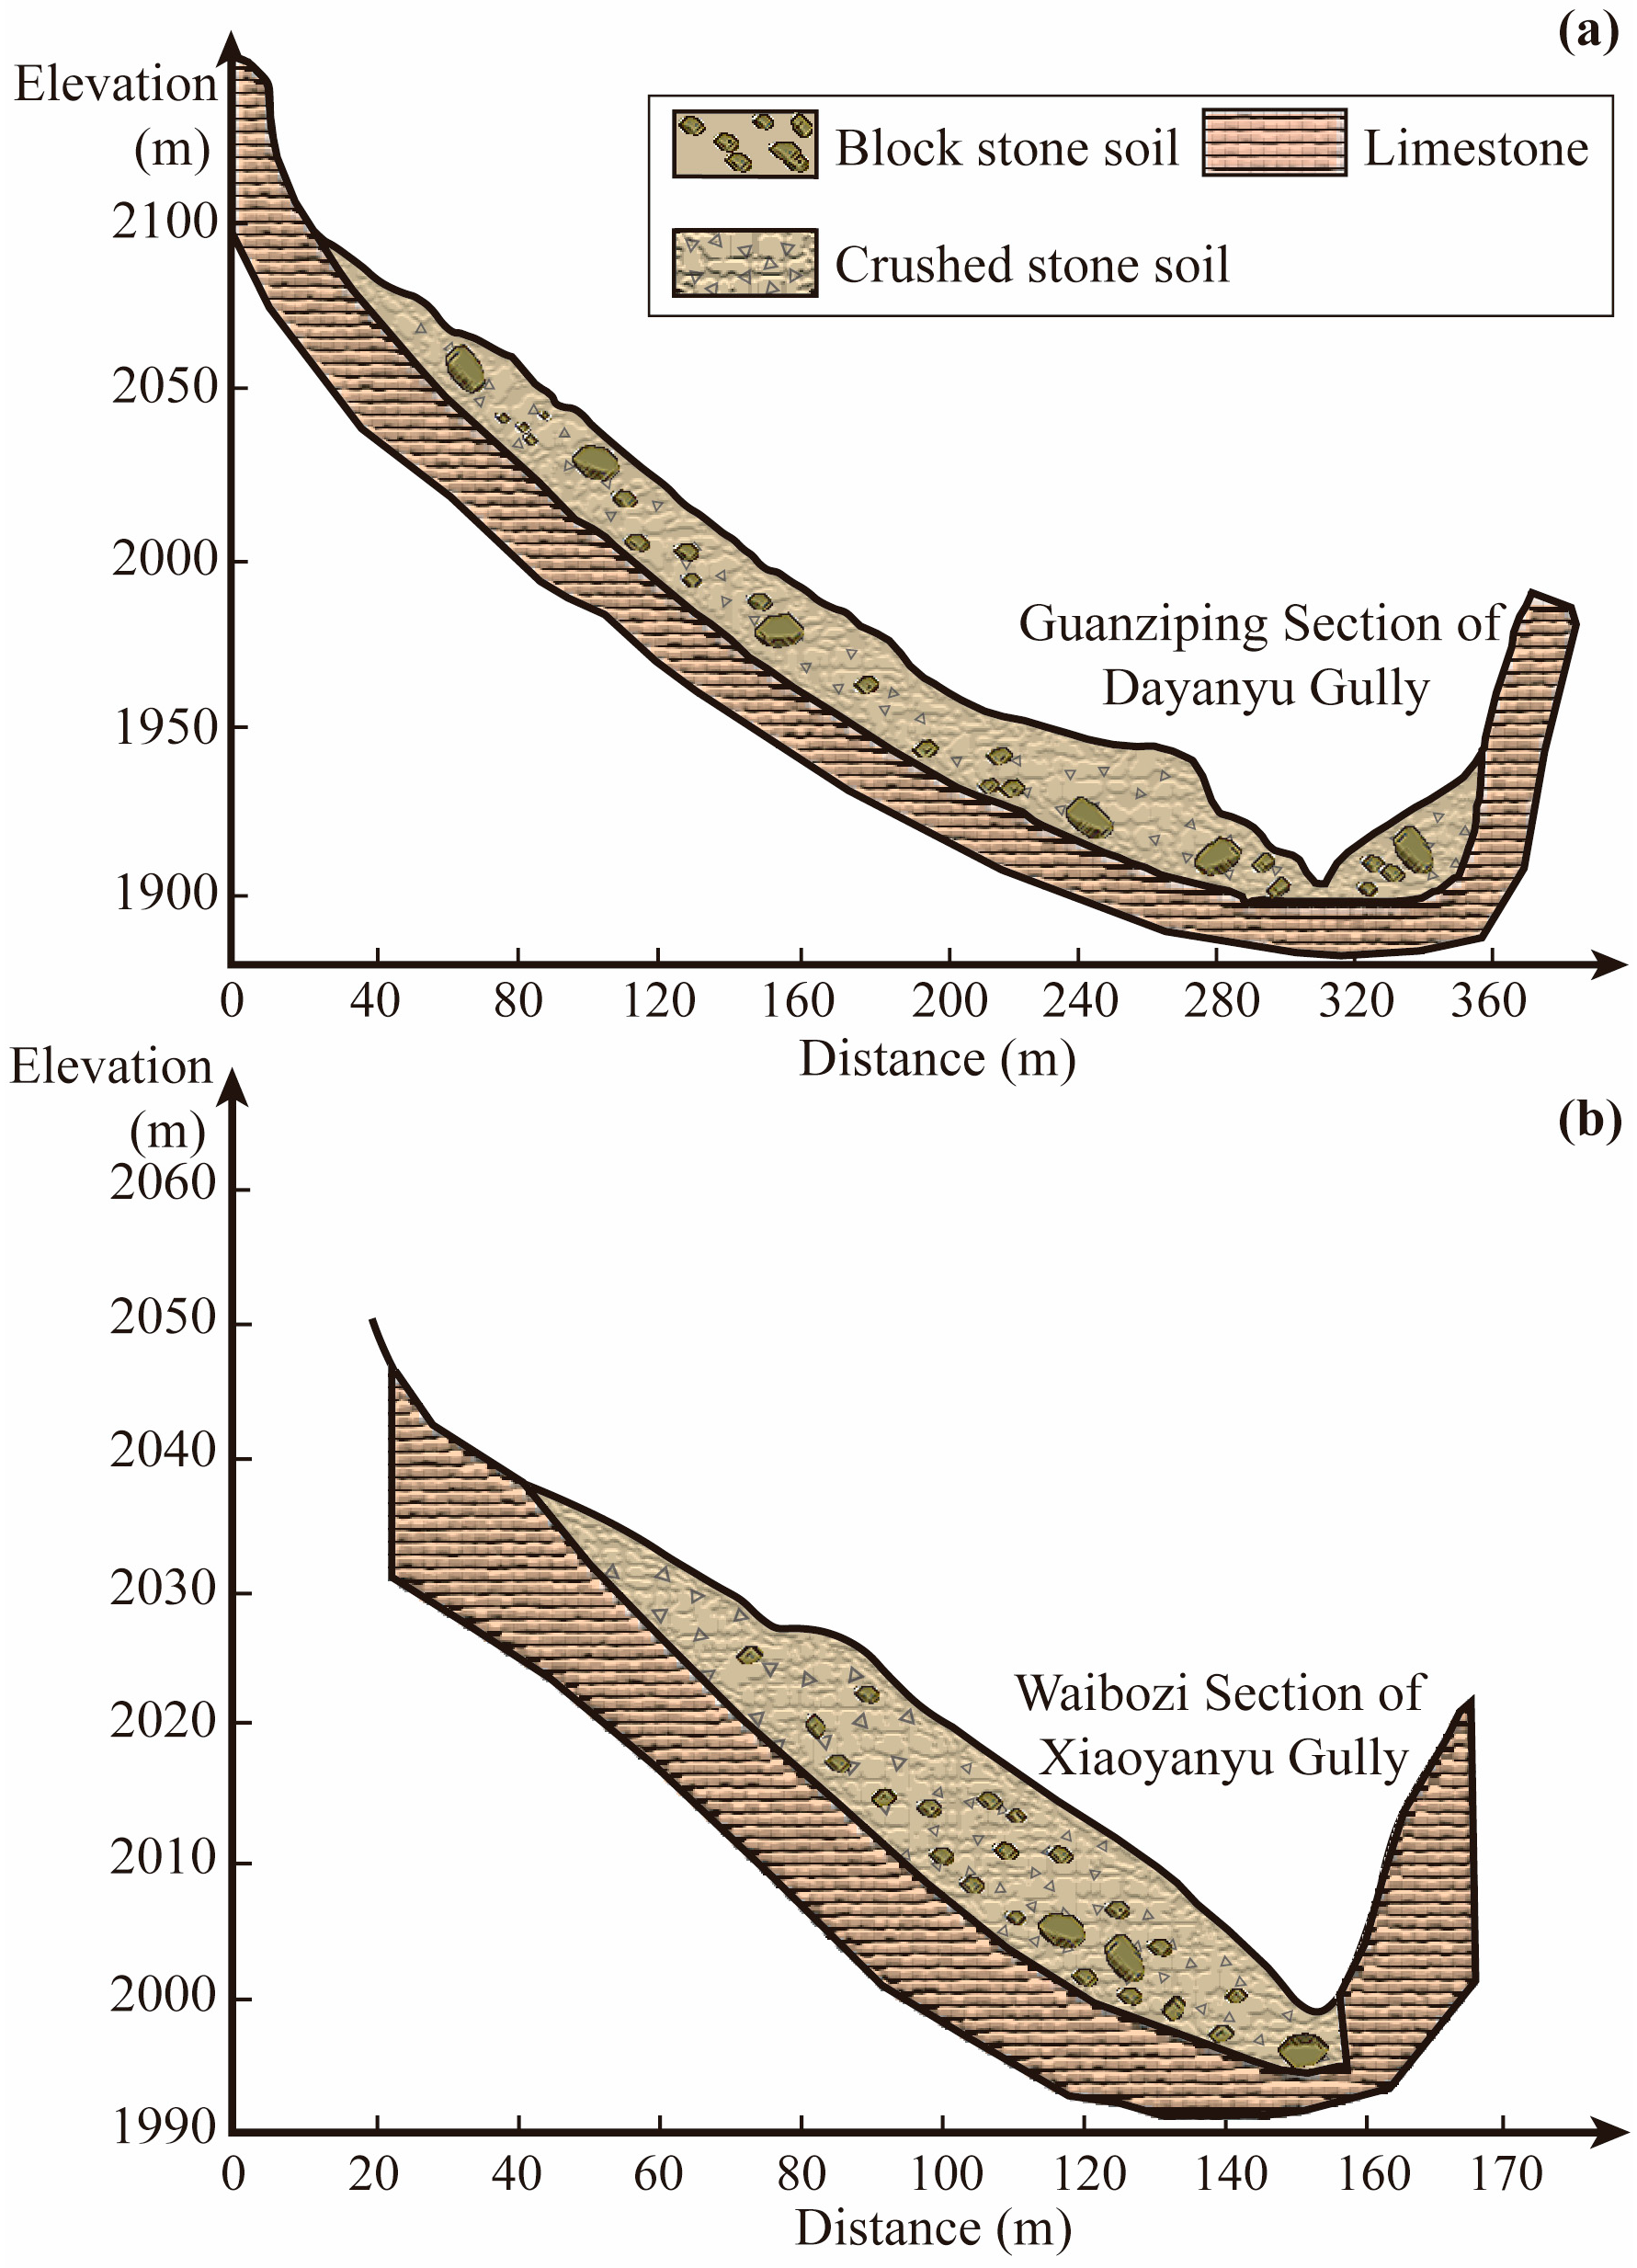
The mountainous region of southern Gansu (102°56′~105°59′ E, 32°35′~34°22′ N) (Figure 1a) is located at the intersection of the eastern margin of the Qinghai–Tibet Plateau and the north-central section of the North–South Seismic Belt of China, representing one of China’s four major debris-flow-prone regions [36]. Subjected to the tectonic collision and compression between the Indian and Eurasian plates, this region encompasses multiple deep-seated active fault zones (e.g., the Diebu-Bailongjiang fault), resulting in extremely intense neotectonic movements and seismic activities. The regional stratigraphy is predominantly composed of Silurian and Devonian systems (Figure 2), with widespread distributions of soft and highly fractured rock formations such as phyllite and slate, providing abundant loose solid material sources for geohazards. Its topography is dominated by high-relief alpine gorges, with the Bailong River featuring a natural hydraulic drop of 2783 m, and exceptionally steep terrain, with local relief commonly exceeding 3000 m [37]. As illustrated in Figure 3, the Guanziping section of the Dayanyu Gully (Figure 3a) and the Waibozi section of the Xiaoyanyu Gully (Figure 3b)—both upstream branches of the Sanyanyu Gully—feature thick layers of block stone soil and crushed stone soil overlying the bedrock. Formed through long-term weathering, seismic shaking, and slope failures, these loose deposits constitute the primary material sources for debris flows. Influenced by orographic uplift, the annual precipitation is unevenly distributed, highly concentrated in the rainy season from May to September, and often occurs as short-duration, high-intensity localized rainstorms [21]. Under the coupling effect of frequent strong earthquakes and extreme rainfall, a massive volume of newly generated loose sediment has sharply increased the risk of high-magnitude debris flows [38], posing a severe challenge to mitigation structures such as check dams.
Figure 1.
(a) Topographic map of the mountainous region of southern Gansu. (b–g) Field investigation of gully mitigation projects in several gullies.
Figure 2.
Regional geological and tectonic setting of the mountainous region in southern Gansu.
Figure 3.
Transverse geological profiles of the upstream branches in the Sanyanyu Gully system, illustrating the thick loose solid deposits overlying the bedrock. (a) Guanziping section of the Dayanyu Gully (data from [39]). (b) Waibozi section of the Xiaoyanyu Gully (data from [40]).
2.2. Investigation Results
We investigated the operational status of 139 accessible check dams within 21 representative debris flow gullies across Wudu County, Wen County, and Zhouqu County in southern Gansu, based on field surveys and a review of existing data (Table 1). The observed failure modes of these dams included complete destruction as well as localized damage to components such as secondary dams, spillways, abutments, and foundations (Figure 1b–g). The analysis showed that approximately 60% of the surveyed dams had suffered varying degrees of damage, with some being completely destroyed, during their service life; and about 58% were fully silted and had lost their sediment trapping capacity. A comparison of the operational status of fully silted and partially silted check dams revealed that the damage and destruction rate of the former reached 74%, while that of the latter was only 39%. This indicates that once the storage capacity is filled, the stress state of a check dam becomes more complex, making it more susceptible to failure under extreme hydrodynamic conditions [41].
Table 1.
Operational status of the investigated check dams.
3. Materials and Methods
3.1. Experimental Materials
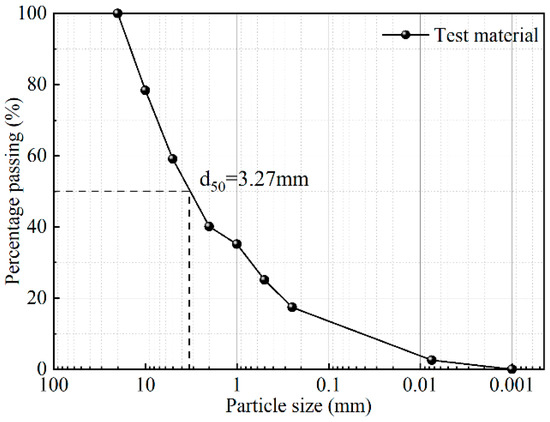
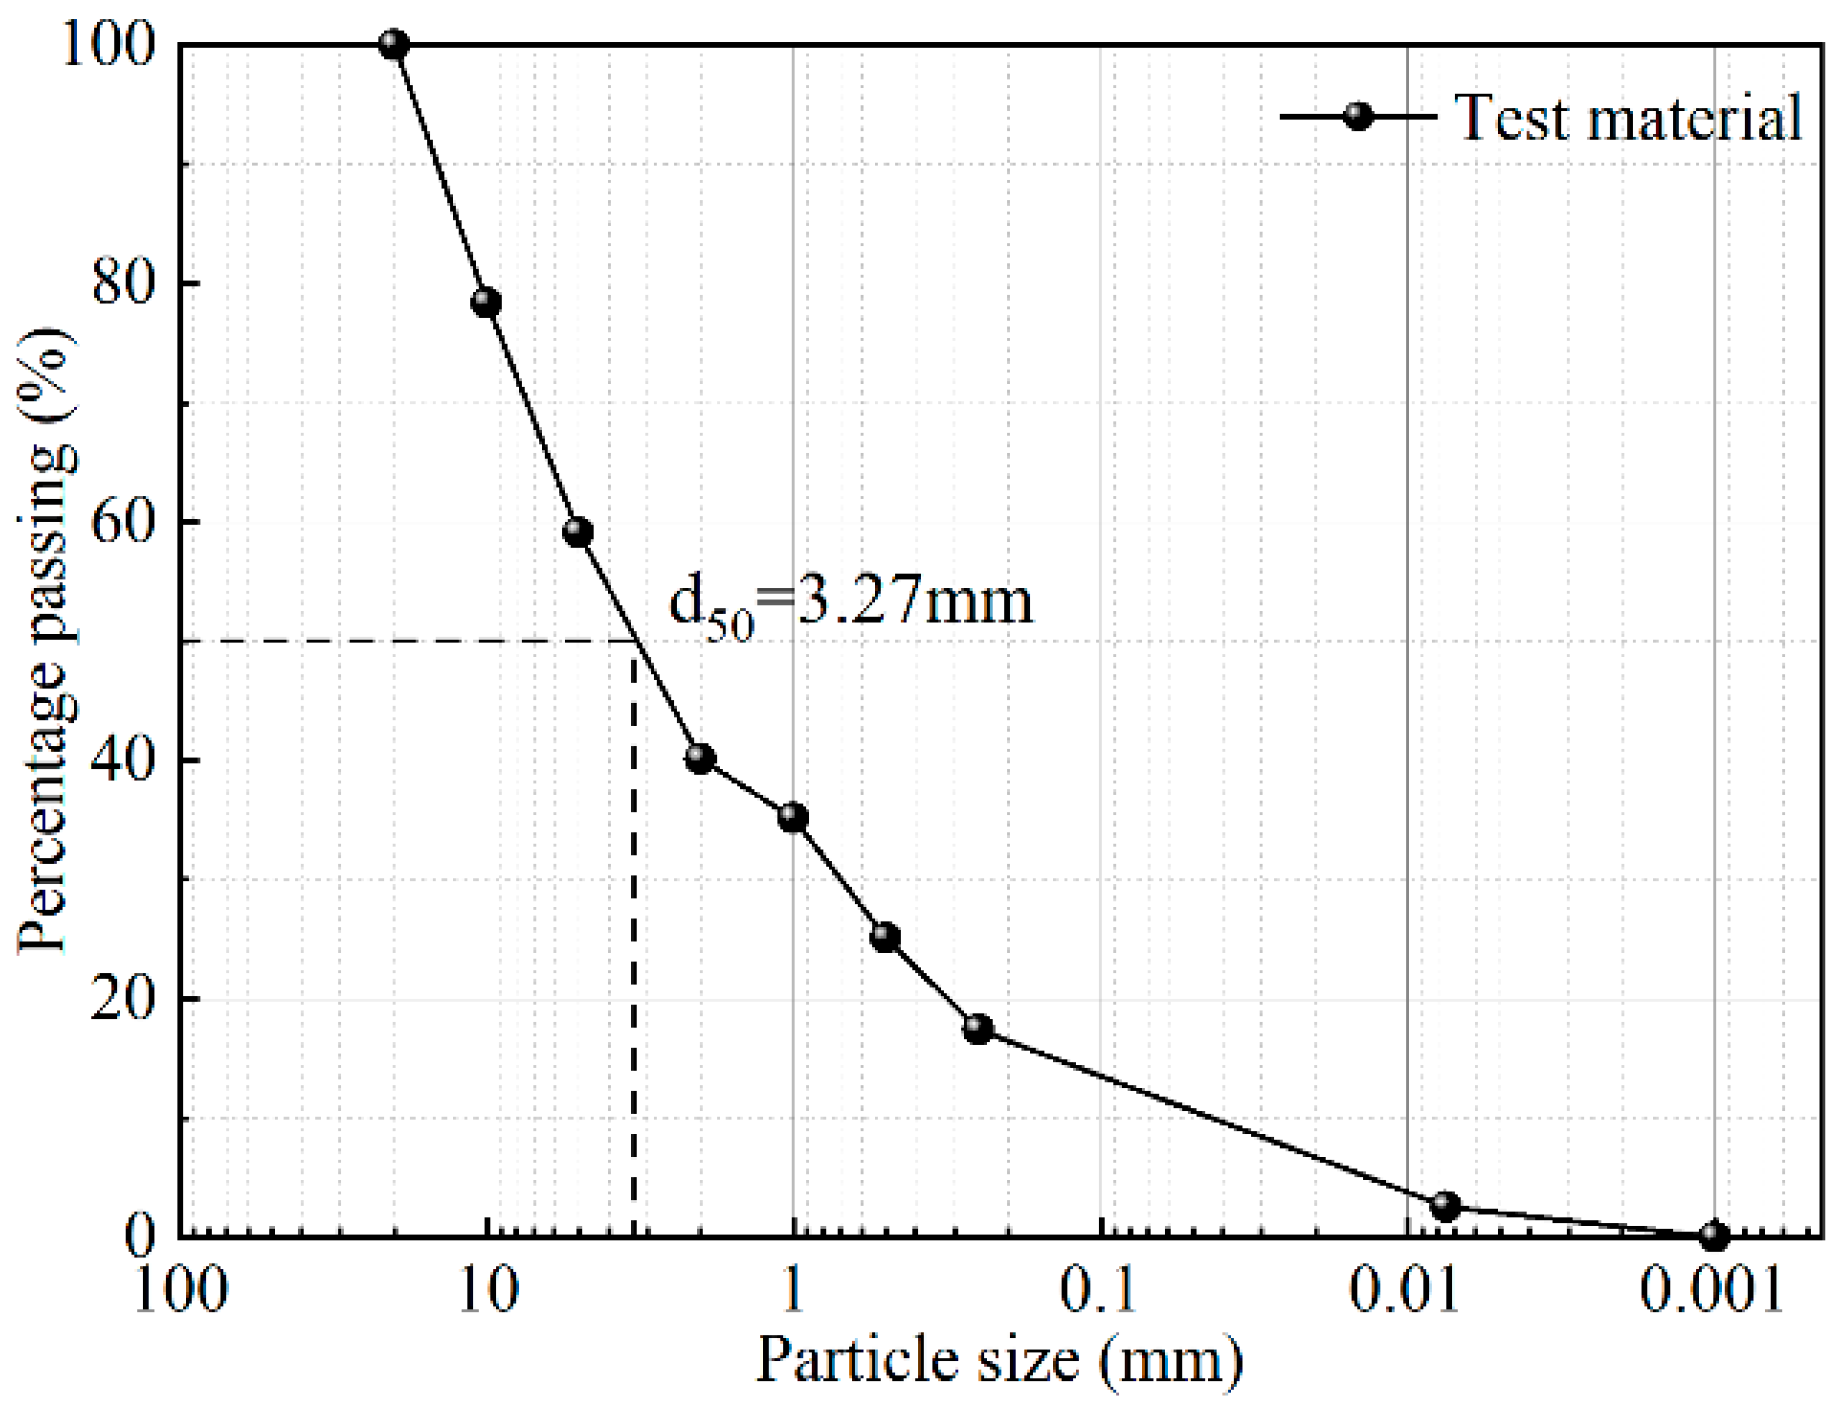
Informed by our field investigations, sediment samples were collected at a location 200 m upstream of the No. 2 check dam in the main channel of the Sanyanyu Gully, Zhouqu County, a site of a past catastrophic debris flow. The soil samples were initially screened through a 20 mm mesh to remove weeds and particles exceeding 20 mm in diameter to meet experimental requirements. Subsequently, an appropriate amount of soil was selected from the samples using the quartering method for multiple sieving tests to obtain the grain size distribution curve (Figure 4). The maximum particle size of the soil sample was 20 mm, which satisfied the principle that the maximum particle size should be less than one-fifth of the flume width. Thus, the soil material can be used as a proxy for natural debris flow material [42,43].
Figure 4.
Grain size distribution curve of the experimental material.
3.2. Experimental Setup
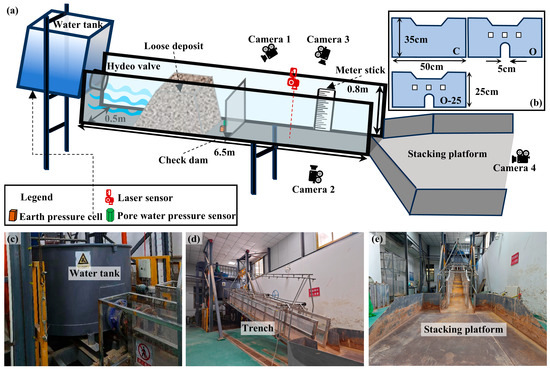
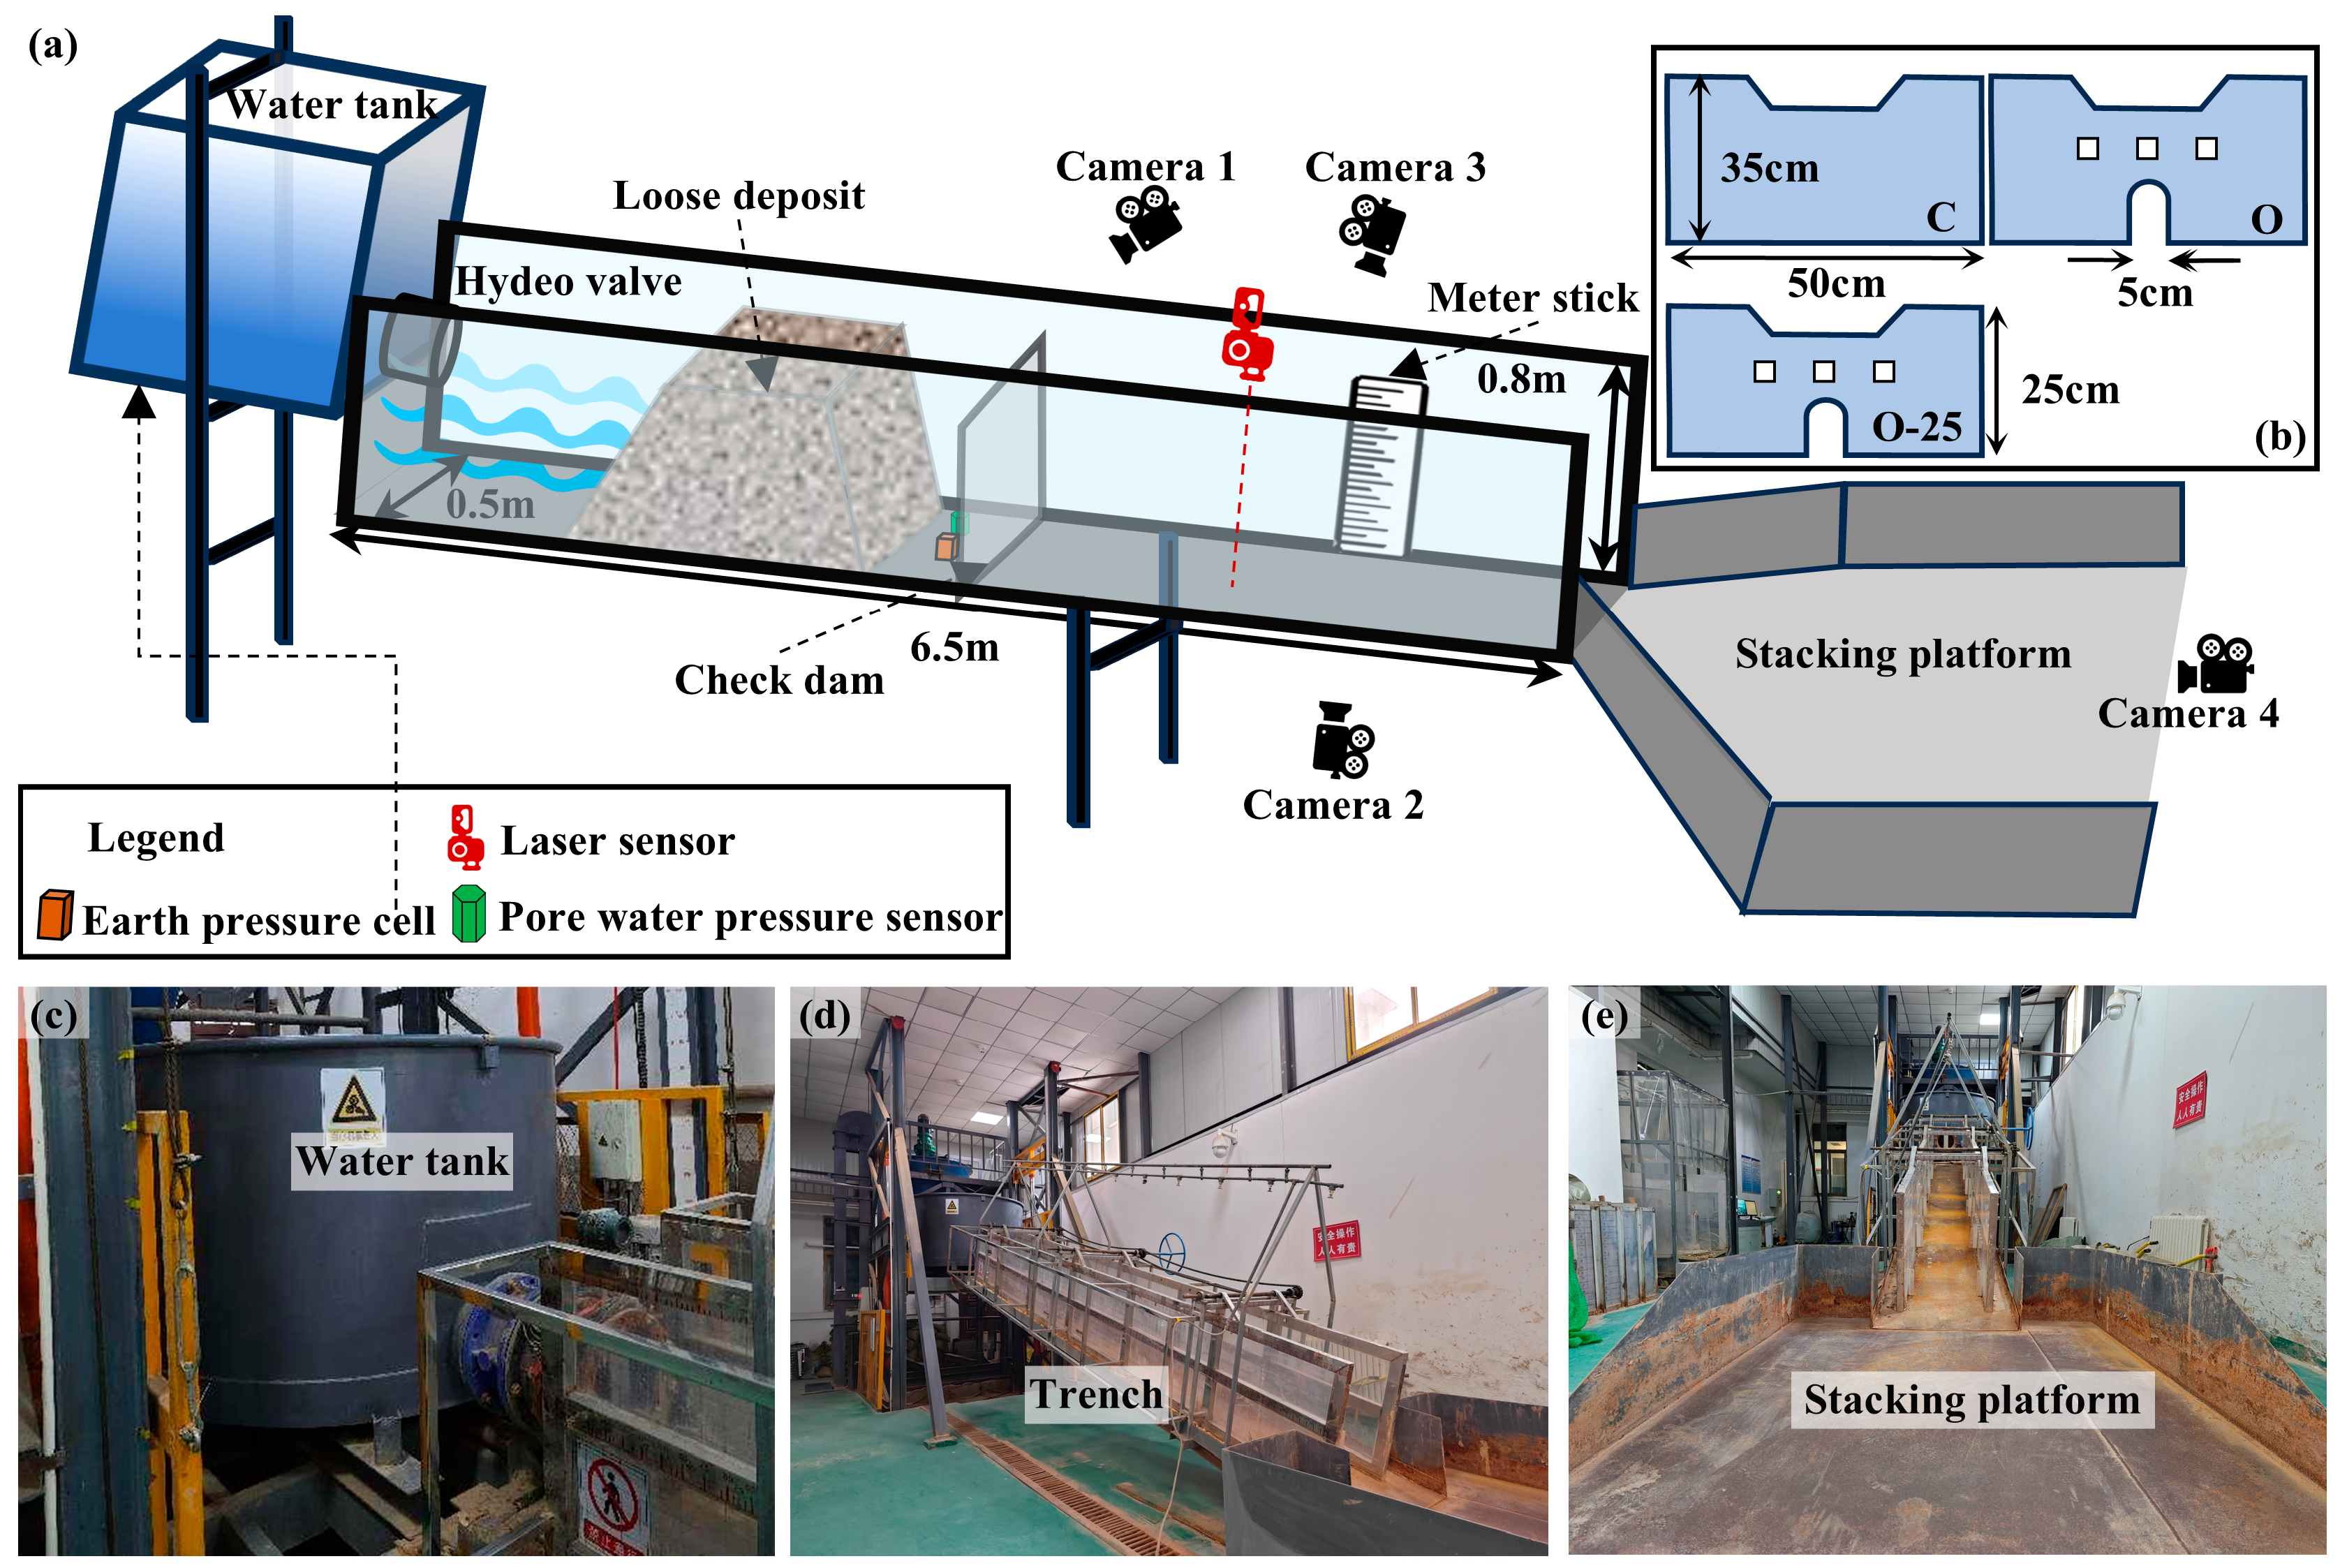
The experiments were conducted in a flume at the Landslide and Debris Flow Simulation Laboratory of the Institute of Geological and Natural Disaster Prevention, Gansu Academy of Sciences. The flume is 650 cm long, 50 cm wide, and 80 cm high, with a slope that can be adjusted from 0° to 40°. The flume bed is made of stainless steel, and the sidewalls are made of plexiglass to facilitate the observation of debris flow movement. A 1 m3 water tank was connected to the top of the flume, and a deposition platform (230 cm long, 200 cm wide) was at the downstream end. The water discharge was controlled by a pump-and-valve system and set to a constant rate of 0.002 m3/s. This value was selected based on previous flume experiments of a similar scale [26,44]. The center of the deposit was located 230 cm from the top of the flume, with a total mass of 148.5 kg and a bulk density of 1800 kg/m3. The check dam was installed 300 cm from the top of the flume, which provided sufficient space for material initiation and also ensured that the dam-breach debris flow had sufficient distance to accelerate and evolve.
The layout of the data acquisition instrumentation is shown in Figure 5a. Four cameras were used to film simultaneously. One camera (Camera 1) (DJI Pocket 2, 2K, DJI, Shenzhen, China) was positioned obliquely above the check dam to record the formation and movement of the dam-breach debris flow. A second camera (Camera 2) (Xiaomi 14 Pro, 2K, Xiaomi Corporation, Beijing, China) was placed parallel to the flume bed at a distance of 110 cm from the outlet to monitor the debris flow velocity. At the same location, a third camera (Camera 3) (Xiaomi 13 Pro, 2K, Xiaomi Corporation, Beijing, China) was placed against the flume sidewall to record the debris flow depth in conjunction with a ruler on the opposite sidewall. The last camera (Camera 4) (DJI Pocket 2) was positioned above the inundated area to record the debris flow deposition process. The bulk density of the debris flow was determined by continuous sampling at the flume outlet. At 290 cm downstream from the flume inlet, a pore water pressure sensor (HC-25, 0.25% FS, Hengrui Company, Beijing, China) and a total stress sensor (CYY9, 0.25% FS, Weizheng Company, Xi’an, China) were installed to measure pore water pressure and total normal stress during sediment deposition and initiation. A laser sensor (LR-TB5000, ±3 mm, KEYENCE Corporation, Osaka, Japan) was installed 250 cm from the outlet to monitor the bed sediment thickness variations. The LiDAR sensor of an iPhone 15 Pro (Apple Inc., Cupertino, CA, USA), mounted on a gimbal to minimize operator-induced error, was used to horizontally scan the surface of the deposit from a height of 80 cm. The resulting point cloud data were processed in CloudCompare v2.14 and ArcGIS Pro 3.15 to generate a Digital Elevation Model (DEM) of the deposition. The reliability of this LiDAR-based technique has been previously validated [45,46].
Figure 5.
Schematic of the experimental flume. (a) Layout of various equipment. (b) Dimensions of the model dams. (c–e) Photographs of the experimental setup.
Furthermore, both field investigations and previous studies [47,48] have shown that check dams are subjected to the greatest impact loads and are most prone to failure after their reservoirs are fully silted. Field investigations also found that approximately 70% of the check dams in the study area are masonry structures. As rigid dams, their structural failure typically manifests as brittle failure (Figure 1b,d). Under natural conditions, this type of abrupt failure can be triggered by the rapid scouring of the dam foundation by an overtopping flow. Therefore, to simulate this structural failure in our experiments, the dam was manually removed at the instant of overtopping. Although this method simplifies the complex dam breaching process, it was able to maximize the capture of the amplification effect produced by an instantaneous collapse.
3.3. Experimental Conditions
The experiments primarily considered three variables: flume slope, check dam type, and bed condition. All experimental conditions are listed in Table 2. Based on the average slopes of the main channel, the upper reaches, and the tributaries of the Sanyanyu Gully, the flume slopes were set to 13°, 16°, and 19°. The check dam types included an open dam and a closed dam, both with a height of 35 cm, as well as an open dam with a height of 25 cm. Bed types were divided into fixed beds and a 6 cm thick layer of wet sediment. In addition, a no-dam condition was set up as a control experiment to quantify the amplification effect of the dam breach on the debris flow.
Table 2.
Experimental conditions.
The Froude number (Fr), representing the ratio of inertial to gravitational forces, is commonly used to ensure dynamic similarity between flume flows and natural events [49,50,51]. It is defined as
where v is the flow velocity (m/s), g is the gravitational acceleration (m/s2), and h is the flow depth (m).
In this study, the Froude number of the debris flows ranged from 2.95 to 6.74, falling within the range of geophysical flows (0.5 < Fr < 7.6) reported in field observations [52,53]. Thus, the experiments could be used to simulate the field-scale behavior of debris flows.
4. Results and Analysis
A total of 12 flume experiments were conducted under different conditions, as detailed in Table 2. In Section 4.1, by comparing the experimental scenarios of the no-dam, closed dam, and open dam conditions (E2, E5, E6), the basic characteristics of the formation and evolution processes of dam-breach debris flows are described. Since the scale of a debris flow correlates with mobilized sediment volume, peak discharge, and inundation area [54], the amplification effect of check dam failure on debris flows was subsequently quantified in Section 4.2, Section 4.3 and Section 4.4 using three key indicators: peak discharge Q, erosion rate E, and downstream inundated area S, respectively.
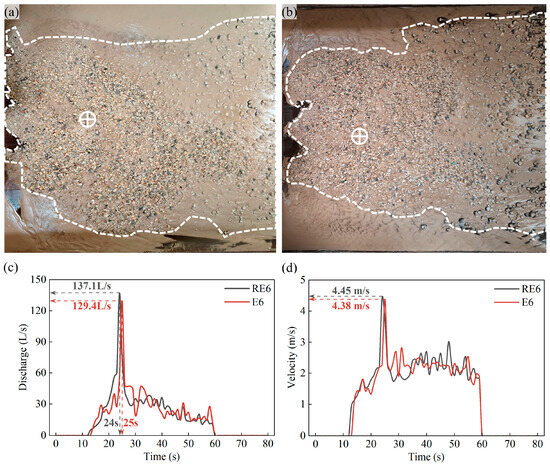
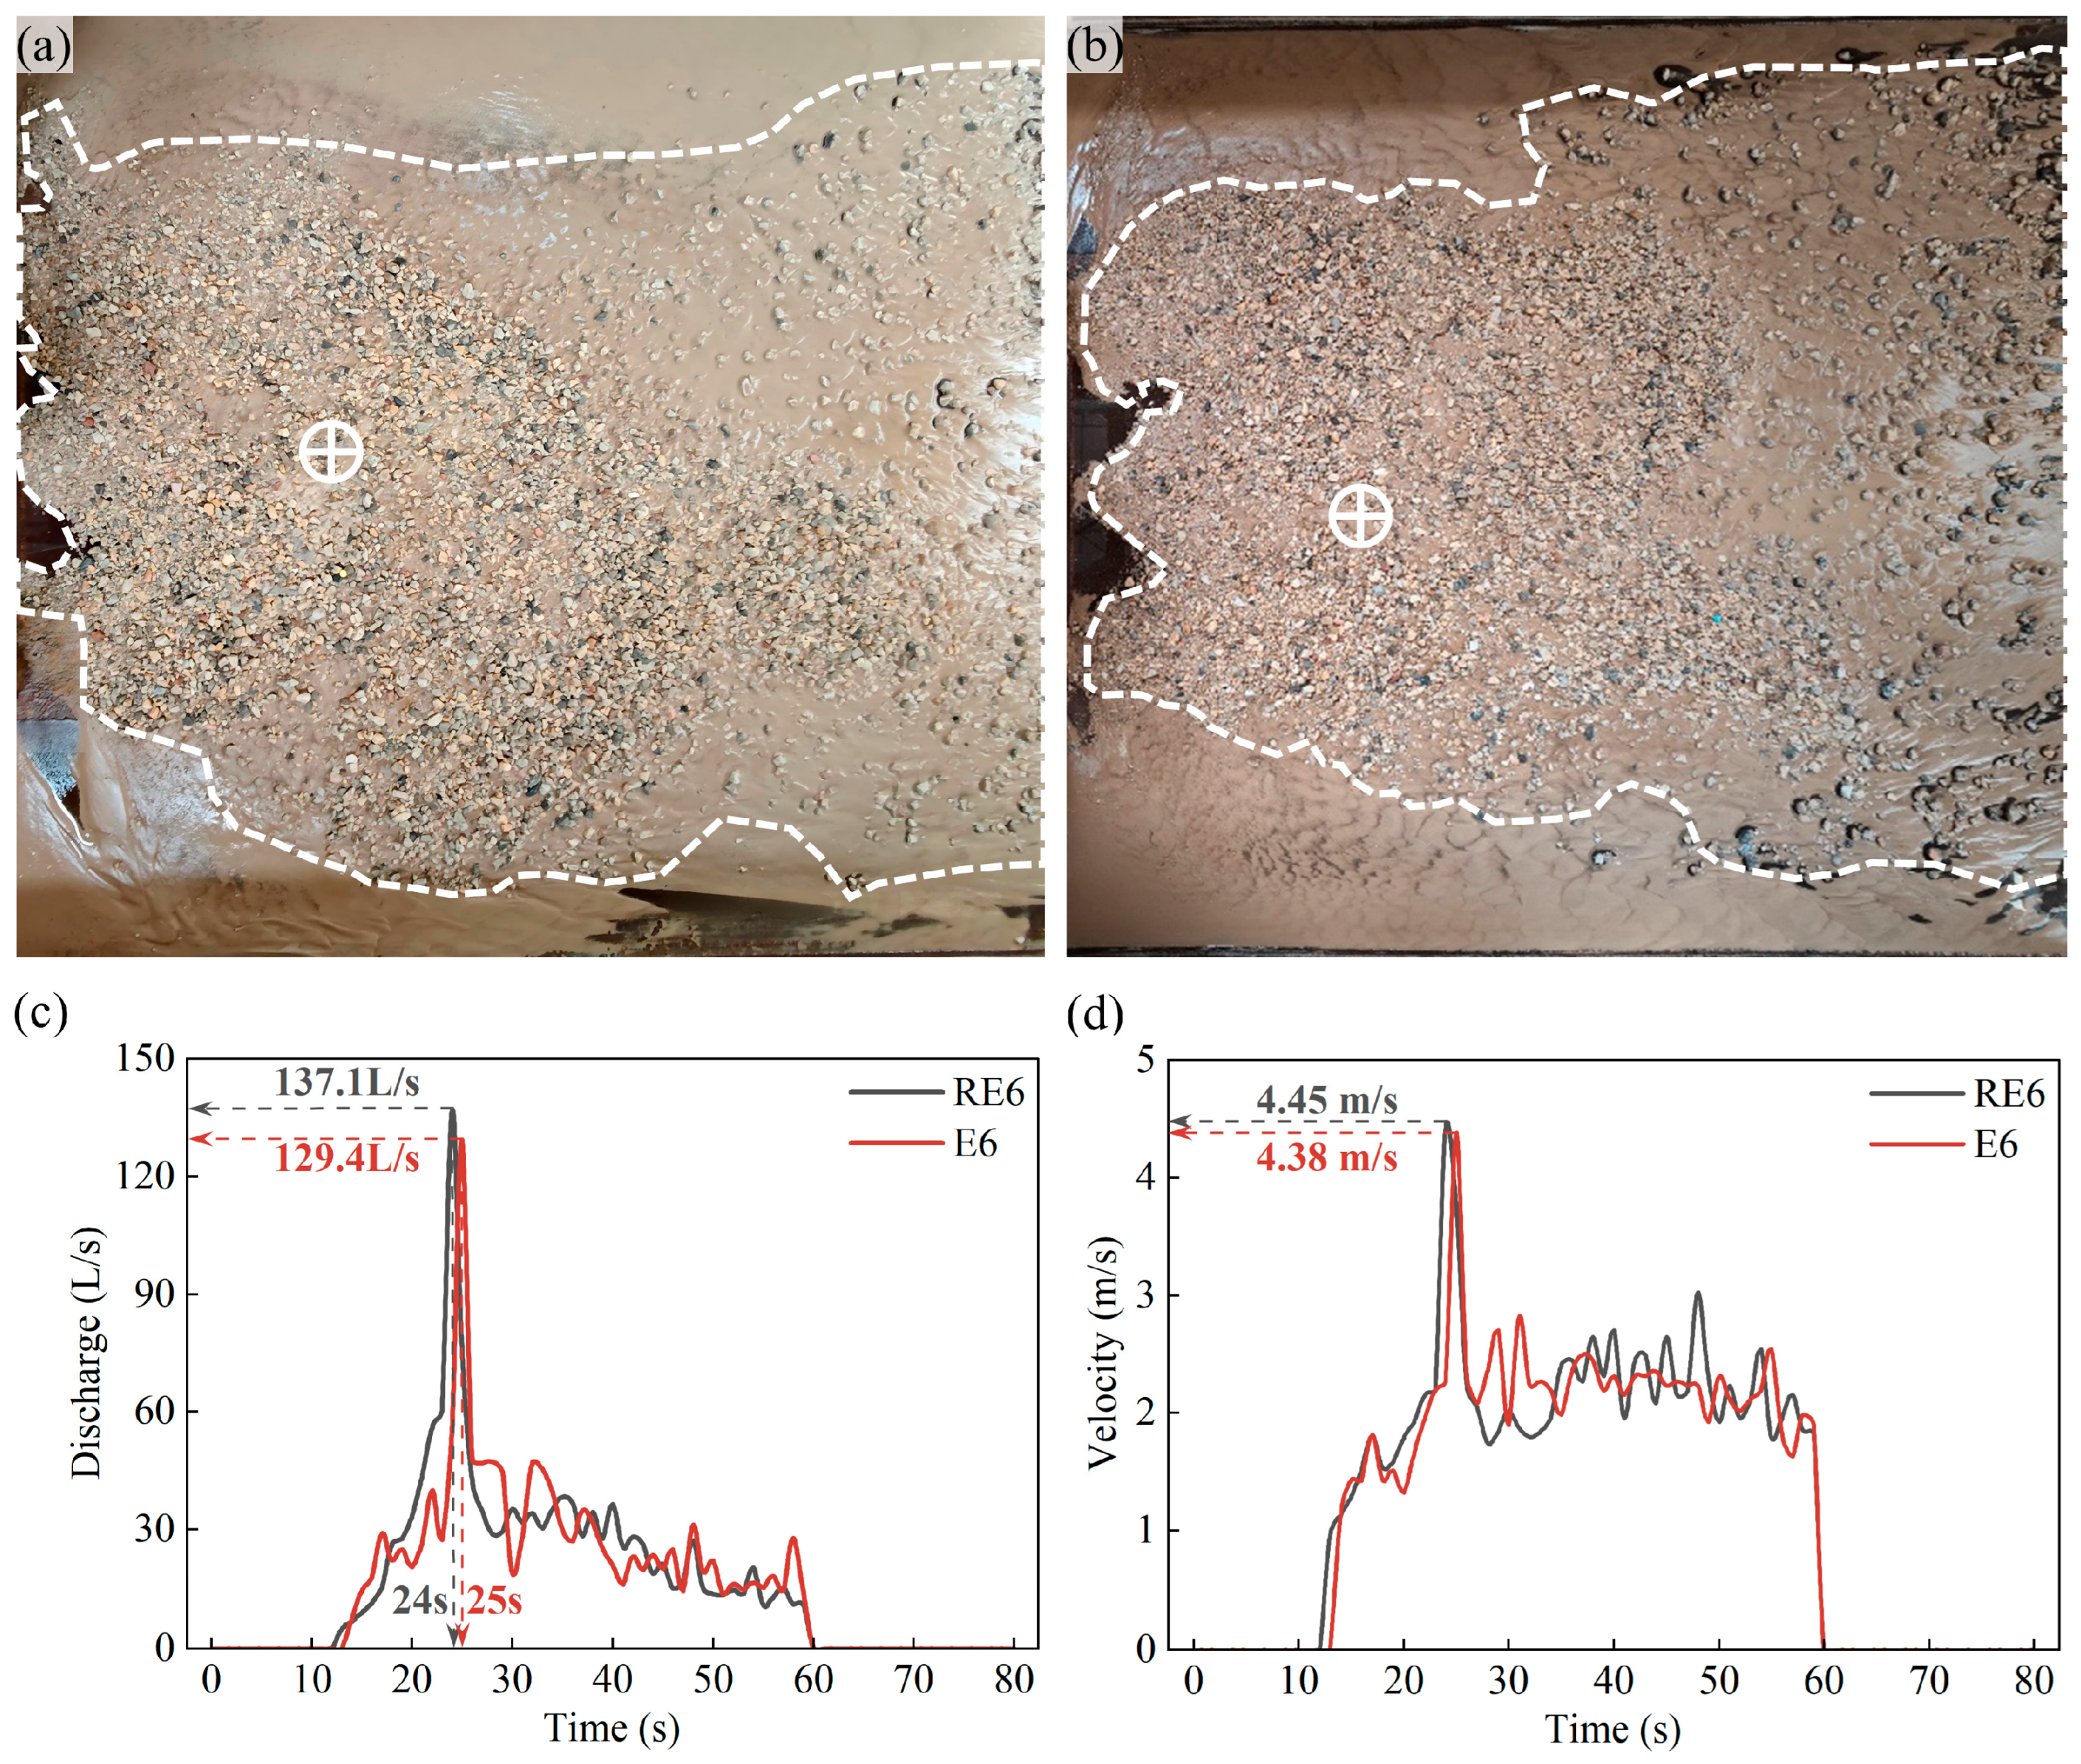
To verify the repeatability of the experimental method, an additional repeat test (RE6) was conducted for the representative scenario of an open check dam at a 16° slope (E6). As shown in Figure 6, the deposition morphology (Figure 6a,b), discharge hydrograph (Figure 6c), and velocity time-series (Figure 6d) of the repeat test were in good agreement with those of the original test. The relative differences in peak discharge, peak velocity, the arrival time of peak flow, and final deposition area between E6 and RE6 were 5.95%, 1.60%, 4.00%, and 8.50%, respectively. This indicates the reliability of the test method and the results.
Figure 6.
Comparative analysis of debris flow hydrodynamic characteristics and deposition extent. (a) Deposition morphology in scenario RE6. (b) Deposition morphology in scenario E6. (c) Comparison of discharge hydrographs. (d) Comparison of flow velocity time-series. The circles with a plus sign represent the deposition centers, and the dashed lines indicate the deposition areas.
4.1. Evolution Process of Dam-Breach Debris Flows
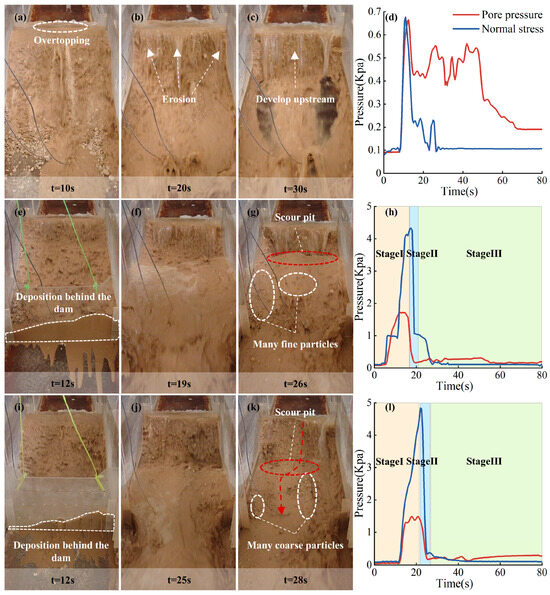
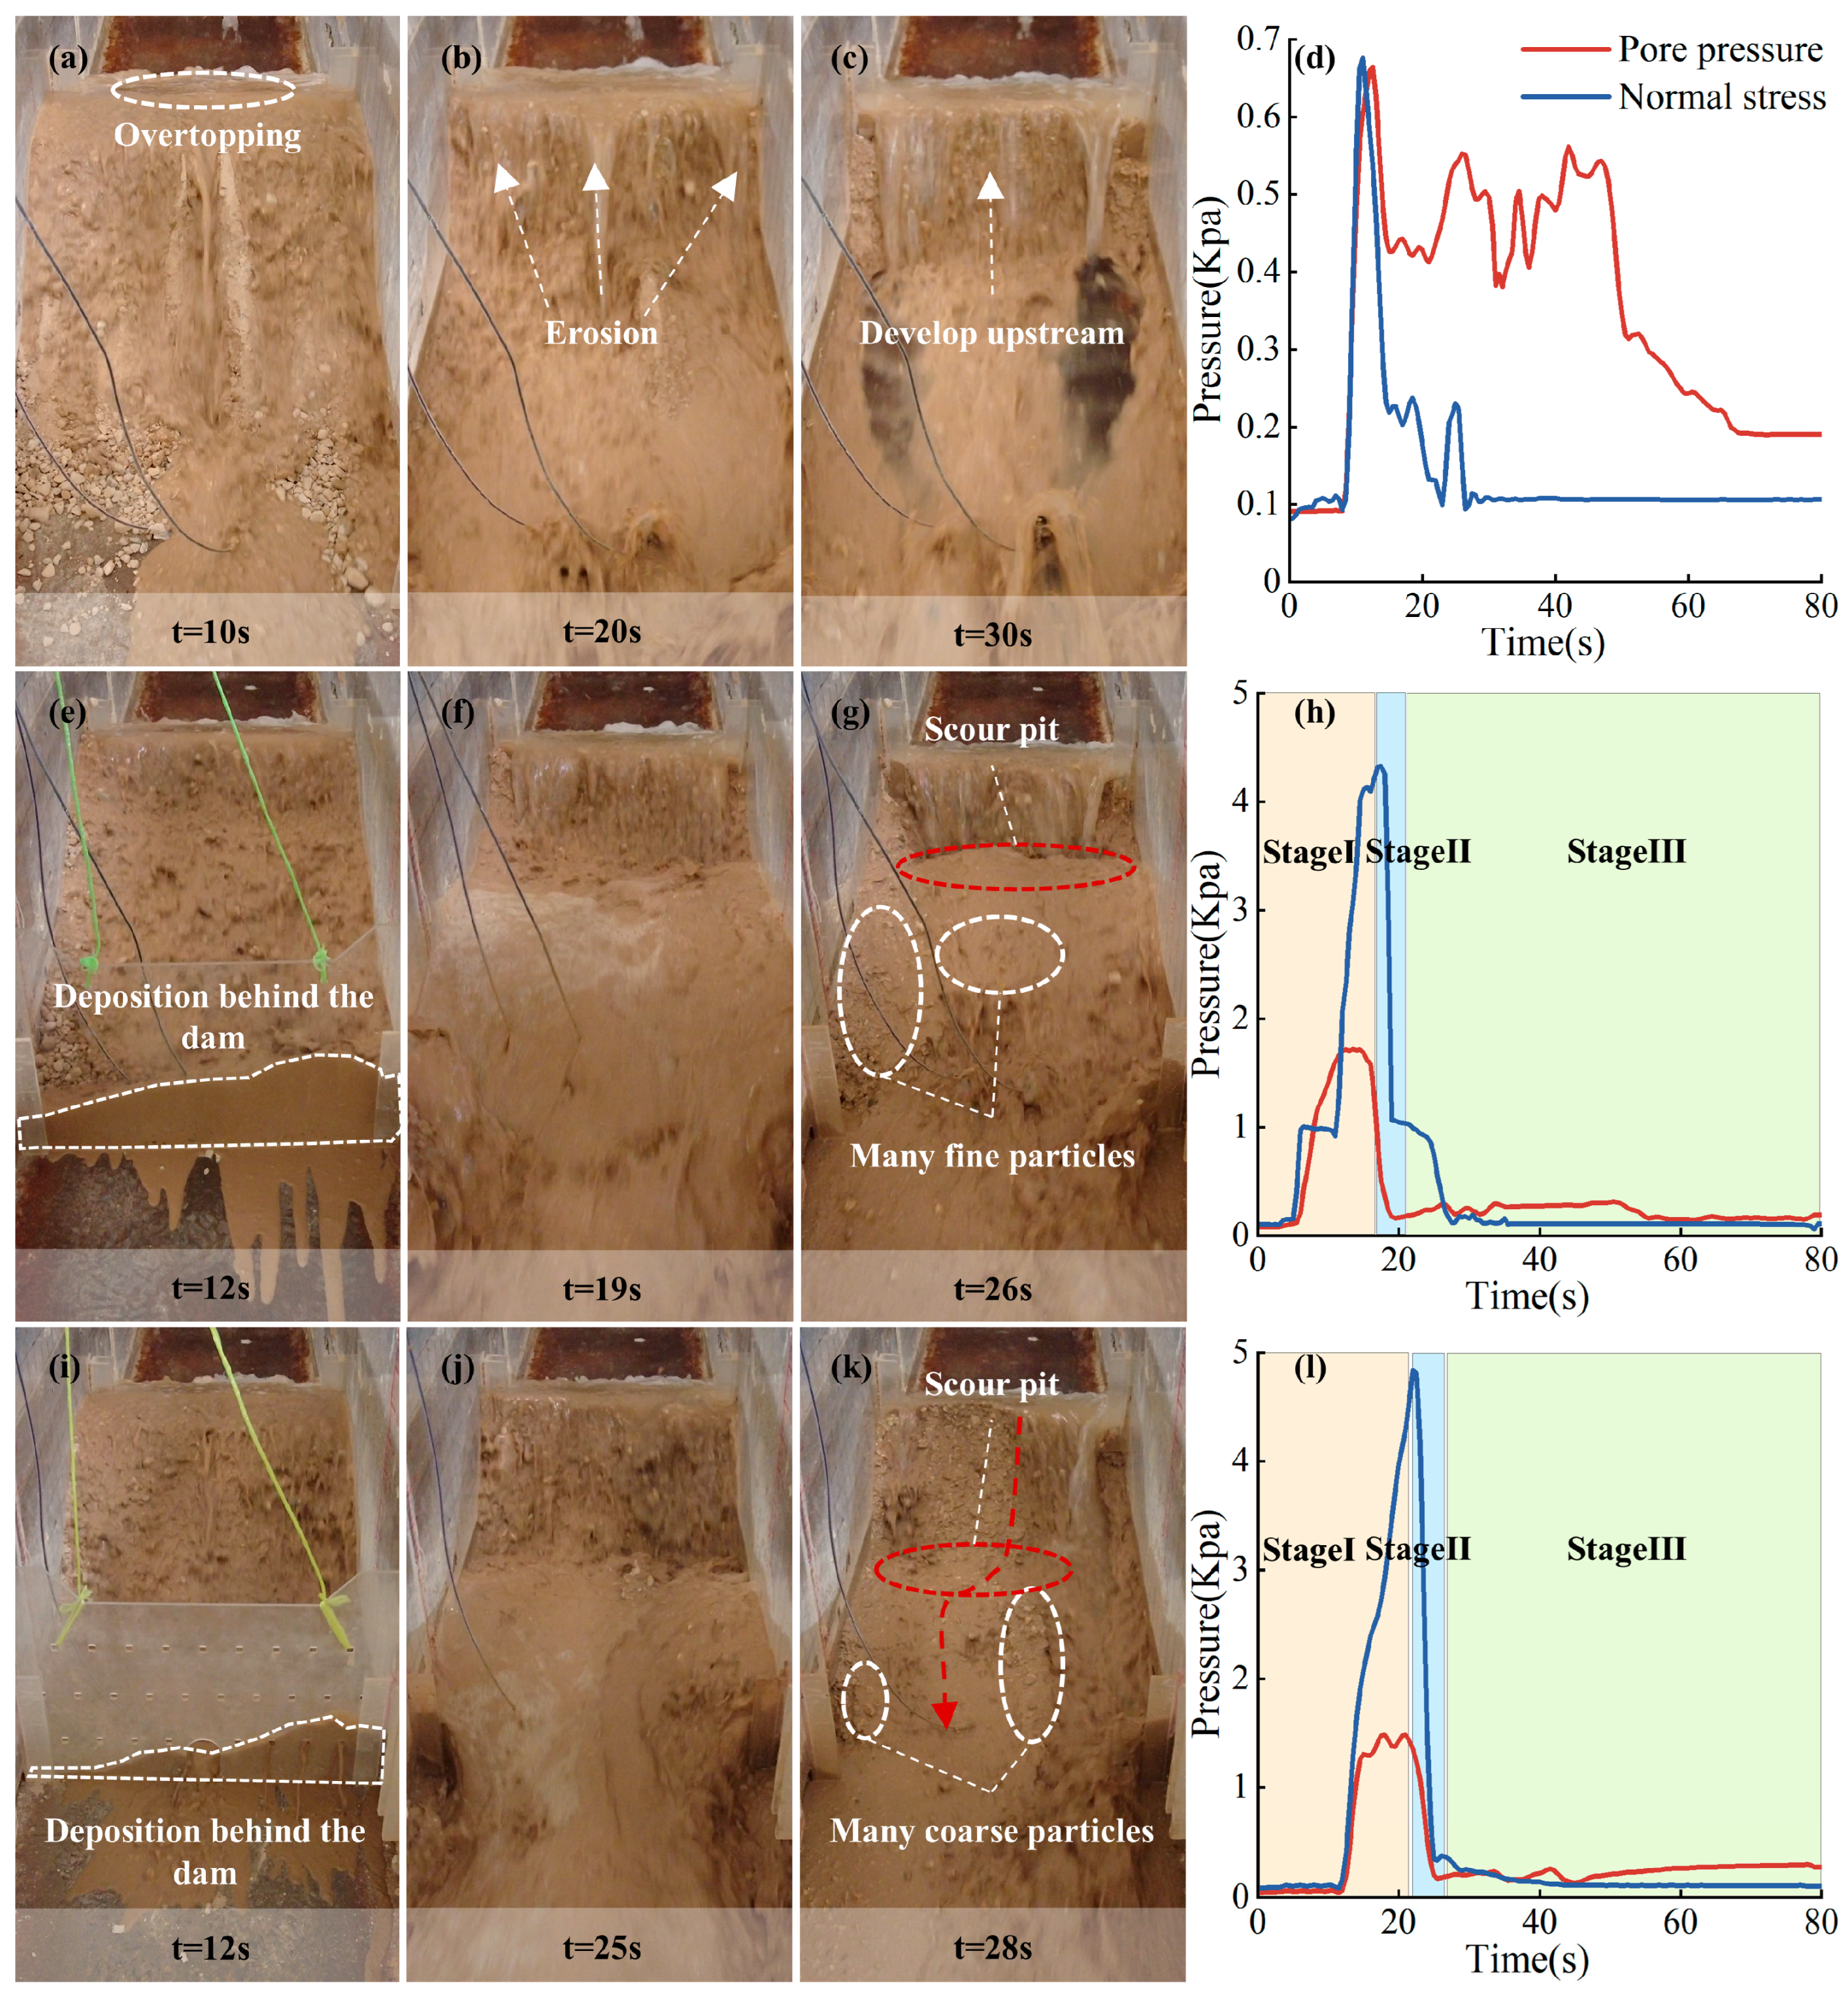
As shown in Figure 7a–c, under the no-dam condition, the formation of the debris flow manifested as a progressive erosion process. Once the upstream flow accumulated at the deposit front and overtopped, the flow initiated headward erosion from the downstream toe, progressing upstream, causing solid material to be progressively stripped, destabilized, and entrained by the flow, until the deposit was fully mobilized. Due to the absence of a check dam, mobilized material was directly transported downstream, resulting in relatively low pore water pressure and normal stress peaks of approximately 0.68 kPa and 0.65 kPa, respectively (Figure 7d), both exhibiting an initial increase followed by a decrease.
Figure 7.
Images and sensor time-series data from experiments E2, E5, and E6. (a–c,e–g,i–k) The debris flow evolution process under different check dam types. (d,h,l) Pore water pressure and normal stress behind the dam under different check dam types.
Under dam conditions, the evolution of the debris flow could be delineated into three distinct stages, based on visual observations and the dynamics of pore water pressure and normal stress behind the dam. As shown in Figure 7i–k, under the open-dam condition, following the initiation of the deposit, solid material was transported and deposited behind the dam, with fine grains and some coarse grains flushed downstream through the drainage facilities. Since the upstream inflow exceeded the discharge capacity of the check dam, the mud level behind the dam continuously rose (Stage I: Material initiation and deposit behind the dam stage). At this point, the pore water pressure and total normal stress behind the dam reached peak values of 1.48 kPa and 4.8 kPa, respectively, significantly higher than the peaks observed in the no-dam scenario. The dam progressively reached its load-bearing limit under the combined loading from sediment deposition, hydrostatic pressure, and hydrodynamic forces and failed upon overtopping. The reserved material and potential energy behind the dam were rapidly released, forming dam-breach debris flows (Stage II: Dam breaching and material release stage). This stage was extremely brief and was characterized by a sharp decay in the pressures behind the dam. However, the sediment behind the dam was not completely mobilized during the breach. The residual material formed scour pits, promoting further erosion, and was progressively destabilized and mobilized by the sustained inflow until it was fully initiated (Stage III: Recession and residual material adjustment stage). The pressures behind the dam showed a steady decreasing trend, ultimately stabilizing at approximately 0.1 kPa and 0.2 kPa, respectively. Notably, the decay time for normal stress after the breach of the open dam (6.5 s) was significantly shorter than that for the closed dam (10.5 s) (Figure 7h,l). This difference is primarily attributed to the fact that the closed dam failure left more fine particle-containing materials with better overall integrity (Figure 7g), whereas the “retaining the coarse and sluicing the fine” characteristic of open dams resulted in the residual material being predominantly exposed coarse particles with poor stability (Figure 7k), making them more susceptible to flow disturbance and rapid transport downstream.
4.2. Discharge Amplification Effect
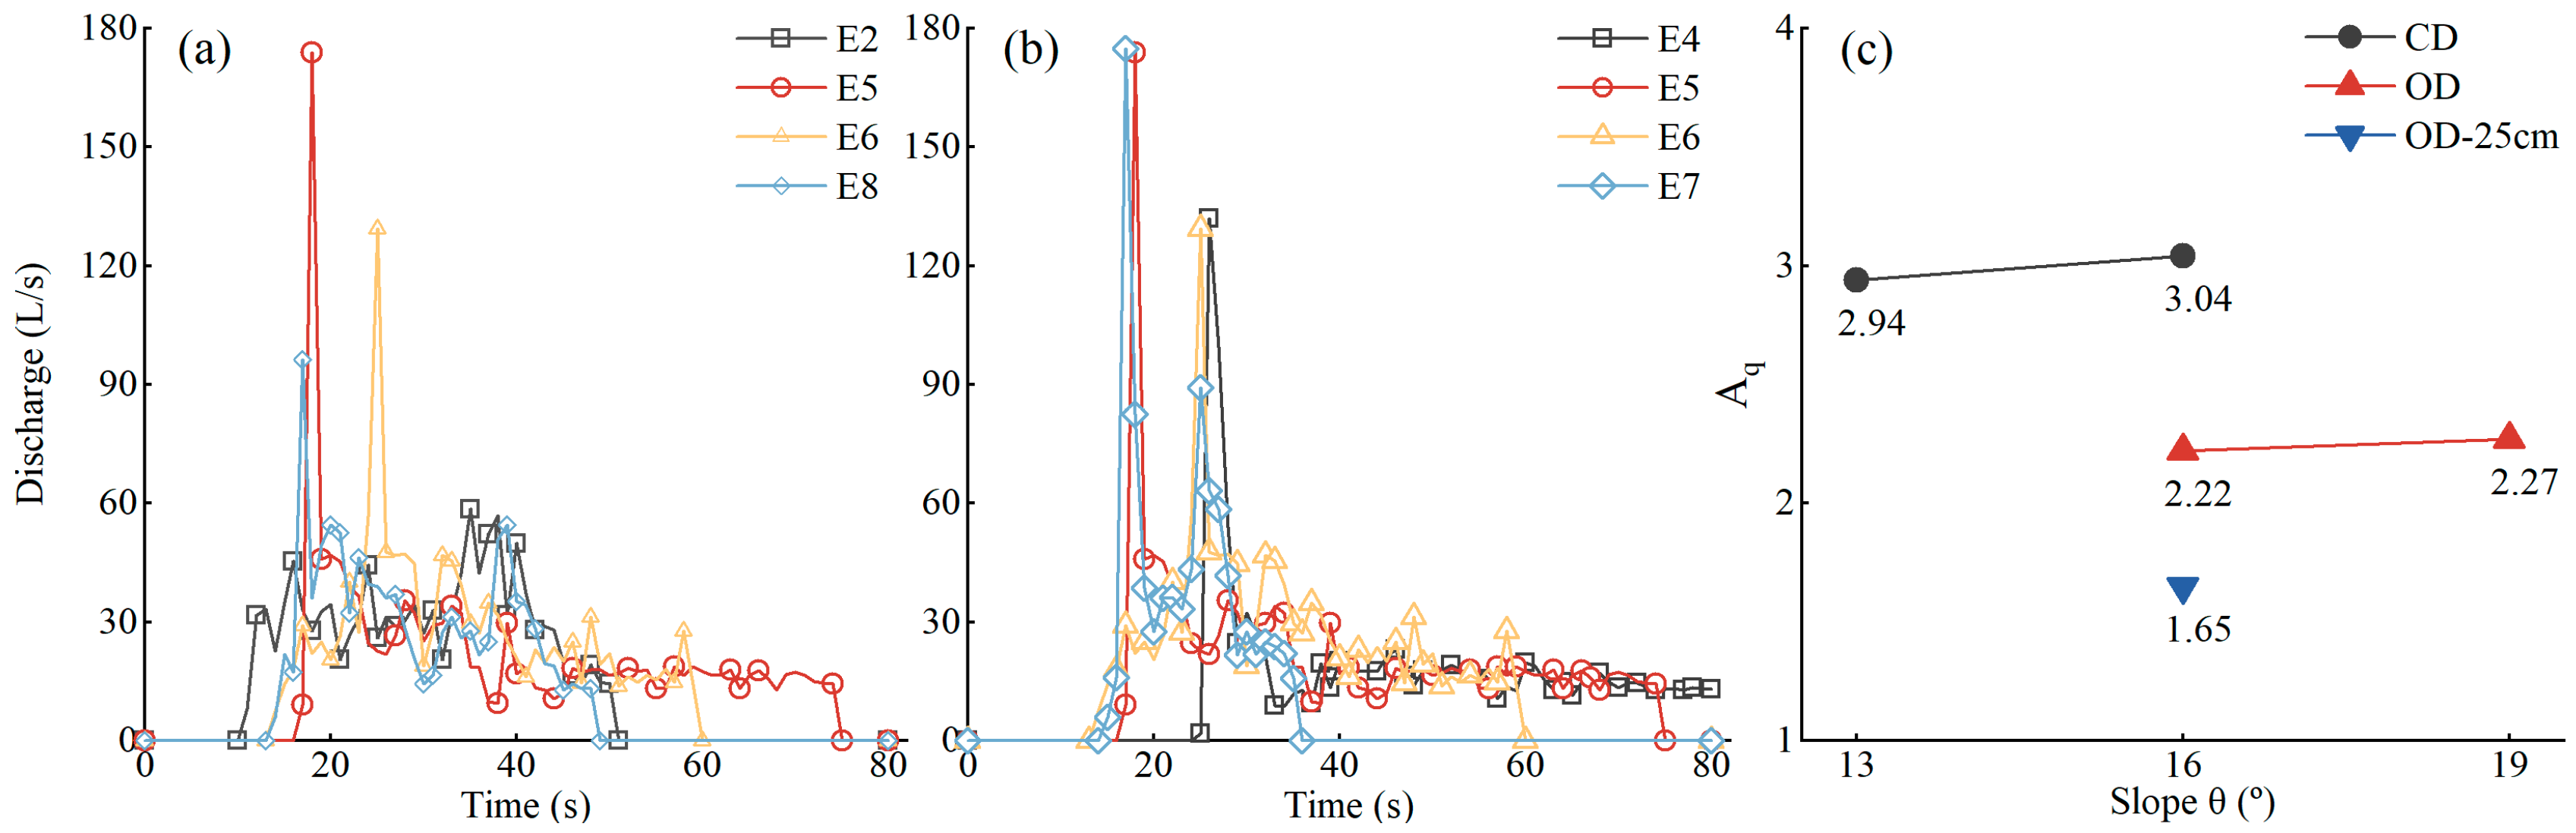
The failure of a check dam triggers an abrupt release of the reserved sediment and potential energy, causing a significant amplification effect on the debris flow discharge. As shown in Figure 8a, under the same flume slope (16°), the debris flow discharge process in E2 (no dam) was relatively gentle, exhibiting an overall trend of initial increase followed by decrease, with a relatively small peak discharge of approximately 58 L/s. In comparison, the dam-breach scenarios (E5, E6, and E8) all exhibited sharp and high discharge peaks after dam failure. The closed dam case (E5) yielded the highest peak discharge at approximately 173 L/s, far exceeding that of E2. As the flume slope increased, the duration of the dam-breach hydrograph was shortened, while the peak discharge increased and occurred earlier (Figure 8b). To quantify this amplification, a discharge amplification factor, Aq, was defined:
where Qdam and Qno-dam represent the debris flow peak discharges under dam and no-dam scenarios for the same experimental settings, respectively (m3/s). As shown in Figure 8c, in this study, Aq ranged from 1.65 to 3.04. Specifically, as the flume slope increased from 13° to 16°, Aq for the closed dam case increased from 2.94 to 3.04. Similarly, when the slope increased from 16° to 19°, Aq for the open dam case increased from 2.22 to 2.27. This suggests that the discharge amplification factor increases with the gradient, but the increase is not very significant. In contrast, when the dam height was increased from 25 cm to 35 cm, Aq for the open dam case increased significantly from 1.65 to 2.22. A greater dam height means more material interception and energy storage, resulting in higher flow velocity and depth for the formed debris flow after dam failure, thereby causing peak discharge under high dam cases to be significantly greater than under low dam cases. Under the same 16° slope, the Aq for the closed dam case was markedly higher than that for the open dam case. Observations of experimental phenomena in E5 and E6 revealed that due to the “retaining the coarse and sluicing the fine” function of the open dam, reserved material and energy were released concurrently with their accumulation. This resulted in the solid material content behind the dam being relatively low and dominated by coarse grains, making the velocity and flow depth of the dam-breach debris flow relatively lower than in the closed dam case, which in turn led to a smaller peak discharge and amplification factor. These experimentally derived discharge amplification factors (Aq = 1.65–3.04) provide a quantitative physical basis for the massive scale enlargement observed in the field. For instance, post-disaster investigations of the 2010 Zhouqu debris flow revealed that cascading dam failures caused the peak discharge to reach 2 to 50 times the flood-prevention design standard [16].
Figure 8.
(a) Debris flow hydrographs for different check dam types at a constant slope (16°). (b) Debris flow hydrographs for different flume gradients. (c) Discharge amplification factors under different conditions.
4.3. Erosion Amplification Effect
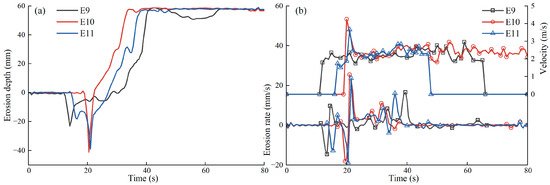
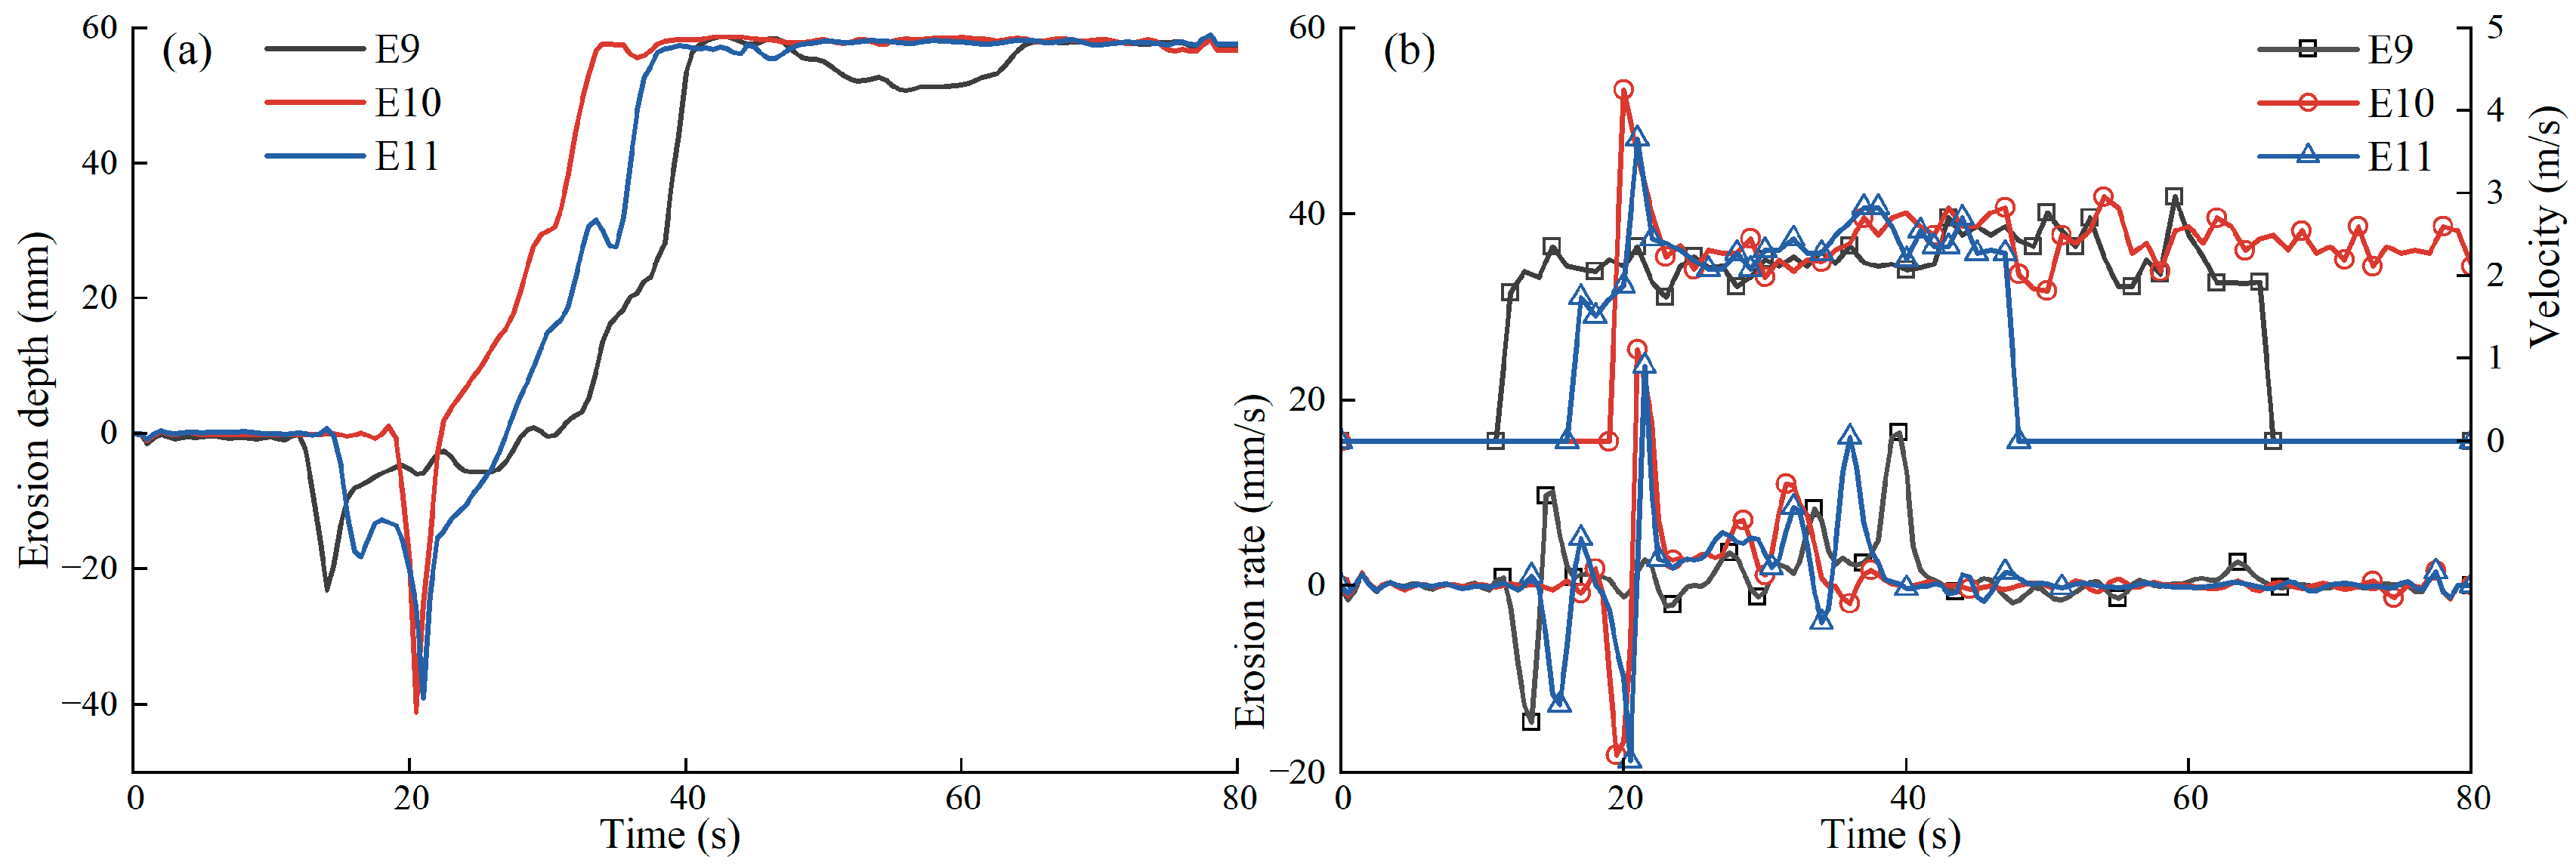
The channel bed erosion process is a core part of the interaction between a debris flow and the underlying surface. Previous research has established that the erosional capacity of debris flows is positively correlated with several factors, including velocity, flow depth, and the channel gradient [55,56]. Consequently, debris flows with high velocity and high flow depth formed by check dam failure will significantly enhance their erosional damage to downstream channel beds. In this study, we used a laser sensor to obtain a time series of bed elevation changes at a monitoring point (Figure 9a). The instantaneous erosion rate at this location was then estimated by applying a first-order numerical differentiation to this time series (Figure 9b), where positive rates denote erosion and negative rates denote deposition. The dynamic characteristics of dam-breach debris flows are closely related to erosion processes. As shown in Figure 6b, for the experiments conducted on a mobile bed (E10 and E11), the maximum erosion rates were observed after the passage of the breach-induced peak discharge at the monitoring point. These rates reached 25.42 mm/s and 23.65 mm/s, respectively, both markedly exceeding the rate of 16.42 mm/s recorded under the no-dam control case. To quantify the amplification of this erosion intensity, an erosion rate amplification factor, Ae, was defined:
where Eno-dam and Edam are the peak erosion rates of debris flows under no-dam and dam conditions for the same experimental settings, respectively (mm/s). Based on this calculation, the Ae for experiments E10 and E11 were 1.55 and 1.44, respectively. This directly confirms that check dam failure enhances the instantaneous erosion intensity of the downstream debris flow [33].
Figure 9.
(a) Bed thickness variations at the monitoring point. (b) Corresponding debris flow velocity and erosion rate variations.
Fundamentally, erosion is governed by the balance between the basal shear stress (τb) exerted by the flow and the resisting stress (τres) of the bed material. Bed particles are mobilized and entrained only when τb > τres [55,57]. According to the critical shear stress model proposed by [58] (Equation (4)), the relationship between debris flow shear stress and erosion rate can be analyzed:
where E is the erosion rate (m/s), and kd is the erodibility coefficient (m3/N·s), which is a constant determined by the bed particle characteristics [59]. τb is expressed using the Voellmy model as follows:
where ρ is the debris flow bulk density, (kg/m3), φ is the internal friction angle of the debris flow material, (°), and Cz is the Chézy coefficient, where Cz = h1/6/n, and n is the Manning roughness. The basal resisting stress τres can be expressed by the formula proposed by [60] as follows:
where σ is the total normal stress, p is the pore water pressure, (σ − p) is the effective stress, φb is the internal friction angle of the bed material, and c is the cohesion. Based on Equations (4)–(6), the mechanism for this erosion amplification can be qualitatively explained: the rapid increase in debris flow velocity and depth caused by dam failure directly leads to a significant increase in debris flow shear stress; simultaneously, the rapid loading of dam-breach debris flows generates high pore water pressure in the wet bed surface sediments, reducing effective stress and thereby weakening the resistance of the bed material [61]. These two factors jointly promote enhanced erosion rates of dam-breach debris flows on channel beds.
4.4. Deposition Amplification Effect
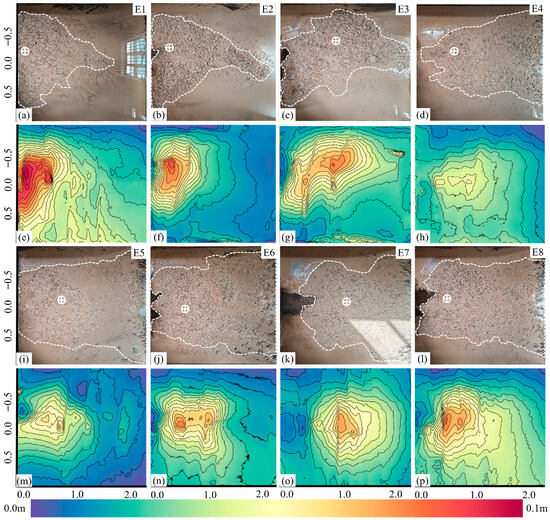
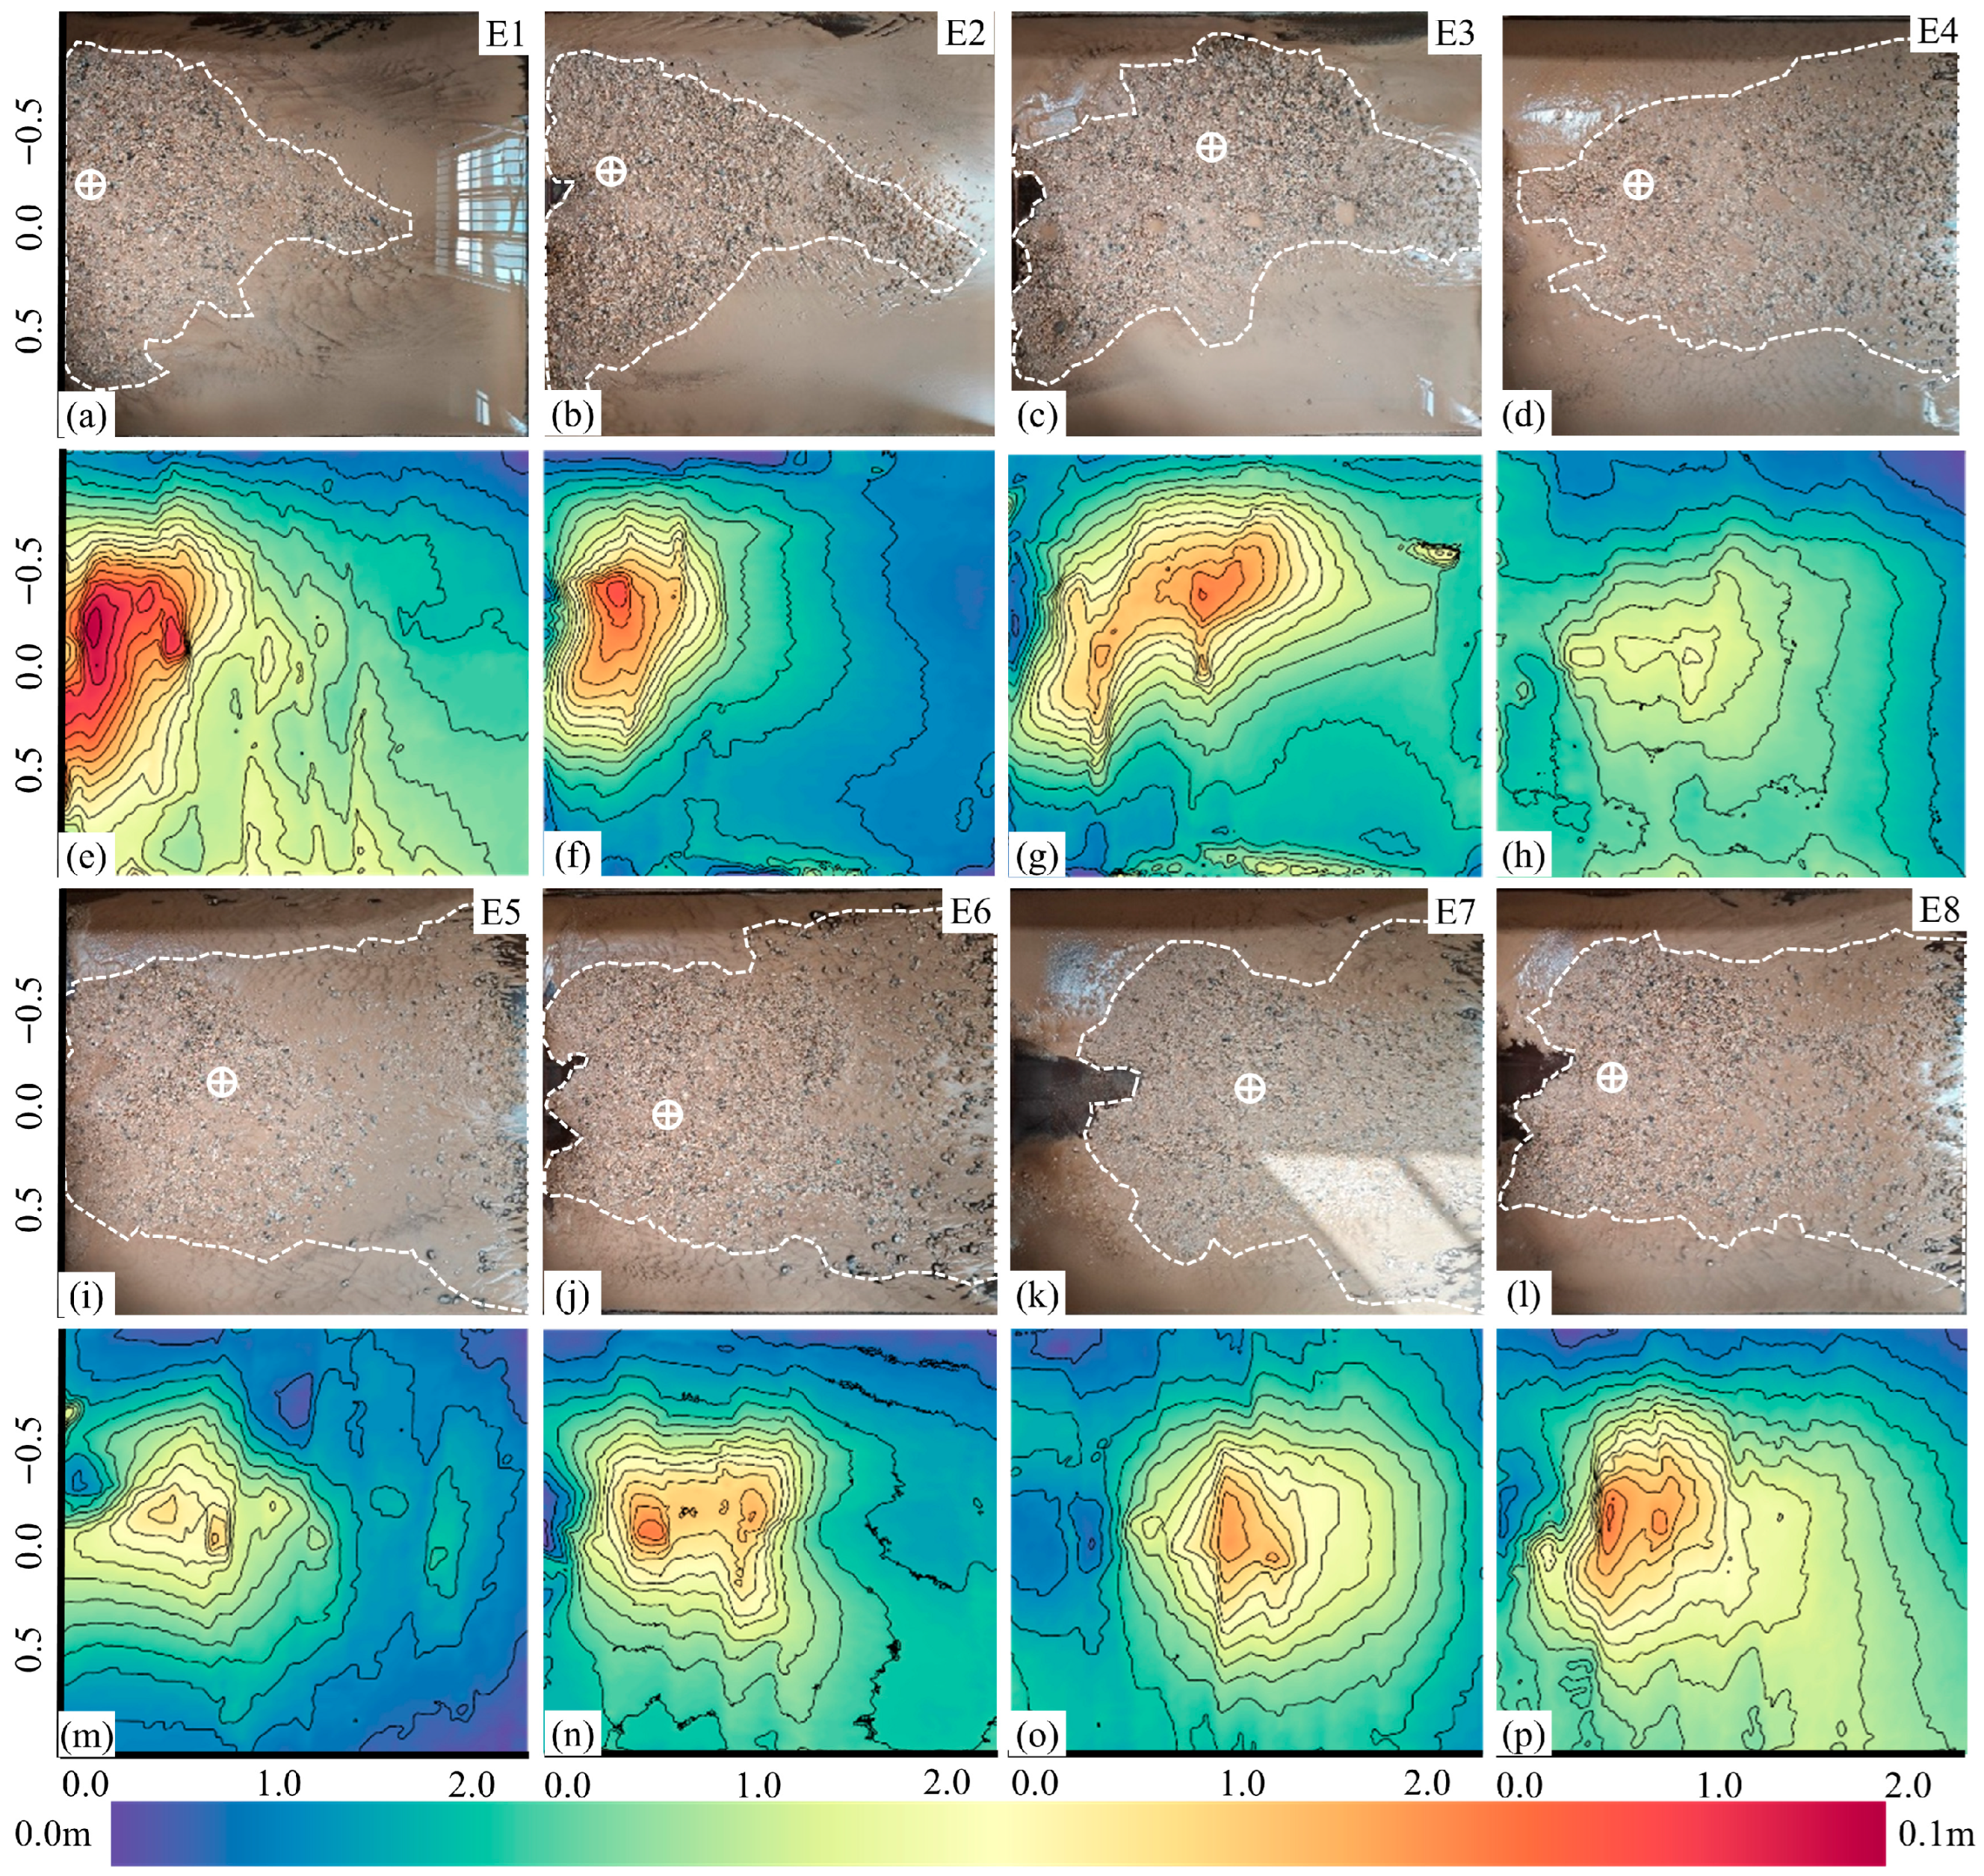
The runout distance and deposition area of a debris flow are key indicators for evaluating its destructive effect [62]. The dam-breach debris flows with stronger dynamics and carrying larger volumes of materials significantly alter downstream deposition characteristics. Due to the size limitations of the deposition platform, some debris flow materials under dam conditions flowed beyond the deposition platform. Therefore, for this study, the debris flow runout distance (L) is defined as the sum of L1 (the distance from the flume outlet to the apex of the deposition fan) and L2 (the distance the flow traveled beyond the deposition platform, measured with a meter stick). The deposition area (S) is defined as the sum of S1 (the area covered by sediment within the designated platform, marked by a white dashed line) and S2 (the area of the over-run portion, estimated as the product of L2 and the width of the deposition front). The thickest region of the deposition fan is defined as the deposition center (marked by circles with plus signs) [63]. The maximum thickness is denoted as H, and the ratio of the runout distance L to the maximum thickness H is defined as the debris flow mobility (L/H). For the no-dam control case, since the debris flow materials were fully contained within the stacking platform, the runout distance, deposition area, and mobility could still be represented by L1, S1 and L1/H.
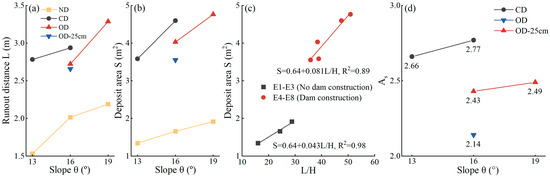
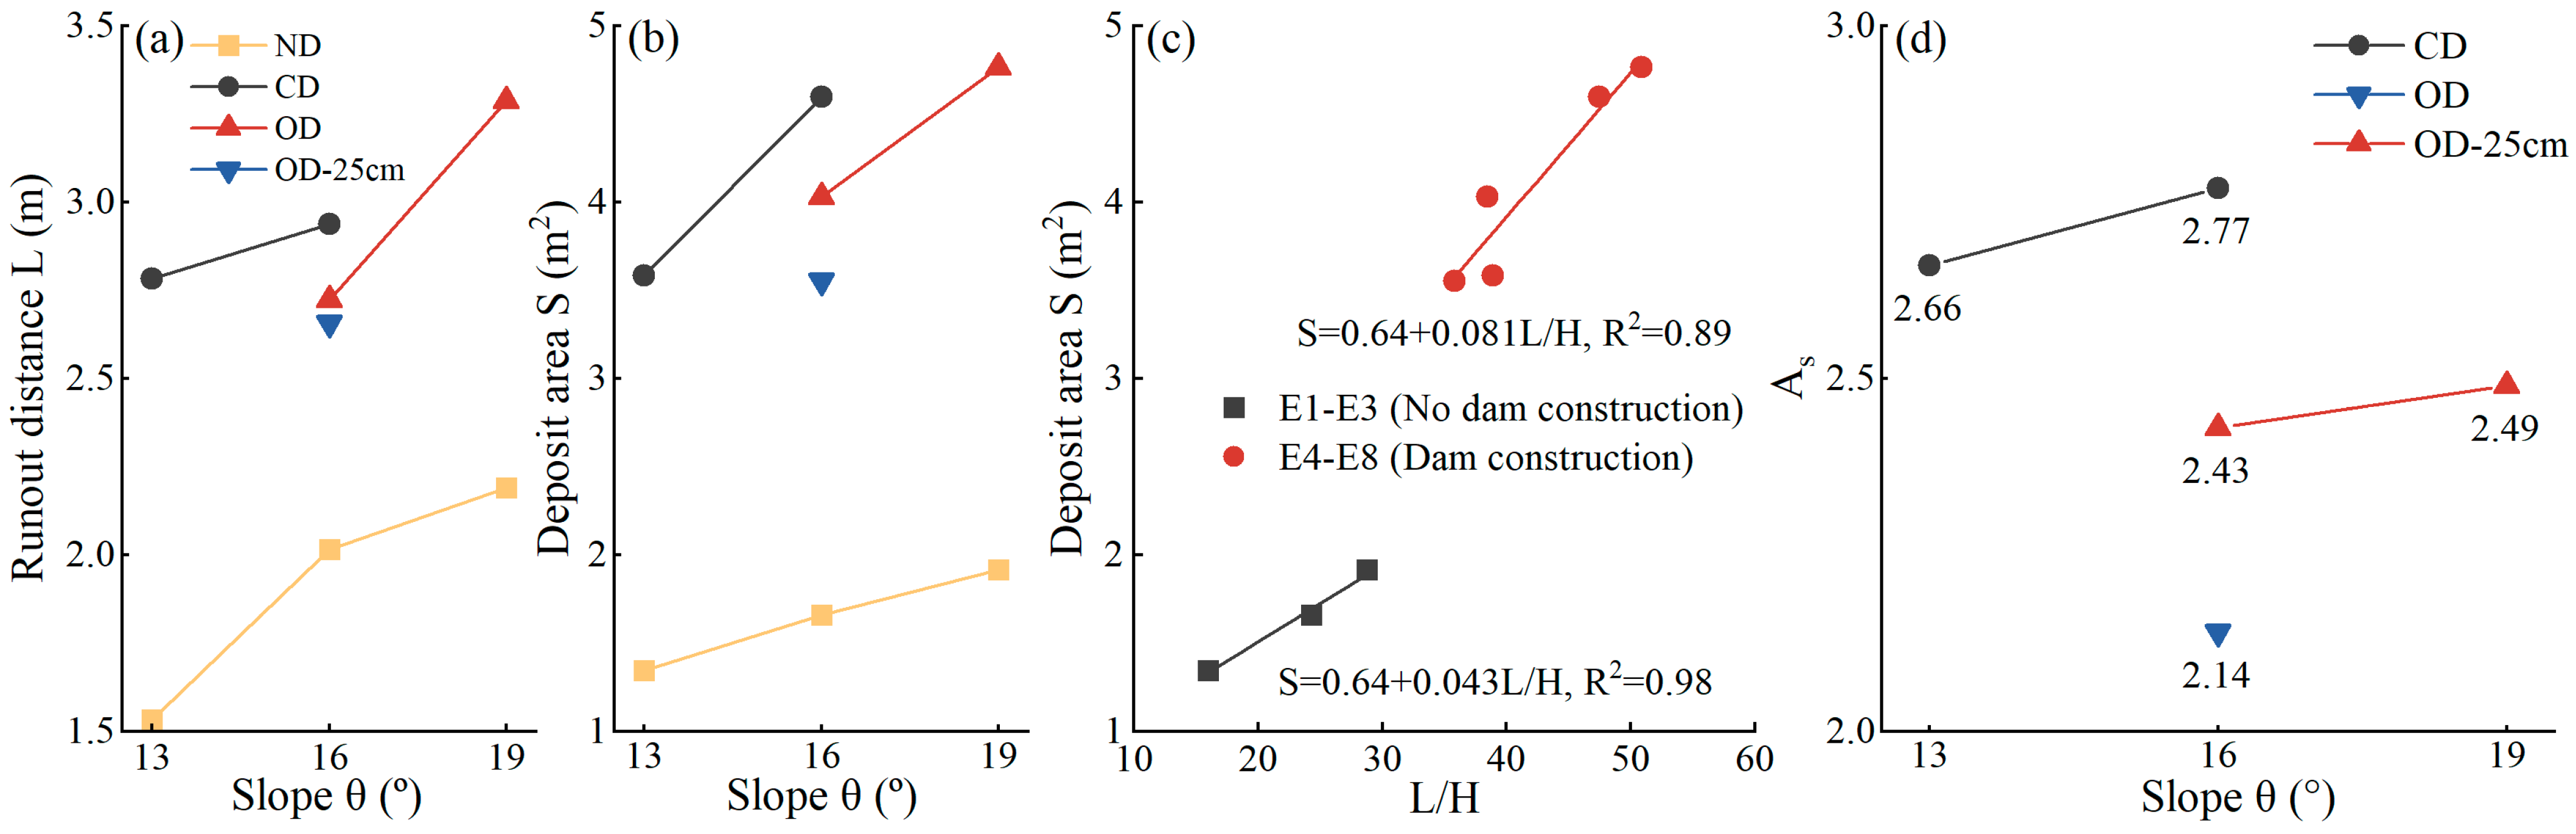
Figure 10 illustrates the downstream deposition patterns under various flume slopes after the breaching of different check dam types. The results reveal significant differences in deposition characteristics between the dam and no-dam scenarios. In the no-dam scenarios (Figure 10a–c,e–g), the debris flow had relatively low energy, forming a thick, concentrated, fan-shaped deposit near the flume outlet. The maximum deposition thickness reached 9.6 cm, and the deposition center was located closer to the outlet. In contrast, under dam scenarios (Figure 10d,h,i–l,m–p), the dam-breach debris flows possessed greater kinetic energy and higher mobility. This caused the deposit to be more widespread and thinner, with a morphology more akin to a trapezoid. Its maximum deposition thickness was relatively smaller (approximately 6.5 cm), and the deposition center was significantly displaced downstream. As the slope increased, the initial kinetic energy of the debris flow increased, enhancing its mobility and resulting in greater runout distances and deposition areas. Under the same slope conditions, the runout distance and deposition area under dam cases were significantly larger than in the no-dam cases (Figure 11a,b). Additionally, the debris flow deposition area showed significant linear correlation with the dimensionless mobility coefficient under both conditions (Figure 11c), but the slope for the dam cases (0.081) was nearly twice that of the no-dam cases (0.043), indicating that dam failure not only provided debris flows with higher mobility but also significantly improved the efficiency of “converting mobility into disaster range.” To further quantify the deposition amplification, a deposition area amplification factor, As, was defined:
where Sno-dam and Sdam are the debris flow deposition areas under no-dam and dam conditions for the same experimental settings, respectively, (m2). Based on this calculation, the As for dam-breach debris flows ranged from 2.14 to 2.77 under the different dam types and slope conditions (Figure 11d). At the same slope, the As for the closed dam was significantly greater than that for the open dam, and the As for the higher dam was significantly greater than that for the lower dam. This is primarily attributed to the larger initial release of energy and material, which results in greater flow mobility and transport capacity.
Figure 10.
Debris flow deposit morphology. (a–d,i–l) Photographs of deposition areas from experiments E1–E8. (e–h,m–p) DEM of deposition areas from experiments E1–E8.
Figure 11.
(a,b) Variation in debris flow runout distance and deposition area with slope for different check dam scenarios. (c) Relationship between deposition area and the mobility coefficient. (d) Deposition amplification factor for the different experimental scenarios.
Notably, at the same 16° slope, the runout distance and deposition area for the open dam case were both smaller than those for the closed dam. This is because during the initial material mobilization and deposition behind the dam stage, the open dam allowed some materials and water flow to pass through the drainage system into the downstream deposition area in advance, forming a “paving” effect. This increased the basal roughness for subsequent debris flow movement, thereby increasing transport resistance and limiting the overall transport of the debris flow to some extent [63].
5. Discussion
5.1. Mechanism of Debris Flow Scale Amplification by Check Dam Failure
The process and internal mechanism of debris flow amplification by check dam failure involve complex water–soil–structure interactions. By employing a range of flume slopes and check dam types, this study reproduced the complete evolutionary process of a dam-breach debris flow. Here, we interpret the amplification mechanism through two key processes: (1) the release of reserved material and energy during the initiation phase and (2) erosional entrainment during the transport phase.
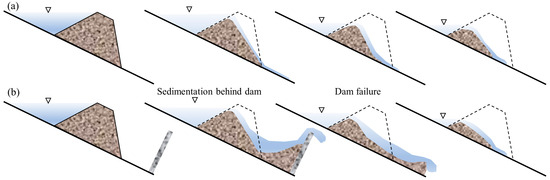
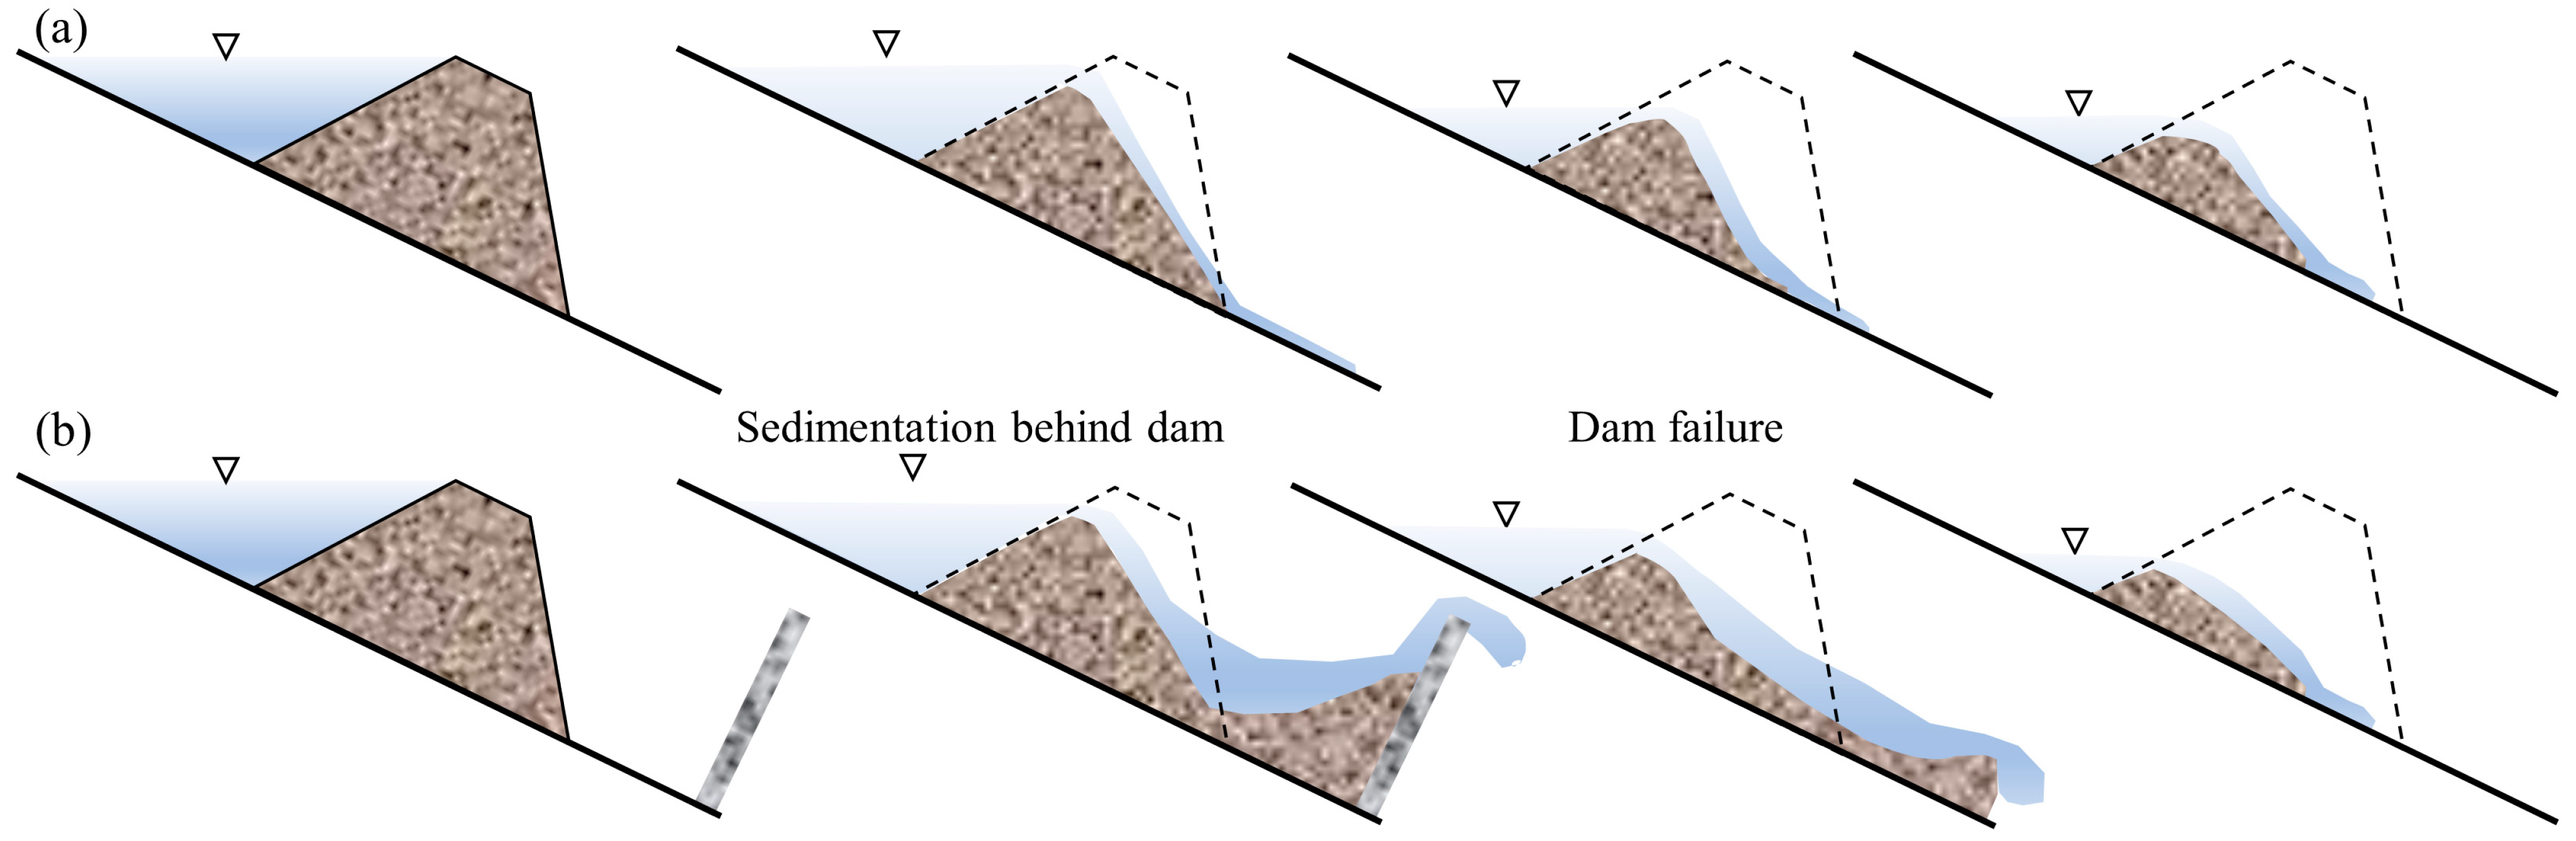
First, the gradual accumulation and subsequent abrupt release of material and potential energy provide the powerful initial kinetic energy that forms the primary basis for the amplification. In contrast to the progressive, retrogressive erosion of the no-dam scenario (Figure 12a), a check dam concentrates a vast amount of gravitational potential energy and a large volume of solid material behind it by impounding the flow and intercepting sediment. Upon failure, the constrained sediment and energy are released on a massive scale and nearly instantaneously (Figure 12b), and are rapidly and efficiently converted into the macroscopic kinetic energy of the debris flow. This is consistent with the viewpoint proposed by Cui et al. [23], who analyzed the Zhouqu debris flow and concluded that “dam failure is a process of potential energy conversion to kinetic energy”. Furthermore, during the impoundment process, pore water pressure within the sediments behind the dam increases dramatically, reaching a peak value of 1.48 kPa (approximately 2.2 times the 0.68 kPa observed in the no-dam case) (Figure 7d,h,l). The generation of this excess pore water pressure significantly reduces the effective stress and shear strength of the sediments, thereby increasing debris flow velocity and momentum [61].
Figure 12.
Schematic diagram of deposit evolution. (a) No-dam scenario. (b) With-dam scenario. The blue shade indicates the reservoir water, the triangle symbol represents the water level, and the black dashed lines show the original morphology of the deposit.
Second, erosional entrainment during the transport process acts as a “secondary amplifier” of the dam-breach debris flow magnitude. The failure of a check dam serves as a “trigger” that induces more intense channel bed erosion, with the peak instantaneous erosion rate reaching 25.42 mm/s (significantly higher than the 16.42 mm/s recorded under the no-dam condition) [33], a view confirmed by the findings in Section 4.3 of this study. Natural debris flow channels commonly develop abundant loose sediment [64], providing the material foundation for magnitude amplification during the channel evolution of the debris flow. In fact, the channel evolution process of a debris flow can be viewed as a material and energy exchange process. The debris flow transfers its own kinetic energy to the bed material through collisions, shear, and other physical interactions. This energy overcomes the basal resistance and inertia of the bed material, mobilizing it from a static to a kinetic state. According to the law of conservation of energy, a portion of the dissipated kinetic energy of the flow is converted into the potential and kinetic energy of the entrained material, thus promoting the overall movement of the debris flow [65]. Evidently, the high initial kinetic energy imparted by the dam breach endows the flow with a greater work capacity, enabling it to mobilize and entrain more sediment along its path and thereby further amplifying its magnitude during downstream transport [55].
5.2. Controlling Factors of Debris Flow Scale Amplification by Check Dam Failure
The experimental results show that the check dam type is one of the key factors governing the amplification of dam-breach debris flow magnitude. The peak discharge of a debris flow is commonly used as a critical parameter for assessing event scale, and the volume of material released at the instant of a dam breach directly influences this peak discharge. To quantitatively analyze the differences in material release among the various dam types, this study estimated the solid material supply during the dam breach based on the post-breach discharge hydrograph and debris flow bulk density. The calculation formula is as follows:
where M is the material supply during dam breach, (kg), ρs is the solid particle density, taken as 2650 kg/m3, Q(t) is the debris flow discharge process, t is the time point of breaching initiation, Δt is the breaching duration, taken as 1s, and C is the debris flow solid volumetric concentration, calculated as C = (ρ − ρw)/(ρs − ρw), where ρw is the liquid phase density in debris flow, taken as 1000 kg/m3.
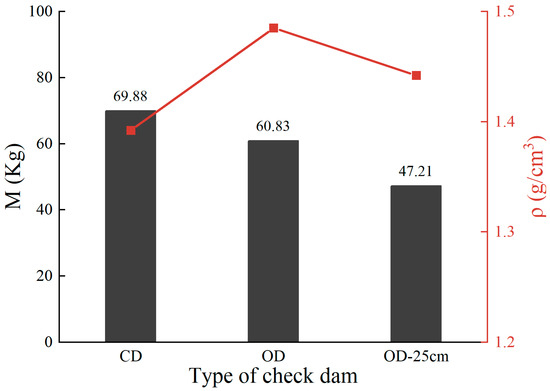
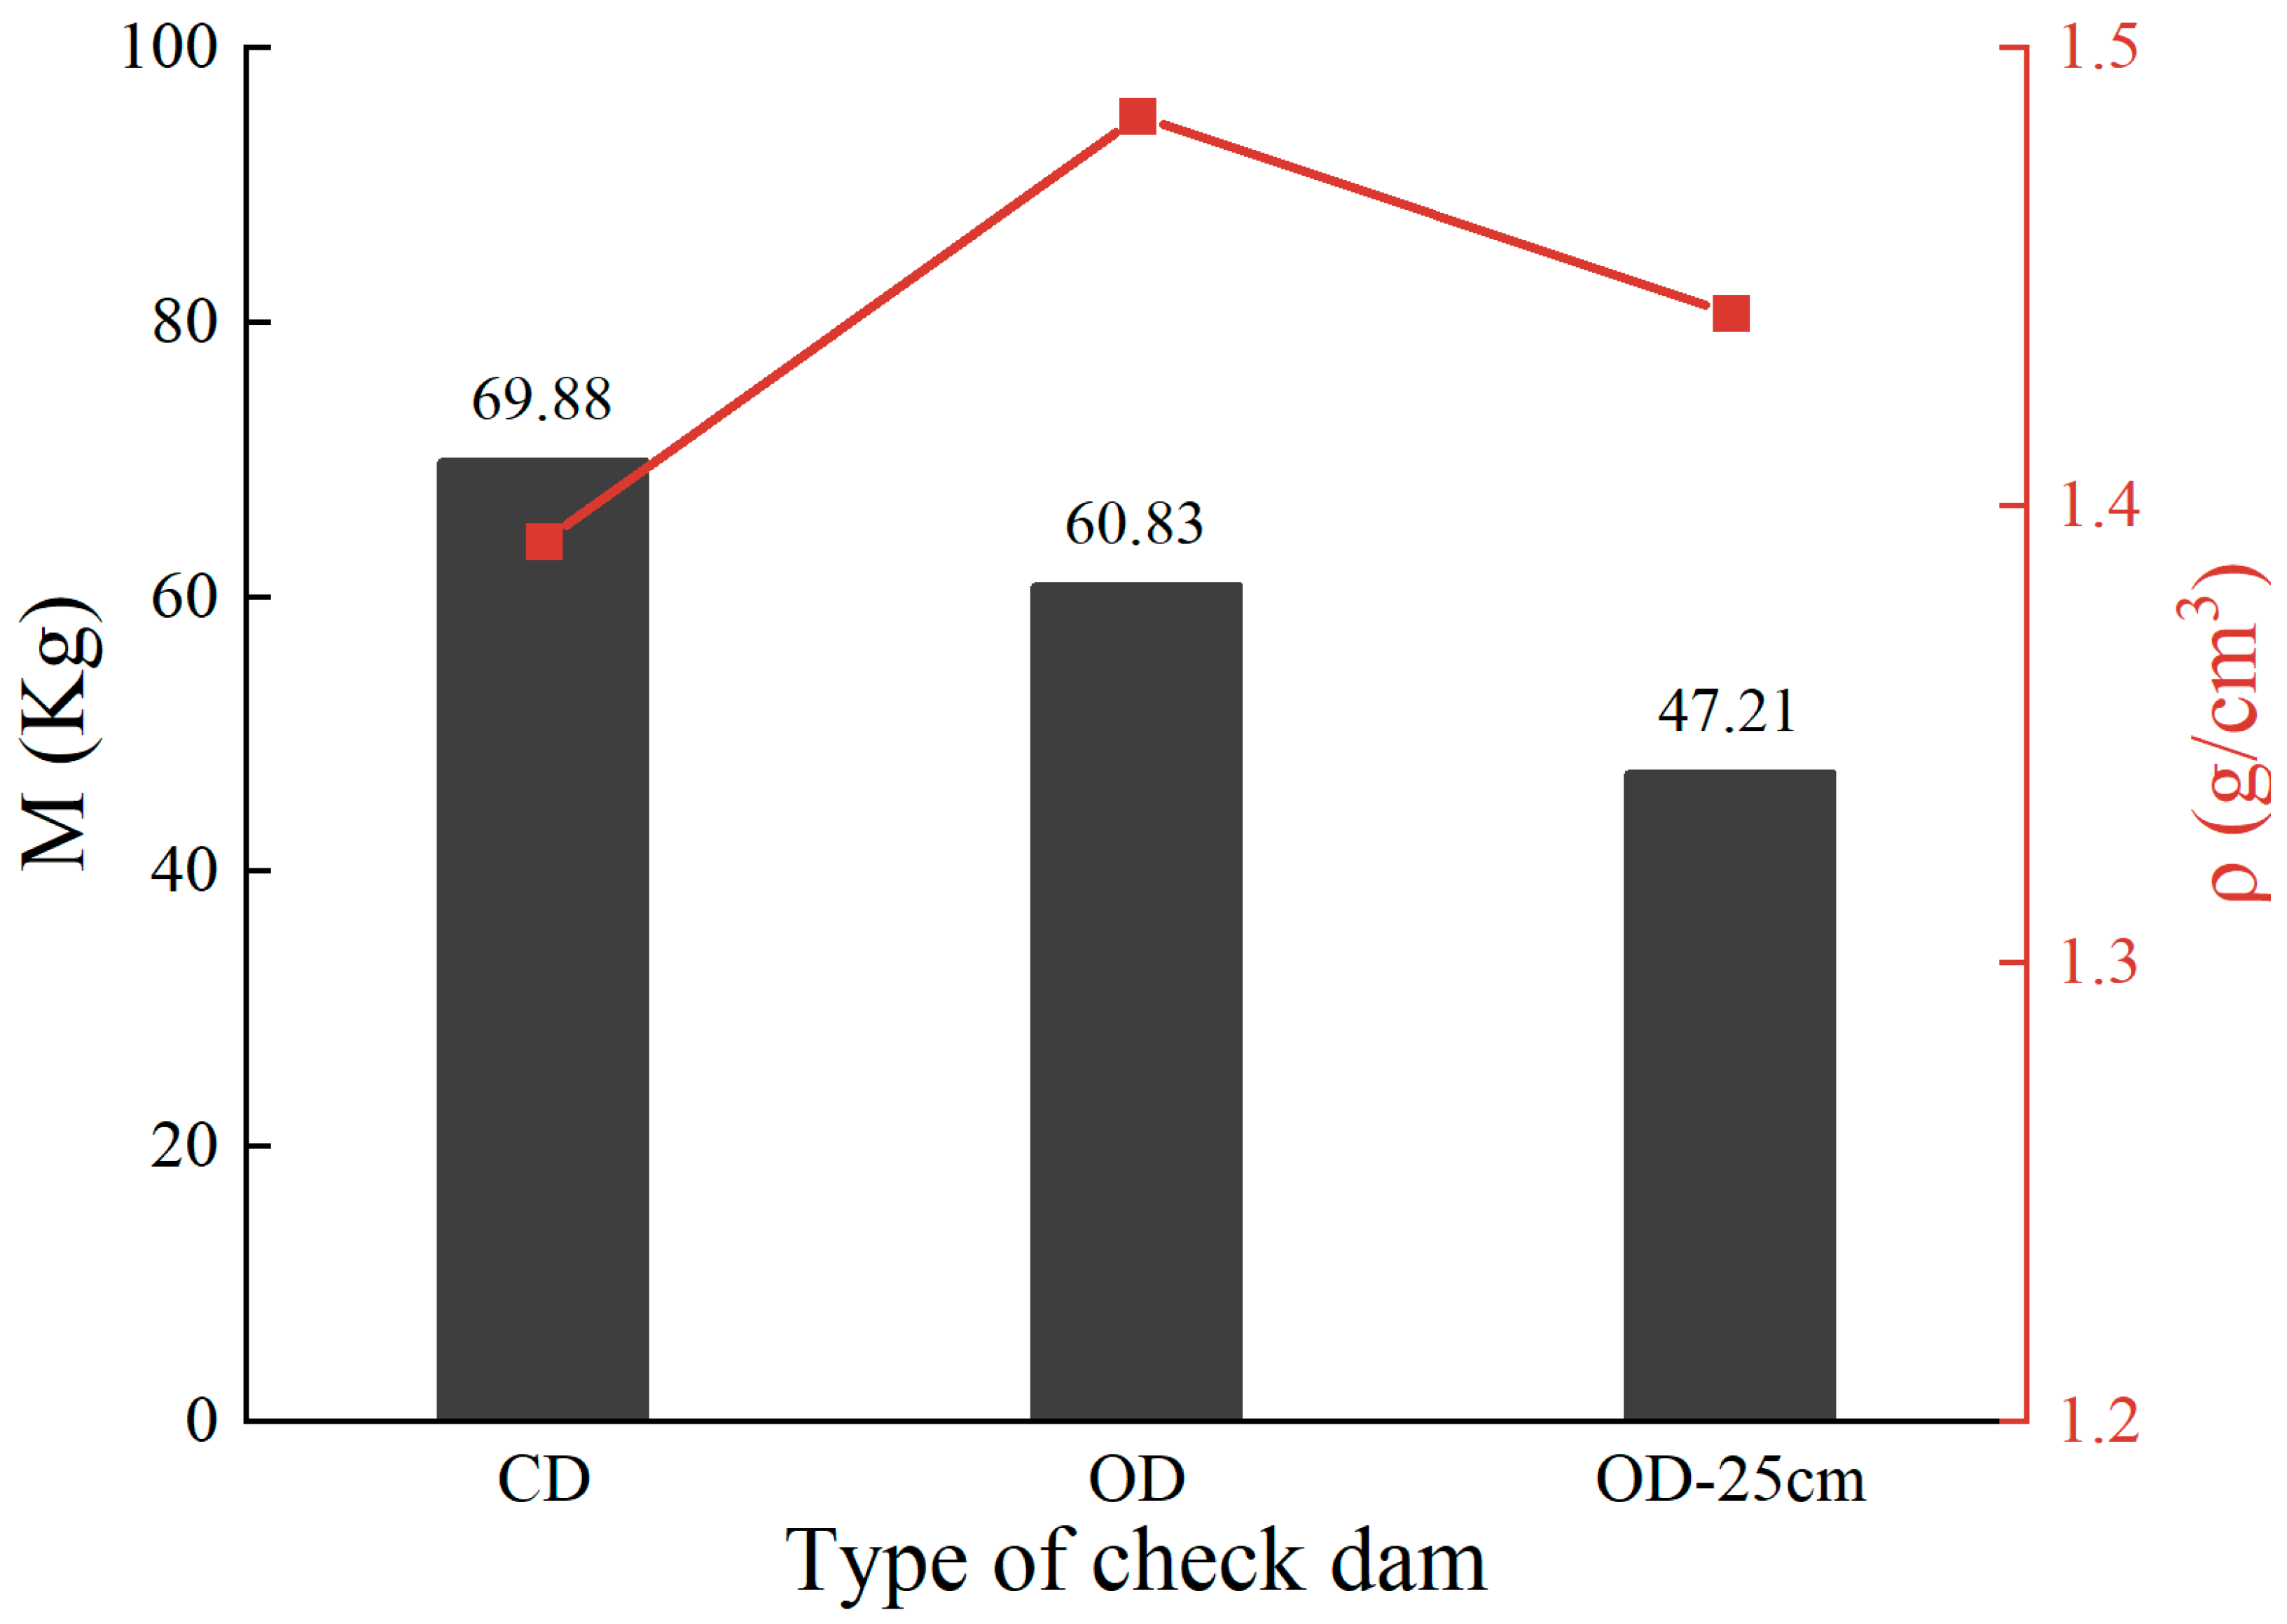
As shown in Figure 13, under a 16° flume slope, the mass supplied by the dam failure ranged from 47.21 kg to 69.88 kg, corresponding to 31.6–46.7% of the total source material. Due to its complete blockage effect, the closed dam was able to accumulate the maximum amount of material and potential energy, resulting in the largest instantaneous mass release (69.88 kg). The open dam yielded the next largest release (60.83 kg), as it had already discharged some material through its drainage system before the breach, thereby reducing the intensity of the instantaneous release. A greater dam height implies a larger storage capacity, which directly governs the trapping efficiency of the check dam [66]. Consequently, the lower dam produced the smallest mass release (47.21 kg). Simultaneously, during the material initiation and deposition behind the dam stage, the peak pore water pressure behind the closed dam was markedly higher than that behind the open dam. This higher pore pressure reduced inter-particle contact and decreased basal friction, making the sediment behind the dam more easily transformed into a debris flow [57,67]. This is another important reason for the greater material supply during a closed dam breach. Furthermore, the breach timing and the post-breach stability of residual materials differ between the two dam types. The open dam exhibited a faster normal stress decay time (6.5 s) compared to the closed dam (10.5 s) post-breach. This temporal difference indicates that the “retaining the coarse and sluicing the fine” function of open dams leaves a less stable, coarse-dominated residual matrix that is more rapidly mobilized upon failure [31,32]. A noteworthy observation is that while the closed dam breach released the largest solid mass, the bulk density of the debris flow at peak discharge was significantly lower than that of the open dam case (Figure 10). This is likely because the closed dam breach entrained a larger volume of the overlying ponded water, leading to a higher water content in the flow. According to rheological principles, a lower bulk density implies lower yield stress and viscosity [68,69]. This would lead to an increase in flow velocity [43], resulting in greater mobility, a larger deposition area, and a longer runout distance, which is consistent with the deposition characteristics observed in Section 4.4.
Figure 13.
Instantaneous material supply and debris flow bulk density during failure of different check dam types.
Channel slope also plays a critical role in debris flow amplification. In experiments E4–E7, peak velocity and discharge increased sharply with steeper slopes. Physically, a debris flow is a gravity-driven mixture of water and sediment [70]. Channel slope governs its dynamic characteristics. A steeper slope provides greater driving force, which enhances the conversion efficiency of sediment potential energy into kinetic energy, resulting in faster and larger debris flows [8,71]. Conversely, gentler slopes increase the stability of deposits behind the dam, somewhat hindering the release of potential energy. Notably, although the discharge amplification factor increases with slope (Figure 8c), this trend is less pronounced than in some field cases [16] or other experimental studies [28]. This discrepancy may arise from two factors. First, debris flow dynamics are highly sensitive to channel angle on gentle slopes but are primarily dominated by sediment bulk density on steep slopes (>15°) [43]. The relatively steep and narrow range of slopes tested here may have masked the full response of the amplification effect. Second, unlike real-world dam failures, our physical model represents idealized, simplified conditions. It may not fully capture the secondary downstream amplification caused by sustained erosional entrainment, which inevitably introduces scale effects.
5.3. Implications for Debris Flow Hazard Mitigation
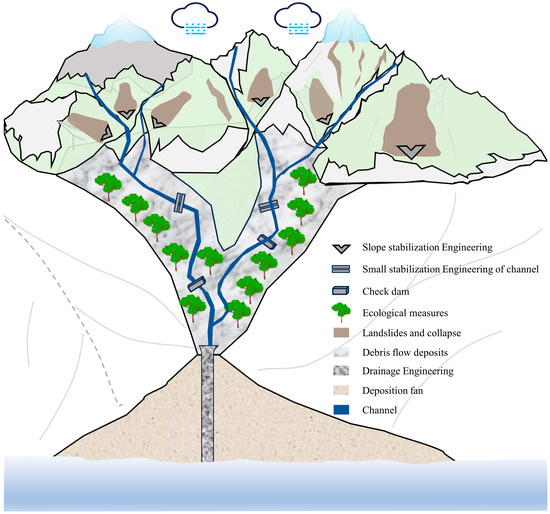
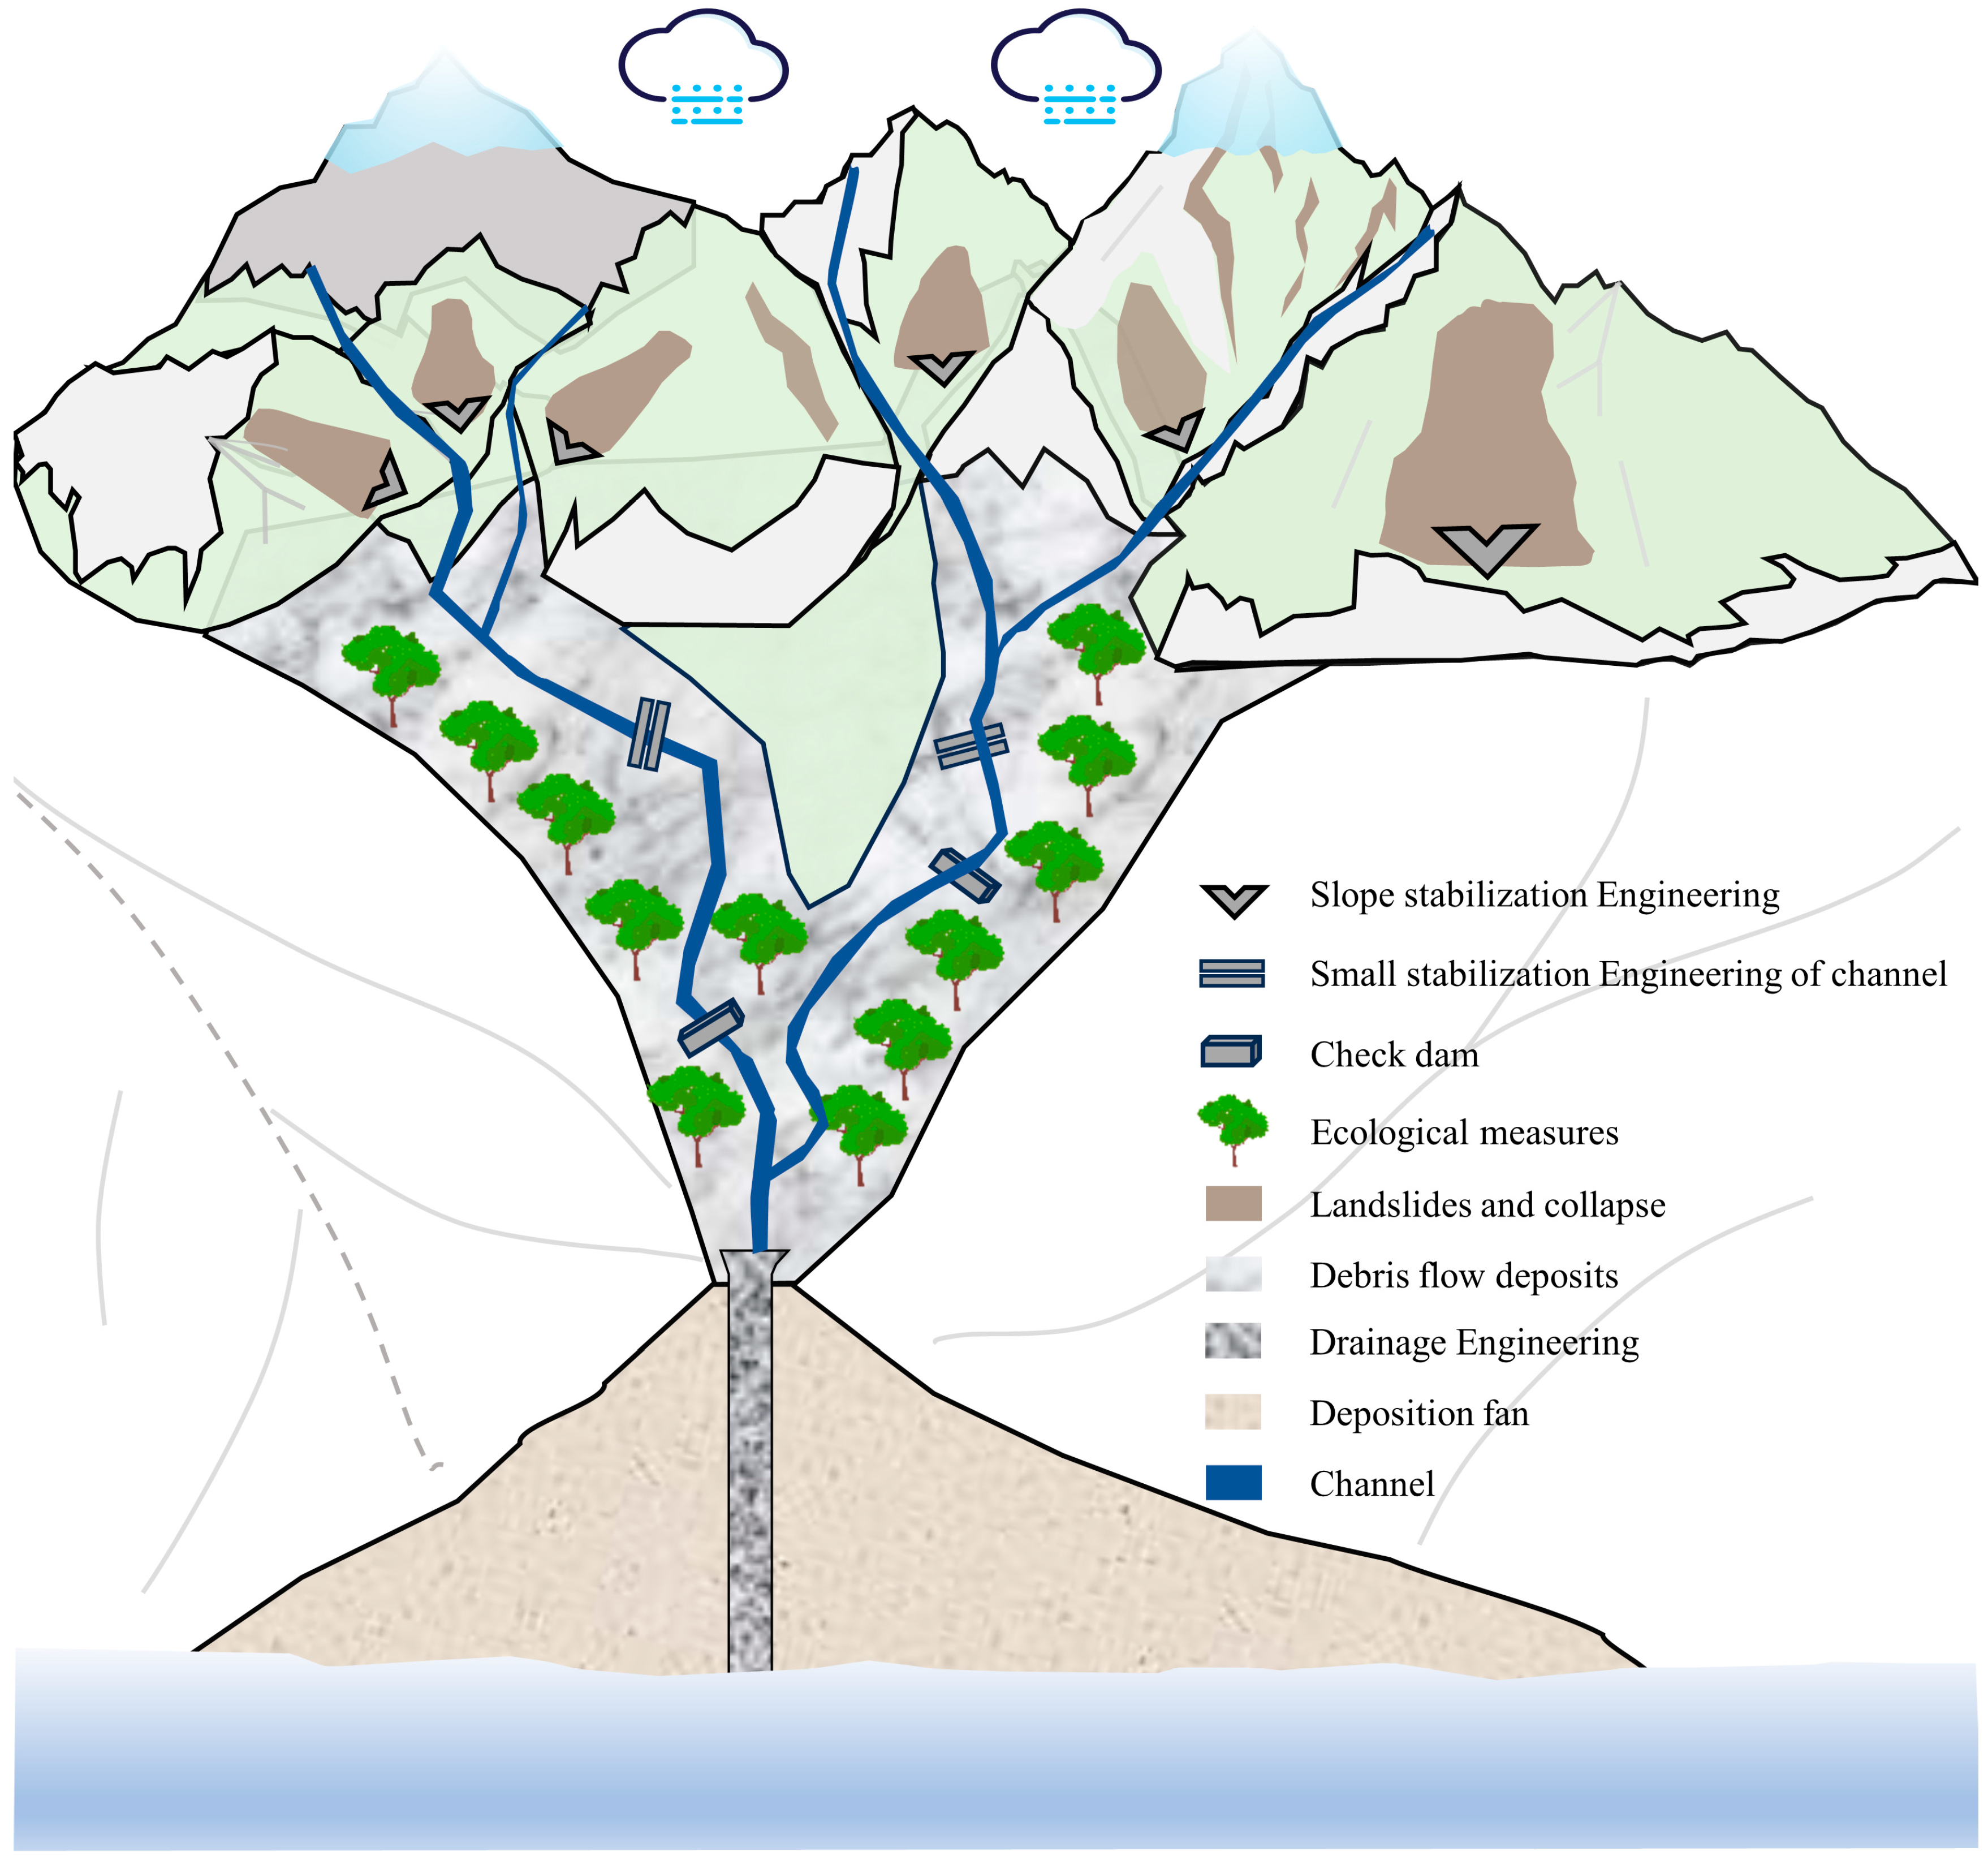
Based on the results of field investigations and flume experiments, it is clear that the effectiveness of debris flow check dams is time-limited. In regions with abundant loose sediment and high debris flow frequency, the check dams often become fully silted and lose their primary function shortly after construction. Once dam failure occurs, the scale of the debris flow will be catastrophically amplified [17,21]. According to the insights of this study, the management of debris flow channels in high-relief mountainous areas with abundant loose material sources should follow an integrated prevention and control concept of “source reduction and transport process control” (Figure 14). First, for the steep upstream sections of gullies where direct sources like collapses and landslides develop, the construction of large-scale check dams should be avoided or limited. Instead, slope engineering measures such as retaining walls, anchor bolt support, and slope cutting for load reduction should be implemented to enhance slope stability, fundamentally reducing the possibility of loose solid material entering the channels. For the more gently sloping middle and lower reaches, efforts should focus on vegetation restoration combined with small-scale, flexible engineering works like net barriers and gabion baskets. These measures help stabilize loose deposits on the channel bed and banks, thereby suppressing the amplification and propagation of debris flows during transport [6]. Second, in necessary cases, check dams can be deployed in channel bends to utilize natural topography for energy dissipation [72], and priority should be given to an “open-structure, low-height” design. The optimal opening ratio should be calculated and adopted based on the grain-size distribution of the source material, achieving a balance between the “retaining the coarse and sluicing the fine” function and structural safety [41]. Furthermore, the field investigations and the work of [47] both confirm that check dams are subjected to the greatest loads when their reservoirs are full, making them highly susceptible to destruction. Therefore, regular and scientifically planned sediment removal is essential. This not only extends the service life of the dam but also proactively reduces the total volume of potentially mobilizable material and the stored potential energy behind the dam, thereby controlling the amplification effect [73]. Finally, the potential failure risk of existing check dams (especially those with severe siltation or safety hazards) and their associated amplification effects must be integrated into the assessment framework for debris flow hazard zoning and the design of all mitigation projects. Ignoring this “engineering-induced” amplification risk could lead to a severe underestimation of design standards, leaving behind significant safety hazards.
Figure 14.
Schematic diagram of integrated mitigation measures for a debris flow gully.
5.4. Limitations and Future Work
While this study provides quantitative insights into the amplification mechanisms of check dam failures, several limitations must be explicitly acknowledged. First, to maximize the capture of the amplification effect produced by an instantaneous collapse, the structural failure of the rigid dam was simplified by manual removal at the instant of overtopping. This approach, while isolating the sudden release mechanism, cannot fully represent the complex fluid-solid interactions of a natural progressive breach. Second, the experimental parameters were constrained to a relatively narrow slope range (13–19°), a fixed volume of specific source material, and a single flume width, which collectively limit the generalizability of the observed amplification factors. Finally, the inherent scale effects of physical flume modeling limit the direct transferability of these absolute quantitative values to real-world, full-scale failures.
Future research should address these constraints to broaden the applicability of the findings. Subsequent studies need to incorporate progressive breach tests to simulate different structural failure modes accurately. Investigating the effects under different reservoir-fill states (e.g., partially silted conditions) and employing materials with broader grain-size distributions are also necessary to better reflect field variations. Ultimately, combining these advanced physical experiments with coupled physical-numerical models is essential for comprehensive validation and upscaling the results to catchment-level risk assessments.
6. Conclusions
This study conducted a series of flume experiments, complemented by field investigations of check dam operational status in the mountainous regions of southern Gansu, to quantitatively assess the amplification effects of dam failure on debris flow dynamics, erosion processes, and deposition extent, while also elucidating the key controlling factors and underlying physical mechanisms. The main conclusions are as follows:
- (1)
- Check dam failure is a prevalent and predictable risk. A survey of 139 check dams in southern Gansu revealed that approximately 60% had sustained damage and 58% were filled to capacity, having lost their sediment storage function. The damage rate reached 74% after reservoir silting, significantly exceeding the 39% rate for non-silted conditions.
- (2)
- Dam failure significantly amplifies the scale of a debris flow. Compared to the no-dam case, the check dam failure amplified the peak discharge by a factor of 1.65–3.04, the erosion rate by a factor of 1.44–1.55, and the deposition area by a factor of 2.14–2.77.
- (3)
- The scale amplification of debris flows is a two-stage process of “initial mobilization and downstream enhancement”. The gradual accumulation and subsequent large-scale, rapid release of material and potential energy behind the dam provide a powerful initial kinetic energy, constituting the first stage of amplification. Subsequently, the high-energy debris flow entrains a large amount of channel bed material during transport due to its enhanced erosional capacity, further increasing the volume and destructive potential of the debris flow, forming the second stage of amplification.
- (4)
- The degree of amplification is primarily governed by the intrinsic properties of the check dam and is modulated by channel geomorphic conditions. The closed dams and high dams generate greater instantaneous material supply after failure, exhibiting the most significant amplification effects. The flume slope provides positive feedback to the amplification effect by enhancing the gravitational drive and energy conversion efficiency of the debris flow.
- (5)
- The mitigation efficacy of check dams is time-limited and can transform into a source of risk. The construction of large-scale check dams in high-risk areas with abundant source material should be approached with caution. The management should shift toward integrated prevention and control strategies of “source reduction and transport process control”. This involves slope engineering to control material sources, ecological restoration to stabilize channel beds, and the prioritization of optimally designed open-type dam systems combined with dynamic dredging to mitigate debris flow hazards. Crucially, the potential failure of existing dams and the associated amplification effects warrant explicit consideration in disaster mitigation planning, as neglecting this factor may lead to underestimation of hazard magnitude.
Author Contributions
Conceptualization, Y.W. (Yu Wang) and X.L.; Methodology, Y.W. (Yu Wang), Y.W. (Yukun Wang), Y.M., J.H., Y.Y. and X.L.; Validation, Y.W. (Yukun Wang); Investigation, Y.W. (Yu Wang), Y.W. (Yukun Wang), Y.M., Z.X. and B.L.; Data curation, Y.W. (Yukun Wang) and Y.M.; Writing—original draft, Y.W. (Yukun Wang); Writing—review & editing, Y.W. (Yu Wang), Y.Y. and X.L.; Visualization, Y.W. (Yukun Wang), Y.M., J.H., Y.Y., Z.X., X.L. and B.L.; Supervision, Y.W. (Yu Wang), J.H., Z.X., X.L. and B.L.; Funding acquisition, X.L. All authors have read and agreed to the published version of the manuscript.
Funding
This study was financially supported by the National Natural Science Foundation of China (42567023), the Key Research and Development Program of Gansu Province (25YFFA090), the Major Project of Gansu Academy of Sciences (2024ZDZX-02), and the Major Science and Technology Project of Gansu Province (23ZDFA009-02).
Institutional Review Board Statement
Not applicable.
Informed Consent Statement
Not applicable.
Data Availability Statement
The data that support the findings of this study are available from the corresponding author upon reasonable request.
Conflicts of Interest
The authors declare no conflicts of interest.
References
- Chen, X.; Cui, Y. The Formation of the Wulipo Landslide and the Resulting Debris Flow in Dujiangyan City, China. J. Mountain Sci. 2017, 14, 1100–1112. [Google Scholar] [CrossRef] [Scilit]
- Schaefer, L.N.; Santi, P.M.; Duron, T.C. Debris Flow Behavior during the September 2013 Rainstorm Event in the Colorado Front Range, USA. Landslides 2021, 18, 1585–1595. [Google Scholar] [CrossRef] [Scilit]
- Jia, X.; Lv, J.; Luo, Y. Simulation and Management Impact Evaluation of Debris Flow in Dashiling Gully Based on FLO-2D Modeling. Appl. Sci. 2024, 14, 4216. [Google Scholar] [CrossRef] [Scilit]
- Luo, H.; Zhang, L.; He, J.; Zhou, J. Performance of Debris Flow Barriers: An Energy Perspective. Acta Geotech. 2025, 20, 987–1000. [Google Scholar] [CrossRef] [Scilit]
- Piton, G.; Recking, A. Effects of Check Dams on Bed-Load Transport and Steep-Slope Stream Morphodynamics. Geomorphology 2017, 291, 94–105. [Google Scholar] [CrossRef] [Scilit]
- Shen, W.; Wang, D.; Qu, H.; Li, T. The Effect of Check Dams on the Dynamic and Bed Entrainment Processes of Debris Flows. Landslides 2019, 16, 2201–2217. [Google Scholar] [CrossRef] [Scilit]
- Shen, W.; Li, T.; Li, P.; Lei, Y. Numerical Assessment for the Efficiencies of Check Dams in Debris Flow Gullies: A Case Study. Comput. Geotech. 2020, 122, 103541. [Google Scholar] [CrossRef] [Scilit]
- Chen, J.; Zhang, W.; Cao, C.; Yin, H.; Wang, J.; Li, W.; Zheng, Y. The Effect of the Check Dam on the Sediment Transport and Control in Debris Flow Events. Eng. Geol. 2024, 329, 107397. [Google Scholar] [CrossRef] [Scilit]
- Hu, T.; Huang, R. A Catastrophic Debris Flow in the Wenchuan Earthquake Area, July 2013: Characteristics, Formation, and Risk Reduction. J. Mountain Sci. 2017, 14, 15–30. [Google Scholar] [CrossRef] [Scilit]
- Zheng, H.; Ding, M.; Huang, T.; Gao, Z. Benefit Evaluation of Geotechnical Projects for Debris Flow Prevention and Control Based on Projection Pursuit in Wenchuan County, SW China. J. Earth Sci. 2025, 36, 700–716. [Google Scholar] [CrossRef] [Scilit]
- Liu, X.; Zhou, Z.; Dong, Y.; Wu, W.; Wei, W. Investigation of the Failure Patterns of Debris Flow Retaining Dams and Optimized Engineering Countermeasures—A Case Study at Wudu District of Longnan City, Gansu, China. Mt. Res. 2020, 38, 473–482. (In Chinese) [Google Scholar] [CrossRef]
- Mazzorana, B.; Trenkwalder-Platzer, H.J.; Fuchs, S.; Hübl, J. The Susceptibility of Consolidation Check Dams as a Key Factor for Maintenance Planning. Österr Wasser Und Abfallw 2014, 66, 214–216. [Google Scholar] [CrossRef] [Scilit]
- Sodnik, J.; Martinčič, M.; Mikoš, M.; Kryžanowski, A. Are Torrent Check-Dams Potential Debris-Flow Sources? In Proceedings of the Engineering Geology for Society and Territory; Springer International Publishing: Cham, Switzerland, 2015; Volume 2, pp. 485–488. [Google Scholar]
- Hübl, J.; Nagl, G.; Suda, J.; Uchida, T. Check Dam Failures. In Advances in Debris-Flow Science and Practice; Springer: Cham, Switzerland, 2024; pp. 565–588. [Google Scholar]
- Ramirez, J.A.; Mertin, M.; Peleg, N.; Horton, P.; Skinner, C.; Zimmermann, M.; Keiler, M. Modelling the Long-Term Geomorphic Response to Check Dam Failures in an Alpine Channel with CAESAR-Lisflood. Int. J. Sediment Res. 2022, 37, 687–700. [Google Scholar] [CrossRef] [Scilit]
- Cui, P.; Zhou, G.G.D.; Zhu, X.H.; Zhang, J.Q. Scale Amplification of Natural Debris Flows Caused by Cascading Landslide Dam Failures. Geomorphology 2013, 182, 173–189. [Google Scholar] [CrossRef] [Scilit]
- Tang, C.; Rengers, N.; van Asch, T.W.J.; Yang, Y.H.; Wang, G.F. Triggering Conditions and Depositional Characteristics of a Disastrous Debris Flow Event in Zhouqu City, Gansu Province, Northwestern China. Nat. Hazards Earth Syst. Sci. 2011, 11, 2903–2912. [Google Scholar] [CrossRef] [Scilit]
- Motagh, M.; Akhani, H. The Cascading Failure of Check Dam Systems During the 28 July 2022 Emamzadeh Davood Flood in Iran. Nat. Hazards 2023, 116, 4051–4057. [Google Scholar] [CrossRef] [Scilit]
- Dallan, E.; Marchi, L.; Rosatti, G.; Zugliani, D.; Cavalli, M.; Crema, S.; Valentinotti, R.; Borga, M. What Can Be Learnt from the Catastrophic Failure of a Check Dam System? A Forensic Analysis of a Cascading Natural-Anthropogenic Hazard. Nat. Hazards 2025, 121, 12909–12931. [Google Scholar] [CrossRef] [Scilit]
- Piton, G.; Carladous, S.; Recking, A.; Tacnet, J.M.; Liébault, F.; Kuss, D.; Quefféléan, Y.; Marco, O. Why Do We Build Check Dams in Alpine Streams? An Historical Perspective from the French Experience. Earth Surf. Process. Landf. 2017, 42, 91–108. [Google Scholar] [CrossRef] [Scilit]
- Xiong, M.; Meng, X.; Wang, S.; Guo, P.; Li, Y.; Chen, G.; Qing, F.; Cui, Z.; Zhao, Y. Effectiveness of Debris Flow Mitigation Strategies in Mountainous Regions. Prog. Phys. Geogr. Earth Environ. 2016, 40, 768–793. [Google Scholar] [CrossRef] [Scilit]
- Lucas-Borja, M.E.; Piton, G.; Yu, Y.; Castillo, C.; Antonio Zema, D. Check Dams Worldwide: Objectives, Functions, Effectiveness and Undesired Effects. Catena 2021, 204, 105390. [Google Scholar] [CrossRef] [Scilit]
- Cui, P.; Lei, Y.; Hu, K.; Zhou, G.G.D.; Zhu, X.; Chen, H. Amplification Mechanism and Hazard Analysis for Zhouqu Giant Debris Flow. Int. J. Eros. Control Eng. 2016, 9, 71–79. [Google Scholar] [CrossRef] [Scilit]
- Zhou, G.G.D.; Cui, P.; Chen, H.Y.; Zhu, X.H.; Tang, J.B.; Sun, Q.C. Experimental Study on Cascading Landslide Dam Failures by Upstream Flows. Landslides 2013, 10, 633–643. [Google Scholar] [CrossRef] [Scilit]
- Chen, S.-C.; Lin, T.-W.; Chen, C.-Y. Modeling of Natural Dam Failure Modes and Downstream Riverbed Morphological Changes with Different Dam Materials in a Flume Test. Eng. Geol. 2015, 188, 148–158. [Google Scholar] [CrossRef] [Scilit]
- Jiang, X.; Wei, Y.; Wu, L.; Lei, Y. Experimental Investigation of Failure Modes and Breaching Characteristics of Natural Dams. Geomat. Nat. Hazards Risk 2018, 9, 33–48. [Google Scholar] [CrossRef] [Scilit]
- Jiang, X.; Wei, Y. Natural Dam Breaching Due to Overtopping: Effects of Initial Soil Moisture. Bull. Eng. Geol. Env. 2019, 78, 4821–4831. [Google Scholar] [CrossRef] [Scilit]
- Hu, W.; Li, Y.; Fan, Y.; Xiong, M.; Luo, H.; McSaveney, M.; Zheng, Y.; Tang, M. Flow Amplification from Cascading Landslide Dam Failures: Insights from Flume Experiments. Eng. Geol. 2022, 297, 106483. [Google Scholar] [CrossRef] [Scilit]
- Zhou, G.G.D.; Cui, P.; Zhu, X.; Tang, J.; Chen, H.; Sun, Q. A Preliminary Study of the Failure Mechanisms of Cascading Landslide Dams. Int. J. Sediment Res. 2015, 30, 223–234. [Google Scholar] [CrossRef] [Scilit]
- Zheng, H.; Shi, Z.; Peng, M.; Guan, S.; Hanley, K.J.; Feng, S. Amplification Effect of Cascading Breach Discharge of Landslide Dams. Landslides 2022, 19, 573–587. [Google Scholar] [CrossRef] [Scilit]
- Sun, H.; You, Y.; Liu, J. Experimental Study on Characteristics of Trapping and Regulating Sediment with an Open-Type Check Dam in Debris Flow Hazard Mitigation. J. Mt. Sci. 2018, 15, 2001–2012. [Google Scholar] [CrossRef] [Scilit]
- Sun, H.; You, Y.; Liu, J.; Zhang, G.; Feng, T.; Wang, D. Experimental Study on Discharge Process Regulation to Debris Flow with Open-Type Check Dams. Landslides 2021, 18, 967–978. [Google Scholar] [CrossRef] [Scilit]
- Baggio, T.; D’Agostino, V. Simulating the Effect of Check Dam Collapse in a Debris-Flow Channel. Sci. Total Environ. 2022, 816, 151660. [Google Scholar] [CrossRef] [Scilit]
- Chong, Y.; Chen, G.; Meng, X.; Yang, Y.; Shi, W.; Bian, S.; Zhang, Y.; Yue, D. Quantitative Analysis of Artificial Dam Failure Effects on Debris Flows—A Case Study of the Zhouqu ‘8.8′ Debris Flow in Northwestern China. Sci. Total Environ. 2021, 792, 148439. [Google Scholar] [CrossRef] [Scilit] [PubMed]
- Mohammadizadeh, S.; Moghaddam, M.A.; Talebbeydokhti, N. Analysis of Flow in Porous Media Using Combined Pressurized-Free Surface Network. J. Porous Media 2021, 24, 1–15. [Google Scholar] [CrossRef] [Scilit]
- Su, Q.; Liang, M.; Yuan, D.; Xie, H.; Wu, Z. Geomorphic Features of the Bailongjiang River Drainage Basin and Its Relationship with Geological Disaster. Earth Sci. 2016, 41, 1758–1770. (In Chinese) [Google Scholar]
- Cui, K.; Fan, W.; Xiang, L.; Shen, N.; Liang, M.; Li, X.; Luo, L. Study on the Basic Characteristics and Particle Gradation Fractal Dimension of New Debris Flow Deposits in Wudu Section of Bailong River Basin. J. Disaster Prev. Mitig. Eng. 2022, 42, 674–682. (In Chinese) [Google Scholar] [CrossRef]
- Xiong, J.; Tang, C.; Gong, L.; Chen, M.; Li, N.; Shi, Q.; Zhang, X.; Chang, M.; Li, M. How Landslide Sediments Are Transferred out of an Alpine Basin: Evidence from the Epicentre of the Wenchuan Earthquake. Catena 2022, 208, 105781. [Google Scholar] [CrossRef] [Scilit]
- Hu, X.; Bi, Y.; Wei, J. Conditions Leading to the Destructive Debris Flow at the Sanyanyu Gulley and Its Occurrence Trend. Chin. J. Geol. Hazard Control 2011, 22, 55–60. [Google Scholar] [CrossRef]
- Li, R.; Wang, G.; Zhao, C.; Hu, X.; Zhu, L.; Zeng, Q. Analysis of Material Sources Derived from Sanyanyu Debris Flow in Zhouqu County. Northwestern Geol. 2011, 44, 21–29. [Google Scholar]
- Huang, J.; Liu, X.; Zhang, Z.; Zhang, J.; Ma, Y.; Li, Q.; Wang, Y.; An, Y. Experimental Investigation into Effects of Material and Energy Regulation of Debris Flow by Using Check Dams with Different Porosities. Front. Earth Sci. 2024, 12, 1499995. [Google Scholar] [CrossRef] [Scilit]
- Zhou, B. Guidelines for Debris Flows Control; Science Press: Beijing, China, 1991. (In Chinese) [Google Scholar]
- Qiu, E.; Luo, X.; Xu, D.; Wang, F.; Bai, H.; Liu, J.; Xiong, X.; Peng, Z. Dynamic Response Characteristics of Bridges under the Impact of Debris Flows in Mountainous Areas. Phys. Fluids 2025, 37, 27172. [Google Scholar] [CrossRef] [Scilit]
- Yang, Y.; Chen, G.; Meng, X.; Chong, Y.; Shi, W.; Bian, S.; Jin, J.; Yue, D. Characteristics of the Impact Pressure of an Outburst Debris Flow: Insights from Experimental Flume Tests. Eng. Geol. 2024, 330, 107428. [Google Scholar] [CrossRef] [Scilit]
- Pandey, N.K.; Satyam, N. Entrainment-Driven Morphological Changes in Debris Flow Deposits by Varying Water Content at Laboratory Scale. Bull. Eng. Geol. Environ. 2025, 84, 215. [Google Scholar] [CrossRef] [Scilit]
- Tsai, T.-C.; Peng, C.-C. Ground Segmentation Based Point Cloud Feature Extraction for 3D LiDAR SLAM Enhancement. Measurement 2024, 236, 114890. [Google Scholar] [CrossRef] [Scilit]
- Wang, D.; Qu, H.; Shen, W.; He, S. Dynamic Response Analysis for Debris Flow Dam with Sediments. Adv. Eng. Sci. 2021, 53, 1–9. (In Chinese) [Google Scholar] [CrossRef]
- Wang, D.; Liao, C.; Qu, H.; Yan, S. Study on Dynamic Response of Debris Flow Impact on Check Dam with Sediments. Earth Sci. 2024, 49, 1017–1027. (In Chinese) [Google Scholar]
- Scheidl, C.; Chiari, M.; Kaitna, R.; Müllegger, M.; Krawtschuk, A.; Zimmermann, T.; Proske, D. Analysing Debris-Flow Impact Models, Based on a Small Scale Modelling Approach. Surv. Geophys. 2013, 34, 121–140. [Google Scholar] [CrossRef] [Scilit]
- Armanini, A.; Rossi, G.; Larcher, M. Dynamic Impact of a Water and Sediments Surge against a Rigid Wall. J. Hydraul. Res. 2020, 58, 314–325. [Google Scholar] [CrossRef] [Scilit]
- Ng, C.W.W.; Majeed, U.; Choi, C.E. Effects of Solid Fraction of Saturated Granular Flows on Overflow and Landing Mechanisms of Rigid Barriers. Geotechnique 2022, 74, 27–41. [Google Scholar] [CrossRef] [Scilit]
- Hübl, J.; Suda, J.; Proske, D.; Kaitna, R.; Scheidl, C. Debris Flow Impact Estimation; University od Ss Cyril and Methodius: Skopje, Macedonia, 2009; pp. 137–148. [Google Scholar]
- Choi, C.E.; Ng, C.W.W.; Au-Yeung, S.C.H.; Goodwin, S.R. Froude Characteristics of Both Dense Granular and Water Flows in Flume Modelling. Landslides 2015, 12, 1197–1206. [Google Scholar] [CrossRef] [Scilit]
- Ballesteros-Cánovas, J.A.; Stoffel, M.; de Haas, T.; Bodoque, J.M. Debris Flow Dating and Magnitude Reconstruction. In Advances in Debris-Flow Science and Practice; Jakob, M., McDougall, S., Santi, P., Eds.; Springer International Publishing: Cham, Switzerland, 2024; pp. 219–248. [Google Scholar]
- Iverson, R.M.; Ouyang, C. Entrainment of Bed Material by Earth-surface Mass Flows: Review and Reformulation of Depth-integrated Theory. Rev. Geophys. 2015, 53, 27–58. [Google Scholar] [CrossRef] [Scilit]
- Yan, Y.; Wang, R.; Xiong, G.; Feng, H.; Xiang, B.; Hu, S.; Wang, X.; Lei, Y. Lateral Shear Stress Calculation Model Based on Flow Velocity Field Distribution from Experimental Debris Flows. Int. J. Disaster Risk Sci. 2024, 15, 803–819. [Google Scholar] [CrossRef] [Scilit]
- Li, P.; Wang, J.; Hu, K.; Xie, J. Shedding Effects of Sediment Composition and Bed Morphology on Debris Flow Dynamics and Entrainment Mechanism: Insights from Laboratory Experiments. Eng. Geol. 2024, 333, 107495. [Google Scholar] [CrossRef] [Scilit]
- Partheniades, E. Erosion and Deposition of Cohesive Soils. J. Hydraul. Div. 1965, 91, 105–139. [Google Scholar] [CrossRef] [Scilit]
- Zhang, J.; Yang, X.; Fan, G.; Li, H.; Zhou, J. Experimental Study on Erosion Mechanisms in Landslide Dam Breaching: Effects of Particle Composition. Environ. Earth Sci. 2025, 84, 302. [Google Scholar] [CrossRef] [Scilit]
- Zheng, H.; Shi, Z.; Yu, S.; Fan, X.; Hanley, K.J.; Feng, S. Erosion Mechanisms of Debris Flow on the Sediment Bed. Water Resour. Res. 2021, 57, e2021WR030707. [Google Scholar] [CrossRef] [Scilit]
- Iverson, R.M.; Reid, M.E.; Logan, M.; LaHusen, R.G.; Godt, J.W.; Griswold, J.P. Positive Feedback and Momentum Growth during Debris-Flow Entrainment of Wet Bed Sediment. Nat. Geosci. 2010, 4, 116–121. [Google Scholar] [CrossRef] [Scilit]
- De Haas, T.; Braat, L.; Leuven, J.R.F.W.; Lokhorst, I.R.; Kleinhans, M.G. Effects of Debris Flow Composition on Runout, Depositional Mechanisms, and Deposit Morphology in Laboratory Experiments. J. Geophys. Res. Earth Surf. 2015, 120, 1949–1972. [Google Scholar] [CrossRef] [Scilit]
- Baselt, I.; De Oliveira, G.Q.; Fischer, J.-T.; Pudasaini, S.P. Deposition Morphology in Large-Scale Laboratory Stony Debris Flows. Geomorphology 2022, 396, 107992. [Google Scholar] [CrossRef] [Scilit]
- Hou, R.; Wu, M.; Li, Z.; Chen, N.; Chen, X.; Peng, T.; Huang, N. Big Disaster from Small Watershed: Insights into the Failure and Disaster-Causing Mechanism of a Debris Flow on 25 September 2021 in Tianquan, China. Int. J. Disaster Risk Sci. 2024, 15, 622–639. [Google Scholar] [CrossRef] [Scilit]
- Hu, X.; Jiang, Y.; Xia, X.; Zhu, Y. Erosion and Transport Mechanisms of Granular Flow: Insights from a Flume Experiment and Block Energy Model. Nat. Hazards 2025, 121, 2781–2799. [Google Scholar] [CrossRef] [Scilit]
- Guan, S.; Shi, Z.; Zheng, H.; Shen, D.; Hanley, K.J.; Yang, J.; Xia, C. Effects of Soil Properties and Geomorphic Parameters on the Breach Mechanisms of Landslide Dams and Prediction of Peak Discharge. Acta Geotech. 2023, 18, 5485–5502. [Google Scholar] [CrossRef] [Scilit]
- Iverson, R.M.; Logan, M.; LaHusen, R.G.; Berti, M. The Perfect Debris Flow? Aggregated Results from 28 Large-Scale Experiments. J. Geophys. Res. Earth Surf. 2010, 115, F03005. [Google Scholar] [CrossRef] [Scilit]
- Johnson, A.M. Physical Processes in Geology; Freeman, Cooper: San Francisco, CA, USA, 1970. [Google Scholar]
- Wu, C.; Wei, J.; Hou, X. Effect of Solid Volume Concentration on the Rheological Properties of Debris Flow: A Case Study of Jiangjiagou Debris Flow in China. Appl. Sci. 2024, 14, 1940. [Google Scholar] [CrossRef] [Scilit]
- Armanini, A. Closure Relations for Mobile Bed Debris Flows in a Wide Range of Slopes and Concentrations. Adv. Water Resour. 2015, 81, 75–83. [Google Scholar] [CrossRef] [Scilit]
- Yang, H.; Liu, J.; Sun, H.; Zhang, W.; Shang, Y.; Fu, H. The Blockage and Erosion Characteristics of Woody Debris Flow on an Erodible Gully Bed: Insight from a Small-Scale Model Experiment. Phys. Fluids 2024, 36, 126602. [Google Scholar] [CrossRef] [Scilit]
- Yang, Q.; Guan, M.; Peng, Y.; Chen, H. Numerical Investigation of Flash Flood Dynamics Due to Cascading Failures of Natural Landslide Dams. Eng. Geol. 2020, 276, 105765. [Google Scholar] [CrossRef] [Scilit]
- Zhang, Z.; Liu, X.; Huang, J.; Ma, Y.; Li, Q.; Wang, Y. Effects of Open-Type Check Dams on Sediment Trapping in Outburst Debris Flows with Varying Bed Slope in Longnan, China. Landslides 2025, 22, 3493–3507. [Google Scholar] [CrossRef] [Scilit]

Disclaimer/Publisher’s Note: The statements, opinions and data contained in all publications are solely those of the individual author(s) and contributor(s) and not of MDPI and/or the editor(s). MDPI and/or the editor(s) disclaim responsibility for any injury to people or property resulting from any ideas, methods, instructions or products referred to in the content. |
© 2026 by the authors. Licensee MDPI, Basel, Switzerland. This article is an open access article distributed under the terms and conditions of the Creative Commons Attribution (CC BY) license.