


Abstract
To compare hurdle-resisted sprint training (EGH), sled-resisted training (EGS), and hurdles-only training (CG) on performance and kinematics using a smallest-effect-size-of-interest (SESOI) framework, fifteen U18 female hurdlers (16.3 ± 1.3 years) were randomized to EGH, EGS, or CG (n = 5 each) for a 7-week intervention (7 microcycles). EGH used individualized resistance (10% velocity decrement), while EGS used fixed ~13% body-mass resistance. Outcomes included 30 m hurdle time (30 mH), Technique Index, and exploratory kinematics. Primary analysis used baseline-adjusted robust ANCOVA with permutation and linear mixed models (LMM) as sensitivity checks. A smallest-effect-size-of-interest (SESOI) of −0.066 s (~1.2%) was pre-specified. Adjusted ANCOVA favored EGH over CG (−0.19 s; 95% CI [−0.45, 0.06]; p = 0.11). The point estimate exceeded the SESOI, though the CI captured both meaningful and trivial effects. Sensitivity analyses maintained this directional pattern, but LMM estimates varied in magnitude, suggesting model dependence. The EGH–EGS contrast was smaller and uncertain (−0.15 s; p = 0.10). Exploratory baseline-adjusted kinematic contrasts showed no clear differences at the first hurdle, but highlighted nominal differences in the EGH group at the second hurdle (greater take-off distance, p = 0.030) and third hurdle (shorter flight and landing times, p < 0.05), which should be interpreted as hypothesis-generating. In this preliminary trial, the data are compatible with a range of effects from negligible to practically meaningful for hurdle-resisted sprint training relative to both control and sled-resisted conditions. All estimates are accompanied by wide compatibility intervals, precluding confirmatory conclusions. These findings establish protocol feasibility, provide estimation-based preliminary evidence with openly available individual-level data, and motivate adequately powered multi-center replication trials.
1. Introduction
High hurdles, namely the men’s 110 m and women’s 100 m outdoor events, are sprint disciplines in which athletes must clear ten hurdles while preserving near-maximal sprint velocity throughout the race. At the performance level, elite hurdling is characterized by (a) a high-velocity approach to the first hurdle [1,2], (b) minimal horizontal velocity loss during hurdle clearance [1,3], and (c) the rapid re-establishment of an efficient three-step rhythm between hurdles [2,3,4,5]. Accordingly, a practically important performance construct is the technical cost of hurdling relative to flat sprinting, often operationalized as a Technique Index (Tindex), defined as the time difference between hurdle and flat sprint performance over the same distance [6,7].
In the men’s 110 m hurdles, the event imposes additional sprint ‘constraints’ compared with flat sprinting because the short inter-hurdle distance limits the extent to which athletes can reach and sustain true maximal velocity between barriers; velocity is typically regulated through the hurdle units and can increase again on the run-in after the tenth hurdle. Moreover, men’s contemporary elite practice has increasingly shifted toward a seven-step approach to the first hurdle, reflecting an evolving acceleration solution specific to the men’s event [1,2,3,4,5]. While these features are informative for understanding sprint–hurdle constraints in general, the present study focuses on U18 female 100 m hurdles, where hurdle height and spacing differ and where the early hurdle units are still strongly determined by acceleration into H1 and the stabilization of a reproducible three-step rhythm.
Gender-specific hurdle constraints (hurdle height and spacing) shape technique and kinematics, meaning that findings from men cannot be mechanically transferred to women without considering these event constraints [1,3]. Importantly, for U18 hurdlers the technical model is further constrained by age-group hurdle specifications, because hurdle height increases across age groups and can alter key spatiotemporal demands around clearance and the early hurdle units [8]. In parallel, adolescent athletes are still influenced by growth and maturation processes that affect sprint mechanics and the expression of force and power, with meaningful inter-individual variability persisting through the mid-to-late teenage years [9].
During adolescence, sprint and jump performance trajectories diverge between genders, an effect attributed to pubertal sexual dimorphism and its consequences for muscle mass and power development [9,10,11]. In addition, girls’ earlier maturation and typically smaller gains in strength- and power-related capacities across mid-adolescence highlight the practical importance of early and well-targeted strength/power development and individualized load progressions [12]. From a hurdling-specific perspective, women’s sprint hurdling is performed under different mechanical constraints than men’s (hurdle height and spacing), and world-class comparisons indicate that the women’s event is generally less disruptive to horizontal velocity because of the lower hurdle height relative to stature [1,3,13]. For U18 female hurdlers, hurdle height is often further reduced at younger age groups (e.g., 0.762 m in U18 versus 0.838 m in senior women), which may shift the balance toward “more sprinting and less barrier-induced deceleration” and, consequently, may alter how resisted sprint methods transfer to hurdle performance. Collectively, these sex- and age-related constraints provide a rationale for evaluating training transfer specifically within U18 female hurdling.
In sprint hurdling, acceleration is especially important because it shapes the approach to the first hurdle and influences early-race velocity and rhythm. Evidence from sprint acceleration research indicates that performance is closely linked to the athlete’s ability to produce and orient high mechanical power and to express an effective horizontal force–velocity profile during the acceleration phase [14]. Moreover, start and initial acceleration characteristics are highly relevant in elite sprinters and high hurdlers, supporting the idea that acceleration capacity is a key physical determinant underpinning hurdle performance [15]. Consequently, minimizing the “technical gap” between flat sprint acceleration and hurdle acceleration is a primary training objective. Accordingly, coaches frequently employ sprint-specific methods that overload the acceleration phase, with training effects most meaningfully evaluated using short-distance outcomes that preserve event specificity (e.g., electronically timed 30 m sprint-hurdle performance).
Resisted sprinting, where external resistance is added while the athlete sprints horizontally, has been widely used for this purpose. Systematic reviews and meta-analyses generally support small-to-moderate improvements in short-distance acceleration following resisted sprint training compared with unresisted sprinting, although outcomes depend on programming variables and load prescription [16,17]. Among resisted sprint methods, sled towing/pulling is one of the most common in applied settings and research. A major practical issue is how to prescribe “equivalent” resistance across athletes. Historically, loads have often been prescribed as a percentage of body mass (%BM). From an applied perspective, a ~10% body-mass sled load is often used as a practical light-load starting point in coaching and research; however, the same %BM can elicit different velocity decrements across athletes as individual differences in strength, technique, training history and gender can produce large variability in the actual velocity reduction caused by the same %BM [18]. This limitation is likely amplified in U18 female hurdlers, where maturation status and training age can differ markedly even within the same chronological age, making %BM prescriptions especially inconsistent. For that reason, approaches based on velocity decrement have been proposed to individualize loading more precisely [19,20,21]. This point may be even more important when working with U18 athletes, where between-athlete variability in load–velocity relationships can be substantial [21]. In addition, specific sprint training applied via resisted sprinting was found to be more efficient than other training modalities for provoking advanced adaptations in young athletes [22]. Evidence indicates that resisted sprint training can meaningfully improve short-distance acceleration, although training effects depend on how resistance is prescribed and progressed [17,23].
Despite the growing evidence base for resisted sprint training in flat sprinting, transferring these methods to sprint hurdling is not straightforward. Specifically, sled towing cannot be practically implemented during sprint-hurdle drills that involve hurdle clearance and the early inter-hurdle rhythm, because the hurdles constrain the sled system. At the same time, field-based mechanical resistance devices can provide quantifiable horizontal resistance and acceptable reliability for resisted sprinting, offering a plausible hurdle-resisted alternative [24,25,26]. Despite the prevalence of intervention studies in sprint hurdlers, direct comparisons between hurdle-resisted sprinting and sled-resisted sprinting are limited, particularly when the prescription philosophies differ (performance-based velocity decrement vs. fixed % body mass), making it difficult to attribute any between-method differences to the device/modality rather than to the loading strategy itself. This scarcity is particularly pronounced in U18 female hurdlers, where age-group hurdle specifications and maturation-related variability may significantly influence training responses [8]. In applied environments, resisted-load prescription is often standardized pragmatically within each modality (e.g., via performance-based decrement targets or nominal relative loads), prioritizing feasible field implementation over perfectly matched external-force profiles across methods. Furthermore, access to this specific athletic population is often limited, necessitating study designs that move beyond simple null-hypothesis significance testing toward estimation-based approaches (effect sizes and uncertainty) suitable for smaller sample sizes, thereby prioritizing effect magnitudes and their uncertainty over dichotomous “significant/non-significant” conclusions [27,28]. Accordingly, the present study adopts an estimation-first framework and uses planned methodological triangulation to examine whether inferences are consistent across complementary, small-sample-appropriate analytical perspectives.
An additional applied consideration is the feasibility and reproducibility of intervention research in hurdling. Recruiting adequately sized groups of competitive hurdlers within a narrow age category is difficult, and this constraint is particularly evident in national-level samples. Consequently, the present study was designed as a field-based, coach-reproducible protocol using standard training frequency (three sessions per week), short-distance sprint/hurdle exposures, and readily implementable monitoring (electronic timing and 2D video). Nonetheless, wider replication will likely require multi-club or multi-center recruitment and harmonized load-prescription procedures (e.g., velocity-decrement targeting vs. % body mass) to ensure comparable functional intensity across settings.
Therefore, the purpose of this preliminary randomized pre–post trial was to estimate the effects of hurdle-resisted sprint training (EGH) compared with sled-resisted sprint training (EGS) and control sprint-hurdle training (CG) on sprint-hurdling performance. In alignment with the planned statistical framework, the primary outcome was post-intervention 30 m sprint-hurdle time (30 mH), with the primary estimand defined as the baseline-adjusted between-group difference at post-test. The a priori primary contrast was EGH vs. CG, with EGH vs. EGS specified as a pre-specified key secondary contrast and EGS vs. CG considered secondary. The secondary performance outcome was Tindex (30 mH − 30 mS), reflecting hurdle-specific technical cost; 30 mS was measured to compute Tindex and is reported descriptively [6,7]. Finally, exploratory analyses examined hurdle-clearance characteristics via a pre-specified set of spatiotemporal clearance variables across the early hurdle units (e.g., take-off and landing distances, hurdling distance, and support/flight timing measures over the first hurdles), treated as hypothesis-generating in line with the preliminary-report framework. Given the expected constraints of U18 hurdling recruitment, results were intended to provide estimation-based evidence (effect magnitudes and uncertainty) and to be interpreted relative to a pre-specified smallest-effect-size-of-interest (SESOI) rather than dichotomous “significant/non-significant” decisions [29,30]. The SESOI was defined a priori to anchor interpretation to practical relevance, and robustness was evaluated via the planned triangulation framework and complementary nonparametric summaries of individual changes consistent with the analysis plan.
2. Materials and Methods
2.1. Study Design
The exploratory study used a randomized, controlled, pre–post experimental design to examine the effects of resisted sprint training on sprint-hurdle acceleration performance and hurdle-running kinematics in trained young female hurdlers. The experimental timeline consisted of three phases: (1) an initial evaluation (pre-test), (2) a seven-week training intervention, and (3) a reassessment (post-test). Following baseline testing, participants were assigned to an identification code and randomly allocated in a 1:1:1 ratio to one of three groups: (a) sprint-hurdle training combined with mechanically applied horizontal resistance (EGH), (b) sprint training combined with weighted sled towing (EGS), or (c) a control group performing regular sprint and sprint-hurdle training without external resistance (CG). Group allocation was generated using a computer-based blocked randomization list (Sealed Envelope Ltd., London, UK) by an independent researcher not involved in testing or training supervision. Although allocation was randomized, assessors were not blinded to group assignment.
2.2. Participants
Fifteen (n = 15) healthy female track-and-field hurdlers (age: 16.3 ± 1.3 years; height: 167.9 ± 4.4 cm; body mass: 59.2 ± 6.1 kg; body mass index: 20.9 ± 1.6 kg·m−2) volunteered to participate. Athletes were of medium-to-high competitive level, regularly competing in national-level U18 championships, with 2–6 years of athletics experience and limited prior exposure to resisted sprinting (~1 year); none had previously completed a structured block of resisted sprint-hurdle training. Testing and the intervention were conducted during the pre-competition period.
Recruitment was based on feasibility from the available pool of eligible athletes at the national level (≈30 nationwide) during the pre-competition period; this constraint is common in applied research with competitive/elite athletes, where recruiting large samples is often impractical [27]. Athletes were eligible if they: (i) were female sprint hurdlers around the target age group, (ii) were currently training and competing, (iii) were free from injury at study entry, and (iv) could attend the planned training schedule. Participants were instructed to avoid additional training outside the prescribed program that could influence performance during the testing and intervention period. Adherence and protocol deviations were defined a priori. Adherence was defined as attendance at the supervised intervention sessions, recorded by the investigators. A participant was considered adherent if she completed ≥85% of the planned sessions (≥15 of 18 sessions). In the event that participants exhibited protocol deviations, such as completing less than 85% of sessions, undertaking additional high-intensity sprint or hurdle training outside the prescribed program during the intervention period, or sustaining an injury or illness that impeded the completion of training or post-testing, they were excluded from the final analyses.
The study was approved by the Ethics Committee of the School of Physical Education and Sports Science, National and Kapodistrian University of Athens (approval number: 1433/21-11-2022), and was conducted in accordance with the Declaration of Helsinki. Parental/guardian signed informed consent was collected for all participants.
2.3. Procedure and Instrumentation
Basic anthropometric measurements such as body height (cm), body mass (kg), and body mass index (kg·m−2) were collected [31]. Body height was measured to the nearest 0.01 m, and body mass was measured to the nearest 0.1 kg using a SECA 769 scale and a SECA 220 stadiometer (Seca GmbH & Co. KG, Hamburg, Germany) during a preliminary session. Body composition was estimated based on the sum of four skinfolds (biceps, triceps, subscapular, and supra-iliac) [32] using pre-calibrated callipers (Holtain Ltd., Crosswell, Crymych, Pembrokeshire, UK).
Both the initial assessment (pre-test) and reassessment (post-test) were conducted on the same synthetic indoor track (Recortan M99, APT Corp., Harmony, PA, USA) at approximately the same time of day to minimize diurnal variability [33] and environmental influences (e.g., ambient temperature). Participants wore the same spike shoes in all testing sessions. Post-testing was scheduled 48 h (two days) after the final training session of the intervention to allow recovery from maximal-intensity work [34]. During this 48 h period, training and life-style was kept as in a typical training microcycle. Maximum 30 mS and 30 mH trials were performed from a block start and timed electronically using photocell timing gates (Microgate Srl, Bolzano, Italy), with times recorded to the nearest 0.01 s. The 30 mH test consisted of a 30 m run with three hurdles (height: 0.762 m) in accordance with World Athletics’ rules Technical Rule 22 [35]. The first hurdle was placed 13 m from the start line, and the second and third hurdles were placed at 8.5 m intervals thereafter (i.e., at 21.5 m and 30.0 m from the start).
Either side of the track lane was marked with black and white markers placed at 1 m intervals lying parallel to the track lane long axis. Three high-definition digital video cameras (SONY HDR—SR10, Sony Corporation, Minato, Tokyo, Japan), operating at 100 frames∙s−1 (resolution 1920 × 1080 pixels), were positioned at 20 m from the runway with their optical axis perpendicular to the 1st, 2nd and 3rd hurdle respectively, and recorded the hurdle clearance stride for each hurdle. For spatial calibration, two pairs of iron calibration rods (length: 3.0 m; diameter: 0.025 m) were used to provide a two-dimensional (2D) scale reference for each stationary camera [36]. For each hurdle, the first rod was placed 3.5 m before the hurdle and the second rod 2.0 m after the hurdle, yielding a calibrated field of view of 5.5 m along the x-axis and 3.0 m along the y-axis. Hurdle clearance time (HCT; s) was determined by frame-by-frame analysis using the Kinovea version 2023.1.1 software (©Joan Charmant and contributors, France), with take-off defined as the last frame of ground contact before the hurdle and landing as the first frame of ground contact after clearance; HCT was computed as the number of frames between events divided by the sampling frequency. Tindex, an indicator of hurdle-specific technical cost, was calculated as the difference between hurdle and flat sprint performance over the same distance: Tindex = 30 mH − 30 mS [6,7].
The following hurdle technique parameters were quantified from the calibrated 2D video recordings. Temporal variables (take-off support time, flight time, landing support time) were quantified for the first, second, and third hurdles; spatial distance variables (take-off distance, landing distance, hurdling clearance distance) were quantified for the second hurdle. For each hurdle, event timing was identified frame-by-frame (toe-off before the hurdle; first ground contact after the hurdle; toe-off after landing), and temporal variables were computed as the number of frames between events divided by 100.
- Hurdling clearance distance (HCD; m): Horizontal distance covered from take-off (toe-off) before the hurdle to the first touchdown after the hurdle as
HCD = toe touchdown point after hurdle − toe-off point before hurdle.
- Take-off distance (TOD; m): Horizontal distance from the vertical plane of the hurdle to the athlete’s take-off point for clearance, measured at the last frame of ground contact of the take-off foot as
TOD = hurdle − toe-off point before hurdle.
- Landing distance (LD; m): Horizontal distance from the vertical plane of the hurdle to the first ground-contact point after clearance, measured at the first frame of landing contact as
LD = toe touchdown point after hurdle − hurdle.
- Take-off support time (TST; s): Duration of the final ground-contact phase before take-off, defined from the first frame of contact of the take-off foot to the last frame of contact (toe-off) immediately preceding clearance as
TST = Number of frames (contact start − toe-off)/100.
- Flight time (FT; s): Time spent airborne over the hurdle, defined from the last frame of ground contact at take-off (toe-off) to the first frame of ground contact at landing as
FT = Number of frames (toe-off instance − toe touchdown instance after hurdle)/100
- Landing support time (LST; s): Duration of the first ground-contact phase after landing from the hurdle, defined from the first frame of landing contact to the last frame of that contact (toe-off) as
LST = Number of frames (landing toe touchdown instance − landing toe-off instance)/100
Before each testing session (pre-test and post-test), participants completed the same standardized warm-up protocol for sprint hurdling, supervised by the researcher. The warm-up lasted ~45–50 min and consisted of: (1) 8–10 min of moderate-intensity running; (2) 15–20 min of dynamic mobility and stretching exercises; (3) ~10 min of sprint-specific running drills; and (4) ~10 min of hurdle-specific drills. The hurdle-specific component included kinematic drills mimicking sprint-hurdle actions and 2–3 progressive hurdle-clearance runs with increasing intensity.
2.4. Intervention Training Program
The intervention was implemented over 7 weeks and followed a 3:1 loading structure (three medium-intensity microcycles, one recovery microcycle, and three subsequent medium-intensity microcycles). Training was delivered across two consecutive mesocycles, with three supervised training sessions per microcycle. Sessions were scheduled with approximately 48 h between stimuli and lasted ~60 min (excluding warm-up) [18,37]. Total sprint volume per training session was approximately 300 m, consistent with applied sprint-training recommendations [37]. Rest intervals were standardized to maintain maximal sprint/hurdle execution quality (i.e., to minimize performance and technical deterioration) [37]. The warm-up protocol during the intervention was identical to that used for the pre- and post-testing sessions. All training was conducted in the same facility at similar afternoon times for all participants, and every session was supervised by the researchers. All athletes started off from a World Athletics-approved starting block.
2.4.1. Experimental Group—Hurdling Mechanical Resistance (EGH)
For the EGH group, resisted sprint-hurdle training was performed using a weighted, adjustable towing system (Exergenie®—Efficiency in exercise™, Exergenie DBA Team America Health & Fitness, Inc., Thousand Oaks, CA, USA), following a previously described approach to resisted sprinting [38]. Resistance prescription was guided by the principle that excessive slowing may alter sprint/hurdle technique; therefore, resistance was individualized using a performance-decrement criterion [20,39]. Specifically, for each athlete, the towing resistance was adjusted so that her 30 mH under resistance was approximately 10% slower than her own unresisted 30 mH [19].
To preserve the intended hurdle rhythm while running under resistance, hurdle spacing during the resisted 30 m sprint-hurdle runs in training was reduced by 10% for all EGH participants (start line to first hurdle: 11.70 m; inter-hurdle distance: 7.65 m). This spacing modification was applied uniformly and was not used as an additional loading criterion. The resulting individualized towing loads required to reach the ~10% performance decrement corresponded, on average, to approximately 13% of body mass [16,19]. Thus, %BM is reported descriptively rather than as an independent prescription rule. One week before the intervention, athletes were familiarized with the device by completing two maximal-effort resisted repetitions using the same hurdle setup. The device was attached to the athlete via a harness and elastic connector and tethered with a 60 m rope; resistance could be adjusted from 2 to 400 lb (~0.91 to ~181.4 kg) in 2-lb (~0.91 kg) increments.
The EGH group completed three sessions per microcycle across the seven-week intervention. Each session consisted of 5 × 30 m resisted sprint-hurdle runs at maximal intent (individualized resistance set to the ~10% performance decrement and 10% reduced hurdle spacing), with 4 min recovery between repetitions. After a 10 min recovery, athletes performed additional unresisted sprint-hurdle runs to emphasize transfer: 3 × 20 m (two hurdles) and 3 × 30 m (three hurdles) at maximal speed, with 4 min recovery between repetitions.
2.4.2. Experimental Group—Sprint Sled Towing (EGS)
Participants assigned to the EGS group completed three sessions per microcycle across the 7-week intervention during the pre-competition period, with sessions separated by ~48 h and performed at maximal intent. Each session comprised a 5 × 30 m maximal sled-resisted sprint training at maximal intent with 4 min passive recovery between repetitions. The external load was prescribed as ~13% of body mass, which falls within the range commonly reported for “moderate” resisted sled sprint training loads of ~13% of body mass, which is a commonly used nominal sled load in applied and research settings. Importantly, this %BM prescription does not standardize functional intensity (i.e., the resulting velocity decrement can vary substantially between athletes); therefore, EGS and EGH should be interpreted as comparing two applied prescription approaches rather than perfectly intensity-matched loading. To reduce confusion, %BM in EGS was used as a pragmatic field-standardization method, whereas EGH was explicitly individualized by targeting a ~10% performance decrement during the resisted 30 mH [16,19,40]. For clarity, the target %BM refers to the intended total towed mass relative to the athlete’s body mass, while the equation yields the amount of weight added to the sled (excluding sled mass). As %BM prescriptions can yield different velocity decrements across athletes, this approach was used as a practical load standardization method for the present applied setting. Following a 10 min recovery, athletes performed additional unresisted sprint-hurdle runs just as the EGH group did (3 × 20 m with two hurdles and 3 × 30 m with three hurdles).
2.4.3. Control Group (CG)
Participants in the CG did not perform any form of external resistance training during the intervention. They completed three training sessions per microcycle across the 7-week pre-competition period, matched to the experimental groups for session frequency. Each session consisted of 5 × 30 m maximal sprint runs without resistance, with 4 min passive recovery between repetitions. Following a 10 min recovery, athletes performed additional unresisted sprint-hurdle runs just as the EGH and EGS groups did (3 × 20 m with two hurdles and 3 × 30 m with three hurdles).
2.5. Statistical Analysis
2.5.1. Framework and Design
Analyses followed the preliminary report framework for small-sample intervention trials, with emphasis on estimation, uncertainty, and the compatibility of the data with a range of plausible effects rather than dichotomous significance decisions [28,30]. Given the target population of trained female sprint hurdlers, the small sample was treated explicitly as an informative preliminary step intended to guide future confirmatory work. The SESOI is detailed in the sample size justification subsection [30,41,42]. All randomized athletes completed pre- and post-testing and were included in the analytic dataset; therefore, the analyzed sample corresponded to the full randomized cohort.
This study used a three-arm, parallel-group design to compare two resisted sprint-training modalities with a hurdles-only control condition. The primary outcome was post-intervention 30 mH, with baseline 30 mH included as a covariate in the primary model. The primary estimand was the adjusted difference in post-intervention 30 mH performance between groups within a single three-arm model. The EGH versus CG contrast was defined as primary; EGH versus EGS was a pre-specified key secondary contrast; and EGS versus CG was secondary. In all models, CG served as the reference category, so effects are expressed as adjusted mean differences from control (seconds; negative values indicate faster performance). We report point estimates, 95% confidence intervals (CIs), standardized effect sizes, and exact p-values. Interpretation centers on effect magnitudes and uncertainty relative to the SESOI rather than on fixed thresholds.
2.5.2. Sample Size Justification and SESOI
This trial was constrained by the number of eligible national-level athletes available at a single training center and was therefore conducted as a preliminary report rather than a fully powered confirmatory trial [28]. To support interpretation and planning of future studies, we pre-specified a SESOI for the primary outcome, 30 m hurdle time, using a combination of substantive and standardized considerations [30,41,42,43].
Based on the between-athlete standard deviation (SD) of baseline 30 m hurdle time in this sample (SD = 0.33 s) and a small standardized threshold (0.20 SD units) as the minimum practically relevant improvement, the SESOI was set to 0.066 s (~1.2% of the baseline mean). Standardized effects for observed changes are reported as Hedges’ g (small-sample corrected standardized mean difference; SMD) [44]. The 0.20 SD value above is used only to operationalize the SESOI. This threshold aligns with the “aggregation of marginal gains” theory, which posits that performance improvements near the 1% threshold are practically significant in Olympic-level competition [45]. Relative to existing estimates of the smallest worthwhile enhancement in elite hurdles and sprint events, typically around 0.3–0.5% for world-class athletes and up to ~1% for other elite sprinters [46,47], our SESOI of 1.2% is on the conservative side, such that any effect deemed meaningful in this study would represent a clear competitive advantage rather than race-to-race noise. The present sample (N = 15) was therefore used primarily to obtain preliminary estimates of group differences and their 95% CIs relative to this SESOI, with the main purpose of informing the design and power calculations of future multi-center trials rather than providing definitive hypothesis tests.
To illustrate the implications for future work, we performed an analysis of covariance (ANCOVA)-based sample size calculation focused on the primary EGH–CG contrast. Assuming the pre–post correlation observed in this preliminary sample (r ≈ 0.90), detecting a 0.066 s difference with 80% power at α = 0.05 in a two-arm ANCOVA would require approximately 55 athletes per group; our current groups of n = 5 therefore represent only about 9% of this lower-bound optimal size. Because the actual design includes three groups (EGH, EGS, CG) and multiple planned contrasts, a fully specified three-arm sample size calculation that controls the family-wise Type I error rate would require at least this many participants per group and likely more [48,49]. Thus, regardless of the precise formula used, the present study is more than an order of magnitude smaller than the optimal sample size and must be interpreted as a resource-constrained preliminary report that quantifies uncertainty around the SESOI rather than as a confirmatory hypothesis test.
2.5.3. Primary Estimand and Robust ANCOVA
The primary analysis used ANCOVA on the post-test outcome with baseline as a covariate. The primary estimand was the adjusted mean difference in post-30 mH between groups, controlling for baseline 30 mH, with EGH − CG (hurdle-resisted vs. control) defined as the primary contrast, EGH − EGS defined as a pre-specified key secondary contrast based on training specificity, and EGS − CG considered secondary. For pre–post designs, ANCOVA on the post-test outcome with baseline as covariate often yields higher precision than change-score analysis when randomization is preserved and the baseline–post relation is approximately linear [50,51].
We fitted an ordinary least squares ANCOVA with Group as a fixed factor (CG, EGS, EGH) and baseline 30 mH as a covariate. Because the sample is small (N = 15), we avoided default model-based standard errors. We used CR3 (type-3) leverage-adjusted cluster-robust standard errors with Satterthwaite degrees of freedom (clubSandwich) [52]. With one post-intervention observation per athlete, this correction is conceptually similar to HC3-style leverage adjustment, improving small-sample inference [53]. For all estimates, 95% CIs were interpreted in relation to the SESOI.
2.5.4. Sensitivity Analyses and Methodological Triangulation
To ensure conclusions were not artifacts of a single modeling choice, we triangulated the primary contrast using two additional frameworks [54]. First, we fitted a longitudinal linear mixed model with random intercepts for athletes and Kenward–Roger degrees of freedom (KR df) to improve small-sample inference [55,56]. To align the mixed-model estimand with the primary ANCOVA estimand, we used a constrained-baseline parameterization (no main effect for Group), with fixed effects for Time and the Group × Time interaction. This specification constrains baseline group means and yields post-intervention group contrasts aligned with baseline-adjusted ANCOVA contrasts under randomization. From this model we obtained estimated marginal means and EGH–CG, EGH–EGS, and EGS–CG contrasts at post-intervention [57].
Second, we performed a contrast-specific label-shuffle permutation ANCOVA (10,000 shuffles), maintaining group sizes to obtain empirical p-values for each pre-specified baseline-adjusted contrast (EGH – CG, EGH – EGS, EGS – CG), thereby reducing reliance on small-sample normal-theory approximations and distributional assumptions [58]. Permutation p-values were obtained via global label shuffles maintaining group sizes (block IDs were not retained in the analytic dataset), and are reported as a sensitivity analysis. Across all three approaches (robust ANCOVA, constrained-baseline linear mixed models-LMM, and permutation ANCOVA), interpretation focused on the compatibility of the observed data with effects at or beyond the SESOI rather than on strict dichotomous decisions.
2.5.5. Effect Sizes and Exploratory Outcomes
Between-group differences in individual changes were quantified using Hedges’ g (based on post–pre change scores) with 95% CIs to summarize the magnitude of observed effects [44,59]. These standardized effects complement the adjusted ANCOVA estimates and support comparison with prior resistance-training literature. For visualization and descriptive robustness checks, distributions of individual changes in 30 mH and Tindex were summarized using Kruskal–Wallis tests with Dunn-type post hoc comparisons with Holm adjustment.
Secondary outcomes (Tindex) and exploratory kinematic variables were analyzed using the robust ANCOVA framework described above and interpreted as hypothesis-generating in line with the preliminary report guidelines and replication concerns [28,42,60]. Effect sizes and CIs for these outcomes are reported descriptively and interpreted cautiously relative to the SESOI and known measurement variability, without formal claims of efficacy.
2.5.6. Diagnostics and Reproducibility
Model assumptions (linearity, homoscedasticity, normality) were assessed using the performance package, which provides simulation-based predictive checks, residual-versus-fitted plots, leverage diagnostics, and Q–Q plots for linear models [61]. p-values were not formally adjusted for multiplicity; instead, false-positive risk was managed by pre-specifying a primary estimand and a limited hierarchy of planned contrasts, and by treating all secondary and exploratory findings as hypothesis-generating [28,29]. Analyses were conducted in R (version 4.5.3, 2025; R Core Team, R Foundation for Statistical Computing, Vienna, Austria) with a fixed random seed. De-identified individual-level data, analysis code, and study materials are openly available on the Open Science Framework (https://doi.org/10.17605/OSF.IO/4VBYR) under a permissive non-commercial license to ensure transparency and reproducibility.
3. Results
Results are organized hierarchically. The primary analysis is robust ANCOVA (CR3/Satterthwaite) on the pre-specified EGH–CG contrast (Section 3.2), interpreted against the SESOI (Section 3.3). Section 3.4 and Section 3.5 present sensitivity and distributional checks that assess model dependence; these are complementary rather than confirmatory. Secondary (T-index; Section 3.6) and exploratory kinematic outcomes (Section 3.7) are hypothesis-generating. Full individual-level data are available on the Open Science Framework repository.
3.1. Participants and Baseline Characteristics
Fifteen trained female sprint hurdlers (N = 15) completed the intervention with no missing outcome data in the analytic dataset (n = 5 per group). Baseline characteristics were generally comparable across groups (Table 1). The cohort’s age distribution corresponded to a mean age of approximately 16.3 ± 1.3 years; mean body mass was 59.2 ± 6.1 kg and height 167.9 ± 4.4 cm. At baseline, EGH had slightly faster 30 mH (5.21 ± 0.22 s) than the sled-resisted (EGS; 5.29 ± 0.28 s) and control groups (CG; 5.59 ± 0.39 s—Table 1; Table S1 in Supplementary Materials).
Table 1.
Baseline characteristics by group.
3.2. Primary Outcome: 30 m Hurdle Performance (30 mH)
Descriptively, mean pre–post changes in 30 mH favored EGH and CG (EGH: 5.21 → 5.09 s; CG: 5.59 → 5.53 s), whereas EGS showed minimal change (5.29 → 5.29 s—Figure 1; Table S1 in Supplementary Materials).
Figure 1.
30 m hurdle performance pre- and post-intervention by training group. CG: control (hurdles-only training); EGS: sled-resisted sprint training plus hurdle sprint training; EGH: hurdle-resisted sprint training. Points and thin colored lines represent individual athletes in each group (CG, EGS, EGH; n = 5 per group). Thick black lines and error bars represent group means and 95% confidence intervals at each time point. Text in the EGH panel summarizes the primary EGH–CG contrast from the robust ANCOVA with leverage-adjusted robust variance estimator (CR3) standard errors and Satterthwaite degrees of freedom and the permutation test based on 10,000 label shuffles of group. Primary (EGH vs. CG) adjusted difference: –0.19 s, p = 0.114 (Permutation p = 0.019). Key secondary (EGH vs. EGS) adjusted difference: –0.15 s, p = 0.096.
The primary estimand was the baseline-adjusted post-intervention between-group difference in 30 mH. Using robust ANCOVA with CR3 standard errors and Satterthwaite degrees of freedom, the adjusted post-intervention contrast favored EGH over CG (−0.192 s, 95% CI [−0.447, 0.063], t(5.80) = −1.86, p = 0.114) (Table 2). The key secondary planned contrast also favored EGH over EGS (−0.148 s, 95% CI [−0.330, 0.033], t(7.72) = −1.89, p = 0.096), while EGS did not differ meaningfully from CG (−0.044 s, 95% CI [−0.297, 0.209], p = 0.683).
Table 2.
Triangulated estimates for training group contrasts on post 30 m hurdle time (30 mH).
3.3. Smallest Effect Size of Interest-Based Interpretation
The SESOI was 0.066 s in the beneficial direction (i.e., −0.066 s for faster times). Although the point estimate for EGH vs. CG exceeded the SESOI (−0.192 s), the 95% CI included values smaller than the SESOI and values near zero, yielding an inconclusive interpretation relative to the SESOI threshold (Table 3). The same SESOI-based conclusion applied to EGH vs. EGS, whereas EGS vs. CG did not meet the SESOI at the point estimate (Table 3).
Table 3.
SESOI-based interpretation for baseline-adjusted 30 m hurdle contrasts (robust ANCOVA).
3.4. Methodological Triangulation (Robust ANCOVA, cLDA LMM, Permutation)
Triangulation supported the direction of the primary effect while showing expected model dependence in a small sample. In the constrained-baseline linear mixed model (cLDA; KR df), post-intervention contrasts remained directionally consistent but were smaller and less precise, with the compatibility interval spanning both meaningful and trivial effects (EGH vs. CG: −0.108 s, 95% CI [−0.307, 0.092], p = 0.265—Table 2). A contrast-specific permutation ANCOVA (10,000 label shuffles) provided an empirical p-value for the primary EGH–CG comparison of p = 0.019 (Figure 1).
3.5. Effect Size and Distributional Checks (Change Scores)
Change-score distributions were consistent with the descriptive pattern (Figure 2). A nonparametric Kruskal–Wallis test indicated no clear evidence of group differences in the distribution of change scores (p = 0.357). The standardized magnitude of the EGH–CG change-score contrast was moderate (|Hedges’ g| ≈ 0.42), though imprecise due to sample size (Figure 2).
Figure 2.
Change in 30 m hurdle time (post minus pre) by training group. CG: control (hurdles-only training); EGS: sled-resisted sprint training plus hurdle sprint training; EGH: hurdle-resisted sprint training. Violin and boxplots summarize the distribution of individual changes in 30 m hurdle time (post minus pre) for each training group (CG, EGS, EGH; n = 5 per group). Small points represent individual athletes; the larger point indicates the median change in each group. The headline statistics report the Kruskal–Wallis omnibus test and an associated effect size with confidence interval. Dunn post hoc tests (Holm-adjusted) were conducted; no pairwise differences were significant. Negative values indicate improved (faster) hurdle times.
3.6. Secondary Outcome: Technique Index (Tindex)
At post-intervention, baseline-adjusted contrasts suggested lower Tindex (i.e., a smaller hurdle–sprint gap) in the resisted groups compared with control, but with wide uncertainty. Robust ANCOVA estimated EGH vs. CG at −0.152 s (95% CI [−0.458, 0.154], p = 0.265) and EGS vs. CG at −0.164 s (95% CI [−0.492, 0.165], p = 0.260—Table 4). Constrained Longitudinal Data Analysis (cLDA) LMM estimates were directionally similar (EGH vs. CG −0.151 s, p = 0.245). Kruskal–Wallis testing on Tindex change scores indicated no evidence of distributional differences (p = 0.914—Figure 3; Table 4).
Table 4.
Technique Index (Tindex) contrasts at post-intervention.
Figure 3.
Change in Technique Index (Tindex) by training group. CG: control (hurdles-only training); EGS: sled-resisted sprint training plus hurdle sprint training; EGH: hurdle-resisted sprint training. Violin and boxplots show individual changes in Tindex (post minus pre, in seconds). Headline statistics are the Kruskal–Wallis omnibus test and associated effect size with confidence interval. Dunn post hoc tests (Holm-adjusted) were conducted; no pairwise differences were significant. Negative values indicate relatively greater improvement in hurdle versus sprint performance. EGH vs. CG adjusted difference: –0.15 s, p = 0.265.
3.7. Exploratory Kinematics (Hypothesis-Generating)
Exploratory, baseline-adjusted kinematic contrasts (EGH vs. CG) showed no clear between-group differences for timing variables at the first and second hurdles, or for hurdling clearance or landing distances at the second hurdle (all p ≥ 0.126; Table 5). However, at the third hurdle, the EGH group demonstrated a nominally shorter flight time (–0.047 s [95% CI: –0.078, –0.016], p = 0.009) and a shorter landing support time (–0.011 s [95% CI: –0.021, –0.000], p = 0.045) compared to control. Additionally, take-off distance at the second hurdle was nominally greater in the EGH group (0.129 m [95% CI: 0.017, 0.241], p = 0.030). Collectively, these findings should be interpreted as hypothesis-generating given the exploratory nature of the analysis.
Table 5.
Exploratory baseline-adjusted kinematic contrasts (Robust ANCOVA EGH vs. CG).
3.8. Model Diagnostics
Diagnostic panels for the primary robust ANCOVA indicated no major departures from model assumptions: residual distributions were broadly compatible with approximate normality, variance patterns were not strongly heteroskedastic, and collinearity was low as the variance inflation factors (VIFs) were in the “low” range. The cLDA LMM diagnostics likewise did not reveal major violations, including reasonable random-effect behavior and no extreme influential points outside contour thresholds, acknowledging that leverage and influence are inherently more sensitive in very small samples (see Supplementary Materials, Diagnostics folder).
4. Discussion
In this exploratory study of national-level U18 female sprint hurdlers, we compared the effects of seven microcycles of hurdle-resisted sprint training, sled-resisted sprint training combined with hurdle sprint training, and hurdles-only training on 30 m hurdle performance, Tindex, and hurdle-clearance kinematics. Using a recent framework for small-sample intervention studies, we emphasized estimation, SESOI-based interpretation, and methodological triangulation rather than dichotomous null-hypothesis testing [28,30]. Across robust ANCOVA, linear mixed models, permutation-based ANCOVA, standardized effect sizes, and non-parametric tests, the most consistent signal was that EGH tended to produce faster 30 mH than CG, with a primary adjusted difference of approximately −0.19 s and an LMM-based post-intervention contrast of −0.11 s. Both estimates exceed the pre-specified SESOI of 0.066 s, whereas differences between EGH and EGS were smaller (≈−0.13 s; LMM post contrast) and clearly more uncertain. Secondary analyses suggested a broadly similar but imprecise pattern for Tindex, and exploratory kinematic contrasts pointed to small, distributed changes, with specific adaptations emerging at the second hurdle (increased take-off distance) and third hurdle (reduced flight and landing support times) rather than a single uniform mechanical shift. Because multiple kinematic endpoints were evaluated without multiplicity adjustment, these hurdle-specific signals should be interpreted as hypothesis-generating.
Crucially, all estimates were accompanied by very wide compatibility intervals that comfortably included trivial and even opposite-signed effects, reflecting the extreme mismatch between the optimal and achieved sample sizes. Based on the observed variance and pre–post correlation in 30 mH, a two-arm ANCOVA designed to detect the SESOI with 80% power would require roughly 55 athletes per group, whereas the present trial included only five athletes per group, around 9% of this lower-bound optimal size. In line with recent guidance on SESOI-based, compatibility-focused interpretation of small trials [29,41,42,59,60], the absence of conventional “statistical significance” therefore cannot be taken as evidence that the three training modalities are equivalent. Rather, the data remain compatible with a range of effects, from negligible differences to practically meaningful advantages for hurdle-resisted training over both sled-resisted and hurdles-only conditions within this three-arm randomized design, underscoring that the primary value of this study lies in refining plausible effect sizes, SESOI benchmarks, and design parameters for future, adequately powered multi-center trials.
4.1. 30 m Hurdle Performance and Training Specificity
Across the 7-week intervention, EGH showed the largest improvement in 30 m hurdle performance (≈2.3% relative to baseline), CG improved to a smaller extent (≈1.1%), whereas EGS showed little to no change. In the baseline-adjusted analyses, the overall pattern was most consistent with a directional advantage for EGH over CG, although the wide compatibility intervals preclude confirmatory claims. In contrast, EGH vs. EGS and EGS vs. CG yielded smaller and more uncertain estimates, with compatibility intervals spanning negligible and meaningful effects, suggesting that any between-group effects involving sled-resisted sprinting were smaller and/or more variable in this sample. A plausible explanation for the pattern of 30 mH changes (EGH improving most, CG improving modestly, and EGS showing little change) is the combined influence of training specificity and transfer. However, because EGH and EGS differed not only in task specificity (hurdle-resisted vs. flat sled sprinting) but also in load prescription philosophy (velocity decrement vs. fixed %BM), any between-group differences cannot be attributed uniquely to the resistance modality. Thus, the pattern may reflect the combined effects of (i) task specificity (resistance applied within hurdle running) and (ii) individualized functional intensity (decrement-based prescription), rather than the mechanical-resistance method alone.
Resisted sprint training is generally most effective when the overloaded task preserves the key technical and coordinative features of the target performance [62], and when loading is prescribed in a way that avoids excessive disruption of sprint mechanics. In hurdling, performance over the first 30 m is not determined by acceleration alone, but by accelerating into the first hurdle while maintaining a constrained early rhythm (fixed step pattern to the first hurdle, standardized inter-hurdle spacing, and precise preparation for take-off and landing, which collectively influence velocity maintenance across the early hurdle units [1]). Therefore, applying resistance within sprint-hurdle running (such as for EGH in the present study) is likely to provide a more direct, task-specific stimulus than flat sled towing, which requires transfer from straight sprint mechanics to barrier-constrained coordination. More broadly, evidence syntheses in resisted sprint training emphasize that performance adaptations depend strongly on how resistance is prescribed and progressed, and that prescribing sled loads as a fixed percentage of body mass can yield highly variable effective intensity across athletes and contexts [16]. Finally, tether-based resistance systems are designed to provide a more quantifiable and repeatable horizontal resistance stimulus, and recent research has quantified the horizontal force characteristics of Exer-Genie–type devices [24] and supported the validity and reliability of field-based resisted-sprint devices [25,26], which may help reduce “noise” in the training dose and facilitate more consistent transfer to sprint-hurdle performance. From a coaching perspective, where a tethered device is available, resistance can be prescribed in an accessible way by targeting a small performance decrement (e.g., ~10% slower than the athlete’s unresisted time over the same sprint-hurdle distance), which individualizes functional intensity more reliably than fixed % body mass. If rhythm deteriorates, the load or volume should be reduced.
4.2. Technique Index and the Hurdle–Sprint Gap
Across groups, Tindex showed a different pattern than 30 mH. CG showed a small improvement in relative hurdling efficiency (0.74 vs. 0.71 s; ≈−4.1% vs. baseline), whereas EGS demonstrated the least favorable change (0.49 vs. 0.54 s; ≈+10.2%), and EGH also increased slightly (0.52 vs. 0.55 s; ≈+5.8%), alongside substantial individual variability. This divergence is plausible because Tindex is a difference score (30 mH − 30 mS). If a resisted intervention improves flat sprint acceleration to a similar or greater extent than hurdle performance, the hurdle–sprint gap may remain unchanged or widen, even when 30 mH improves. This interpretation is consistent with the resisted-sprint literature showing that adaptations are highly dependent on load prescription/progression and often manifest strongly in short-sprint acceleration capacity [16]. At the same time, sprint-hurdle performance is strongly linked to the ability to sustain high running velocity across hurdle units and minimize disruption to rhythm determinants repeatedly highlighted in race and kinematic analyses [1,3] and time-analyses linking faster intermediate segments/hurdle-unit velocities with better overall performance [4,5]. Consequently, reducing Tindex likely requires improvements that are disproportionately hurdle-specific (e.g., clearance economy, shorter/less disruptive flight, and rapid re-establishment of sprinting after touchdown), rather than generalized speed gains alone [1,3].
4.3. Exploratory Kinematic Observations
Across the secondary kinematic outcomes, the baseline-adjusted analyses suggest that the intervention effects were selective rather than global. Most clearance spatiotemporal variables did not show clear, consistent group separation once pre-intervention values were accounted for, implying that hurdle-resisted training did not produce a uniform change in “overall technique” across all measured parameters. Instead, kinematic strategies varied widely among athletes, with no single parameter (such as take-off distance or flight time) universally driving the improved 30 m hurdle times in the EGH group. Functionally, this suggests that the performance benefit of hurdle-resisted training may stem from improved holistic coordination or force application between hurdles, rather than a forced, uniform alteration of clearance mechanics. The absence of robust between-group differences in the remaining support-time and distance variables suggests that any performance benefit is unlikely to be explained by a single dominant kinematic change; rather, it is more compatible with small, distributed adjustments and/or improved coordination under task-specific loading. Given the small sample and the exploratory nature of these kinematic endpoints, these findings should be treated as hypothesis-generating targets for replication with larger cohorts and more comprehensive hurdle-unit measurement.
4.4. Limitations
From a coaching perspective, several practical limitations should be considered when interpreting and applying the findings. First, the intervention was implemented in a real-world pre-competition context, meaning that training content outside the prescribed resisted sessions (e.g., technical hurdling drills, strength/power work, competition demands, and day-to-day fatigue management) could not be standardized to the extent possible in a laboratory setting; therefore, the observed responses likely reflect the combined influence of the intervention and the broader training environment. Second, U18 female hurdlers typically present substantial heterogeneity in maturation status, training age, strength levels, and technical stability, which can amplify inter-individual variability in response to resisted methods and make group-level averages less representative for some athletes. Third, although resistance was prescribed with the intention of preserving technique, field constraints make it difficult to guarantee that each athlete experienced an identical “effective” intensity across sessions (e.g., subtle differences in surface, footwear, motivation, and execution quality), and small deviations in hurdle rhythm or take-off/landing preparation may have disproportionate effects on short hurdle performance. Fourth, the testing protocol assessed a short segment (30 m with three hurdles) and therefore captures early-phase hurdling rather than the full-race demands of rhythm maintenance and technique robustness under accumulating fatigue; consequently, the transfer of these findings to complete 100 m/110 m hurdle races should be made cautiously.
From a statistical perspective, the dominant limitation of this trial is the extremely small sample size per arm (n = 5), which inevitably yields wide compatibility intervals and imprecise estimates of between-group differences. This situation is typical of intervention research in sport and exercise science, where structural constraints on recruitment often produce low power, unstable estimates, and poor replication prospects [27,30,42,48,59,60]. Even though we followed a Preliminary Report framework, pre-specified a SESOI, and centered interpretation on compatibility intervals rather than dichotomous significance thresholds [28,29], the present n = 5 per group still implies a high risk of Type M (magnitude) and Type S (sign) errors and “winner’s curse” phenomena, whereby effects that appear promising in small samples are exaggerated or even reverse direction when replicated in larger cohorts [63,64,65,66]. This risk is further compounded by the breadth of our analytic program: in addition to the primary contrast (EGH–CG) and the pre-specified key secondary contrast (EGH–EGS) on 30 m hurdle performance, we evaluated secondary outcomes (Tindex), a set of exploratory kinematic variables, and multiple analytical approaches (robust ANCOVA, mixed-effects models, permutation tests, standardized effect sizes, and non-parametric tests). Although we intentionally refrained from formal multiplicity corrections and instead treated non-primary results as hypothesis-generating, the sheer number of outcomes and contrasts increases the probability of both false-positive and false-negative findings, and raises the risk that the most “attractive” effects in this small dataset are those that are most over-estimated [59,67,68,69].
Methodologically, we attempted to reduce model dependence and small-sample bias by (a) anchoring inference to a clearly defined SESOI and target difference [29,43,70,71]; (b) triangulating across robust ANCOVA with CR3/Satterthwaite corrections, mixed-effects models with KR df, and permutation-based ANCOVA [52,54,72,73,74]; and (c) explicitly checking model assumptions instead of relying on a single pipeline [73,74,75]. Nevertheless, with only 15 athletes, all regression models operate close to the limits of what is reasonable: there is limited flexibility to include additional covariates without overfitting, and simulation work suggests that even small-sample-adjusted cluster-robust and mixed-effects methods can still show non-trivial bias and coverage problems when group sizes are as low as in the present design [52,72,73,76]. Our choice of ANCOVA on post-test outcomes with baseline adjustment follows best-practice recommendations for randomized trials with potential baseline imbalance [50,51], but the robustness of any single specification remains difficult to verify in such a small sample.
Although randomization was computer-generated, baseline 30 mH was numerically faster in the EGH group (5.21 ± 0.22 s) than in CG (5.59 ± 0.39 s), a difference that is not uncommon when randomizing very small samples. The primary ANCOVA adjusts for this imbalance by including baseline performance as a covariate, thereby estimating treatment effects conditional on baseline; nevertheless, with n = 5 per group, residual confounding from unmeasured covariates cannot be excluded, and the possibility that faster, potentially more trainable athletes were disproportionately allocated to EGH should be acknowledged as a limitation. Replication with larger samples is essential to confirm that the observed directional pattern is not an artifact of chance baseline imbalance [50,51].
The analytical sophistication of this study—including robust ANCOVA with CR3 corrections, constrained-baseline LMM with Kenward–Roger degrees of freedom, permutation-based inference, SESOI-anchored interpretation, and methodological triangulation—is not intended to substitute for adequate sample size or to create a false sense of inferential precision. Rather, the triangulated framework was designed to transparently expose model dependence and provide honest uncertainty quantification, consistent with the preliminary-report philosophy. The discrepancy between the permutation p-value (0.019) and the parametric estimates (p = 0.114, 0.265) reflects the expected model sensitivity in very small samples and should be interpreted as evidence of structural instability rather than as confirmatory evidence of an effect. Readers should interpret all estimates with the understanding that n = 5 per group fundamentally limits the precision and stability of any statistical approach [52,54,72,73,74].
A further limitation concerns the operationalization of the SESOI. We defined the SESOI for 30 m hurdle performance as 0.2 × the between-athlete standard deviation of baseline times (=0.066 s), which corresponds to ~1.2% of the baseline mean and is broadly consistent with performance-analytics work suggesting that improvements around 0.5–1.5% can be practically decisive in elite sprinting and hurdling [45,46,47,77,78]. While this rule-based, distribution-informed approach is preferable to post hoc interpretation without any target difference [29,41,42], it still relies partly on the variability of the current sample and may not perfectly reflect what coaches and athletes would regard as a “not-to-be-missed” gain in different competitive contexts [43,70,78].
Finally, the illustrative sample-size calculation we report is based on a two-arm ANCOVA approximation for the primary EGH–CG contrast and should be viewed as a lower-bound requirement for a future confirmatory trial. A fully specified three-arm design that treats both EGH–CG and EGH–EGS as primary or co-primary contrasts and formally controls the family-wise error rate would almost certainly require a larger total sample to maintain adequate power [67,69]. Thus, while the present calculation already demonstrates that the current trial operates at only a small fraction of the optimal per-group size, the true requirements for a rigorously powered three-arm study are likely even higher, reinforcing that the current investigation is best regarded as a statistically underpowered but methodologically transparent preliminary report.
4.5. Directions for Future Research
Looking ahead, from a statistical perspective, future work on this topic would benefit from prospectively planned, adequately powered multi-center trials in which the SESOI is justified a priori using a combination of trial-methodology guidance (e.g., DELTA2) and sport-specific performance considerations [43,70,78]. A SESOI-driven study would allow prospectively justified sample-size planning informed by realistic effect distributions rather than convenient assumptions of large effects [29,59,70]. Such trials should be explicitly designed around the primary estimand—for example, adjusted EGH–CG and EGH–EGS contrasts in a three-arm ANCOVA or mixed-model framework—so that both the SESOI and the analysis model are prospectively aligned. Such a study should also embed the planned analyses in small-sample simulation work to assess bias, precision, and Type M/S error rates for the chosen models [65,66]. Future work could strengthen the SESOI framework by combining distribution-based rules with external anchors (e.g., qualification standards, typical within-athlete variability, or expert-elicited thresholds) and by validating whether the same SESOI is appropriate across levels of competition [43,70,78].
For complex longitudinal designs with repeated measures and clustering, simulation-based or analytic sample size planning should be used to target acceptable precision and power for the primary estimand, rather than relying on rules of thumb or retrospective justification [29,49,71,79,80]. In practice, this means specifying realistic variance–covariance structures (e.g., pre–post correlations, between-athlete variability, site-level clustering) and examining how different design choices—number of athletes per group, number of centers, follow-up duration—affect both power and the width of compatibility intervals. Given the practical difficulty of recruiting large numbers of high-level hurdlers at a single site, one promising avenue is to embed similar interventions within big-team or networked collaborations, where harmonized protocols, open data, and shared analysis code allow cumulative evidence across multiple small studies to be synthesized via prospective meta-analysis or hierarchical modeling [28,60,81,82]. Such collaborative designs, coupled with transparent pre-registration, explicit SESOI justification, and routine sharing of de-identified individual-level data, would enable planned cross-study synthesis rather than ad hoc meta-analyses and would help to reduce the risk of Type M/S errors and over-interpretation that inevitably accompanies statistically sophisticated analyses conducted on very small samples [29,63,66].
5. Conclusions
In this preliminary trial of trained female sprint hurdlers, the data are compatible with a range of effects from negligible to practically meaningful for hurdle-resisted sprint training across baseline-adjusted robust ANCOVA, constrained-baseline linear mixed models, and permutation-based inference. This study’s primary contribution was consistent with a potential performance advantage for hurdle-resisted training over both hurdles-only and sled-resisted conditions; however, all estimates were accompanied by wide compatibility intervals that included trivial and opposite-signed effects, precluding confirmatory interpretation. Secondary kinematic analyses suggested selective, small changes rather than a uniform alteration of hurdle technique, but these exploratory findings should be interpreted as hypothesis-generating given the small sample and multiple endpoints evaluated. Generalization beyond the present sample and training context is not warranted on the basis of these data alone.
From an applied perspective and pending replication in adequately powered trials, the preliminary findings are consistent with the possibility that integrating horizontal resistance within sprint-hurdle running may provide a more effective and specific stimulus for improving short-distance hurdling performance than relying on flat sled towing alone. Coaches who choose to implement hurdle-resisted training should prioritize quality of execution and preserve the intended hurdle rhythm, using conservative, technique-preserving loading and adequate recoveries to avoid technical deterioration across repetitions. As a practical reference, the present EGH protocol used individualized towing resistance targeting a ~10% velocity decrement (corresponding to approximately 13% body mass), applied during 5 × 30 m resisted hurdle runs per session with 4 min passive recovery, followed by six unresisted sprint-hurdle transfer runs (3 × 20 m and 3 × 30 m), delivering three sessions per microcycle across seven weeks in a 3:1 loading structure; hurdle spacing was uniformly reduced by 10% during resisted runs to preserve the intended three-step inter-hurdle rhythm. We note that these values should be taken as a starting-point reference rather than fixed prescriptions, given the preliminary nature of the findings. Given the high inter-individual variability typical of U18 athletes, resistance and progression should be individualized and monitored closely, with simple field feedback (e.g., maintenance of step pattern, stable take-off/landing positions, and consistent clearance timing) used to ensure that overload does not compromise hurdle mechanics. Overall, the results support the practical idea that resisted methods may be most useful when they overload the specific coordinative and mechanical demands of accelerating into and through early hurdle units. This study’s primary contribution is to the cumulative evidence base through openly available individual-level data, validated measurement protocols, and calibrated effect-size estimates that can inform prospective meta-analyses and adequately powered replication trials; it should not be used in isolation to guide training decisions.
Supplementary Materials
The following supporting information can be downloaded at https://doi.org/10.17605/OSF.IO/4VBYR (accessed before 12 April 2026).
Author Contributions
Conceptualization, S.M., Z.P., A.S.T. and A.S.; methodology, S.M., Z.P., A.S.T. and A.S.; software, S.M. and Z.P.; validation, S.M., A.S.T. and A.S.; formal analysis, S.M., V.P., A.S.T. and Z.P.; investigation, S.M. and A.S.T.; resources, S.M., A.S.T. and A.S.; data curation, S.M. and Z.P.; writing—original draft preparation, S.M., V.P. and A.S.; writing—review and editing, Z.P., V.P., A.S.T. and F.P.; visualization, Z.P., V.P. and A.S.T.; supervision, A.S.T. and A.S.; project administration, A.S. All authors have read and agreed to the published version of the manuscript.
Funding
This research received no external funding.
Institutional Review Board Statement
The study was conducted in accordance with the Declaration of Helsinki, and approved by the Ethics Committee of the School of Physical Education and Sports Science, National and Kapodistrian University of Athens (approval number: 1433 and date of approval 21 November 2022).
Informed Consent Statement
Informed parental consent was obtained from all participants involved in the study.
Data Availability Statement
The data presented in this study are openly available in OSF at [https://doi.org/10.17605/OSF.IO/4VBYR].
Conflicts of Interest
The authors declare no conflicts of interest.
Abbreviations
The following abbreviations are used in this manuscript:
| %BM | percentage of body mass |
| 2D | two-dimensional |
| 30 mH | 30 m sprint-hurdle time |
| 30 mS | 30 m flat sprint time |
| ANCOVA | analysis of covariance |
| CG | control sprint-hurdle training |
| CI | confidence interval |
| cLDA | constrained longitudinal data analysis |
| CR3 | leverage-adjusted robust variance estimator |
| EGH | hurdle-resisted sprint training |
| EGS | sled-resisted sprint training |
| FT | flight time |
| HC3 | heteroskedasticity-consistent standard error |
| HCD | hurdling clearance distance |
| HCT | hurdle clearance time |
| KR df | Kenward-Roger degrees of freedom |
| LD | landing distance |
| LMM | linear mixed models |
| LST | landing support time |
| SD | standard deviation |
| SESOI | smallest-effect-size-of-interest |
| SMD | standardized mean difference |
| Tindex | technique index |
| TOD | take-off distance |
| TST | take-off support time |
| U18 | under 18 years old age category |
| VIF | variance inflation factor |
References
- Hanley, B.; Walker, J.; Paradisis, G.P.; Merlino, S.; Bissas, A. Biomechanics of world-class men and women hurdlers. Front. Sports Act. Living 2021, 3, 704308. [Google Scholar] [CrossRef] [Scilit]
- Mansour, H.; Ben Chaifa, M.; Atta, I.I.; Alhumaid, M.M.; Said, M.A. Efficiency factors in 110-metre hurdle clearance techniques: Kinematics among specialist hurdlers and decathletes. Hum. Mov. 2024, 25, 84–96. [Google Scholar] [CrossRef] [Scilit]
- Bissas, A.; Paradisis, G.P.; Hanley, B.; Merlino, S.; Walker, J. Kinematic and temporal differences between world-class men’s and women’s hurdling techniques. Front. Sports Act. Living 2022, 4, 873547. [Google Scholar] [CrossRef] [Scilit]
- González-Frutos, P.; Veiga, S.; Mallo, J.; Navarro, E. Evolution of the Hurdle-Unit Kinematic Parameters in the 60 m Indoor Hurdle Race. Appl. Sci. 2020, 10, 7807. [Google Scholar] [CrossRef] [Scilit]
- Tsiokanos, A.; Tsaopoulos, D.; Giavroglou, A.; Tsarouchas, E. Race pattern of men’s 110-m hurdles: Time analysis of Olympic hurdle performance. Int. J. Kinesiol. Sports Sci. 2018, 5, 56–64. [Google Scholar] [CrossRef] [Scilit]
- Kaisidou, V.; Gaitanidis, L.; Panoutsakopoulos, V. Relationships between the technique index and performance in 60-m hurdle indoor races in elite male heptathletes. Trends Sport. Sci. 2021, 28, 137–145. [Google Scholar] [CrossRef] [Scilit]
- Otsuka, M.; Ito, M.; Ito, A. Analysis of hurdle running at various inter-hurdle distances in an elementary school PE class. Int. J. Sport. Health Sci. 2010, 8, 35–42. [Google Scholar] [CrossRef] [Scilit]
- Ozaki, Y.; Ueda, T. Do Different Hurdle Heights Alter Important Spatiotemporal Variables in Hurdle Clearance? Front. Sports Act. Living 2022, 4, 822592. [Google Scholar] [CrossRef] [Scilit]
- Tønnessen, E.; Svendsen, I.S.; Olsen, I.C.; Guttormsen, A.; Haugen, T. Performance development in adolescent track and field athletes according to age, sex and sport discipline. PLoS ONE 2015, 10, e0129014. [Google Scholar] [CrossRef] [Scilit]
- Bezuglov, E.; Achkasov, E.; Vakhidov, T.; Malyakin, G.; Kapralova, E.; Kolesnichenko, V.; Vinogradov, M.; Zharikova, T.; Emanov, A. Gender Differences and Performance Changes in Sprinting and Long Jump Among Young Athletes. Sports 2024, 12, 347. [Google Scholar] [CrossRef] [Scilit] [PubMed]
- Balcarova, B.; Pedersen, A.V. The development of the performance sex gap in track-and-field events across the lifespan. Front. Sports Act. Living 2025, 7, 1659762. [Google Scholar] [CrossRef] [Scilit]
- Tingelstad, L.M.; Raastad, T.; Myklebust, G.; Gjerstad Andersen, T.E.; Solstad, B.E.; Bugten, J.B.; Luteberget, L.S. Age and Sex Differences in Physical Performance Among Adolescent Team Sport Athletes. Eur. J. Sport. Sci. 2025, 25, e12284. [Google Scholar] [CrossRef] [Scilit]
- Panoutsakopoulos, V.; Theodorou, A.S.; Kotzamanidou, M.C.; Fragkoulis, E.; Smirniotou, A.; Kollias, I.A. Gender and event specificity differences in kinematical parameters of a 60 m hurdles race. Int. J. Perform. Anal. Sport. 2020, 20, 668–682. [Google Scholar] [CrossRef] [Scilit]
- Samozino, P.; Peyrot, N.; Edouard, P.; Nagahara, R.; Jimenez-Reyes, P.; Vanwanseele, B.; Morin, J.B. Optimal mechanical force-velocity profile for sprint acceleration performance. Scand. J. Med. Sci. Sports 2022, 32, 559–575. [Google Scholar] [CrossRef] [Scilit]
- Bezodis, I.N.; Brazil, A.; von Lieres Und Wilkau, H.C.; Wood, M.A.; Paradisis, G.P.; Hanley, B.; Tucker, C.B.; Pollitt, L.; Merlino, S.; Vazel, P.J.; et al. World-Class Male Sprinters and High Hurdlers Have Similar Start and Initial Acceleration Techniques. Front. Sports Act. Living 2019, 1, 23. [Google Scholar] [CrossRef] [Scilit] [PubMed]
- Petrakos, G.; Morin, J.B.; Egan, B. Resisted Sled Sprint Training to Improve Sprint Performance: A Systematic Review. Sports Med. 2016, 46, 381–400. [Google Scholar] [CrossRef] [Scilit] [PubMed]
- Aldrich, E.K.; Sullivan, K.; Wingo, J.E.; Esco, M.R.; Leeper, J.; Richardson, M.T.; Winchester, L.J.; Fedewa, M.V. The Effect of Resisted Sprint Training on Acceleration: A Systematic Review and Meta-Analysis. Int. J. Exer Sci. 2024, 17, 986–1002. [Google Scholar] [CrossRef] [Scilit]
- Salazar-Orellana, C.; Alarcón-Rivera, M.; Muñoz-Pereira, B.; Salazar-Méndez, J.; Guzmán-Muñoz, E.; Carrasco-Alarcón, V.; Valdes-Badilla, P. Effects of resisted sled training on sprint performance in team sports. A systematic review and meta-analysis. J. Bodyw. Mov. Ther. 2025, 42, 302–312. [Google Scholar] [CrossRef] [Scilit]
- Cross, M.R.; Brughelli, M.; Samozino, P.; Brown, S.R.; Morin, J. Optimal Loading for Maximizing Power During Sled-Resisted Sprinting. Int. J. Sports Physiol. Perform. 2017, 12, 1069–1077. [Google Scholar] [CrossRef] [Scilit]
- Osterwald, K.M.; Kelly, D.T.; Comyns, T.M.; Catháin, C.Ó. Resisted Sled Sprint Kinematics: The Acute Effect of Load and Sporting Population. Sports 2021, 9, 137. [Google Scholar] [CrossRef] [Scilit]
- Cahill, M.J.; Oliver, J.L.; Cronin, J.B.; Clark, K.P.; Cross, M.R.; Lloyd, R.S. Sled-Pull Load–Velocity Profiling and Implications for Sprint Training Prescription in Young Male Athletes. Sports 2019, 7, 119. [Google Scholar] [CrossRef] [Scilit] [PubMed]
- Rumpf, M.C.; Lockie, R.G.; Cronin, J.B.; Jalilvand, F. Effect of Different Sprint Training Methods on Sprint Performance Over Various Distances: A Brief Review. J. Strength. Cond. Res. 2016, 30, 1767–1785. [Google Scholar] [CrossRef] [Scilit]
- Myrvang, S.; van den Tillaar, R. The Longitudinal Effects of Resisted and Assisted Sprint Training on Sprint Kinematics, Acceleration, and Maximum Velocity: A Systematic Review and Meta-analysis. Sports Med.–Open 2024, 10, 110. [Google Scholar] [CrossRef] [Scilit]
- Ghigiarelli, J.J.; Ferrara, K.J.; Yang, Y.; Abrechsten, J.D.; Barat, V.M.; Sell, K.M.; Gonzalez, A.M. Quantification of horizontal force for the EXER-GENIE® resisted sprint training device. Front. Sports Act. Living 2023, 5, 1231371. [Google Scholar] [CrossRef] [Scilit]
- Rakovic, E.; Paulsen, G.; Helland, C.; Haugen, T.; Eriksrud, O. Validity and Reliability of a Motorized Sprint Resistance Device. J. Strength. Cond. Res. 2022, 36, 2335–2338. [Google Scholar] [CrossRef] [Scilit]
- Sašek, M.; Cvjetičanin, O.; Šarabon, N. The validity and reliability of a hydraulic resistance device for assessing resisted sprint time. Front. Sports Act. Living 2024, 6, 1386882. [Google Scholar] [CrossRef] [Scilit]
- Skorski, S.; Hecksteden, A. Coping With the “Small Sample-Small Relevant Effects” Dilemma in Elite Sport Research. Int. J. Sports Physiol. Perform. 2021, 16, 1559–1560. [Google Scholar] [CrossRef] [Scilit] [PubMed]
- Impellizzeri, F.M.; Murphy, J.; Mesquida, C.; Warne, J.; Hecksteden, A.; Batomen, B.; Wang, C.; Meyer, T.; Lakens, D. Introducing a new “Preliminary Report” submission category for small-sample intervention studies: Rationale and instructions. Sci. Med. Footb. 2026, 10, 1–11. [Google Scholar] [CrossRef] [Scilit]
- Improving Your Statistical Inferences by D. Lakens. Available online: https://lakens.github.io/statistical_inferences/ (accessed on 14 November 2025).
- Mesquida, C.; Murphy, J.; Lakens, D.; Warne, J. Publication bias, statistical power and reporting practices in the Journal of Sports Sciences: Potential barriers to replicability. J. Sports Sci. 2023, 41, 1507–1517. [Google Scholar] [CrossRef] [Scilit] [PubMed]
- Matarazzo, A.; D’anastasio, R. Anthropometric linear measurements of female athletes in the Italian national athletic teams. Int. J. Morphol. 2022, 40, 657–661. [Google Scholar] [CrossRef] [Scilit]
- Nooyens, A.C.; Koppes, L.L.; Visscher, T.L.; Twisk, J.W.; Kemper, H.C.; Schuit, A.J.; van Mechelen, W.; Seidell, J.C. Adolescent skinfold thickness is a better predictor of high body fatness in adults than is body mass index: The Amsterdam Growth and Health Longitudinal Study. Am. J. Clin. Nutr. 2007, 85, 1533–1539. [Google Scholar] [CrossRef] [Scilit]
- Nobari, H.; Azarian, S.; Saedmocheshi, S.; Valdés-Badilla, P.; García Calvo, T. Narrative review: The role of circadian rhythm on sports performance, hormonal regulation, immune system function, and injury prevention in athletes. Heliyon 2023, 9, e19636. [Google Scholar] [CrossRef] [Scilit]
- Liakou, C.A.; Fatouros, I.G.; Poulios, A.; Tsatalas, T.; Karampina, E.; Karanika, P.; Kaloudi, D.; Rosvoglou, A.; Tsimeas, P.; Kamperi, A.; et al. Recovery kinetics following sprint training: Resisted versus unresisted sprints. Eur. J. Appl. Physiol. 2024, 124, 881–896. [Google Scholar] [CrossRef] [Scilit]
- World Athletics. Competition Rules & Technical Rules (Book C: C1.1 & C2.1) [PDF]. Available online: https://worldathletics.org/download/download?filename=89292580-aaca-4ea3-9c96-f4d05afb1bf8.pdf&urlslug=C1.1+%26+C2.1+-+Competition+Rules+%26+Technical+Rules (accessed on 3 December 2025).
- Smirniotou, A.; Panteli, F.; Theodorou, A. Target constraints influence locomotion pattern to the first hurdle. Mot. Control 2022, 26, 194–212. [Google Scholar] [CrossRef] [Scilit] [PubMed]
- Haugen, T.; Sandbakk, Ø.; Enoksen, E.; Seiler, S.; Tønnessen, E. Crossing the Golden Training Divide: The Science and Practice of Training World-Class 800- and 1500-m Runners. Sports Med. 2021, 51, 1835–1854. [Google Scholar] [CrossRef] [Scilit] [PubMed]
- Martínez-Valencia, M.A.; Linthorne, N.P.; Alcaraz, P.E. Effect of lower body explosive power on sprint time in a sled-towing exercise. Sci. Sports 2013, 28, e175–e178. [Google Scholar] [CrossRef] [Scilit]
- Pareja-Blanco, F.; Pereira, L.A.; Reis, V.P.; Fernandes, V.; Arruda, A.F.S.; Guerriero, A.; Alcaraz, P.E.; Freitas, T.T.; Loturco, I. Impact of Sled Loads on Performance and Kinematics of Elite Sprinters and Rugby Players. Int. J. Sports Physiol. Perform. 2022, 17, 465–473. [Google Scholar] [CrossRef] [Scilit]
- Lockie, R.G.; Murphy, A.J.; Spinks, C.D. Effects of resisted sled towing on sprint kinematics in field-sport athletes. J. Strength. Cond. Res. 2003, 17, 760–767. [Google Scholar] [CrossRef]
- Anvari, F.; Lakens, D. Using anchor-based methods to determine the smallest effect size of interest. J. Exp. Soc. Psychol. 2021, 96, 104159. [Google Scholar] [CrossRef] [Scilit]
- Mesquida, C.; Murphy, J.; Lakens, D.; Warne, J. Replication concerns in sports and exercise science: A narrative review of selected methodological issues in the field. R. Soc. Open Sci. 2022, 9, 220946. [Google Scholar] [CrossRef] [Scilit]
- Cook, J.A.; Julious, S.A.; Sones, W.; Hampson, L.V.; Hewitt, C.; Berlin, J.A.; Ashby, D.; Emsley, R.; Fergusson, D.A.; Walters, S.J.; et al. DELTA(2) guidance on choosing the target difference and undertaking and reporting the sample size calculation for a randomised controlled trial. BMJ 2018, 363, k3750. [Google Scholar] [CrossRef] [Scilit]
- Hedges, L.V. Distribution Theory for Glass’s Estimator of Effect size and Related Estimators. J. Edu Stat. 1981, 6, 107–128. [Google Scholar] [CrossRef] [Scilit]
- Harrell, E. How 1% performance improvements led to Olympic gold. Harv. Bus. Rev. 2015, 30, 1–7. [Google Scholar]
- Loturco, I.; Winckler, C.; Kobal, R.; Cal Abad, C.C.; Kitamura, K.; Veríssimo, A.W.; Pereira, L.A.; Nakamura, F.Y. Performance changes and relationship between vertical jump measures and actual sprint performance in elite sprinters with visual impairment throughout a Parapan American games training season. Front. Physiol. 2015, 6, 323. [Google Scholar] [CrossRef] [Scilit] [PubMed]
- Hopkins, W.G. Competitive performance of elite track-and-field athletes: Variability and smallest worthwhile enhancements. Sportscience 2005, 9, 17–20. [Google Scholar]
- Abt, G.; Boreham, C.; Davison, G.; Jackson, R.; Jobson, S.; Wallace, E.; Williams, M. Sample size estimation revisited. J. Sports Sci. 2025, 43, 2511–2516. [Google Scholar] [CrossRef] [Scilit]
- Abt, G.; Boreham, C.; Davison, G.; Jackson, R.; Nevill, A.; Wallace, E.; Williams, M. Power, precision, and sample size estimation in sport and exercise science research. J. Sports Sci. 2020, 38, 1933–1935. [Google Scholar] [CrossRef] [Scilit]
- Lüdtke, O.; Robitzsch, A. ANCOVA versus change score for the analysis of two-wave data. J. Exp. Edu 2025, 93, 363–395. [Google Scholar] [CrossRef] [Scilit]
- Vickers, A.J.; Altman, D.G. Statistics notes: Analysing controlled trials with baseline and follow up measurements. BMJ 2001, 323, 1123–1124. [Google Scholar] [CrossRef] [Scilit] [PubMed]
- Pustejovsky, J.E.; Tipton, E. Corrigendum: Small Sample Methods for Cluster-Robust Variance Estimation and Hypothesis Testing in Fixed Effects Models. J. Bus. Econ. Stat. 2023, 41, 650–652. [Google Scholar] [CrossRef] [Scilit]
- Blanca, M.J.; Arnau, J.; Garcia-Castro, F.J.; Alarcon, R.; Bono, R. Repeated measures ANOVA and adjusted F-tests when sphericity is violated: Which procedure is best? Front. Psychol. 2023, 14, 1192453. [Google Scholar] [CrossRef] [Scilit]
- Hammerton, G.; Munafo, M.R. Causal inference with observational data: The need for triangulation of evidence. Psychol. Med. 2021, 51, 563–578. [Google Scholar] [CrossRef] [Scilit]
- Bates, D.; Mächler, M.; Bolker, B.; Walker, S. Fitting Linear Mixed-Effects Models Usinglme4. J. Stat. Softw. 2015, 67, 1–48. [Google Scholar] [CrossRef] [Scilit]
- Luke, S.G. Evaluating significance in linear mixed-effects models in R. Behav. Res. Methods 2017, 49, 1494–1502. [Google Scholar] [CrossRef] [Scilit] [PubMed]
- Lenth, R.V. emmeans: Estimated Marginal Means, aka Least-Squares Means. In (Version Latest) Comprehensive R Archive Network. 2024. Available online: https://cran.r-project.org/web/packages/emmeans/emmeans.pdf (accessed on 27 November 2025).
- Akritas, M.G. Nonparametric models for ANOVA and ANCOVA designs. In International Encyclopedia of Statistical Science; Lovric, M., Ed.; Springer: Berlin, Germany, 2025; pp. 1717–1723. [Google Scholar] [CrossRef] [Scilit]
- Mesquida, C.; Lakens, D. Is the effect large enough to matter? Why exercise physiologists should interpret effect sizes meaningfully: A reply to Williams et al. (2023). J. Physiol. 2024, 602, 241–242. [Google Scholar] [CrossRef] [Scilit]
- Murphy, J.; Caldwell, A.R.; Mesquida, C.; Ladell, A.J.M.; Encarnacion-Martinez, A.; Tual, A.; Denys, A.; Cameron, B.; Van Hooren, B.; Parr, B.; et al. Estimating the Replicability of Sports and Exercise Science Research. Sports Med. 2025, 55, 2659–2679. [Google Scholar] [CrossRef] [Scilit]
- Lüdecke, D.; Ben-Shachar, M.S.; Patil, I.; Waggoner, P.; Makowski, D. performance: An R package for assessment, comparison and testing of statistical models. J. Open Source Softw. 2021, 6, 3139. [Google Scholar] [CrossRef] [Scilit]
- Bartosz-Jeffries, M.; Loturco, I.; Zając, A.; Maszczyk, A.; Freitas, T.T.; Alcaraz, P.E.; Pereira, L.A.; Gołaś, A. Neuromuscular and Performance Responses to Resisted Sprint Loads in Elite Female Sprinters. Sports 2025, 13, 327. [Google Scholar] [CrossRef] [Scilit] [PubMed]
- Sidebotham, D.; Barlow, C.J. The winner’s curse: Why large effect sizes in discovery trials always get smaller and often disappear completely. Anaesthesia 2024, 79, 86–90. [Google Scholar] [CrossRef] [Scilit]
- van Assen, M.A.; van Aert, R.C.; Wicherts, J.M. Meta-analysis using effect size distributions of only statistically significant studies. Psychol. Methods 2015, 20, 293–309. [Google Scholar] [CrossRef] [Scilit]
- van Zwet, E.W.; Cator, E.A. The significance filter, the winner’s curse and the need to shrink. Stat. Neerl. 2021, 75, 437–452. [Google Scholar] [CrossRef] [Scilit]
- Yang, Y.; Sanchez-Tojar, A.; O’Dea, R.E.; Noble, D.W.A.; Koricheva, J.; Jennions, M.D.; Parker, T.H.; Lagisz, M.; Nakagawa, S. Publication bias impacts on effect size, statistical power, and magnitude (Type M) and sign (Type S) errors in ecology and evolutionary biology. BMC Biol. 2023, 21, 71. [Google Scholar] [CrossRef] [Scilit] [PubMed]
- Borg, D.N.; Bach, A.J.E.; O’Brien, J.L.; Sainani, K.L. Calculating sample size for reliability studies. PMR 2022, 14, 1018–1025. [Google Scholar] [CrossRef] [Scilit]
- Borg, D.N.; Barnett, A.G.; Caldwell, A.R.; White, N.M.; Stewart, I.B. The bias for statistical significance in sport and exercise medicine. J. Sci. Med. Sport. 2023, 26, 164–168. [Google Scholar] [CrossRef] [Scilit] [PubMed]
- Mansournia, M.A.; Collins, G.S.; Nielsen, R.O.; Nazemipour, M.; Jewell, N.P.; Altman, D.G.; Campbell, M.J. A CHecklist for statistical Assessment of Medical Papers (the CHAMP statement): Explanation and elaboration. Br. J. Sports Med. 2021, 55, 1009–1017. [Google Scholar] [CrossRef] [Scilit]
- Parker, R.A.; Cook, J.A. The importance of clinical importance when determining the target difference in sample size calculations. Trials 2023, 24, 495. [Google Scholar] [CrossRef] [Scilit]
- Riesthuis, P. Simulation-Based Power Analyses for the Smallest Effect Size of Interest: A Confidence-Interval Approach for Minimum-Effect and Equivalence Testing. Adv. Meth Pr. Psychol. Sci. 2024, 7, 25152459241240722. [Google Scholar] [CrossRef] [Scilit]
- Silveira, L.; Ferreira, J.C.; Patino, C.M. Mixed-effects model: A useful statistical tool for longitudinal and cluster studies. J. Bras. Pneumol. 2023, 49, e20230137. [Google Scholar] [CrossRef] [Scilit]
- West, B.T.; Welch, K.B.; Galecki, A.T. Linear Mixed Models: A Practical Guide Using Statistical Software, 3rd ed.; Chapman and Hall/CRC: New York, NY, USA, 2022. [Google Scholar]
- Yu, Z.; Guindani, M.; Grieco, S.F.; Chen, L.; Holmes, T.C.; Xu, X. Beyond t test and ANOVA: Applications of mixed-effects models for more rigorous statistical analysis in neuroscience research. Neuron 2022, 110, 21–35. [Google Scholar] [CrossRef] [Scilit]
- Zhang, X.; Hedeker, D. Detecting influential subjects in intensive longitudinal data using mixed-effects location scale models. BMC Med. Res. Methodol. 2023, 23, 237. [Google Scholar] [CrossRef] [Scilit]
- Jiang, S.; Arnold, S.E.; Betensky, R.A. Design and Analysis of N-Of-1 Trials That Incorporate Sequential Monitoring. Stat. Med. 2025, 44, e70177. [Google Scholar] [CrossRef] [Scilit]
- Harris, N.K.; Cronin, J.B.; Hopkins, W.G.; Hansen, K.T. Squat Jump Training at Maximal Power Loads vs. Heavy Loads: Effect on Sprint Ability. J. Strength. Cond. Res. 2008, 22, 1742–1749. [Google Scholar] [CrossRef] [Scilit] [PubMed]
- Swinton, P.A.; Burgess, K.; Hall, A.; Greig, L.; Psyllas, J.; Aspe, R.; Maughan, P.; Murphy, A. Interpreting magnitude of change in strength and conditioning: Effect size selection, threshold values and Bayesian updating. J. Sports Sci. 2022, 40, 2047–2054. [Google Scholar] [CrossRef] [Scilit]
- Whittle, R.; Ensor, J.; Archer, L.; Collins, G.S.; Dhiman, P.; Denniston, A.; Alderman, J.; Legha, A.; van Smeden, M.; Moons, K.G.; et al. Extended sample size calculations for evaluation of prediction models using a threshold for classification. BMC Med. Res. Methodol. 2025, 25, 170. [Google Scholar] [CrossRef] [Scilit] [PubMed]
- Winkler, P.W.; Horvath, A.; Senorski, E.H. Calculation of Statistical Power and Sample Size. In Orthopaedic Sports Medicine; Espregueira-Mendes, J., Karlsson, J., Musahl, V., Ayeni, O.R., Eds.; Springer International Publishing: New York, NY, USA, 2024; pp. 1–15. [Google Scholar] [CrossRef] [Scilit]
- Baumgartner, H.A.; Alessandroni, N.; Byers-Heinlein, K.; Frank, M.C.; Hamlin, J.K.; Soderstrom, M.; Voelkel, J.G.; Willer, R.; Yuen, F.; Coles, N.A. How to build up big team science: A practical guide for large-scale collaborations. R. Soc. Open Sci. 2023, 10, 230235. [Google Scholar] [CrossRef] [Scilit] [PubMed]
- Coles, N.A.; Hamlin, J.K.; Sullivan, L.L.; Parker, T.H.; Altschul, D. Build up big-team science. Nature 2022, 601, 505–507. [Google Scholar] [CrossRef] [Scilit]
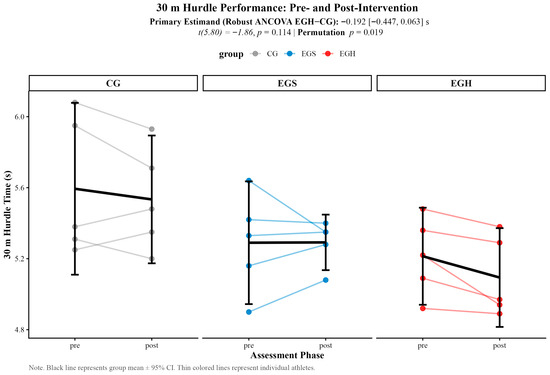
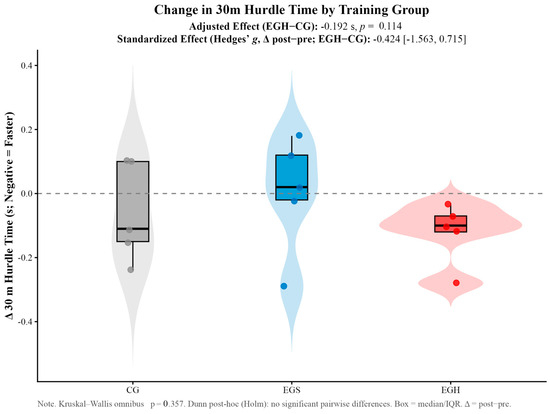
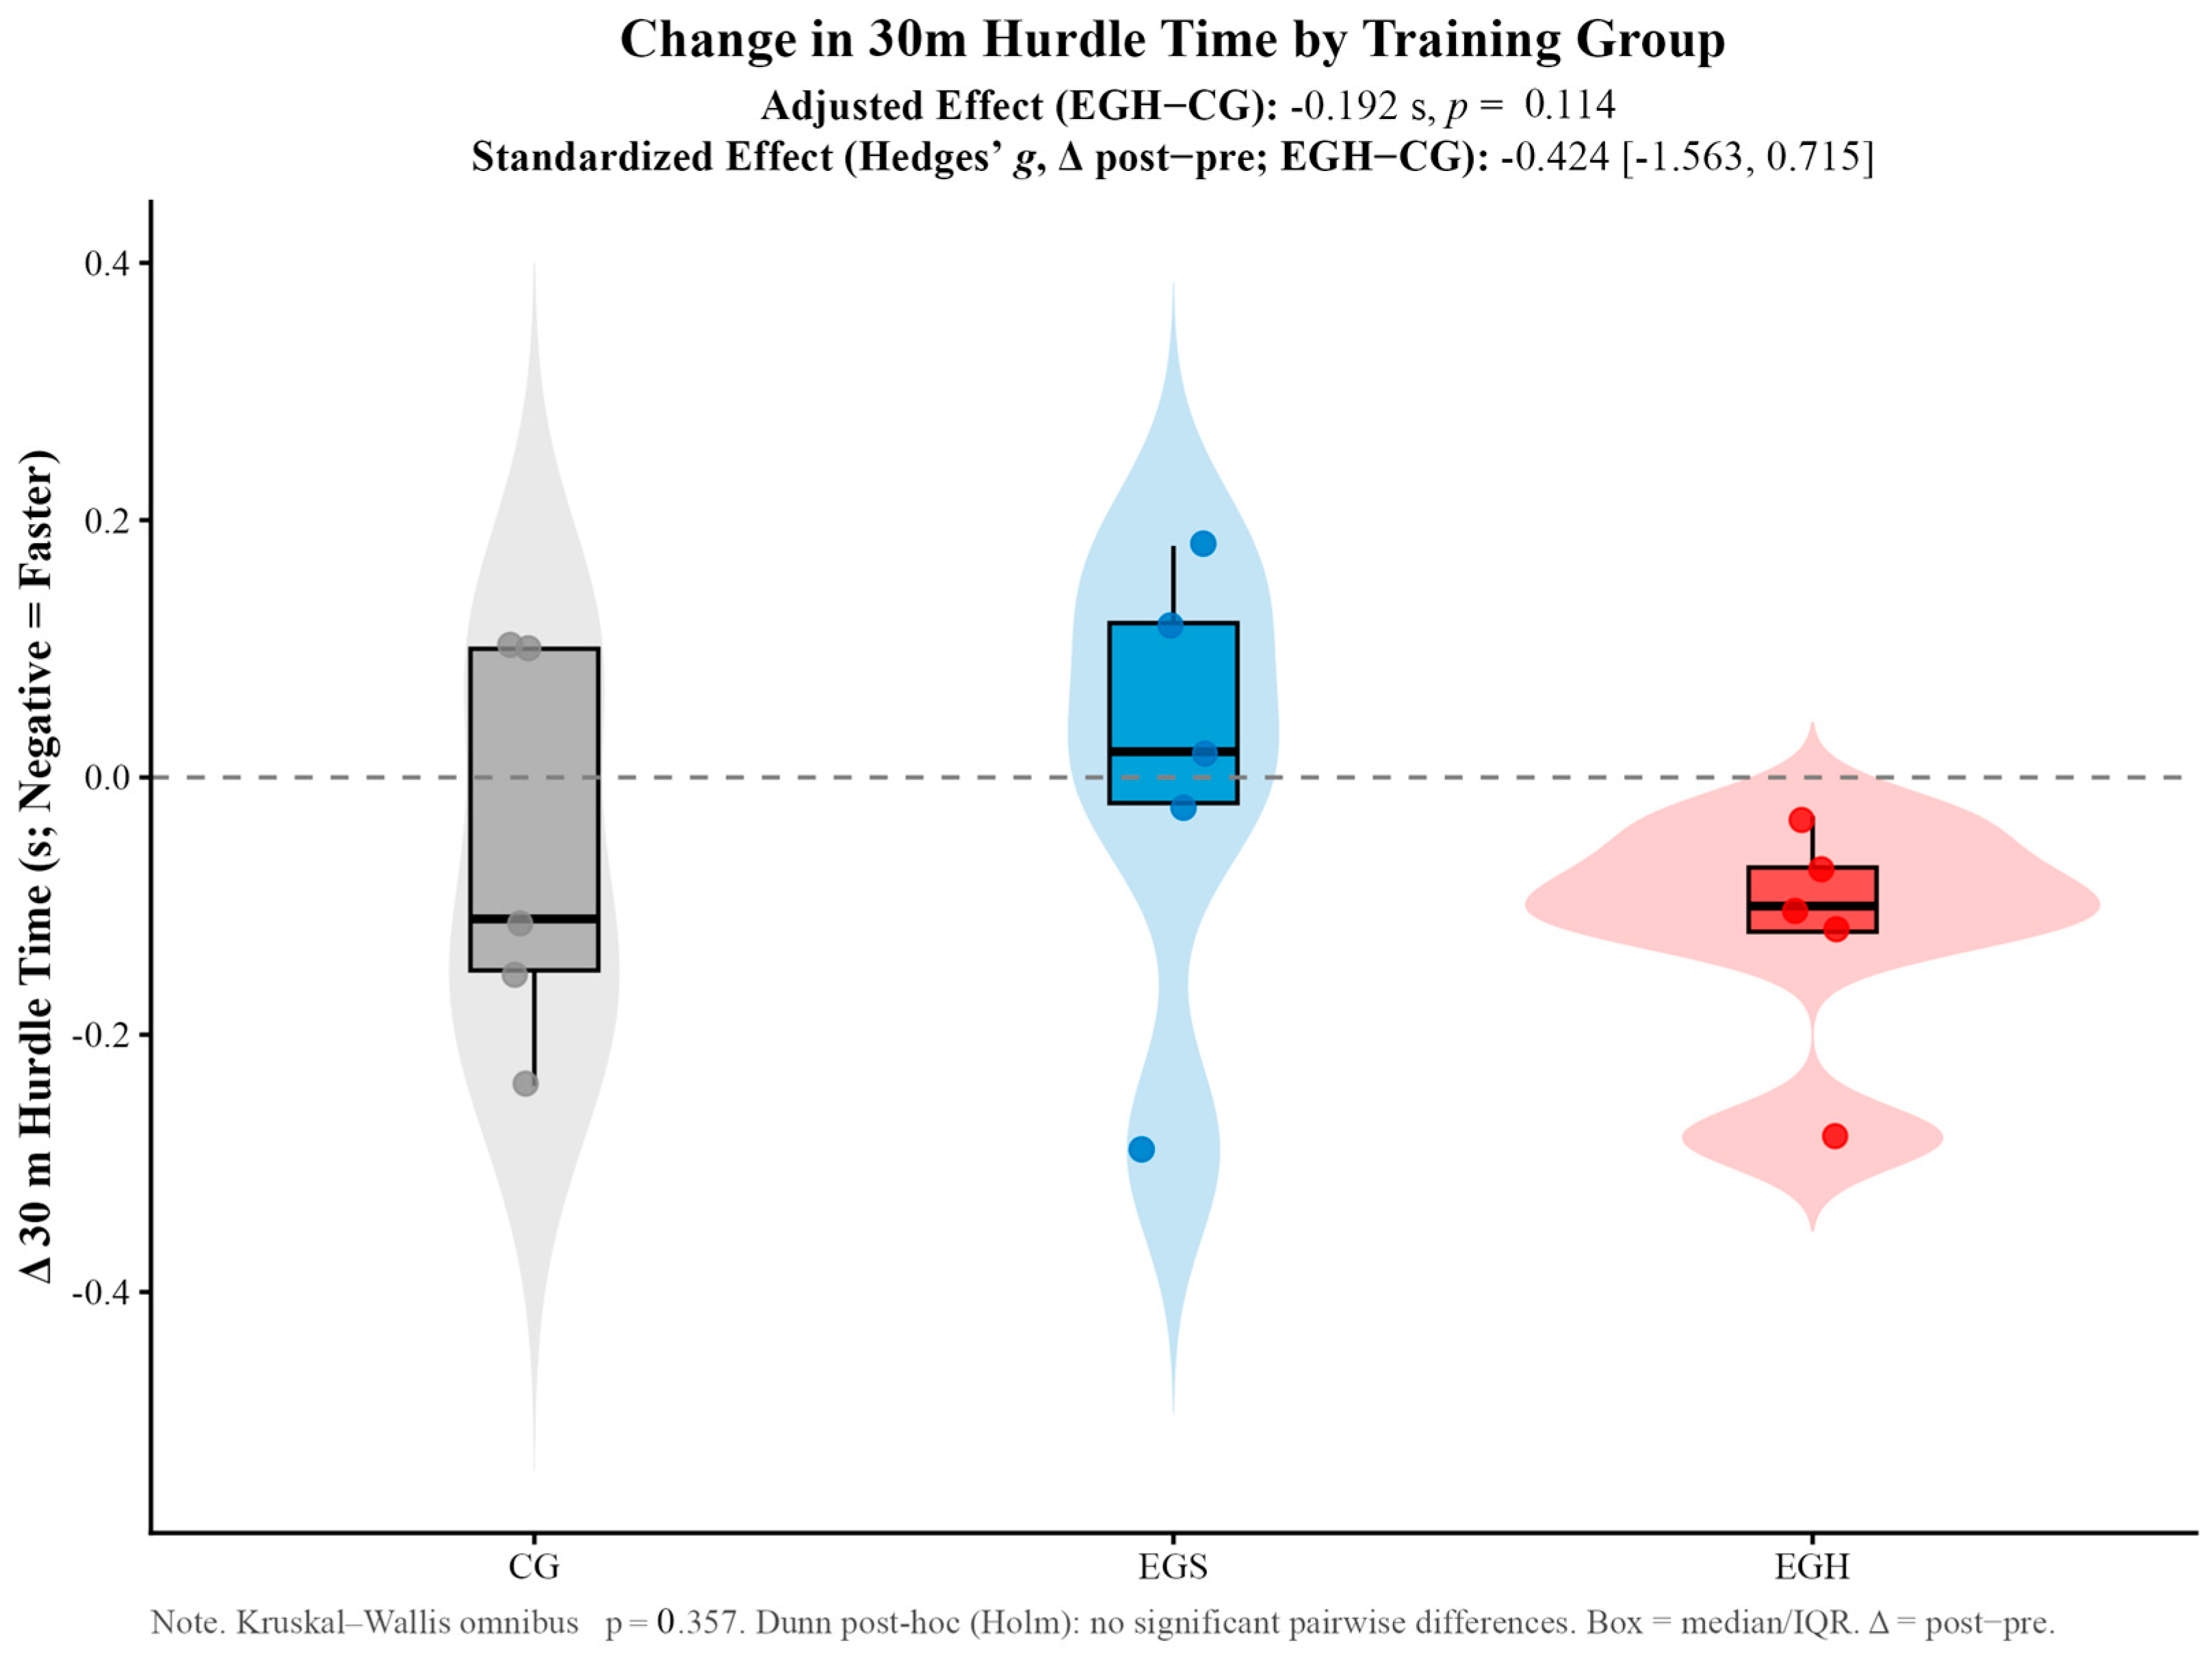
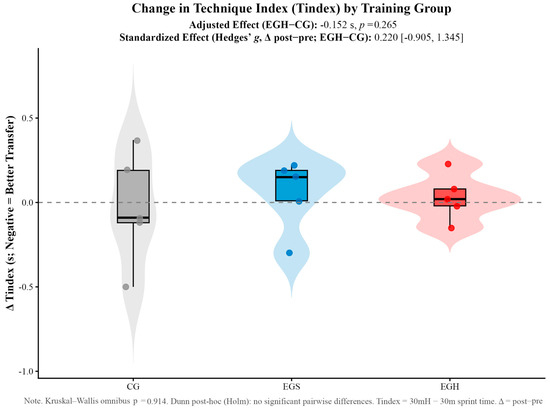
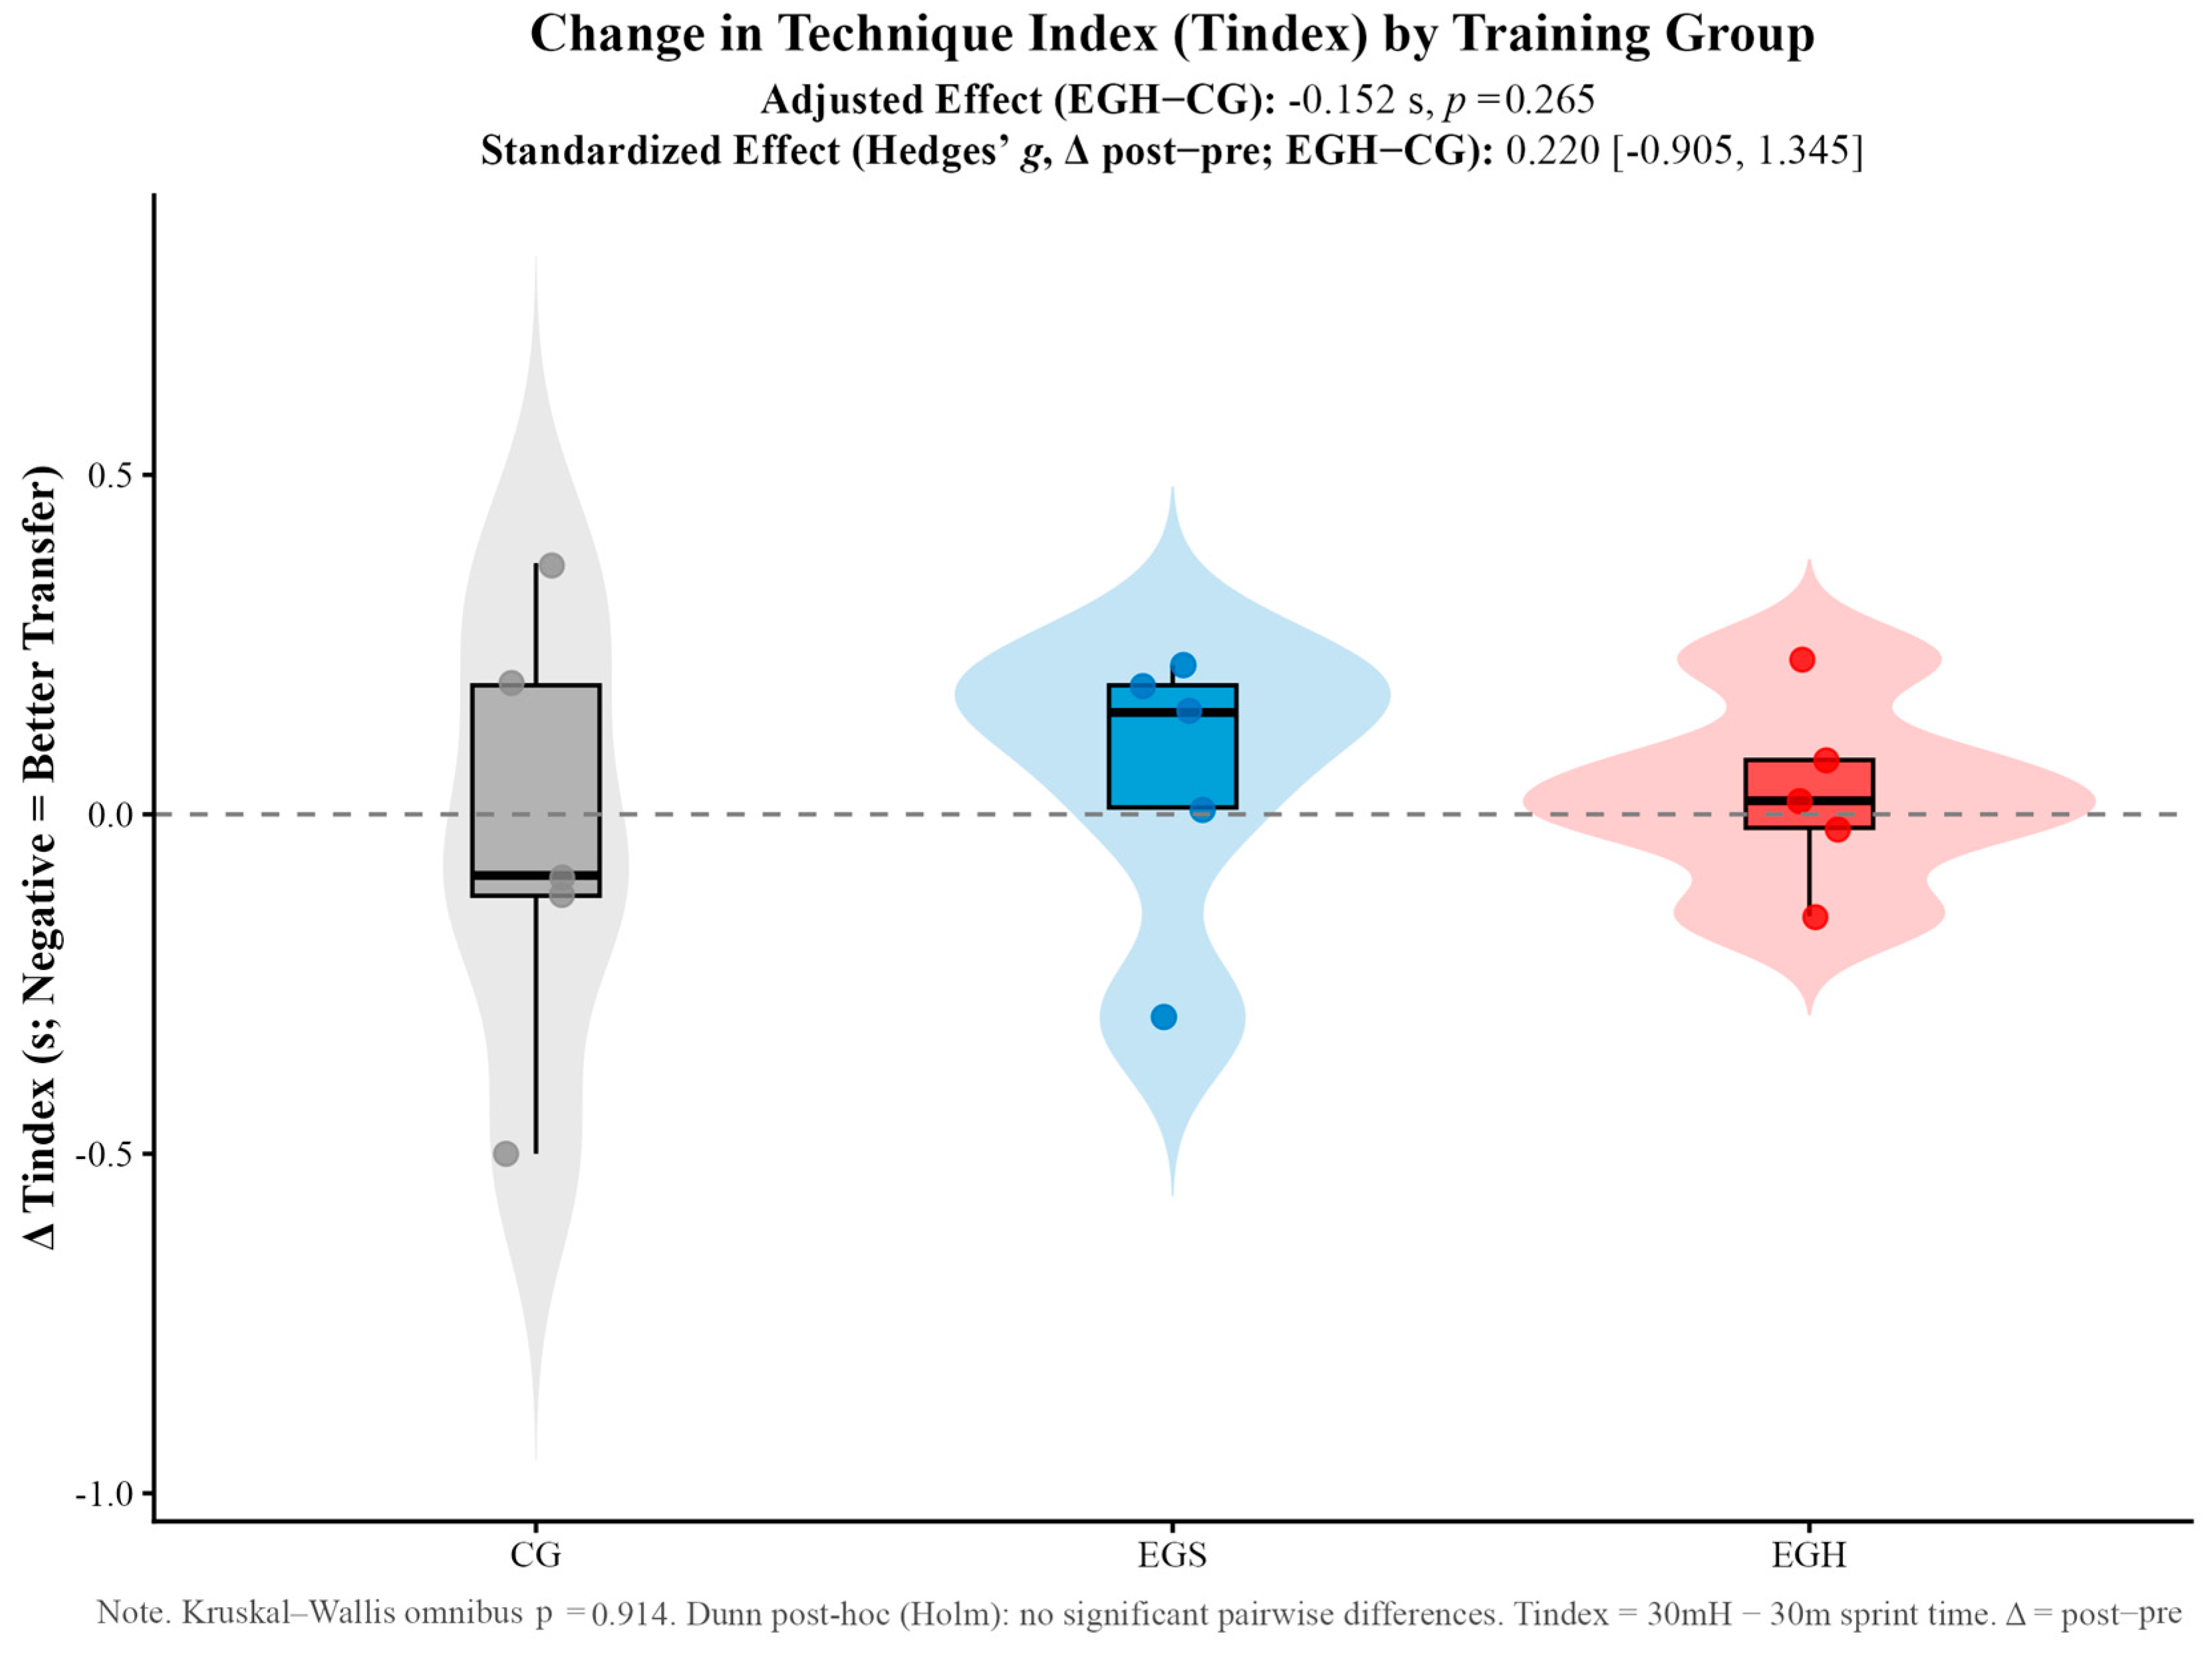

Disclaimer/Publisher’s Note: The statements, opinions and data contained in all publications are solely those of the individual author(s) and contributor(s) and not of MDPI and/or the editor(s). MDPI and/or the editor(s) disclaim responsibility for any injury to people or property resulting from any ideas, methods, instructions or products referred to in the content. |
© 2026 by the authors. Licensee MDPI, Basel, Switzerland. This article is an open access article distributed under the terms and conditions of the Creative Commons Attribution (CC BY) license.