


Abstract
Taste perception is known to be altered in microgravity, which can significantly impact astronauts’ food acceptance and overall dietary experience. This study examines the effects of microgravity and virtual reality (VR) on the sensory perception and overall liking of foods, specifically lemonade and vegetable soup, under controlled experimental conditions. The results indicate that overall liking for both products decreased significantly in microgravity, consistent with prior research on sensory suppression in space environments. However, VR demonstrated a compensatory effect, as overall liking scores in VR-enhanced microgravity stabilized and closely resembled those observed under normal gravity. This suggests that VR has the potential to mitigate the adverse effects of microgravity on taste perception, thereby improving food acceptability for astronauts. These findings underscore the necessity for further research into sensory modulation in altered-gravity environments, particularly for long-duration space missions. Future studies should explore VR-based interventions, adaptive food formulations, and multisensory integration strategies to optimize food palatability and acceptance in space.
1. Introduction
Microgravity refers to the near-zero gravity experienced by objects in free fall or orbit, and it is an important feature of space. In a microgravity environment, body fluids are redistributed, resulting in nasal congestion, changes in saliva flow, and reduced transmission of taste signals [1]. These changes affect astronauts’ sensory experience, especially taste and smell. Studies have shown that astronauts often report a loss of taste in food, especially sweet and salty tastes [2]. This can affect dietary satisfaction and mental health, and impair task performance [3]. Therefore, studying sensory changes associated with microgravity and identifying compensatory strategies are of great significance to space nutrition and sensory science. Importantly, this also creates a need for evaluation approaches that can reliably assess eating-related sensory perception under space-relevant conditions, so that potential countermeasures can be tested in a controlled and reproducible manner.
Microgravity has a notable influence on multiple aspects of human taste perception, leading to changes in both flavor intensity and overall sensory experience. One of the most frequently reported effects is a reduction in taste sensitivity. Astronauts often experience a reduction in taste sensitivity during space missions. This includes an increased threshold for detecting flavors such as monosodium glutamate (MSG) and capsaicin, meaning stronger concentrations are needed for these tastes to be perceived. Hence there is a tendency for astronauts to prefer spicier or umami-rich foods while in microgravity. This shift is likely a compensatory response to the reduced taste sensitivity, as stronger flavors are more easily detected [4]. Studies have shown that the intensity of retronasal aromas is significantly lower in a space-simulated environment compared to normal conditions leading to a weakened overall flavor experience and reduced eating enjoyment and microgravity also affects the perception of mouthfeel and oral texture. In simulated environments, the intensity of mouthfeel sensations was reported to be higher, suggesting that astronauts may perceive textures more intensely [5]. Microgravity can influence the physicochemical properties of saliva and the salivary microbiome. While salivary pH and flow rate may not change significantly, the composition of the salivary microbiome does, with an increase in oral disease-related bacteria and a decrease in health-related commensal bacteria. These changes can affect oral health and potentially influence taste perception [6]. Additional somatosensory modifications—including facial edema, tooth discomfort, and altered pain or temperature sensitivity—can further interfere with normal sensory processing during eating. Psychological factors add another layer to this complexity. The stress inherent to space missions has been linked to shortened duration and clarity of bitter, sour, and sweet taste sensations, indicating that both physiological and psychological mechanisms shape sensory alteration in microgravity [7]. Together, these multidimensional changes highlight the need for sensory evaluation frameworks that can capture not only isolated taste responses but also the broader eating experience under space-related conditions.
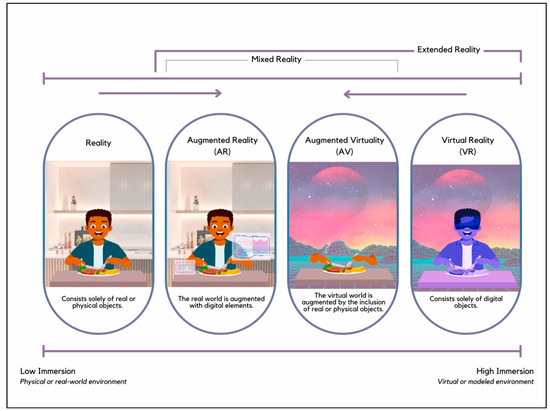
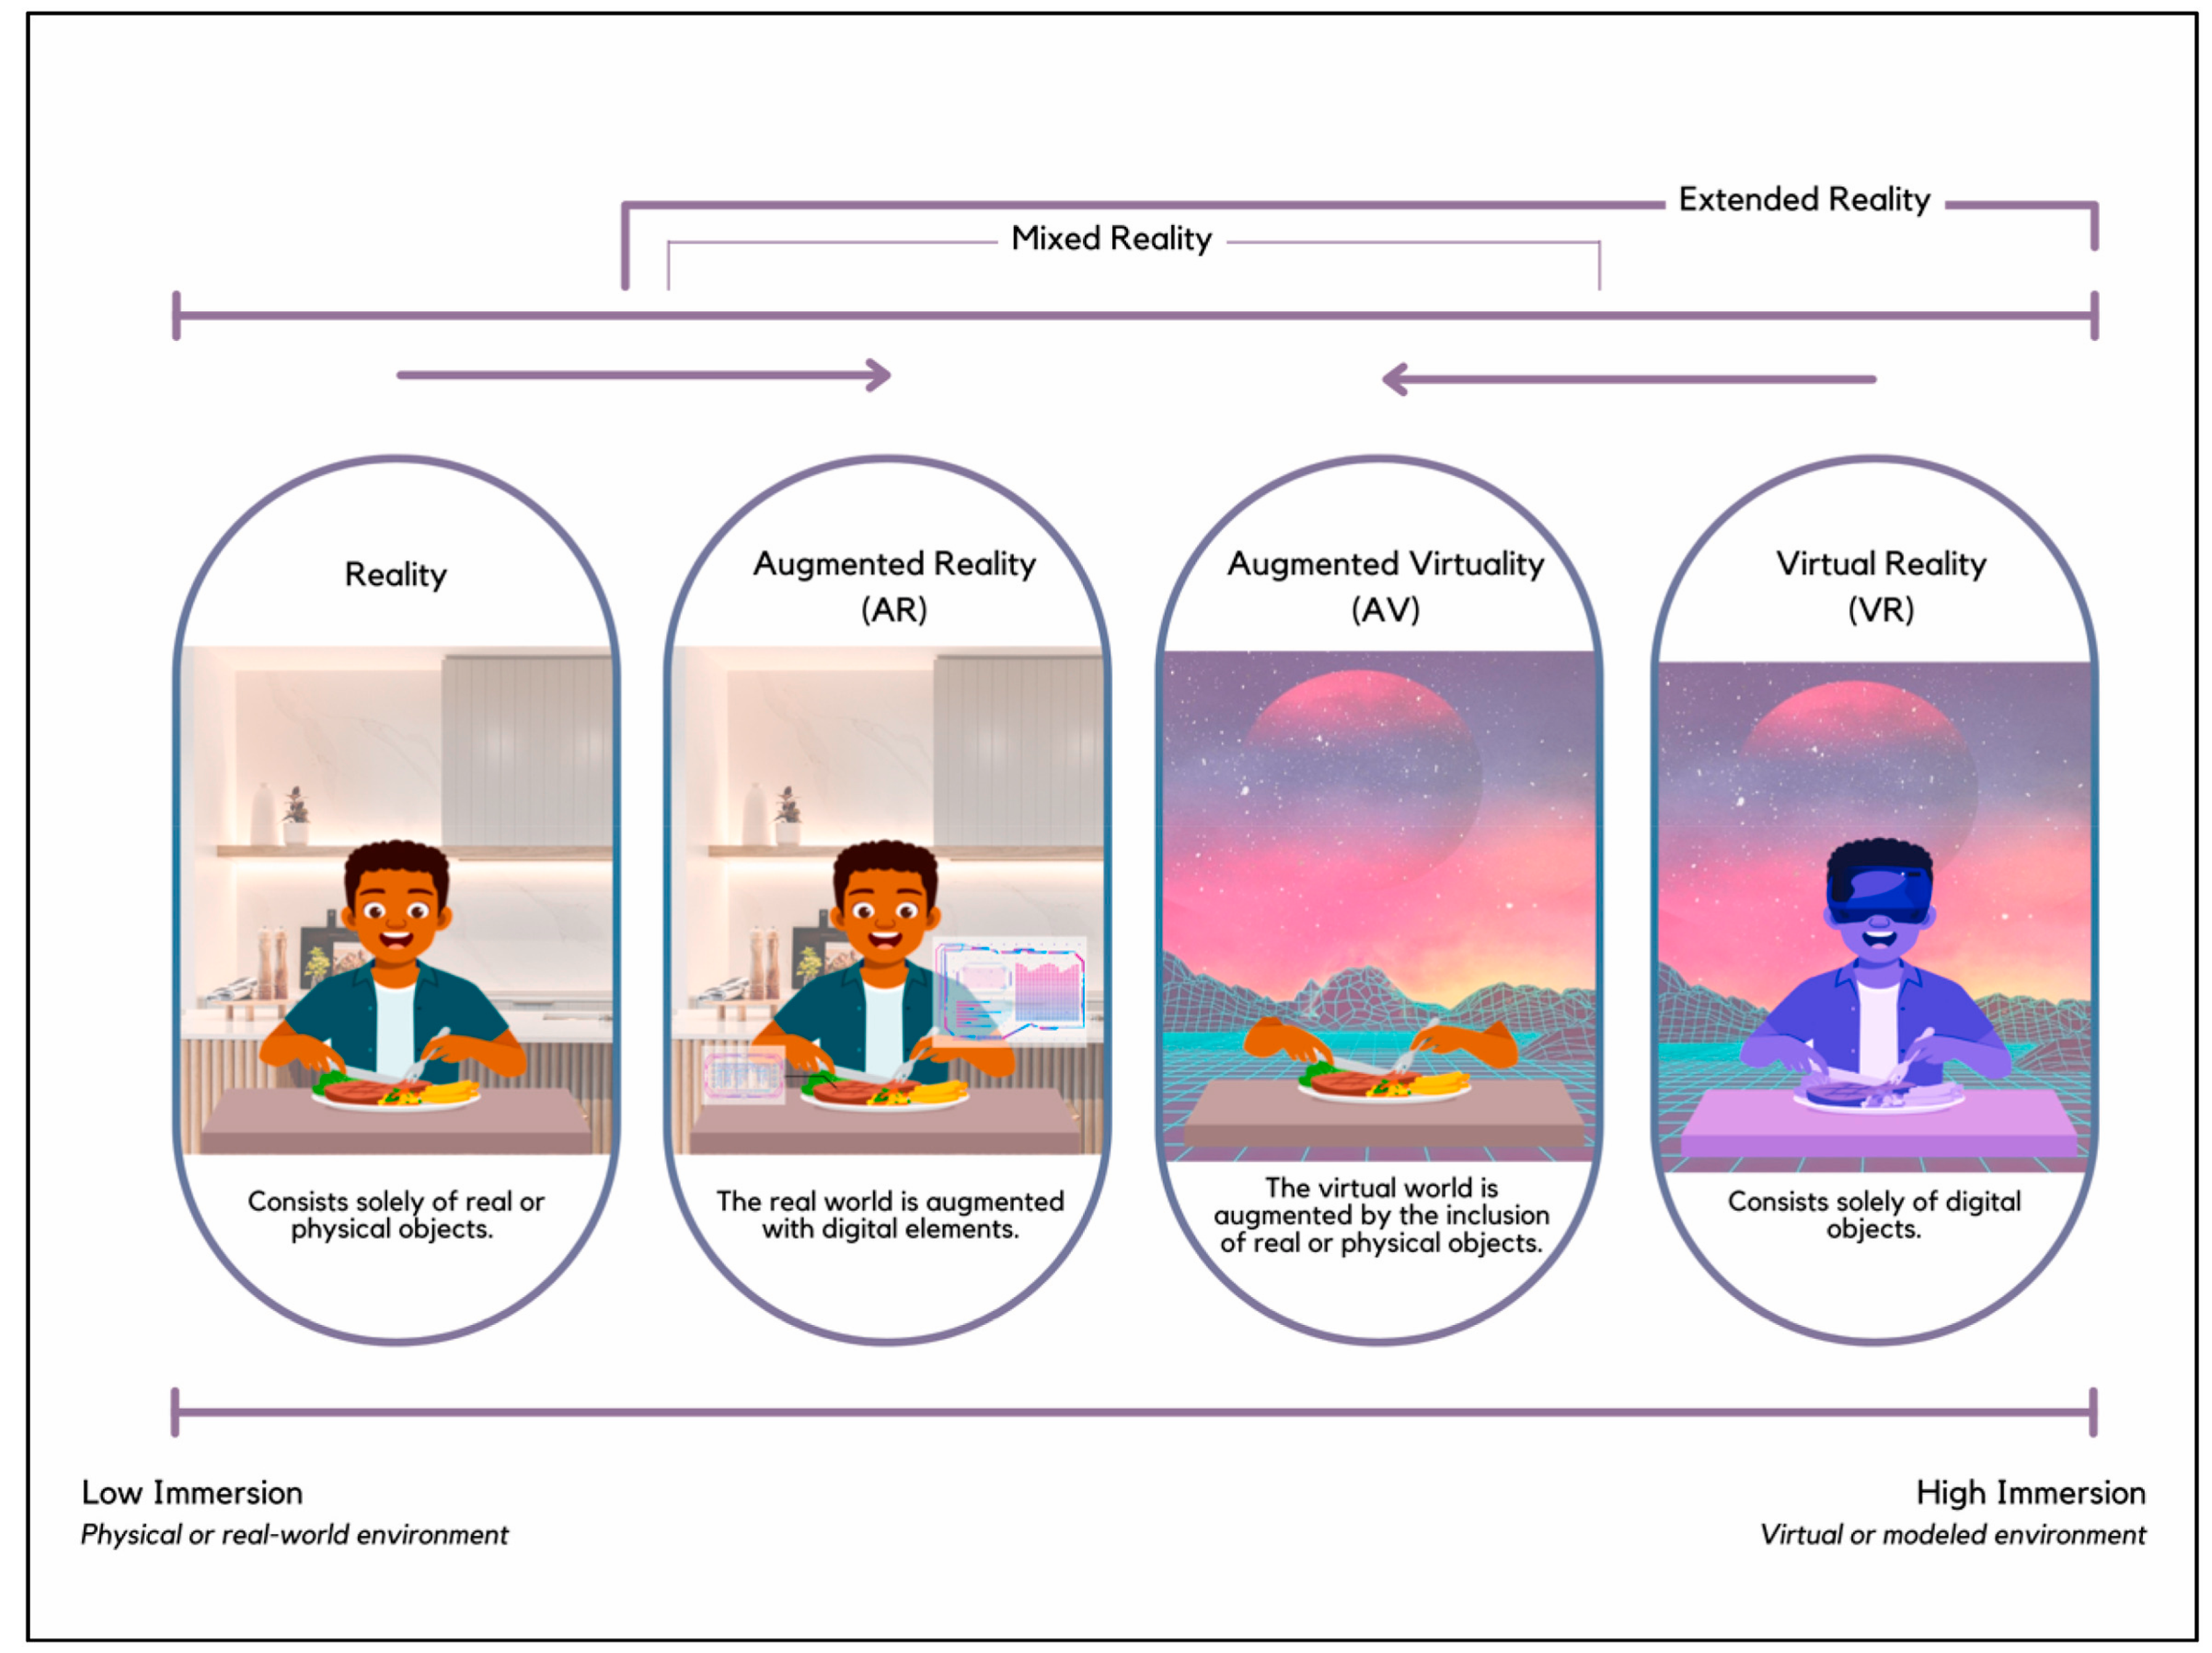
Sensory science studies how humans perceive external stimuli such as vision [8], smell [9], taste, touch, and hearing. It is used in food, cosmetics, and product design [10]. The main goal is to understand how sensory experiences affect consumer behaviors and preferences and then optimize products and product design. However, conventional sensory evaluation is typically performed in highly controlled laboratory environments, which may reduce ecological validity by removing important contextual cues associated with real consumption situations. This limitation is particularly relevant in food perception, as eating experiences are strongly influenced by environmental context, visual atmosphere, and situational immersion. Such constraints are even more pronounced when studying sensory perception in unusual or space-related settings that are difficult to recreate through traditional methods. In response to these limitations, a new tool for sensory science has been established by virtual reality (VR) recently. Real environments are simulated by VR and sensory stimuli are precisely controlled, allowing human perception to be explored under controlled conditions by researchers [11]. According to Milgram and Kishino’s (1993) “reality–virtuality continuum” [12,13], one end of the fully virtual environment is occupied by VR, while augmented reality (AR) and mixed reality (MR) are positioned between real and virtual shown in Figure 1.
Figure 1.
Illustration of Reality–Virtuality Continuum in a concept of sensory and consumer science inspired by Milgram and Kishino (Milgram and Kishino, 1993) [14].
Virtual reality (VR) provides immersive and controlled settings that enhance cross-modal integration and reduce bias, offering innovative opportunities for sensory research; although challenges such as limited olfactory simulation and individual variability persist, its methodological potential remains highly promising [15].
Other context-enriched approaches have also been used in sensory evaluation to improve ecological validity, including natural consumption environments, evoked or imagined contexts, physically recreated settings, and real-life eating situations such as restaurants and public dining areas [16,17,18]. Researchers have also manipulated contextual cues such as tableware, background sound, scent, temperature, and labeling information to better understand how environmental conditions shape sensory responses [19,20]. However, these approaches have mainly been applied to everyday consumption contexts and are less suitable for reproducing highly unusual settings such as space-related eating environments. In this respect, VR offers a particular advantage because it can simulate immersive and otherwise inaccessible contexts while maintaining a high degree of experimental control. Under normal-gravity conditions, VR has been used to simulate eating scenarios and modulate taste perception [21,22]. Found that VR visual feedback can improve juice sweetness ratings. But in microgravity, the VR effect is more complicated. It can reduce sensory deprivation by simulating Earth dining, but microgravity position affect VR compensation by changing the vestibular-oral pathway [23].
This study compared three conditions (normal gravity, simulated microgravity, and simulated microgravity with VR) to examine how microgravity influences taste perception and to evaluate whether VR can compensate for potential sensory alterations. The aim was to determine the extent of taste perception changes under microgravity simulation and to assess the effectiveness of VR in mitigating these effects.
2. Materials and Methods
2.1. Participants
Participants were recruited using convenience sampling from the student population of the Hungarian University of Agriculture and Life Sciences (MATE). The sample included 25 participants, of which 64% were female and 36% were male with a mean age of 25.31 ± 2.98 (Table 1). Because sex differences were not a study objective, sex was not used as a recruitment factor. It is noteworthy that none of the participants had previous experience or exposure to virtual reality (VR). Detailed reporting of participant recruitment and characteristics is important in sensory research, as participant grouping may influence sensory and cognitive performance outcomes [24]. Before starting the experiment, the researchers explained the purpose of the study in detail to the participants to ensure that they clearly understood the methods and the use of the VR headset. The participants provided informed consent through the statement “I understand the above information and voluntarily consent to participate in the study described above. Note: Based on GDPR policies, all the personal data collected are used for academic purposes and will not be released elsewhere or made accessible to a third party”. Importantly, the participants had the right to withdraw from the experiment at any time, and they were not obliged to provide a reason if they felt uncomfortable. The study was conducted in accordance with the Declaration of Helsinki, and the protocol was approved by an internal ethics committee of MATE IFST (approval number: MATE-BC/104-1/2025).
Table 1.
Demographic Table for Participants.
2.2. Sample Description and Preparation
Two product categories were evaluated in this study: vegetable soup and lemonade. For each category, four formulations were prepared, resulting in a total of eight samples per session. The formulations were designed to vary the intensity of key taste attributes while maintaining standardized preparation across experimental conditions.
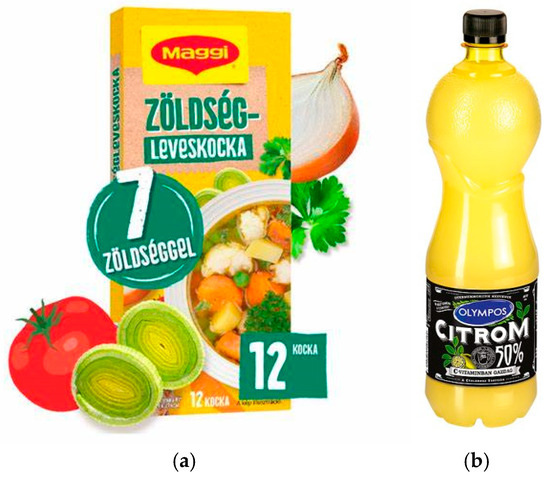
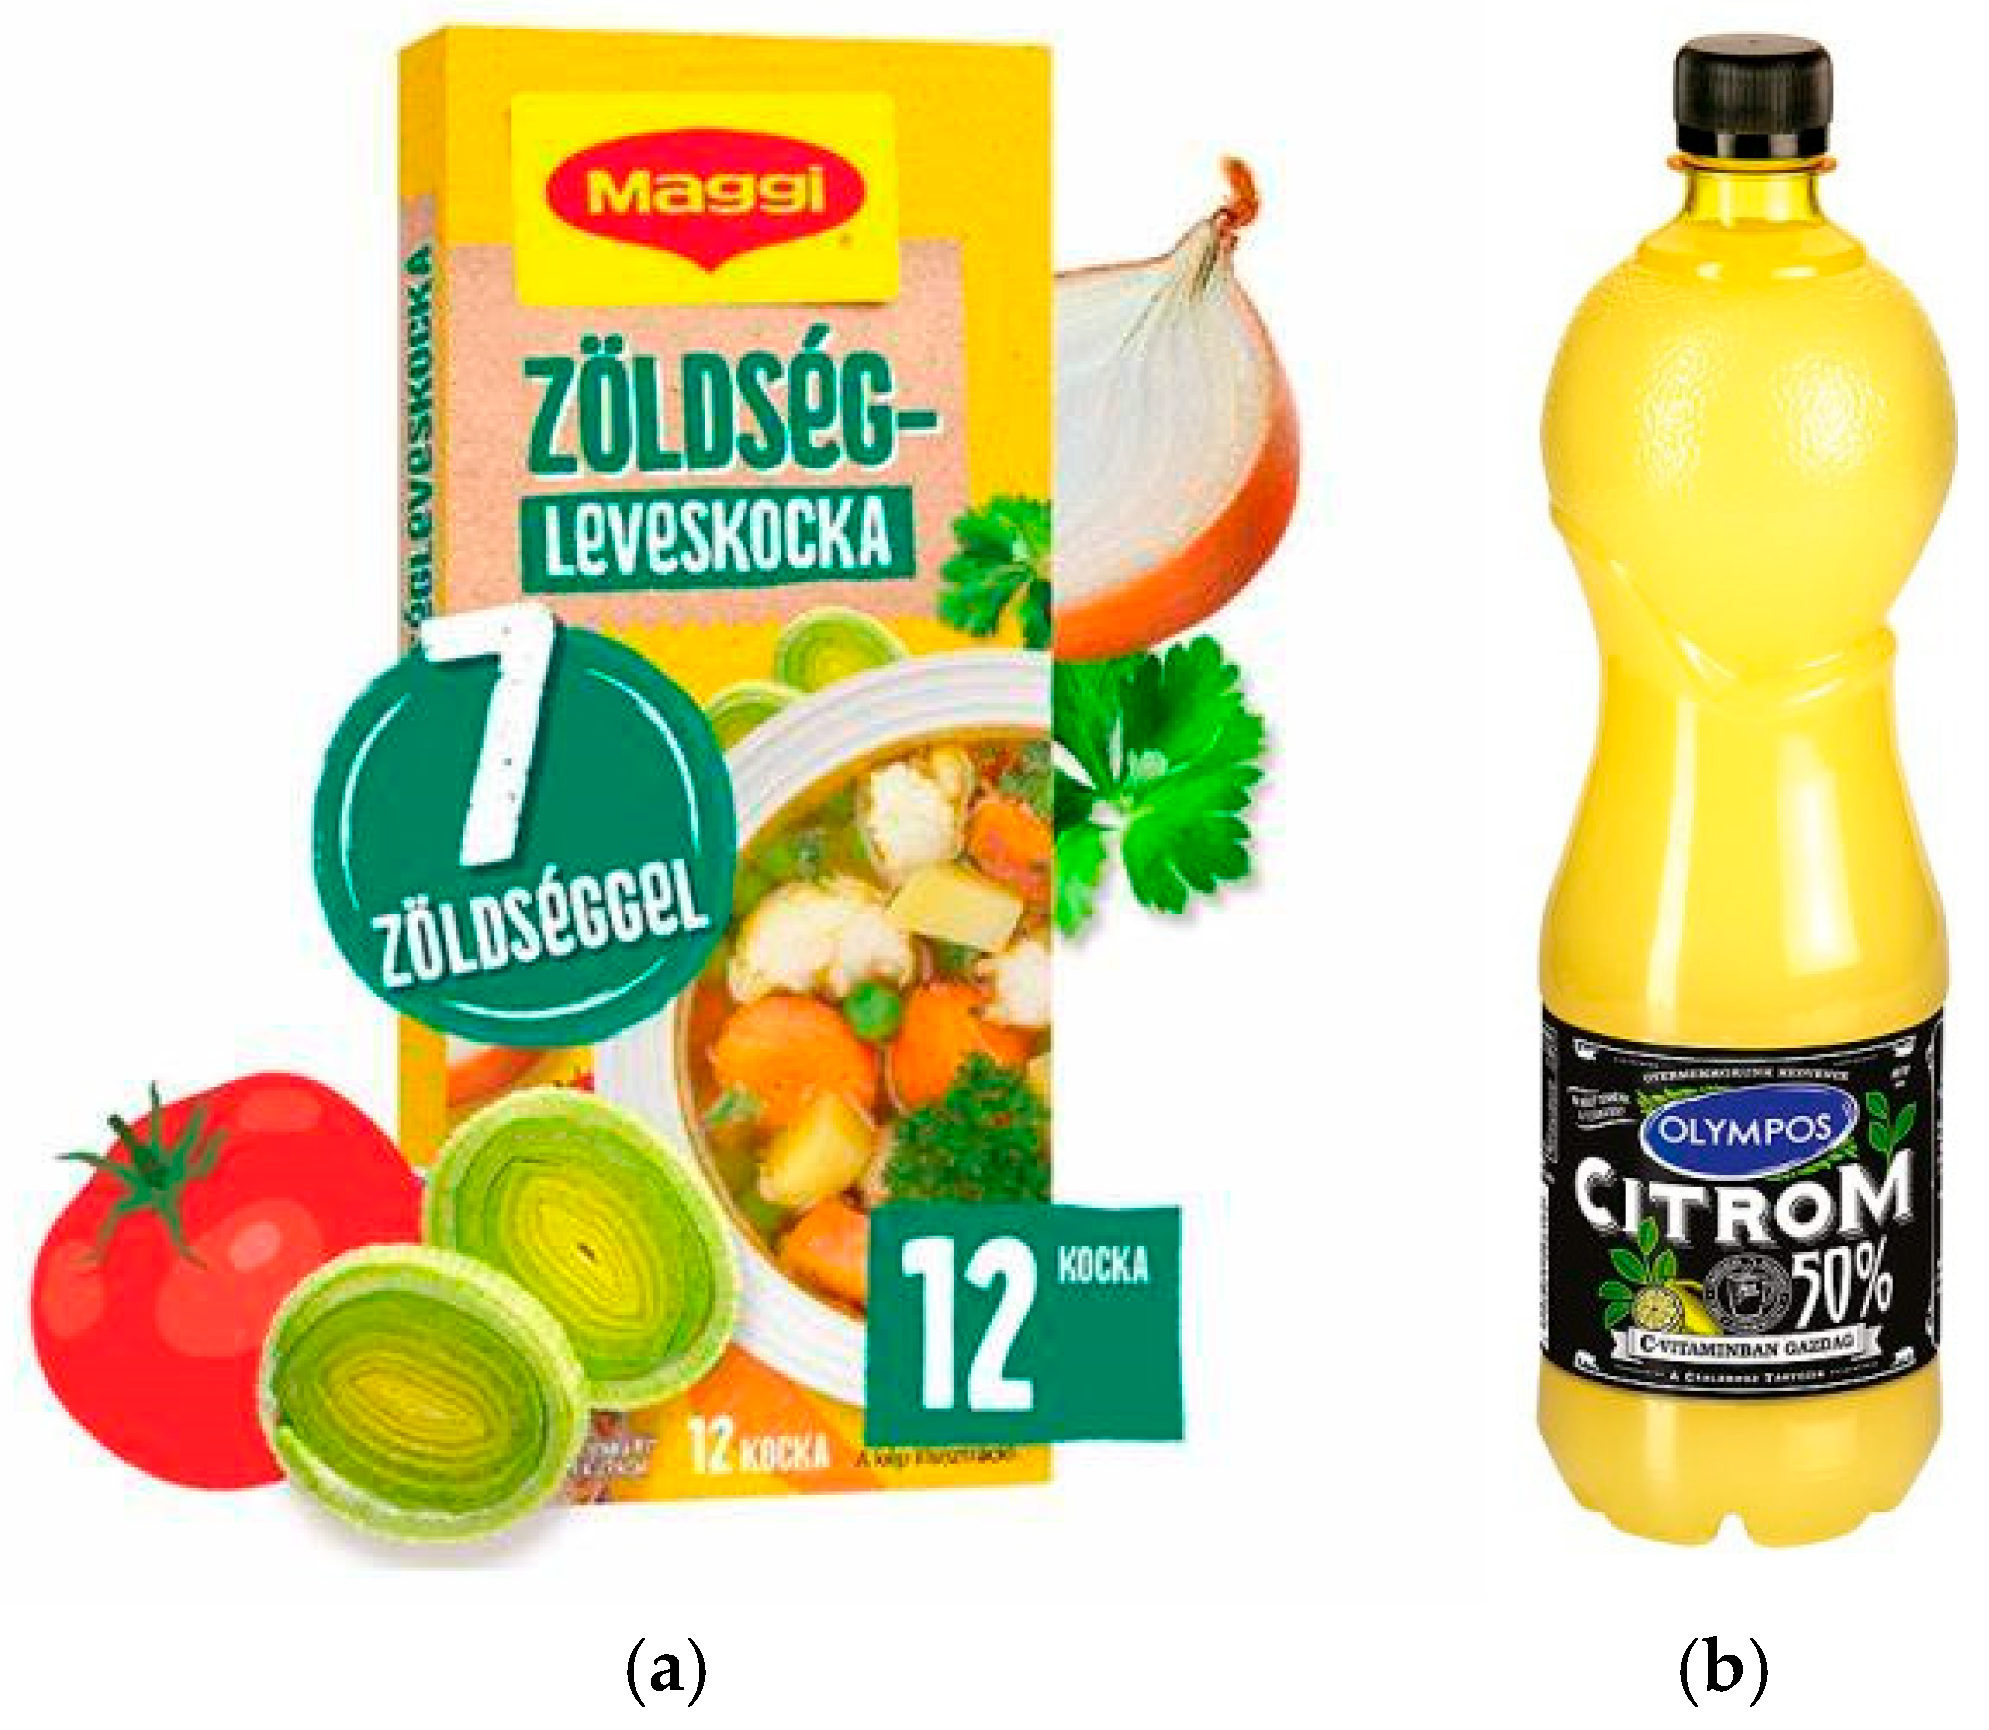
The vegetable soup samples were prepared using the Maggi Zöldség-Leveskocka (Maggi vegetable soup cubes; Nestlé, Vevey, Switzerland) shown in Figure 2a. Four soup formulations were prepared: Control (1:1), Salty (1:2 Salt; Kotányi Hungária Kft., Törökbálint, Hungary), Umami(1:2 MSG;AJI-NO-MOTO® umami seasoning, Tokyo, Japan), and Intense (2:2). Each soup was freshly prepared on the day of testing by dissolving the specified ingredients in water according to Figure 2. Soup samples were served in 50 mL portions, and the serving temperature was measured immediately before presentation; samples were served warm at 60–71 °C.
Figure 2.
Maggi Zöldség-Leveskocka (a) (vegetable soup cube) and Olympus Citrom 50% (b) (lemon juice) used in the sensory analysis experiment. The vegetable soup cube, containing a blend of seven vegetables, was used to prepare standardized soup samples, while the lemon juice was used to create lemonade, a citrus-based beverage made from lemon juice, water, and sugar. Both products ensured consistency in taste intensity across experimental conditions.
The lemonade samples were prepared using Olympos lemon juice (50% lemon juice; Maspex Olympos Kft., Nyárlőrinc, Hungary) as the base ingredient showed in Figure 2b. Four lemonade formulations were prepared: Control (1:1), Sour (1:2 Citric Acid), Sweet (1:2 Sugar; Diamant Kristály Cukor, Pfeifer & Langen GmbH & Co. KG, Cologne, Germany), and Intense (2:2). Each formulation was freshly prepared for each testing session according to Table 2. Lemonade samples were served in 50 mL portions, and the serving temperature was measured immediately before presentation; samples were served chilled at 5–10 °C.
Table 2.
Overall Liking of Vegetable Soup and Lemonade in Different Environments, p < 0.05 was considered statistically significant.
2.3. Environmental Contexts
The study encompassed three environmental settings, (1) Microgravity, (2) Microgravity + Virtual Reality (VR) and (3) Normal gravity, or control. All settings were chosen to replicate conditions experienced in space, specifically focusing on microgravity position and simulating the environment of space through VR technology.
2.3.1. Microgravity Position
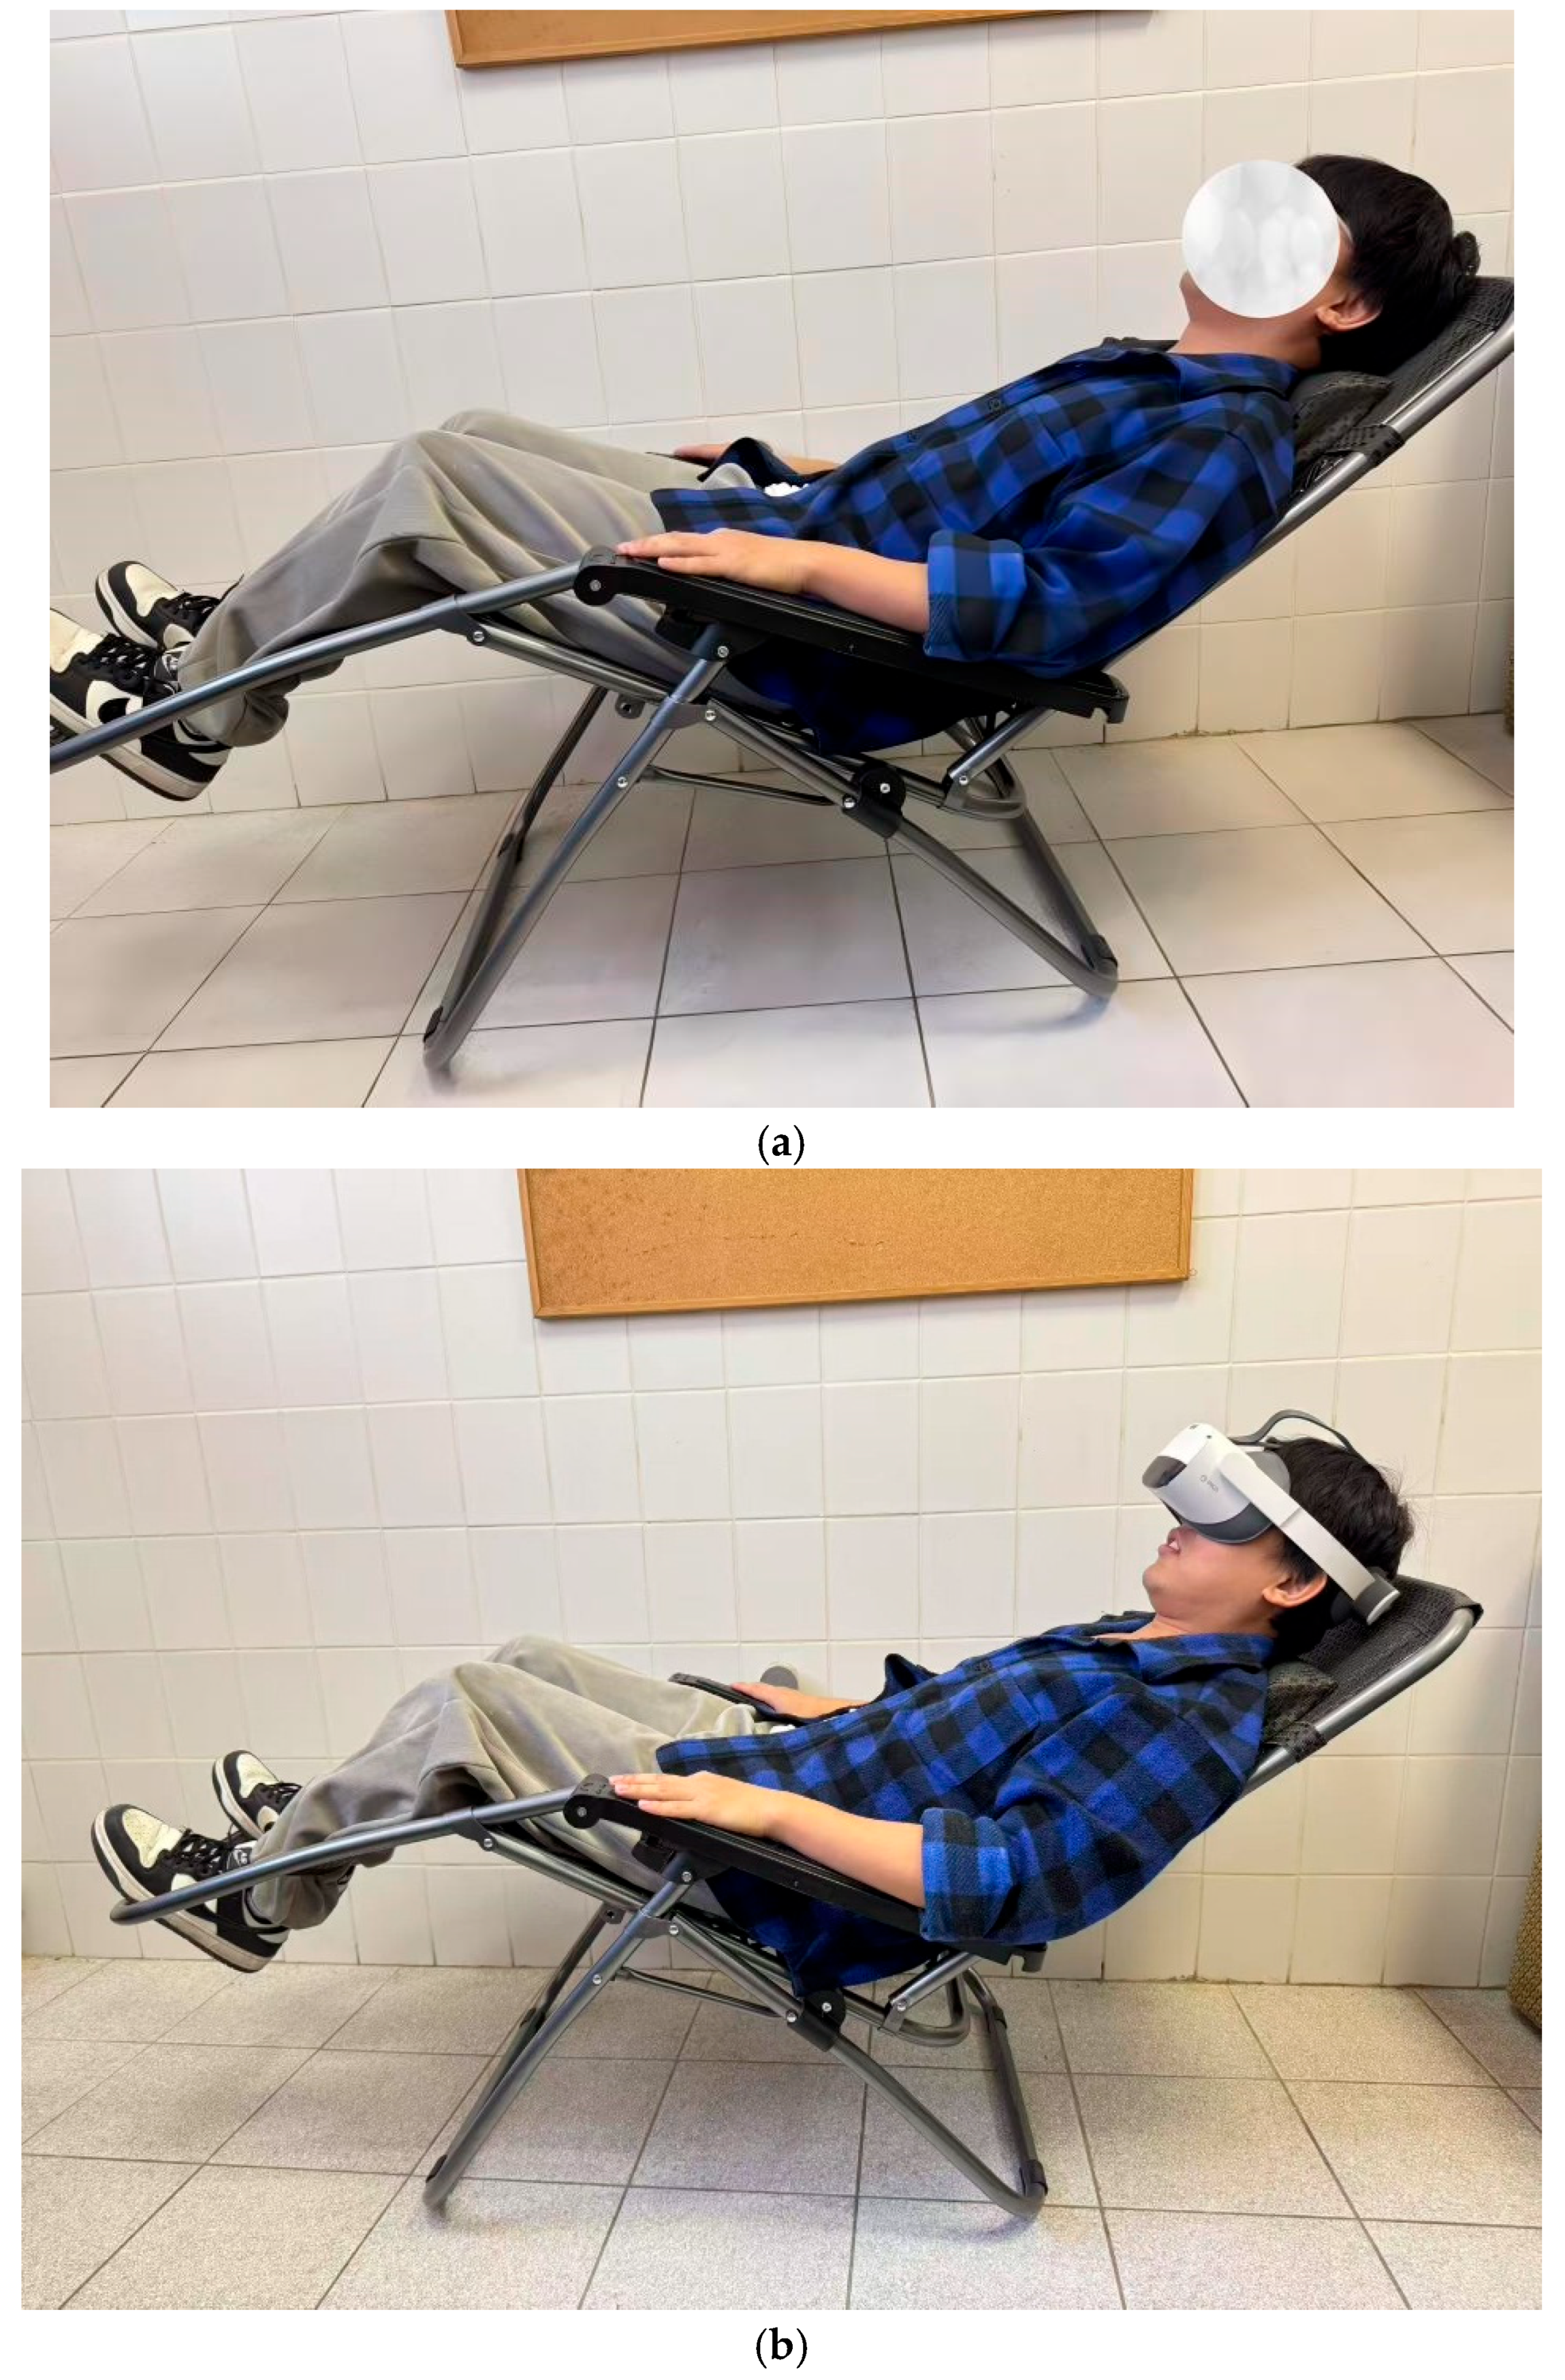
The Microgravity Position context presented within this study utilizes a commercially available ‘zero-gravity’ rocking chair (TIMELESS TOOLS, Budapest, Hungary). Measurements recorded in orbit by NASA astronauts have shown, in its most unstressed and relaxed state, the human body assumes a trunk-to-thigh angle of 128 degrees. This zero-gravity position was found to place the musculoskeletal system in its most rested condition as shown in Figure 3a. Specifically, this natural posture fosters a non-stressed muscle system, correctly aligned vertebrae, better breathing, improved digestion, and enhanced circulation [25].
Figure 3.
(a) Simulated Microgravity Position Using a Zero-Gravity Chair. (b) VR-Simulated Microgravity Condition Using a Zero-Gravity Chair.
2.3.2. Virtual Reality (VR)
A VR-space simulation was created by Pico 3neo pro headset (Pico, San Francisco, CA, United States) default background as shown in Figure 3b. The simulation was inspired by the universe, as it is the most prominent environment for studying microgravity [26]. To note, participants were not screened for prior VR experience during recruitment, as all individuals were given a tutorial on the VR environment, regardless of previous exposure.
2.3.3. Normal Gravity Control Context
In the normal gravity control condition, participants were seated in the sensory booth under standard terrestrial conditions, without wearing a VR headset. To ensure comparability with the microgravity and VR + microgravity conditions, samples were presented individually in the same type of cups and were consumed using a straw wherever feasible. Samples were presented at chin height, and participants evaluated each sample using the same questionnaire and rating scales as in the other conditions. The sample coding, presentation sequence, inter-sample interval, and mouth-rinsing procedure were kept consistent across all three environmental settings.
2.4. Experimental Protocol
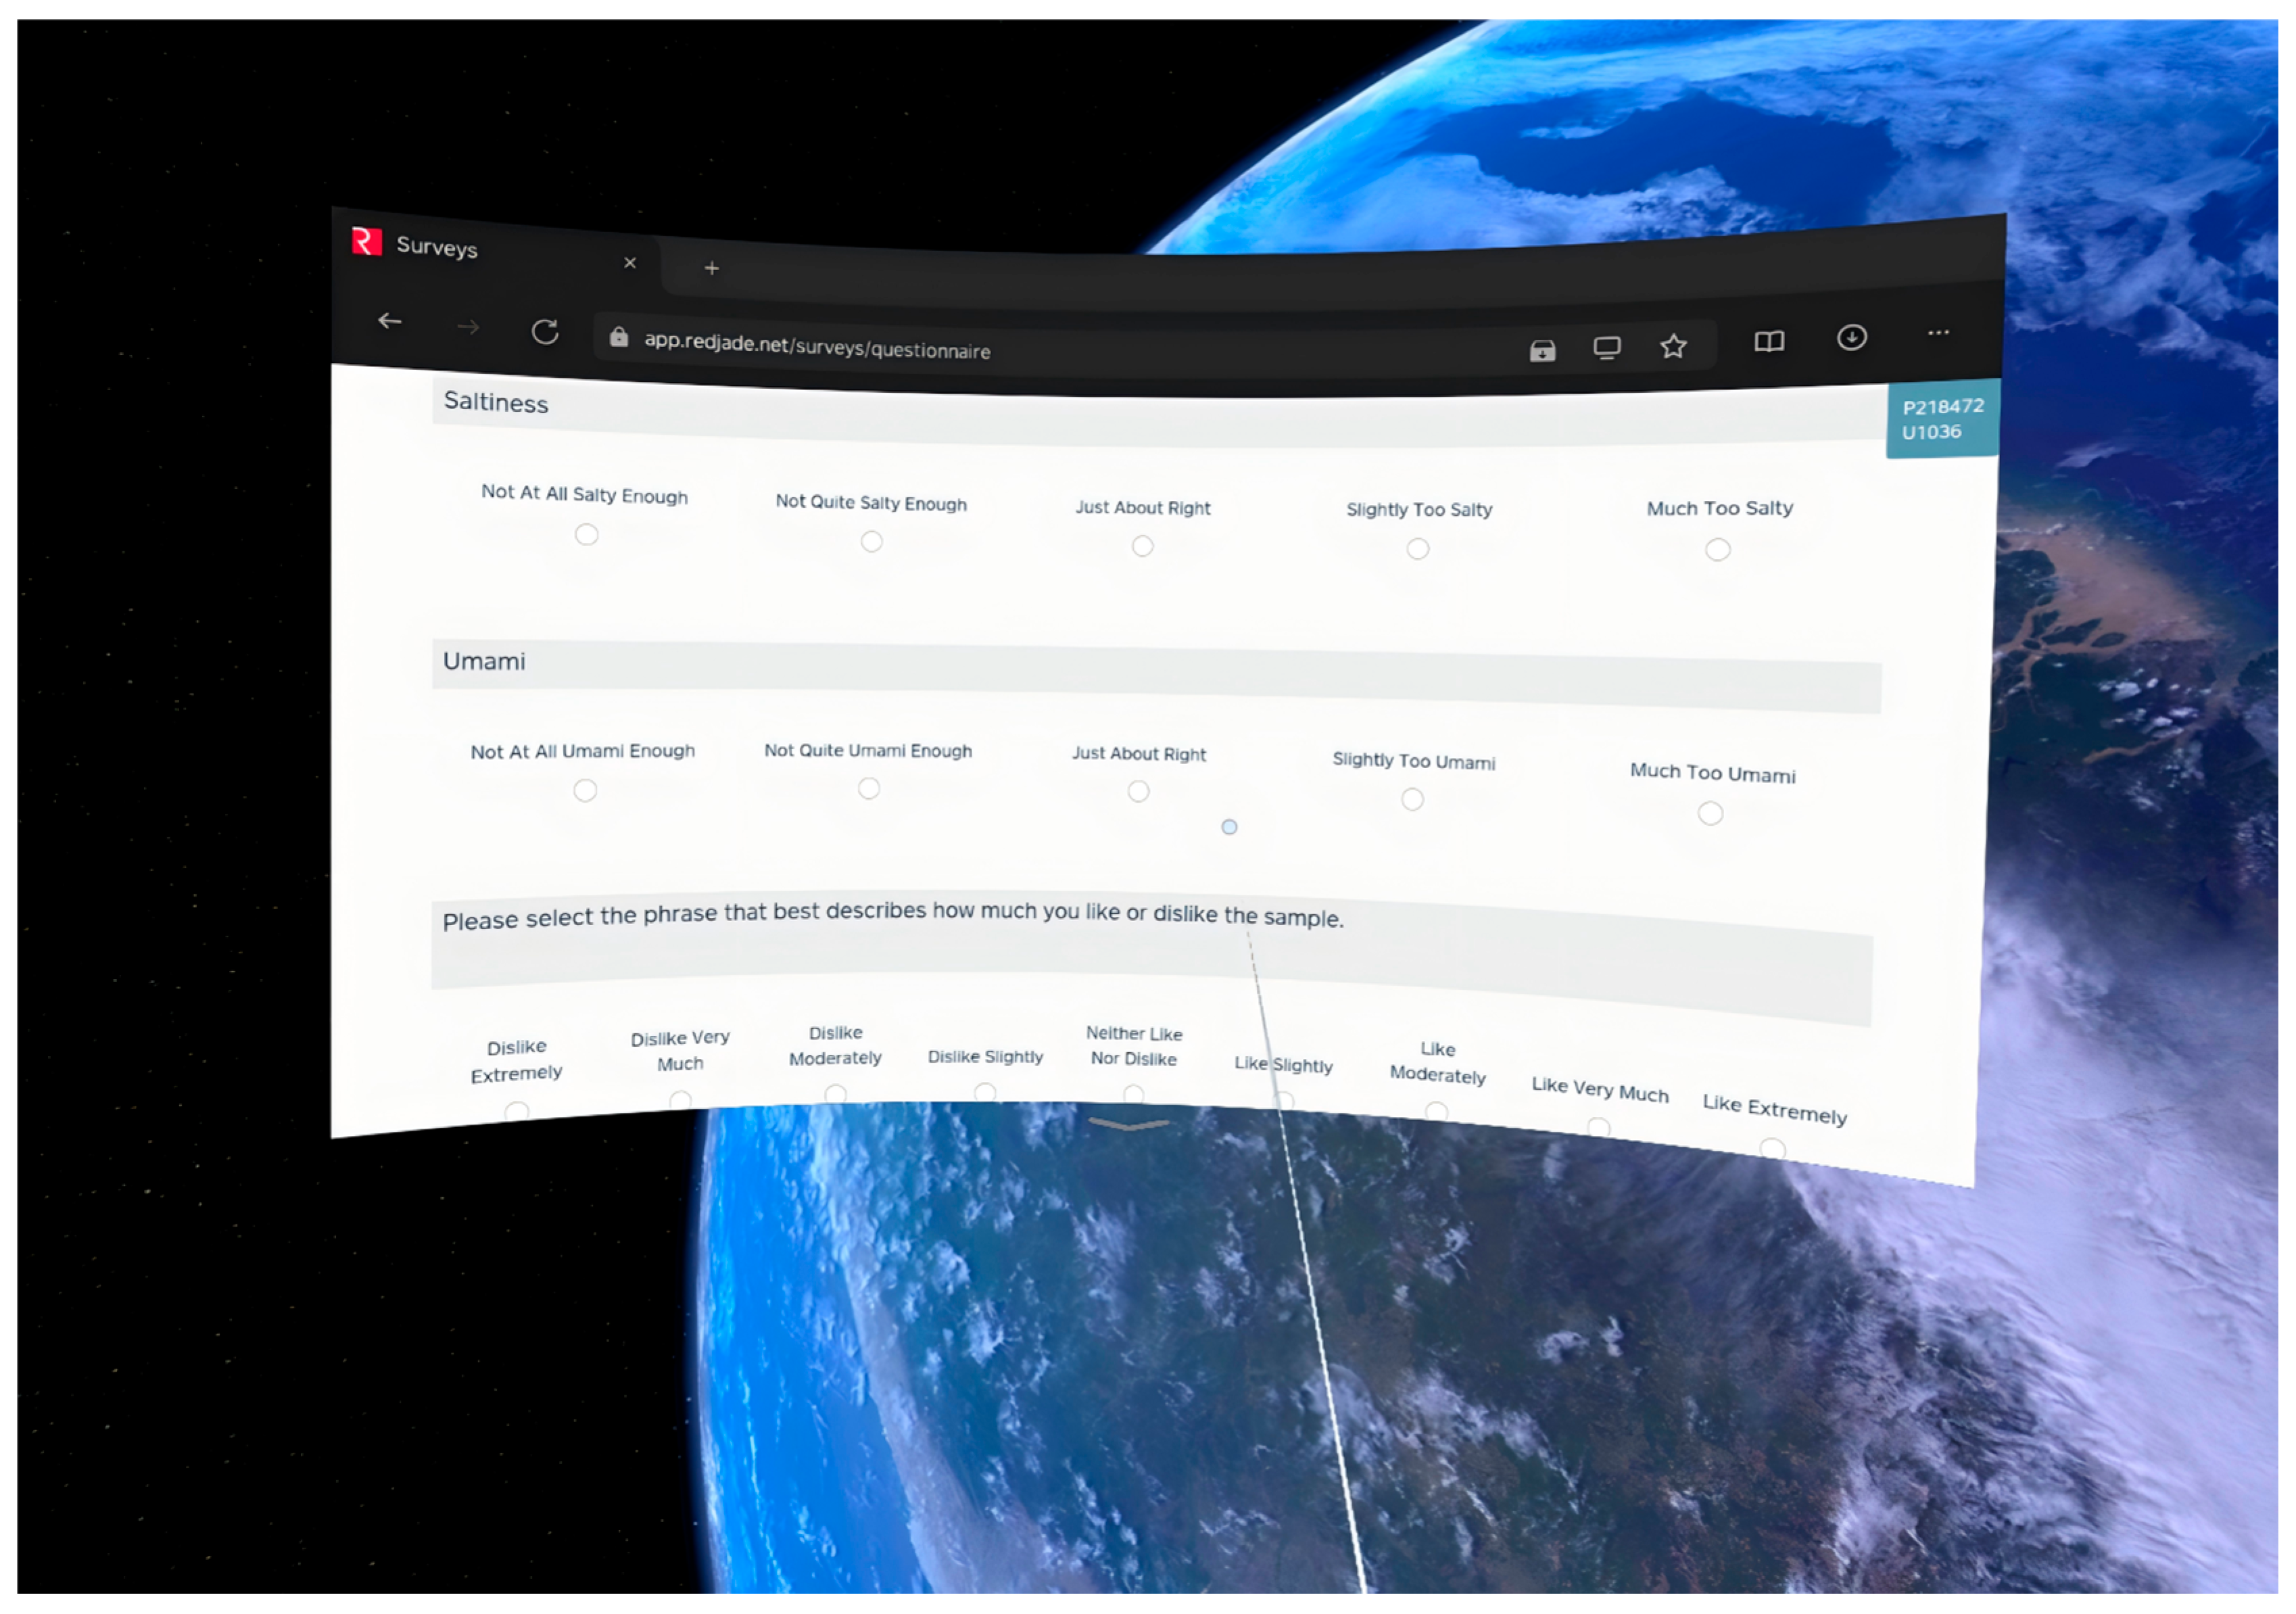
This study involved three experimental scenarios, each completed in a separate session with a one-week washout interval between sessions. First, participants were briefed on the aims of the study and the taste evaluation task. They then completed a demographic questionnaire and a 5-point Just-About-Right (JAR) questionnaire, rating saltiness and umami from “Too Salty/Umami” (1) to “Not enough Salty/Umami” (5). Overall liking was assessed using a 9-point hedonic scale ranging from “Dislike Extremely” (1) to “Like Extremely” (9). The experiment consisted of three conditions: normal, microgravity position, and VR + microgravity position. Participants evaluated vegetable soup and lemonade prepared according to different formulations. Control recipes (1:1) were formulated for both vegetable soup and lemonade, where “1:1” denotes the standard ratio of base ingredient to water. To reduce the likelihood of participants identifying the control samples, additional variations were prepared: Vegetable Soup Salty (1:2 Salt, increased saltiness), Vegetable Soup Umami (1:2 MSG, enhanced umami), Vegetable Soup Intense (2:2, overall stronger flavor), Lemonade Sour (1:2 citric acid, increased sourness), Lemonade Sweet (1:2 sugar, enhanced sweetness), and Lemonade Intense (2:2, intensified overall taste). Each sample was served in a heat-resistant sustainable plastic cup, with a portion size of 50 mL. Soup samples were served warm at 60–71 °C, whereas lemonade samples were served chilled at 5–10 °C; serving temperatures were checked immediately before presentation using a digital food thermometer. All samples were labeled with randomly generated three-digit codes to blind participants to sample identity. Within each session, the presentation order of samples was randomized and counterbalanced across participants. Samples were presented at chin height, and participants were instructed to taste them using a straw and then record their ratings. A 30 s interval was maintained between samples, and participants rinsed their mouths with purified water after each sample to minimize carryover effects. To reduce potential lingering effects of VR exposure, the order of the three experimental scenarios was standardized. In the microgravity position, participants lay in a “zero gravity” chair while a volunteer guided the straw to their mouth during sample delivery and data collection. In the VR + microgravity condition, participants wore a VR headset and entered a simulated microgravity environment before evaluating the samples. Thus, in addition to coded sample presentation, visual information about the real-world serving context was masked during the VR-based condition (Figure 4).
Figure 4.
VR + Microgravity Condition with Jar Questionnaire and Preference Liking. In the VR + Microgravity condition, participants experienced a space simulation using a Pico VR headset while completing an online sensory evaluation questionnaire. The white line indicates the pointer emitted from the VR hand controller.
2.5. Measures
JAR Questionnaire and Preference Liking
The perceived taste intensity was measured using a 5-point JAR scale, ranging from “Too Salty/Umami/Sweet” (1) to “Not enough Salty/Umami/Sweet” (5). Preference liking was assessed using a 9-point hedonic scale, with ratings from “Dislike Extremely” (1) to “Like Extremely” (9). Given the potential variability in scale interpretation among participants, an 8-item questionnaire was developed to ensure standardization. This questionnaire was administered at baseline and required participants to rate various attributes, such as “the sourness/sweetness of the product” or “the overall liking of the product.” Based on the responses, individual scale factors were calculated and subsequently applied to each participant’s intensity ratings for the respective attributes, yielding standardized values. This approach effectively controlled for individual differences in scale usage, ensuring the reliability and comparability of taste intensity responses [27].
2.6. Statistical Analysis
All statistical analyses were performed using XLSTAT annual version 2025.2.0 (Addinsoft, New York, NY, USA). Overall liking scores (9-point hedonic scale) were analyzed using repeated-measures ANOVA, with context, product, and their interaction treated as fixed effects, while participant was treated as a random effect. Statistical significance was set at p < 0.05 (two-sided), and Bonferroni-adjusted post hoc comparisons were performed when significant effects were detected. Least squares mean (LS means) were reported for each condition.
Penalty analysis was used to examine participants’ perceptions of taste intensity and the effect of deviations from the ideal level on liking. Multiple Factor Analysis (MFA) was performed on overall liking data to visualize the relationships among products and contexts, with participants treated as observations and the three contexts treated as variable blocks. Similarity between context blocks was quantified using RV coefficients.
No trained descriptive sensory profiling was conducted, as the aim of this study was to evaluate consumer acceptance and perceived taste responses rather than analytical sensory characterization [28]. Significance level of α = 5% was used. All figures were generated using XLSTAT (Addinsoft, New York, NY, USA).
3. Results
3.1. Descriptive Statistics of Vegetable Soup and Lemonade (Overall Liking) Across Three Environments
The study found that food preference was highest under normal gravity (5.8 ± 1.3 for both soup and lemonade), with consistent ratings among participants. In microgravity, this reduction was statistically significant only for lemonade (p = 0.001), whereas the difference for soup was not significant (p = 0.053). Increased standard deviation indicates individual differences in adaptation. Under VR + microgravity, scores partially recovered (5.2 ± 1.4 for soup, 5.7 ± 1.5 for lemonade), with lemonade nearly returning to normal levels.
3.2. Comparison of Overall Liking Across Different Environmental Conditions
Overall liking (OAL) scores showed a strong trend of change in different environments: the lowest score in a microgravity environment indicated that the overall preference for food was negatively affected by the microgravity position, and the highest score in a normal environment indicated that food was most popular in a normal environment, while the score in a VR + microgravity environment was between the two, indicating that VR technology improves the experience to a certain extent [29]. This trend was significant only for the lemonade product, as shown in Table 3; however, the p-value for soups was 0.053, which just barely exceeds the significance level of 0.05. From microgravity to a normal environment, OAL scores increased significantly, reflecting that normal gravity is conducive to taste perception; and from a normal environment to a VR + microgravity environment, the score decreased slightly, but it was still higher than in a pure microgravity environment, indicating that VR have a certain effect on improving food acceptance [30]. These findings are in accordance with previously reported literature data, thereby supporting the validity and consistency of the present results. The results indicate that microgravity significantly reduces overall food acceptance, as reflected by the lowest OAL scores observed in this condition. This decline aligns with previous research suggesting that fluid redistribution and impaired olfactory function in microgravity contribute to diminished taste perception [31]. The highest OAL scores in the normal gravity condition reinforce the idea that gravity plays a crucial role in maintaining an optimal sensory environment for taste perception. Interestingly, VR + microgravity led to a partial recovery of food preference, with OAL scores falling between those of normal gravity and microgravity conditions. This suggests that VR serves as a compensatory tool to some extent, likely through enhanced visual and contextual cues that influence sensory expectations and overall food enjoyment. However, the fact that VR + microgravity scores remained lower than those in normal gravity indicates that VR alone cannot fully restore the sensory experience lost in microgravity [32], highlighting the limitations of visual compensation without direct olfactory or gustatory stimulation [33].
Table 3.
Post hoc pairwise comparisons of overall liking across environmental conditions for Lemonades. Differences were considered statistically significant at p < 0.05.
3.3. Penalty Analysis for Vegetable Soup and Lemonade Under Normal, Microgravity, and VR + Microgravity
The impact of vegetable soup salty (NCS/MCS/VRCS) and umami (NCU/MCU/VRCU) and lemonade sour (NCA/MCA/VRCA) and sweet (NCS/MCS/VRCS) on food acceptance under conditions of too much and too little, across normal gravity, microgravity, and VR+ microgravity was measured. The findings demonstrate that microgravity alters taste perception, while VR partially compensates for these effects.
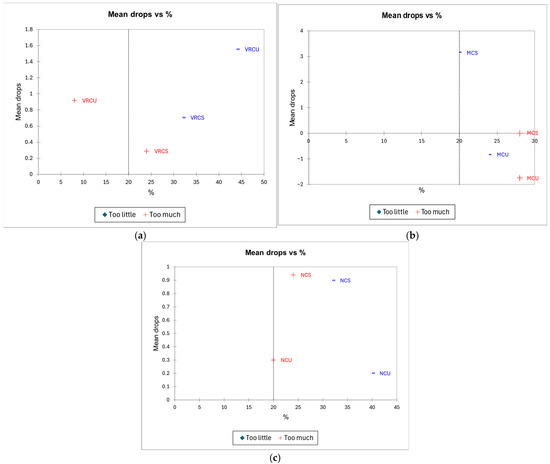
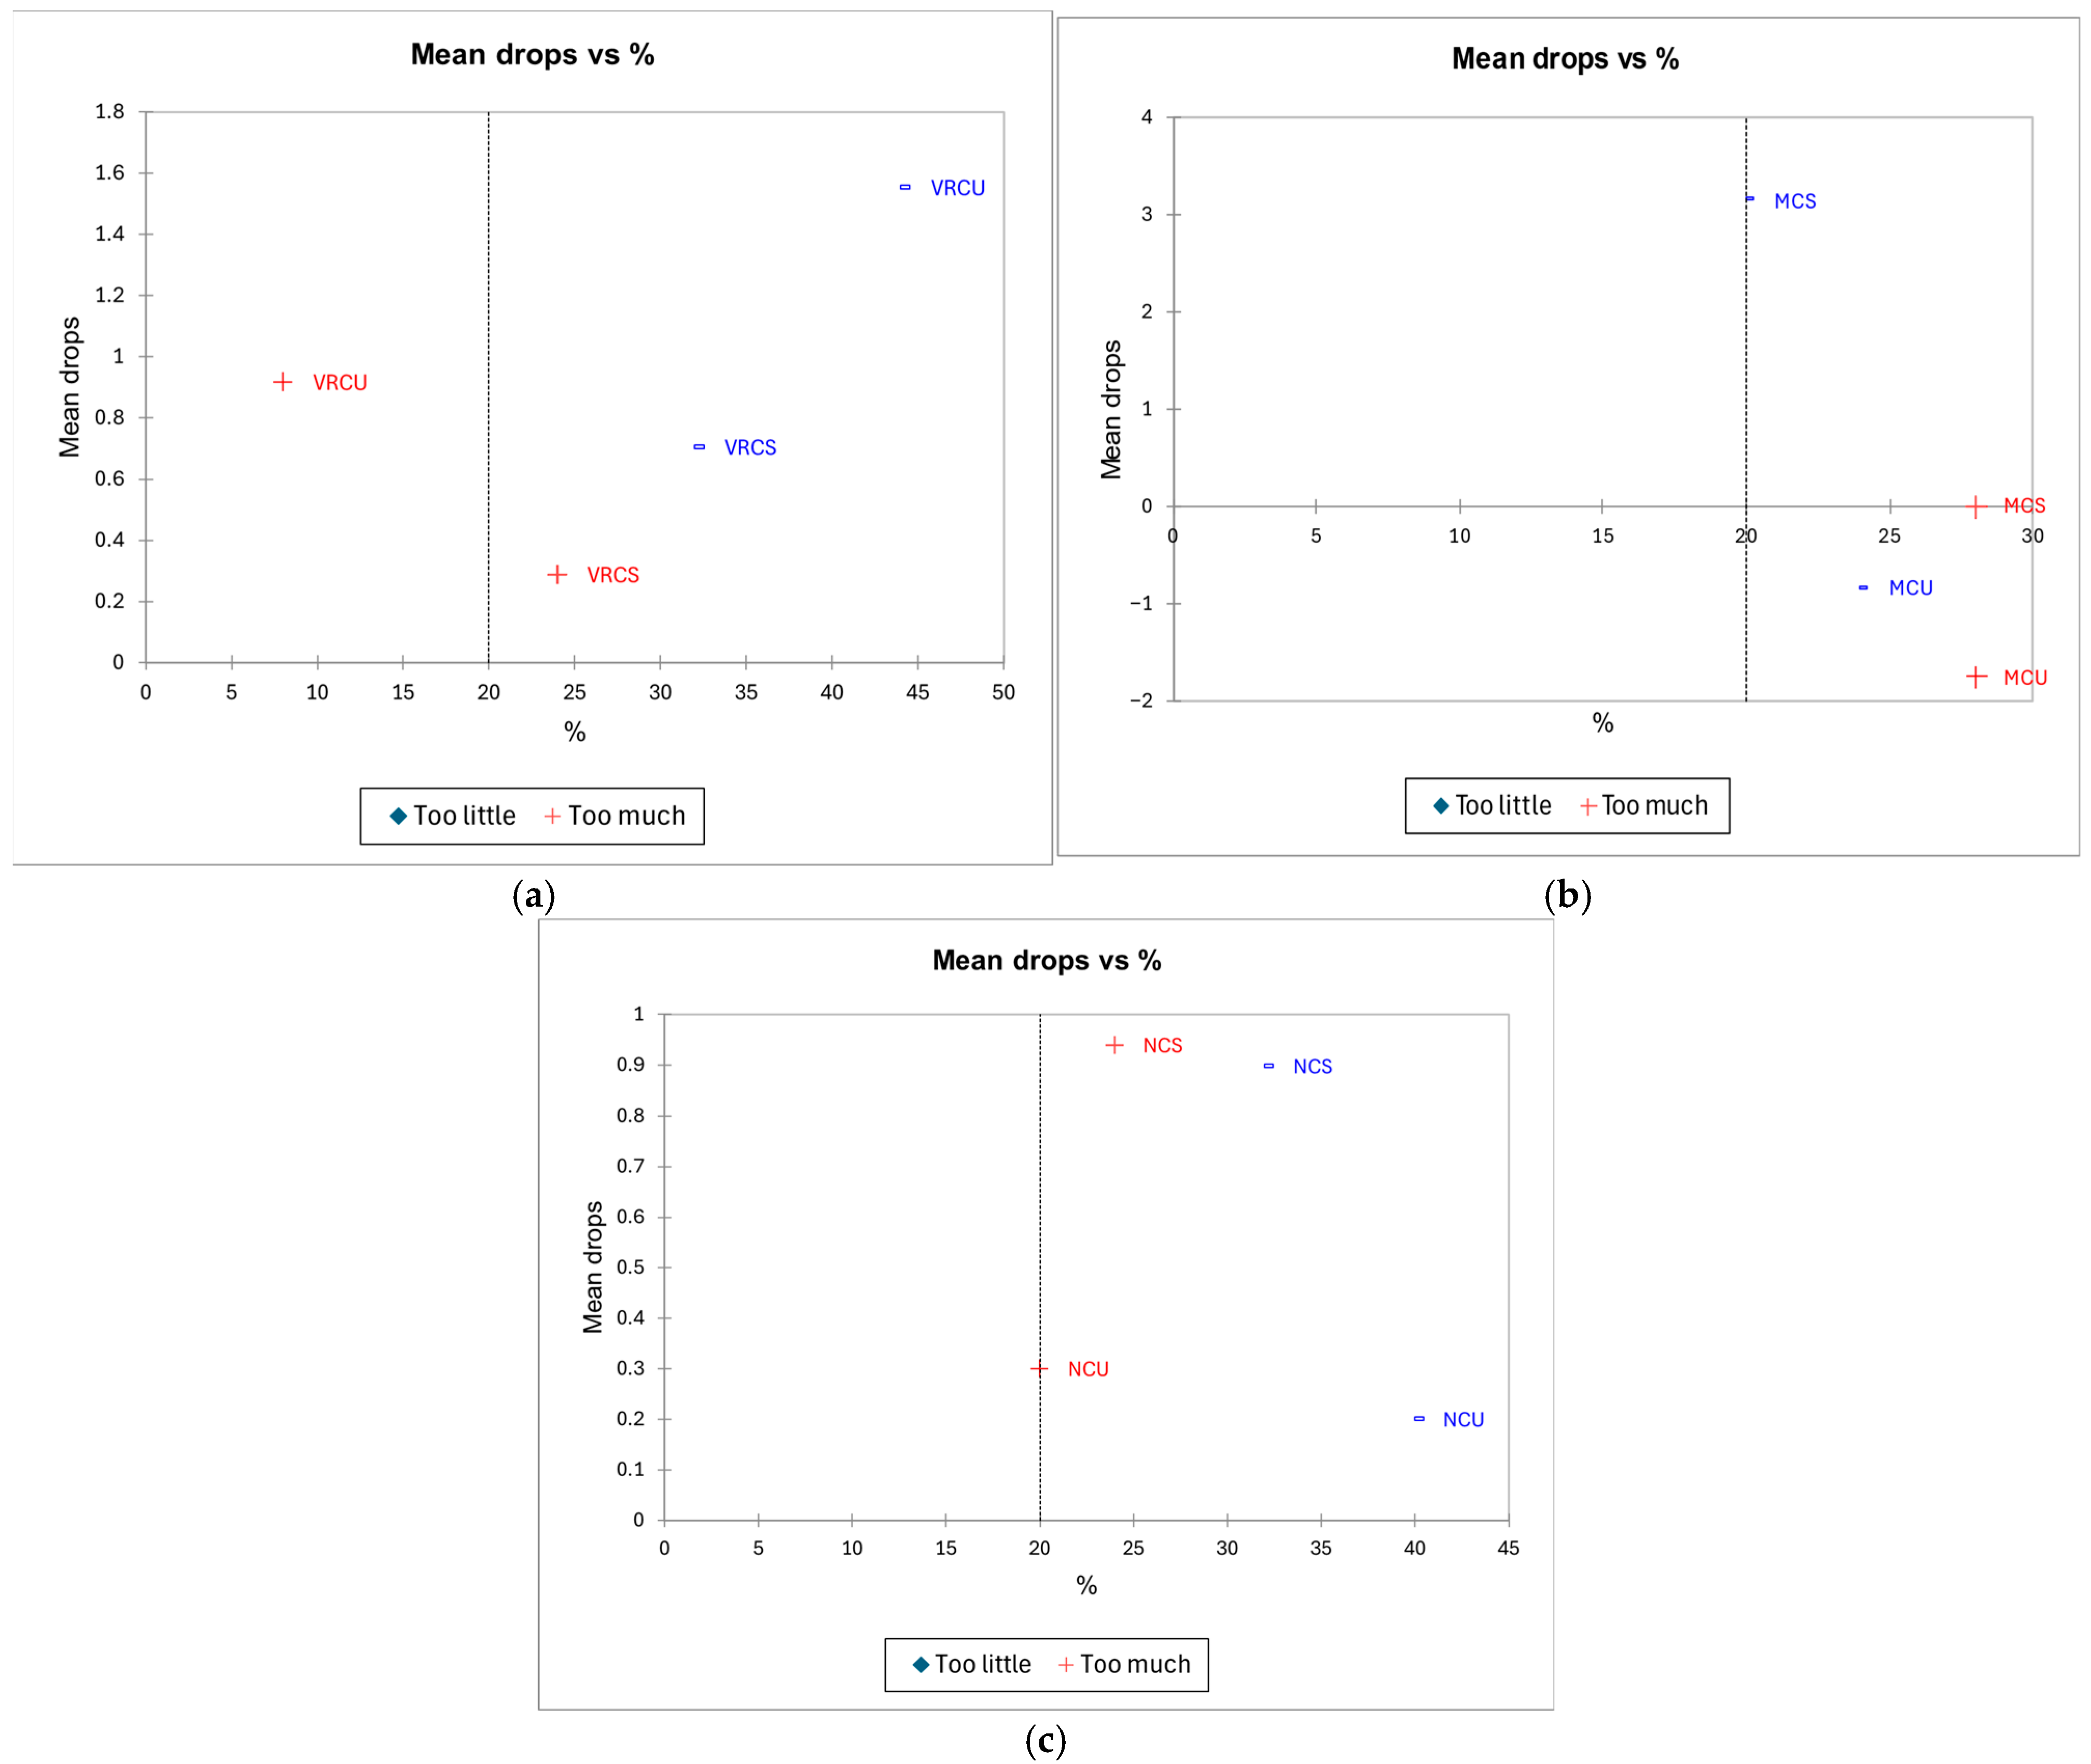
These figures showed how salty (S) and umami (U) perceptions of vegetable soup are penalized across three experimental conditions: Normal Gravity (NC), Microgravity (MC), and VR-simulated Microgravity (VRC). The x-axis represents the percentage of participants who perceived the taste attribute as “too little” (blue, –) or “too much” (red, +). The y-axis represents the mean penalty drops, i.e., how much overall liking decreased due to this perception. The 20% threshold was used as a practical relevance criterion in the penalty analysis.
The penalty analysis results for saltiness and umami perception in vegetable soup under normal gravity, microgravity, and VR + microgravity are shown in Figure 5a–c. Saltiness has been identified as a key determinant of food preference [34]. Under normal gravity, food acceptance was reduced by both too much saltiness (32%, Mean Drops = 0.898) and too little saltiness (24%, Mean Drops = 0.939). Percentages are crucial in penalty analysis, as mean drop values should only be considered for non-JAR endpoints that meet a certain limit. This limit is usually set at 20%, meaning that only attributes rated by more than 20% of consumers are taken into account [35]. Since both values exceed this threshold, the findings highlight that deviations in saltiness—either excessive or insufficient—represent critical drivers of consumer dissatisfaction. A slightly stronger negative impact was observed for insufficient salt, suggesting that flavor perception is more compromised by too little salt. In microgravity, a much stronger negative effect was observed for excessive salt (20%, Mean Drops = 3.154), while minimal impact was found for too little salt (28%, Mean Drops = 0.011), indicating that salt perception is weakened in microgravity, Previous research has shown that this exhibits biases in the perception of their environment in microgravity [36]. In VR + Microgravity, the effects of too much salt (32%, Mean Drops = 0.705) and too little salt (24%, Mean Drops = 0.288) were reduced compared to microgravity alone, suggesting that the suppression of salt perception is mitigated by VR, though normal perception is not fully restored [37]. Meanwhile, under normal gravity, minimal effects on acceptance were observed for both too much umami (40%, Mean Drops = 0.200) and too little umami (20%, Mean Drops = 0.300) However, in microgravity, a significant decrease in acceptance was caused by too little umami (28%, Mean Drops = −1.738, p = 0.001), whereas a moderate effect was observed for too much umami (24%, Mean Drops = −0.833). These findings suggest that the impact of umami deficiency is amplified in microgravity, making it a critical factor in space food palatability [38]. In VR + Microgravity, the negative effects of too much umami (44%, Mean Drops = 1.553) and too little umami (8%, Mean Drops = 0.917) persisted but were less pronounced, indicating that umami perception is balance to some extent by VR [39].
Figure 5.
Comparative Penalty Analysis of Salty (S) and Umami (U) Perception in Vegetable Soup Across Normal Gravity (c), Microgravity (b), and VR + Microgravity (a). The dashed vertical line indicates the 20% threshold. Blue (−) denotes “too little”, and red (+) denotes “too much”.
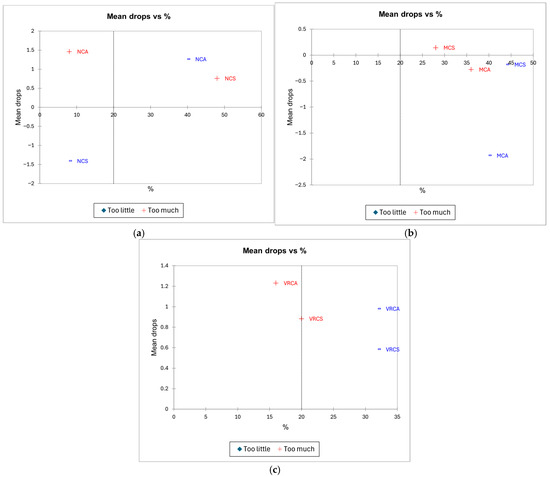
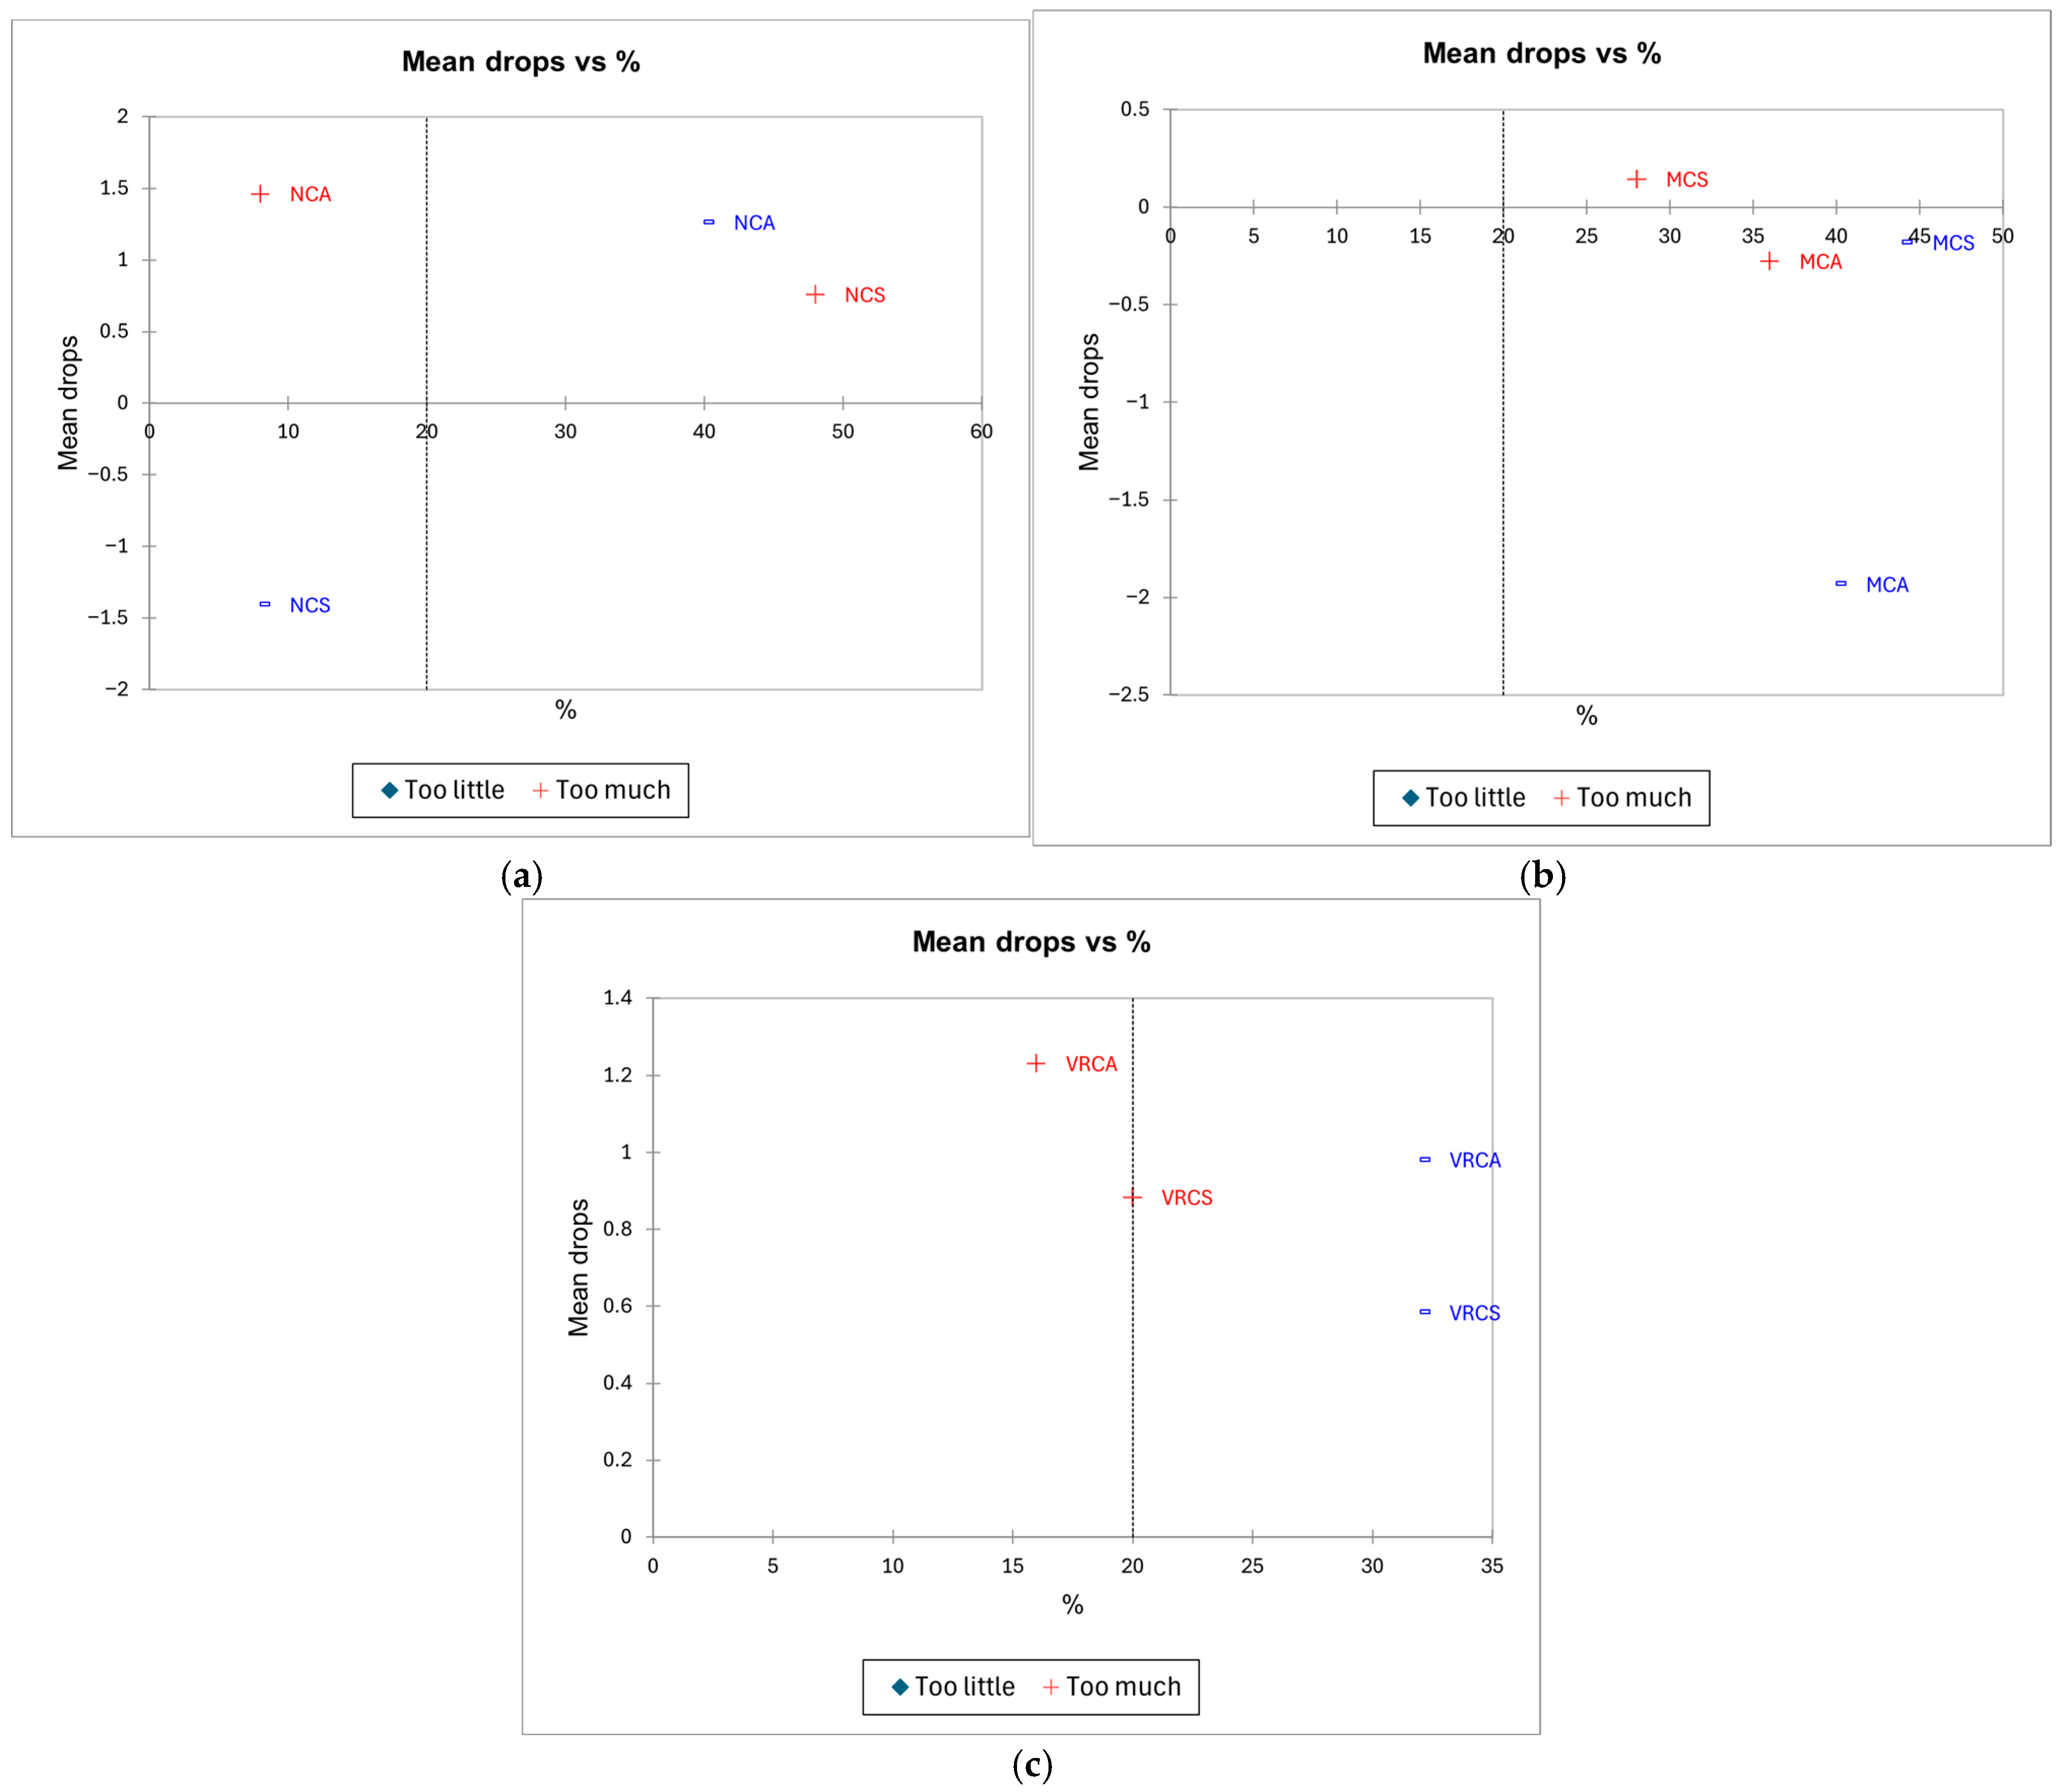
The penalty analysis results for sweetness and acidity perception in lemonade under normal gravity, microgravity, and VR + microgravity are shown in Figure 6a–c.Under normal gravity, too little sweetness was more frequently detected (48% of participants, Mean Drops = 0.758) than too much sweetness (8%, Mean Drops = −1.409), but the negative impact was stronger for those who perceived too much sweetness [13] In microgravity, neither too much sweets (Too Sweet = 44%, Mean Drops = −0.182) nor too little sweetness (Not Sweet = 28%, Mean Drops = 0.143) had an impact, suggesting a general reduction in sweetness sensitivity in this environment [37]. However, in VR + Microgravity, the penalty for too little sweetness increased (Not Sweet = 20%, Mean Drops = 0.883), while tolerance for too much sweetness remained relatively stable (Too Sweet = 32%, Mean Drops = 0.583). This suggests that VR heightens sensitivity to a lack of sweetness while maintaining tolerance for excessive sweetness [40]. On the other hand, acidity exhibited stronger effects across conditions. In normal gravity, both too much acidity (Too Acid = 40%, Mean Drops = 1.262) and too little acidity (Not Acid = 8%, Mean Drops = 1.462) negatively impacted acceptance, with too little acidity having the highest penalty effect. In microgravity, too much acidity caused a much sharper decline in acceptance (Too Acid = 40%, Mean Drops = −1.933), while too little acidity had a comparatively smaller impact (Not Acid = 36%, Mean Drops = −0.278), suggesting microgravity amplifies the perception of sourness but reduces sensitivity to acidity deficiency [41]. In VR + Microgravity, the penalty effect of too much acidity was reduced (Too Acid = 32%, Mean Drops = 0.981), while the penalty for insufficient acidity increased (Not Acid = 16%, Mean Drops = 1.231). This indicates that VR helps mitigate excessive acidity perception but increases sensitivity to acidity deficiency [23].
Figure 6.
Comparative Penalty Analysis of Acid and Sweet Perception in Lemonade Across Normal Gravity (a), Microgravity (b), and VR + Microgravity Conditions (c). The dashed vertical line indicates the 20% threshold. Blue denotes “too little”, and red denotes “too much”.
3.4. Multiple Factor Analysis of Vegetable Soup and Lemonade in Normal, Microgravity, and VR + Microgravity Environments
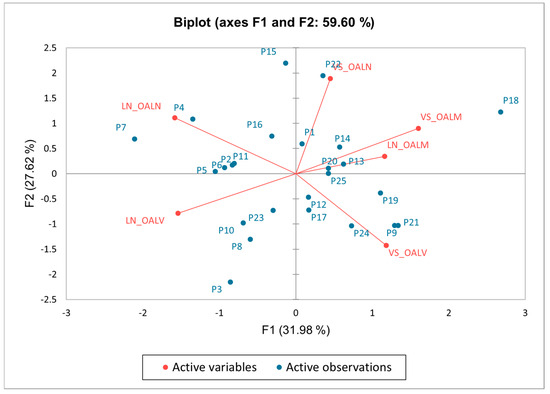
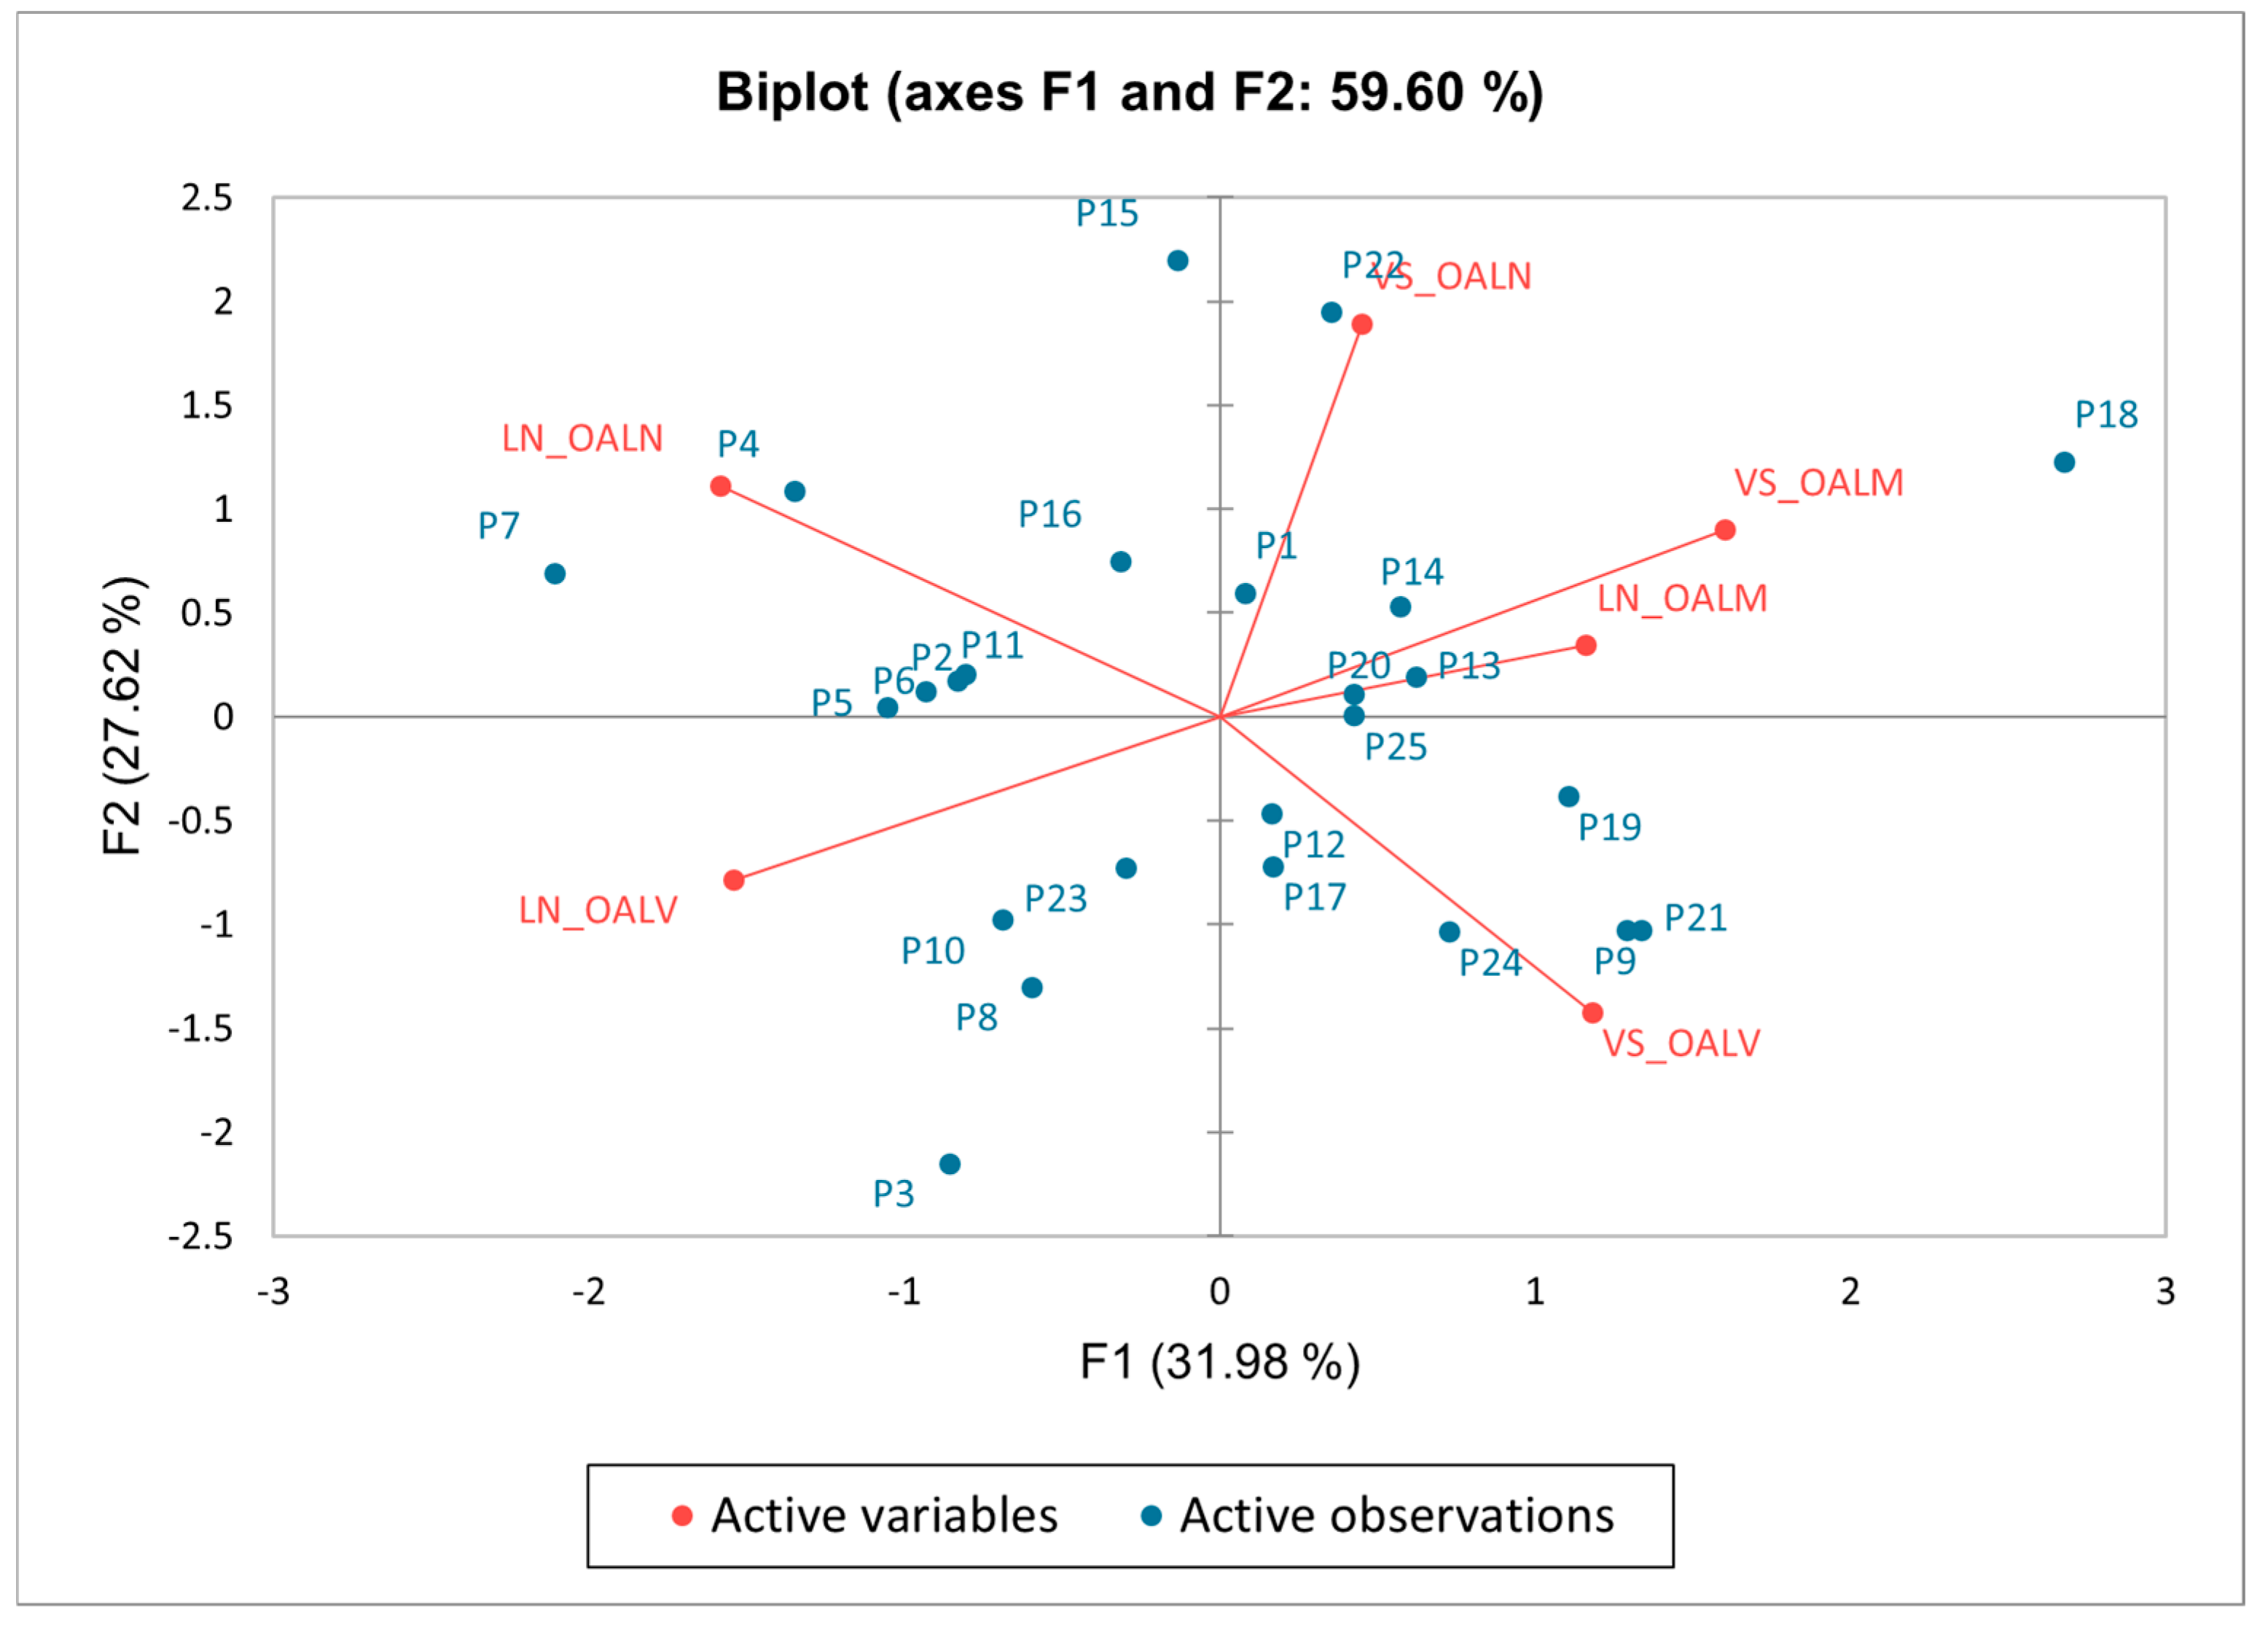
Multiple Factor Analysis (MFA) revealed that the first two dimensions effectively captured the primary variance structure of the dataset, with Factor 1 (F1) accounting for 31.98% and Factor 2 (F2) explaining 27.62% of the total variance, yielding a cumulative variance contribution rate of 59.60%. This bidimensional solution provided sufficient explanatory power for multivariate pattern visualization through biplot representation. The resultant MFA biplot graphically delineates the spatial distribution of overall liking (OAL) evaluations across three experimental conditions, namely microgravity, VR microgravity, and normal gravity, for two food products: lemonade (LN) and vegetable soup (VS) as shown in Figure 7. Participant observations, denoted as active observations in the biplot, are shown as blue points, whereas the six product × context variables are represented by red vectors: LN_OALM (Lemonade: microgravity OAL), VS_OALM (Vegetable soup: microgravity OAL), LN_OALV (Lemonade: VR Environment OAL), VS_OALV (Vegetable soup: VR Environment OAL), LN_OALN (Lemonade: normal gravity OAL), and VS_OALN (Vegetable soup: normal gravity OAL). A comparison of the spatial positions of LN_OALM and VS_OALM with those of LN_OALN and VS_OALN indicates that the liking pattern under microgravity differed from that observed under normal gravity. This result suggests that microgravity altered the overall configuration of consumer acceptance for both lemonade and vegetable soup, which is consistent with previous findings showing that microgravity can influence sensory-related responses [31]. In contrast, the variables associated with normal gravity and VR microgravity showed relatively greater proximity, suggesting that the VR condition partly shifted consumer liking responses toward the normal gravity pattern. This tendency is further supported by the RV coefficient matrix shown in Table 4, in which the highest similarity was observed between normal gravity and VR microgravity (RV = 0.184), followed by normal gravity and microgravity (RV = 0.104), whereas the lowest similarity was found between microgravity and VR microgravity (RV = 0.082). Although the overall RV values remained low, these results indicate that the VR condition was relatively more similar to normal gravity than microgravity alone. This pattern supports the view that immersive virtual environments may exert a partial compensatory effect on food-related sensory responses under space-analog conditions, although such compensation appears limited rather than complete [42].
Figure 7.
MFA biplot of overall liking for lemonade (LN) and vegetable soup (VS) under normal gravity (OALN), microgravity (OALM), and VR + microgravity (OALV) conditions. Blue dots represent participant observations, and red vectors represent product × context variables. Axes F1 and F2 together explain 59.60% of the variance.
Table 4.
RV coefficient matrix among environmental context blocks and the global MFA configuration.
It has to be mentioned that there is a low number of consumers who gave higher preference scores when they performed the tests in the microgravity position. Further analysis is needed to identify if this group represents a significant number of people or not.
4. Conclusions
This study investigated the effects of microgravity and virtual reality on sensory perception and overall liking of beverages, specifically lemonade and vegetable soup, through controlled experimental conditions done with consumers. Overall liking for both products was significantly reduced under microgravity conditions. Notably, VR had a compensatory effect on sensory perception in the microgravity environment, with overall liking scores stabilizing in the VR-enhanced microgravity environment and being very close to those in the normal gravity case. This suggests that the detrimental effects of microgravity on food taste perception can be mitigated by VR, potentially improving the acceptability of food in the space environment. The conclusions presented above are directly supported by the data obtained in this study. These findings highlight the need for further research into altering taste perception in gravity environments, particularly on long-duration space missions. However, the simulated microgravity condition used here reflected only a body-posture-based ground analog and did not incorporate other characteristics of the space environment, such as spacecraft pressure conditions or other in-flight environmental factors. Therefore, the findings should not be interpreted as a full replication of sensory responses in actual spaceflight. It is recommended that future research focuses on three key areas: the potential for virtual reality-based interventions, adaptive food formulations, and multisensory integration strategies to improve food palatability and acceptability during space travel. Optimizing the dietary experience of astronauts is considered crucial, as these sensory adjustments may significantly affect nutritional intake, psychological well-being, and the success of space exploration missions. Beyond the space context, these findings may also have practical applications in the food industry. They may support the development of foods intended for consumption in unusual or constrained environments and suggest that product formulation and sensory optimization may need to be adapted to altered consumption conditions. In addition, VR-based sensory evaluation may provide a useful tool for testing consumer responses in immersive and context-specific scenarios.
The study identified a small subset of participants who showed the highest overall liking values under the simulated microgravity condition, in contrast to the majority of participants. Because of the relatively small sample size, this finding should be interpreted cautiously. Larger sample sizes and further investigation of respondents’ mindsets are needed to better understand this subgroup [43].
Author Contributions
Conceptualization, C.T. and A.G.; methodology, C.T., A.H.Z. and A.G.; software, C.T.; validation, C.T., A.H.Z. and B.B.; formal analysis, C.T.; investigation, C.T.; resources, A.G.; data curation, C.T.; writing—original draft preparation, C.T.; writing—review and editing, A.H.Z., B.B. and A.G.; visualization, C.T.; supervision, A.G.; project administration, A.G. All authors have read and agreed to the published version of the manuscript.
Funding
C.T and B.B thank the support of the Doctoral School of Food Sciences, Hungarian University of Agriculture and Life Sciences also gratefully acknowledge the financial support from the China Scholarship Council (CSC) and Stipendium Hungaricum Scholarship Program. The authors thank the support of MATE University “Proof Of Concept” Program (POC-2025-06). The project was supported by the EKÖP-MATE/2025/26/D university research Scholarship Programmer of the Ministry for Culture and Innovation from the source of the National Research, Development and Innovation Fund. This work was supported by the Flagship Research Groups Programme of the Hungarian University of Agriculture and Life Sciences.
Institutional Review Board Statement
The study was conducted in accordance with the Declaration of Helsinki and approved by the Institutional Review Board (or Ethics Committee) of the Hungarian University of Agriculture and Life Sciences (MATE) (protocol code MATE-BC/104-1/2025).
Informed Consent Statement
Informed consent was obtained from all subjects involved in the study.
Data Availability Statement
The data presented in this study is available on request from the corresponding author.
Conflicts of Interest
The authors declare no conflicts of interest.
References
- Li, L.; Zang, H.; Han, D.; London, N.R. Impact of Varying Types of Nasal Septal Deviation on Nasal Airflow Pattern and Warming Function: A Computational Fluid Dynamics Analysis. Ear Nose Throat J. 2021, 100, NP283–NP289. [Google Scholar] [CrossRef] [Scilit]
- Pramanik, J.; Kumar, A.; Panchal, L.; Prajapati, B. Countermeasures for Maintaining Cardiovascular Health in Space Missions. Curr. Cardiol. Rev. 2023, 19, 57–67. [Google Scholar] [CrossRef] [Scilit]
- Dickerson, B.L.; Sowinski, R.; Kreider, R.B.; Wu, G. Impacts of microgravity on amino acid metabolism during spaceflight. Exp. Biol. Med. 2023, 248, 380–393. [Google Scholar] [CrossRef] [Scilit]
- Prabodha, T.; Danner, L.; Iles, G.N.; Heer, M.; Mack, I.; Brennan, C.; Low, J. Initiating Sensory Science Research in Space Conditions—Current Practices and Future Perspectives. Compr. Rev. Food Sci. Food Saf. 2025, 24, e70241. [Google Scholar] [CrossRef] [Scilit]
- Gonzalez Viejo, C.; Mayorga-Martínez, A.A.; Harris, N.; Villarreal-Lara, R.; Fuentes, S. Spaceward senses: Examining retronasal aroma and mouthfeel perception in simulated space-microgravity environments. npj Sci. Food 2025, 9, 202. [Google Scholar] [CrossRef] [Scilit]
- Sun, H.; Zhou, Q.; Qiao, P.; Zhu, D.; Xin, B.; Wu, B.; Tang, C. Short-term head-down bed rest microgravity simulation alters salivary microbiome in young healthy men. Front. Microbiol. 2022, 13, 1056637. [Google Scholar] [CrossRef] [Scilit] [PubMed]
- Rai, B.; Kaur, J. Mental and physical workload, salivary stress biomarkers and taste perception: Mars desert research station expedition. N. Am. J. Med. Sci. 2012, 4, 577. [Google Scholar] [CrossRef] [Scilit]
- Cao, X.; Horváth-Mezőfi, Z.; Sasvár, Z.; Szabó, G.; Gere, A.; Hitka, G.; Radványi, D. Influence of Visual Quality and Cultural Background on Consumer Apple Preferences: An Eye-Tracking Study with Chinese and Hungarian Consumers. Appl. Sci. 2025, 15, 773. [Google Scholar] [CrossRef] [Scilit]
- Szakál, D.; Fehér, O.; Radványi, D.; Gere, A. Effect of Scents on Gazing Behavior and Choice. Appl. Sci. 2022, 12, 6899. [Google Scholar] [CrossRef] [Scilit]
- Zulkarnain, A.H.B.; Cao, X.; Kókai, Z.; Gere, A. Self-Assessed Experience of Emotional Involvement in Sensory Analysis Performed in Virtual Reality. Foods 2024, 13, 375. [Google Scholar] [CrossRef] [Scilit] [PubMed]
- Gere, A. Virtual reality applications in food science. Current knowledge and prospects. Progress 2021, 17, 3–14. [Google Scholar] [CrossRef] [Scilit]
- Milgram, P.; Kishino, F. A taxonomy of mixed reality visual displays. IEICE Trans. Inf. Syst. 1994, 77, 1321–1329. [Google Scholar]
- Skarbez, R.; Smith, M.; Whitton, M.C. Revisiting Milgram and Kishino’s Reality-Virtuality Continuum. Front. Virtual Real. 2021, 2, 647997. [Google Scholar] [CrossRef] [Scilit]
- Zulkarnain, A.H.B.; Moskowitz, H.R.; Kókai, Z.; Gere, A. Enhancing consumer sensory science approach through augmented virtuality. Curr. Res. Food Sci. 2024, 9, 100834. [Google Scholar] [CrossRef] [Scilit]
- Zulkarnain, A.H.B.; Radványi, D.; Szakál, D.; Kókai, Z.; Gere, A. Unveiling aromas: Virtual reality and scent identification for sensory analysis. Curr. Res. Food Sci. 2024, 8, 100698. [Google Scholar] [CrossRef] [Scilit]
- Galiñanes Plaza, A.; Delarue, J.; Saulais, L. The pursuit of ecological validity through contextual methodologies. Food Qual. Prefer. 2019, 73, 226–247. [Google Scholar] [CrossRef] [Scilit]
- Schöniger, M.K. The role of immersive environments in the assessment of consumer perceptions and product acceptance: A systematic literature review. Food Qual. Prefer. 2022, 99, 104490. [Google Scholar] [CrossRef] [Scilit]
- Dacremont, C.; Sester, C. Context in food behavior and product experience—A review. Curr. Opin. Food Sci. 2019, 27, 115–122. [Google Scholar] [CrossRef] [Scilit]
- Spence, C.; Harrar, V.; Piqueras-Fiszman, B. Assessing the impact of the tableware and other contextual variables on multisensory flavour perception. Flavour 2012, 1, 7. [Google Scholar] [CrossRef] [Scilit]
- Seo, H.-S. Sensory Nudges: The Influences of Environmental Contexts on Consumers’ Sensory Perception, Emotional Responses, and Behaviors toward Foods and Beverages. Foods 2020, 9, 509. [Google Scholar] [CrossRef] [Scilit] [PubMed]
- Xu, C.; Siegrist, M.; Hartmann, C. The application of virtual reality in food consumer behavior research: A systematic review. Trends Food Sci. Technol. 2021, 116, 533–544. [Google Scholar] [CrossRef] [Scilit]
- Wang, Q.J.; Barbosa Escobar, F.; Alves Da Mota, P.; Velasco, C. Getting started with virtual reality for sensory and consumer science: Current practices and future perspectives. Food Res. Int. 2021, 145, 110410. [Google Scholar] [CrossRef] [Scilit]
- Crofton, E.; Murray, N.; Botinestean, C. Exploring the Effects of Immersive Virtual Reality Environments on Sensory Perception of Beef Steaks and Chocolate. Foods 2021, 10, 1154. [Google Scholar] [CrossRef] [Scilit]
- Cabal-Prieto, A.; Herrera-Corredor, J.A.; Vega-Carreño, M.I.; Chay-Canul, A.J.; Chareo-Benítez, B.; Juarez-Barrientos, J.M.; Hernández-Salinas, G.; Guerrero-Ortíz, C.A.; Armida-Lozano, J.; Ramírez-Rivera, E.D.J. Analysis of sensory and cognitive performance of generational consumers using artisan tortillas. J. Sens. Stud. 2024, 39, e12920. [Google Scholar] [CrossRef] [Scilit]
- Ergonomic Chairs. NASA Spinoff. Available online: https://spinoff.nasa.gov/spinoff1997/ch2.html (accessed on 18 March 2025).
- Dawes, C. Reality bites: Highlighting the potential discrepancies between multisensory taste perception in extended and physical reality. Front. Comput. Sci. 2023, 5, 1268849. [Google Scholar] [CrossRef] [Scilit]
- Colla, K.; Keast, R.; Mohebbi, M.; Russell, C.G.; Liem, D.G. Testing the validity of immersive eating environments against laboratory and real life settings. Food Qual. Prefer. 2023, 103, 104717. [Google Scholar] [CrossRef] [Scilit]
- Ares, G.; Varela, P. Trained vs. consumer panels for analytical testing: Fueling a long lasting debate in the field. Food Qual. Prefer. 2017, 61, 79–86. [Google Scholar] [CrossRef] [Scilit]
- Spence, C. Digitally enhancing tasting experiences. Int. J. Gastron. Food Sci. 2023, 32, 100695. [Google Scholar] [CrossRef] [Scilit]
- Song, X.; Pérez-Cueto, F.J.A.; Bredie, W.L.P. Food Desires and Hedonic Discrimination in Virtual Reality Varying in Product–Context Appropriateness among Older Consumers. Foods 2022, 11, 3228. [Google Scholar] [CrossRef] [Scilit]
- Hargens, A.R.; Vico, L. Long-duration bed rest as an analog to microgravity. J. Appl. Physiol. 2016, 120, 891–903. [Google Scholar] [CrossRef] [Scilit] [PubMed]
- Schouteten, J.J.; Van Severen, A.; Dull, D.; De Steur, H.; Danner, L. Congruency of an eating environment influences product liking: A virtual reality study. Food Qual. Prefer. 2024, 113, 105066. [Google Scholar] [CrossRef] [Scilit]
- Apostolou, K.; Liarokapis, F. A Systematic Review: The Role of Multisensory Feedback in Virtual Reality. In Proceedings of the 2022 IEEE 2nd International Conference on Intelligent Reality (ICIR), Piscataway, NJ, USA, 14–16 December 2022; IEEE: New York, NY, USA, 2022; pp. 39–42. Available online: https://ieeexplore.ieee.org/document/10070907 (accessed on 16 March 2026).
- Pilic, L.; Lubasinski, N.J.; Berk, M.; Ward, D.; Graham, C.A.-M.; Da Silva Anastacio, V.; King, A.; Mavrommatis, Y. The associations between genetics, salt taste perception and salt intake in young adults. Food Qual. Prefer. 2020, 84, 103954. [Google Scholar] [CrossRef] [Scilit]
- Gere, A. Penalty analysis is an efficient tool for food product development: Case study with lemonades. J. Process. Energy Agric. 2022, 26, 90–94. [Google Scholar] [CrossRef] [Scilit]
- Clément, G.; Skinner, A.; Lathan, C. Distance and Size Perception in Astronauts during Long-Duration Spaceflight. Life 2013, 3, 524–537. [Google Scholar] [CrossRef] [Scilit]
- Chen, Y.; Huang, A.X.; Faber, I.; Makransky, G.; Perez-Cueto, F.J.A. Assessing the Influence of Visual-Taste Congruency on Perceived Sweetness and Product Liking in Immersive VR. Foods 2020, 9, 465. [Google Scholar] [CrossRef] [Scilit] [PubMed]
- Yamamoto, T.; Inui-Yamamoto, C. The flavor-enhancing action of glutamate and its mechanism involving the notion of kokumi. npj Sci. Food 2023, 7, 3. [Google Scholar] [CrossRef] [Scilit] [PubMed]
- Zhang, Z.-M.; Wu, X.; Zhang, G.; Ma, X.; He, D.-X. Functional food development: Insights from TRP channels. J. Funct. Foods 2019, 56, 384–394. [Google Scholar] [CrossRef] [Scilit]
- Wu, Z.; Shi, R.; Li, Z.; Jiang, M.; Li, Y.; Yu, L.; Liang, H.-N. Examining cross-modal correspondence between ambient color and taste perception in virtual reality. Front. Virtual Real. 2022, 3, 1056782. [Google Scholar] [CrossRef] [Scilit]
- Santanatoglia, A.; Angeloni, S.; Caprioli, G.; Fioretti, L.; Ricciutelli, M.; Vittori, S.; Alessandroni, L. Comprehensive investigation of coffee acidity on eight different brewing methods through chemical analyses, sensory evaluation and statistical elaboration. Food Chem. 2024, 454, 139717. [Google Scholar] [CrossRef] [Scilit]
- Loke, G.; Chandrapala, J.; Besnard, A.; Kantono, K.; Brennan, C.; Newman, L.; Low, J. Food odour perception and affective response in Virtual spacecraft and microgravity body posture (1-G)—Potential ground-based simulations. Food Res. Int. 2024, 197, 115260. [Google Scholar] [CrossRef] [Scilit]
- Porretta, S.; Gere, A.; Radványi, D.; Moskowitz, H. Mind Genomics (Conjoint Analysis): The new concept research in the analysis of consumer behaviour and choice. Trends Food Sci. Technol. 2019, 84, 29–33. [Google Scholar] [CrossRef] [Scilit]

Disclaimer/Publisher’s Note: The statements, opinions and data contained in all publications are solely those of the individual author(s) and contributor(s) and not of MDPI and/or the editor(s). MDPI and/or the editor(s) disclaim responsibility for any injury to people or property resulting from any ideas, methods, instructions or products referred to in the content. |
© 2026 by the authors. Licensee MDPI, Basel, Switzerland. This article is an open access article distributed under the terms and conditions of the Creative Commons Attribution (CC BY) license.