4.2. Data Preprocessing
AIS data are often affected by transmission delays, GPS signal interruption, missing fields, and abnormal observations. Therefore, data preprocessing is essential before model training.
Given the characteristics of AIS data, its collection, uploading, and recording are all dependent on GPS signals. When GPS signals are interrupted due to insufficient signal strength or other reasons, data loss, abnormal MMSI values, and abnormal speed values may occur. Therefore, data cleaning and preprocessing are necessary before model training to ensure the accuracy of subsequent trajectory point selection.
This study preprocesses the AIS data through the following four steps:
Step 1: Anomaly Detection. Data anomalies include the following situations: MMSI identification codes that are not 9 digits or contain non-numeric information, vessel speed over ground (SOG) values of 0 or greater than 30 knots, and vessel course over ground (COG) values that are not within the range of 0–360 degrees. For other anomaly values, such as COG, we use the IQR method to identify outliers (values outside 1.5 times the interquartile range) and remove them after manual verification.
Step 2: Berthing and Constant-Speed Cruising Detection. Since this study focuses on predicting ship speed, AIS data from vessels that are berthed for extended periods are not meaningful for speed prediction and may interfere with the training of neural networks. Therefore, based on Step 1, this study eliminates useless data by applying the criteria that if the speed values are zero for three consecutive time intervals or remain unchanged for one minute, the corresponding data are removed.
Step 3: Missing Value Imputation. For missing SOG values, the mean imputation method is employed. Specifically, the mean of the three valid SOG values preceding and following the missing point is calculated to fill in the missing SOG value. This approach effectively utilizes the temporal features before and after the missing data without interfering with the training of neural networks. For other missing values, such as latitude and longitude data, cubic spline interpolation is used due to its simplicity in calculation, relaxed constraints, and high interpolation accuracy.
Step 4: Equidistant Sampling. The interval sampling of trajectories allows for control over the density of trajectory points. Properly sampled vessel trajectory data not only retains the characteristics of the trajectory but also improves the efficiency of subsequent similarity measurement algorithms [
31].
During actual acquisition, raw AIS data inevitably involve a variety of invalid and anomalous records, which seriously degrade trajectory data quality and undermine the stability and accuracy of subsequent model training. In accordance with the four-stage preprocessing framework proposed above, this study identifies several typical anomalies in original AIS messages, including invalid MMSI identifiers, abnormal ship speed over ground, missing MMSI values, and missing ship speed records. The corresponding processing strategies are formulated accordingly, such as direct deletion and mean interpolation. For clarity, the representative abnormal types encountered in this work and their unified procedure rules are summarized in
Table 2.
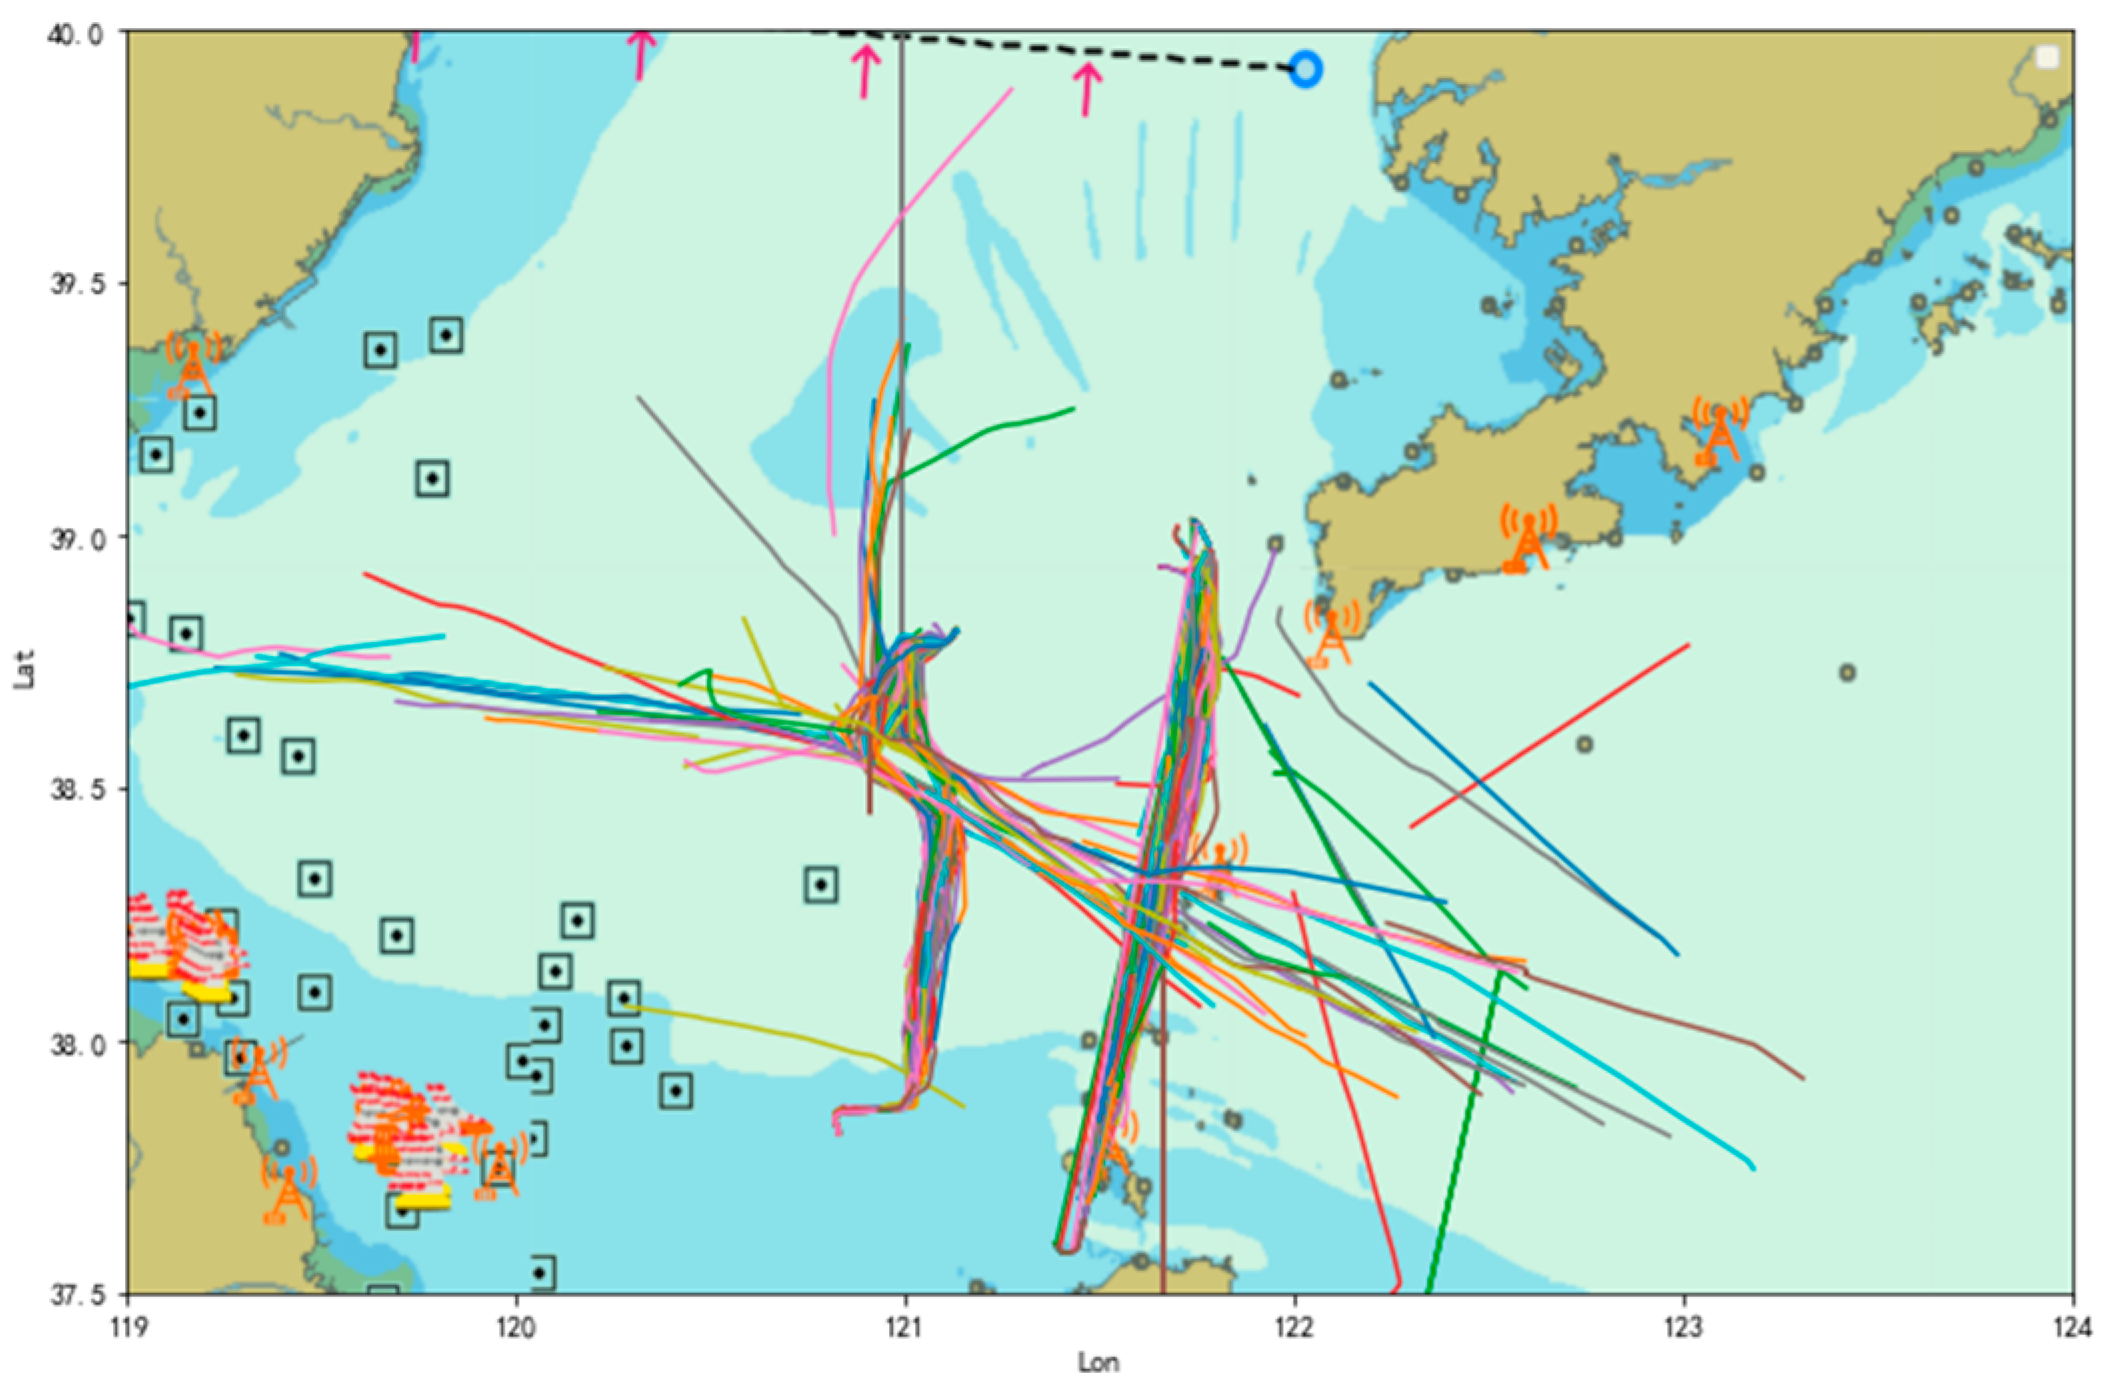
Given that the acceleration and deceleration processes during maritime navigation are relatively prolonged, ship speed is unlikely to change significantly in a short period. Therefore, without affecting the original speed characteristics, sampling is performed at 10-s intervals. Continuous trajectory points with the same MMSI represent the navigation trajectory of the same vessel. Ultimately, 2580 navigation trajectories were formed, totaling 258,000 AIS navigation status data points, with 2064 trajectories used as the training set and 516 trajectories as the testing set. As shown in
Figure 4, the trajectories are reconstructed based on preprocessed AIS data from 256 offshore vessels (after anomaly detection, missing value imputation, and 10-s equidistant sampling). Each trajectory is formed by connecting consecutive longitude and latitude position points of the same vessel (identified by MMSI), with spatial resolution aligned with GPS coordinates, and the final processed data are shown in
Table 3.
After anomaly handling and missing-value processing, min–max normalization was applied to scale each feature into the interval [0, 1], as follows:
where
X is the original feature value and
Y is the normalized value. This preprocessing step improves training stability and accelerates model convergence.
4.4. Experimental Environment and Hyperparameter Settings
The experiments were conducted on a computer with an AMD i7 processor, 16 GB RAM, and an NVIDIA GeForce MX230 GPU. The software environment consisted of Python 3.8, TensorFlow 2.11.0, and Keras 2.11.0 under Windows.
After repeated tuning, As show in
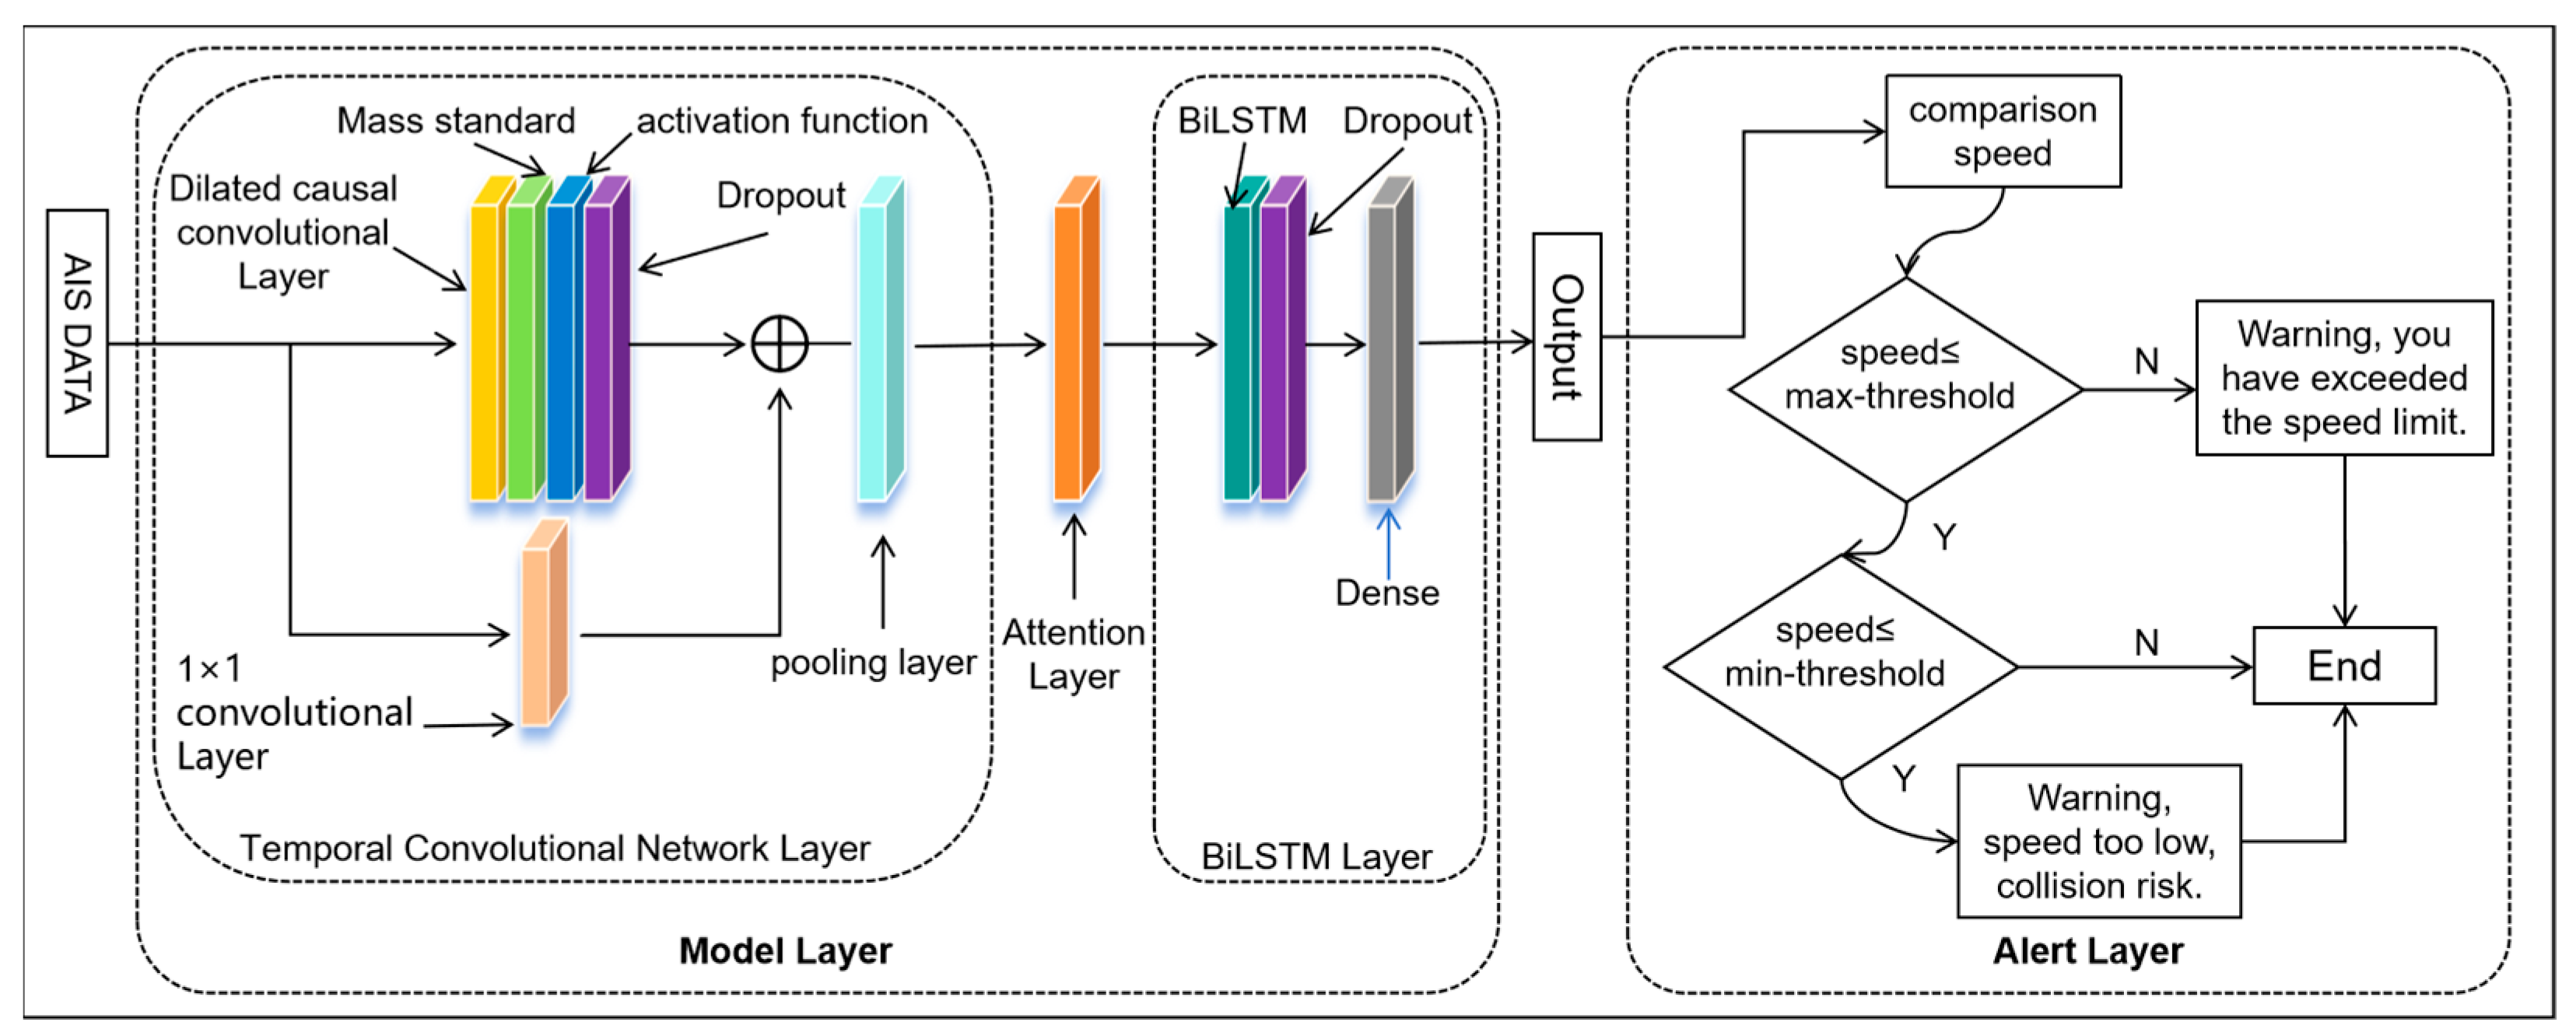
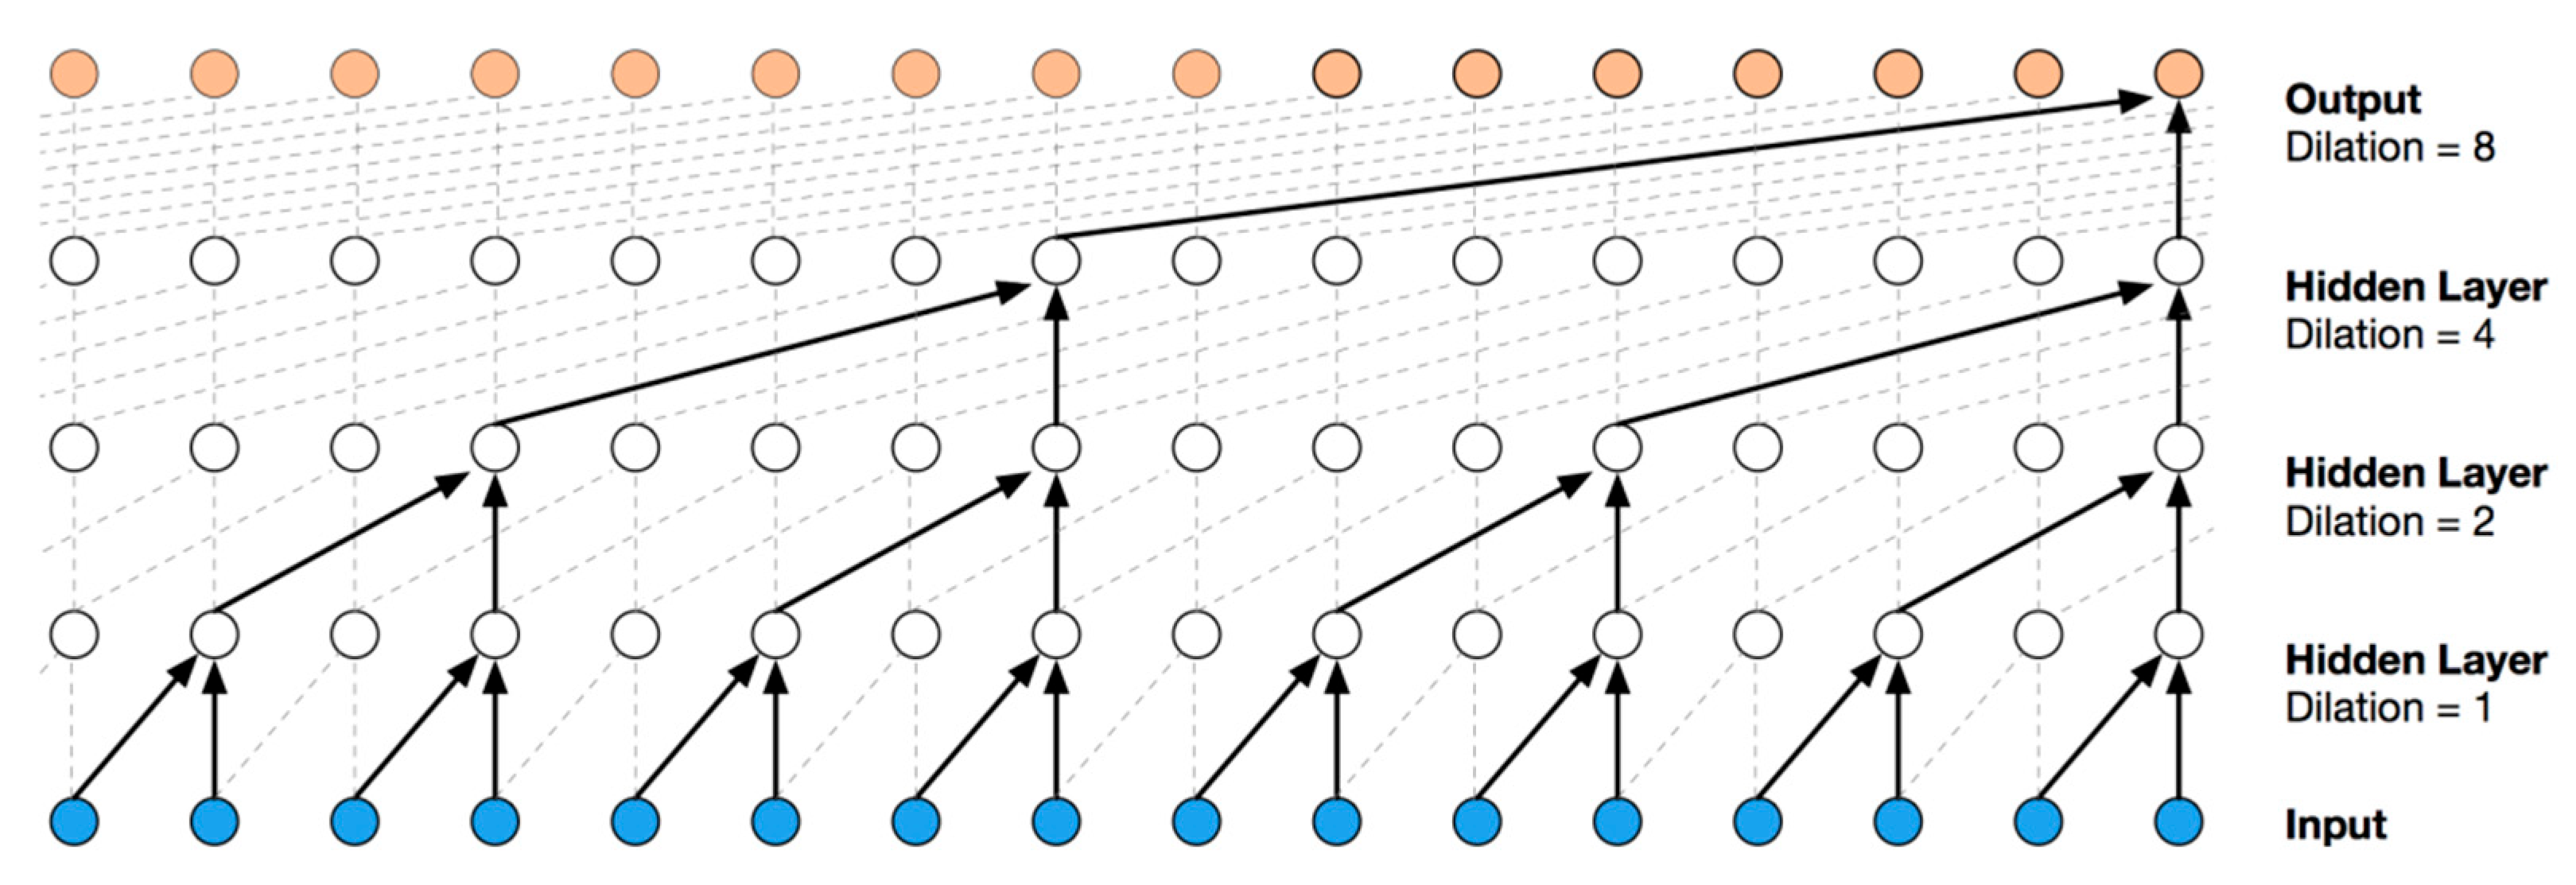
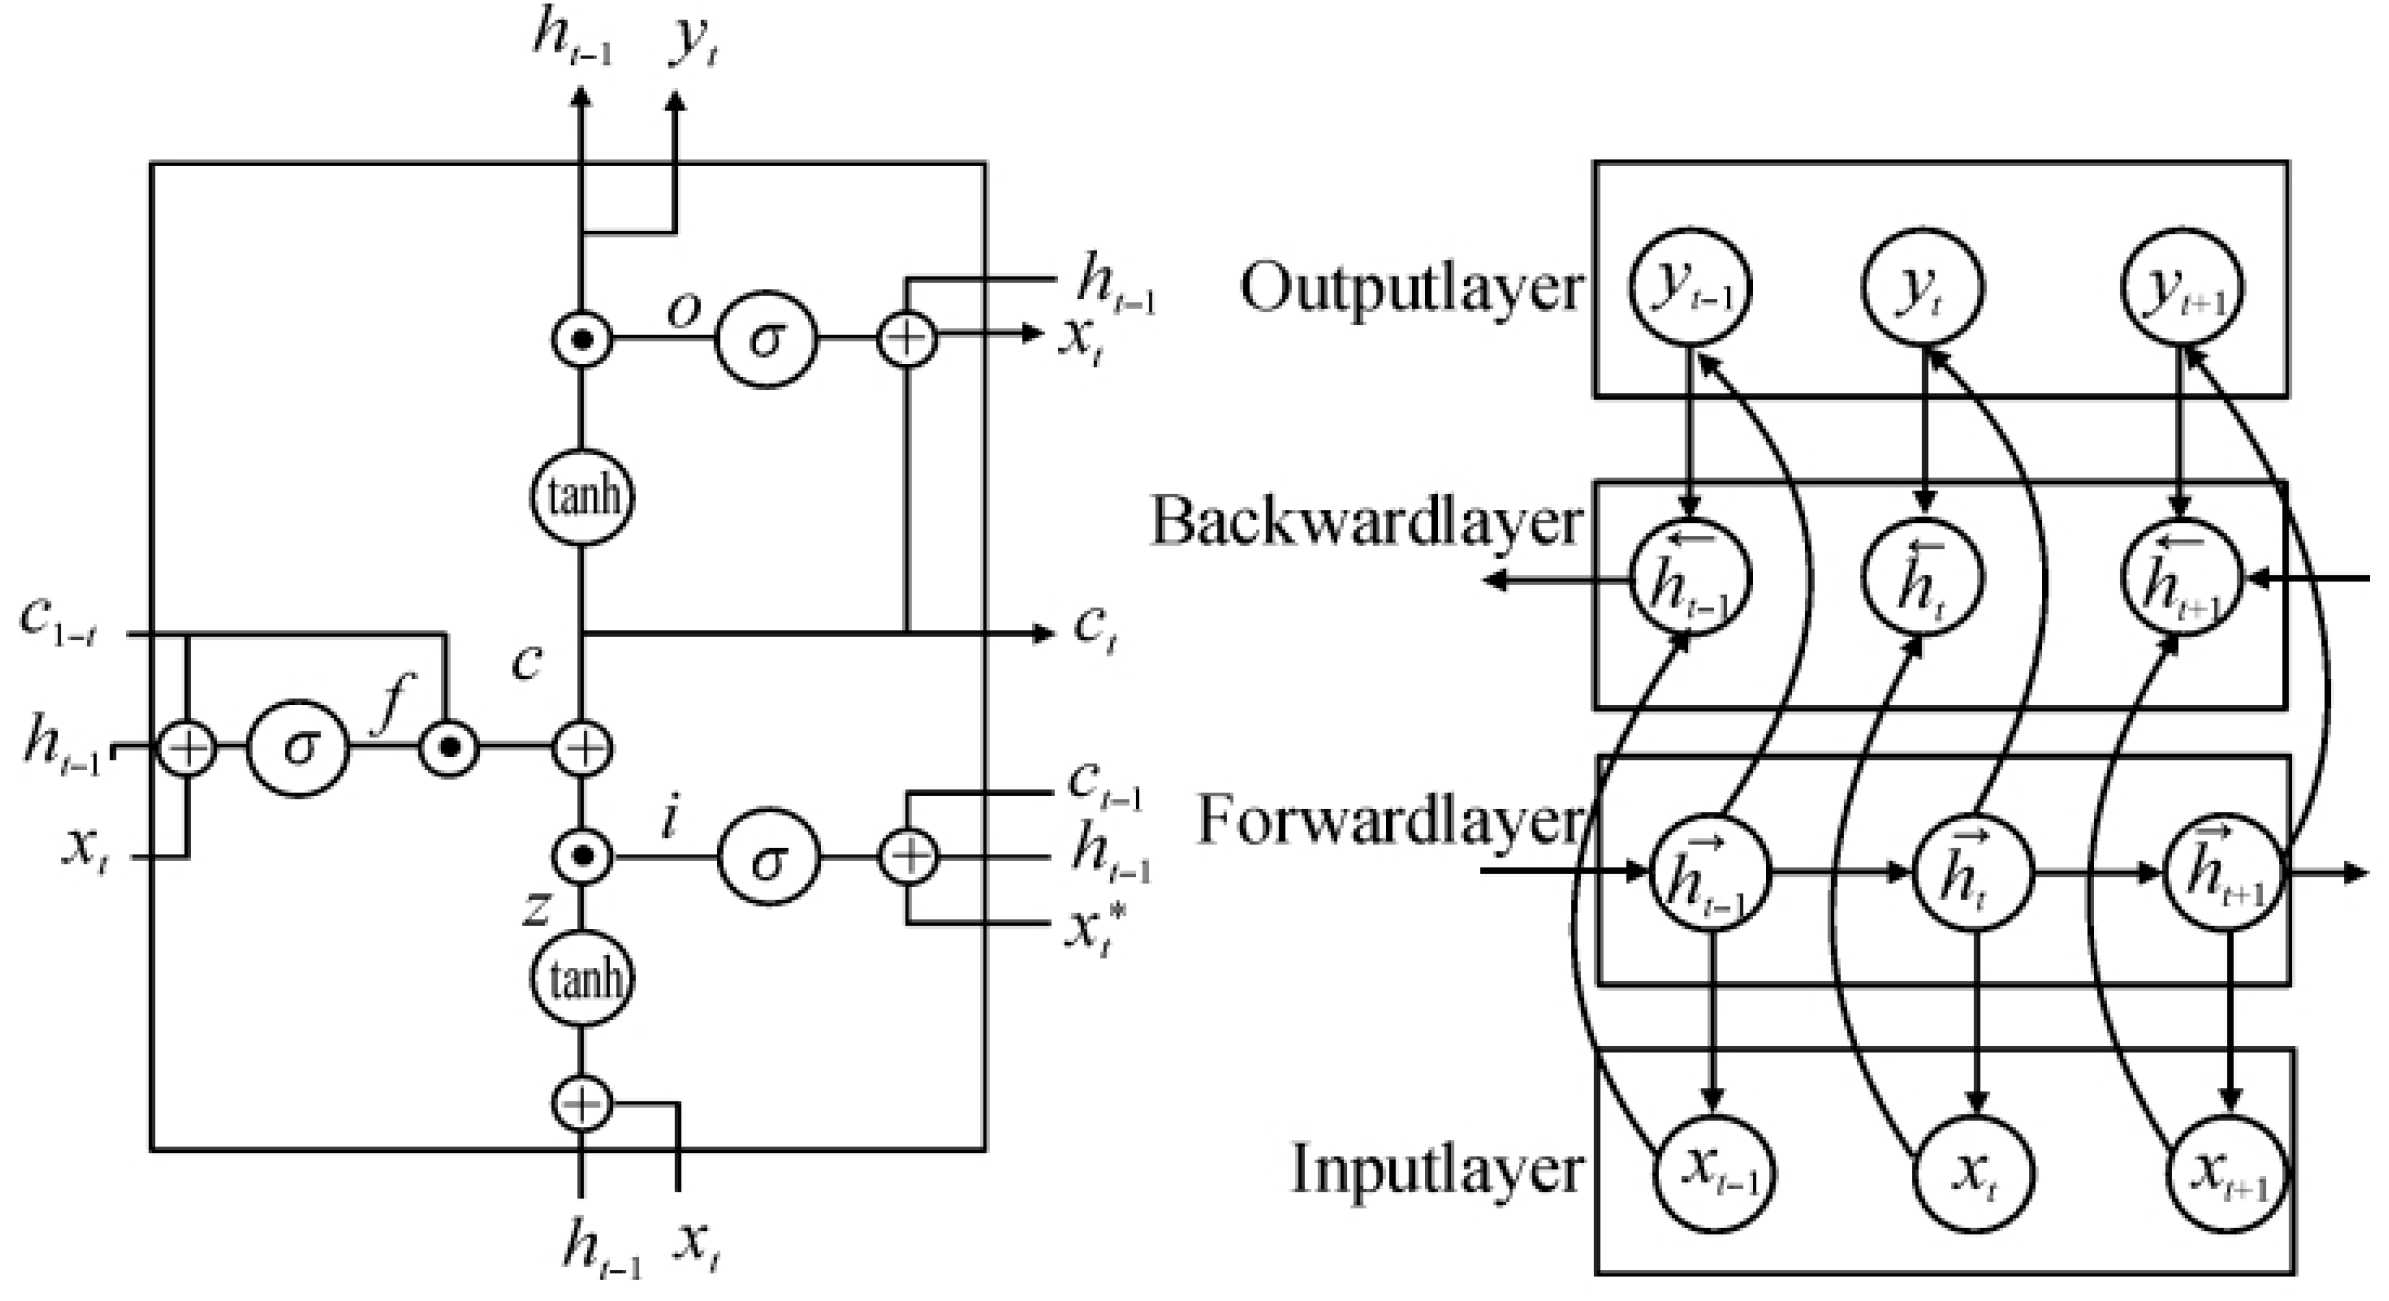
Table 5, the hyperparameters were set as follows. The TCN module used 20 convolution kernels with a kernel size of 6, and dilation factors increased in powers of 2. The BiLSTM module contained 50 hidden units. The fully connected layers adopted a gradually decreasing structure to control model complexity and reduce the risk of overfitting. ReLU was chosen as the activation function, and Adam was used as the optimizer with a learning rate of 0.001. The number of training epochs was 50, the batch size was 64, and the input window length was 3. The loss function was mean squared error (MSE).
For the warning module, the lower and upper speed thresholds in the electronic-fence framework were set to 3 and 25, respectively. In actual engineering applications, these thresholds can be flexibly adjusted according to specific nearshore areas, channel regulations, vessel types, and maritime traffic rules.
4.6. Comparative Results
To assess the effectiveness of the proposed framework, the TCN-Attention-BiLSTM model was compared with nine baseline models, including BP, LSTM, TCN, TCN-LSTM, LSTM-Attention, CNN-LSTM, TCN-Attention, RNN, and ABiLSTM. These models represent several commonly used strategies for sequence prediction, including feedforward approximation, recurrent modelling, attention-enhanced sequence learning and hybrid feature extraction architectures. All models were trained and evaluated under the same experimental setting so that the comparison would reflect differences in model capability rather than differences in training conditions.
Table 6 gives the speed prediction errors of various models when using the evaluation metrics MAE, MSE, RMSE and R
2 to predict ship trajectories. In terms of speed prediction accuracy, the TCN-ABiLSTM model shows significant improvement over the BP, LSTM, TCN, TCN-LSTM, LSTM-Attention, CNN-LSTM, TCN-Attention, RNN, and ABiLSTM models. The MAE was reduced by 21.9%, 69.34%, 60.23%, 52.82%, 45.61%, 21.22%, 46.96%, 19.61%, and 54.86%, respectively. The MSE was reduced by 89.84%, 72.36%, 76.25%, 83.13%, 72.06%, 77.00%, 56.11%, 78.48%, and 71.94% respectively. RMSE decreased by 68.13%, 47.43%, 77.77%, 82.20%, 47.15%, 52.05%, 33.76%, 53.61%, and 47.03% respectively. R
2 increased by 2.41%, 8.43%, 9.21%, 10.32%, 4.91%, 11.89%, 5.73%, 3.97%, and 3.41%. As shown in
Table 6, the proposed model achieves the lowest MAE, MSE and RMSE, together with the highest R
2 among all compared methods. This result indicates that the model not only reduces the average prediction error but also improves the overall fitting consistency between predicted and observed vessel speed. More importantly, the advantage of the proposed framework is not limited to a single metric, which suggests that the improvement is structural rather than incidental.
A first point worth noting is the comparison with single-structure models such as BP, LSTM and BiLSTM. Although these models can capture part of the variation in vessel speed, their performance remains limited. This is consistent with the complexity of the task itself. Nearshore vessel speed does not evolve according to a single dominant pattern; it is shaped by local manoeuvres, medium-term adjustments and trajectory-level context. A model based on only one mechanism usually emphasizes one aspect of the sequence while weakening another. By contrast, the proposed framework separates temporal extraction, feature weighting and contextual modelling into successive stages, which makes it better suited to the layered structure of AIS-based speed evolution.
A second point concerns the comparison with models that already incorporate attention, such as Attention-LSTM and Attention-BiLSTM. The better performance of the proposed model suggests that the benefit of attention depends strongly on where it is placed and what type of representation it acts upon. In the proposed framework, attention is applied after multi-scale temporal extraction rather than directly to the raw sequence or to a purely recurrent hidden state. This means that the weighting operation is performed on a richer set of temporal features, allowing the model to distinguish more effectively between informative and non-informative sequence patterns. The results therefore support the view that attention contributes most when it functions as an intermediate screening mechanism rather than as an isolated add-on.
A third point is the comparison with hybrid baseline models such as CNN-LSTM-Attention and RNN-LSTM-Attention. These models also combine multiple neural components, yet they remain inferior to the proposed framework. This difference is important for understanding the innovation of the present method. The gain does not come simply from stacking more modules, because the baseline hybrids already do that. Instead, the improvement appears to arise from the internal logic of the proposed architecture: TCN is used specifically for multi-scale temporal representation, attention is used specifically for feature reweighting, and BiLSTM is used specifically for contextual integration. In other words, the effectiveness of the model is associated less with architectural complexity than with the way in which the processing stages are functionally organized.
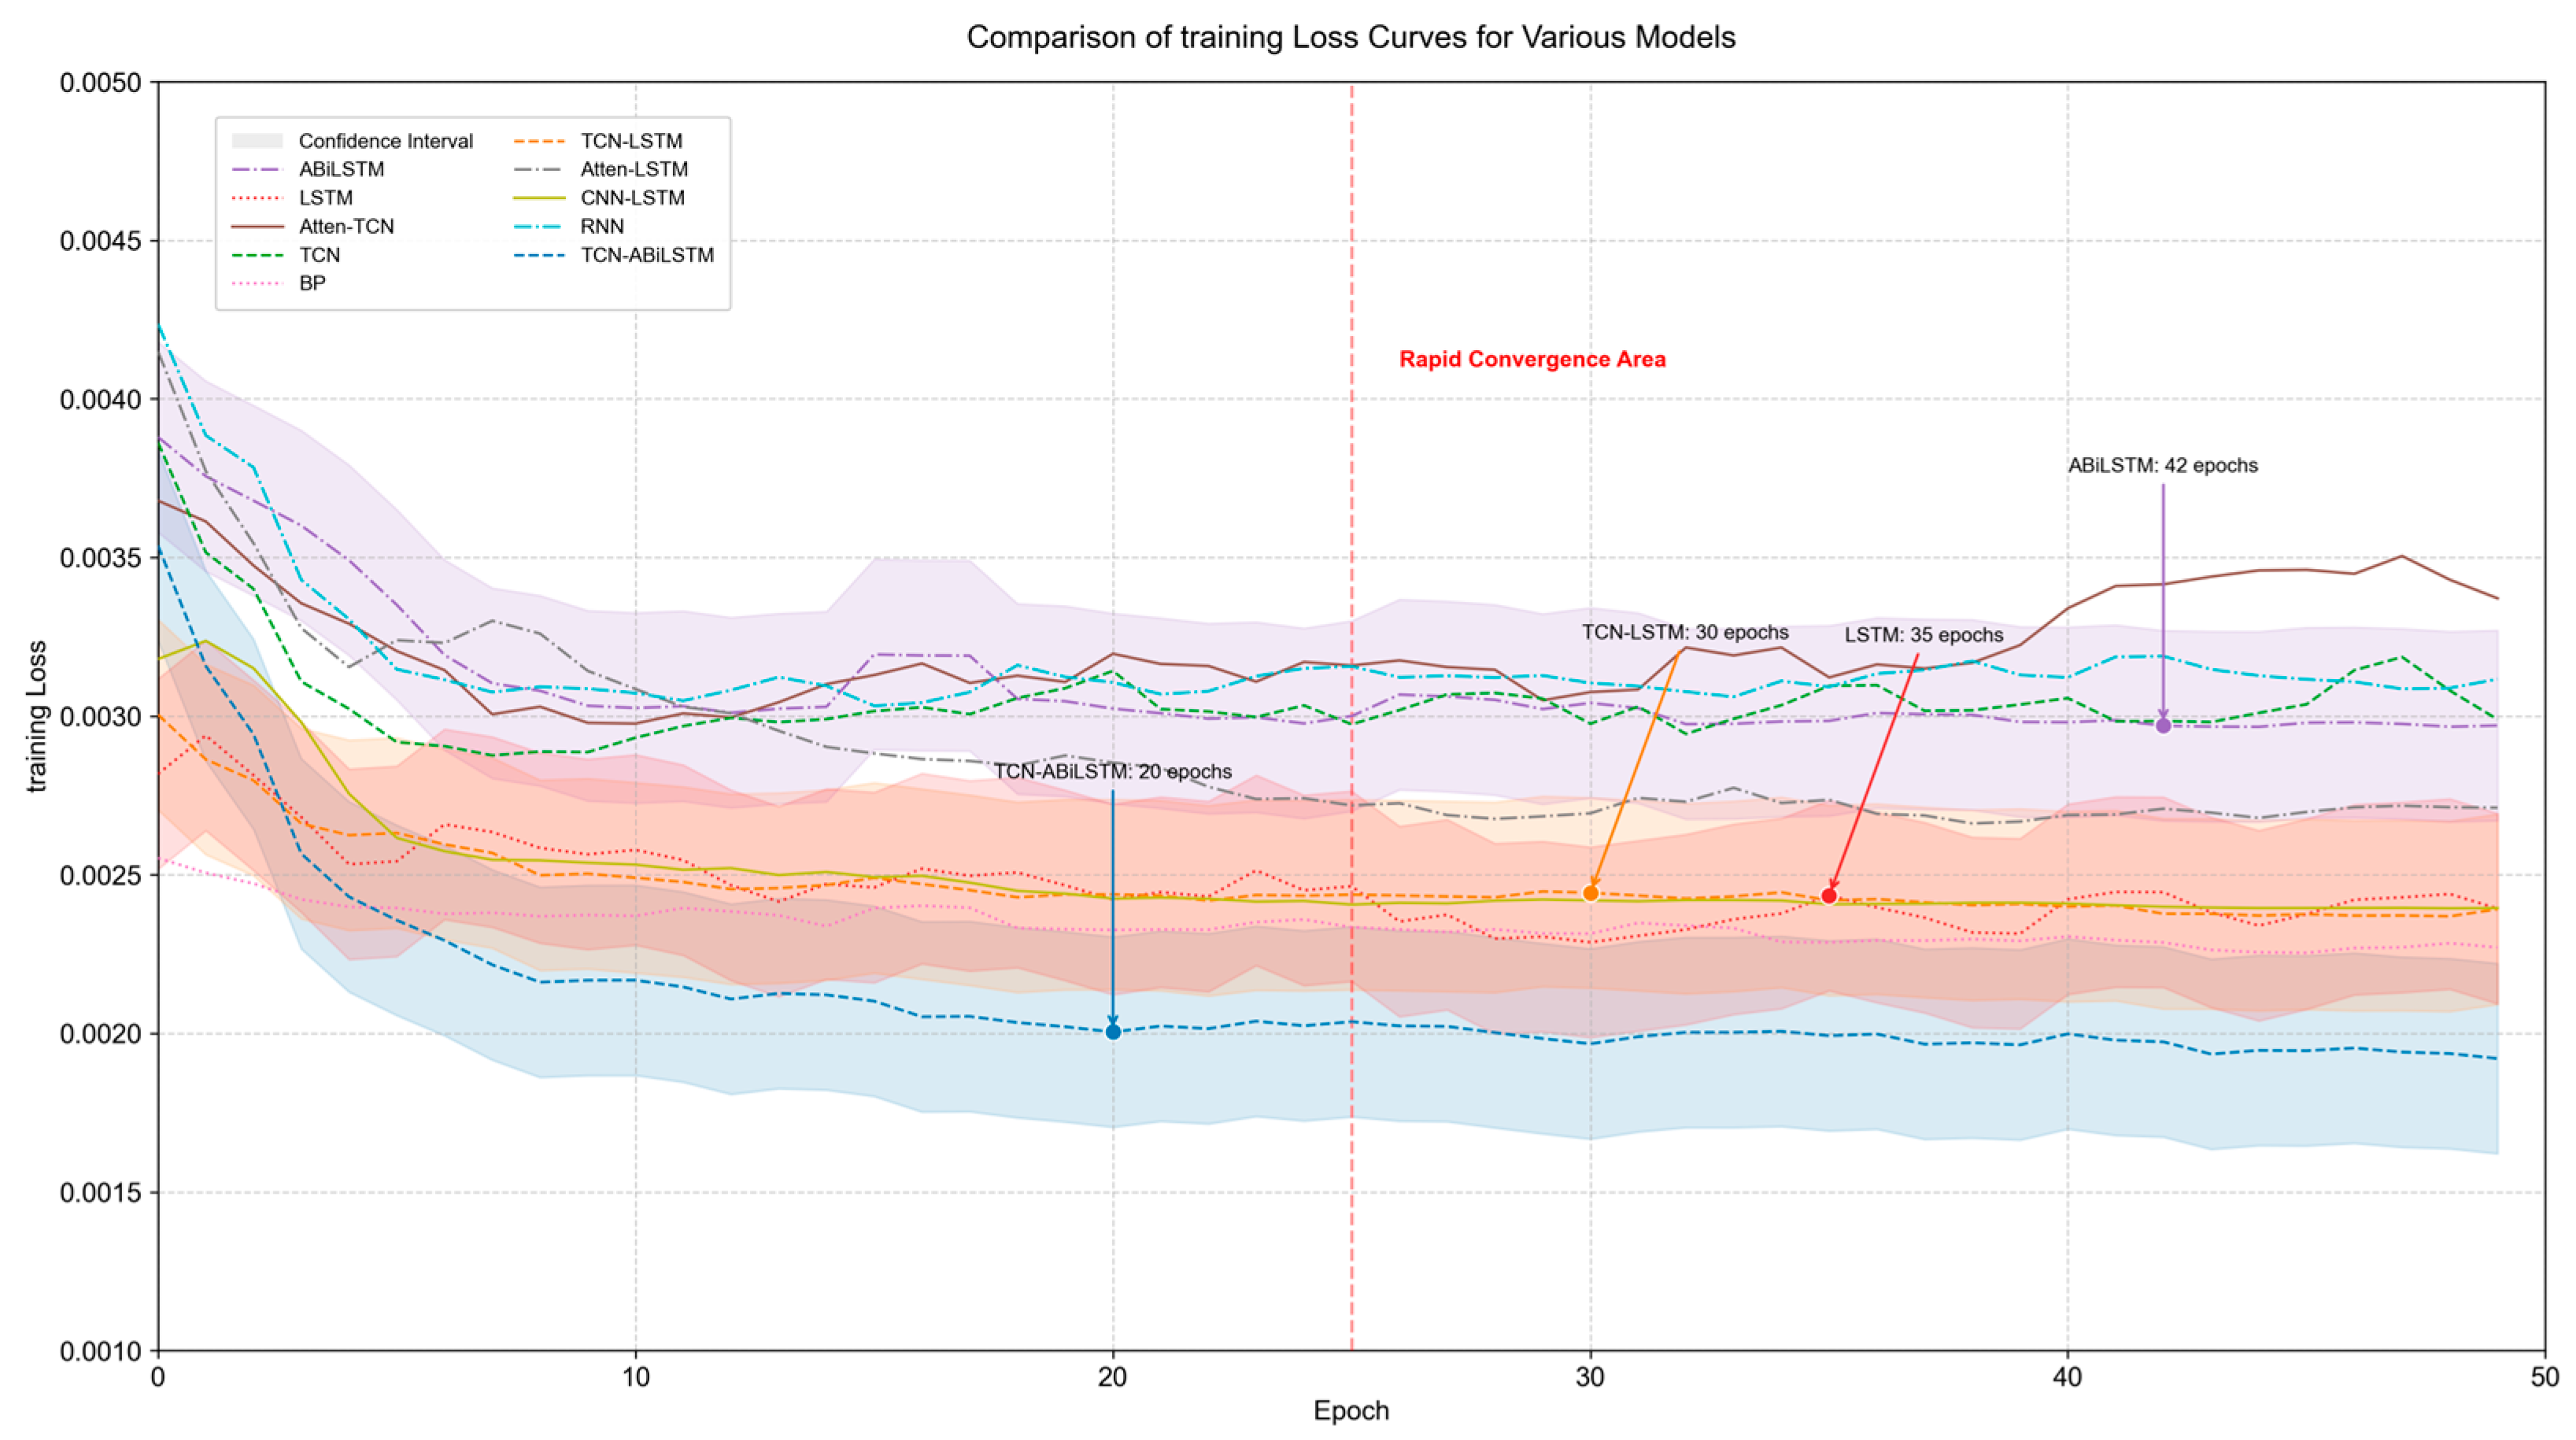
The training curves in
Figure 5 further support this interpretation.
The proposed model converges more rapidly in the early stage of training and stabilizes at a lower loss value than the baseline models. This behaviour suggests that the staged architecture provides a representation that is easier to optimize. Once the temporal structure is first extracted by TCN and then filtered by the attention layer, the subsequent BiLSTM stage no longer needs to learn from raw or weakly processed input, which may reduce optimization difficulty and improve parameter efficiency.
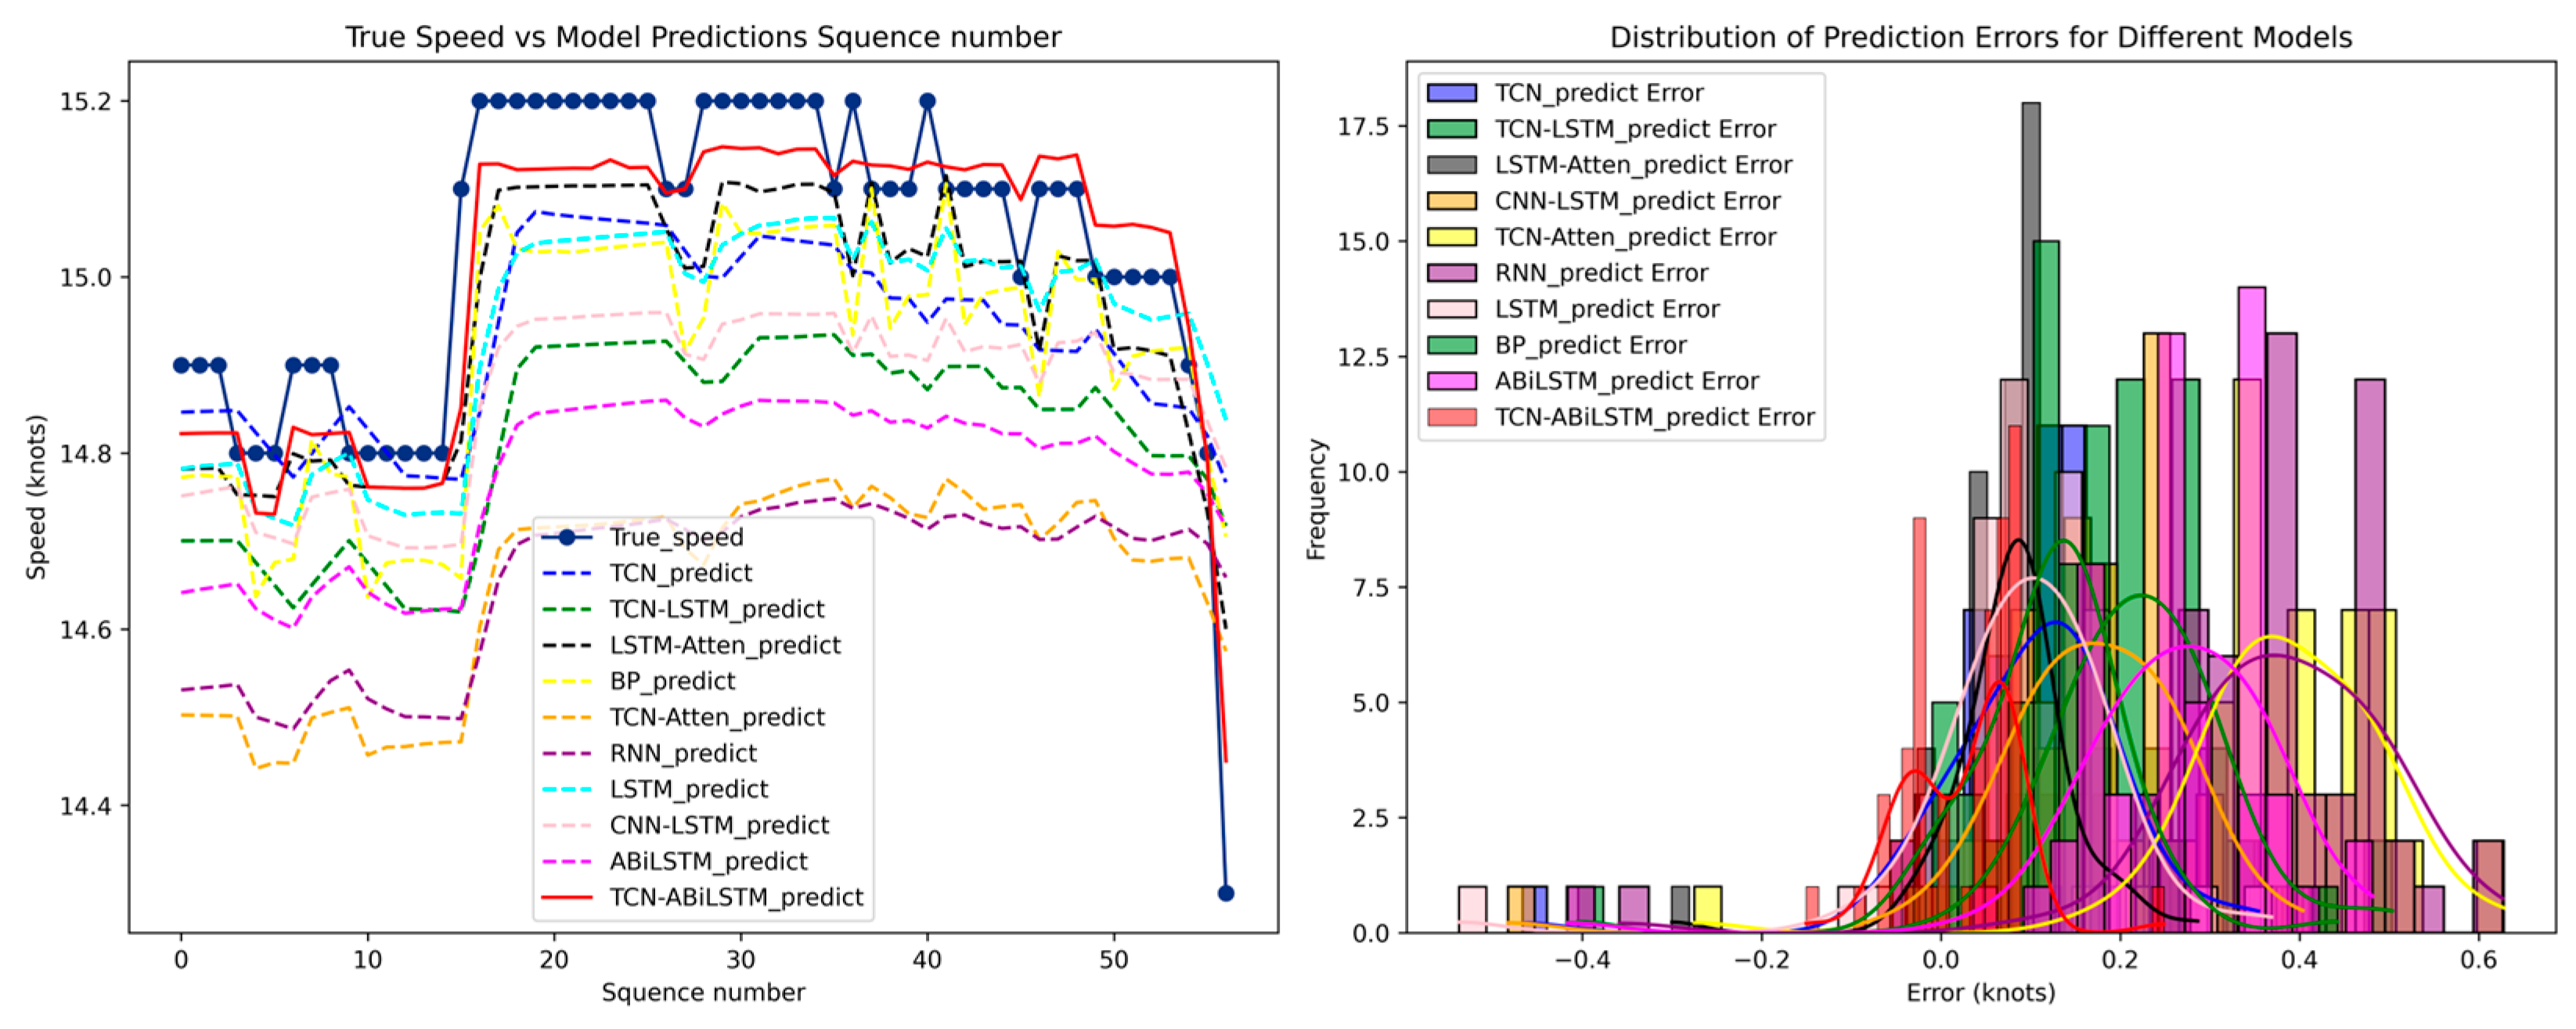
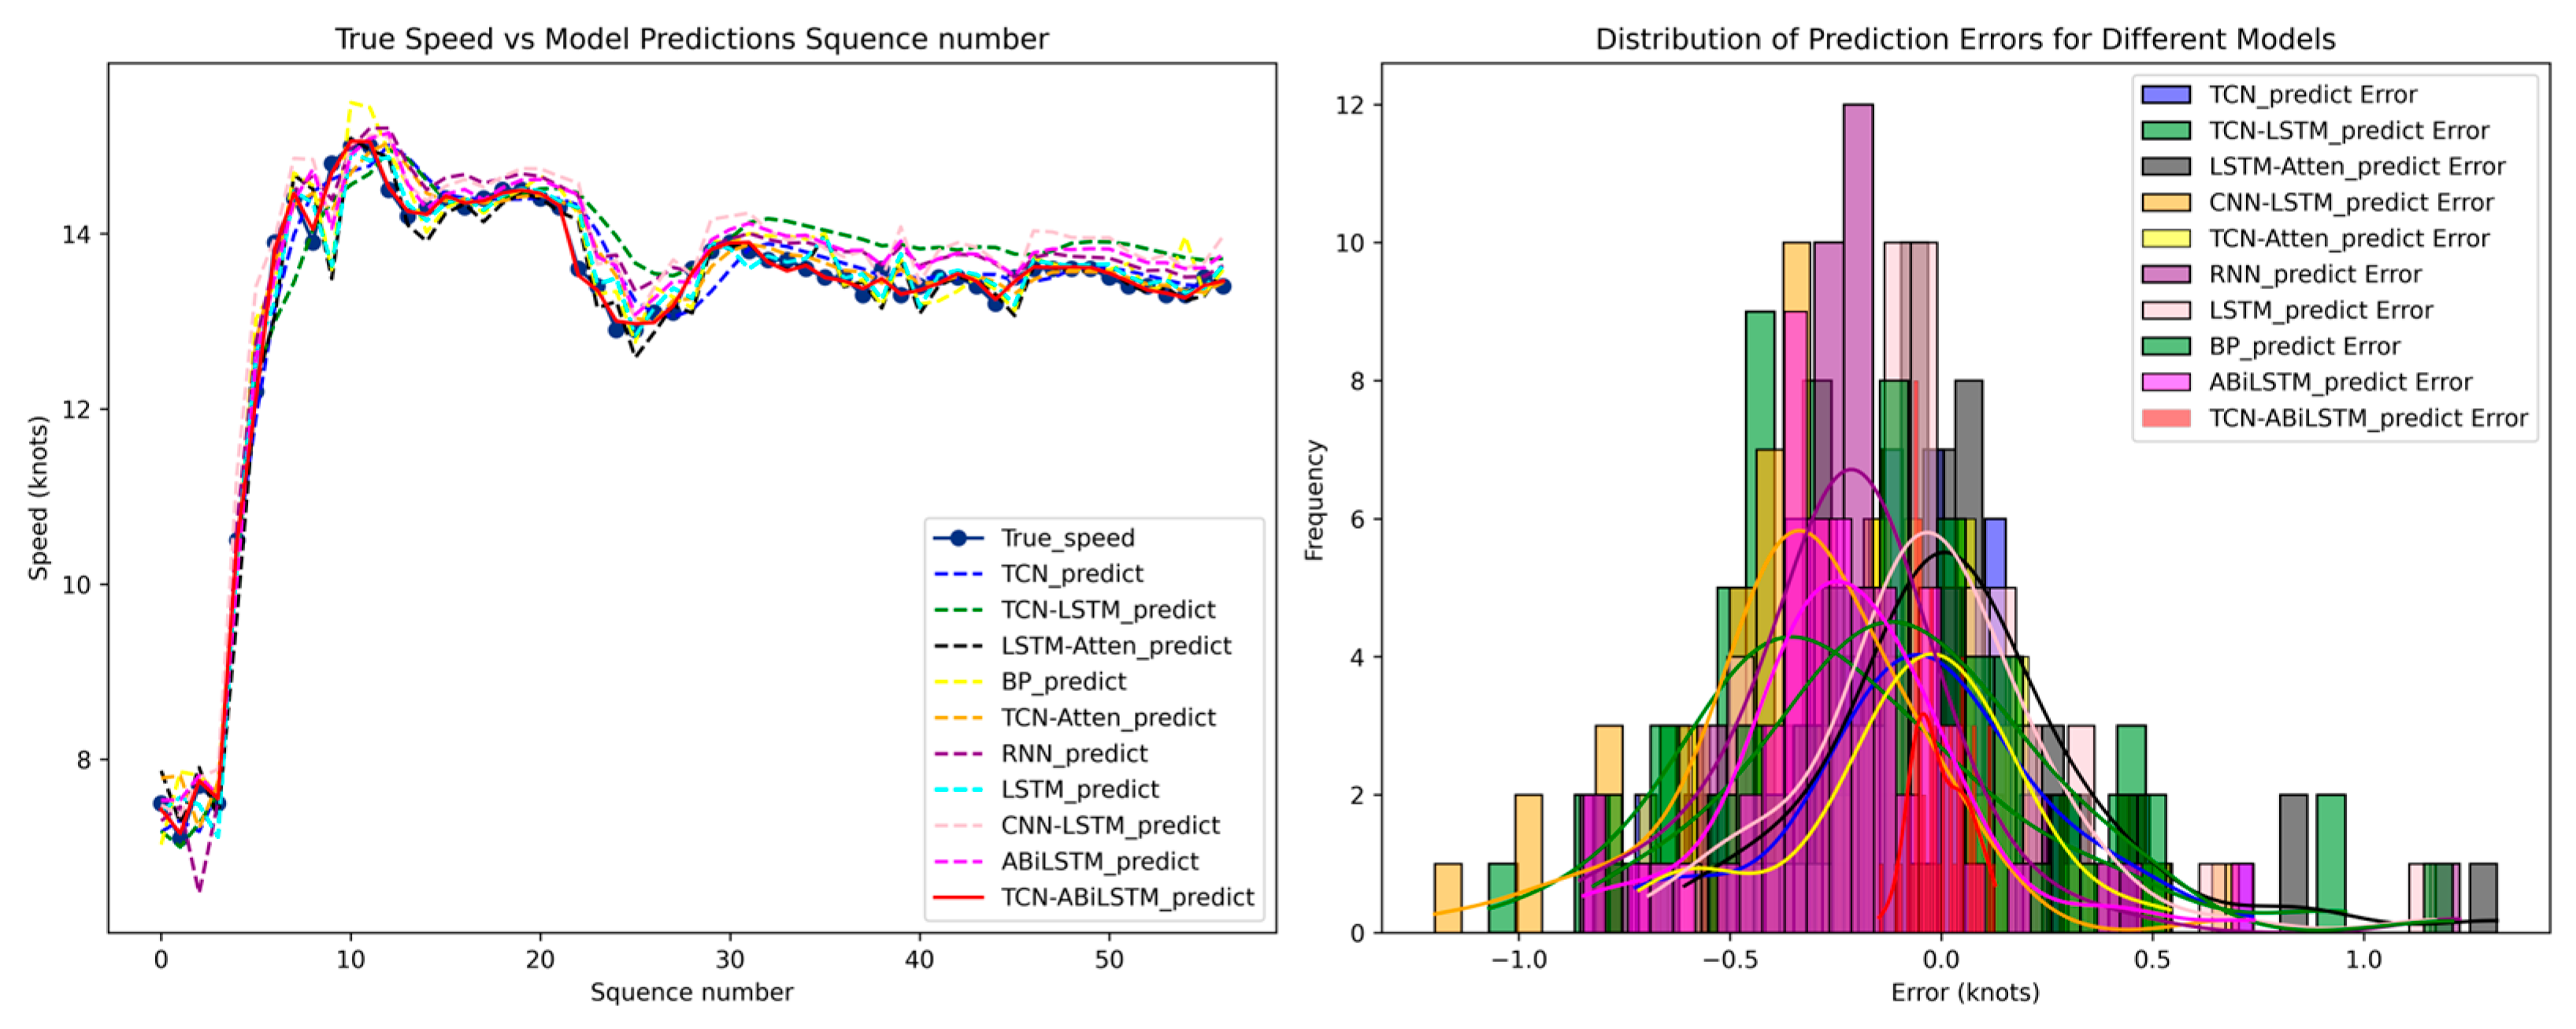
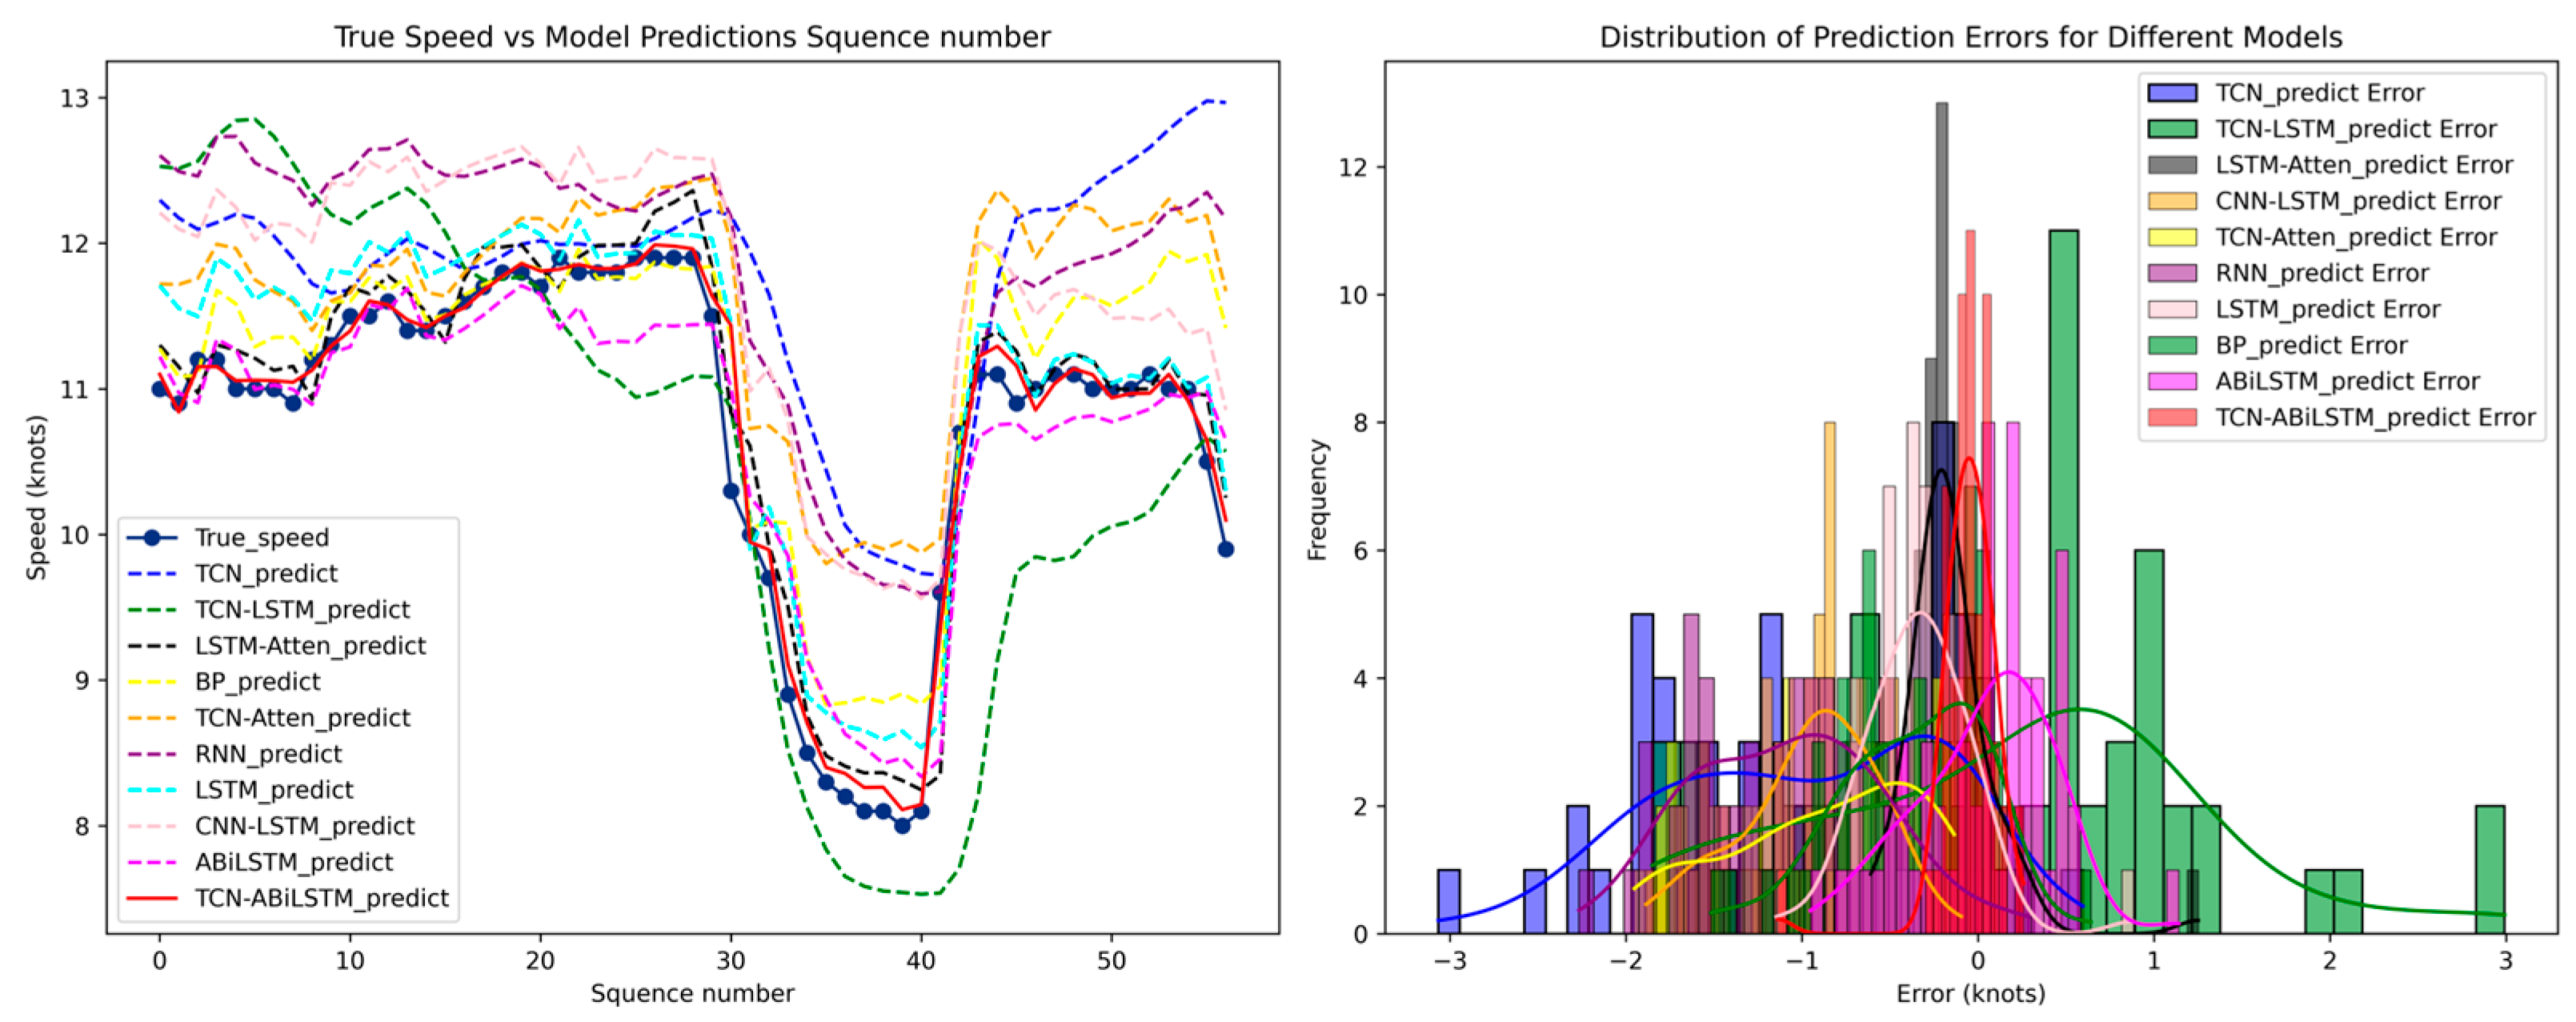
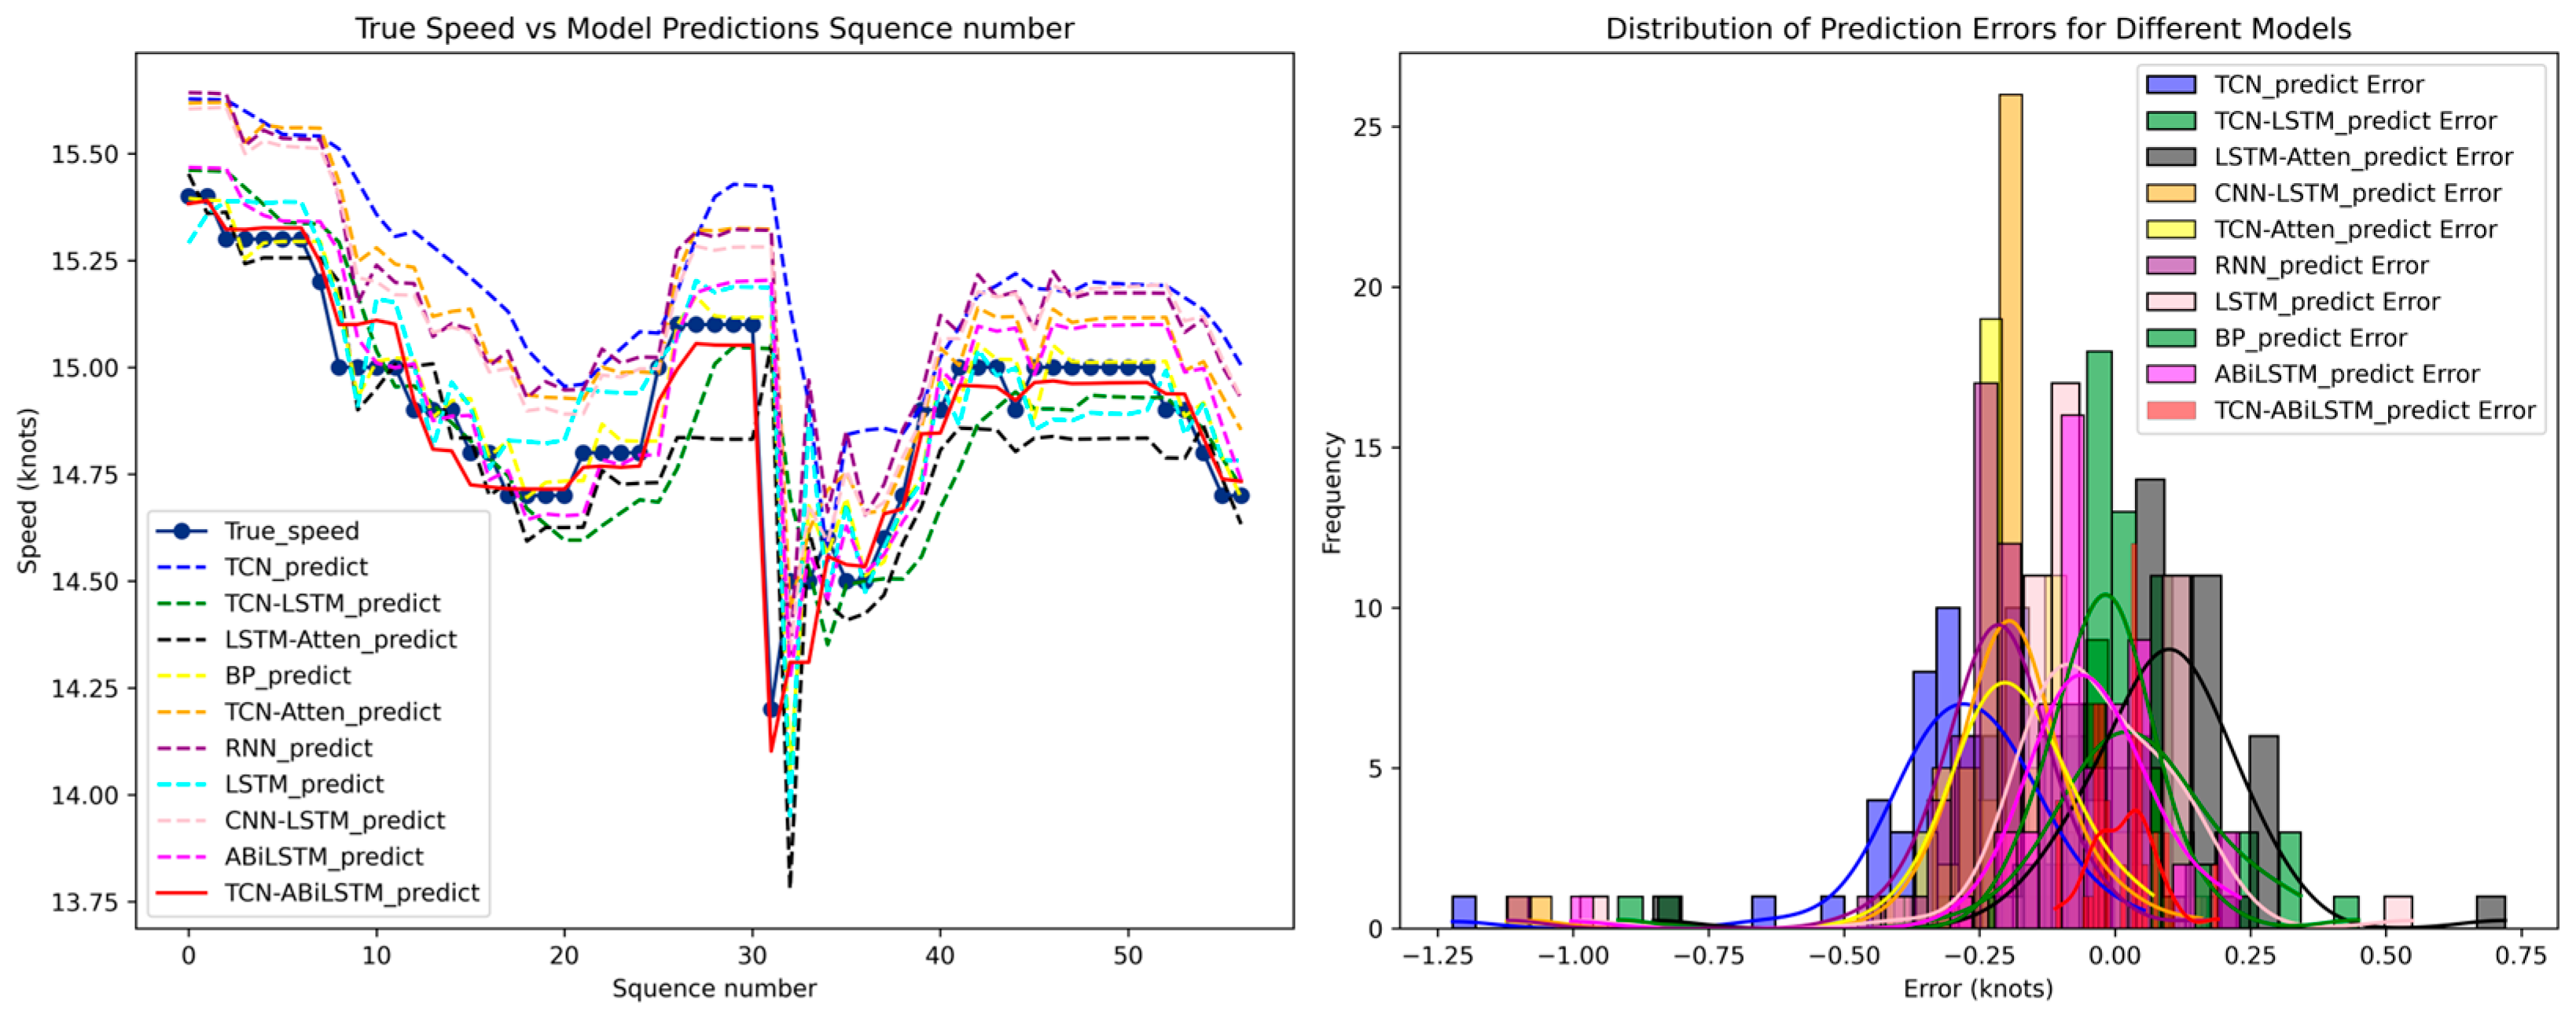
The predicted curve generated by the proposed model follows the observed speed series more closely than the baseline models, particularly in segments where the speed changes more noticeably. This observation is important because the practical difficulty of vessel speed prediction often lies not in reproducing stable cruising states, but in capturing transitions, adjustments and local fluctuations. The better fitting performance in these segments indicates that the model is not merely smoothing the sequence well, but is also more capable of representing the underlying speed adjustment mechanism in nearshore navigation.
Overall, the comparative results do more than show that the proposed model performs better numerically. They also provide empirical support for the design logic of the framework. The advantage of the model is most plausibly explained by the ordered interaction of multi-scale extraction, adaptive feature screening and bidirectional contextual modelling, which together correspond closely to the main difficulties of the task.