


Abstract
Surface topography characterization is essential for evaluating the effects of texturing processes and for describing surface-dependent phenomena. Assessing the relationships between manufacturing, surface geometries, and functional properties requires, firstly, a detailed characterization of surfaces. Conventional parameters defined in ISO 25178-2 describe the statistical distribution of surface heights relative to the mean plane, as well as the arrangement, spacing, and directionality of surface features. They also include height and spatial descriptors, functional properties derived from the Abbott–Firestone curve, and characteristics of individual topographic features, such as peaks and valleys, including their shape, volume, and distribution. While these parameters provide a valuable description of the surface, they are not intrinsically multiscale and provide only a single aggregated descriptor of the surface. Therefore, multiscale parameters complement this description by capturing relative areas and area-scale fractal-like complexity across geometrically decomposed surface features over a range of scales from the nano and micro to the macro scale. The main objective of this study is to evaluate correlations between conventional and multiscale topographic parameters, based on surfaces produced by electrical discharge machining (EDM). The novelty of this study lies in the integrated analysis of correlations between conventional and multiscale parameters, enabling a more comprehensive framework for surface characterization.
1. Introduction
Surface topography can be described using various approaches, which differ mainly in the processing and interpretation of measurement data. The most basic approach represents the surface using an areal measurement dataset; i.e., raw topographic heights (z) in an (x, y) coordinate system, often visualized as a 3D height image [1]. For standardized analysis, a second –approach converts raw topographic heights into conventional topographic parameters defined in the ISO 25178-2 standard [2]. These parameters are divided into five groups: height (distribution of heights), spatial (arrangement and directionality of features), hybrid (slope and surface development), feature (characteristics of individual features such as peaks, valleys, pits), and functional (material and void volumes, related to surface performance). ISO 25178-2 parameters enable a standardized and comparable characterization of surface topography [3]. However, each conventional parameter provides a single-scale representation of the surface, focusing on statistical properties of heights without differentiating micro- and macro-scale surface structures [4]. Multiscale methods provide a third approach to surface characterization by capturing scale-dependent features, separating form, waviness, and roughness, and assessing the effect of topographic scale on functionality [5]. The most comprehensive surface characterization combines raw topographic heights, ISO 25178-2 parameters, and multiscale methods [6].
Correlations between surface topography parameters can reveal relationships among different metrics, providing insights into surface geometry and identifying which parameters capture complementary aspects of surface features [7]. This analysis provides a quantitative assessment of the relationships between individual parameters and the topographic information they represent. Additionally, it facilitates the evaluation of the relationships between multiscale parameters and standardized ISO parameters [8]. From a practical perspective, correlation analysis helps identify representative parameter sets for surface modeling and functional evaluation, particularly in tribological applications [9]. An in-depth characterization of surface topography is crucial because surface features strongly influence the functional properties of surfaces, including wear [10], wettability [11,12], lubrication [13], and corrosion [14]. A comprehensive approach that integrates multiple parameters across relevant scales is therefore essential to understanding and predicting the functional behavior of surfaces [15,16].
The machined surfaces are assumed to be best characterized by well-correlated pairs of conventional surface texture parameters, such as Sq (root mean square height)/Sa (arithmetical mean height) and Sp (maximum height of peaks)/Sz (maximum height) [17]. Moreover, the height parameter Sq shows a strong correlation with hybrid parameters of functional surfaces, primarily related to wear phenomena [18]. Previous studies have shown that Std (texture direction) is considered the most independent parameter, while Sa/Sq are regarded as well-representative parameters [19]. Hybrid parameters imply that Sdr (the developed interfacial areal ratio) can be estimated from Sdq (the root mean square slope). Hybrid parameters are strongly dependent on lateral resolution, decreasing as the sampling distance increases. Therefore, for cross-correlation analysis, it is important to report the measurement parameters [20].
Conventional surface texture parameters provide a reliable basis for evaluating the relationship between surface topography and functional performance [21]. Topographic features at different scales influence surface phenomena in a scale-dependent manner. Therefore, correlations between surface texture and functional performance require multiscale analysis and careful selection of appropriate observation scales [22]. Multiscale parameters, such as relative area, relative length, area–scale fractal complexity, and length–scale fractal complexity, can be effective in characterizing and quantifying surface texture across different scales [12]. Thus, multiscale parameters can be distinguished into those dedicated both to areal surface analysis and to profile analysis. Areal parameters are applicable to both isotropic and anisotropic surfaces, representing the most general and versatile approach to surface topography description. Length-based parameters provide an adequate description of isotropic surfaces, independently of the direction of profile extraction. For anisotropic surfaces, however, it is necessary to consider profiles measured in multiple directions, which enables the identification of variations in topographic characteristics depending on surface direction.
EDM (electrical discharge machining) enables controlled modification of surface topography through electrical discharges, allowing specific surface textures and various scale-dependent topographic features to be produced [23]. The morphological characteristics of discharge craters formed on the surface depend on the machining parameters. The primary process parameters are voltage U, current I, and pulse duration t. In general, crater volume is governed by the pulse energy E = U·I·t, while crater depth is mainly influenced by the discharge current and crater width by the pulse duration [24]. Electrodes are most commonly made of coarse- or fine-grained graphite and copper, and less frequently copper–tungsten. High-roughness textures with the highest efficiency are typically produced using coarse-grained graphite electrodes. Surface topography parameters, both conventional and multiscale, quantitatively describe the generated textures and enable comparison of different texturing conditions [25,26]. Therefore, the selection of appropriate topographic parameters and knowledge of the relationships between them are essential for evaluating EDMed surfaces [27].
The main objective of this study is to provide a comprehensive characterization of surface topography using different parameters and analysis approaches, including 3D height maps, conventional ISO 25178-2 parameters, and additional multiscale calculations. The study focuses on identifying relationships between electrical discharges and surface topography characteristics. The novelty of this research lies in the analysis of correlations within and between conventional and multiscale topographic parameters, which has not been previously reported in the literature. The wide range of topographic parameters and methods makes parameter selection and the interpretation of their relationships challenging. Therefore, this paper compares and integrates different topographic parameters to identify their interrelationships.
2. Materials and Methods
The Ti-6Al-4V titanium alloy (grade 5), textured by EDM, was used for surface topography characterization and for evaluating the correlations within and between conventional and multiscale topographic parameters.
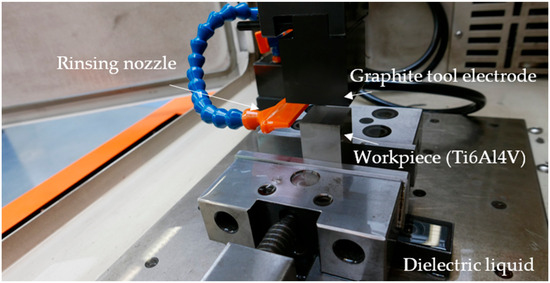
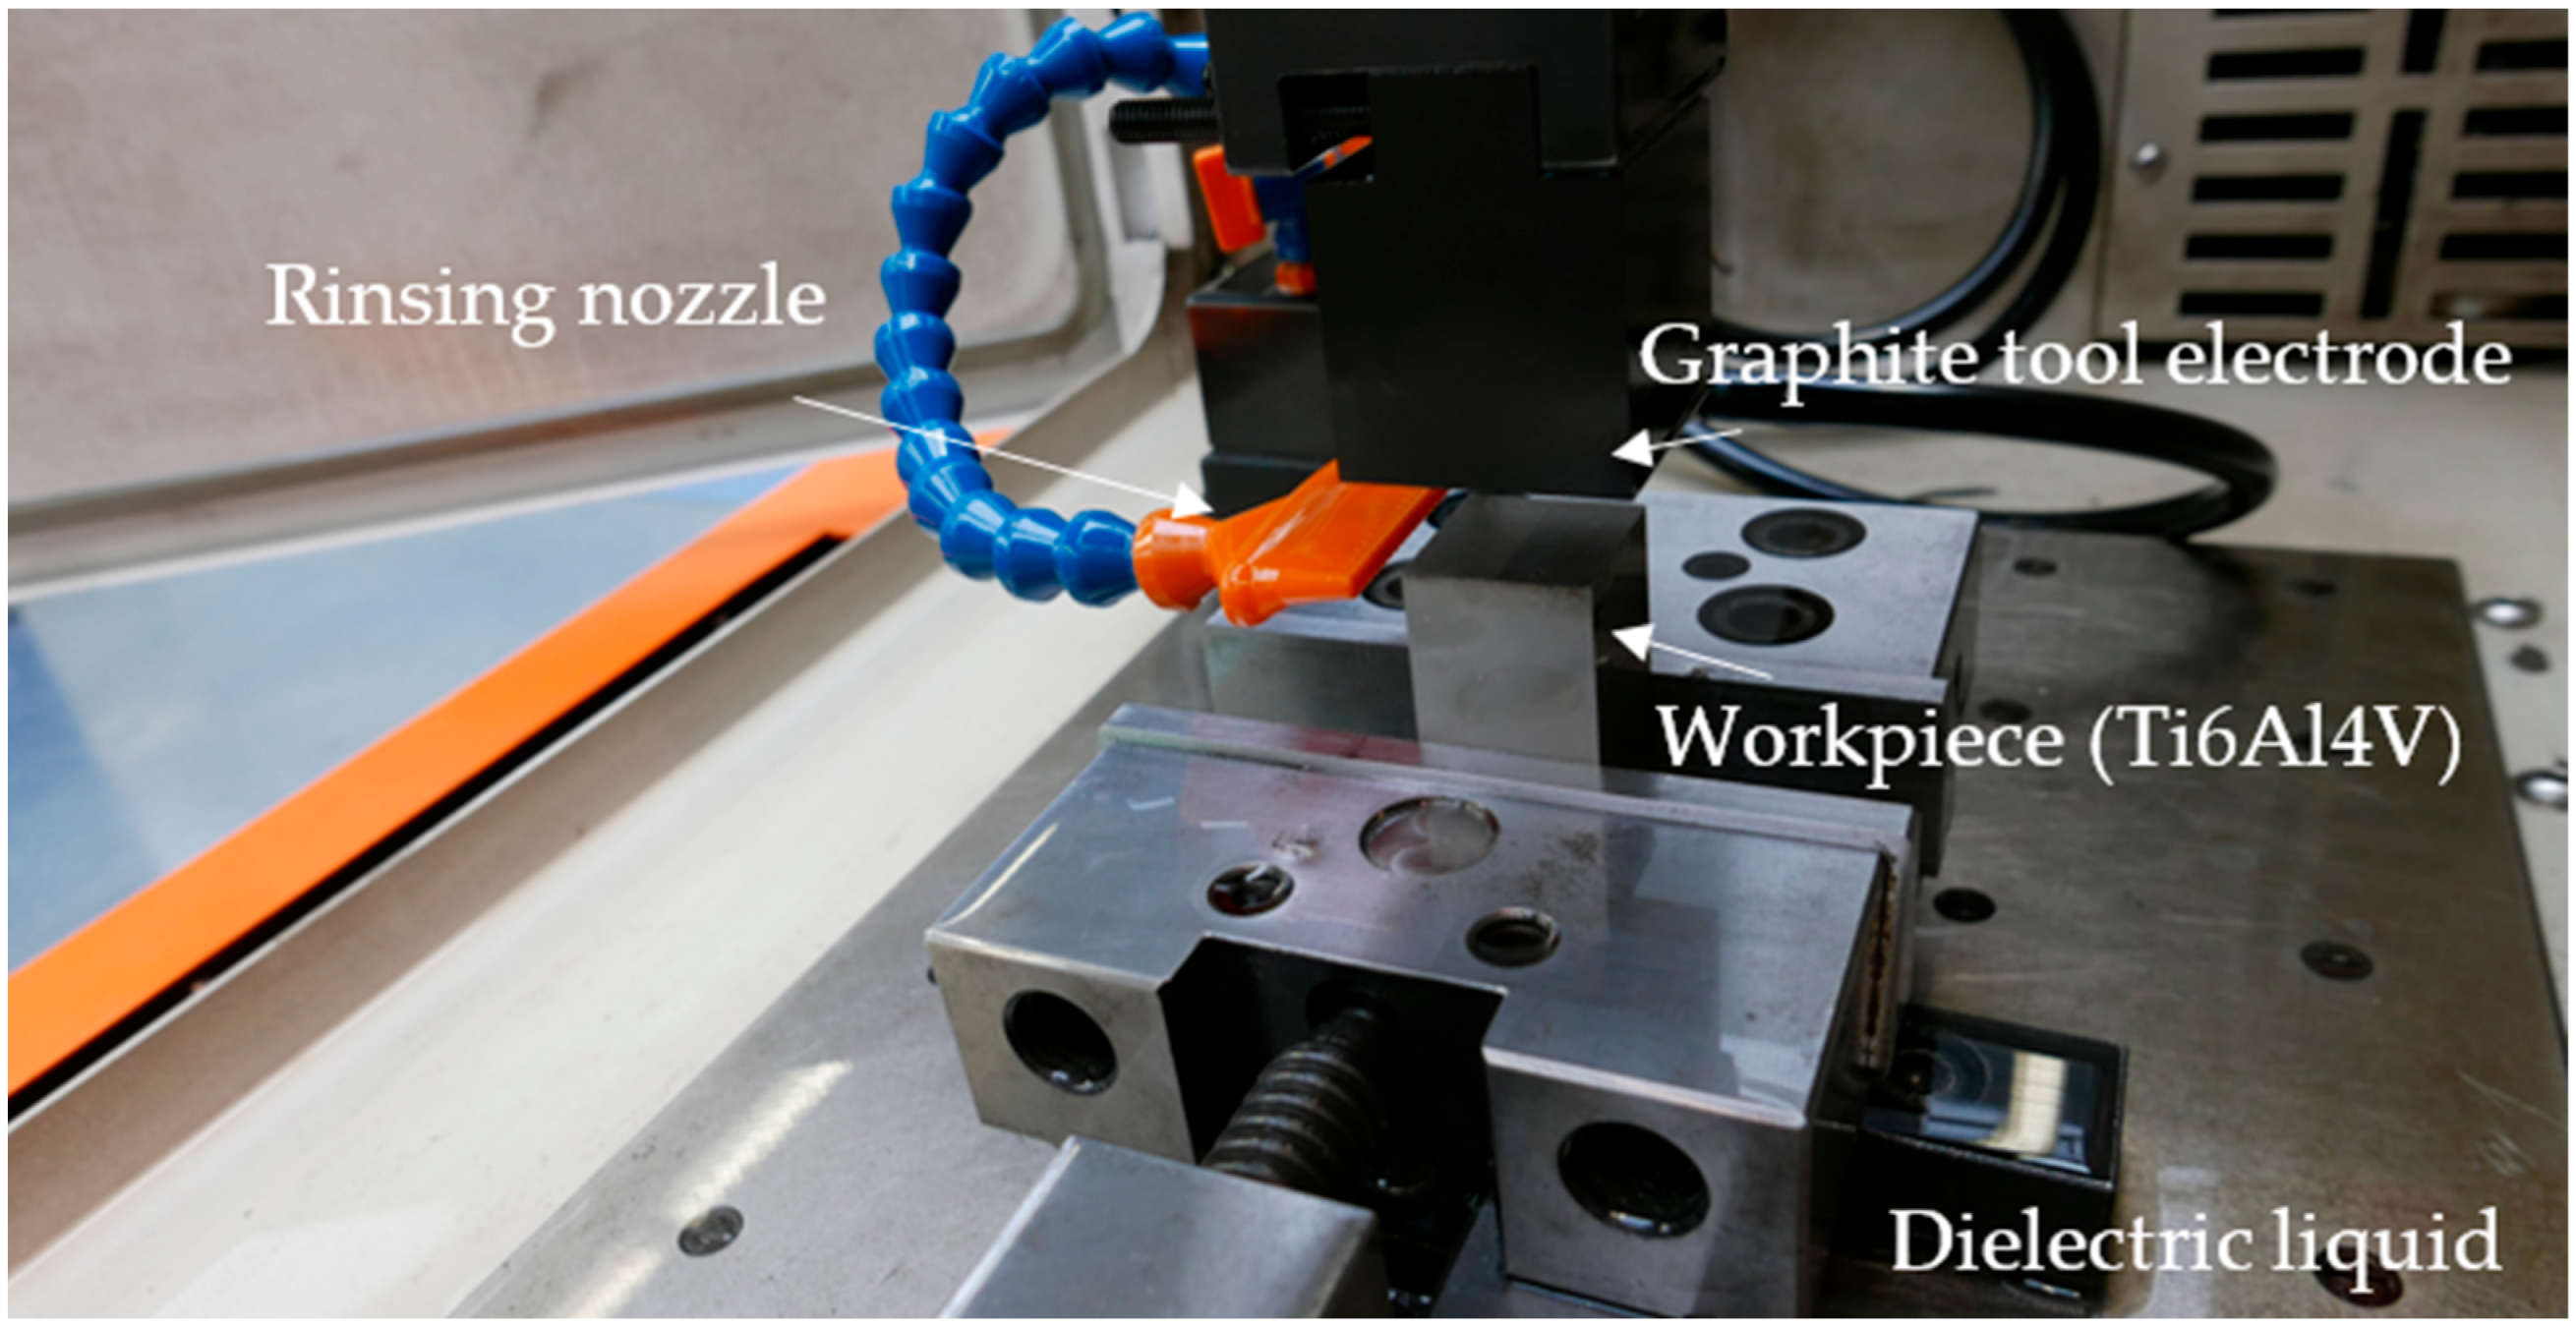
Surface texturing by electrical discharge machining (EDM) (Figure 1) was carried out on an Agie Charmilles SP1U machine, GF Machining Solutions (Biel/Bienne, Switzerland). Two types of Takai Carbon graphite electrodes were applied: HK-3 (for surfaces S1–S3) and HK-20 (for surfaces S4–S8). The HK-3 graphite has fine grain size of 2 μm, and a VDI 3400 surface texture of 16. The HK-20 graphite has standard grain size of 6 μm, and a VDI 3400 surface texture of 24. During EDM processing, both the electrode and the workpiece were immersed in the 108 MP-SE dielectric fluid.
Figure 1.
EDM setup schematic showing the electrode and workpiece arrangement.
The selection of EDM parameters was determined by the machine’s control system (Table 1). The machine’s automated control, configured for the specific electrode material and workpiece, enabled achieving surface finishes in accordance with the VDI 3400 standard [28], which defines 45 classes based on the arithmetic mean height Ra/Sa, calculated as VDI class = 20 log(10 Ra). Each combination of pulse parameters produced distinct discharge energies, which directly influence both the machining efficiency and the surface roughness. Higher discharge energy accelerates material removal but also leads to rougher surfaces [29].
Table 1.
EDM parameters.
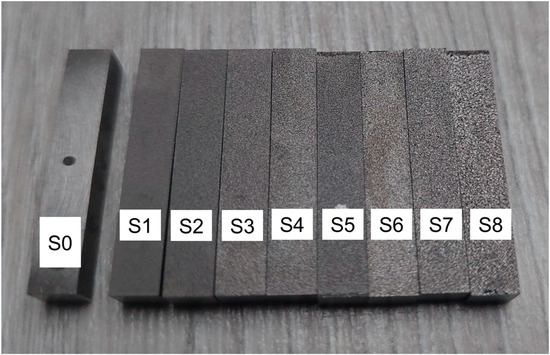
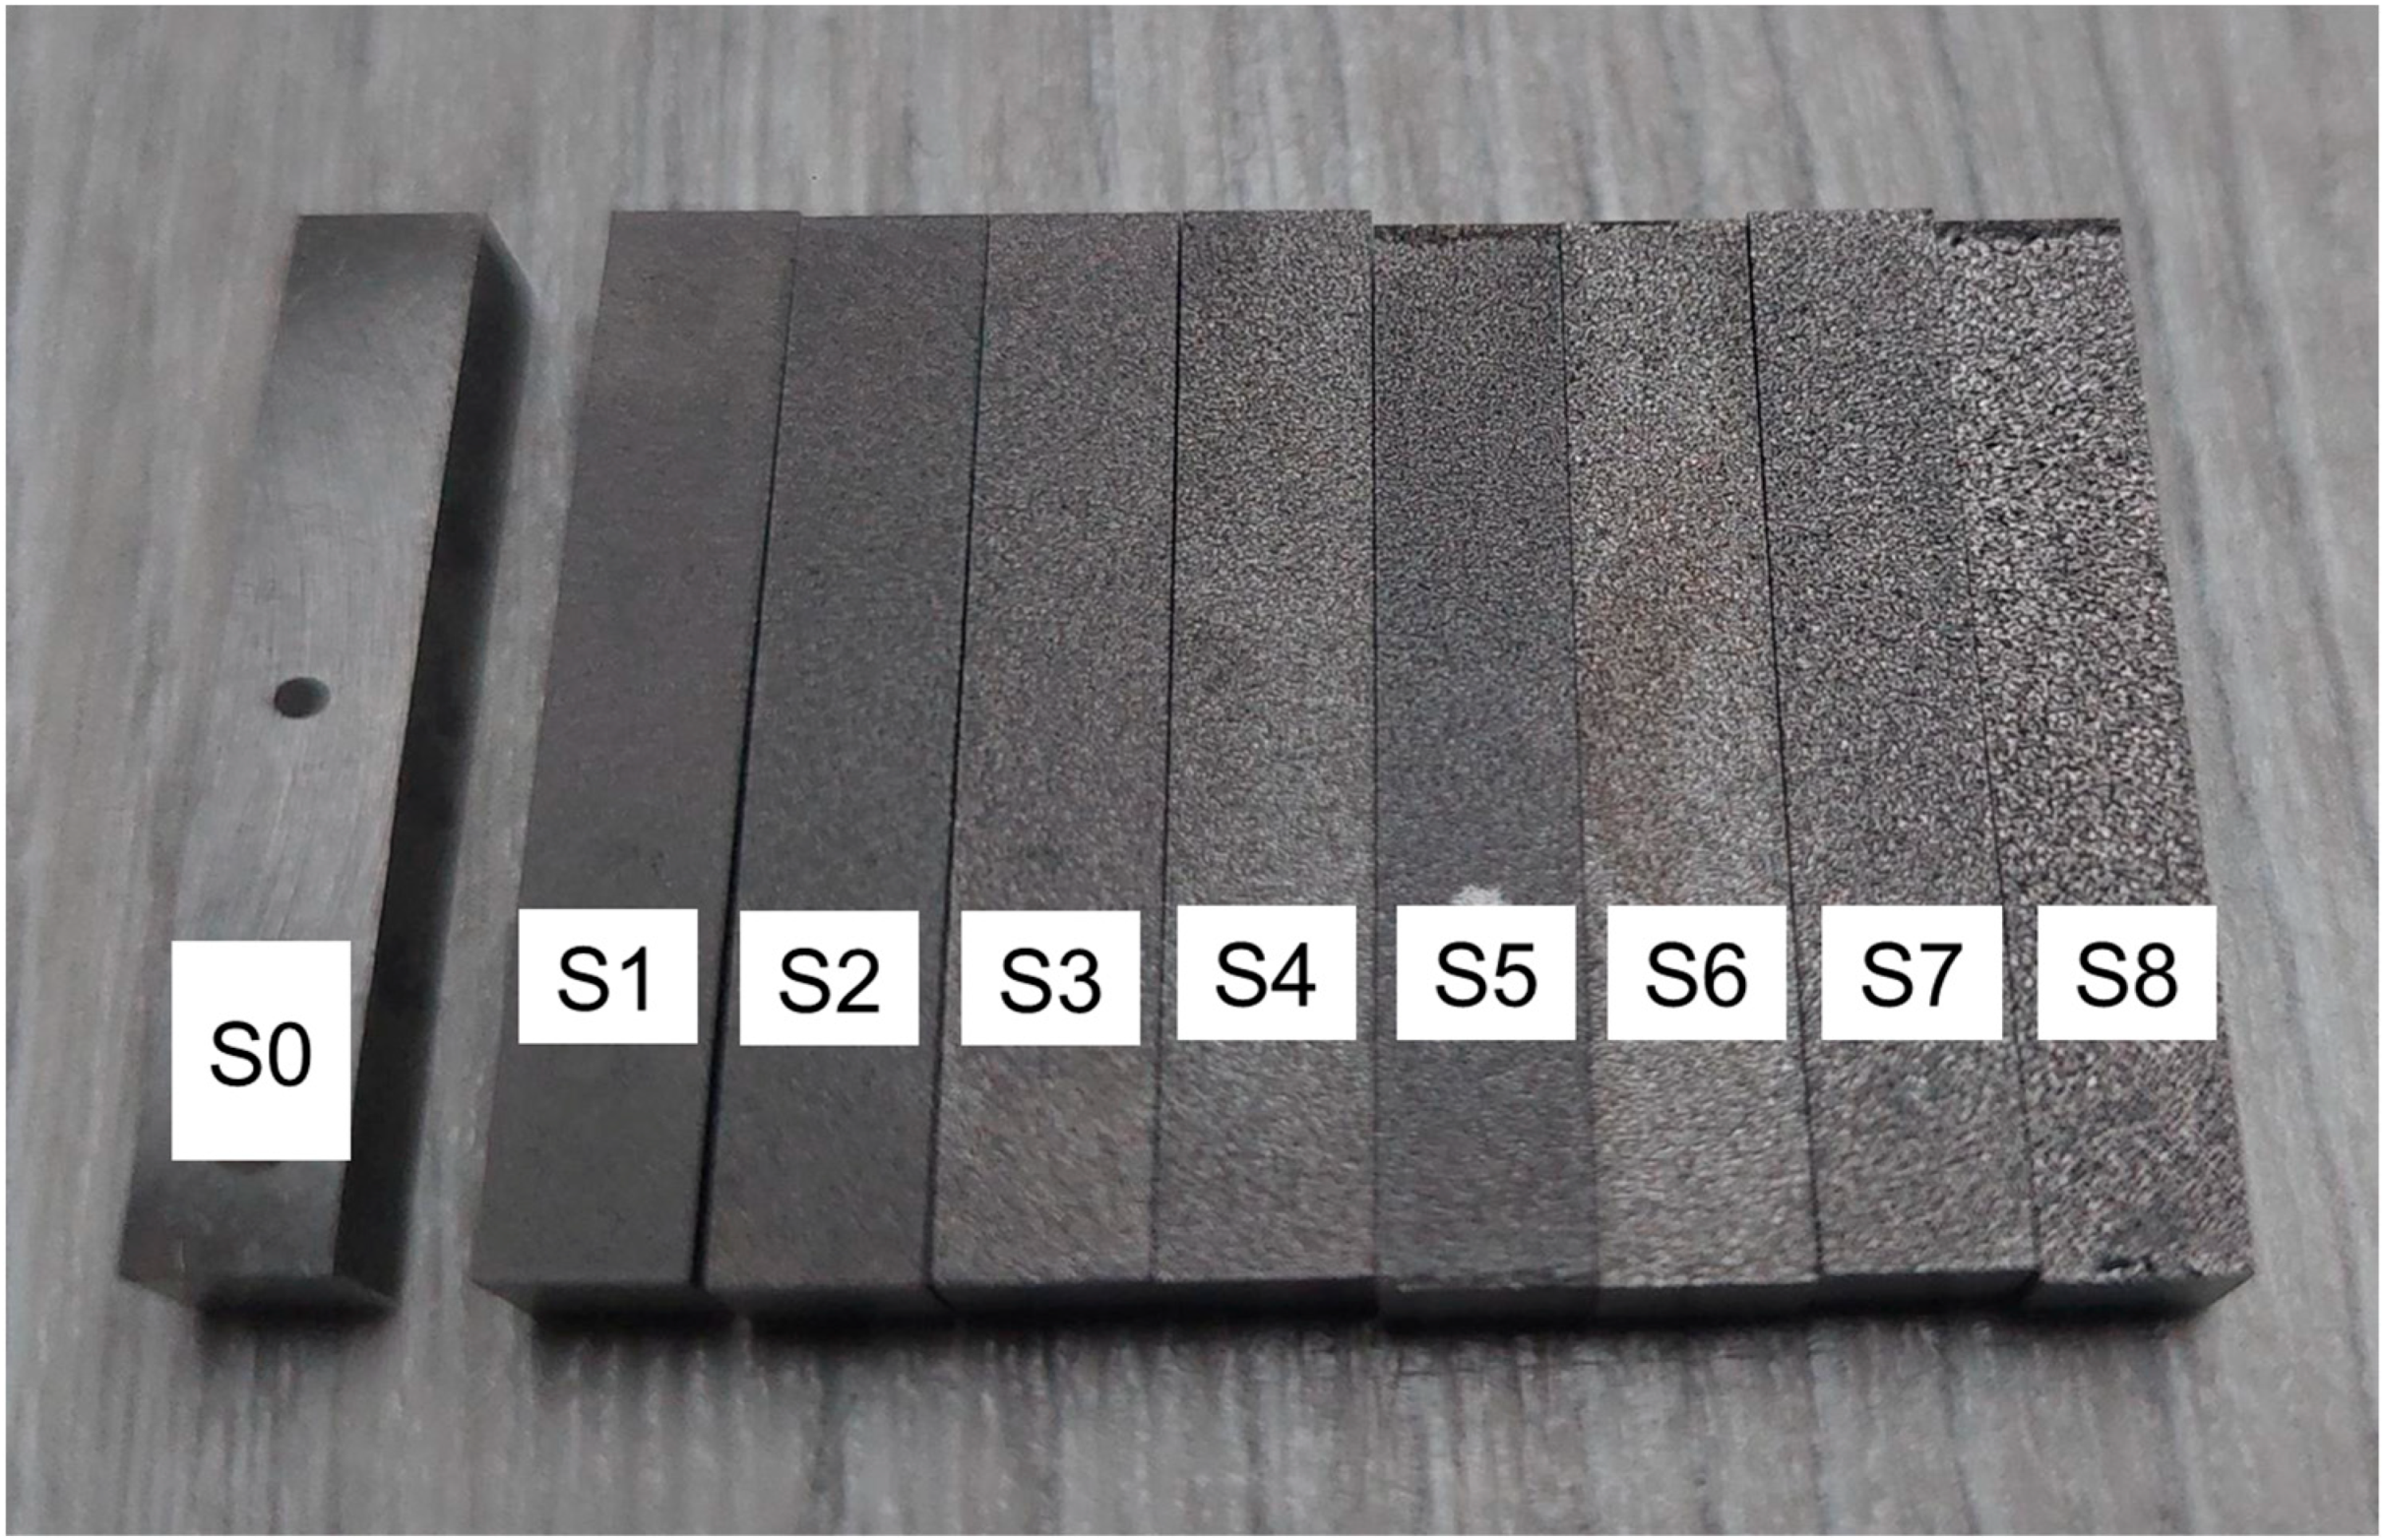
The workpiece was EDMed over an area of 28 mm × 28 mm. Subsequently, a 5 mm thick cuboid was sectioned from the square titanium alloy rod using wire EDM in deionized water (Figure 2). Following machining, the worn surface layer of the electrode was removed by face milling.
Figure 2.
EDM-textured surfaces S1–S8, with an additional view of the polished surface S0 prior to EDM.
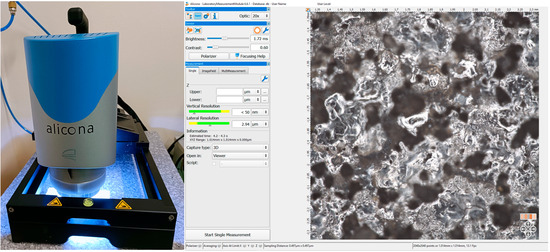
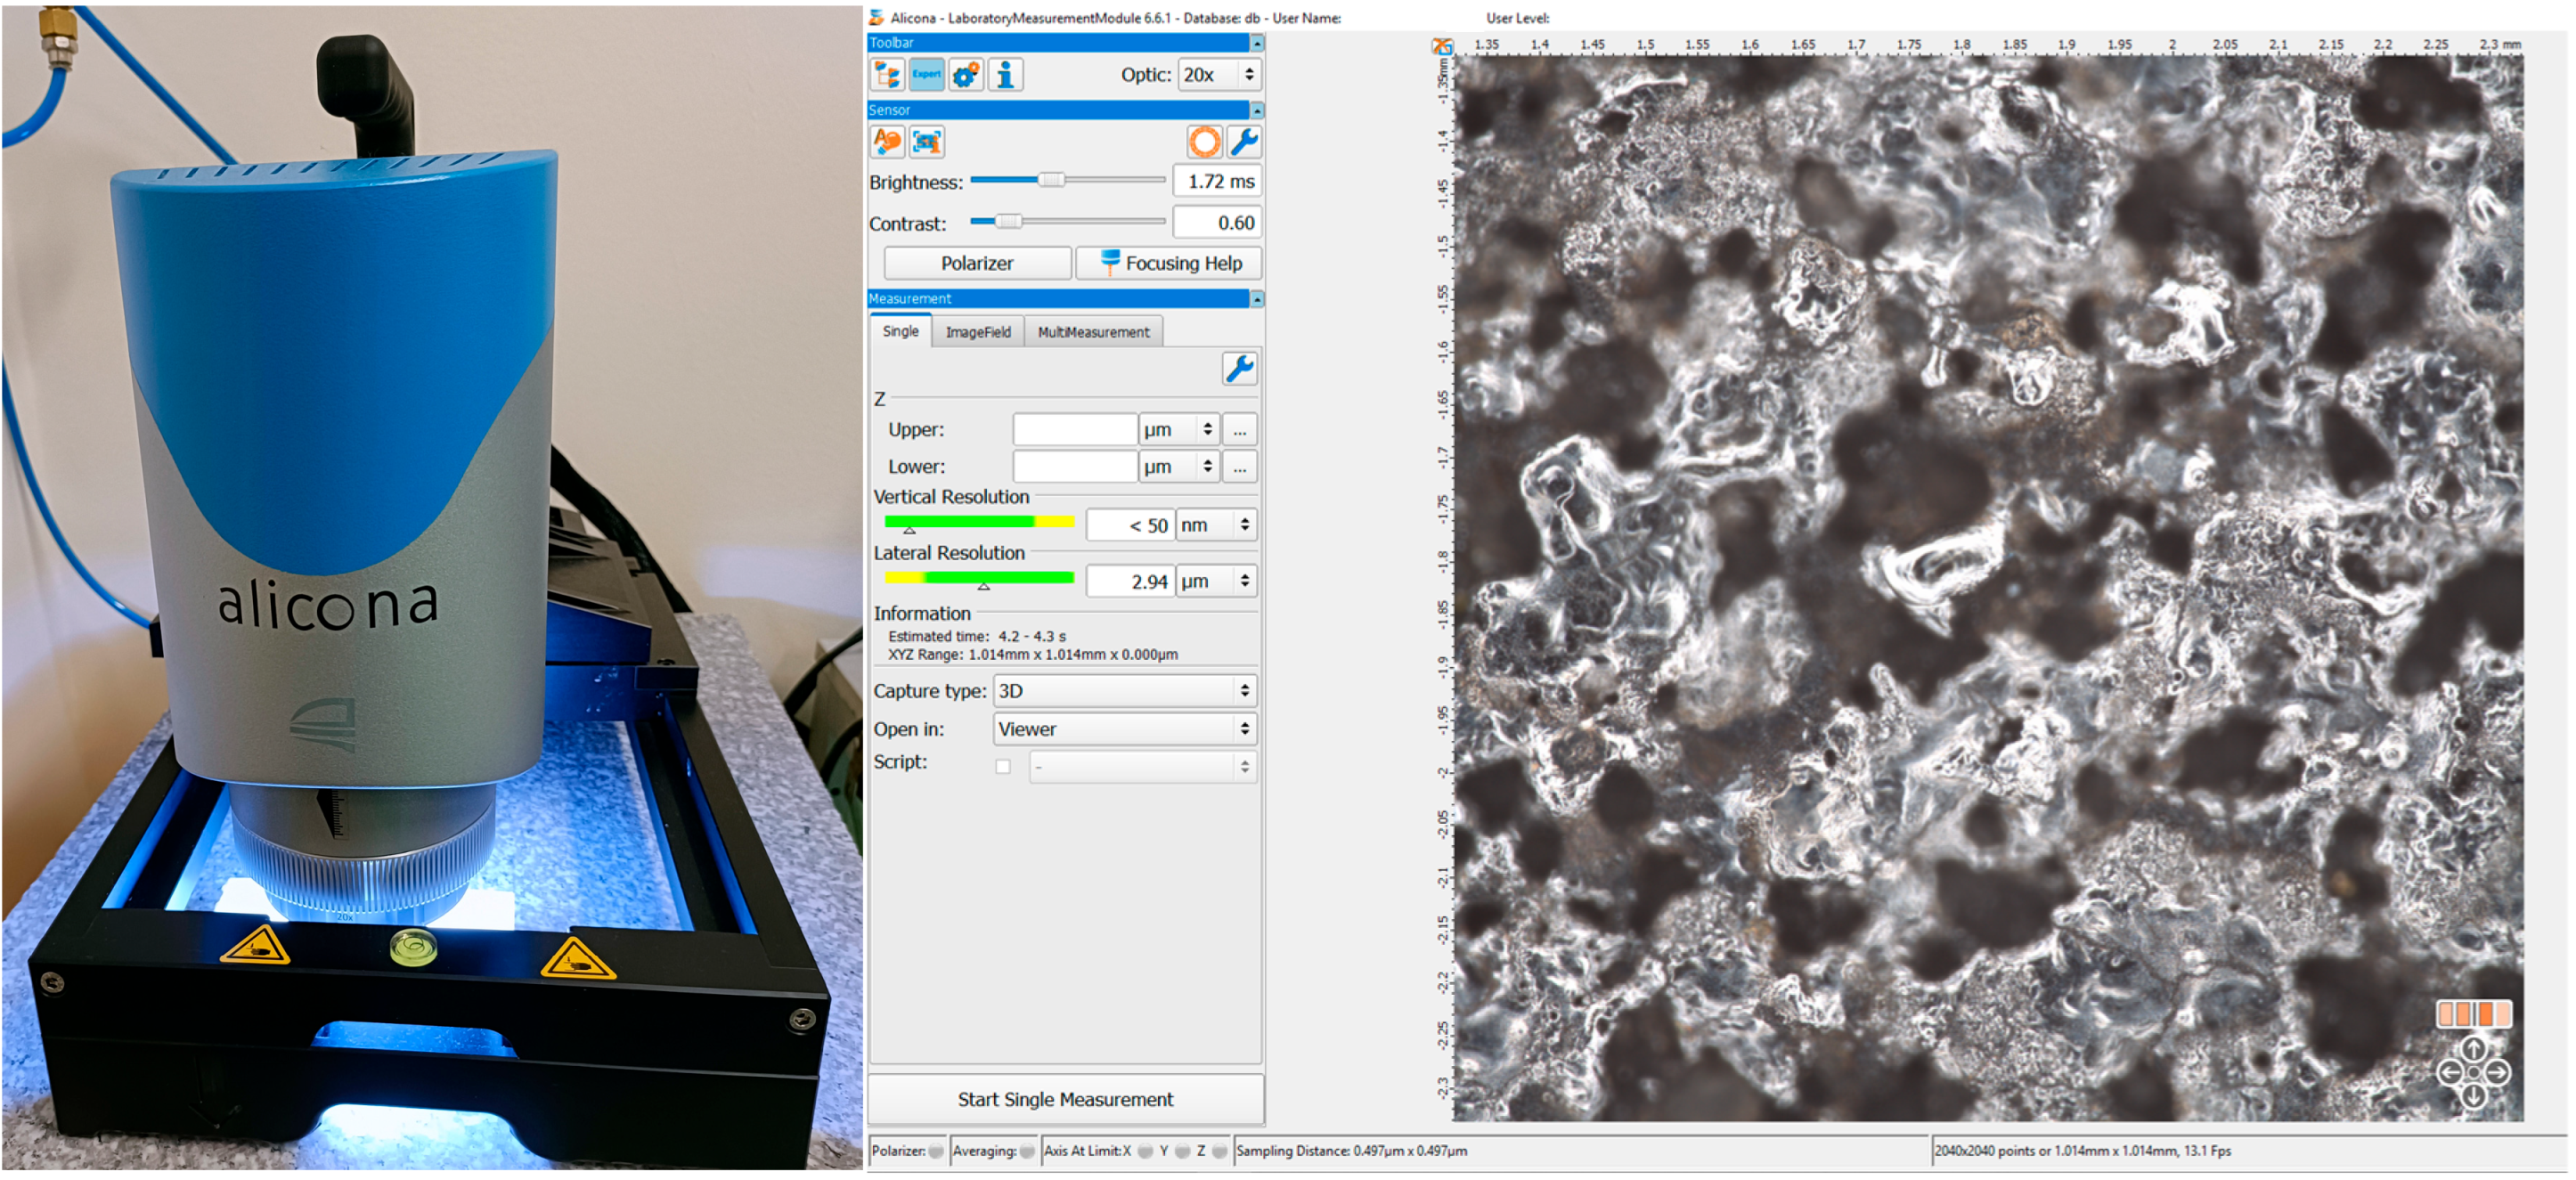
Surfaces containing EDM process residues were cleaned in a three-step procedure: first, they were ultrasonically cleaned in distilled water for 3 min, then rinsed with isopropyl alcohol, and finally rinsed with acetone. The EDMed workpieces were analyzed for surface topography using an 3D optical microscope—Bruker Alicona IF Portable (Graz, Austria). Measurements were performed at 20× magnification, with a vertical resolution of <50 nm, lateral resolution of 2.94 µm, sampling distance of 0.497 µm, and a field of view of 1.014 × 1.014 mm, 2040 × 2040 points (Figure 3). Focus Variation Microscopy (FVM) measures surface topography by analyzing image sharpness at different vertical positions. The workpiece is illuminated, and only regions in sharp focus are recorded [30,31]. Topographic measurements were performed at five randomly selected positions on the surface, and the arithmetic mean of the results was calculated.
Figure 3.
Bruker Alicona Portable RL optical microscope (Bruker, Billerica, MA, USA) and the view of the surface measurement window in Alicona software—Laboratory Measurement Module 6.6.1.
The generation of 3D height images was carried out using Alicona software (Graz, Austria)—Laboratory Measurement Module 6.6.1. Topographic parameter calculations were performed using Alicona software, supplemented with MountainsMap 9 software from Digital Surf (Besançon, France). The topographic measurement data were preprocessed, including surface leveling using least squares, thresholding based on material ratio, removal of outliers, and filling of non-measured points. Topographic parameters were calculated on the primary extracted surfaces after removing the shortest wavelengths, which mainly corresponded to measurement noise, using an S-filter. Gaussian filtering with a nesting index of 0.25 mm.
These studies focus on conventional and multiscale surface topography parameters (Table 2). The selected parameters and the corresponding analysis methods are defined in ISO 25178-2 [2], which provides a standardized framework for their evaluation. Three-dimensional surface analysis parameters and functions are generally denoted by the letter “S”, corresponding to the letter “R” used for profile parameters in two-dimensional analysis. Parameters describing volumetric features are designated by the letter “V”. Conventional surface topography parameters are classified into five groups: height parameters, describing the distribution of surface heights; hybrid parameters, combining height and spatial information such as slope and surface development; feature parameters, characterizing individual surface features including peaks, valleys, and pits; and functional parameters, which describe material and void volumes and are directly linked to surface performance [32]. Spatial parameters were not evaluated because the EDM process typically generates surfaces with isotropic patterns at the scale considered. As a result, directional or arrangement-related metrics have limited meaning. Although, hybrid parameters were analyzed because they capture combined aspects of surface topography, such as slope and surface development, which are directly influenced by the EDM process. Unlike spatial parameters, hybrid metrics provide meaningful information about local gradients and surface complexity, which affect functional properties. Some spatial parameters are often disregarded; for example, Std (texture direction) is considered the most independent from other parameters [19]. Multiscale parameters are associated with multiscale geometric analysis, also referred to as scale-sensitive fractal-like analysis, and include relative area and area–scale fractal-like complexity [33].
Table 2.
Selected conventional and multiscale surface topography parameters (ISO 25178-2) [2].
The standard deviation calculated from five repeated surface topography measurements of the same workpiece ranged from 0.03 to 0.5. The magnitude of the standard deviation was primarily dependent on the numerical scale of the respective parameters. Parameters characterized by a smaller numerical range, such as Sa and Sq, exhibited standard deviation values close to 0.03, whereas parameters with a larger numerical range, such as Sz and Smr, showed higher standard deviations, approaching 0.5.
A correlation analysis was performed between the discharge energy and the surface topography parameters of the processed titanium alloy. The coefficient of determination R2 was used to quantify the relationship between the two sets of analyzed data. Values of R2 closer to 1 indicate a strong correlation, whereas values approaching 0 indicate a weak or negligible relationship. Correlation analysis was carried out to evaluate relationships within and between surface topography parameters.
3. Results
3.1. 3D Surface Images
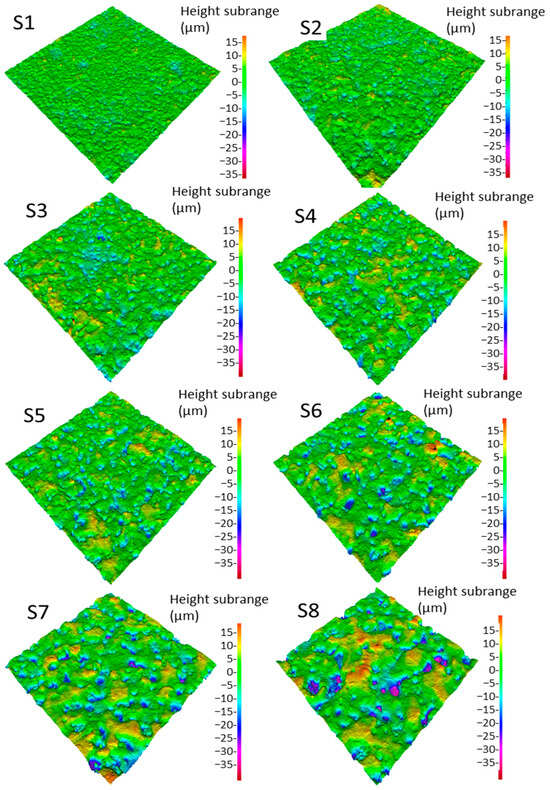
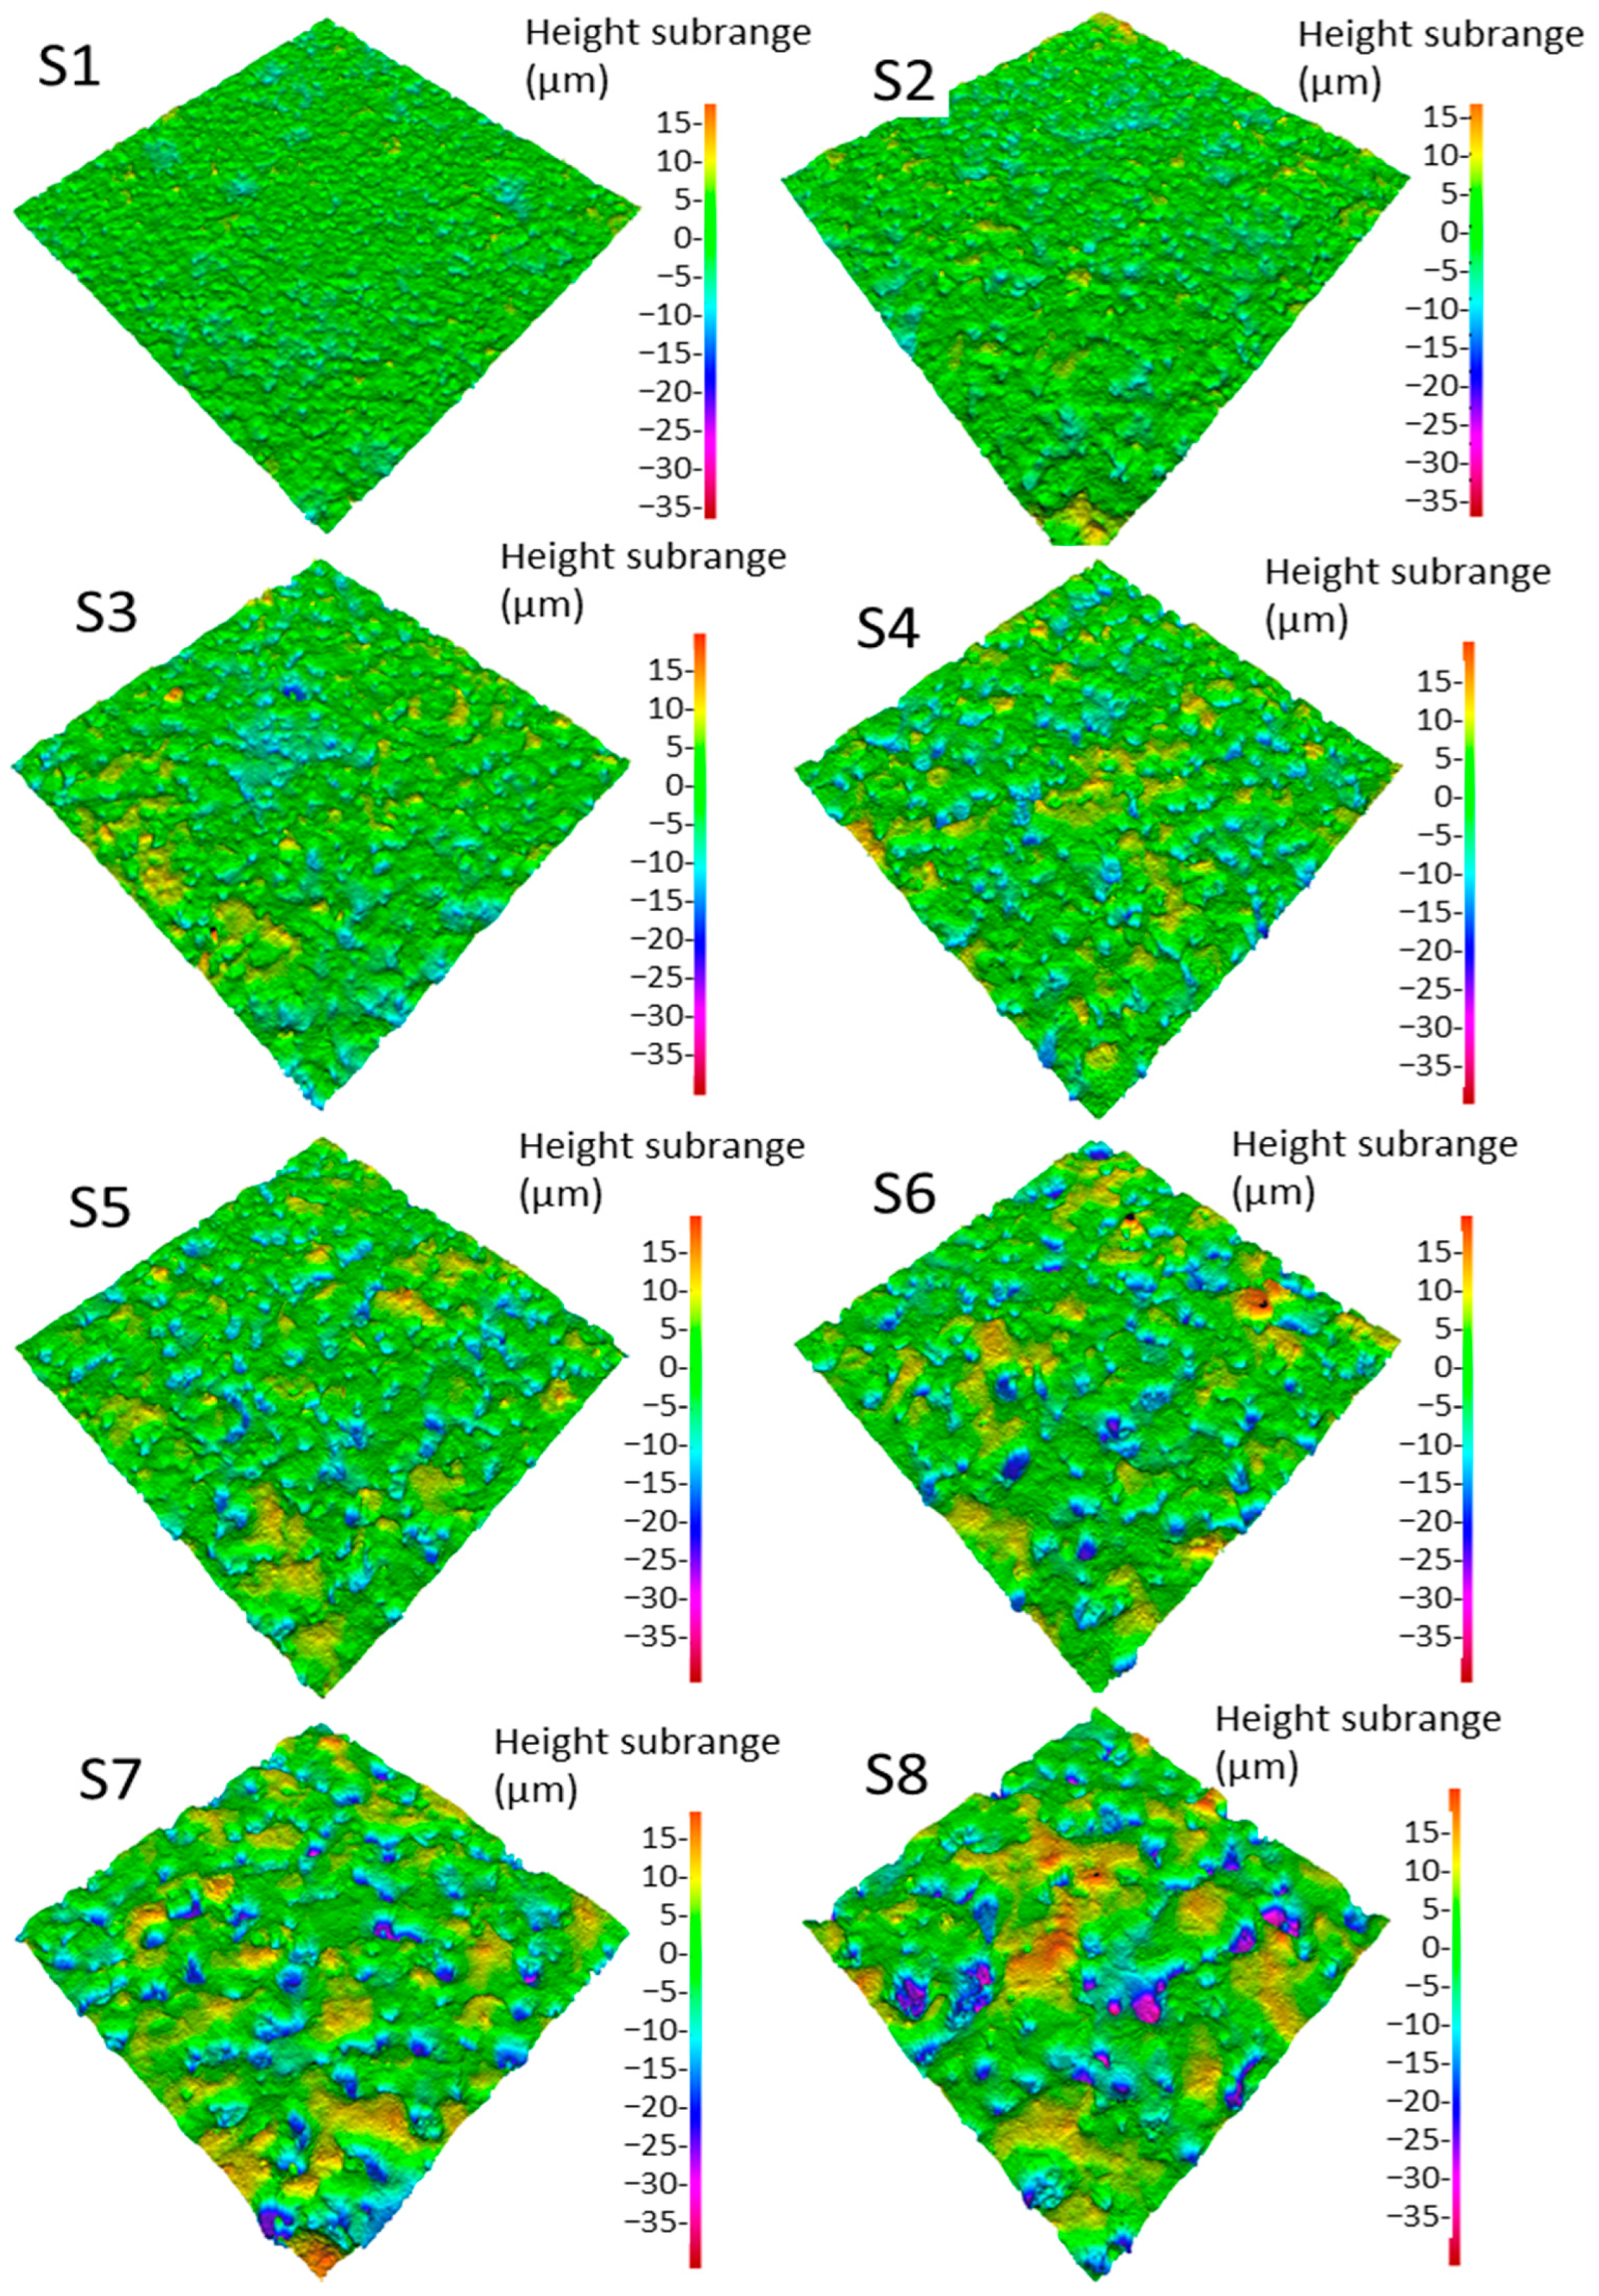
3D images of the EDM-textured surfaces (S1–S8) are shown in Figure 4. The in-plane dimensions (x, y) of each surface are 1.014 × 1.014 mm. The same height scale along the z-axis was applied to all surfaces (S1–S8) to enable direct visual comparison.
Figure 4.
3D surface images of S1–S8. The dimensions in the x and y directions are 1.014 × 1.014 mm.
3.2. Conventional Surface Topography Parameters
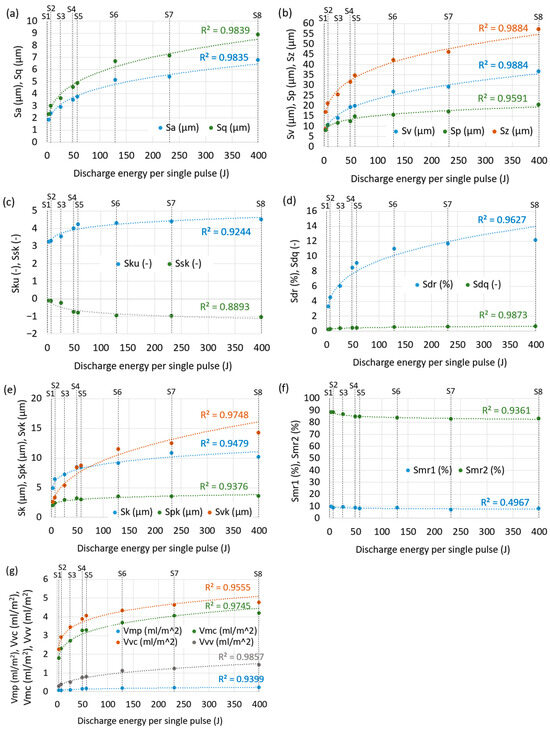
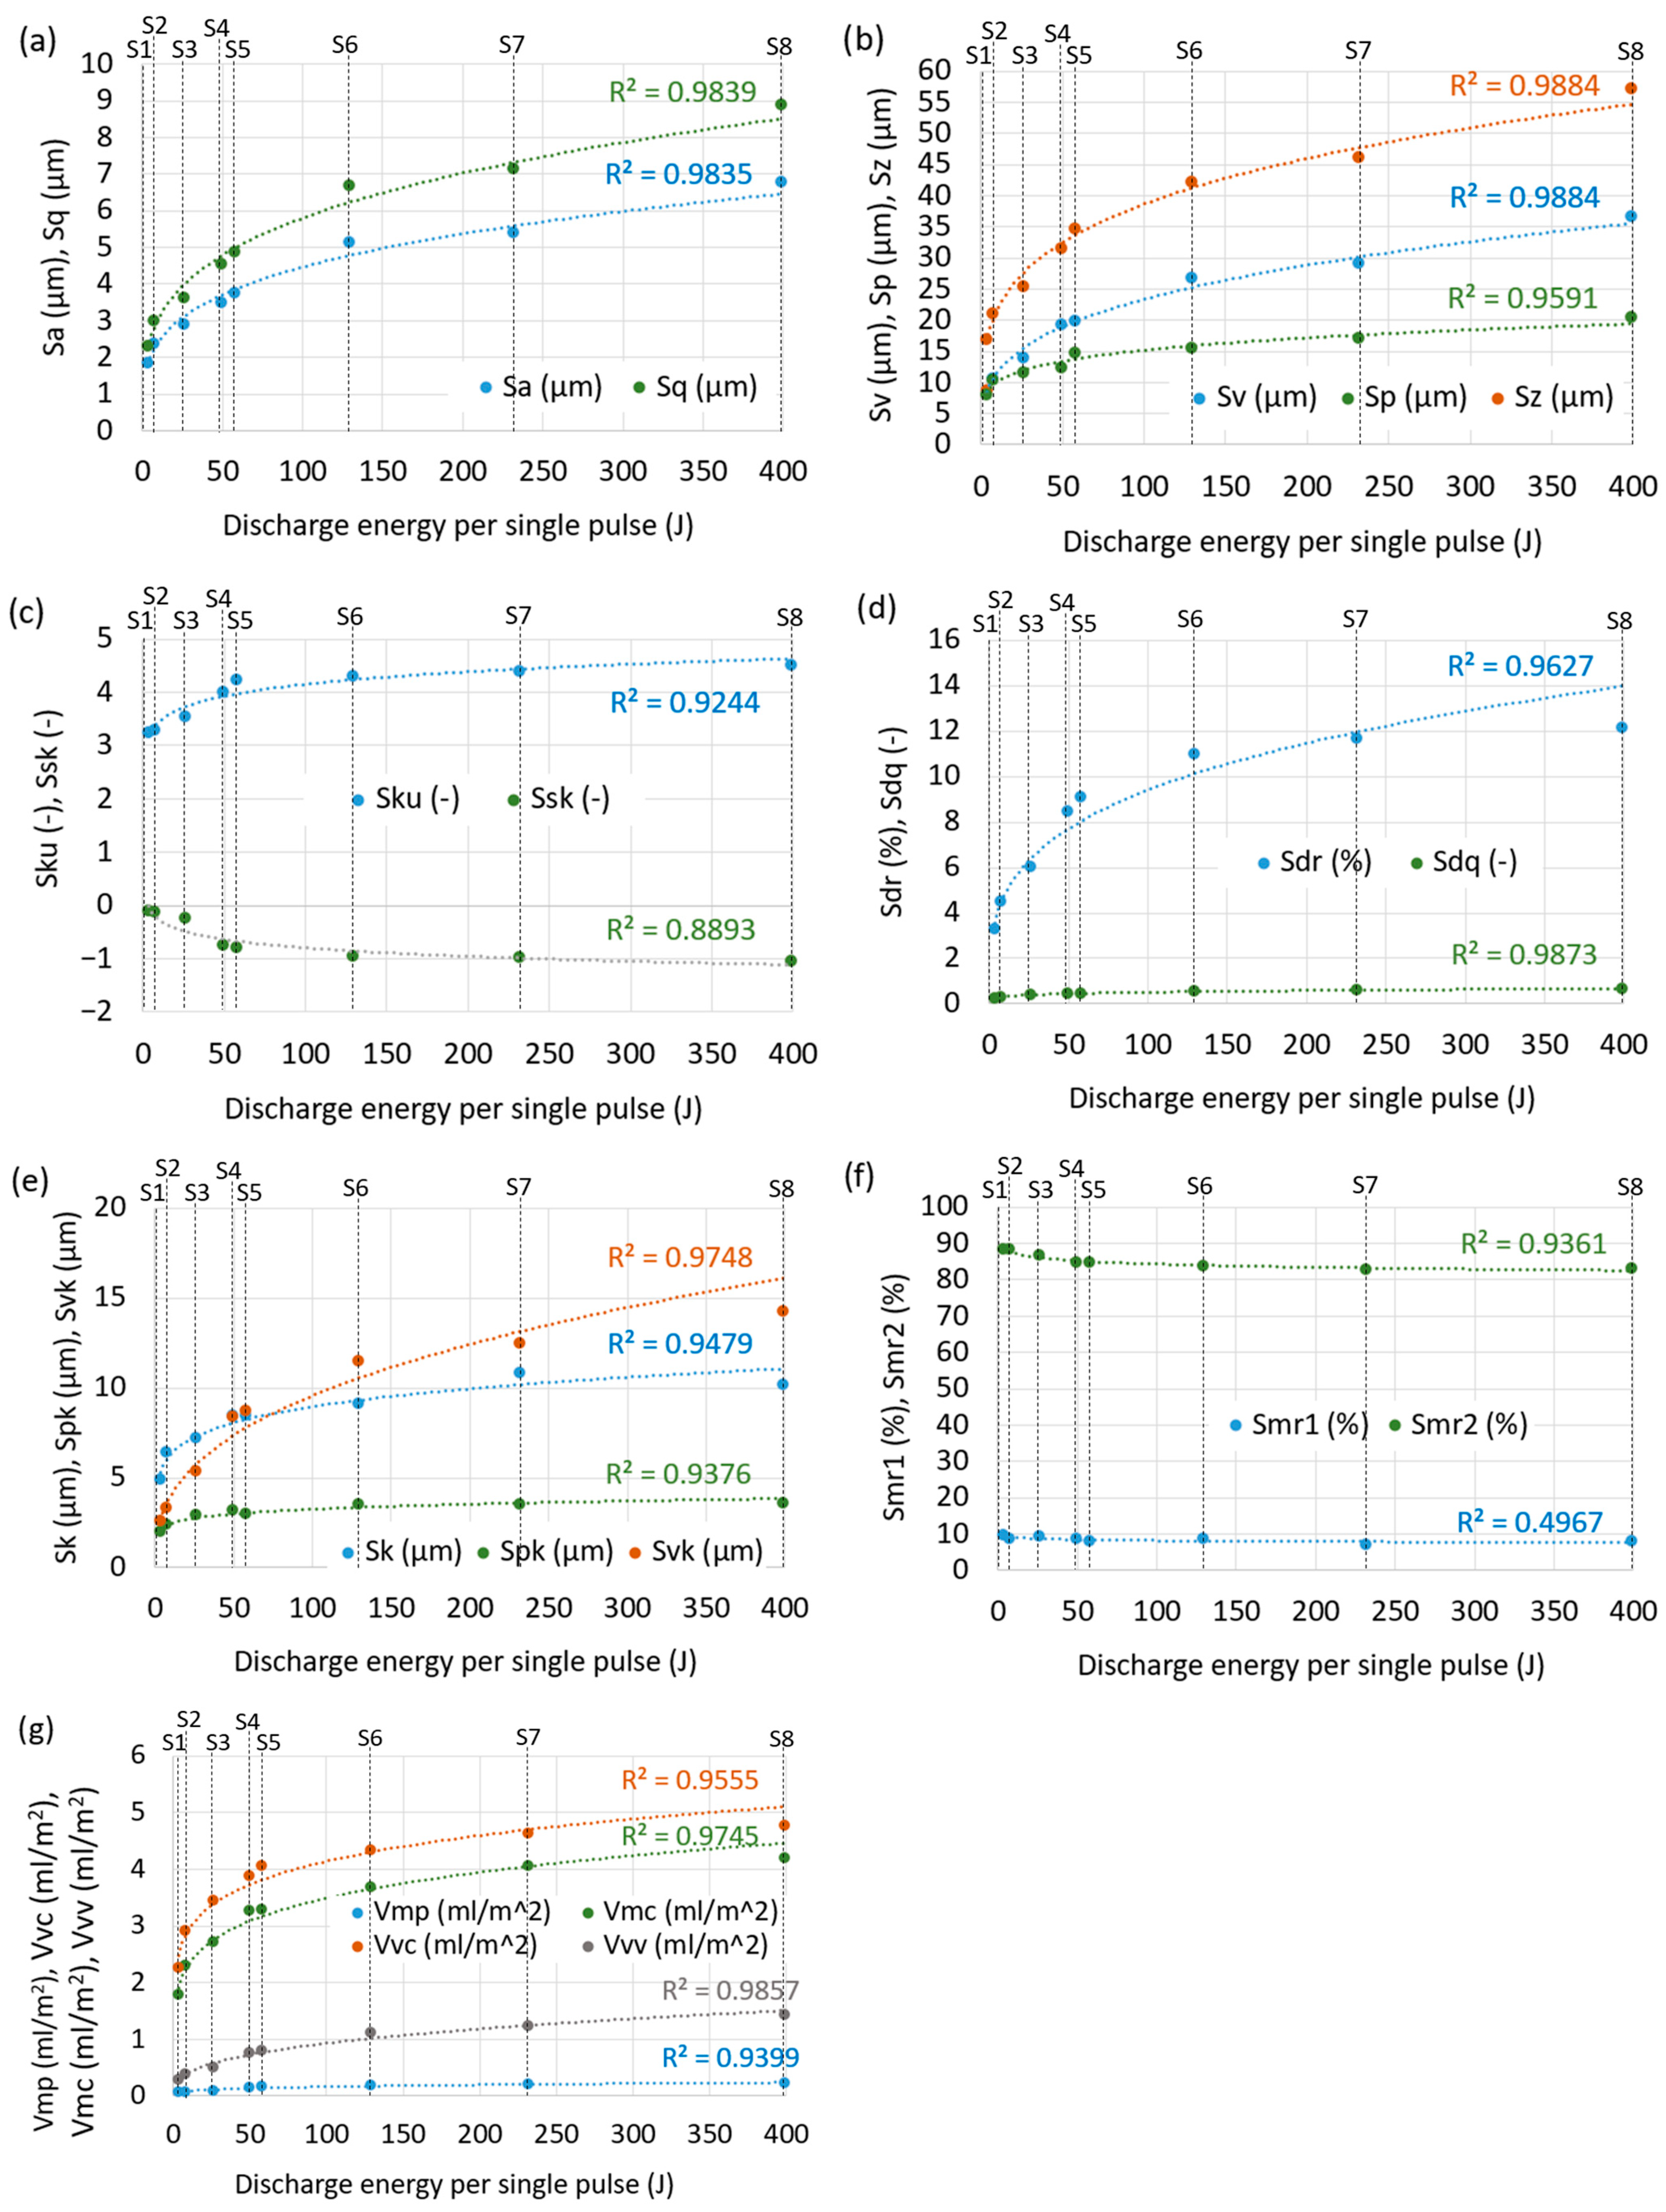
The relationships between discharge energy and surface topography parameters are shown in Figure 5. Coefficients of determination were evaluated for different regression models: exponential, linear, logarithmic, and power. Figure 5 presents the regression coefficients for the models with the highest coefficients of determination, fitted using a power trend line for Sa, Sq, Sv, Sp, Sz, Sku, Sdr, Sdq, Sk, Spk, Svk, Smr1, and Smr2, and a logarithmic trend line for Ssk (due to negative values).
Figure 5.
The relationships between discharge energy and conventional topographic parameters, along with the coefficients of determination: (a) Sa, Sq, (b) Sv, Sp, Sz, (c) Ssk, Sku, (d) Sdr, Sdq, (e) Sk, Spk, Svk, (f) Smr1, Smr2, (g) Vmp, Vmc, Vvc, Vvv.
3.3. Multiscale Surface Topography Parameters
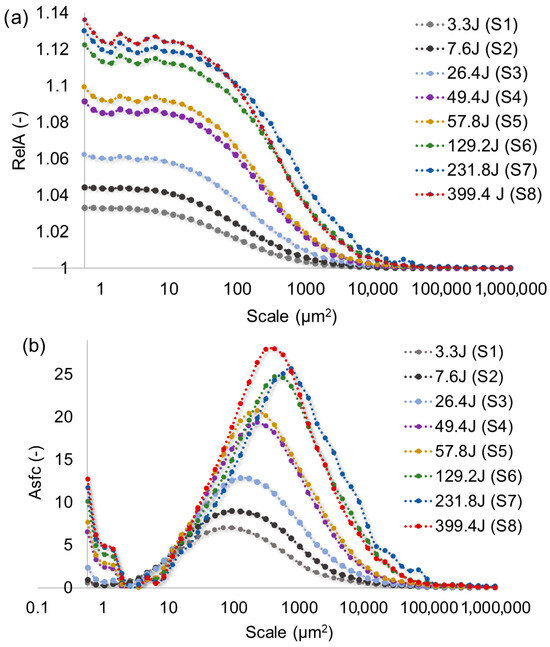
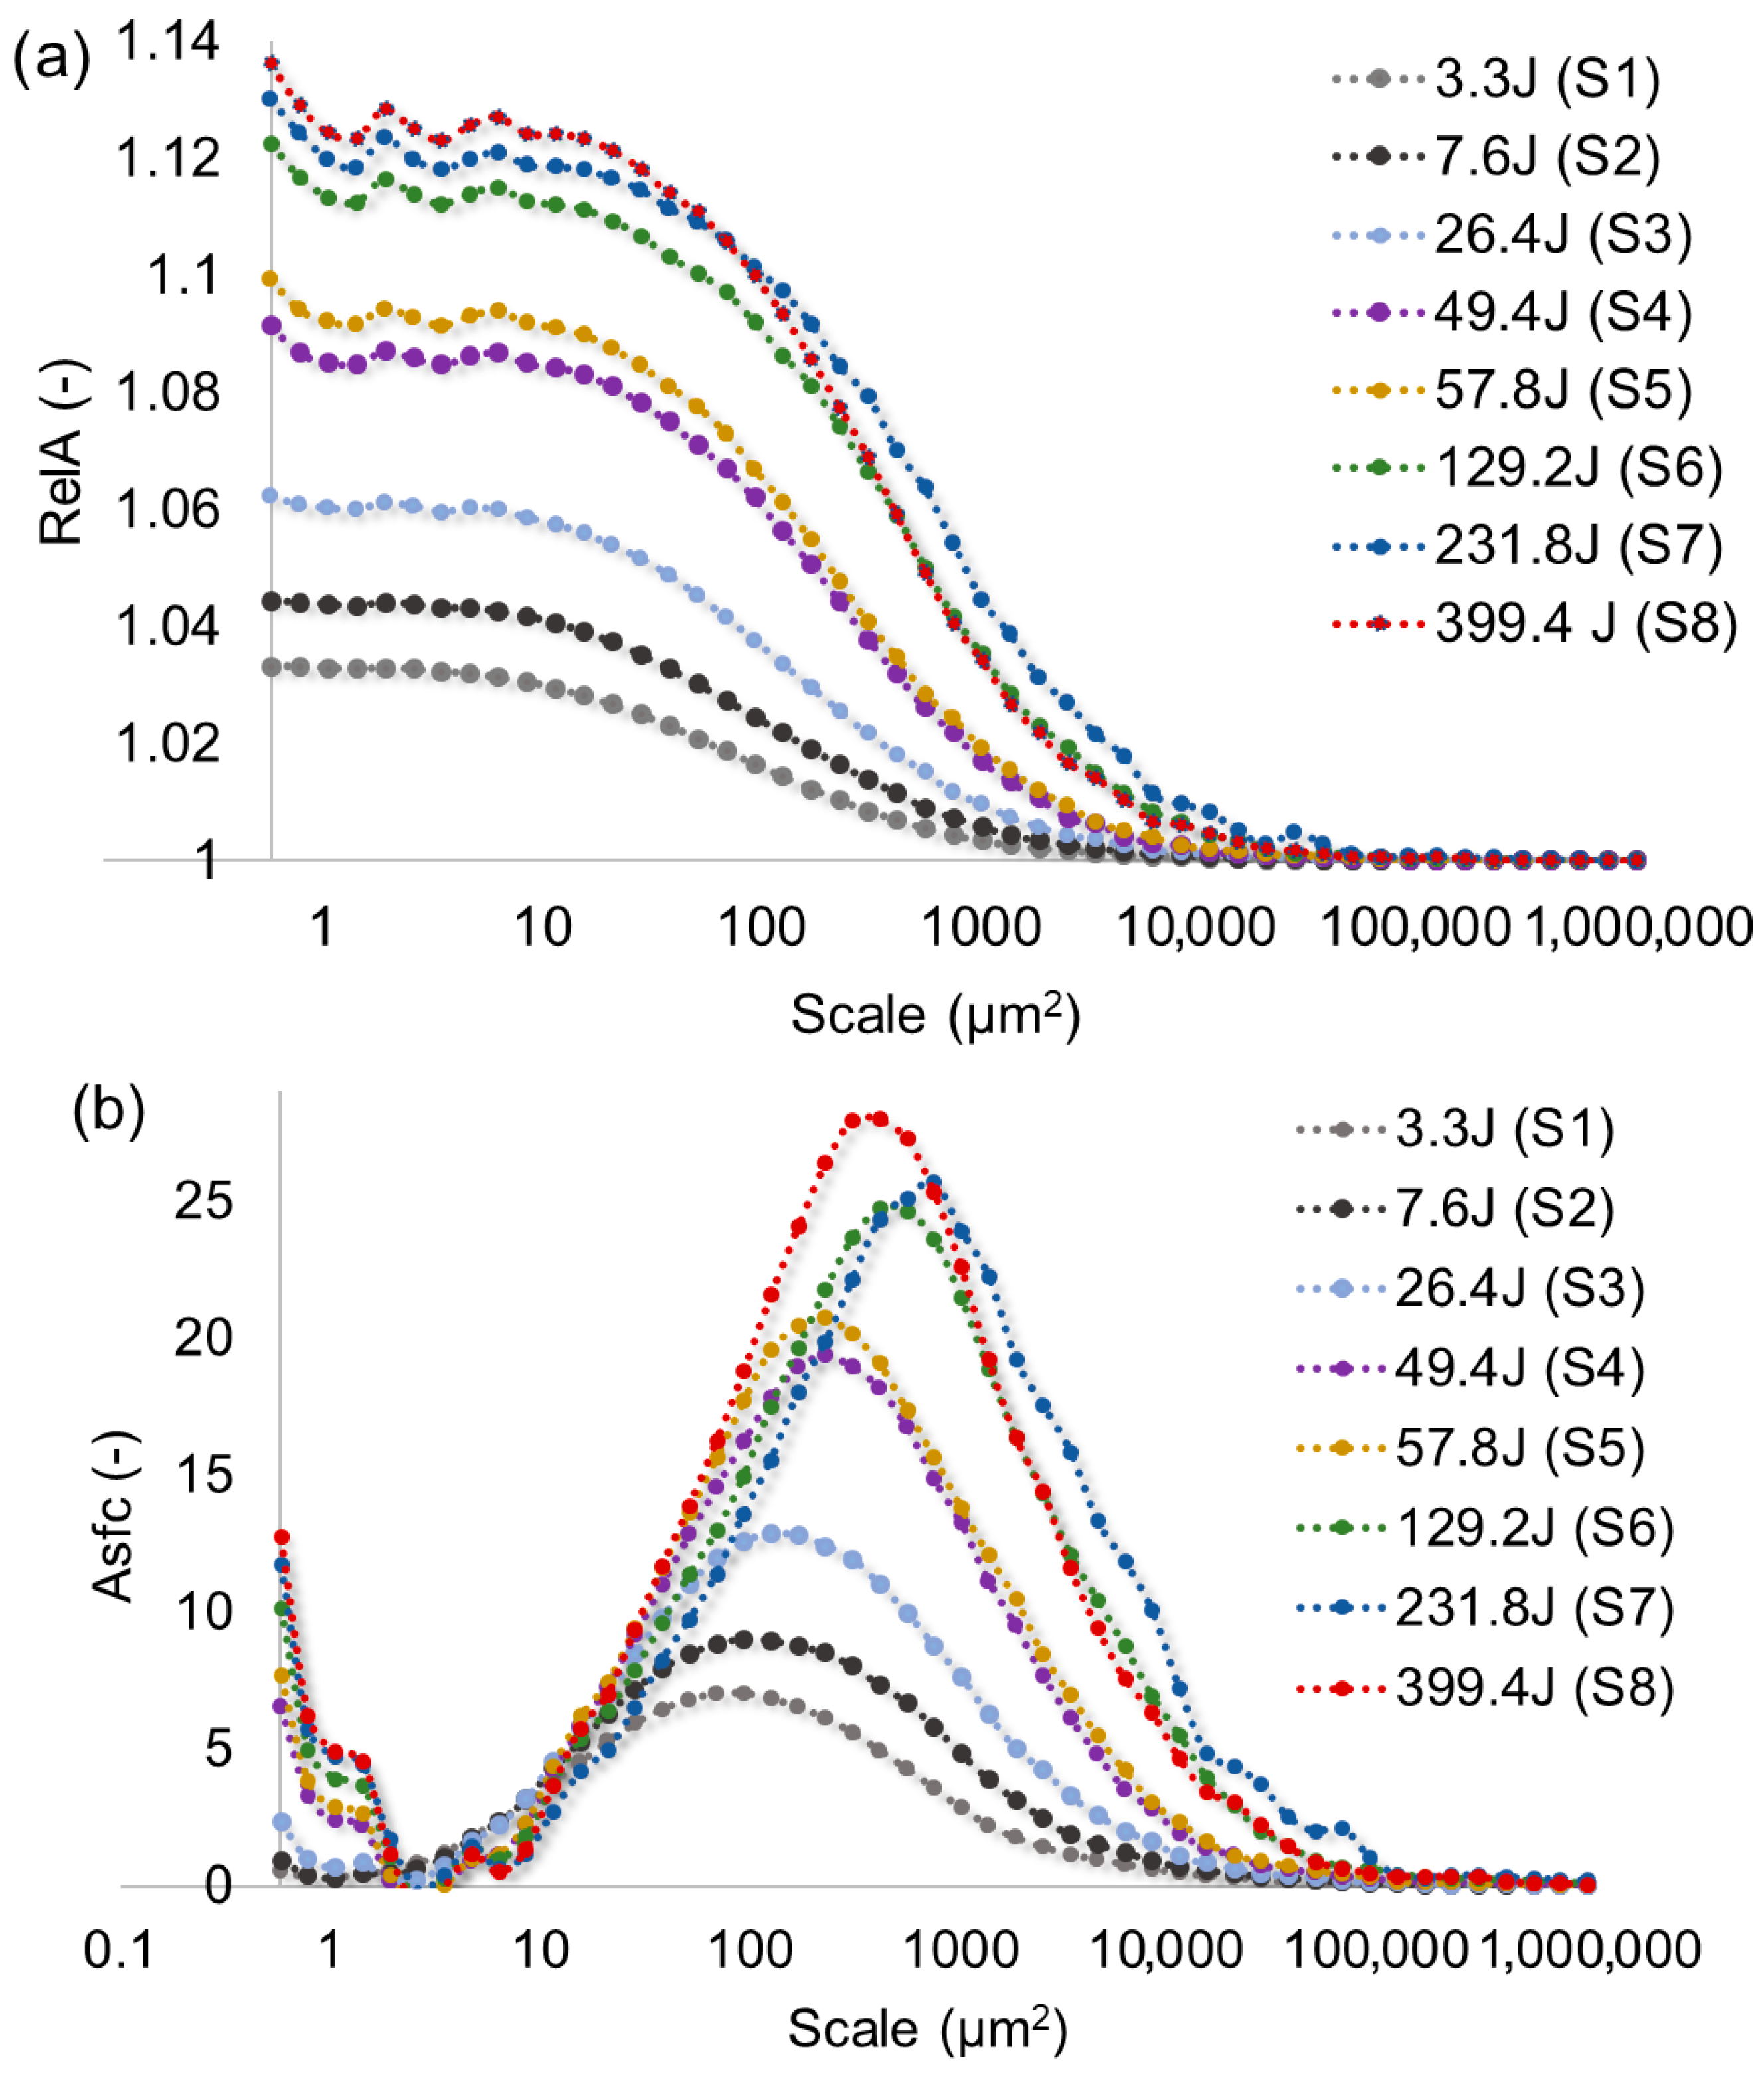
Multiscale geometric parameters offer important complementary information about surface textures. Relative area (Figure 6a) and area–scale complexity (Figure 6b) allow characterization and differentiation of surfaces across various observation scales. Relative areas were determined using the patchwork method, where the surface is covered with triangular tiles of varying sizes. Tile areas define the scale. At each scale, the relative area corresponds to the ratio of the measured surface area to the nominal area. Area–scale complexity represents a scale-dependent derivative of the relative area, reflecting the slopes of logarithmic plots of relative area versus scale.
Figure 6.
Multiscale relationships between discharge energy and multiscale parameters of surface topography: (a) relative area RelA, (b) area-scale complexity Asfc.
3.4. Cross-Correlation Matrix of Conventional Surface Topography Parameters
The cross-correlation matrix shown in Table 3 presents the correlation coefficients between conventional surface topography parameters. These coefficients indicate the strength of the relationships between different variables. Values close to 1 or −1 represent strong correlations, while values near 0 indicate weak or no correlation. Colors were used to visualize the strength of correlations, allowing quick identification of variables with strong positive or negative relationships. A positive correlation indicates that the variables increase together, while a negative correlation means that an increase in one variable corresponds to a decrease in the other. Values of R2 ≥ 0.95 and R2 ≤ −0.95 indicate a strong correlation and are highlighted in dark green. Values of R2 ≥ 0.9 and < 0.95, as well as R2 ≤ −0.9 and > −0.95, indicate a good correlation and are shown in light green. Values of R2 ≥ 0.75 and <0.9, as well as R2 ≤ −0.75 and > −0.9, indicate an average correlation and are highlighted in orange. Values of R2 < 0.75 and > −0.75 indicate a weak correlation and are highlighted in red.
Table 3.
Cross-correlation matrix of conventional surface topography parameters. Please note: dark green—strong correlation, light green—good correlation, orange—average correlation, red—weak correlation.
3.5. Correlations Between Conventional and Multiscale Surface Topography Parameters
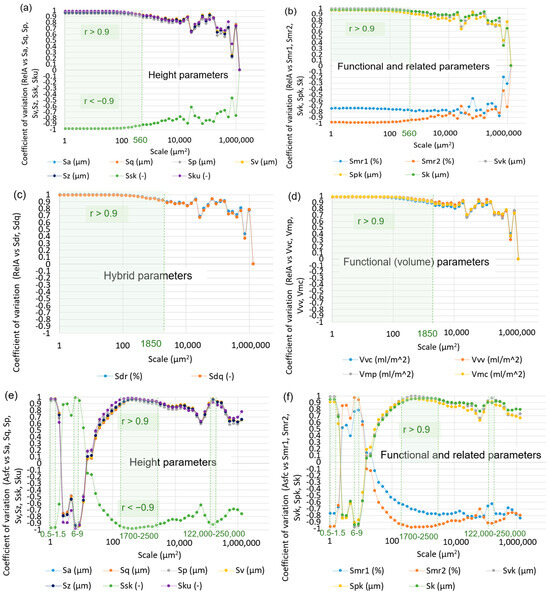
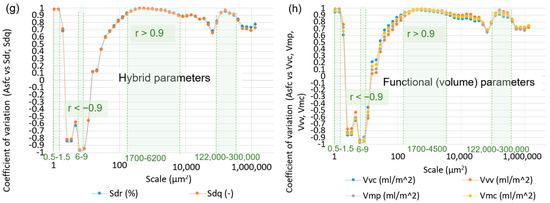
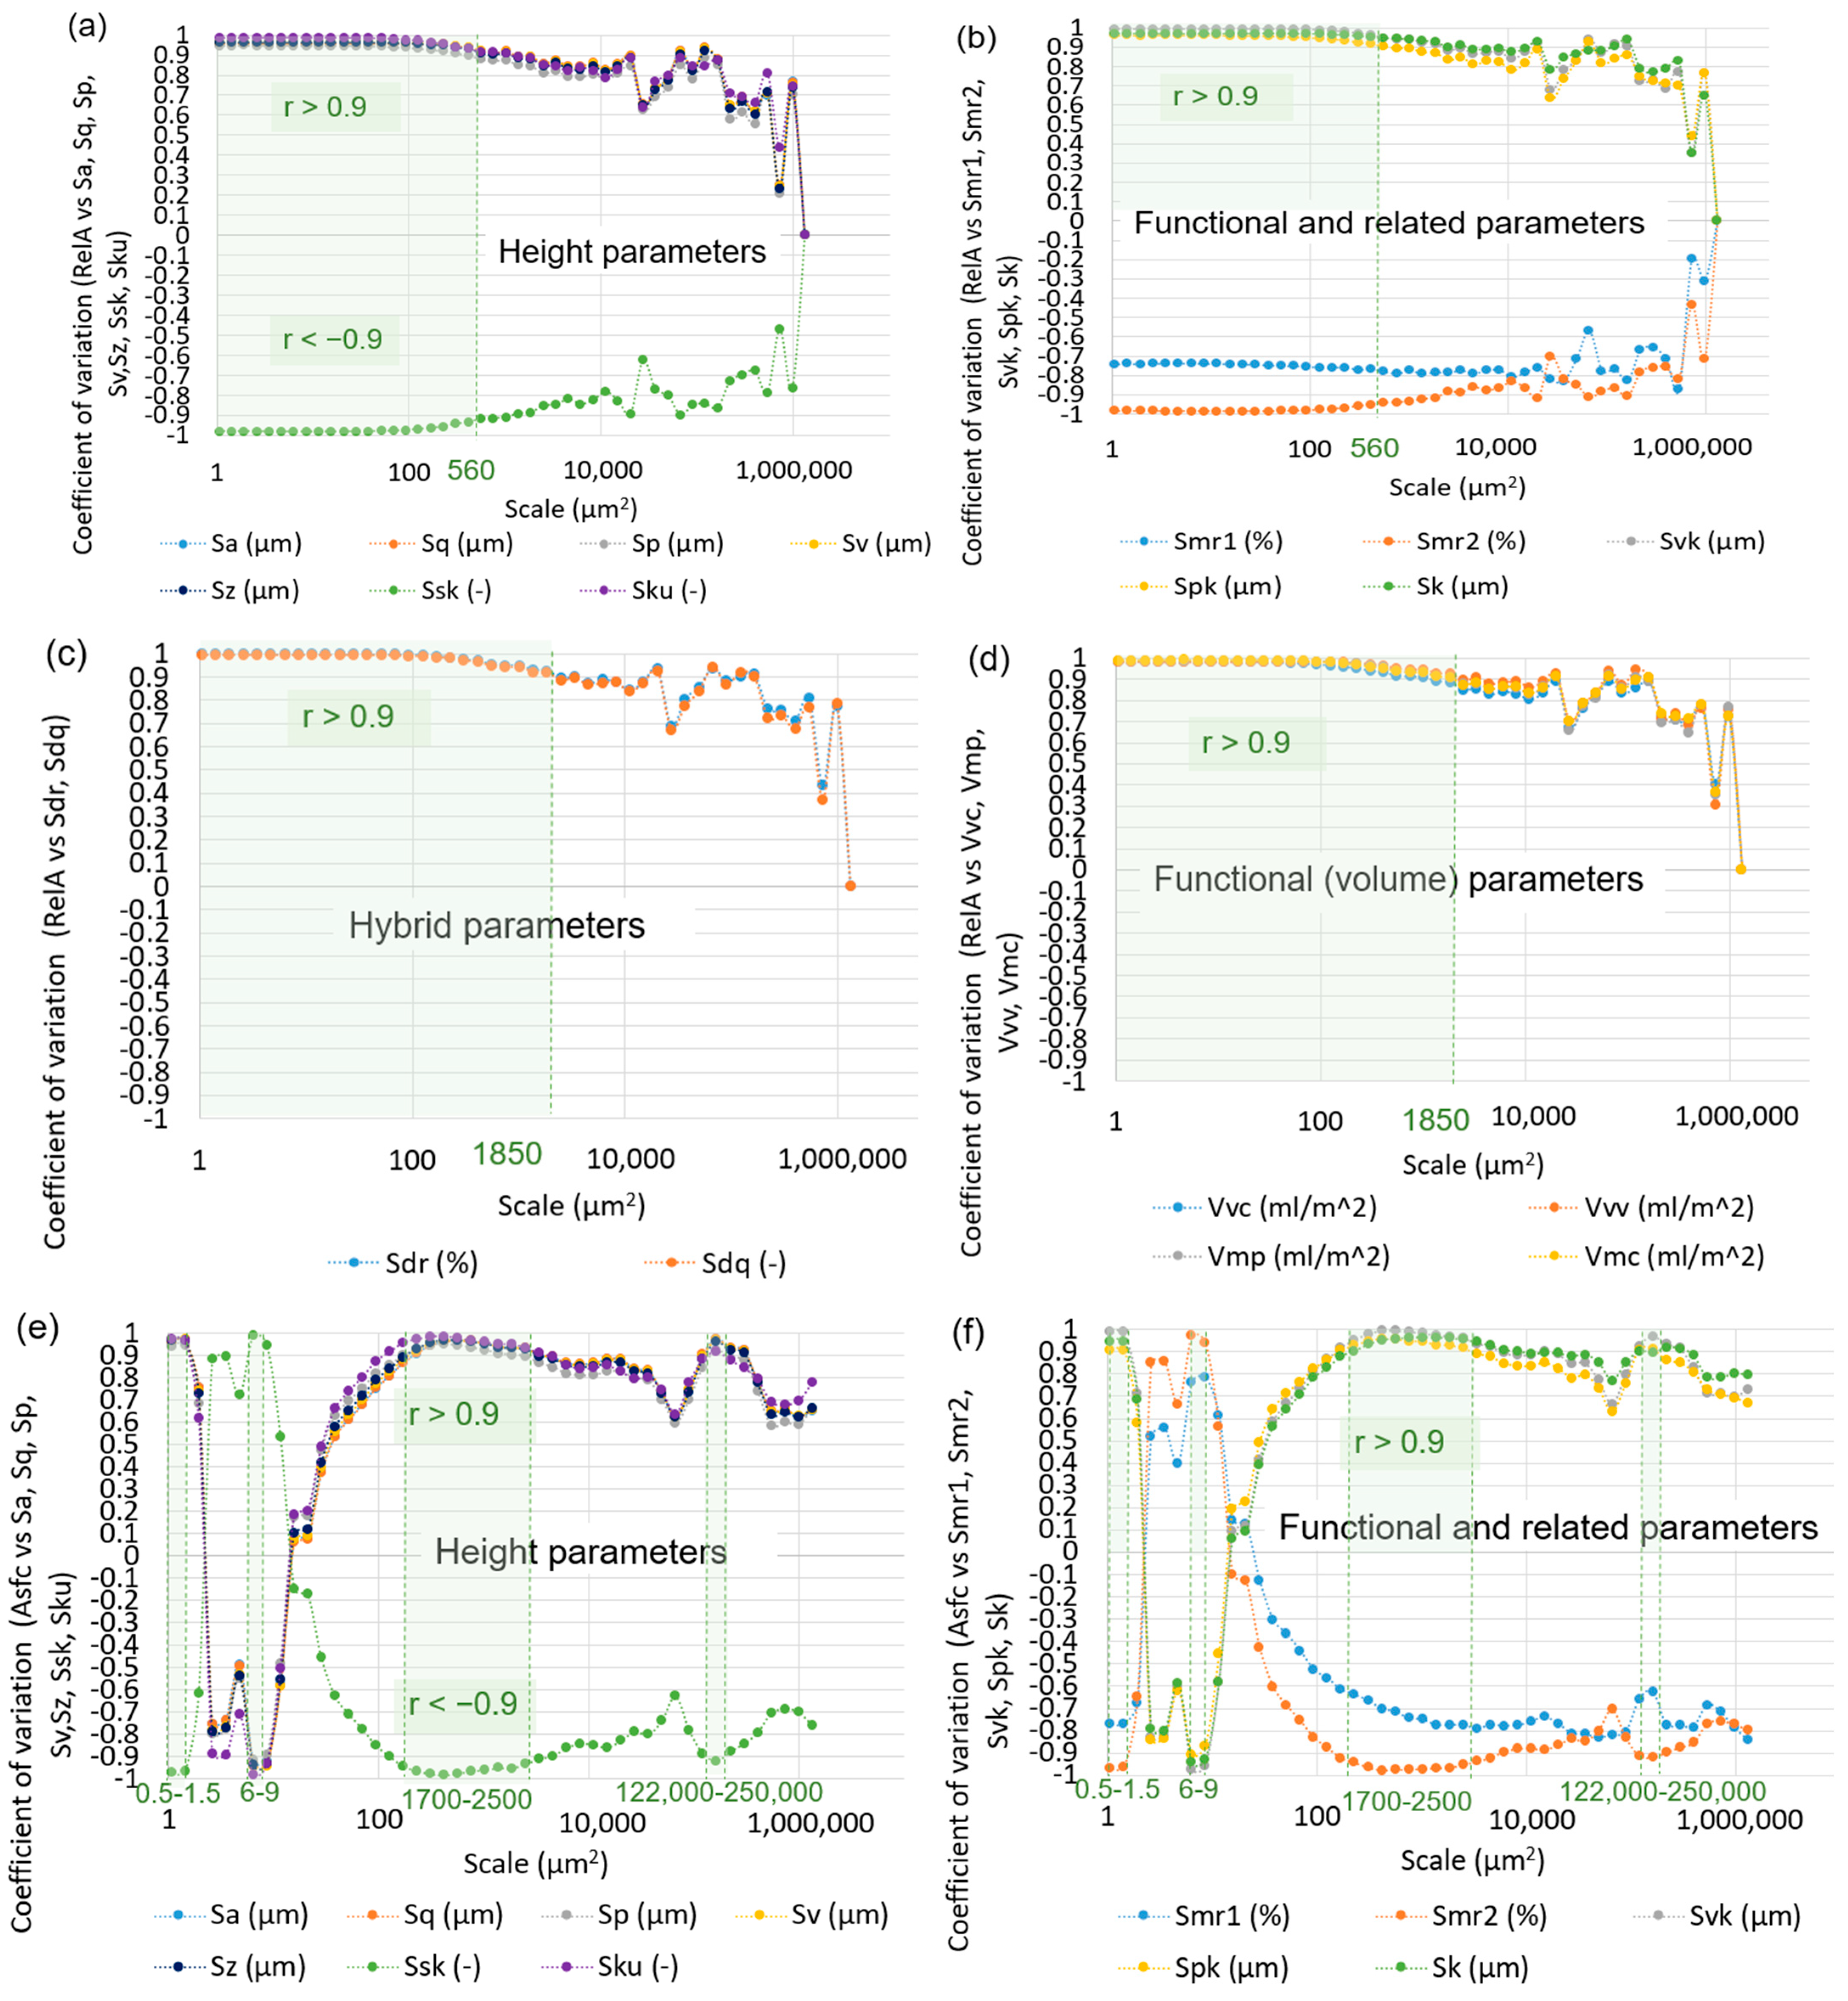
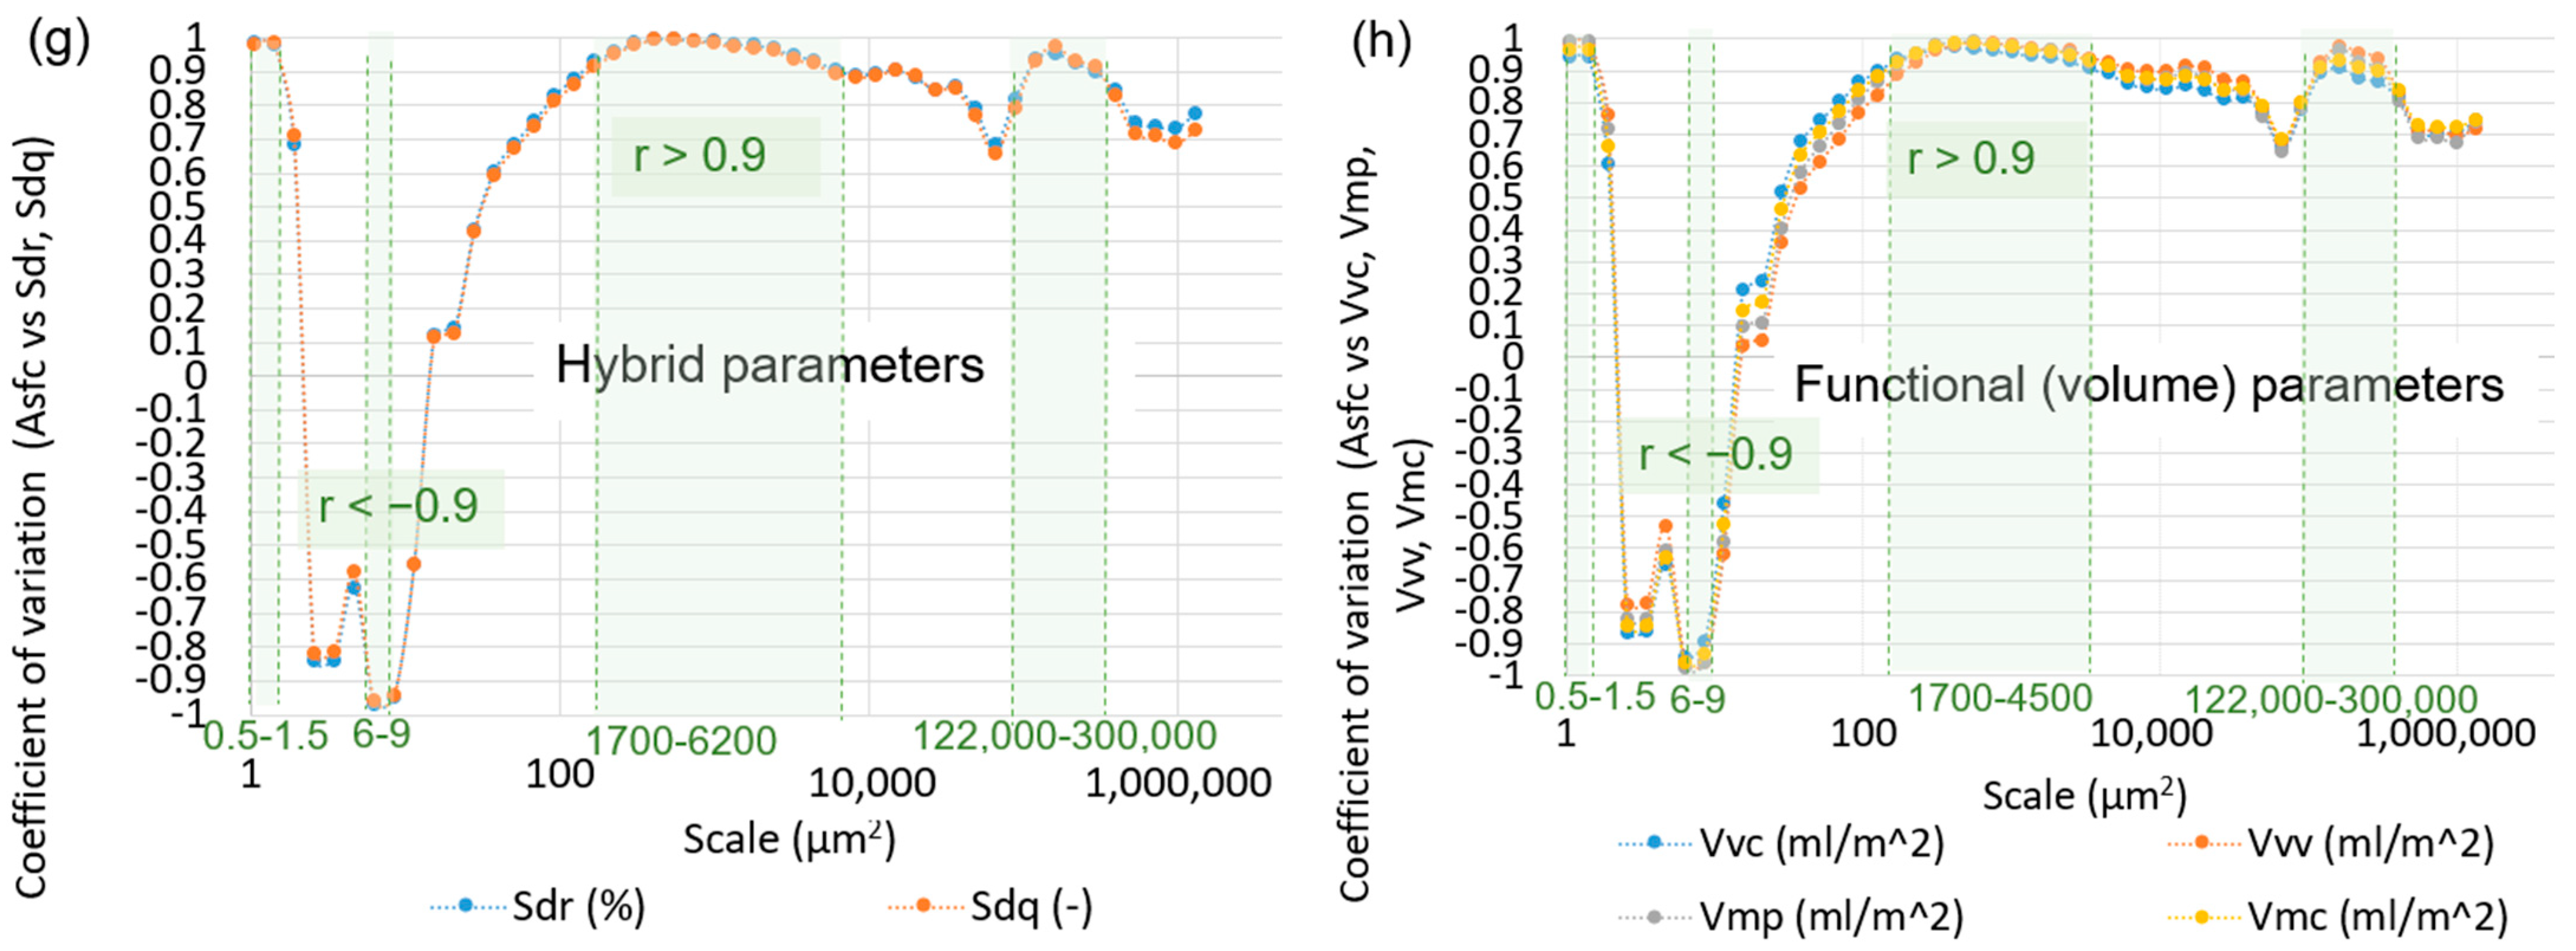
The correlation coefficients between multiscale and conventional surface topography parameters are shown in Figure 7. For this purpose, the relative area was correlated with each selected topography parameter at every scale (Figure 7a–d). The same procedure was then applied to the area–scale fractal-like complexity, correlating it with all conventional parameters (Figure 7e–h). Values close to 1 indicate a strong directly proportional relationship between the two sets of correlated data, while values near −1 indicate a strong inversely proportional relationship. Values close to 0 suggest a weak correlation between the multiscale parameters and conventional surface topography parameters. It should be noted that the correlation coefficients may vary depending on the analysis scale.
Figure 7.
The correlation coefficients between multiscale and conventional surface topography parameters: (a) RelA vs. Sa, Sq, Sp, Sv, Sz, Ssk, Sku, (b) RelA vs. Smr1, Smr2, Svk, Spk, Sk, (c) RelA vs. Sdr, Sdq, (d) RelA vs. Vvc, Vvv, Vmp, Vmc, (e) Asfc vs. Sa, Sq, Sp, Sv, Sz, Ssk, Sku, (f) Asfc vs. Smr1, Smr2, Svk, Spk, Sk, (g) Asfc vs. Sdr, Sdq, (h) Asfc vs. Vvc, Vvv, Vmp, Vmc.
4. Discussion
4.1. Electrical Discharge Machining in the Formation of Surface Topographies
The surface geometry produced by electrical discharge machining is formed by the cumulative effect of individual electrical discharges, resulting in a stochastic distribution of craters. The morphology of these features is primarily influenced by electrical pulse parameters, including discharge current, pulse duration, and voltage. Crater size is closely related to the effective discharge energy, with higher energy levels generally leading to increased crater diameter and depth (Figure 4). Discharge voltage affects the inter-electrode gap and process stability, where higher voltage allows a larger gap and improves dielectric flushing and debris removal. Discharge current mainly governs the material removal rate and crater penetration, while the pulse off-time contributes to stabilizing conditions within the inter-electrode gap [25,34,35]. Through appropriate control of these parameters, the discharge energy can be adjusted to tailor the surface topography of titanium alloys.
4.2. Conventional Surface Topography Parameters Characterizing EDMed Surfaces
An increase in discharge energy leads to the formation of deeper craters, which results in larger height differences between surface peaks and valleys. This effect is reflected by higher values of the average height parameters Sa and Sq (Figure 5a), as well as the extreme height parameters Sp, Sv, and Sz (Figure 5b), which describe the growing differences between surface peaks and valleys. The development of deeper valleys is also associated with more negative skewness (Ssk), indicating a surface dominated by valleys, while higher kurtosis (Sku) suggests a more pronounced distribution of extreme features (Figure 5c). The formation of steeper local slopes and a more developed surface is captured by the hybrid parameters Sdq and Sdr, which increase as discharge energy rises, reflecting higher root mean square gradients and greater developed interfacial area (Figure 5d). With increasing discharge energy, the reduced valley depth (Svk) increases, reflecting enhanced valley development, whereas the reduced peak height (Spk) tends to increase due to the formation of higher resolidified peaks. The core height (Sk) also increases, indicating a thicker functional core region (Figure 5e). Correspondingly, the material ratios Smr1 and Smr2 describe shifts in the relative contributions of peak and valley regions, with higher energies generally promoting valley-dominated surface profiles (Figure 5f). Volumetric functional parameters further confirm these trends. The void volumes of the core (Vvc) and valleys (Vvv) increase with discharge energy, indicating a larger capacity for fluid retention and debris accommodation. At the same time, the material volumes of peaks (Vmp) and the core (Vmc) also increase, reflecting the growth of resolidified material and overall surface development (Figure 5g).
Relationships between conventional surface topography parameters are generally high, indicating strong relationships among the measured variables. This also demonstrates that the EDM process, specifically the discharge energy, is capable of producing well-defined and distinguishable textured surfaces. High coefficients of determination suggest that changes in discharge energy systematically influence multiple topographic features, making EDM an effective method for generating surfaces that can be reliably described and distinguished using surface characterization parameters. This also indicates that EDM can serve as an effective method for texturing surfaces with the desired topographic parameters, suitable for practical applications. Appropriate machining conditions and the selection of topographic parameters are essential for reliable comparative analysis [36].
4.3. Multiscale Surface Topography Parameters Characterizing EDMed Surfaces
Multiscale analysis complements conventional surface topography characterization by revealing scale-dependent differences in EDM-textured surfaces. Relative area (RelA) varies with observation scale, with higher values at smaller scales reflecting increased surface development. As the scale increases, RelA decreases, indicating reduced sensitivity to fine surface features. For scales above approximately 10,000 µm2, all analyzed surfaces (S1–S8) exhibit similar topographic responses, whereas the greatest differences occur at smaller scales. Higher discharge energy leads to increased relative area values, corresponding to more developed cratered surfaces (Figure 6a). Area–scale fractal-like complexity (Asfc) indicates that at the smallest scales, complexity values are similar for all surfaces. At intermediate scales, Asfc increases and differences between surfaces become more pronounced, while at larger scales it decreases toward zero. Higher Asfc values correspond to increased surface roughness. Unlike relative area, which behaves as a low-pass descriptor, Asfc emphasizes specific scale ranges, functioning as a band-pass measure of surface complexity (Figure 6b).
4.4. Cross-Correlation Matrix of Conventional Surface Topography Parameters
The cross-correlation matrix of conventional surface topography parameters [2] indicates that most parameters are strongly correlated (Table 3). Height parameters (Sa, Sq, Sp, Sv, Sz) show strong correlations (R2 ≥ 0.98), indicating that as the overall surface roughness increases, peak and valley heights increase proportionally. Skewness (Ssk) is strongly negatively correlated with height and hybrid parameters, indicating that as surface roughness increases, surfaces tend to become more valley-dominated. Kurtosis (Sku) is positively correlated with height parameters and negatively with Ssk, consistent with the formation of sharper peaks as roughness grows. Hybrid parameters (Sdq, Sdr) also show strong correlations with amplitude metrics, reflecting the coupled changes in slope and area development. Functional parameters (Sk, Spk, Svk) and volumetric parameters (Vmp, Vmc, Vvc, Vvv) generally show strong or good correlations with height and hybrid parameters, confirming that the increase in discharge energy affects both the peaks, valleys, and material ratios consistently. However, Smr1 shows weaker correlations (R2 ≈ 0.68–0.75) with some height and volumetric parameters, which may be due to local variability in peak-to-valley distribution that does not scale linearly with average heights. Similarly, relative contributions of valley regions (Smr2) slightly deviate in correlation with certain amplitude parameters because the formation of deep craters is influenced by random discharge locations and overlapping of craters, introducing variability in the material ratio that does not directly follow global height metrics. While most parameters are strongly interdependent, a bit weaker correlations reflect the stochastic nature of EDM crater formation and local variations in surface topography, highlighting the importance of using multiple topographic descriptors to fully characterize EDM-textured surfaces.
The cross-correlations between conventional surface topography parameters can be analysed not only in terms of their numerical relationships but also with consideration of their physical meaning. Some of the observed correlations can be directly attributed to the mathematical definitions of the parameters, particularly those describing height-related features (e.g., Sa, Sq, Sp, Sv, and Sz), which are inherently interdependent. Similarly, strong correlations between hybrid parameters (Sdq, Sdr) and amplitude parameters arise from their dependence on surface height variations and gradients. However, several relationships cannot be explained solely by mathematical coupling and instead reflect underlying changes in the surface structure induced by the EDM process. In particular, parameters related to functional performance (e.g., Smr1, Smr2, Vmp, Vmc, Vvc, Vvv) show systematic trends associated with material removal and valley/core distribution, which are governed by the physical formation of craters. Therefore, while part of the correlation structure is expected from the definitions of the parameters, selected key relationships are further interpreted in terms of the physical mechanisms of surface formation during EDM, including material melting, resolidification, and peak–valley redistribution.
4.5. Correlations Between Conventional and Multiscale Surface Topography Parameters
Correlation coefficients (CV) between conventional and multiscale parameters connect conventional surface topography parameters and features observed across different scales. High CV values suggest that changes in conventional parameters are reflected in the multiscale surface characteristics. Lower CV values reveal that certain surface features, are captured primarily by multiscale parameters and may be missed by conventional metrics. For the correlation between multiscale relative area (RelA) and conventional surface parameters, the strongest relationships are observed at the finest scales. Correlation coefficients (CV) decrease as the observation scale increases. With the exception of Smr1, CV values at the smallest scales (up to 100 µm2) exceed 0.95 or are below −0.95. Additionally, a good correlation coefficient (r > 0.9 or r < −0.9) is observed between the relative area and both height, as well as functional and related parameters. This relationship is consistent across measurement scales ranging from the finest scale of 0.58 µm2 up to 560 µm2. For hybrid and functional (volume-related) parameters, a similarly good correlation are observed, but over a slightly larger scale, reaching up to 1850 µm2. At coarser scales, the relationships weaken further (Figure 7a–d).
The correlations between area–scale fractal complexity (Asfc) and conventional surface parameters are strongest within certain scale ranges. For the correlation between area–scale fractal complexity (Asfc) and both height-related and functional parameters, the range of best scales includes the finest scales (0.5–1.5 µm2 and 6–9 µm2), intermediate scales (1700–2500 µm2), and coarser scales (122,000–250,000 µm2). For the correlation between Asfc and functional (volume) parameters, the range of optimal observation scales is slightly broader. In addition to the finest scales (0.5–1.5 µm2 and 6–9 µm2), it also includes intermediate scales (1700–4500 µm2) and coarser scales (122,000–300,000 µm2). For the correlation between Asfc and hybrid parameters, the range of best observation scales is even broader. Beyond the finest scales (0.5–1.5 µm2 and 6–9 µm2) and the coarsest scales (122,000–300,000 µm2), it also includes a wider range of intermediate scales (1700–6200 µm2). In the aforementioned scale ranges, the correlation coefficient is strong, with r > 0.9 or r < −0.9.
At the smallest scales, Asfc captures fine surface features, such as micro-craters and minor asperities. At intermediate scales, Asfc reflects more complex surface structures, including combinations of peaks and valleys. At larger scales (>10,000 µm2), which represent the overall surface form, the sensitivity of Asfc to local topographic details slightly decreases, as the surface is effectively averaged, resulting in lower correlations with conventional parameters (Figure 7e–h).
5. Conclusions
The study characterized surface topography using both conventional and multiscale parameters in order to evaluate the influence of discharge energy in electrical discharge machining (EDM). Correlation analysis was performed both within and between the two parameter groups, revealing strong interdependencies for selected descriptors. The results indicate that certain conventional topographic parameters are highly consistent with multiscale parameters, suggesting that they partially capture similar aspects of surface complexity, while others provide complementary or independent information about surface topography. Surface texture induced by EDM is inherently hierarchical and cannot be fully characterized using a single-scale description. Multiscale parameters provide additional insight into how surface features evolve across different observation scales between measurement sampling distance and field of view.
The most important conclusions from the studies can be summarized as follows:
- Correlation analysis between multiscale parameters (RelA, Asfc) and conventional surface topographic parameters (Sa, Sq, Ssk, Vvv, etc.) demonstrates which conventional topographic parameters most effectively capture multiscale surface complexity and at which observation scales these relationships are most pronounced,
- Strong correlations between conventional and multiscale parameters (|r| > 0.9) occur predominantly at the finest and intermediate observation scales. This relationship weakens at coarser resolutions, highlighting the limited sensitivity of single-scale descriptors to large-scale surface features and confirming the inherently multiscale nature of the surface texture,
- Strong correlations (|r| > 0.9) between conventional and multiscale parameters occur only in specific scale ranges. For relative area, these are mainly 0.58–560 µm2 (height and functional conventional parameters) and up to 1850 µm2 (hybrid and functional volume parameters). For area–scale fractal complexity strong correlations appear at 0.5–1.5 µm2, 6–9 µm2, 1700–2500 µm2, and 122,000–250,000 µm2. Hybrid parameters cover the widest range of effective observation scales,
- Strong interdependencies among conventional surface parameters (R2 ≥ 0.98), especially height and hybrid descriptors, reflect the coupled response of roughness, slope, and material distribution to EDM energy, while deviations (e.g., Smr1, Smr2) highlight stochastic crater formation and non-linear valley/peak development, confirming that surface texture is governed both by parameter definitions and underlying physical processes such as melting, resolidification, and crater overlap,
- Relative area increases with higher discharge energy, especially at smaller scales, and decreases as the observation scale grows, showing reduced sensitivity to fine surface features at larger scales. While area–scale fractal complexity rises at intermediate scales with increasing discharge energy, highlighting differences between surfaces, while remaining similar for all surfaces at the smallest and the largest scales,
- With increasing discharge energy, the surface becomes more intensely eroded and re-solidified, leading to higher amplitude and more developed roughness (Sa, Sq, Sz, Sp, Sv), increased surface steepness and complexity (Sdq, Sdr), and greater peak/valley and material volume parameters (Sk, Spk, Svk, Vmp, Vmc, Vvc, Vvv), while the decrease in Ssk indicates a progressive transition toward valley-dominated surface structures due to enhanced crater formation and material removal.
- The findings support the need for a comprehensive surface characterization framework, in which conventional, and multiscale parameters are jointly used to capture the scale-dependent and physically distinct aspects of EDM-generated surface topography.
Author Contributions
Conceptualization, K.P.; methodology, K.P. and M.R.; software, K.P. and M.R.; validation, K.P., M.R. and A.Z.; formal analysis, KP., M.R., K.R. and A.Z.; investigation, KP., M.R. and A.Z.; resources, K.P. and M.R.; data curation, KP., M.R. and A.Z.; writing—original draft preparation, KP., M.R., K.R. and A.Z.; writing—review and editing, KP., M.R., K.R. and A.Z.; visualization, KP., M.R. and A.Z.; supervision, K.P.; project administration, K.P.; funding acquisition, K.P. and M.R. All authors have read and agreed to the published version of the manuscript.
Funding
This research was supported by the Polish Ministry of Science and Higher Education as a part of research subsidy, project number: 0614/SBAD/1604.
Institutional Review Board Statement
Not applicable.
Informed Consent Statement
Not applicable.
Data Availability Statement
The original contributions presented in the study are included in the article, further inquiries can be directed to the corresponding author.
Conflicts of Interest
The authors declare no conflicts of interest.
References
- Peta, K.; Love, G.; Brown, C.A. Comparing Repeatability and Reproducibility of Topographic Measurement Types Directly Using Linear Regression Analyses of Measured Heights. Precis. Eng. 2024, 536, 192–203. [Google Scholar] [CrossRef] [Scilit]
- ISO 25178-2; Geometrical Product Specification (GPS)—Surface Texture: Areal—Part 2: Terms, Definitions and Surface Texture Parameters. ISO: Geneva, Switzerland, 2021.
- Alar, V.; Razumić, A.; Runje, B.; Stojanović, I.; Kurtela, M.; Štrbac, B. Application of Areal Topography Parameters in Surface Characterization. Appl. Sci. 2025, 15, 6573. [Google Scholar] [CrossRef] [Scilit]
- Slavov, S.; Van, L.S.B.; Dimitrov, D.; Nikolov, B. An Approach for 3D Modeling of the Regular Relief Surface Topography Formed by a Ball Burnishing Process Using 2D Images and Measured Profilograms. Sensors 2023, 23, 5801. [Google Scholar] [CrossRef] [Scilit] [PubMed]
- Raja, J.; Muralikrishnan, B.; Fu, S. Recent Advances in Separation of Roughness, Waviness and Form. Precis. Eng. 2002, 26, 222–235. [Google Scholar] [CrossRef] [Scilit]
- Marinello, F.; Pezzuolo, A. Application of ISO 25178 Standard for Multiscale 3D Parametric Assessment of Surface Topographies. IOP Conf. Ser. Earth Environ. Sci. 2019, 275, 012011. [Google Scholar] [CrossRef] [Scilit]
- Rozanski, R.; Kawecka, E.; Perec, A. Classification of the Cutting Surface Topography Using a Set of Uncorrelated Parameters with High Discriminative Ability. Materials 2025, 18, 3131. [Google Scholar] [CrossRef] [Scilit]
- Yu, G.J.; Bouteiller, J.-M.C.; Berger, T.W. Topographic Organization of Correlation Along the Longitudinal and Transverse Axes in Rat Hippocampal CA3 Due to Excitatory Afferents. Front. Comput. Neurosci. 2020, 14, 588881. [Google Scholar] [CrossRef] [Scilit]
- Sedlaček, M.; Podgornik, B.; Vižintin, J. Correlation between standard roughness parameters skewness and kurtosis and tribological behaviour of contact surfaces. Tribol. Int. 2012, 48, 102–112. [Google Scholar] [CrossRef] [Scilit]
- Peta, K.; Stemp, W.J.; Chen, R.; Love, G.; Brown, C.A. Multiscale Characterizations of Topographic Measurements on Lithic Materials and Microwear Using a GelSight Max: Investigating Potential Archaeological Applications. J. Archaeol. Sci. Rep. 2024, 57, 104637. [Google Scholar] [CrossRef] [Scilit]
- Peta, K.; Kubiak, K.J.; Sfravara, F.; Brown, C.A. Dynamic Wettability of Complex Fractal Isotropic Surfaces—Multiscale Correlations. Tribol. Int. 2026, 214, 111145. [Google Scholar] [CrossRef] [Scilit]
- Peta, K.; Kubiak, K.J.; Brown, C.A. Multiscale Geometric Analysis of Dynamic Wettability on Complex, Fractal-like, Anisotropic Surfaces. Measurement 2026, 264, 120328. [Google Scholar] [CrossRef] [Scilit]
- Kuhnke, S.; Gensch, F.; Nitschke, R.; Sanabria, V.; Mueller, S. Influence of Die Surface Topography and Lubrication on the Product Quality during Indirect Extrusion of Copper-Clad Aluminum Rods. Metals 2020, 10, 888. [Google Scholar] [CrossRef] [Scilit]
- Kieszkowska-Krzewicka, M.; Ratajczak, K.; Peta, K.; Cichowicz, R.A. The Indoor Environment During Swimming Competitions and Its Impact on Construction Materials: Airborne Trichloramine as a Degradation Factor. Appl. Sci. 2025, 15, 12040. [Google Scholar] [CrossRef] [Scilit]
- Weidel, S.; Engel, U. Surface Characterisation in Forming Processes by Functional 3D Parameters. Int. J. Adv. Manuf. Technol. 2007, 33, 130–136. [Google Scholar] [CrossRef] [Scilit]
- Peta, K. Surface Wettability Modeling and Predicting via Artificial Neural Networks. Materials 2025, 18, 191. [Google Scholar] [CrossRef] [Scilit]
- Pawlus, P.; Reizer, R.; Wieczorowski, M.; Królczyk, G. Parametric Description of One-Process Surface Texture. Measurement 2022, 204, 112066. [Google Scholar] [CrossRef] [Scilit]
- Jiang, Z.; He, P.; Zhang, X.; Zhang, G.; Liu, F. Comprehensive Evaluation of Surface Parameter Correlation in Running-in Wear Process. J. Phys. Conf. Ser. 2023, 2591, 012003. [Google Scholar] [CrossRef] [Scilit]
- Qi, Q.; Li, T.; Scott, P.J.; Jiang, X. A Correlational Study of Areal Surface Texture Parameters on Some Typical Machined Surfaces. Procedia CIRP 2015, 27, 149–154. [Google Scholar] [CrossRef] [Scilit]
- Pawlus, P.; Reizer, R.; Żelasko, W. Effect of Sampling Interval on Dependence Between Hybrid Parameters of Machined Surface Textures. Materials 2025, 18, 5394. [Google Scholar] [CrossRef] [Scilit]
- Zeng, Q.; Qin, Y.; Chang, W.; Luo, X. Correlating and Evaluating the Functionality-Related Properties with Surface Texture Parameters and Specific Characteristics of Machined Components. Int. J. Mech. Sci. 2018, 149, 62–72. [Google Scholar] [CrossRef] [Scilit]
- Peta, K.; Bartkowiak, T.; Rybicki, M.; Galek, P.; Mendak, M.; Wieczorowski, M.; Brown, C.A. Scale-Dependent Wetting Behavior of Bioinspired Lubricants on Electrical Discharge Machined Ti6Al4V Surfaces. Tribol. Int. 2024, 194, 109562. [Google Scholar] [CrossRef] [Scilit]
- Peta, K.; Mendak, M.; Bartkowiak, T. Discharge Energy as a Key Contributing Factor Determining Microgeometry of Aluminum Samples Created by Electrical Discharge Machining. Crystals 2021, 11, 1371. [Google Scholar] [CrossRef] [Scilit]
- Jahan, M.P. (Ed.) Electrical Discharge Machining (EDM): Types, Technologies and Applications; Nova Science Publishers: New York, NY, USA, 2015. [Google Scholar]
- Ramasawmy, H.; Blunt, L. Effect of EDM Process Parameters on 3D Surface Topography. J. Mater. Process. Technol. 2004, 148, 155–164. [Google Scholar] [CrossRef] [Scilit]
- Maradia, U.; Scuderi, M.; Knaak, R.; Boccadoro, M.; Beltrami, I.; Stirnimann, J.; Wegener, K. Super-Finished Surfaces Using Meso-Micro EDM. Procedia CIRP 2013, 6, 157–162. [Google Scholar] [CrossRef] [Scilit]
- Hyde, J.M.; Cadet, L.; Montgomery, J.; Brown, C.A. Multi-Scale Areal Topographic Analysis of Surfaces Created by Micro-EDM and Functional Correlations with Discharge Energy. Surf. Topogr. 2014, 2, 045001. [Google Scholar] [CrossRef] [Scilit]
- VDI 3400; Electrical Discharge Machining (DEM)—Definitions, Processes, Application. DIN: Berlin, Germany, 1975.
- Peta, K.; Bartkowiak, T.; Galek, P.; Mendak, M. Contact Angle Analysis of Surface Topographies Created by Electric Discharge Machining. Tribol. Int. 2021, 163, 107139. [Google Scholar] [CrossRef] [Scilit]
- Alburayt, A.; Syam, W.P.; Leach, R. Lateral Scale Calibration for Focus Variation Microscopy. Meas. Sci. Technol. 2018, 29, 065012. [Google Scholar] [CrossRef] [Scilit]
- Danzl, R.; Helmli, F.; Scherer, S. Focus Variation—A Robust Technology for High Resolution Optical 3D Surface Metrology. Stroj. Vestn./J. Mech. Eng. 2011, 57, 245–256. [Google Scholar] [CrossRef] [Scilit]
- Kalin, M.; Pogačnik, A.; Etsion, I.; Raeymaekers, B. Comparing Surface Topography Parameters of Rough Surfaces Obtained with Spectral Moments and Deterministic Methods. Tribol. Int. 2016, 93, 137–141. [Google Scholar] [CrossRef] [Scilit]
- Brown, C.A.; Hansen, H.N.; Jiang, X.J.; Blateyron, F.; Berglund, J.; Senin, N.; Bartkowiak, T.; Dixon, B.; Le Goïc, G.; Quinsat, Y.; et al. Multiscale Analyses and Characterizations of Surface Topographies. CIRP Ann. 2018, 67, 839–862. [Google Scholar] [CrossRef] [Scilit]
- Wang, H.J.; Zuo, D.W.; Wu, X.M.; Wang, M. Relationship between the Fine Discharge Parameters and Craters EDMed of the NAK80 Steel. Key Eng. Mater. 2010, 426–427, 85–88. [Google Scholar] [CrossRef] [Scilit]
- Antar, M.; Hayward, P.; Dunleavey, J.; Butler-Smith, P. Surface Integrity Evaluation of Modified EDM Surface Structure. Procedia CIRP 2018, 68, 308–312. [Google Scholar] [CrossRef] [Scilit]
- Pawlus, P.; Reizer, R.; Żelasko, W. Characterization of the Maximum Height of a Surface Texture. Materials 2023, 16, 7109. [Google Scholar] [CrossRef] [Scilit]

Disclaimer/Publisher’s Note: The statements, opinions and data contained in all publications are solely those of the individual author(s) and contributor(s) and not of MDPI and/or the editor(s). MDPI and/or the editor(s) disclaim responsibility for any injury to people or property resulting from any ideas, methods, instructions or products referred to in the content. |
© 2026 by the authors. Licensee MDPI, Basel, Switzerland. This article is an open access article distributed under the terms and conditions of the Creative Commons Attribution (CC BY) license.