Article

Synergistic Identification of Rockburst Precursors Integrating Tensile Shear Fracture Evolution and Critical Slowing Down


1
College of Mining Engineering, North China University of Science and Technology, Tangshan 063210, China
2
Hebei Green Intelligent Mining Technology Innovation Center, Tangshan 063210, China
*
Author to whom correspondence should be addressed.
Appl. Sci. 2026, 16(8), 3962; https://doi.org/10.3390/app16083962
Submission received: 13 March 2026 / Revised: 14 April 2026 / Accepted: 14 April 2026 / Published: 19 April 2026

Abstract

To investigate the crack evolution mechanisms and early-warning precursors of excavation-induced rockbursts, unloading rockburst simulation tests were conducted on granite using a true triaxial testing machine. Analysis of tensile and shear crack development shows that tensile cracking dominates the early stage, with the proportion of tensile cracks exceeding 50% (Ntr > 50%), whereas shear failure becomes predominant near final rupture, with the proportion of shear cracks exceeding 50% (Nsr > 50%). Based on this, the tensile–shear ratio (TSR) is proposed to quantify the dynamic evolution of both crack types. In the present tests, a sustained TSR below 1 was observed during the transition from tensile- to shear-dominated failure, suggesting that it may be a potential precursor to imminent rockburst under the current experimental conditions. According to critical slowing down (CSD) theory, both the autocorrelation coefficient and variance of acoustic emission (AE) parameters increase significantly prior to failure. In contrast, TSR shows earlier identifiable changes and is therefore more suitable for early-stage warning, whereas CSD indicators provide clearer signals as the system approaches failure. Additionally, granite exhibits a rapidly fluctuating decline in the AE b-value prior to failure, and the precursor points identified by TSR and CSD consistently fall within the b-value decreasing interval before peak stress. These results suggest that integrating TSR and CSD indicators may be useful for staged AE-based rockburst monitoring and early warning in deep underground engineering.

1. Introduction

Rockburst is a common and highly destructive dynamic hazard in deep underground engineering, typically occurring in hard and brittle rock masses under high in situ stress, excavation-induced stress redistribution, progressive elastic energy accumulation, and dynamic disturbance associated with excavation or mining activities [1,2]. As deep underground space development advances, rockburst disasters are becoming more frequent, making precursor identification increasingly important for early warning. In engineering practice, excavation disturbances disrupt the original stress equilibrium of the rock mass, causing directional unloading and shifting the stress state from triaxial to biaxial or even uniaxial compression. Under high-stress conditions, such unloading-induced stress redistribution and energy accumulation may trigger rockbursts and other hazards [3], thereby threatening engineering safety. In a laboratory true triaxial unloading test, unloading one principal stress can serve as a reasonable approximation of this excavation-induced unloading process. In addition, applied geomechanical studies have shown that excavation-induced stress redistribution interacts strongly with rock mass structure; for example, variations in bedding angle can significantly alter the stress concentration zones around mine workings in stratified rock masses, thereby affecting their stability [4]. Therefore, investigating AE precursors of rockbursts under true triaxial stress paths is of great theoretical and practical significance for early warning in deep underground engineering.
The deformation and failure of rock essentially follow an evolutionary sequence of microcrack closure, nucleation, propagation and coalescence. During this process, the strain energy accumulated in the rock is rapidly released as elastic waves, generating AE signals [5,6]. As a non-destructive monitoring technique, AE can effectively reflect the characteristics of signal sources and the internal damage patterns of materials, and thus can be used to identify rockburst precursors for early warning [7]. In studies on acoustic emission (AE) characteristics during the rockburst fracture process, existing research can generally be divided into three categories. The first category focuses on conventional AE temporal and energy characteristics, which mainly identify precursors through abnormal AE activity before failure, such as event clustering and rapid increases in energy- or frequency-related parameters [8,9,10]. However, these indicators are often strongly dependent on specific parameters and test conditions. The second category focuses on statistical complexity parameters, which mainly reveal precursor evolution through changes in multifractal features, entropy, and correlation structure [11,12]. However, their physical interpretation is less direct, and the results are more sensitive to data processing methods. The third category focuses on crack-mode identification and fracture evolution mechanisms, which mainly link precursor information to crack-type transition and crack propagation [13,14]. However, these methods are more dependent on feature selection, classification strategy, and loading conditions.
Despite progress in identifying rockburst precursors, most existing methods rely on specific AE parameters or multi-indicator systems. Vulnerable to lithological heterogeneity, loading modes and environmental noise, these methods struggle to establish universal critical thresholds. Thus, researchers have recently introduced CSD theory into rock mass dynamic hazard analysis, exploring AE signal temporal evolution to identify instability precursor patterns via complex system dynamics. Ling et al. [15] analyzed the AE count characteristics via unloading tests and combined the Mann–Kendall (M-K) test and CSD theory to identify abrupt change points prior to rockbursts. The results show that variance surges can act as rockburst precursors, and the CSD-based early warning system outperforms traditional methods such as the b-value and information entropy approaches. Meanwhile, the M-K test results are proven suitable for short-term early warnings, thereby providing a combined theoretical basis for both short- and long-term risk assessment of rockbursts. Li et al. [16] performed true triaxial step-cycle loading tests on schist specimens with different bedding orientations to investigate the effect of intermediate principal stress. Based on the CSD theory, they proposed an early warning method using AE signal variance and autocorrelation coefficients, which achieved a warning lead time ranging from 4.6 to 907.6 s. Li et al. [17] carried out true triaxial unilateral rapid unloading tests to demonstrate, based on the CSD theory, that the RA/AF ratio, duration, and rise time of AE signals show elevated variance and autocorrelation coefficients in the initial stage of rockburst. Furthermore, the occurrence time of abrupt changes in variance precursor signals was consistent, and the corresponding waveform fluctuations exhibited high similarity. Zhu et al. [18] investigated the AE characteristics and rockburst warning lead times of slate and mica schist under different loading rates via true triaxial unloading tests, based on the CSD theory. They found that the rockburst warning lead times showed a negative correlation with loading rates, and mica schist consistently exhibited shorter warning lead times than slate. Wang et al. [19] conducted uniaxial compression tests on orthogonally cross-fractured sandstone specimens within a CSD-theory-based analytical framework. They found that near peak stress, specimens showed obvious critical slowing down characteristics: the autocorrelation coefficient of AE ring-down count rate surged with marked fluctuations, and variance displayed a stepwise “increase–decrease–increase” pattern. Wang et al. [20] investigated rock mass instability under high-temperature UCG (Underground Coal Gasification, UCG) gases and found that high temperatures delay the inflection points of AE count and b-value, while the inflection point of AE energy variance based on CSD theory shows the best agreement with the actual instability moment. In addition, related studies have shown that, during the UCG process, temperature evolution, roof-rock strength variation, and gasified cavity formation are closely coupled and may significantly affect the thermo-mechanical stability of the surrounding rock mass [21].
In summary, while preliminary progress has been made in identifying the critical slowing down (CSD) characteristics of AE parameters, quantitative analysis of rockburst-related AE signals based on CSD theory remains insufficient. Specifically, rockburst precursor mechanisms and the response patterns of AE parameters during rockburst evolution require further in-depth investigation. To address these issues, this study conducts unloading rockburst simulation tests on granite specimens using a true triaxial testing machine. The evolutionary characteristics of tensile and shear cracks throughout the rockburst process are systematically analyzed, and a tensile–shear ratio (TSR) is introduced to characterize their dynamic interaction. Furthermore, based on CSD theory, the temporal evolution of AE statistical indicators (autocorrelation coefficient and variance) and the AE b-value is examined to identify key precursors from rockburst incubation to instability. Focusing on laboratory-scale unloading-induced rockburst in granite under true triaxial conditions, this study emphasizes AE-based precursor identification using TSR and CSD indicators. The results aim to provide new theoretical insights and technical support for real-time rockburst monitoring and early warning.

2. Unloading Rockburst Testing and Theory

2.1. Test Specimens and Rockburst System

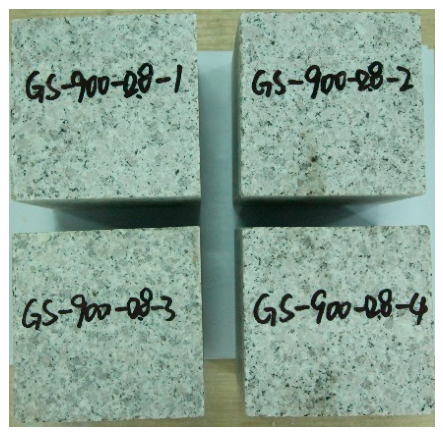
Existing studies [22,23,24] have shown that cube or rectangular prism specimens are commonly adopted in unloading rockburst simulation tests. Although the specimen dimensions vary across different studies, their standard width is generally set at 100 mm. In this study, cubic specimens with dimensions of 100 mm × 100 mm × 100 mm were selected because this size provides a practical balance between specimen size effect, crack monitoring requirements, and the constraints of the true triaxial testing system. Specifically, a 100 mm specimen is large enough to allow the initiation, propagation, and interaction of multiple cracks to develop within the specimen, thereby reducing the influence of local heterogeneity and small-size effects to a certain extent. At the same time, it remains sufficiently compact to ensure stable loading and unloading control, reliable platen contact, and compatibility with the loading capacity and operating limits of the true triaxial apparatus. To mitigate the influence of inherent rock heterogeneity on test results, all specimens were cored from the same intact rock mass block. The prepared specimens are presented in Figure 1.
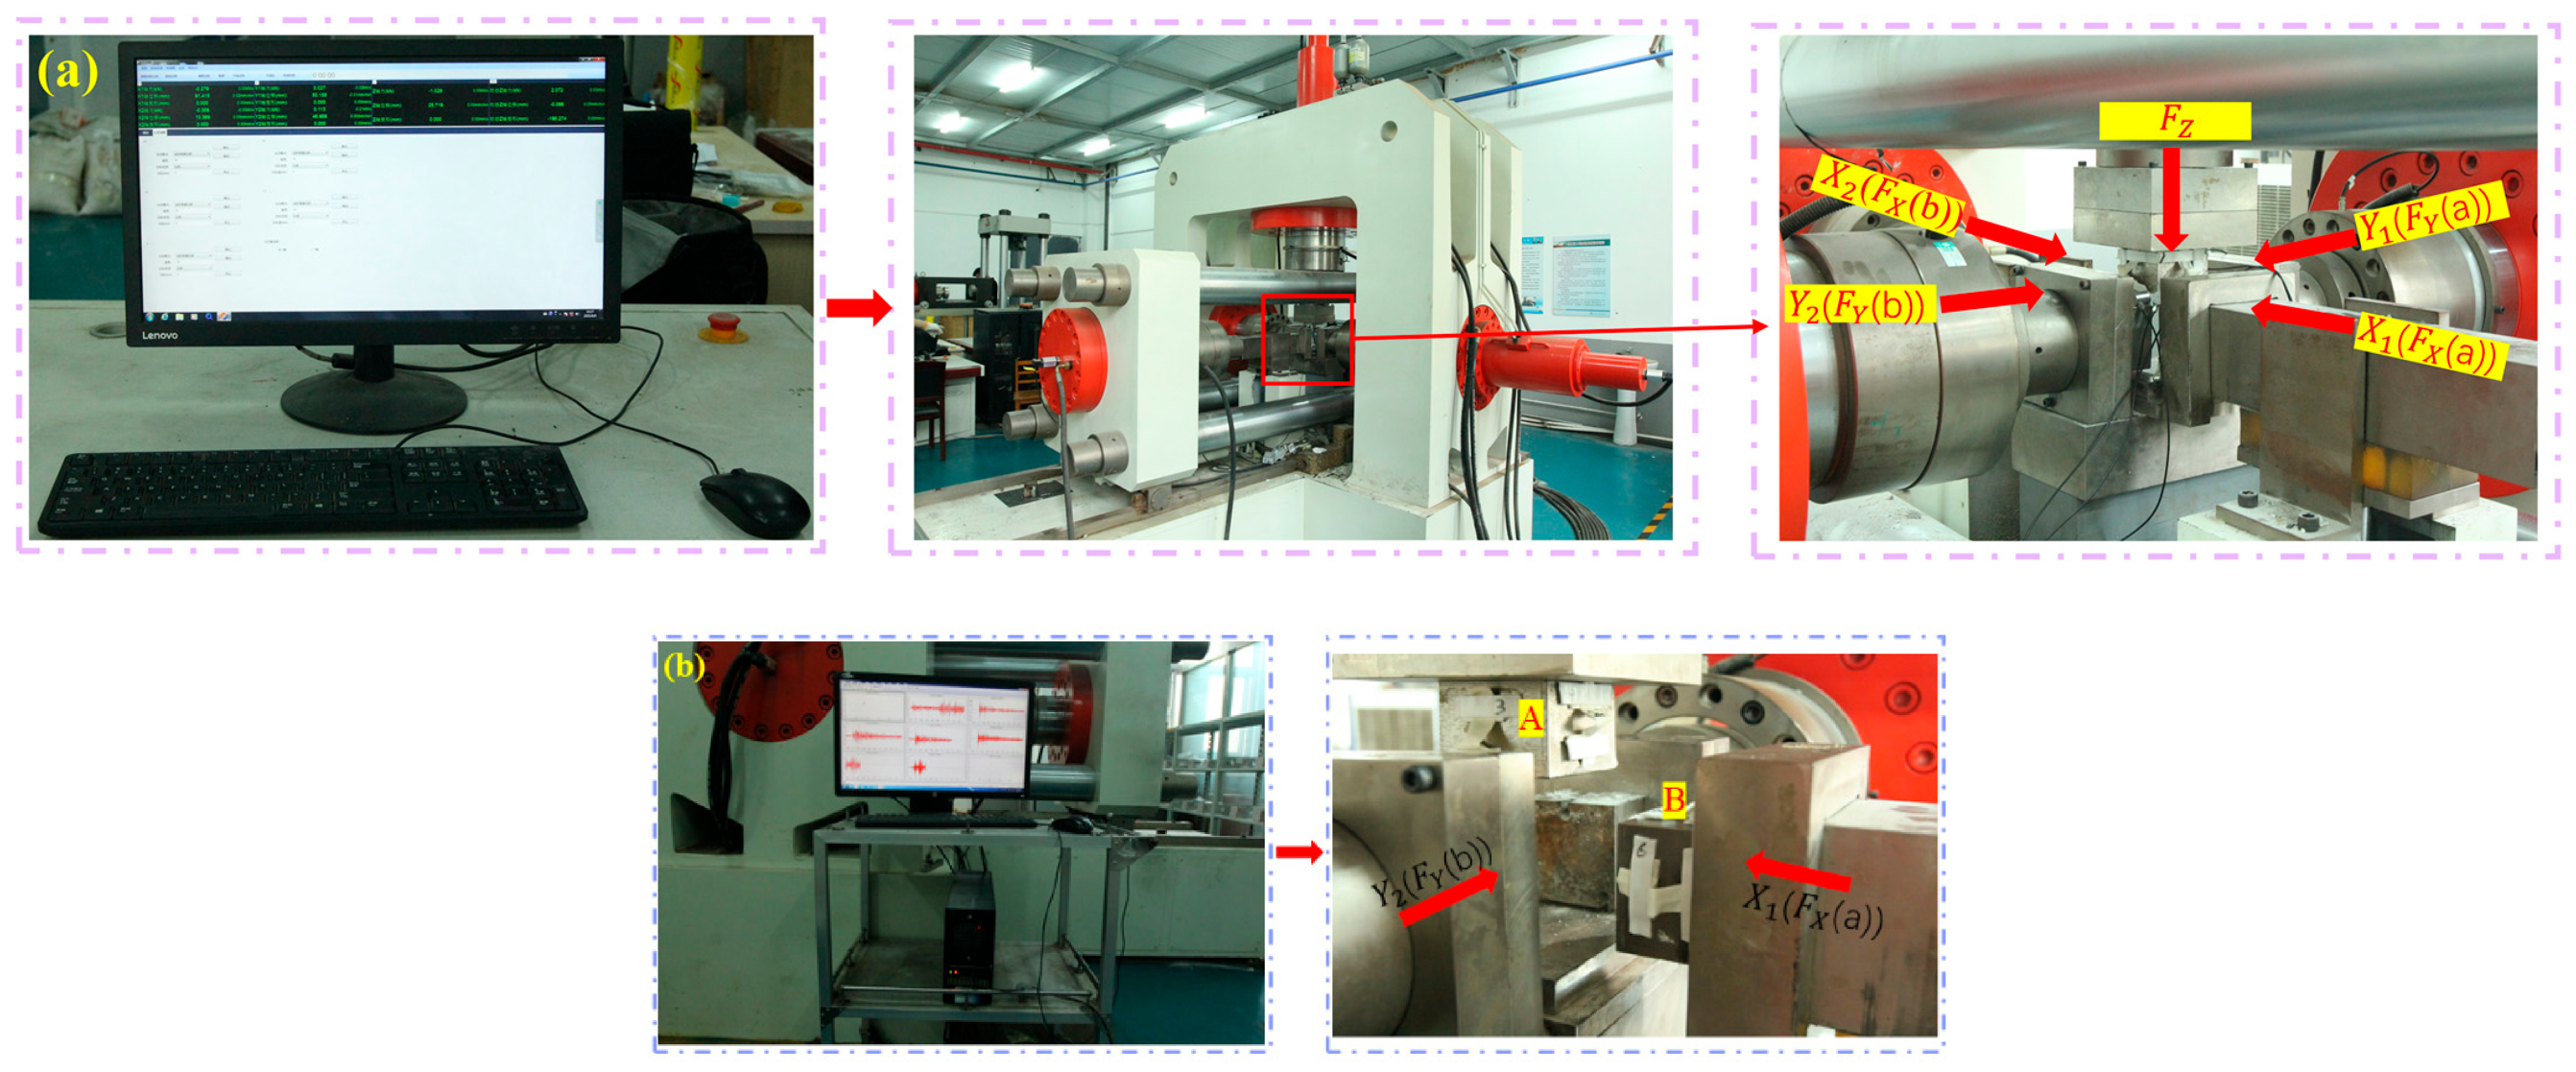
The rockburst simulation test system is primarily composed of a mechanical loading system and an acoustic emission (AE) monitoring system, as illustrated in Figure 2. The mechanical loading apparatus employs the QKX-YB200 true triaxial rockburst testing machine (QIANKUNXIN INTELLIGENT TECHNOLOGY, Qingdao, China), which features a maximum axial load of 3200 kN, a maximum horizontal load of 2400 kN, and a maximum displacement of 200 mm. Both the load and displacement control accuracies are within 0.5%, and the system supports triaxial asynchronous or biaxial synchronous loading and unloading operations. The acoustic emission (AE) monitoring system adopted in this study is the PCI-Express8 multi-channel acoustic emission monitoring system developed by Physical Acoustics Corporation (PAC) of the United States (Princeton Junction, NJ). During the test, three R6α sensors were deployed to acquire acoustic emission signals generated throughout the rockburst process; these sensors have an operating frequency range of 0–300 kHz. Specifically, two sensors were mounted on the Z-axis loading platen (corresponding to Position A in Figure 2b), and one sensor was mounted on one loading end of the X-axis (corresponding to Position B in Figure 2b). Analysis of the test results revealed that the AE parameters collected by different channels exhibited consistent evolutionary trends; accordingly, the channel with the highest signal acquisition count was selected for subsequent data analysis.

2.2. Testing Protocol

Ref. [25] compiled an extensive database of rockburst cases, showing that the burial depths of the affected rock masses are mostly concentrated in the range of 600–1100 m, which represents a high-incidence interval for rockbursts. Therefore, a depth of 900 m was selected in this study as a representative intermediate depth within this range for the unloading rockburst simulation tests. Meanwhile, Refs. [26,27] point out that granite surrounding rocks possess a strong energy storage capacity and fracture energy release potential, and are thus highly susceptible to rockbursts under high-stress conditions. Accordingly, four groups of unloading rockburst tests were conducted to simulate the in situ stress conditions at a depth of 900 m. The vertical principal stress was determined based on the weight of the overlying rock mass, whereas the horizontal principal stresses (i.e., the maximum and minimum principal stresses) were determined according to the results of geological stress measurements in China [28]. Geological stresses at different depths were calculated using Equations (1)–(3).
σ H = 0.02989 H + 2.7984 , ( R = 0.9966 )
σ h = 0.01766 H + 1.0583 , ( R = 0.9987 )
σ v = 0.02532 H + 0.8177 , ( R = 0.9995 )
In the formula, σ H is the maximum horizontal stress, MPa; σ h is the minimum horizontal stress, MPa; σ v is the vertical stress, MPa; H is the depth, m.
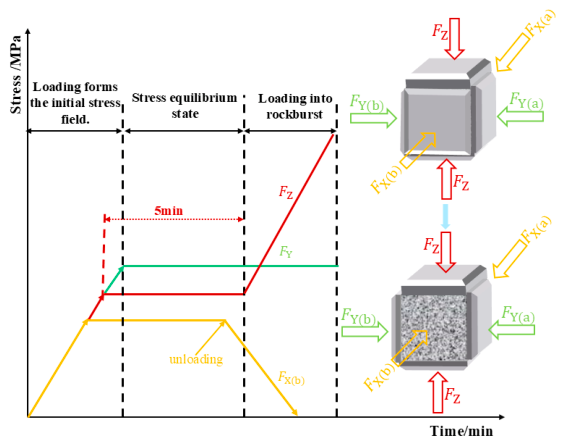
At the start of the test, the specimen was first preloaded to 2 kN in all three directions. Subsequently, the loads in the X, Y, and Z directions were increased at a rate of 1 kN/s to 169.5 kN, 297.0 kN, and 236.1 kN, respectively, and maintained at these target load levels for 5 min to ensure that the internal stress of the specimen achieved stable equilibrium. Rockbursts mostly occur within 1–3 days after excavation [29], indicating that tangential stress concentration is one of the primary causes. Accordingly, in this experiment, vertical loading was applied at a rate of 0.4 mm/min to simulate this tangential stress concentration process. The experimental loading procedure is illustrated in Figure 3. To ensure the accuracy of acoustic emission (AE) signal acquisition, external interference in signal collection was minimized during the experiment through three key measures: optimizing the coupling medium (i.e., applying Vaseline between the sensors and the specimen), arranging the sensors reasonably, and controlling the experimental environment. At the signal processing stage, an appropriate trigger threshold (45 dB) was set, and a band-pass filter was applied to select the frequency range of the acquired signals. The 45 dB threshold was selected to reduce low-level background noise while retaining AE signals generated by microcrack activity, and the band-pass filtering was applied in accordance with the sensor operating frequency range to suppress low-frequency mechanical noise and high-frequency electromagnetic interference. This step helped ensure the reliability and analytical accuracy of the AE signal data.

2.3. Acoustic Emission Analysis Method

2.3.1. Critical Slowing Down Theory

The critical slowing down (CSD) theory is a core concept in statistical physics, which is widely observed in natural dynamical systems. When a dynamical system undergoes a phase transition and gradually approaches the critical point, it typically exhibits a distinctive dynamical characteristic, namely the so-called critical slowing down phenomenon. Its essence lies in the following: minor perturbations within the system that facilitate the formation of new phases start to amplify and persist. This process manifests as increased fluctuation amplitudes, extended fluctuation durations, slower recovery rates following external disturbances, and a gradual decline in the system’s ability to revert to its original state after being perturbed. These dynamical characteristics collectively indicate a weakening of system stability and an inherent tendency of the system to gradually approach a critical transition state. Notably, the critical slowing down (CSD) phenomenon can typically be quantified and observed through two key statistical indicators: variance and autocorrelation coefficient. In general, CSD indicators—variance and autocorrelation coefficient—are employed to quantitatively characterize the critical slowing down (CSD) phenomenon of a system. These indicators exhibit a significant increasing trend as the system approaches the critical point, indicating that the system’s dynamical characteristics and response behaviors undergo substantial changes near the critical point [30,31,32]. CSD indicators can be categorized into metric-based indicators and model-based indicators, both of which are capable of capturing changes in the characteristics of system time series. The key difference between these two categories lies in the fact that model-based CSD indicators (e.g., autoregressive models) can more profoundly characterize the dynamic evolutionary features of the system. In contrast, the metric-based CSD indicators employed in this study—such as autocorrelation coefficient and variance—do not rely on prediction or fitting models during their calculation process. Consequently, they exhibit high applicability in scenarios with limited data volume and where rapid computation is required.
Variance is a fundamental statistical metric that quantifies the degree of dispersion of sample data around its mean value, and its mathematical expression is given as follows:
S 2 = 1 n i = 1 n ( X i X ¯ ) 2
In the formula, S 2 denotes the variance; X i represents the i-th sample datum; and X ¯ is the sample mean.
The autocorrelation coefficient is a statistical measure of dependency between different time points of the same variable. The autocorrelation coefficient of X with lag length j can be expressed as:
a ( j ) = i = 1 n j ( X i X ¯ S ) ( X i + j X ¯ S )
Assuming that the system state variable is subjected to periodic external disturbances with a period of Δ t , the recovery rate of the system following such disturbances is defined as λ . This recovery rate exhibits an approximately exponential relationship with the disturbance period, which can be expressed by the following regression model:
y n + 1 = e λ Δ t y n + s ε n
In the formula, y n denotes the magnitude of the system’s deviation from the equilibrium state; ε n is a random variable that follows a normal distribution. If λ is independent of y n , then this process can be further simplified as follows:
y n + 1 = a y n + s ε n
In the formula, a is the autocorrelation coefficient, a = e λ Δ t .
Based on Equation (7), the following inferences can be drawn through an analysis of the variance Var:
V a r ( y n + 1 ) = E ( y n 2 ) + [ E ( y n ) ] 2 = s 2 1 a 2
In the formula, E denotes the mathematical expectation.
As the system approaches the critical point, the perturbation-induced recovery rate λ gradually decreases and ultimately approaches zero. Meanwhile, the autocorrelation coefficient a approaches 1, whereas the variance tends toward infinity. Thus, the increasing trends of variance and autocorrelation coefficient can be regarded as precursor indicators of the system approaching the critical point.
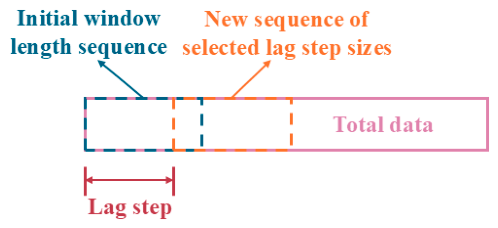
When conducting critical slowing down (CSD) phenomenon analysis, it is essential to rationally set the window length and lag step prior to calculating the variance and autocorrelation coefficient. The window length refers to the number of samples included in each data sequence segment, while the lag step denotes the sliding interval between two consecutive data windows of equal length (see Figure 4). Specifically, the variance is used to characterize the degree of dispersion of the new sequence after lag processing, and the autocorrelation coefficient reflects the linear correlation between the original window sequence and its lagged counterpart.

2.3.2. The Value of b and Its Significance

Acoustic emission (AE) phenomena within rocks can be regarded as small-scale microseismic events occurring inside the material, while the rock fracture process may be analogous to small-scale intense seismic events. Studies have indicated that both AE elastic waves and natural seismic waves mechanistically originate from the accumulation of internal damage in the medium and the instantaneous release of localized energy, thus exhibiting substantial intrinsic similarity. Consequently, the Gutenberg–Richter (G–R) relationship from seismology can be applied to AE analysis: by substituting seismic magnitude with the amplitude of AE events, the energy distribution characteristics of AE events during rock fracture can be quantitatively characterized [33,34].
lg N = a b ( A d B 20 )
In the formula N denotes the cumulative number of acoustic emission events with energy levels greater than or equal to the standardized amplitude; A d B represents the acoustic emission amplitude; a is a constant.
From a physical perspective, a larger b-value indicates that the specimen predominantly generates numerous low-energy AE events internally, with damage mainly manifesting as the dispersed initiation of microcracks. Conversely, a smaller b-value signifies the frequent occurrence of high-energy AE events, accelerating the propagation and penetration of macroscopic cracks, thereby gradually driving the material into an unstable fracture stage. When the b-value remains relatively stable during the loading process, it implies that the ratio of small-scale to large-scale AE events does not change significantly. This indicates a state of relative equilibrium between microcrack activity and macrocrack activity within the specimen.

3. Rockburst Fracture Evolution and Acoustic Emission Characteristics

3.1. Rockburst Instability Failure Process

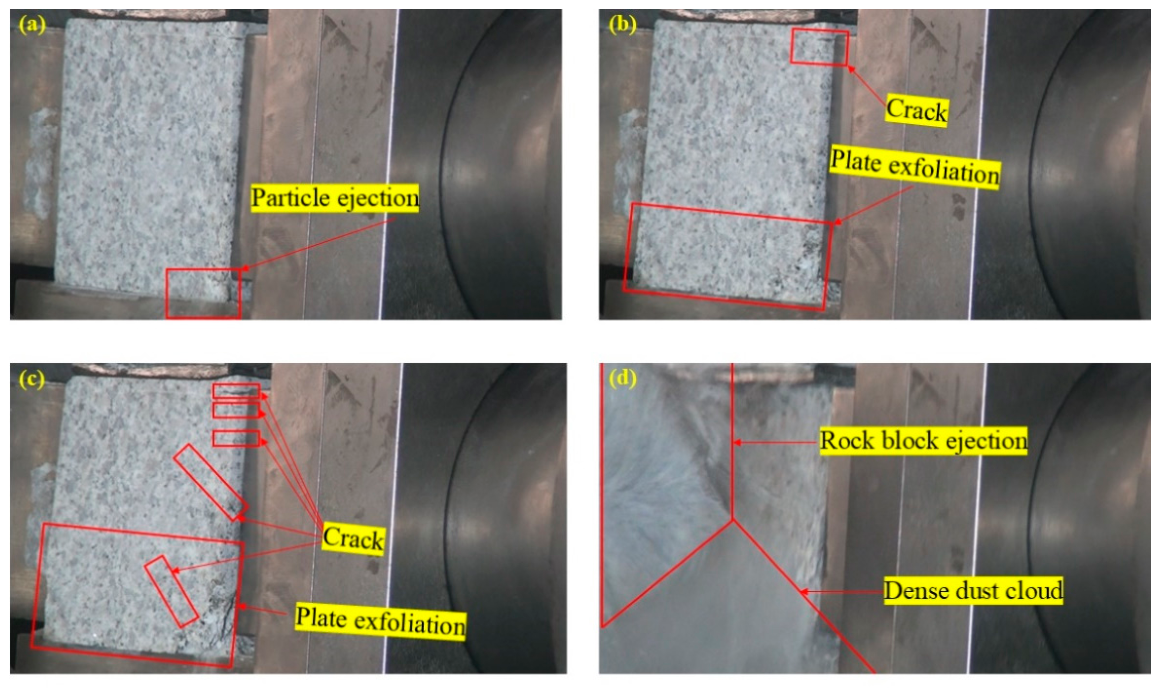
Based on existing literature [35,36,37] and the macroscopic failure characteristics observed in laboratory tests, the rockburst evolution process can be generally divided into four sequential stages: particle ejection, plate detachment, plate fragmentation, and block ejection, as schematically illustrated in Figure 5.
Particle ejection: Following a period of stability, microcracks within the specimen begin to initiate and propagate as loading increases. Multiple instances of minor particle and small block ejection occur above the unloading surface, accompanied by cracking sounds. Dust begins to appear during this stage, though overall strength remains low.
Plate detachment: Surface cracks propagate, causing plate-like or shell-shaped rock fragments to undergo brittle detachment along fracture boundaries, accompanied by distinct cracking sounds.
Shear Fragmentation: Crack propagation accelerates, causing rapid polygonal or block-like fragmentation of the rock surface. Fragments often exhibit slight tremors or displacements before detachment, accompanied by dust and increasingly dense fracturing sounds.
Block ejection: Rock fragments are propelled at high velocity from the specimen surface, accompanied by intense brittle fracture sounds and dense dust clouds. This represents the most concentrated energy release phase throughout the unloading rockburst process.

3.2. Characteristics of Rockburst Acoustic Emission Behavior During Unloading

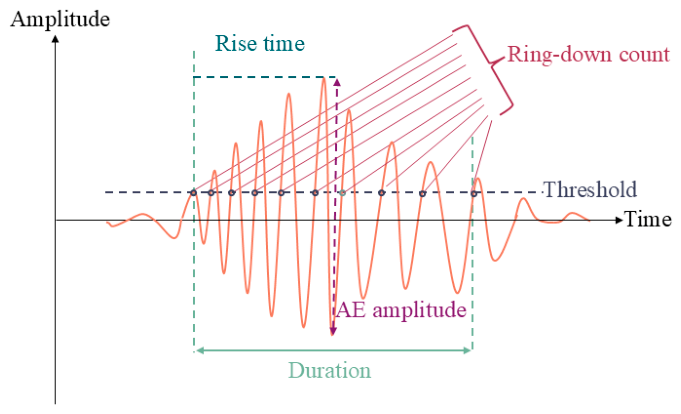
To comprehensively characterize the fracture behavior of rock during loading, this study selected the rise time, ring-down count, amplitude, duration, peak frequency, RA, and RA/AF of acoustic emission signals as primary analytical parameters (see Figure 6), where RA is defined as rise time/amplitude, AF is defined as ring-down count/duration, and RA/AF denotes the ratio between these two derived AE parameters. These parameters reflect the micro-damage evolution process of rock masses from multiple dimensions, including energy release characteristics, crack propagation rates, and fracture mechanism classification, possessing strong physical significance and behavioral indicative properties. Among them, amplitude and ring-down count reflect the intensity of cracking and local energy release levels; duration and rise time characterize the persistence and response speed of fracture signals; peak frequency, RA values, and the RA/AF ratio are frequently employed to distinguish between shear and tensile fracture mechanisms, providing a basis for identifying rock mass instability types. Multi-parameter joint analysis helps reduce identification errors and enhances the ability to differentiate between various precursor behaviors.
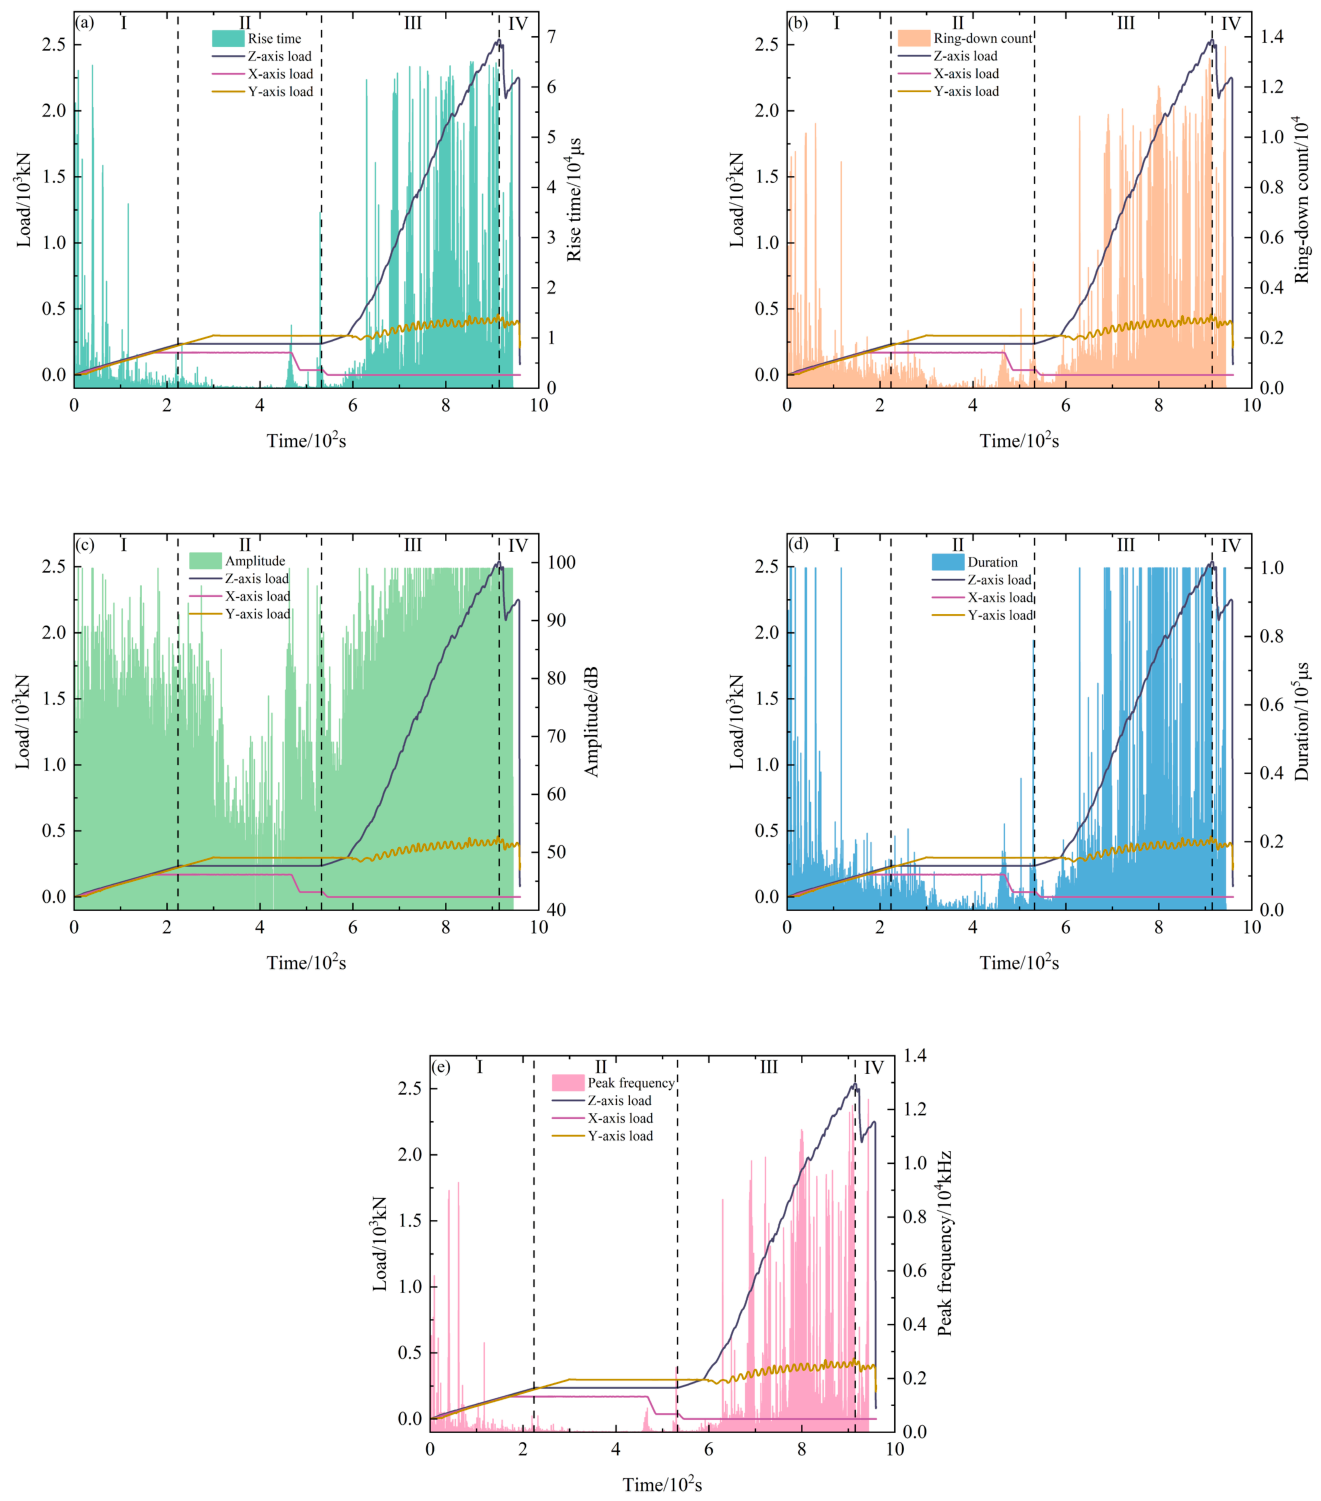
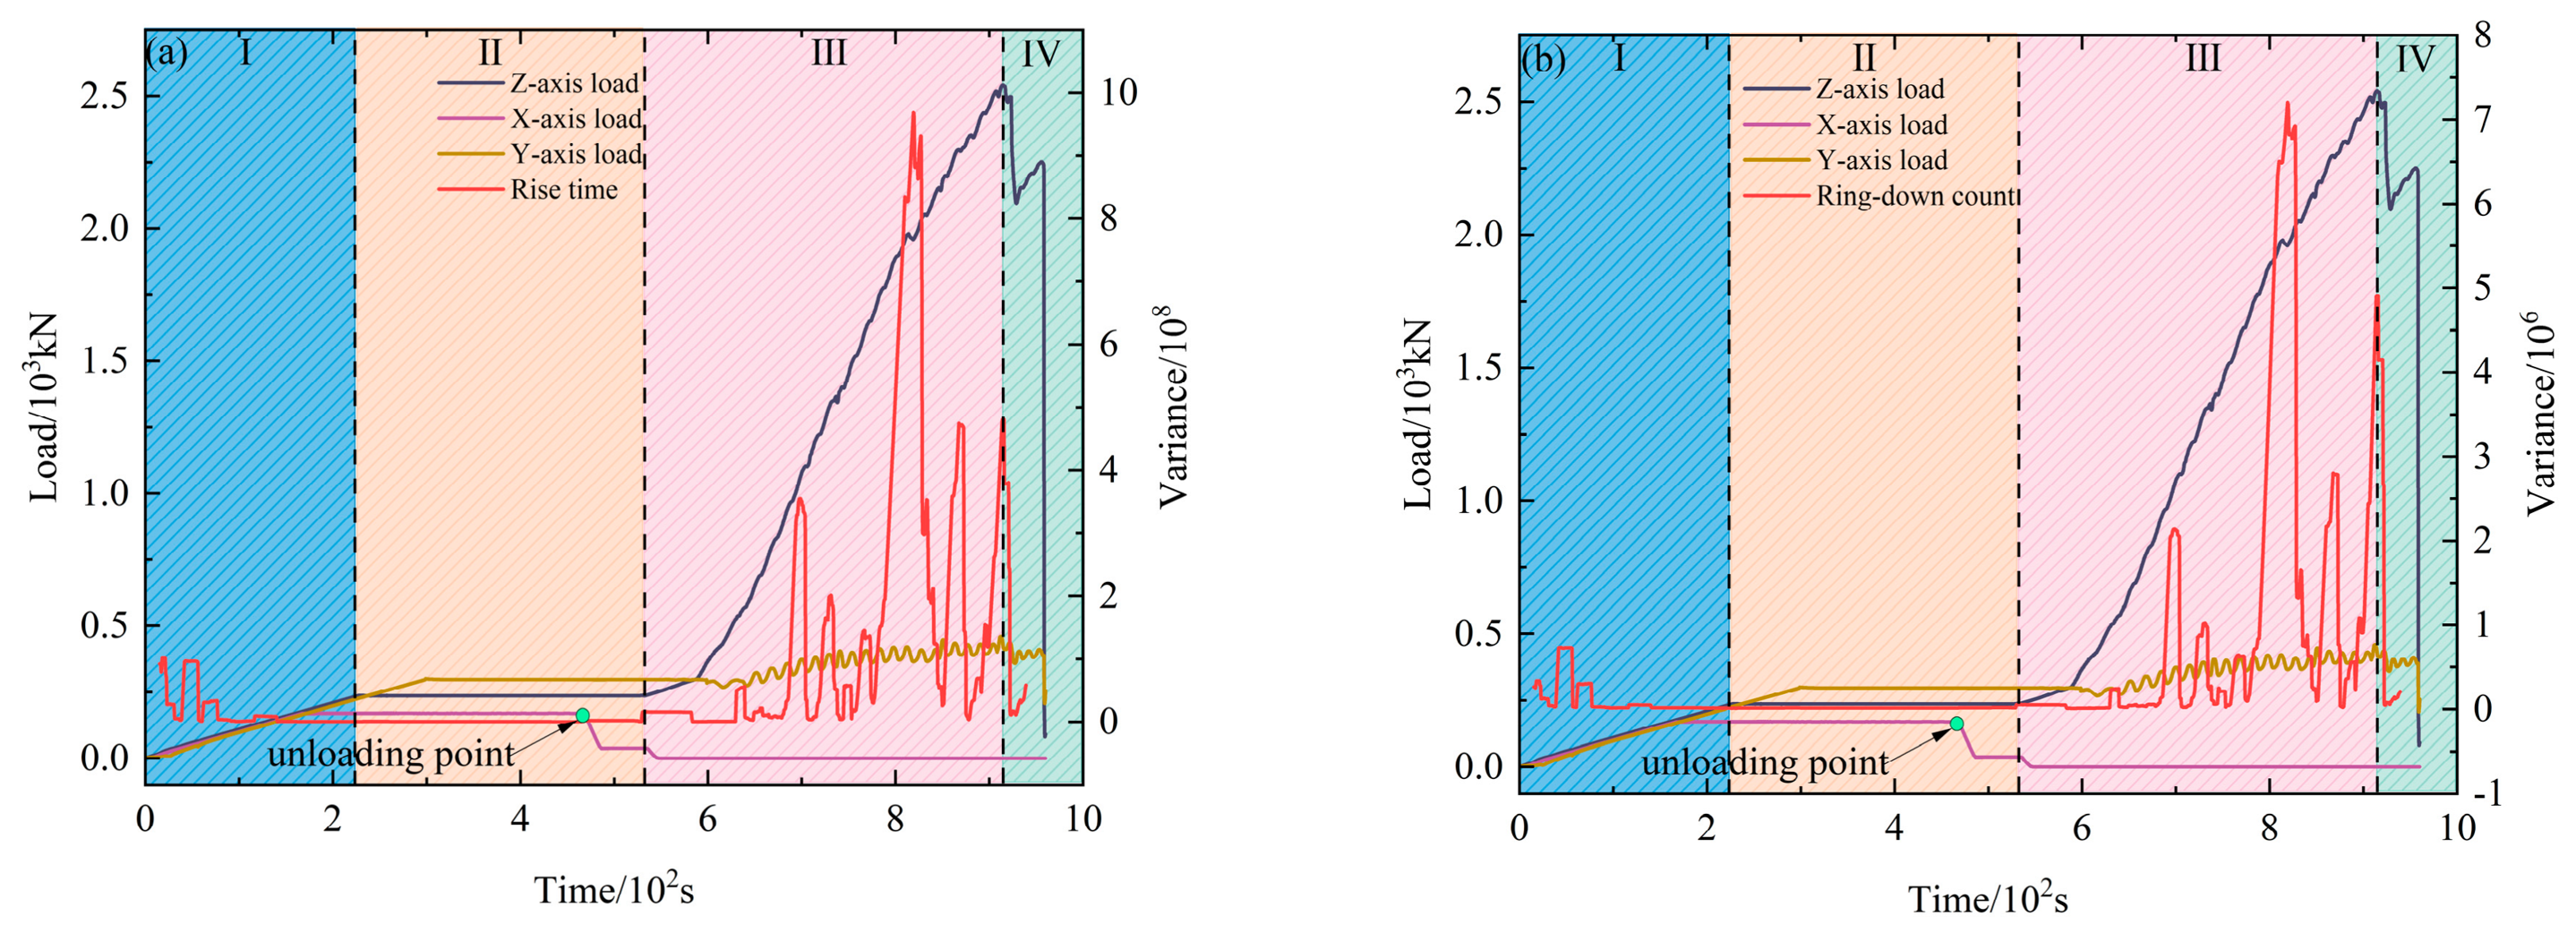
The evolution patterns of typical parameters during rockburst processes (rise time, ring-down count, amplitude, duration, and peak frequency) are illustrated in Figure 7. Based on the evolution of the axial (Z-axis) stress, four stages are identified: Stage I corresponds to the initial stress loading stage, Stage II to the load-holding stage, Stage III to the macro-failure stage, during which the Z-axis load continues to increase toward its peak, representing the stress concentration process associated with rockburst initiation, and Stage IV to the post-peak stage after the Z-axis load reaches its peak and begins to decrease.
Stage I: Initial stress loading stage. During this stage, a certain number of microfractures occur. The propagation of these microfractures generates a small number of macroscopic cracks, thereby producing a limited number of stronger acoustic emission signals. The amplitude exhibits a more pronounced response characteristic compared to other parameters, primarily because it reflects the maximum amplitude of the transient pulse without requiring time integration processing. Concurrently, the high gain and short-time response characteristics of the acoustic emission instrument heighten its sensitivity to peak signals. Consequently, amplitude often exhibits more pronounced features among acoustic emission parameters. Stage II: Load-holding stage. At the initial stage of this phase, acoustic emission (AE) signals are minimal due to the stable X-axis and Z-axis loads. Overall, rise time, ring-down count, duration, and peak frequency remain at relatively low levels. As unloading progresses, stronger AE signals with higher parameter values emerge compared to the early stage of Stage II. This phenomenon is attributed to the rapid stress release during unloading and the transient unstable propagation of internal cracks in the specimen. Stage III: Macro-failure stage. During the quiescent period of this stage, AE signals generated by energy storage are weak. As loading increases, AE parameters exhibit significant abrupt changes or rapid increases prior to failure, with overall AE signals remaining at elevated levels throughout this stage. Stage IV: Post-peak stage. This stage coincides with large-scale fracturing, resulting in complete specimen failure. As conventional AE characteristic parameters fail to directly reveal precursory features of rockburst failure, this study further incorporates tensile–shear crack evolution analysis, critical slowing down theory, and AE b-value analysis for precursor identification.

4. Quantitative Characterization and Evolutionary Features of Tensile–Shear Fracturing During Rockburst Processes Under Unloading Conditions

4.1. Quantitative Characterization of Tensile Shear Failure

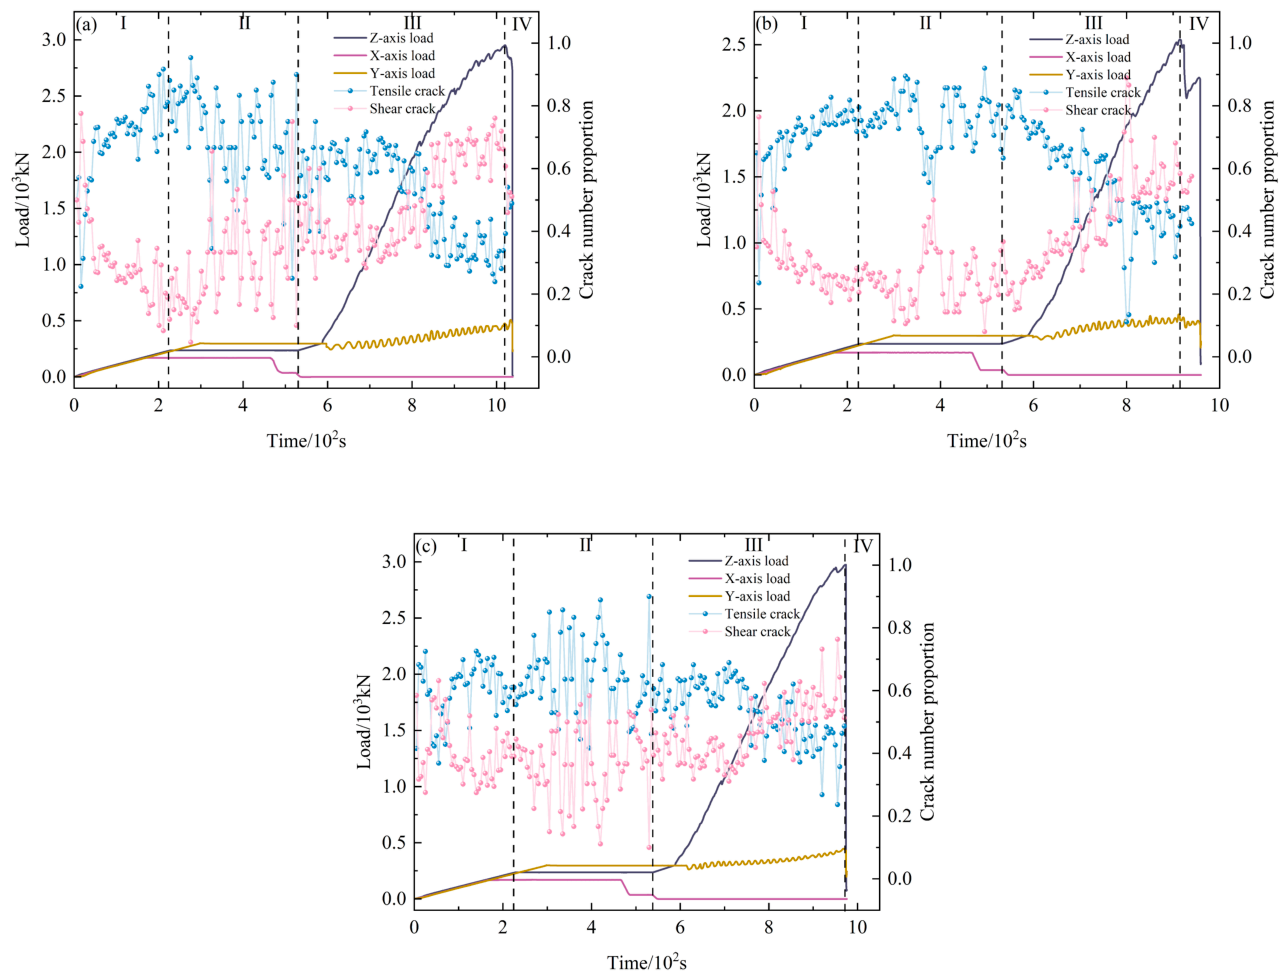
Employing a PSO + GMM + SVM classification model [38], the source fracture types of acoustic emission signals during rockburst events are identified and categorized, distinguishing between tensile and shear fractures. Based on the classification results, the quantities of both fracture signal types are statistically determined, thus enabling quantitative characterization of tensile and shear fracture occurrences during rockburst processes. In that study, the AE data from three granite direct-shear specimens, HGZJ-1, HGZJ-2, and HGZJ-3, were used for training, and HGZJ-5 was used as the test set. The final DT-AdaBoost classifier achieved a total identification accuracy of 0.9887. Since this framework was established and validated using AE data from laboratory direct-shear fracture tests on granite, it was adopted in the present study as a reference method for fracture-mode discrimination of specimens GS-900-0.8-1, GS-900-0.8-3, and GS-900-0.8-4 in the current granite unloading tests.

4.2. Dynamic Evolution and Precursor Characteristics of Tensile Shear Failure

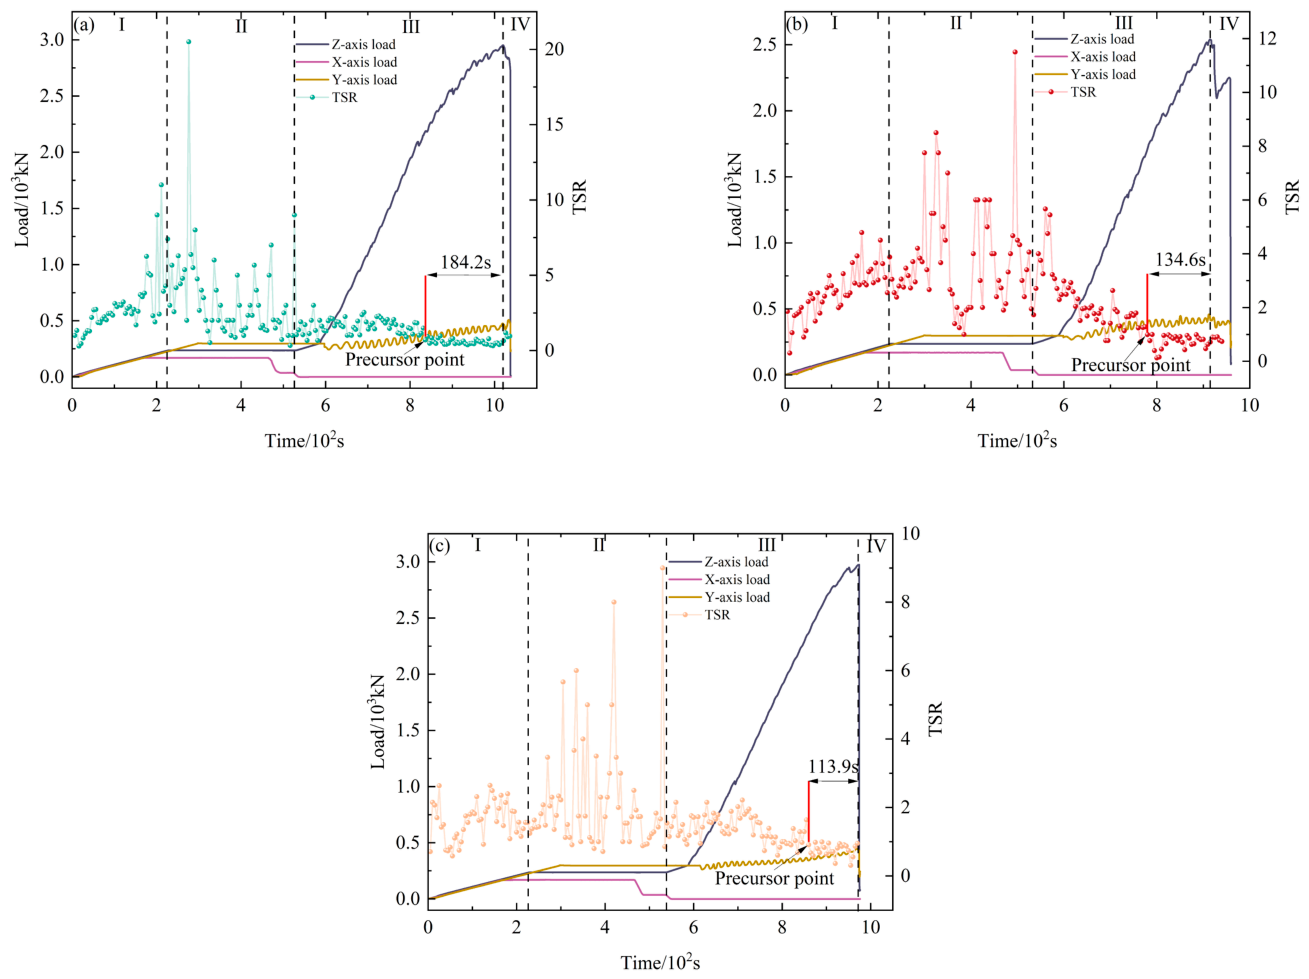
The variation in the proportion of tensile fractures versus shear fractures during rockburst processes is illustrated in Figure 8. Results indicate that tensile fractures predominated during the early phases of Stages I, II, and III, which exhibited an initial rise followed by a decline, with their proportion consistently remaining above 50%. In the latter part of Stage III, the proportion of tensile fractures continued to decrease, falling below 50%, while the proportion of shear fractures exceeded 50%, gradually becoming dominant and thus demonstrating their triggering effect on rockburst hazards. Overall, the proportion of tensile fractures exhibited a decreasing trend during the rockburst process, while the proportion of shear fractures gradually increased. During the interplay between the two in Stage III, a critical point of equal proportion existed, defined herein as the tensile–shear equilibrium point. Prior to this equilibrium point, tensile fractures predominated, while shear fractures became dominant thereafter.
Based on the quantitative classification results, the tensile–shear ratio (TSR) is introduced to characterize the relative proportion of tensile and shear fractures during the rockburst process. TSR is defined as:
T S R = N t r N s r
In the formula, Ntr represents the proportion of tensile failures, and Nsr represents the proportion of shear failures.
The TSR characterizes the quantitative relationship between tensile and shear fractures during rockburst processes. When TSR = 1, it indicates an equal proportion of tensile and shear fractures. When TSR > 1, tensile fractures predominate over shear fractures. Conversely, when TSR < 1, shear fractures exceed tensile fractures, thus becoming the dominant fracture mechanism.
As shown in Figure 9, a TSR-based precursor is identified only when the TSR first falls below 1 and remains below 1 for at least three consecutive calculation points, rather than at an isolated single point. This indicates that shear failure has become dominant. The first point of this sustained TSR < 1 sequence is regarded as the precursor point. However, this threshold should be understood as being dependent on specific conditions, as the tensile–shear ratio and its transition characteristics may vary with rock type, stress state, surrounding rock conditions, and loading/unloading paths. Therefore, for other rock types or engineering conditions, the TSR threshold should be recalibrated and validated prior to application. The precursor information for the specimens is presented in Table 1.
As shown in Table 1, the TSR-based warning-time proportions of the three specimens are concentrated within the range of 81–89%, with an average of 85.18%, indicating that the proposed precursor criterion shows relatively good timeliness under the present experimental conditions.

5. Critical Slowing Down Behavior of Acoustic Emission Prior to Rockburst Under Unloading Conditions

5.1. Effect of Window Length and Lag Step Size on Critical Slowing Down Indicators

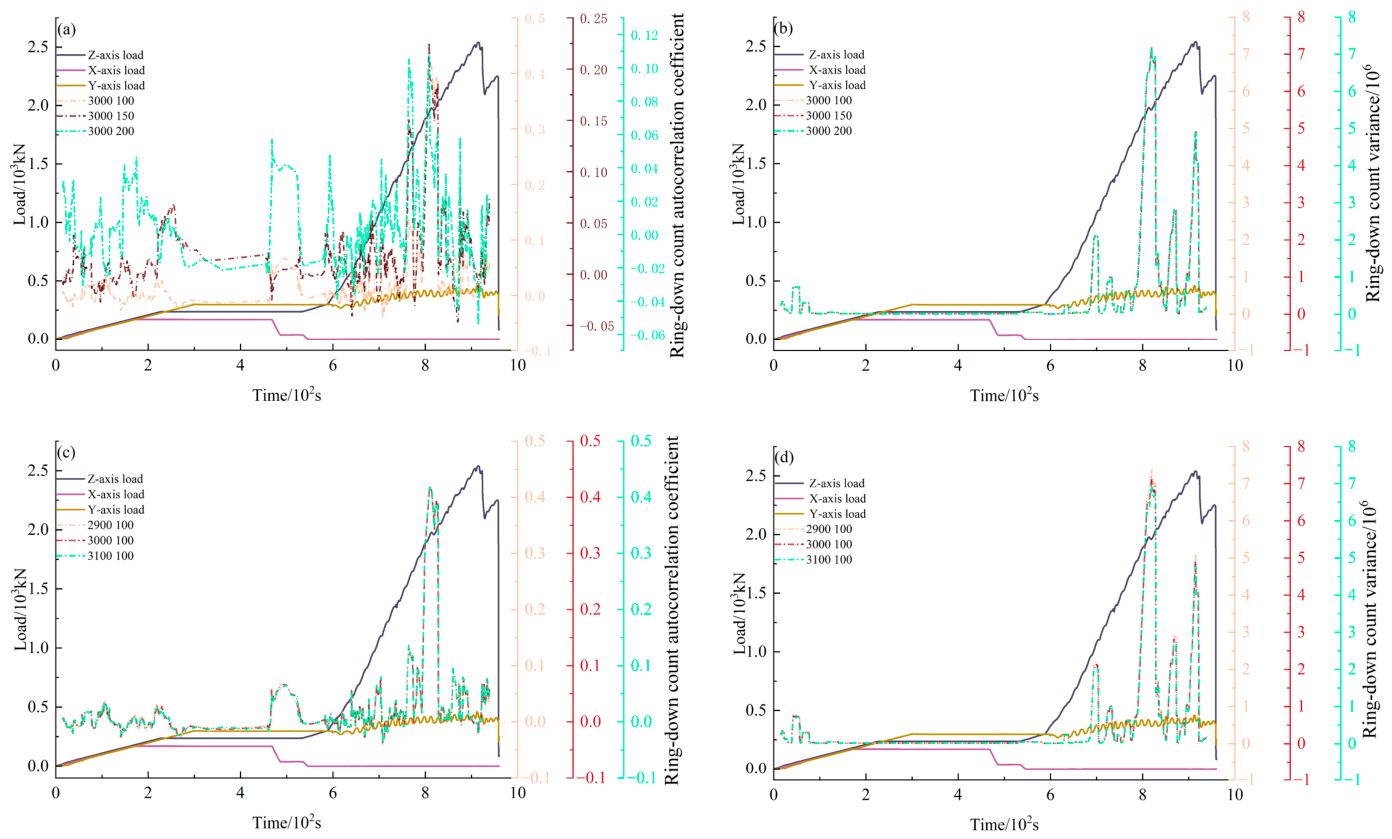
Taking the acoustic emission parameter (ring-down count) of specimen GS-900-0.8-3 as an example, the influence of different window lengths and lag steps on the critical slowing down phenomenon was analyzed. To investigate the effect of the lag step size on variance and autocorrelation coefficients under the condition of a fixed window length, the window length was set to 3000, with lag step sizes of 100, 150, and 200. Additionally, we examined the influence of varying window lengths on AE variance and autocorrelation coefficients: with a lag step size of 100, window lengths were set to 2900, 3000, and 3100. As illustrated in Figure 10, when the window length was 3000 and the lag step was 200, the autocorrelation coefficient curve exhibited the greatest fluctuation amplitude, whereas fluctuations were relatively smaller for lag step sizes of 100 and 150 (Figure 10a). When the lag step was 100 and window lengths were 2900, 3000, and 3100, respectively, the autocorrelation coefficient curves were nearly identical (Figure 10c). When the window length was 3000 and lag steps were 100, 150, and 200, respectively, the variance curves were nearly identical (Figure 10b). When the lag step was 100, the peak of the variance curve during the precursor phase decreased with increasing window length, reaching its maximum when the window length was 2900 (Figure 10d). Compared to variance, the autocorrelation coefficient curve exhibited more scattered fluctuations, yet its overall trend remained consistent, aligning with the conclusions drawn by Zhu et al. and Wei et al. [39,40]. This stems from variations in correlation between the new and original sequences under fixed lag step conditions. While window length and lag step influence autocorrelation coefficient fluctuations to some extent, they exert a negligible impact on precursor onset timing, indicating their effect on precursor information is negligible. It should be noted that the sensitivity analysis of window length and lag step was mainly conducted using the ring-down count sequence of the representative specimen GS-900-0.8-3. Since the precursor evolution trends for window lengths of 2900, 3000, and 3100 were very similar, 3000 was selected as a representative intermediate value. Likewise, although different lag steps gave similar precursor timing, the autocorrelation coefficient fluctuated most strongly at 200, whereas 100 and 150 were relatively more stable. Considering that 100 also provides the highest temporal resolution, the final setting of 3000/100 was adopted as a practical compromise between stability and resolution, and as a unified parameter setting for subsequent comparative analysis.

5.2. Critical Slowing Down Behavior Analysis of Multi-Parameter Acoustic Emission

5.2.1. Autocorrelation Coefficient Analysis

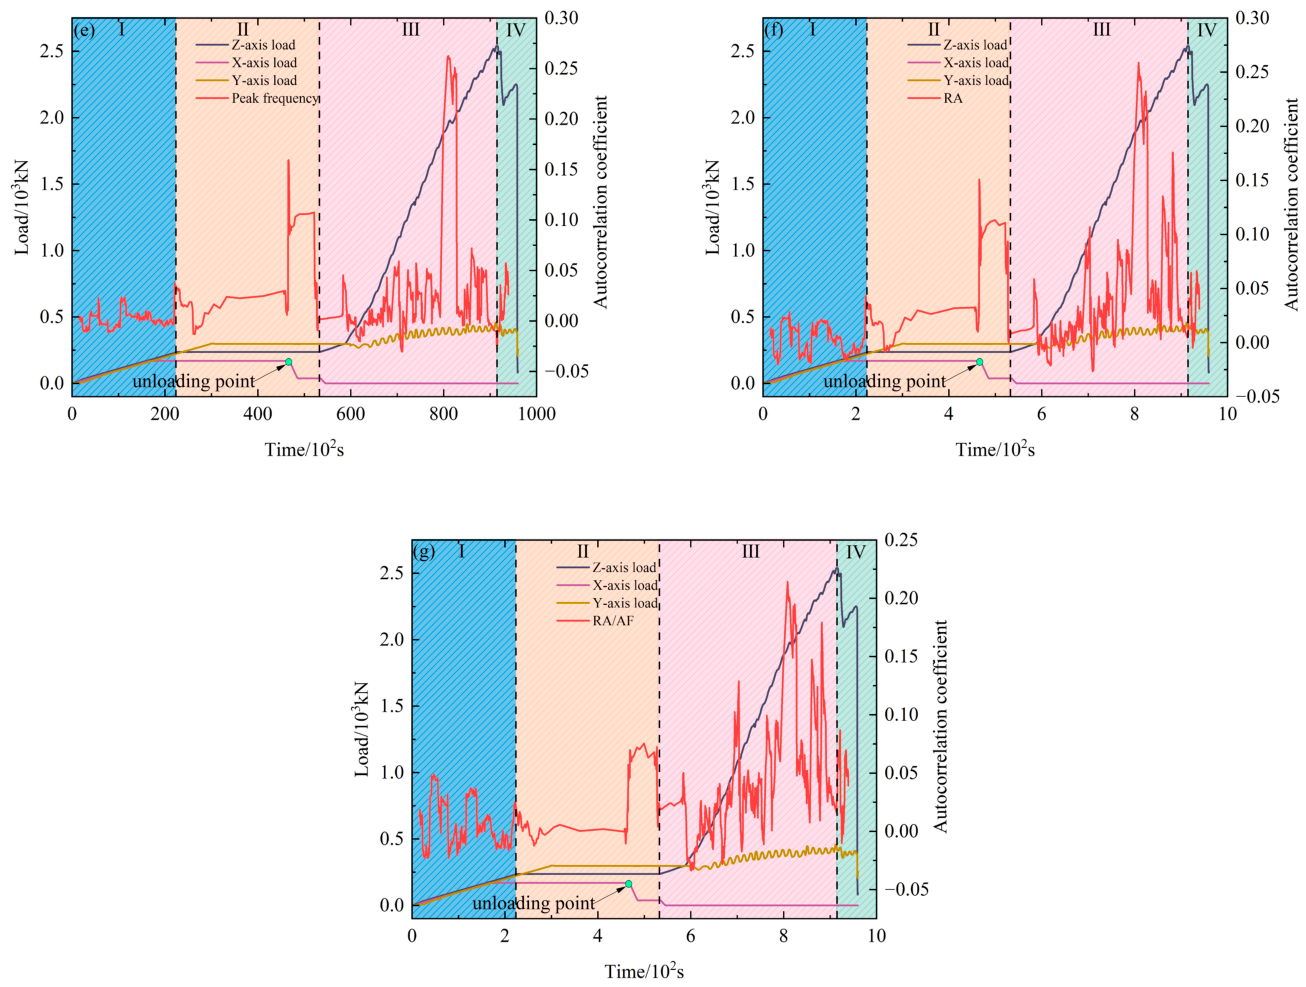
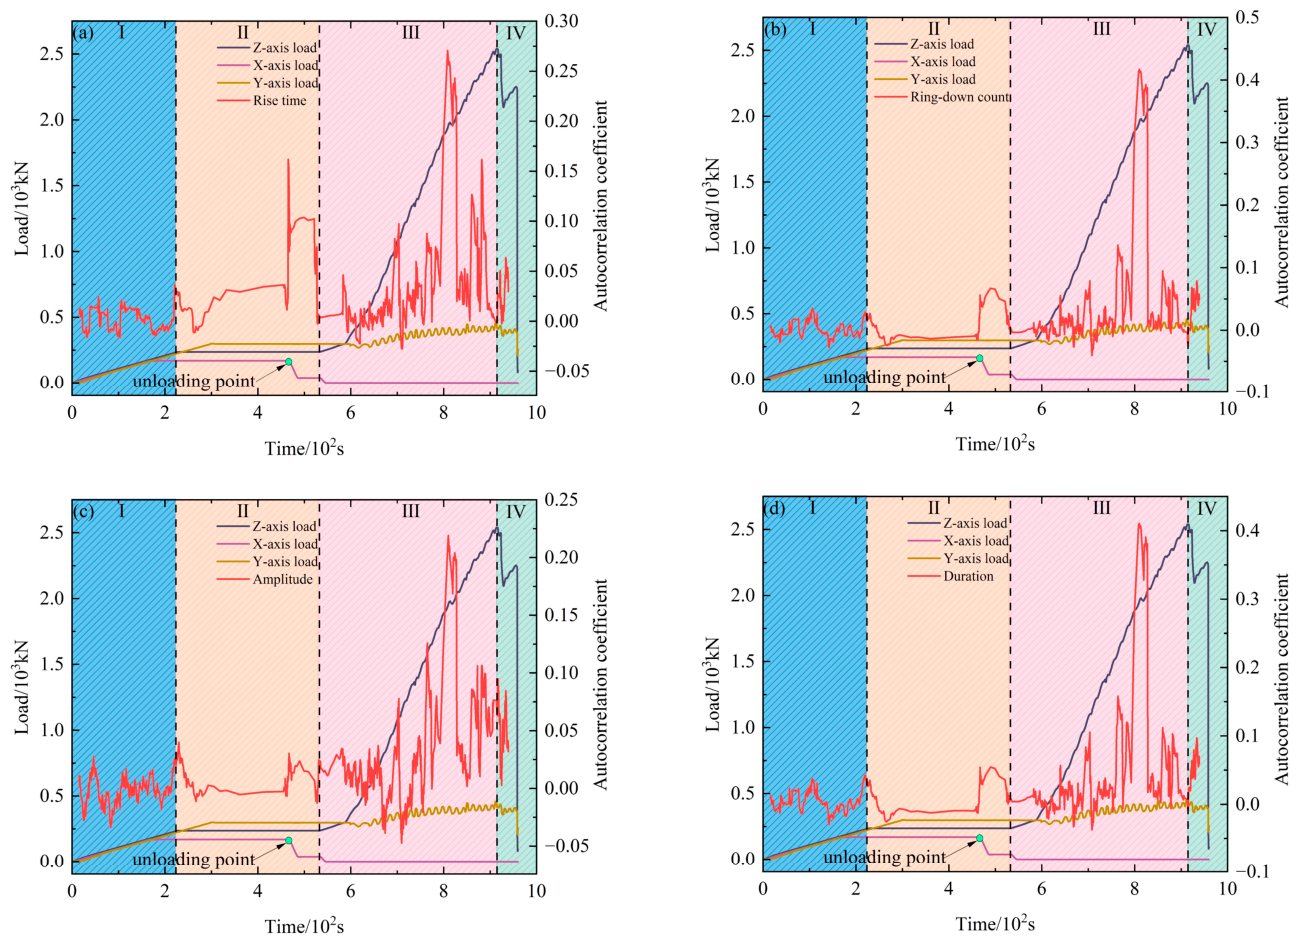
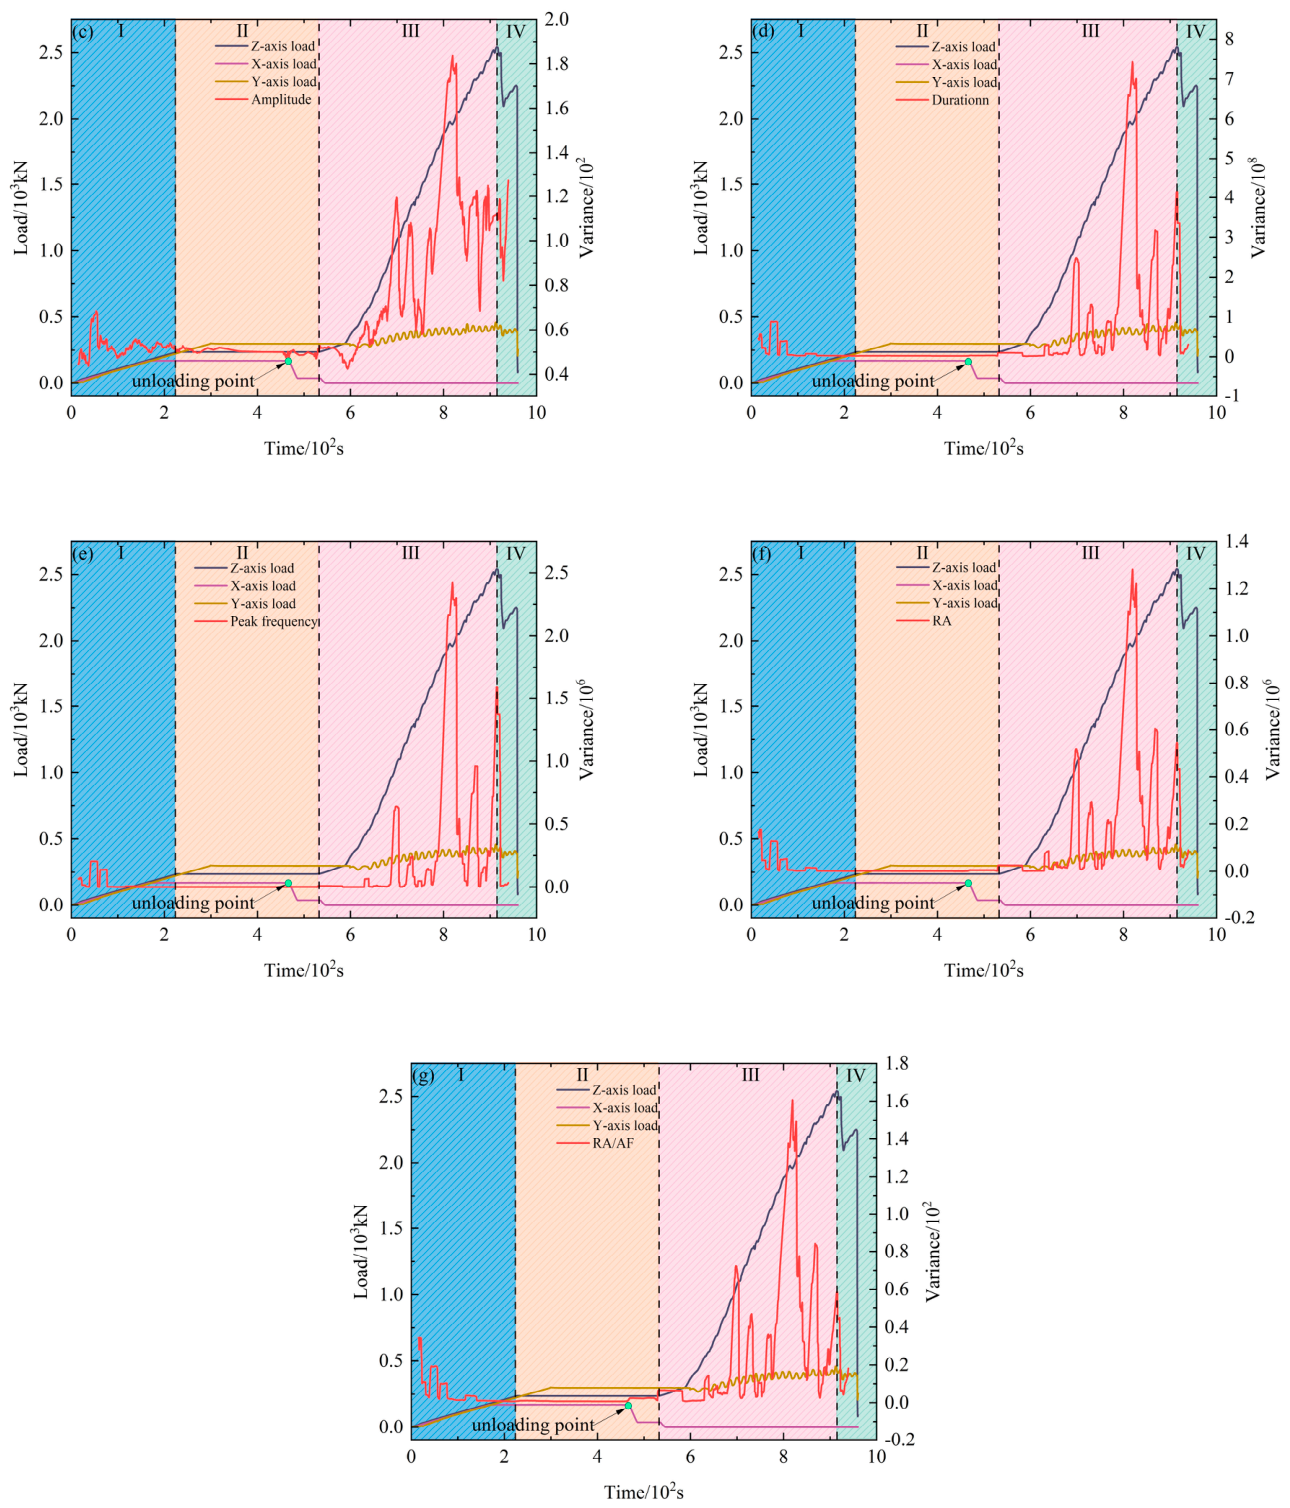
Given the consistent response patterns exhibited by the granite specimens during testing, and due to space constraints, this paper selects the representative granite specimen (GS-900-0.8-3) for detailed discussion. The changes in autocorrelation coefficients for acoustic emission parameters during the rockburst process (rise time, ring-down count, amplitude, duration, peak frequency, RA, and RA/AF) are illustrated in Figure 11. As shown in Figure 11, the autocorrelation coefficients of AE parameters fluctuated during the first loading phase (Stage I) of the rockburst process. During the early stage of Stage II, minor fluctuations occurred primarily due to the generation of a small number of acoustic emission signals as the Y-direction load remained in the loading phase. In the mid-stage, as the triaxial loading stabilized, the autocorrelation coefficient generally maintained a relatively steady level. In the late stage, accelerated crack propagation caused by unloading triggered significant fluctuations in the autocorrelation coefficient. During Stage III, the autocorrelation coefficient of the AE parameter continued to exhibit fluctuating behavior. At the onset of this stage, fluctuations were relatively minor; as loading progressed, the amplitude of fluctuations gradually increased. Upon reaching a certain load level, the autocorrelation coefficient of the AE parameter experienced a sustained, substantial surge, followed by a decline after reaching its peak, demonstrating a pronounced abrupt change characteristic.

5.2.2. Analysis of Variance

The variance changes in acoustic emission parameters during rockburst processes (rise time, ring-down count, amplitude, duration, peak frequency, RA, and RA/AF) are illustrated in Figure 12. As evident from Figure 12, the variance of AE parameters during rockburst remained virtually stable in the late Stage I and Stage II phases (with amplitude exhibiting more noticeable fluctuations due to its smaller variance values). In Stage III, once loading reached a certain level, the variance of AE parameters exhibited a sustained, substantial increase, a trend similar to that of the autocorrelation coefficient. After peaking, it showed an overall downward trend, thus exhibiting distinct abrupt change characteristics.

5.3. Analysis of Precursor Characteristics

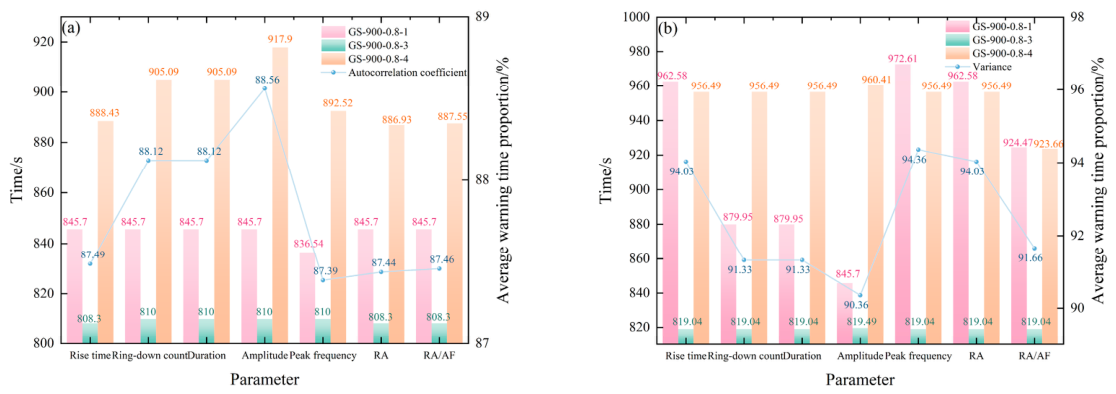
According to critical slowing down theory, when a system transitions from a stable state to a critical failure state and approaches a critical point, the autocorrelation coefficient and variance of its characteristic parameters typically increase significantly. Consequently, pronounced changes in the autocorrelation coefficient and variance of acoustic emission parameters can be identified as reliable precursors to rockburst occurrence. Thus, these peak points where acoustic parameters undergo significant changes serve as precursor points with predictive significance. The corresponding times for the autocorrelation coefficient and variance precursor points of each specimen, along with the average early warning time proportion of AE characteristic parameters, are shown in Figure 13. The autocorrelation coefficients and variances of the acoustic emission parameters for the specimens, as well as the warning lead times and average warning lead times, are shown in Table 2 and Table 3.
As shown in Figure 13, among the autocorrelation coefficient indicators, the peak frequency parameter has the lowest average early warning time proportion (87.39%), indicating the earliest warning time; while that of amplitude is the highest (88.56%), with the latest warning time. Among variance indicators, amplitude exhibits the lowest average proportion (90.36%), making it the earliest warning parameter among variance indicators; conversely, the peak frequency parameter has the highest proportion (94.36%), occurring near the moment of failure. This indicates that different analytical methods exhibit varying degrees of sensitivity to changes in the same parameter. It is noteworthy that the RA/AF value exhibits a relatively low proportion in the average warning time for both the autocorrelation coefficient and variance indicators (autocorrelation coefficient: 87.46%; variance: 91.66%), thus further highlighting its stability and superior early warning performance as a precursor indicator.
Specimen GS-900-0.8-3 exhibited a high degree of concentration in the early warning time proportions across all parameters for both the autocorrelation coefficient and variance indicators, indicating a highly consistent rock fracture process for this specimen. In contrast, data from specimens GS-900-0.8-1 and GS-900-0.8-4 exhibited fluctuations across different parameters, reflecting the complexity of the rock fracture process. The dominant precursor mechanisms may vary due to subtle differences in the internal structure of these specimens.
Overall, based on the analysis of AE parameters under the framework of critical slowing down theory, the three specimens show generally similar precursor evolution trends under the present test conditions, although some parameter-level fluctuations are still present. These results provide preliminary evidence for the applicability of CSD-based indicators in unloading-induced rockburst precursor identification, but are not sufficient to support stronger claims regarding reliability or reproducibility. The precursor points identified by the autocorrelation coefficient indicators typically preceded those identified by variance indicators. The corresponding average early warning time proportions for AE characteristic parameters are concentrated at 87–88% and 91–95%, respectively, across all tested parameters. This discrepancy indicates that during rockburst processes triggered by unloading, the system first exhibits diminished resilience—specifically, a marked enhancement in short-term memory within the acoustic emission time series, with autocorrelation coefficients reaching critical thresholds earlier. Subsequently, the amplitude of intrinsic fluctuations gradually amplifies, resulting in variance indicators exhibiting precursor responses only as the system approaches the instability threshold. This evolutionary sequence—“an initial enhancement of temporal correlation, then a subsequent amplification of intrinsic fluctuation amplitude”—aligns with the pre-instability statistical characteristic changes revealed by critical slowing down theory. It thereby validates that the dynamics of unloading-induced rockburst processes conform to typical critical instability mechanisms.
Moreover, the critical slowing down theory consistently identifies precursor characteristics across all acoustic emission parameters of the three test specimen groups—including rise time, ring-down count, amplitude, duration, peak frequency, RA, and RA/AF. This thus indicates that the critical slowing down phenomenon is not an isolated fluctuation in a single parameter but rather a manifestation of the overall dynamic stability evolution of the rock fracture system. Although the proportion of warning time varies among different specimens, it generally remains within the range of 87–95%, indicating that a relatively clear and exploitable early warning window exists prior to unloading-induced rockburst events. This in turn provides crucial empirical support for the development of a multi-indicator collaborative prediction method based on critical slowing down.

6. Characterization of the b-Value in Acoustic Emission

Rockburst Failure Analysis Based on b-Value

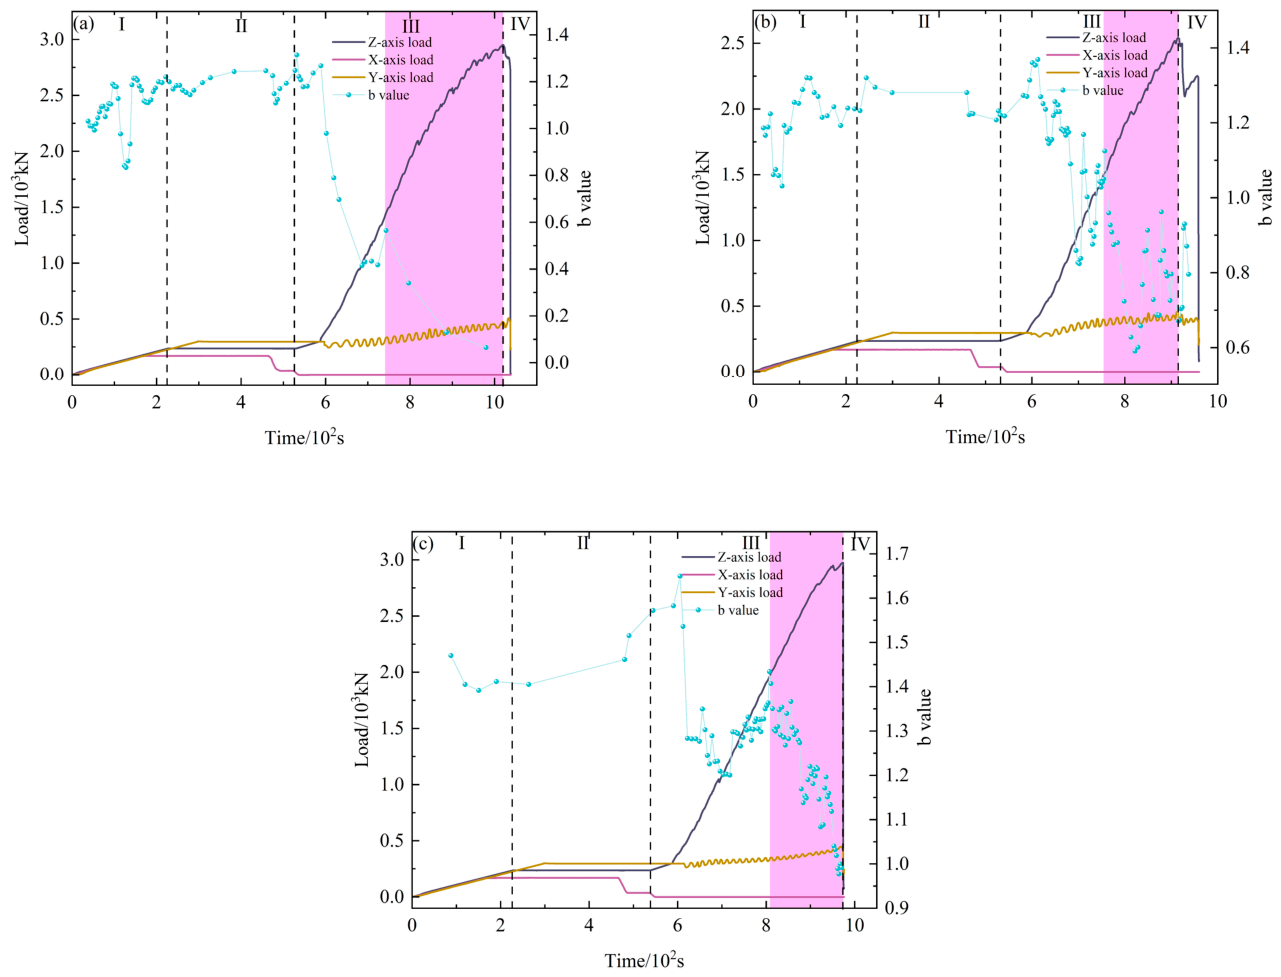
From Figure 14, it can be seen that the b-value versus load curves of different samples all exhibit obvious stage characteristics, but there are still certain differences among the samples. Overall, all specimens maintain a high b-value level during Stages I and II. These stages are characterized by internal fracturing activity dominated by numerous low-energy microcracks, reflecting a stable damage accumulation process within the rock material. Subsequently, upon entering Stage III, the b-values of different specimens exhibited varying degrees of fluctuation. This phenomenon reflects a notable increase in microcrack nucleation within the rock material, though high-energy fracturing events had not yet become dominant. Prior to reaching the peak load, the b-values of all specimens decreased rapidly, indicating a sharp surge in high-energy acoustic emission (AE) events. This signaled the acceleration of macrocrack propagation, culminating in crack through-growth. The greater the decrease in b-value and the earlier its occurrence, the more pronounced the stress concentration in the specimen, indicating a more abrupt and unstable failure process. Among the specimens studied, GS-900-0.8-1 exhibited the earliest and most pronounced decrease in b-value. In contrast, GS-900-0.8-3 and GS-900-0.8-4 demonstrated a marked decline only during the mid-to-late loading stages, indicating a later emergence of macroscopic cracks and a more stable fracture evolution.
Overall, the high-to-low transition in the b-value during the entire loading process clearly reflects the intrinsic fracture evolution mechanism of the rock material, capturing the transition from the scattered initiation of microcracks to the rapid propagation of macrocracks. The decrease in the b-value serves as a crucial precursor to the specimen’s entry into the unstable fracture stage. The timing of its onset and the magnitude of its decline can be used to determine the development stage of large cracks and the proximity to critical failure. Consequently, the b-value serves as a crucial indicator for evaluating the fracture evolution characteristics of rock materials and anticipating the transition phases of rock failure. Table 4 shows that the TSR and CSD precursor points identified in the preceding sections all fall within the decreasing interval of the acoustic emission b-value before peak stress, providing indirect support for the TSR- and CSD-based analysis results.
Based on indoor rockburst simulation tests and critical slowing down (CSD) theory, this study developed an acoustic emission (AE) signal-centered rockburst prediction method. Furthermore, the feasibility of this proposed method under experimental conditions was preliminarily verified. To promote its engineering application, future research should incorporate field conditions for calibration and validation, extend the method to different lithologies, stress paths, and loading-disturbance conditions, and integrate AE with microseismic, stress, and displacement monitoring to improve its practicality and stability.

7. Conclusions

Laboratory rockburst simulation tests were conducted, and the rockburst precursor identification and analysis were performed based on the TSR (tensile-shear ratio) index—proposed according to the crack evolution characteristics during rockburst—and the critical slowing down theory (CSD). The main conclusions are drawn as follows:
(1)
During rockburst events, fracture types evolve in distinct phases: tensile fractures dominate initially, with the proportion of tensile fractures exceeding 50% (Ntr > 50%), while shear fractures grow in proportion and become predominant as instability nears, with the proportion of shear fractures exceeding 50% (Nsr > 50%). The proposed tensile–shear ratio (TSR) effectively characterizes the dynamic transition between these two fracture types. Under the present experimental conditions, a sustained TSR below 1 signals a shift from tensile to shear failure, acting as a critical precursor for imminent rockbursts.
(2)
Critical slowing down (CSD) theory-based analysis shows that autocorrelation coefficients and variances of acoustic emission (AE) characteristic parameters—rise time, ring-down count, amplitude, duration, peak frequency, RA and RA/AF—increase significantly prior to rockbursts, showing typical CSD characteristics. This confirms the sensitivity and applicability of CSD methods for rockburst early warning. Further analysis reveals that window length and lag step size barely affect the emergence timing of variance precursor points, while the peak of these precursor points decreases with increasing window length.
(3)
During unloading rockburst evolution, precursor manifestations of critical slowing down (CSD) indicators (autocorrelation coefficient and variance) in acoustic emission (AE) characteristic parameters show high consistency, with minimal time differences between precursor points, demonstrating excellent cross-parameter stability. The autocorrelation coefficient typically emerges 3–8% earlier than the variance, indicating the system follows a CSD trajectory from “diminished recovery capacity” to “increased fluctuations” prior to instability.
(4)
For acoustic emission (AE) parameters, the average time proportion of autocorrelation coefficient precursor points falls between 87 and 89%, and that of variance falls between 91 and 95%. In contrast, the tensile-shear ratio (TSR) has an average precursor time proportion of 85.18%, indicating an earlier response during unloading-induced rockbursts and suitability for rapid early-stage warning. Conversely, critical slowing down (CSD) indicators (autocorrelation coefficient and variance) are more applicable for mid-to-late stage warning as the system nears instability. This complementary timing advantage suggests that combining TSR and CSD indicators can improve the effectiveness of rockburst early warning at different stages.
(5)
Prior to granite failure, the acoustic emission (AE) b-value declines rapidly with fluctuations. Notably, the precursor points identified by the tensile-shear ratio (TSR) and critical slowing down (CSD) theory fall within the b-value decreasing interval before peak stress. This consistency confirms the reliability of the TSR and CSD methods for analyzing granite rockburst failure. Furthermore, integrating TSR, variations in CSD indicators (autocorrelation coefficient and variance) of AE parameters and AE b-value evolution characteristics effectively reveal the evolutionary patterns of granite rockburst failure.

Author Contributions

Conceptualization, P.L. and Y.L.; Methodology, P.L., Y.L., Y.C. and Q.H.; Validation, Q.H. and Q.S.; Formal analysis, Z.H.; Data curation, Y.L.; Writing—original draft, Y.L.; Writing—review & editing, P.L., Y.L., Z.H., Y.C., Q.H. and Q.S.; Visualization, Y.L.; Supervision, Z.H. and Y.C.; Project administration, P.L.; Funding acquisition, P.L. All authors have read and agreed to the published version of the manuscript.

Funding

Funding was provided by Project (52474098), supported by the National Natural Science Foundation of China; Project (23564201D), supported by the Hebei Province Innovation Capacity Enhancement Program; The Science and Technology Research Project of the Department of Education of Hebei Province (QN2025427); and the Natural Science Foundation of Hebei Province of China (E2025209181).

Institutional Review Board Statement

Not applicable.

Informed Consent Statement

Not applicable.

Data Availability Statement

The data underpinning this study are available from the corresponding author on reasonable request.

Conflicts of Interest

The authors have no competing interests to declare that are relevant to the content of this article.

References

  1. Li, M.L.; Li, K.G.; Wu, S.C.; Qin, Q.C.; Zheng, Z. Tunnel rockburst with a single set of joints under true-triaxial stress condition. J. Rock Mech. Geotech. Eng. 2025, 17, 4827–4851. [Google Scholar] [CrossRef] [Scilit]
  2. Zhou, J.; Li, X.; Mitri, H.S. Evaluation method of rockburst: State-of-the-art literature review. Tunn. Undergr. Space Technol. 2018, 81, 632–659. [Google Scholar] [CrossRef] [Scilit]
  3. Liu, J.; Zhang, L.M.; Cong, Y.; Wang, Z.Q. Research on the mechanical characteristics of granite failure process under true triaxial stress path. Rock Soil Mech. 2021, 42, 2069–2077. [Google Scholar] [CrossRef]
  4. Imashev, A.; Suimbayeva, A.; Zhunusbekova, G.; Adoko, A.C.; Issakov, B. Assessing stability of mine workings driven in stratified rock mass. Min. Miner. Depos. 2024, 18, 82–88. [Google Scholar] [CrossRef] [Scilit]
  5. Sun, Y.S.; Yu, F.; Lv, J.G. Research on the Characteristics of Acoustic Emission Activities of Granite and Marble under Different Loading Methods. Lithosphere 2023, 2023, 2773795. [Google Scholar] [CrossRef] [Scilit]
  6. Wang, C.S.; Wan, H.; Ma, J.J.; Chen, X.L. Acoustic Emission Characteristics and Initiation Mechanism of Instantaneous Rock Burst for Beishan Granite. Shock Vib. 2024, 2024, 6813580. [Google Scholar] [CrossRef] [Scilit]
  7. Zhao, F.; Meng, S.Z.; Liu, D.Q.; Huang, Z.Q.; Yuan, G.X.; Hu, C.Y.; Wang, H.Y.; Wang, H.J. Failure precursor of granite rockburst based on acoustic emission signal characteristics. Chin. J. Rock Mech. Eng. 2024, 43, 2669–2686. [Google Scholar]
  8. Liu, J.; Zhou, Z.H.; Zhang, J.; Wang, C.; Hou, T.K.; Qiao, M. Acoustic emission characteristics of diorite at varying unloading rates and identification of its unsteady phases. Rock Soil Mech. 2025, 46, 225–232+243. [Google Scholar] [CrossRef]
  9. Gao, F.Q.; Zhang, C.Y.; Han, L.C.; Xia, Y.X.; Gao, Q.W.; Zhou, Y.Q.; Li, D.Y. Study on the evolution law of acoustic emission time series characteristics of coal-rock assemblage under true triaxial conditions. Front. Earth Sci. 2025, 13, 1594518. [Google Scholar] [CrossRef] [Scilit]
  10. Liu, S.J.; Zheng, H.J.; Chen, G.Q.; Hu, Y.T.; Meng, K. Acoustic emission precursor information of rock failure under true triaxial loading and unloading conditions. Front. Earth Sci. 2023, 11, 1182413. [Google Scholar] [CrossRef] [Scilit]
  11. Sun, B.; Ren, F.Q.; Liu, D.Q. Research on the failure precursors of layered slate based on multifractal characteristics of acoustic emission. Rock Soil Mech. 2022, 43, 5. [Google Scholar] [CrossRef]
  12. Li, P.; Sun, J.L.; Cai, M.F.; Ren, F.H.; Guo, Q.F.; Miao, S.J.; Wu, X. Acoustic emission behavior of rock materials containing two preexisting flaws and an opening subjected to uniaxial compression: Insights into self-similarity, chaotic, and fractal features. J. Mater. Res. Technol. 2022, 20, 1786–1801. [Google Scholar] [CrossRef] [Scilit]
  13. Du, K.; Li, X.F.; Tao, M.; Wang, S.F. Experimental study on acoustic emission (AE) characteristics and crack classification during rock fracture in several basic lab tests. Int. J. Rock Mech. Min. Sci. 2020, 133, 104411. [Google Scholar] [CrossRef] [Scilit]
  14. Ju, S.Y.; Li, D.S.; Jia, J.Q. Machine-learning-based methods for crack classification using acoustic emission technique. Mech. Syst. Signal Process. 2022, 178, 109253. [Google Scholar] [CrossRef] [Scilit]
  15. Ling, K.; Liu, D.Q.; Wang, S.Y.; Guo, Y.P.; Zhang, Y.Y.; Yang, J.S.; Zhang, X.P. Research on the synergetic precursors identification of rockburst based on the critical slowing-down theory and the Mann–Kendall test. Bull. Eng. Geol. Environ. 2025, 84, 531. [Google Scholar] [CrossRef] [Scilit]
  16. Li, K.H.; Du, G.Z.; Han, D.Y.; Yin, Z.Y.; Li, J.T.; Lin, H. Mechanical and acoustic emission characteristics of anisotropic rock subjected to tiered cyclic intermediate principal stress. Eng. Geol. 2025, 358, 108403. [Google Scholar] [CrossRef] [Scilit]
  17. Li, J.Y.; Liu, D.Q.; He, M.C.; Guo, Y.P.; Wang, H.S. Experimental investigation of true triaxial unloading rockburst precursors based on critical slowing-down theory. Bull. Eng. Geol. Environ. 2023, 82, 65. [Google Scholar] [CrossRef] [Scilit]
  18. Zhu, C.; Huang, M.; Ren, F.Q.; Li, X.S.; Gu, J.Z.; Li, H.B.; He, M.C. Multivariate acoustic emissions precursors of rockburst from the perspective of early warning. Int. J. Min. Sci. Technol. 2025, 35, 703–717. [Google Scholar] [CrossRef] [Scilit]
  19. Wang, C.Y.; Sui, Q.R.; Liu, C.C.; Yan, Y.H.; Zhu, H.J.; Guo, Y. Test study on failure precursors of orthogonal cross fractured sandstone under uniaxial compression. J. Vib. Shock 2024, 43, 202–212+257. [Google Scholar] [CrossRef]
  20. Wang, Z.; Yang, C.; Lin, H. Fracture instability and acoustic emission critical slowing down characteristics of rock with hole-shaped flaw under the coupling of high-temperature and cyclic load. Comput. Part. Mech. 2025, 12, 2183–2205. [Google Scholar] [CrossRef] [Scilit]
  21. Saik, P.; Lozynskyi, V.; Berdnyk, M.; Klimov, D. Dynamics of temperature-strength changes in the immediate roof and formation of the gasified cavity of an underground gasifier. Eng. J. Satbayev Univ. 2026, 48, 16–28. [Google Scholar] [CrossRef] [Scilit]
  22. Pan, C.; Liu, C.Y.; Zhao, G.M.; Yuan, W.; Wang, X.; Meng, X.R. Fractal characteristics and energy evolution analysis of rocks under true triaxial unloading conditions. Fractal Fract. 2024, 8, 387. [Google Scholar] [CrossRef] [Scilit]
  23. Liu, C.Y.; Zhao, G.M.; Xu, W.S.; Meng, X.R.; Liu, Z.X.; Cheng, X.; Lin, G. Experimental study on failure characteristics of single-sided unloading rock under different intermediate principal stress conditions. Int. J. Min. Sci. Technol. 2023, 33, 275–287. [Google Scholar] [CrossRef] [Scilit]
  24. Li, H.R.; He, M.C.; Xiao, Y.M.; Liu, D.Q.; Hu, J.; Cheng, T. Granite strainbursts induced by true triaxial transient unloading at different stress levels: Insights from excess energy ΔE. J. Rock Mech. Geotech. Eng. 2025, 17, 7078–7092. [Google Scholar] [CrossRef] [Scilit]
  25. Wu, M.; Ye, Y.C.; Wang, Q.H.; Hu, N.Y. Development of rockburst research: A comprehensive review. Appl. Sci. 2022, 12, 974. [Google Scholar] [CrossRef] [Scilit]
  26. Hu, C.Y.; Mei, Z.H.; Xiao, Z.H.; Mei, F.D. Strain-Mode Rockburst Dynamics in Granite: Mechanisms, Evolution Stages, and Acoustic Emission-Based Early Warning Strategies. Appl. Sci. 2025, 15, 4884. [Google Scholar] [CrossRef] [Scilit]
  27. Liu, J.Z.; Gao, Y.T.; Chen, F.; Cao, Z.S. Mechanism study and tendency judgement of rockburst in deep-buried underground engineering. Minerals 2022, 12, 1241. [Google Scholar] [CrossRef] [Scilit]
  28. Sun, Y.; Tan, C.X. An analysis of present-day regional tectonic stress field and crustal movement trend in China. J. Geomech. 1995, 1, 1–12. [Google Scholar]
  29. Jiang, J.Q.; Su, G.S.; Liu, Y.X.; Zhao, G.F.; Yan, X.Y. Effect of the propagation direction of the weak dynamic disturbance on rock failure: An experimental study. Bull. Eng. Geol. Environ. 2021, 80, 1477–2671. [Google Scholar] [CrossRef] [Scilit]
  30. Zhao, K.; Zhong, J.C.; Wen, D.T.; Liu, Y. Predicting destabilisation precursor phenomena in low-strength molybdenum ore during destruction: Insights based on critical slowing down and cusp catastrophe theory. Nondestruct. Test. Eval. 2025, 1–25. [Google Scholar] [CrossRef] [Scilit]
  31. Liang, P.; Li, Z.; Li, Q.; Yu, G.Y.; Wang, S.; Han, Q.; Huang, X.H. The critical slowing-down characteristics of multi-physical field monitoring information about the brittle failure of rock under three-point bending. Nondestruct. Test. Eval. 2024, 39, 701–723. [Google Scholar] [CrossRef] [Scilit]
  32. Kong, X.G.; Zhan, M.Z.; Cai, Y.C.; Ji, P.F.; He, D.; Zhao, T.S.; Hu, J.; Lin, X. Precursor signal identification and acoustic emission characteristics of coal fracture process subjected to uniaxial loading. Sustainability 2023, 15, 11581. [Google Scholar] [CrossRef] [Scilit]
  33. Casas, N.; Giorgetti, C.; Pignalberi, F.; Scuderi, M.M. The role of grain size on shear localization illuminated by acoustic emissions. J. Geophys. Res. Solid Earth 2025, 130, e2024JB030448. [Google Scholar] [CrossRef] [Scilit]
  34. Zhang, K.; Zhang, S.; Ren, J.X.; Wang, M.; Jing, S.; Zhang, W.J. Study on Characteristics of Acoustic Emission b Value of Coal Rock with Outburst-Proneness under Coupled Static and Dynamic Loads. Shock Vib. 2023, 2023, 2400632. [Google Scholar] [CrossRef] [Scilit]
  35. Zhang, L.; Li, Z.J.; Li, Q.; Liang, P.; Cheng, H.J. Influence of intermediate Principal Stress on Triaxial Unloading Failure and Energy Characteristics of Deep Hard Rock. Min. RD 2022, 42, 127–132. [Google Scholar] [CrossRef]
  36. Sun, F.Y.; Guo, J.Q.; Fan, J.Q.; Liu, X.L. Experimental study on rockburst fragment characteristic of granite under different loading rates in true triaxial condition. Front. Earth Sci. 2022, 10, 995143. [Google Scholar] [CrossRef] [Scilit]
  37. Su, G.S.; Jiang, J.Q.; Feng, X.T.; Mo, C.; Jiang, Q. Experimental study of ejection process in rockburst. Chin. J. Rock Mech. Eng. 2016, 35, 1990–1999. [Google Scholar]
  38. Wang, J.X.; Liang, P.; Zhang, Y.B.; Yao, X.L.; Yu, G.Y.; Han, Q. Real-time identification of acoustic emission signals of rock tension-shear fracture based on machine learning and study on precursory characteristics. Mech. Syst. Signal Process. 2025, 230, 112665. [Google Scholar] [CrossRef] [Scilit]
  39. Zhu, X.; Tang, Y.; Fan, J.; Hu, J.W.; Liu, J.F.; He, C.L. Experimental study on failure precursors of fine sandstone based on critical slowing down theory. Chin. J. Rock Mech. Eng. 2022, 41, 53–61. [Google Scholar]
  40. Wei, Y.; Li, Z.H.; Kong, G.X.; Zhang, Z.B.; Wang, J.L.; Cheng, F.Q. Critical slowing characteristics of sandstone under uniaxial compression failure. J. China Coal Soc. 2018, 43, 427–432. [Google Scholar] [CrossRef]
Figure 1. Granite specimen.
Applsci 16 03962 g001
Figure 2. Experimental apparatus: (a) press system and loading direction; (b) acoustic emission system and sensor locations.
Applsci 16 03962 g002
Figure 3. Loading path.
Applsci 16 03962 g003
Figure 4. Schematic diagram of window length and lag step.
Applsci 16 03962 g004
Figure 5. Evolution process of unloading-induced rockburst: (a) particle ejection; (b) plate exfoliation; (c) shear fragmentation; (d) block ejection.
Applsci 16 03962 g005
Figure 6. Schematic diagram of AE parameters.
Applsci 16 03962 g006
Figure 7. AE evolution characteristics during the unloading-induced rockburst process: (a) rise time; (b) ring-down count; (c) amplitude; (d) duration; (e) peak frequency.
Applsci 16 03962 g007
Figure 8. Dynamic evolution of tensile–shear cracks: (a) GS-900-0.8-1; (b) GS-900-0.8-3; (c) GS-900-0.8-4.
Applsci 16 03962 g008
Figure 9. Evolution characteristics of TSR: (a) GS-900-0.8-1; (b) GS-900-0.8-3; (c) GS-900-0.8-4.
Applsci 16 03962 g009
Figure 10. Critical slowing down characteristics under different window lengths and lag steps: (a) autocorrelation coefficients for various lag steps; (b) variance for various lag steps; (c) autocorrelation coefficients for various window lengths; (d) variance for various window lengths.
Applsci 16 03962 g010
Figure 11. Autocorrelation coefficients of AE parameters: (a) rise time; (b) ring-down count; (c) amplitude; (d) duration; (e) peak frequency; (f) RA; (g) RA/AF.
Applsci 16 03962 g011aApplsci 16 03962 g011b
Figure 12. Variance of AE parameters: (a) rise time; (b)ring-down count; (c) amplitude; (d) duration; (e) peak frequency; (f) RA; (g) RA/AF.
Applsci 16 03962 g012aApplsci 16 03962 g012b
Figure 13. Autocorrelation coefficient of the specimen, timing of variance-based precursory points, and proportion of average early-warning time for AE characteristic parameters: (a) autocorrelation coefficient; (b) variance.
Applsci 16 03962 g013
Figure 14. Load and b-value: (a) GS-900-0.8-1; (b) GS-900-0.8-3; (c) GS-900-0.8-4.
Applsci 16 03962 g014
Table 1. Precursor information of specimens.
Specimen NumberTSRRockburst Time/sWarning Time/sEarly Warning Lead Time/sAverage Early Warning Time/sProportion of Warning Time/%Average Proportion of Warning Time/%
GS-900-0.8-10.701020.50836.30184.20144.281.9585.18
GS-900-0.8-30.99914.60780.00134.6085.28
GS-900-0.8-40.91973.90860.00113.9088.30
Table 2. Lead time for early warning based on the Specimen’s autocorrelation coefficient.
Specimen NumberParameter/s
Rise TimeRing-Down CountDurationAmplitudePeak FrequencyRARA/AF
GS-900-0.8-1174.80174.80174.80174.80183.96174.80174.80
GS-900-0.8-3106.30104.60104.60104.60104.60106.30106.30
GS-900-0.8-485.4768.8168.8156.0081.3886.9786.36
Average122.19116.07116.07111.80123.31122.69122.49
Table 3. Lead time for early warning based on the Specimen’s variance.
Specimen NumberParameter/s
Rise TimeRing-Down CountDurationAmplitudePeak FrequencyRARA/AF
GS-900-0.8-1140.55140.55140.55174.847.8957.9296.03
GS-900-0.8-395.5695.5695.5695.1195.5695.5695.56
GS-900-0.8-417.4117.4117.4113.517.4117.4150.24
Average84.5184.5184.5194.4753.6256.9680.61
Table 4. Comparison of TSR precursor time, AE-parameter precursor interval, and b-value decreasing interval for different specimens.
Specimen NumberGS-900-0.8-1GS-900-0.8-3GS-900-0.8-4
TSR precursor time/s836.30780.00860.00
AE parameter precursor interval/s836.54–972.61808.30–819.49886.93–960.41
b-value decreasing interval/s743.46–979.97757.00–917.77807.43–970.66
Disclaimer/Publisher’s Note: The statements, opinions and data contained in all publications are solely those of the individual author(s) and contributor(s) and not of MDPI and/or the editor(s). MDPI and/or the editor(s) disclaim responsibility for any injury to people or property resulting from any ideas, methods, instructions or products referred to in the content.