Article

Does Basketball Training Load Provide an Adequate Amount of Physical Activity for Pre-Peak Height Velocity Athletes?

by
Alexandra Avloniti
1,
Nikolaos-Orestis Retzepis
1,
Theodoros Stampoulis
2,
Christos Kokkotis
2,
Dimitrios Balampanos
1,
Dimitrios Draganidis
3,
Maria Protopapa
1,
Dimitrios Pantazis
1,
Panagiotis Aggelakis
1,
Panagiotis F. Foteinakis
1,
Nikolaos Zaras
1,
Antonis Kambas
1,
Ilias Smilios
1,
Maria Michalopoulou
1,
Ioannis G. Fatouros
3 and
Athanasios Chatzinikolaou
1,*
1
Department of Physical Education and Sport Science, School of Physical Education, Sport Science and Occupational Therapy, Democritus University of Thrace, 69100 Komotini, Greece
2
Department of Occupational Therapy, School of Physical Education, Sport Science and Occupational Therapy, Democritus University of Thrace, 69100 Komotini, Greece
3
Department of Physical Education and Sport Science, School of Physical Education, Sport Science and Dietetics, University of Thessaly, 42100 Trikala, Greece
*
Author to whom correspondence should be addressed.
Appl. Sci. 2026, 16(8), 3951; https://doi.org/10.3390/app16083951
Submission received: 7 March 2026 / Revised: 15 April 2026 / Accepted: 17 April 2026 / Published: 18 April 2026
(This article belongs to the Special Issue Biomechanical Analysis for Sport Performance)

Abstract

Purpose: The primary aim of the present study was to examine the extent to which participation in organized youth basketball training contributes to physical activity across intensity zones during training sessions in relation to biological maturation status. Methods: Participants were classified into three maturity groups based on predicted age at peak height velocity (PHV): −2.5 to −1.5, −1.5 to −0.5, and ≥−0.5 to 0.83 years from PHV. Data from two training sessions per participant were averaged to obtain representative individual values. One-way analyses of variance (ANOVAs) were used to examine differences in anthropometric, physical performance, and field performance variables between PHV groups. Physical activity patterns were analyzed using two-way mixed-design ANOVAs with PHV stage as the between-subject factor and intensity zone (MET- and HRR-based) as the within-subject factor. Results: Across all maturity groups, approximately 10–17% of total training time was spent in light-intensity activity, while the majority of time was accumulated in moderate-to-vigorous intensity zones (approximately 35–50%, depending on the classification method). Significant maturity-related differences were observed in anthropometric variables and physical performance measures, with more mature players demonstrating superior sprint performance, jumping ability, and grip strength. Field performance indicators also differed between PHV groups, with more mature athletes exhibiting higher external and internal training loads. In contrast, no significant interactions or main effects of PHV stage were observed for physical activity intensity distribution. Conclusions: Organized basketball training contributes substantially to moderate-to-vigorous physical activity accumulated during training sessions. However, these findings reflect training-specific activity and should not be interpreted as representing total daily physical activity. No differences in activity intensity distribution were observed between maturation groups, although this finding should be interpreted with caution, given methodological limitations. These results highlight the need to consider biological maturation when designing youth training programs.

1. Introduction

Physical activity during preadolescence is a critical factor in physiological development and has many health benefits that persist into adulthood. The World Health Organization (WHO) guidelines recommend 60 min of daily moderate-to-vigorous physical activity (MVPA), a fact that is not always achievable by children [1,2]. Daily physical activity can be achieved through both unstructured and structured forms of activity [3]. Unstructured physical activity includes spontaneous participation in activities such as playground play or walking, whereas structured physical activity involves participation in organized forms of exercise, such as team sports [4]. During preadolescence, the primary goals of sports training are to promote physical activity, develop physical literacy, and enhance sport-specific skills, while the maximization of performance is typically a long-term objective [5,6,7,8]. Therefore, organized sport participation should provide an environment that supports children’s need for movement while also laying the foundation for their future athletic development. However, it should be noted that organized training sessions represent only one component of a child’s total daily physical activity. Therefore, evaluating physical activity during training provides an estimate of the contribution of sport participation to daily recommendations, rather than a direct measure of total daily physical activity.
Global evidence indicates a marked decline in moderate-to-vigorous physical activity during adolescence, despite recommendations that children and adolescents should accumulate at least 60 min of moderate-to-vigorous physical activity daily [2,9,10]. Parents and guardians often choose sports activities to achieve the minimum levels of physical activity recommended by the WHO. Thus, a new branch in the field of exercise has developed, called sports-related Physical Activity. Indeed, several publications have associated sports, in general and specifically during pre-adolescence, with benefits for physical fitness and for both the acute phase and later stages of life. Organized youth sports represent an intervention strategy to overcome this obstacle [11]. Organized youth sports have therefore been proposed as a potential strategy to address insufficient physical activity levels. However, studies conducted within the sports science domain have primarily focused on performance-related metrics, such as distance covered, speed, and accelerations–decelerations, without directly linking training load to physical activity using a common framework [12]. Establishing a clearer connection between training load and physical activity would allow practitioners to design training programs that better reflect the physiological and developmental needs of children, particularly during pre-competitive stages [13,14].
Basketball is one of the most popular sports among children worldwide. In Greece, official competition in basketball typically begins at the U14 level, while national-level championships are organized from the U16 category onward. Nevertheless, participation in basketball often starts at a much younger age, around six years old. According to the objectives outlined by the national federation, the early stages of sport participation focus on the development of fundamental movement patterns, sport-specific skills, and enjoyment, alongside the enhancement of psychological and social competencies, with the long-term aim of preparing children for competitive sport. In terms of performance demands, basketball is characterized by high metabolic requirements and complex neuromuscular requirements, offering a framework for enhancing both cognitive function and musculoskeletal health across the lifespan [15,16]. In youth basketball, match play and training involve intermittent high-intensity actions such as sprinting, jumping, and rapid changes in direction interspersed with periods of low-to-moderate activity [17]. Motor activities and the way they are performed have been linked to benefits in the health and mechanical performance of children and adults [18,19,20]. In team sports, the combination of load requirements and the cognitive skills of technique and tactics creates a learning and training environment that offers a fun way to train and promotes adherence to the training program [21,22,23]. However, there is a lack of evidence regarding training load during pre-adolescence, and even more so regarding the translation of training load into physical activity metrics, which represent a key objective of the training process prior to entry into competitive categories [24,25]. During the transition from pre-adolescence to adolescence, a characteristic period known as Peak Height Velocity is identified based on the biological maturation of the systems. During this period, there is a temporary disruption of motor control and movement efficiency, a phenomenon described as adolescent awkwardness, which has been associated with reduced movement economy, altered biomechanics, greater variability in motor performance, and a higher risk of musculoskeletal injuries [26,27]. These disruptions in coordination during the growth spurt may reduce movement efficiency and increase the energetic cost of locomotion, thereby altering the distribution of time spent in light, moderate, and vigorous intensity zones during training [6,28,29]. Also, during this maturational window, differences in biological age can substantially influence anthropometric characteristics, physical fitness, and sport performance. More biologically mature athletes typically present greater height, body mass, and muscle strength, which may confer advantages in speed, jumping ability, and power-based tasks [30,31]. Conversely, less mature individuals may experience performance and skill deficits during the period of rapid growth, potentially exacerbating the effects of adolescent awkwardness and increasing susceptibility to injury and withdrawal from sport participation [29,32]. Although the above findings are documented in the general population, it appears that engagement in sports, specifically football, can address the effects of PHV on motor clumsiness. However, this remains to be proven in other sports, such as basketball, where taller children may affect the results. Collectively, these observations underscore the importance of quantifying training load in relation to physical activity metrics, especially during the pre-PHV period, when maturational changes may markedly affect movement efficiency and, consequently, physical activity levels.
The significance of the study is multifaceted, as it examines the impact of biological maturation on the mechanical performance of young basketball players, as well as the relationship between training load and physical activity, which represents a key component of the training process prior to participation in competitive categories. The first research hypothesis is that biological maturation may affect the relationship between activity during training and the quantification of Physical Activity, and that basketball includes at least some minutes characterized as moderate- and high-intensity physical activity. The second research hypothesis is that engagement in basketball may mitigate the phenomenon of adolescent awkwardness, as is the case in football, and that children at an advanced biological level will perform better than children of younger biological age, both in predetermined tests and during training.
Therefore, the primary aim of the present study was to examine whether participation in organized youth basketball training provides sufficient physical activity across intensity zones in relation to biological maturation status. A secondary aim was to investigate differences in anthropometric characteristics, physical performance, and field performance across maturation stages defined by predicted age at peak height velocity in male youth basketball players. It was hypothesized that athletes in more advanced maturation stages would demonstrate superior performance outcomes due to greater neuromuscular development and morphological advantages associated with biological maturation. Given the limited and inconsistent evidence regarding the influence of maturation on physical activity intensity distribution, this aspect of the study was approached in a more exploratory manner.

2. Materials and Methods

2.1. Study Design

A cross-sectional study design was performed to assess youth basketball players’ physical activity during the competitive season. Specifically, data from two training sessions were collected and averaged to obtain representative values for each participant. This approach was adopted due to practical constraints related to access, scheduling, and the need to ensure consistency.
All measurements and evaluations were conducted at the facilities within the School of Physical Education and Sport Science at Democritus University of Thrace at the same time of day. During the first visit and prior to the start of the monitoring process, anthropometric data were obtained for all participants, including standing and sitting height, estimated leg length, and body weight. All of these measurements were used to calculate Peak Height Velocity (PHV) using the equation published by Mirwald et al. [27].
Additionally, anthropometric variables also included body mass index (BMI) and body composition parameters such as body fat percentage. Physical performance evaluations consisted of the following tests: sit-and-reach, isometric handgrip strength, chest medicine ball throw, countermovement jump, 10- and 20 m sprints. Before testing, participants were familiarized with the performance measurements. On the next visits, children participated in a training session during which monitoring measurements were carried out. For all measurements and evaluations, the same experienced research team was used to ensure accuracy and reliability. Before the procedure began, parents or legal guardians received essential information about the study, both verbally and in writing. Written informed consent was obtained from each participant’s parent or guardian. The study received ethical approval from the Research Ethics Committee of Democritus University of Thrace, under reference number DUTH/EHDE/36699/257, on 25 February 2022.

2.2. Participants

Participants were recruited using a non-probabilistic convenience sampling approach from three age-group teams within the same basketball club, based on availability and predefined inclusion criteria. A total of 79 male youth athletes participated in the study, and data were collected during two basketball training sessions.
Inclusion criteria were: (a) male youth basketball players, (b) regular participation in organized basketball training (at least three sessions per week), (c) a minimum of two years of training experience, and (d) absence of injury or medical condition affecting performance during the previous six months.
Exclusion criteria were: (a) any musculoskeletal injury within the previous six months, (b) known cardiovascular or metabolic disorders, (c) inability to complete the testing procedures, and (d) incomplete or unreliable data due to technical issues with heart rate or GPS recordings.
All participants belonged to the same team and training environment, ensuring consistency in coaching practices and training content. Characteristics of the participants are presented in Table 1.

2.3. Procedures

2.3.1. Anthropometric Measurements

Subjects’ anthropometric characteristics were collected by trained research staff in pediatrics and exercise according to procedures described elsewhere [33]. Standing and sitting height as well as body weight were measured to the nearest 0.1 cm and 0.1 kg, respectively. Leg length was determined by the difference between standing and sitting height [34]. Body mass index (BMI) was calculated using the following formula: weight (kg)/height squared (m2) [31]. Body composition values, such as body fat mass percentage, were measured using a Charder MA801 bioelectrical impedance analysis device (Charder Electronic Co., Ltd., Taichung City, Taiwan). Chronological age was computed as the difference between the measurement date and the date of birth.

2.3.2. Monitoring Measurements

To comprehensively assess training demands and physical activity intensity, both internal and external load indicators were used. Heart rate–based measures were employed to assess physiological responses to exercise, IMU-derived variables were used to quantify external mechanical load, and MET-based approaches were applied to classify physical activity intensity into standardized zones. Internal and external load were monitored using Polar Team Pro tracking sensors (Polar Electro Oy, Kempele, Finland) [35]. It integrates heart rate sensors, IMUs (including accelerometer, magnetometer, and gyroscope), and a satellite-based positioning system. As data collection was conducted in an indoor environment, external load variables were primarily derived from inertial sensors rather than satellite-based positioning. Before the start of the monitoring procedure, a player profile was created for each participant, including necessary information about individuals’ characteristics such as date of birth, sex, standing height, body weight, and training frequency [36]. For proper use of the device, each child wore a Polar Team Pro belt positioned around the chest at the Xiphoid process to calibrate the sensor. The same sensor was used for each athlete [37]. After each session, data were exported to an Excel spreadsheet for more detailed analysis [38].
Resting (HRrest) and Maximum heart rate (HRmax) data were obtained with the same individual monitors (Polar Electro Oy, Kempele, Finland). Before field testing, HRrest was recorded for 7 consecutive minutes, with each subject seated in a chair, back against the backrest, feet on the ground, knees flexed at 90 degrees, and arms resting on a desk, also at 90 degrees. In addition, they were instructed to keep their eyes closed to minimize the effects of potential distraction. The average value over the last 5 min of the recording was used for analysis, providing an objective, steady-state value for HRrest [39]. The peak recorded HR was considered to be the subject’s HRmax [40].
The training sessions during which training load was assessed and subsequently translated into physical activity metrics were derived from three different age-group teams of a basketball club registered with the Hellenic Basketball Federation. The club follows a structured training program aligned with federation guidelines, aiming to promote the healthy physical and psychological development of children in pre-competitive age categories.

2.3.3. Maturity Status

Age at PHV was calculated using equations from Mirwald [27], which predicts the time (in years) until an athlete reaches their PHV. The equation is as follows:
Maturity offset = −9.236 + (0.0002708 × leg length × sitting height) − (0.001663 × age × leg length) + (0.007216 × age × sitting height) + (0.02292 × (weight/height) × 100).

2.3.4. Metabolic Equivalents (METs) Calculation

METs were calculated individually using 3 methods based on heart rate parameters. First, the Heart Rate (HR) at rest (HRrest) was determined as the lowest HR measured after the children wore the HR monitor and were seated for 10 min. The HR maximum (HRmax) was calculated using Tanaka’s formula [HRmax = 208 − (0.7 × age in years)], the actual HR (HRa) was measured through the HR monitor during the training sessions, and the Heart Rate Reserve (HRR) was calculated [HRR = (HRa-HRrest)/(HRmax-HRrest)]. The table below describes the 3 methods used to calculate METs [41,42,43].

2.3.5. Upper Limb Strength and Power Assessments

Static handgrip strength (HGS) was assessed using a Charder MG 4800 (Taichung City, Taiwan) medical dynamometer. For proper implementation, subjects needed to remain seated and have the shoulder of the involved limb adducted, with the elbow flexed to 90 degrees and the forearm and wrist positioned in a neutral position. The protocol consisted of a warm-up trial, followed by two all-out efforts, and the best effort was recorded [33,44].
The seated Medicine Ball Throw (SMBT) test was used for evaluating bilateral upper-body explosive strength. Subjects were seated on the floor, with their lower limbs fully extended and their backs, shoulders, and heads against the wall. Then, while holding a 3 kg medicine ball at chest height, with shoulders at 90-degree adduction and elbows flexed, they were asked to throw the ball straight as far as they could. A dynamic start was forbidden to avoid any stretch-shortening cycle effect. Each subject performed two maximal-effort trials with a 30 s rest between trials, and the best throw recorded with a 10 m tape was used for analysis [45,46,47].

2.3.6. Lower Limb Power Assessment

Lower limb explosive strength was assessed using countermovement jumps without (CMJ) and with arm swing (CMJas) on a Swift Performance EZE JUMP contact time jumping mat (Brisbane, Australia). To properly perform a CMJ without arm swing, subjects were instructed to start in an upright position, with their hands on their hips to minimize upper-body influence, and their legs and knees extended. Afterwards, they were asked to perform a rapid squat at a self-selected depth and immediately jump as high as possible. To measure CMJs, subjects followed the same procedure; they were allowed to freely swing their arms during the counter-movement phase. Before testing, a standardized warm-up including dynamic movements was conducted, and, for each test, subjects completed 3 maximal attempts, interspersed with 1 min of rest. Again, the best attempt was recorded for statistical analysis [48,49,50,51].

2.3.7. Lower Limb Flexibility Assessment

For assessing hip flexibility, a sit and reach (SNR) test was conducted, which required a Sit n’ Reach Trunk Flexibility Box (Fabrication Enterprises; Baseline Model 12-1086, New York, NY, USA). Before testing, the subjects were asked to remove their shoes, sit upright on the ground with their knees extended, in parallel, and at shoulder width, and to place their feet flat against the box. In addition, as part of the starting position, they were instructed to place their hands on top of each other in front of their trunk, with their middle fingers aligned. During execution, subjects had to push the metal indicator along the measuring line as far as possible while bending forward and keeping their hands together. Slow, consistent movement was considered a prerequisite, as no muscle activation was required. The test was performed three times with a 15 s rest between trials, and the best value was recorded for analysis [52,53].

2.3.8. Speed Assessments

The 10- and 20 m sprint tests were performed to evaluate linear speed using the Swift Performance time-gate system (Brisbane, Australia). Pairs of photocell timing gates were positioned at 0 m, 10 m, and 20 m to determine the time required to cover 0–10 m and 0–20 m. Subjects were instructed to start from a standing position, place their preferred foot 0.5 m behind the first timing gate, and sprint as fast as possible, without bouncing or performing backward movements before the sprint. Two maximal-effort 20 m sprints, separated by 3 min of rest, were allowed for each subject, and the best trial was recorded for further analysis. A progressive warm-up protocol, including 20 m accelerations, was followed prior to testing [54,55,56].

2.4. Statistical Analyses

Statistical analyses were performed using Python (version 3.10). Data obtained from the two training sessions for each participant were averaged to derive a single representative value per individual. Normality of distributions within each PHV category was assessed using the Shapiro–Wilk test. Descriptive statistics are presented as mean and standard deviation (M ± SD).
One-way analyses of variance (ANOVA) were conducted to examine differences between PHV stages (Group 1: −2.5 to −1.5, Group 2: −1.5 to −0.5, and Group 3: ≥−0.5 to 0.83 years from PHV) for anthropometric characteristics, physical performance measures, and field performance variables. Homogeneity of variances was evaluated using Levene’s test. Effect sizes were expressed as eta squared (η2) for one-way ANOVAs and partial eta squared (ηp2) for mixed-design ANOVAs. Effect sizes were interpreted according to conventional thresholds, with values of 0.01, 0.06, and 0.14 indicating small, medium, and large effects, respectively. When significant main effects were identified, post hoc pairwise comparisons were performed using Welch’s t-tests with Bonferroni adjustment for multiple comparisons to control for Type I error.
To examine physical activity patterns, a two-way mixed-design ANOVA was performed with PHV stage (Group 1: −2.5 to −1.5, Group 2: −1.5 to −0.5, and Group 3: ≥−0.5 to 0.83 years from PHV) as the between-subject factor and intensity zone as the within-subject factor. Intensity zones were defined according to both metabolic equivalents (MET-based zones) and heart rate reserve (HRR-based zones). Sphericity of the within-subject factor was assessed using Mauchly’s test, and when violations were detected, Greenhouse–Geisser corrections were applied to the degrees of freedom. Bonferroni-adjusted post hoc analyses were conducted to examine significant main effects and interactions. Statistical significance was set at p < 0.05.

3. Results

3.1. Descriptive Characteristics

Descriptive characteristics by group are shown in Table 2. One-way ANOVA revealed significant differences between groups for height, F(2, 76) = 193.82, p < 0.001, η2 = 0.84, sitting height F(2, 76) = 139.64, p < 0.001, η2 = 0.79, leg length, F(2, 76) = 93.11, p < 0.001, η2 = 0.71, body weight, F(2, 76) = 46.94, p < 0.001, η2 = 0.55, BMI, F(2, 76) = 5.44, p = 0.006, η2 = 0.13, age, F(2, 76) = 54.79, p < 0.001, η2 = 0.59, and PHV, F(2, 76) = 386.56, p < 0.001, η2 = 0.91.

3.2. Physical Performance

Performance outcomes across groups are presented in Table 3. Significant main effects of PHV category were observed for sprint performance at 10 m, F(2, 76) = 6.59, p = 0.002, η2 = 0.15, and 20 m, F(2, 76) = 7.73, p < 0.001, η2 = 0.17, countermovement jump, F(2, 76) = 6.77, p = 0.002, η2 = 0.15, handgrip strength R, F(2, 76) = 3.87, p = 0.025, η2 = 0.09, and medicine ball throw, F(2, 76) = 121.51, p < 0.001, η2 = 0.76. Athletes in Group 3 demonstrated superior performance in power- and speed-related tasks compared with less mature groups.
Specifically, players in Group 3 produced approximately 29% greater medicine ball throw distances than those in Group 1 and 27% greater distances than those in Group 2. Similarly, countermovement jump height was 21% higher in Group 3 compared with Group 1 and 14% higher than in Group 2. Right-hand grip strength was approximately 26% greater in Group 3 than in Group 1 and 10% greater than in Group 2.
In sprint performance, Group 3 recorded 6% faster times over 10 m and 8% faster times over 20 m than Group 1, and approximately 5–6% faster times than Group 2. These results indicate a clear maturity-related advantage in explosive strength and speed capacities.

3.3. Field Performance

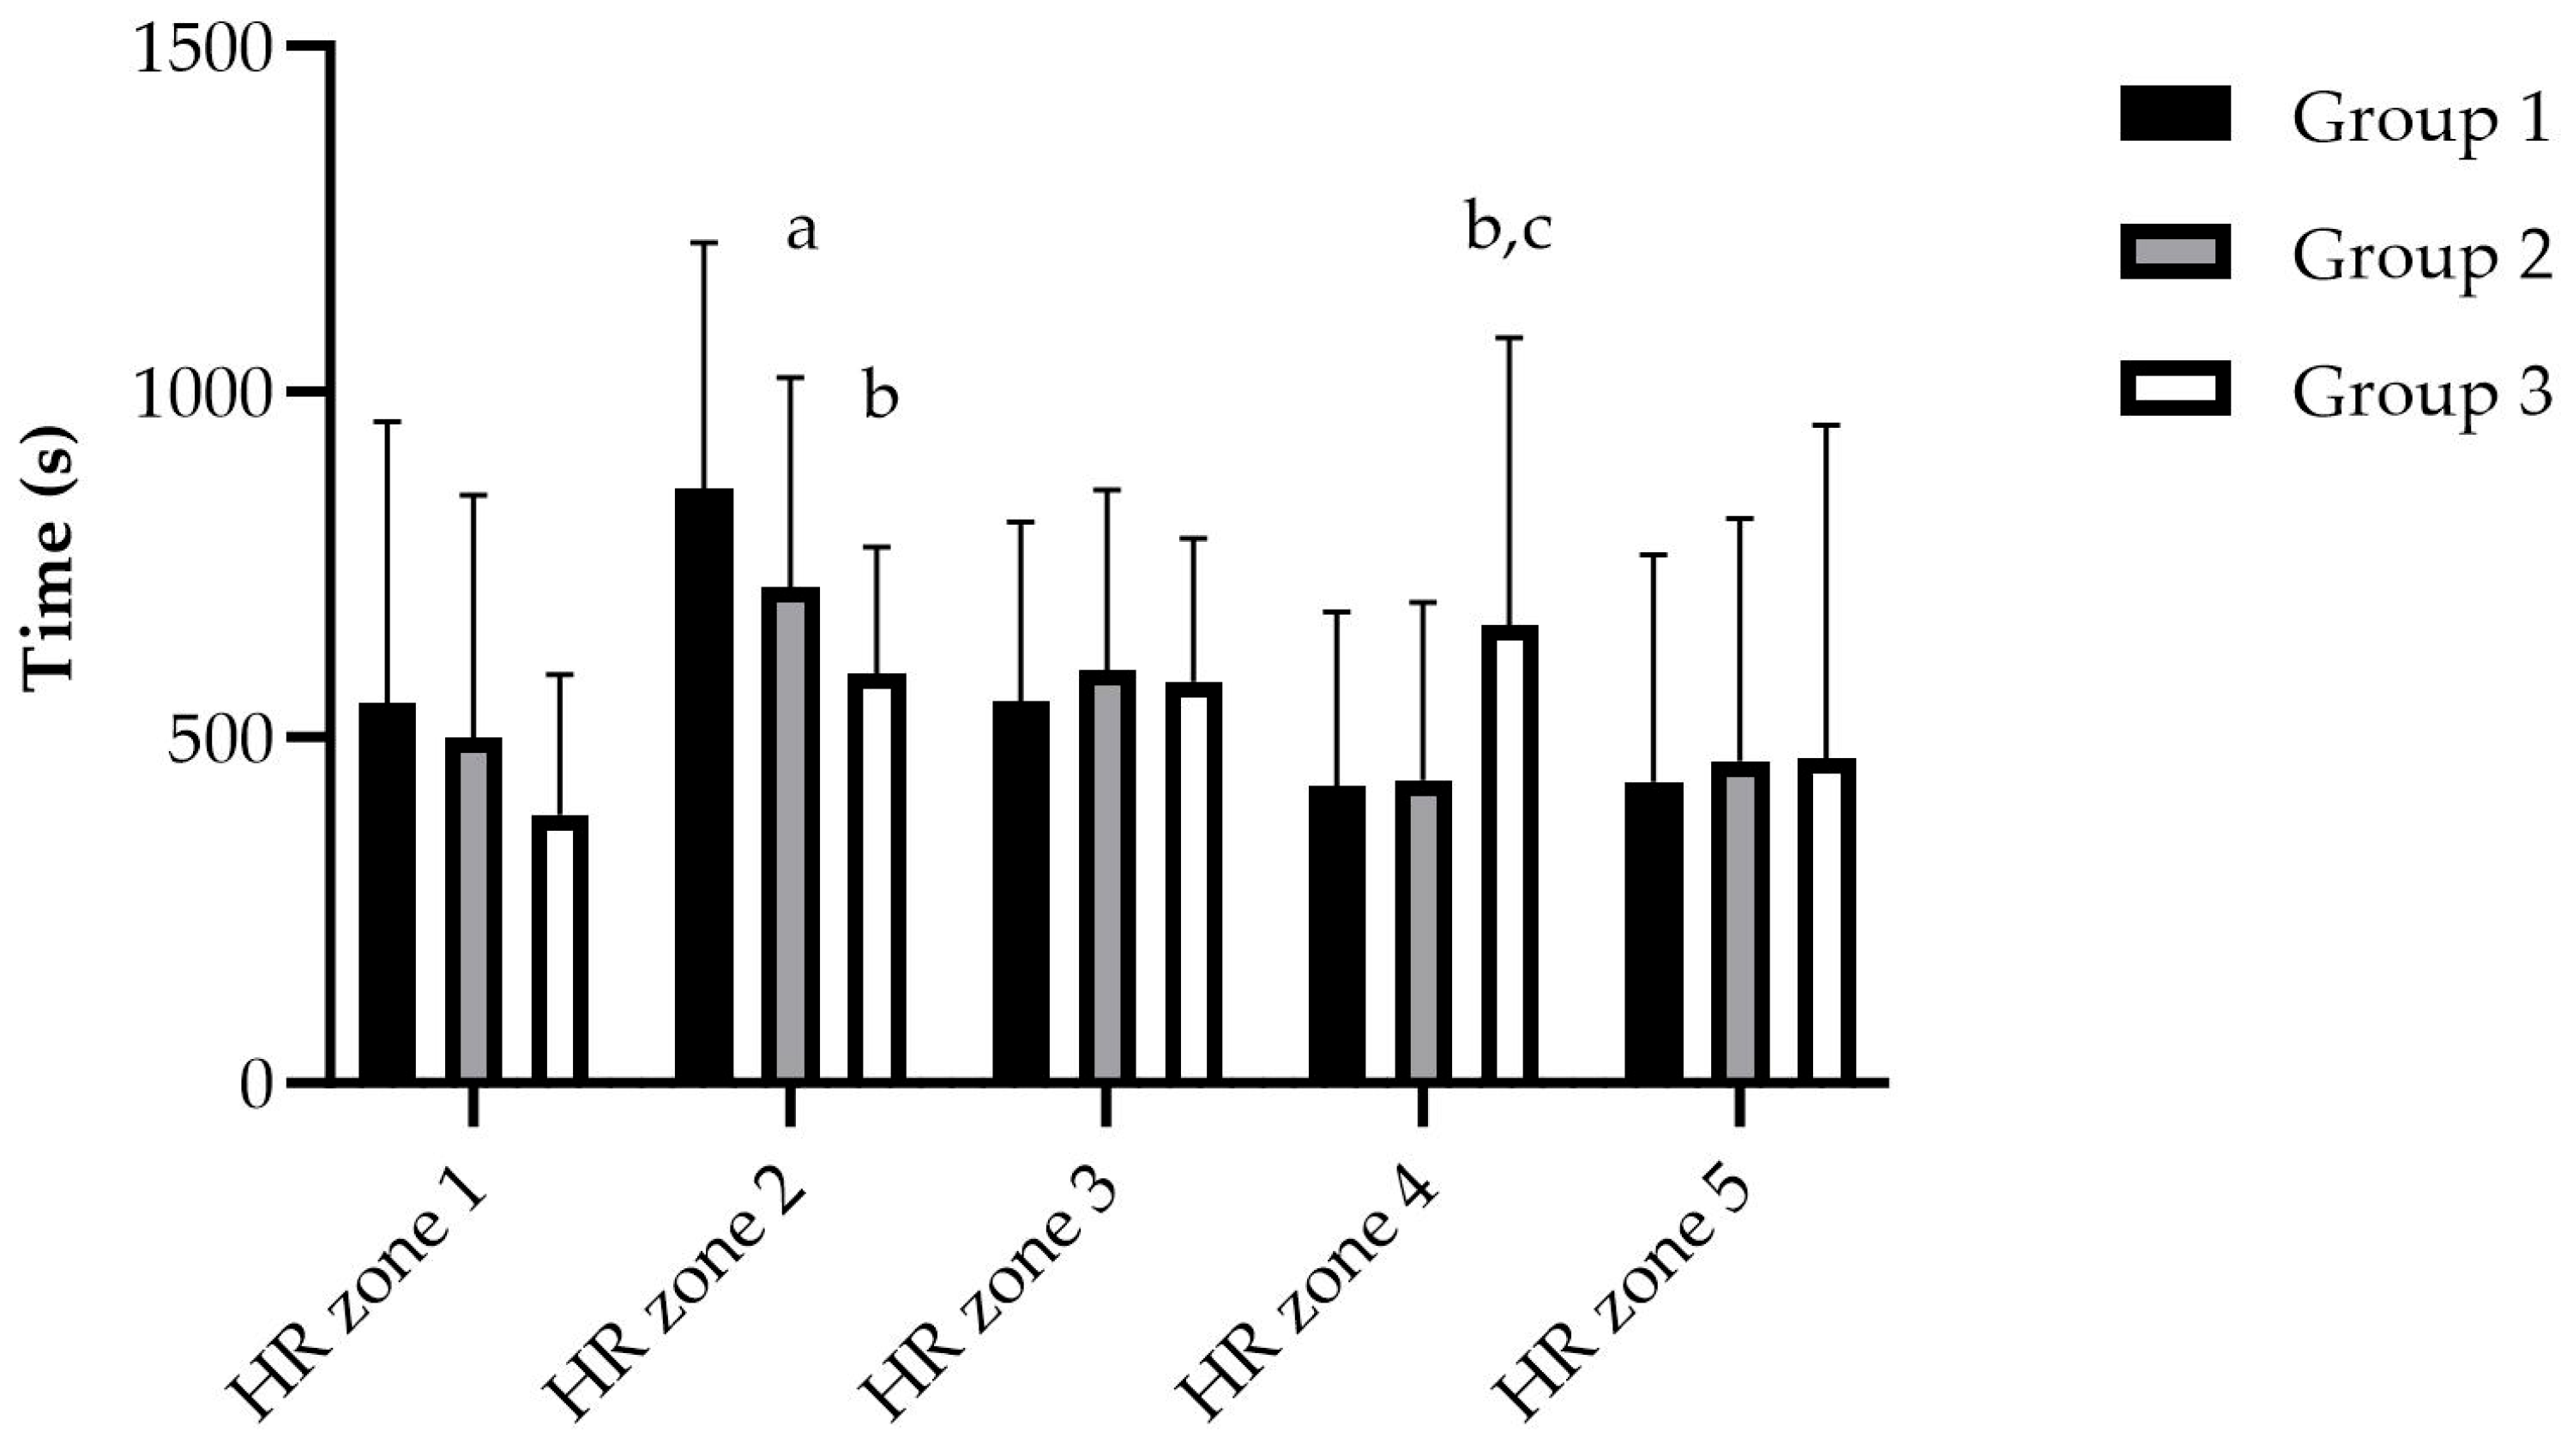
Field-based cardiovascular and internal load variables across PHV stages are presented in Table 4. Significant main effects of PHV category were observed for time spent in HR zone 2 (60–69%), F(2, 76) = 5.61, p < 0.001, η2 = 0.13, time in HR zone 4 (80–89%), F(2, 76) = 4.60, p < 0.001, η2 = 0.29, and caloric expenditure, F(2, 76) = 10.22, p < 0.001, η2 = 0.21.
Post hoc comparisons indicated that players in Group 2 spent approximately 17% less time in HR zone 2 than those in Group 1, while those in Group 3 spent 31% less time in this zone than those in Group 1. In contrast, time spent in HR zone 4 was substantially greater among the most mature players, with Group 3 showing 55% more time in this high-intensity zone than Group 1 and 51% more than Group 2 (Figure 1).
Similarly, caloric expenditure increased with maturation status. Players in Group 3 expended approximately 37% more calories than Group 1 and 15% more calories than Group 2, while Group 2 demonstrated about 20% higher caloric expenditure compared with Group 1. Overall, these findings indicate greater cardiovascular strain and internal load in the more mature players (Table 5).
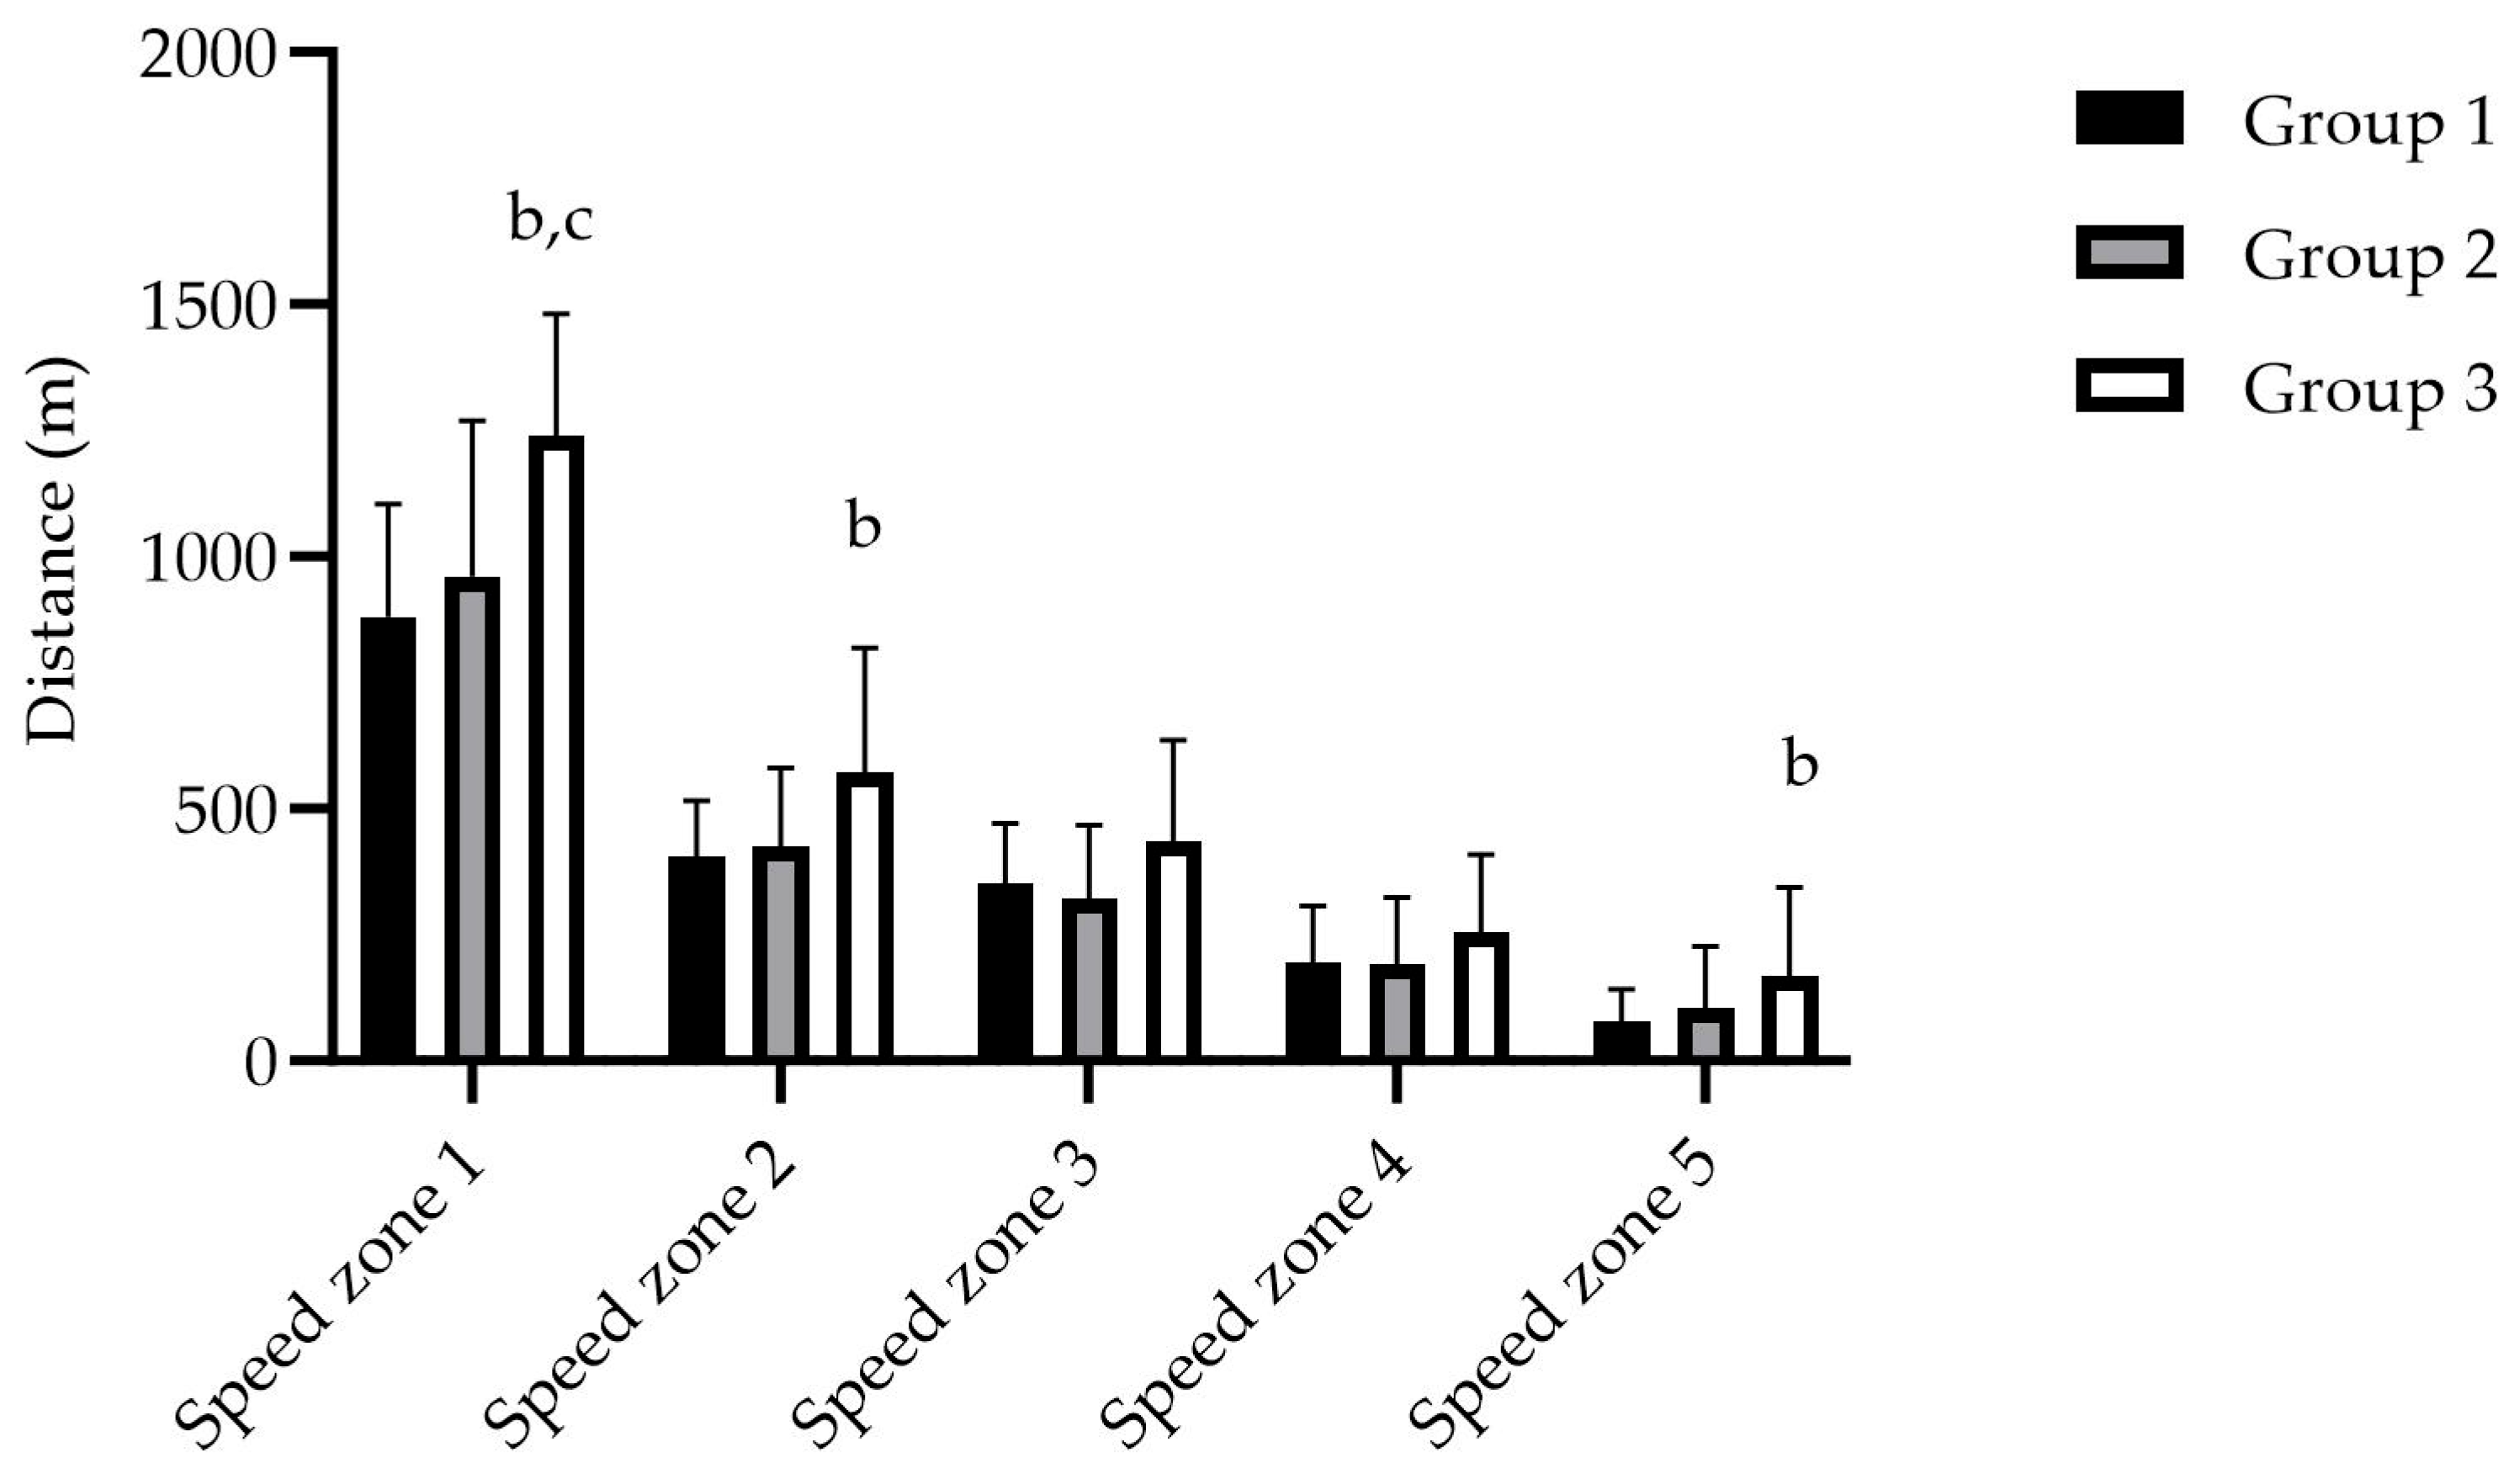
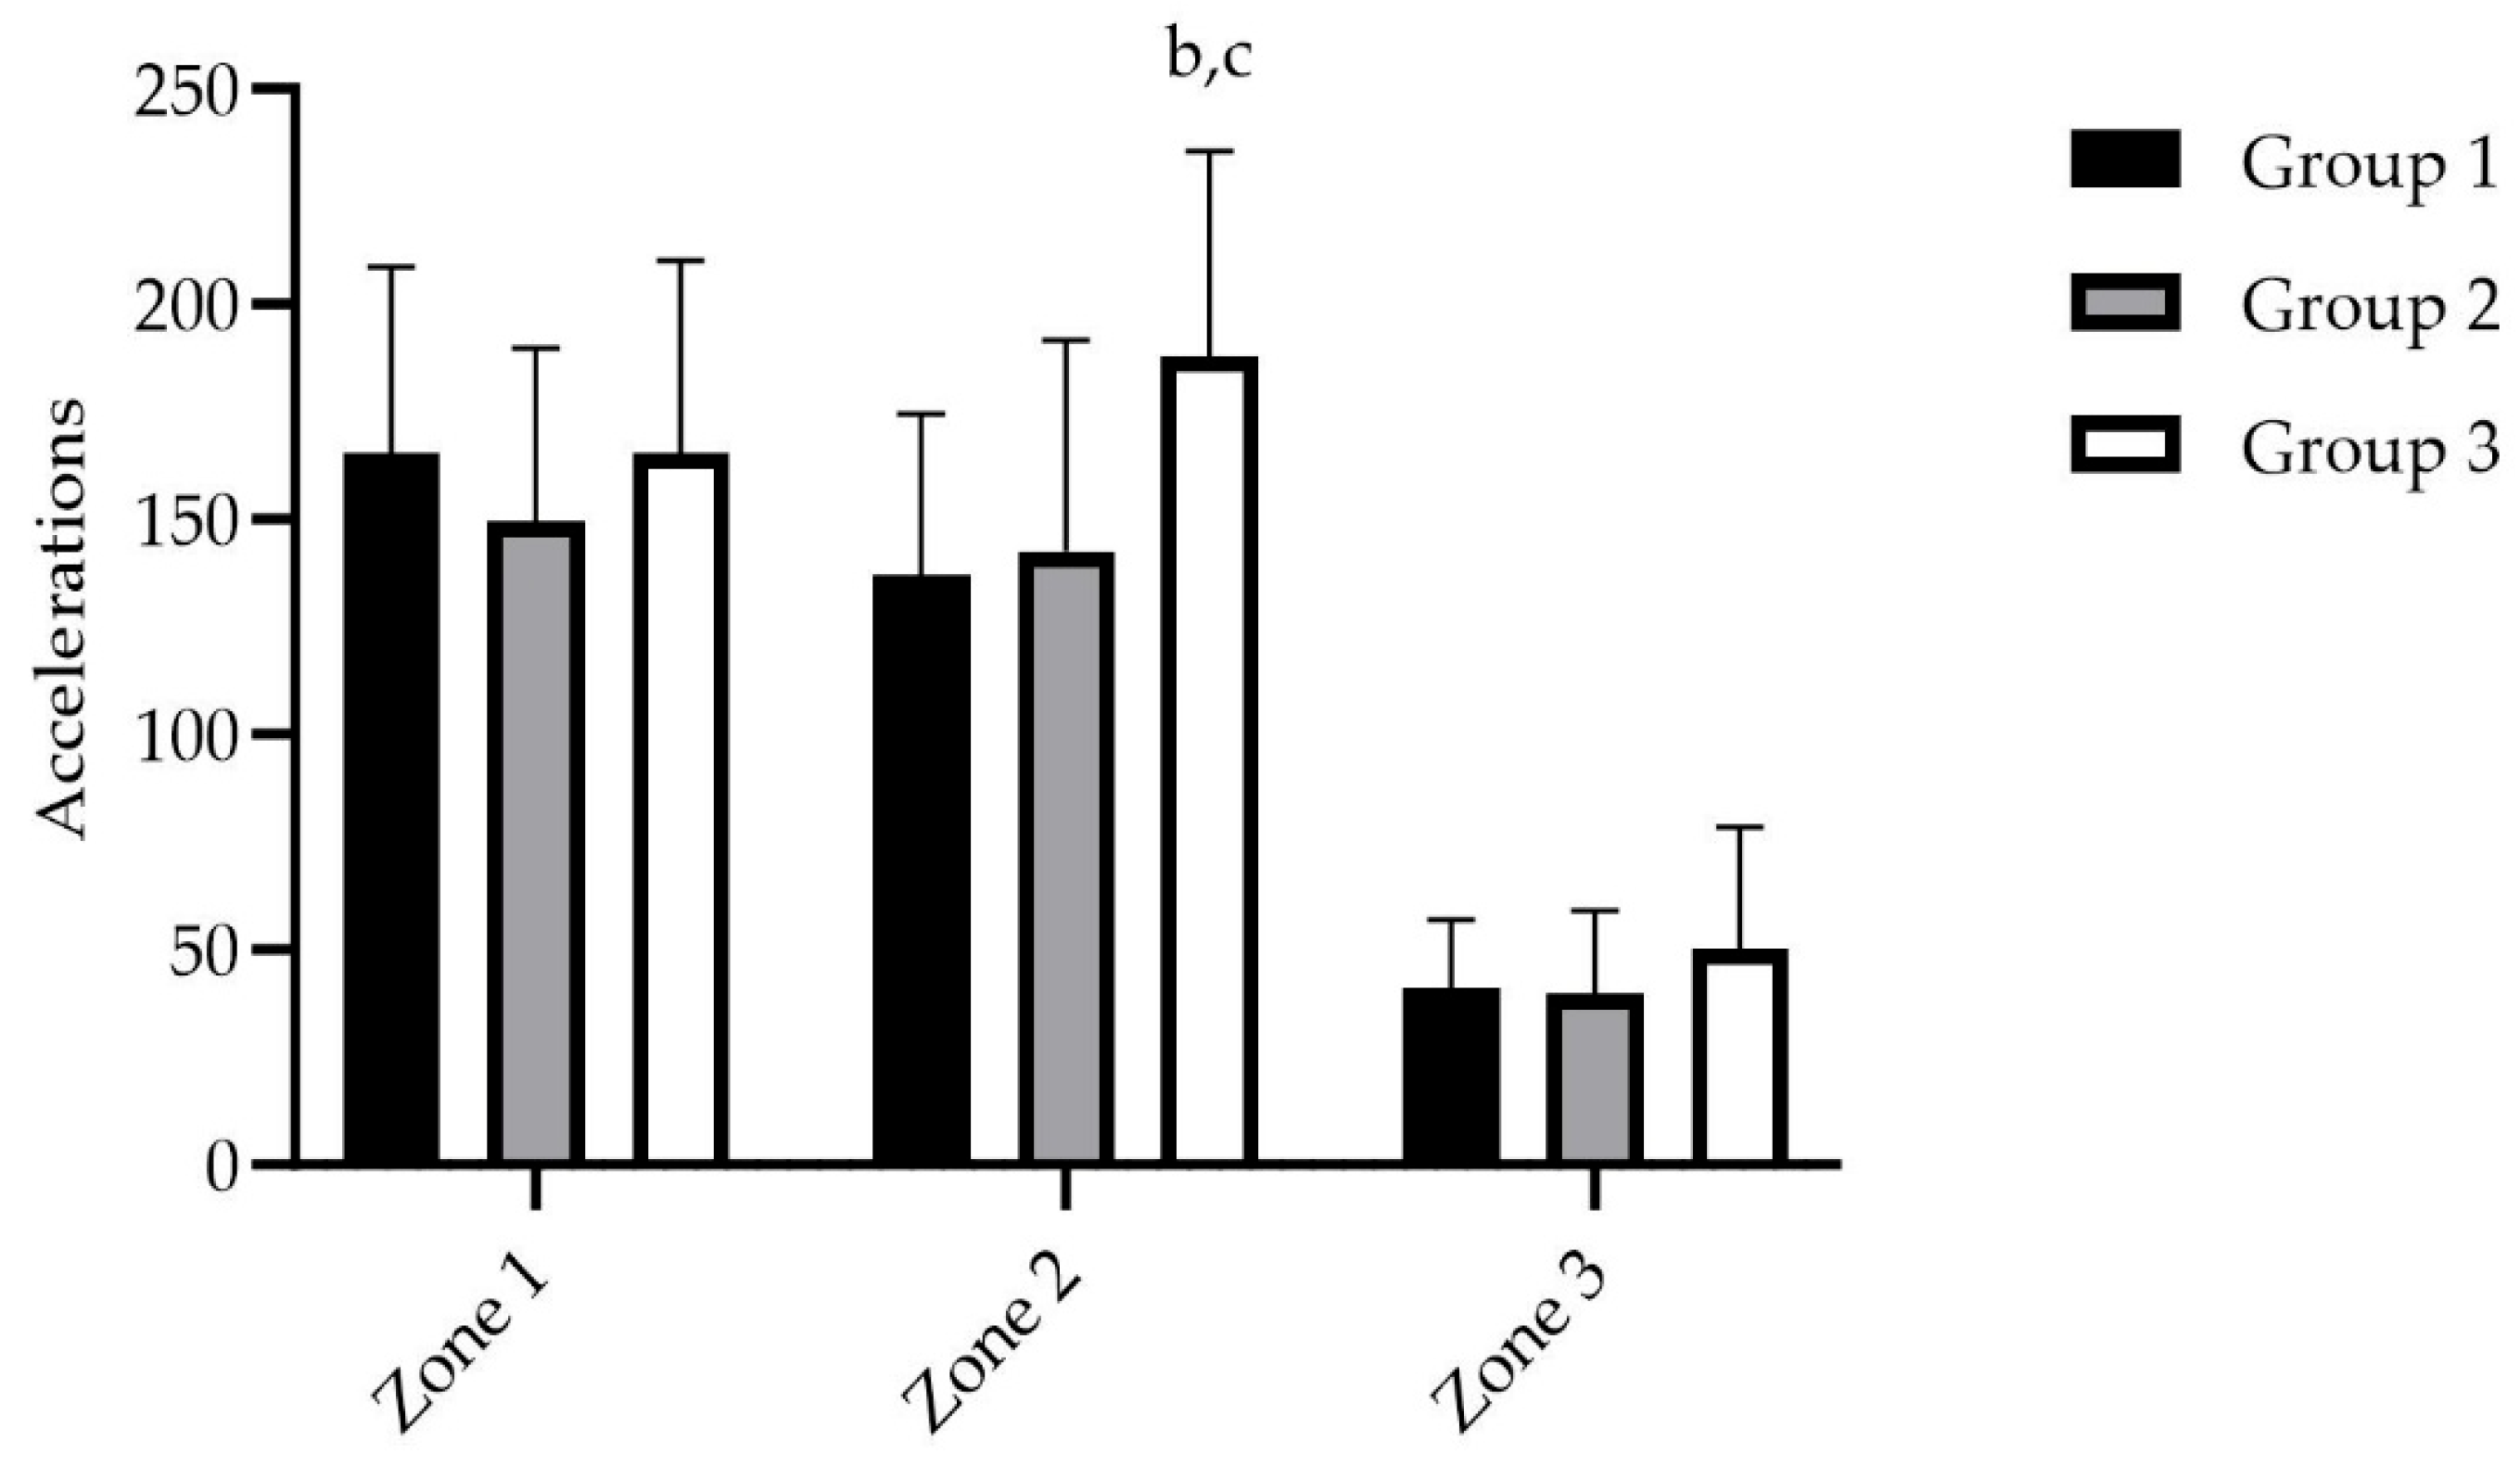
External load and locomotor performance variables are presented in Table 6. Significant main effects of PHV category were found for average speed, F(2, 76) = 14.24, p < 0.001, η2 = 0.27; total distance, F(2, 76) = 8.50, p < 0.001, η2 = 0.18; distance per minute, F(2, 76) = 12.53, p < 0.001, η2 = 0.25; distance in speed zone 1, F(2, 76) = 13.64, p < 0.001, η2 = 0.26; distance in speed zone 3, F(2, 76) = 3.64, p = 0.003, η2 = 0.09; distance in speed zone 5, F(2, 76) = 3.39, p = 0.004, η2 = 0.08; and number of accelerations in zone 2, F(2, 76) = 9.90, p < 0.001, η2 = 0.21.
Post hoc comparisons revealed consistent increases in external load associated with maturity. Players in Group 3 demonstrated approximately 39% higher average running speed than Group 1 and 34% higher speed than Group 2. Similarly, the total distance covered was 36% greater in Group 3 compared with Group 1 and 31% greater than in Group 2. The distance covered per minute followed a similar pattern, with Group 3 showing 42% higher values than Group 1 and 36% higher values than Group 2.
In terms of speed zones, Group 3 accumulated 41% more distance in speed zone 1 than Group 1 and 29% more than Group 2. Distance in speed zone 2 was 40% greater in Group 3 compared with Group 1. High-speed running (speed zone 5) was also elevated in the most mature players, with Group 3 covering 114% more distance than Group 1 (Figure 2).
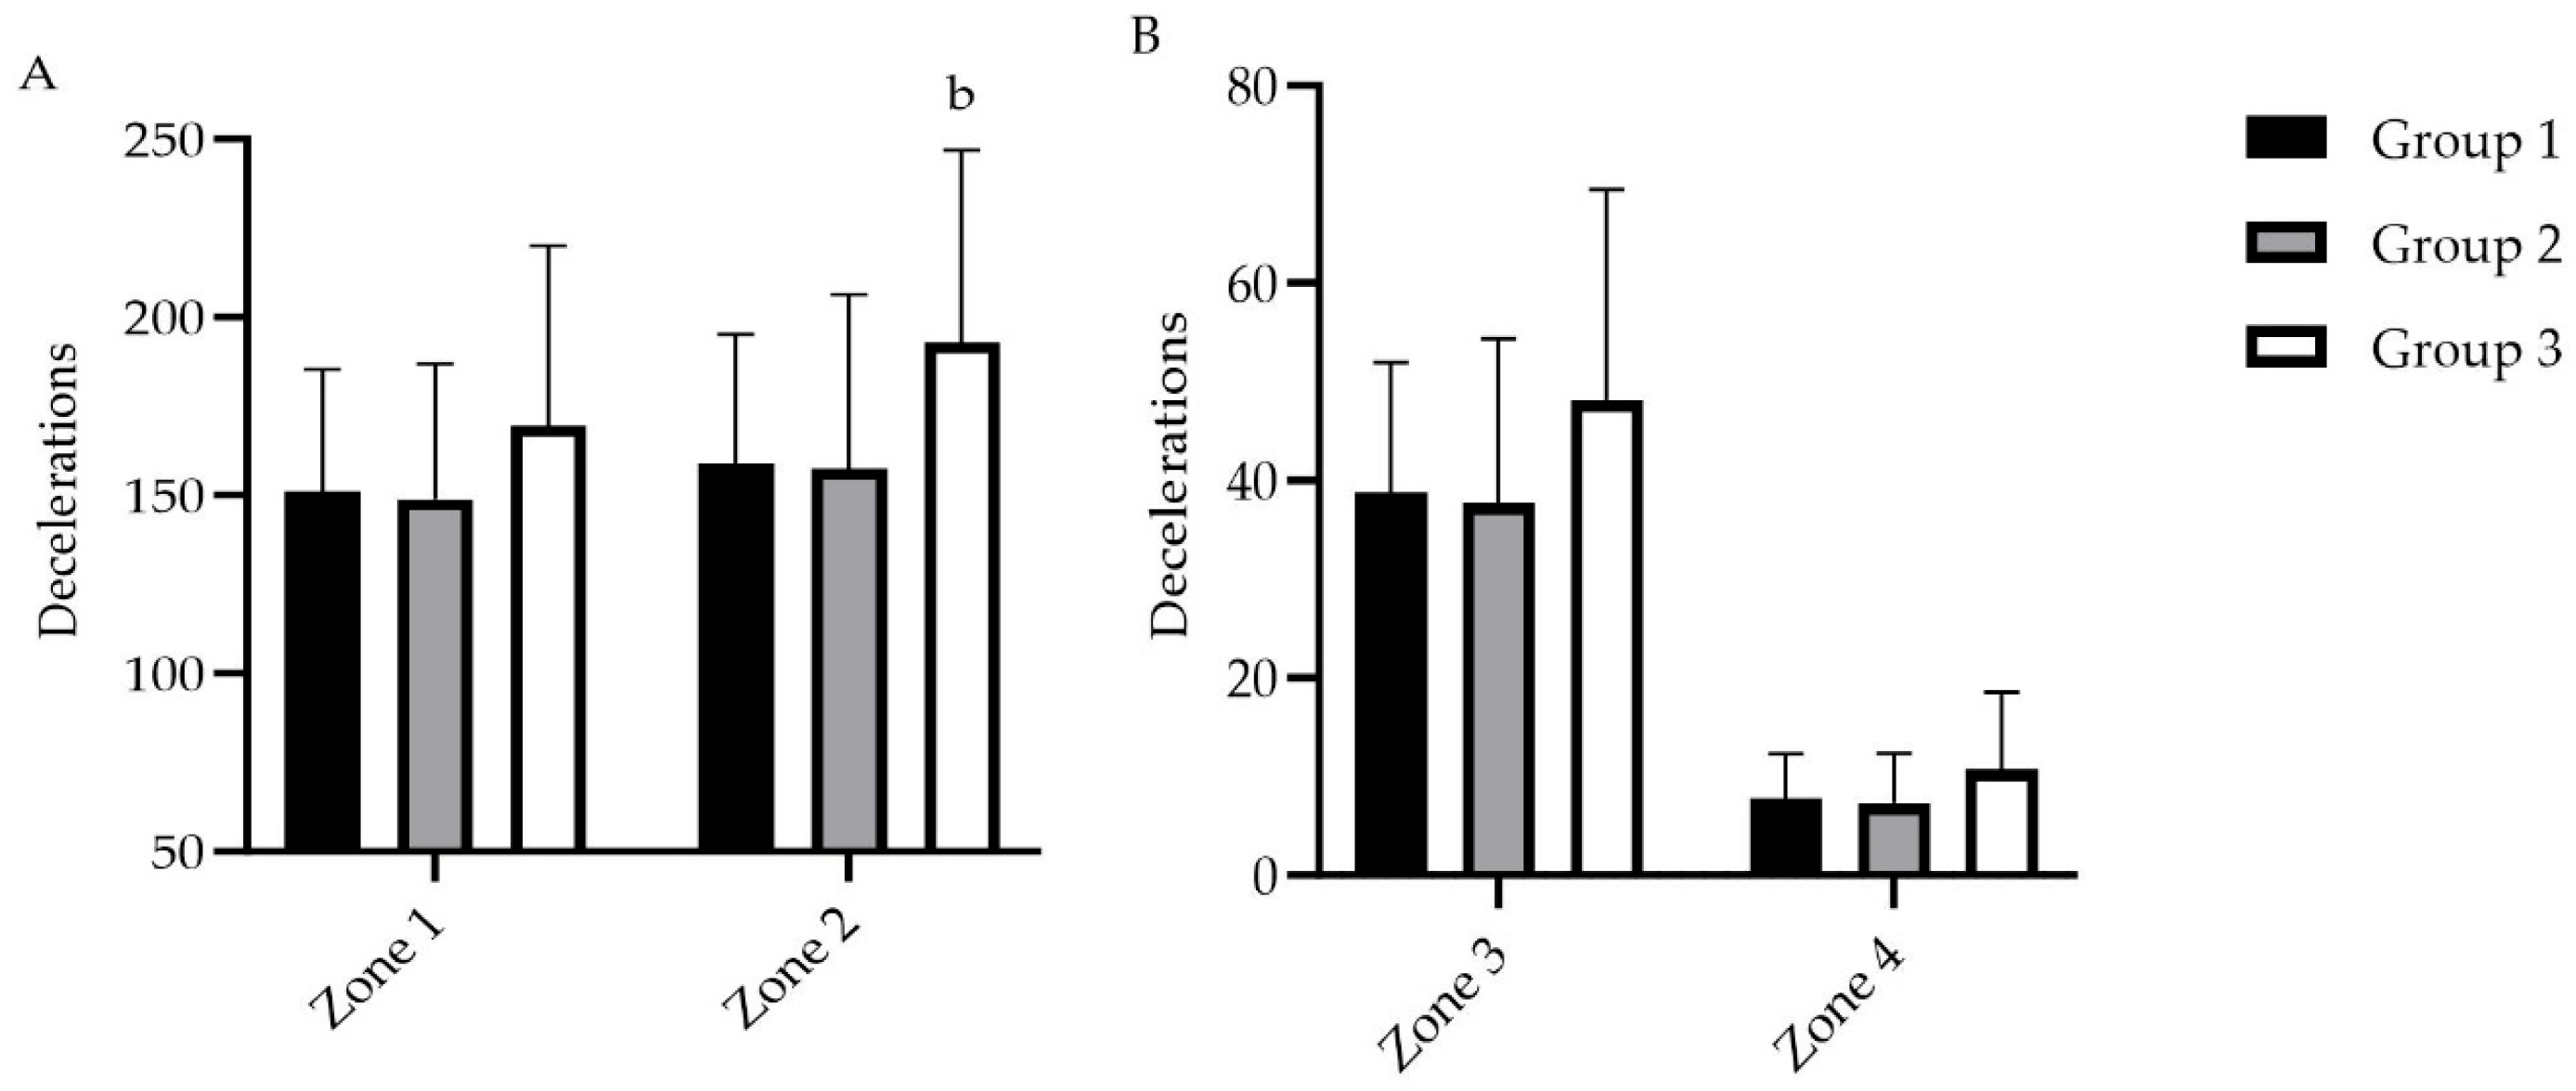
Regarding accelerative actions, the number of accelerations in zone 2 was 37% higher in Group 3 compared with Group 1 and 32% higher than in Group 2. Collectively, these results indicate that more mature players were exposed to substantially greater external mechanical loads during training sessions (Figure 3 and Figure 4).

3.4. Physical Activity

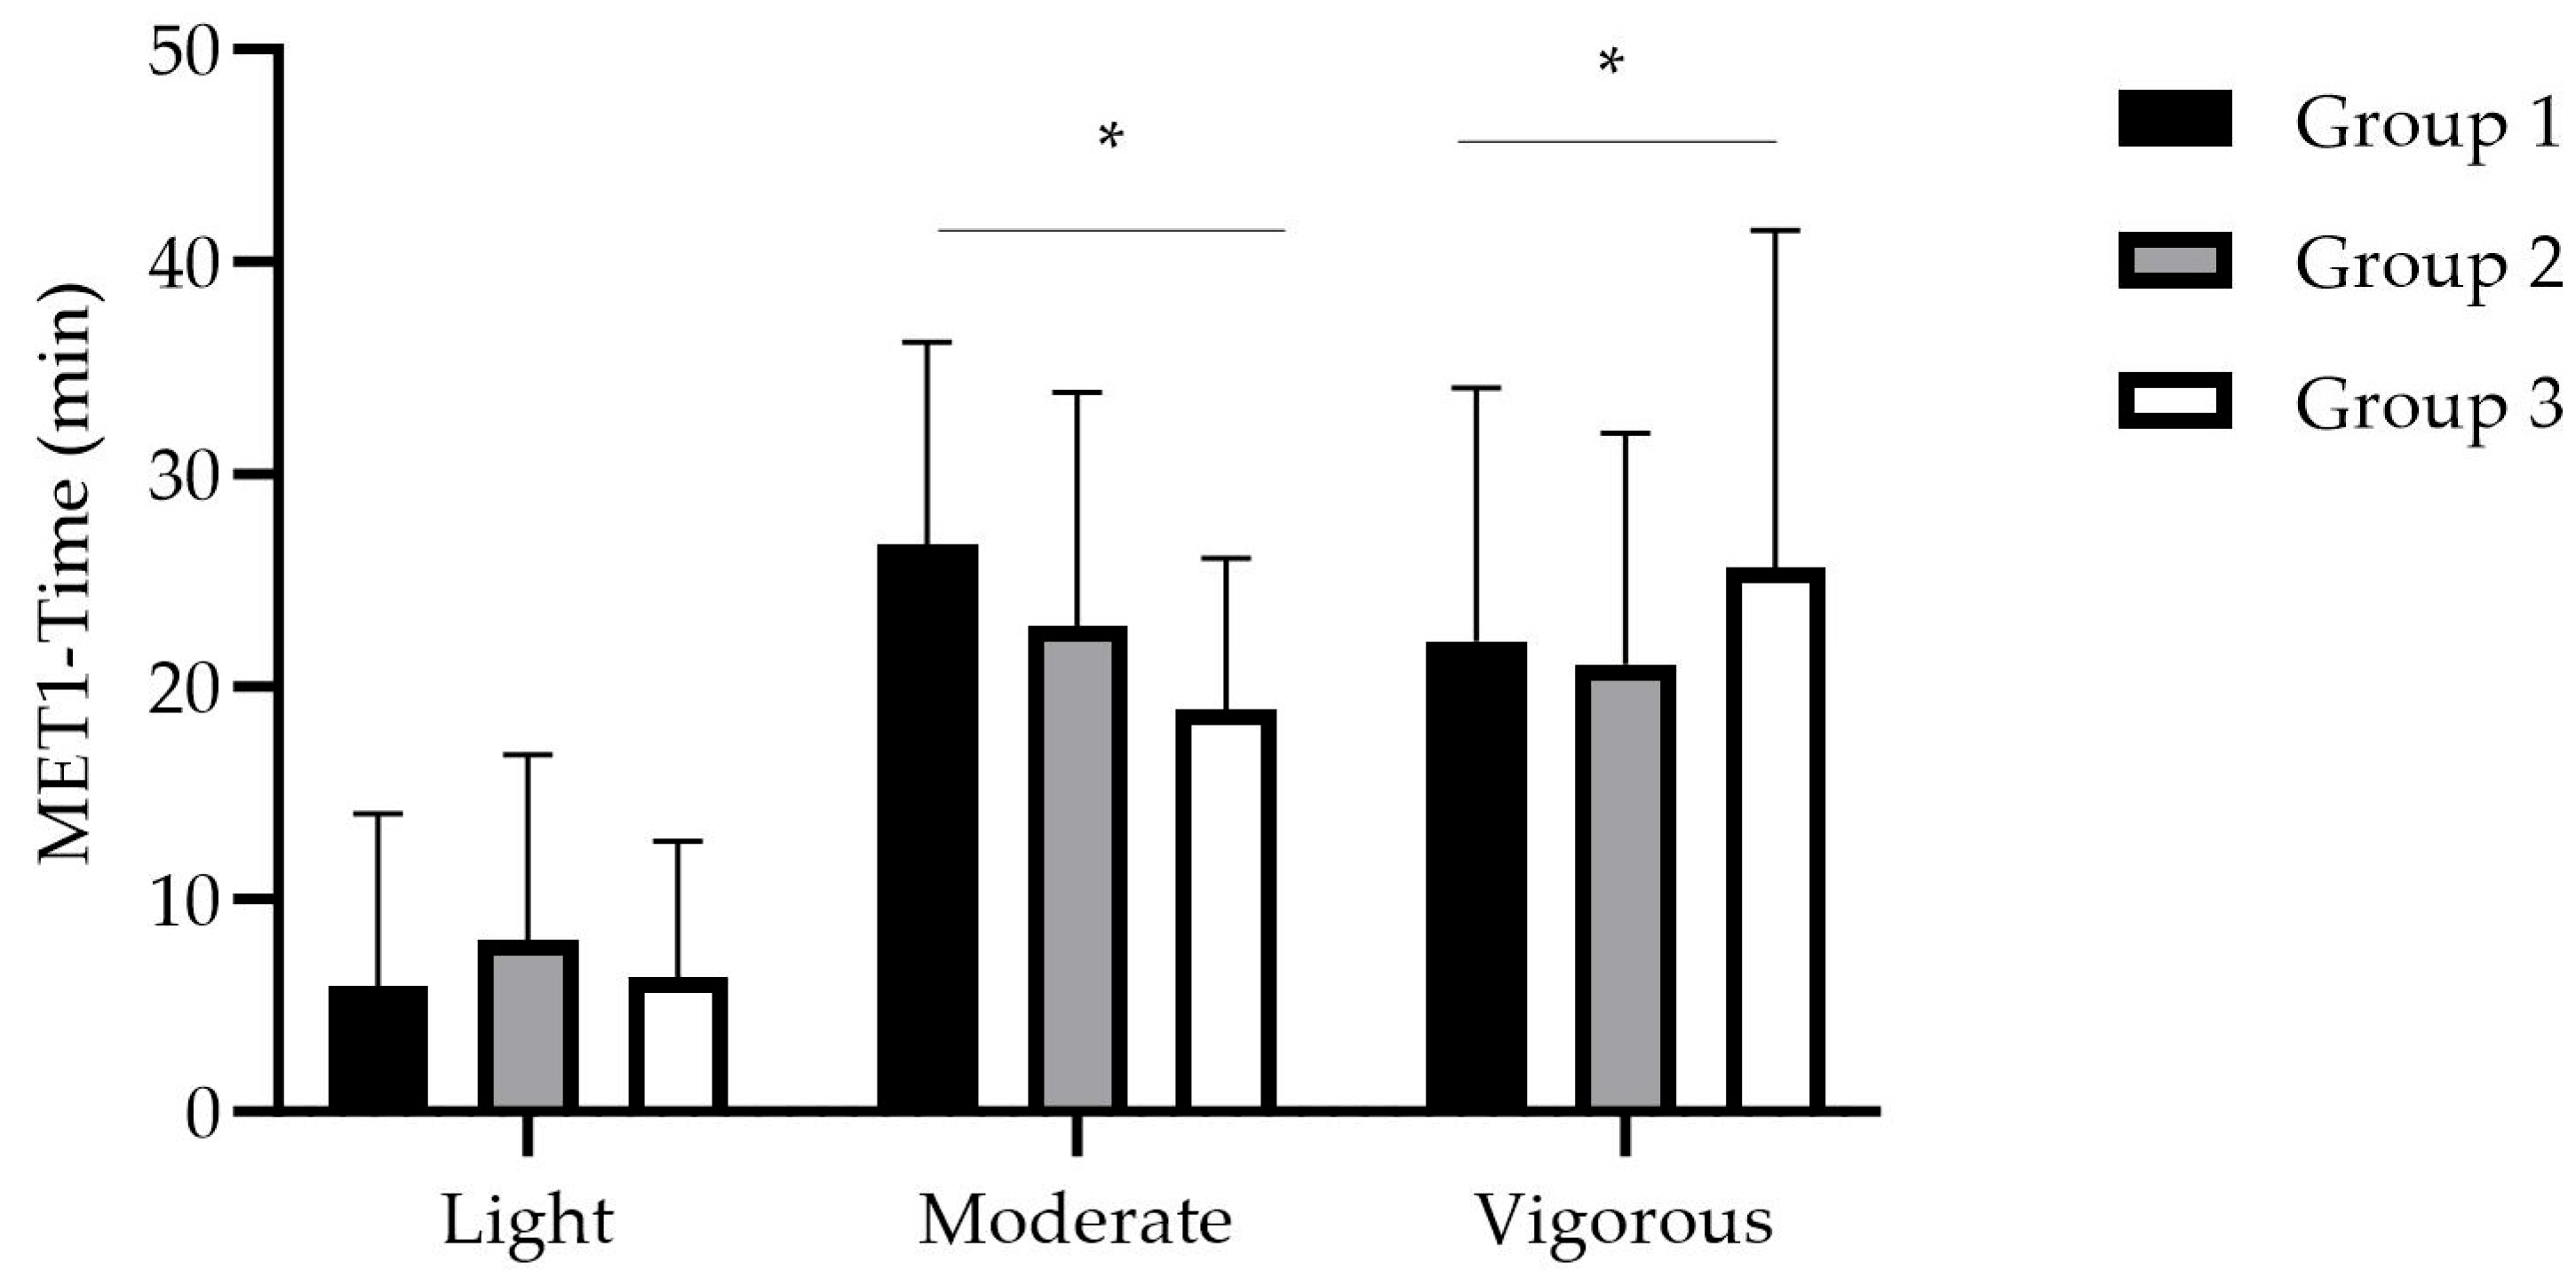
A mixed-design ANOVA was conducted with PHV stage as the between-subject factor and intensity zone as the within-subject factor. For MET1, the group × intensity zone interaction was not significant, F(4, 152) = 1.68, p = 0.158. The main effect of PHV stage was also not significant, F(2, 76) = 1.73, p = 0.184, ηp2 = 0.04. In contrast, a significant main effect of intensity zone was observed (Greenhouse–Geisser corrected), F(1.46, 111.19) = 47.20, p < 0.001, ηp2 = 0.38. Bonferroni-adjusted post hoc comparisons indicated that time spent in the Light zone was significantly lower than in both the Moderate and Vigorous zones (both p < 0.001), whereas Moderate and Vigorous zones did not differ (p = 1.00) (Figure 5).
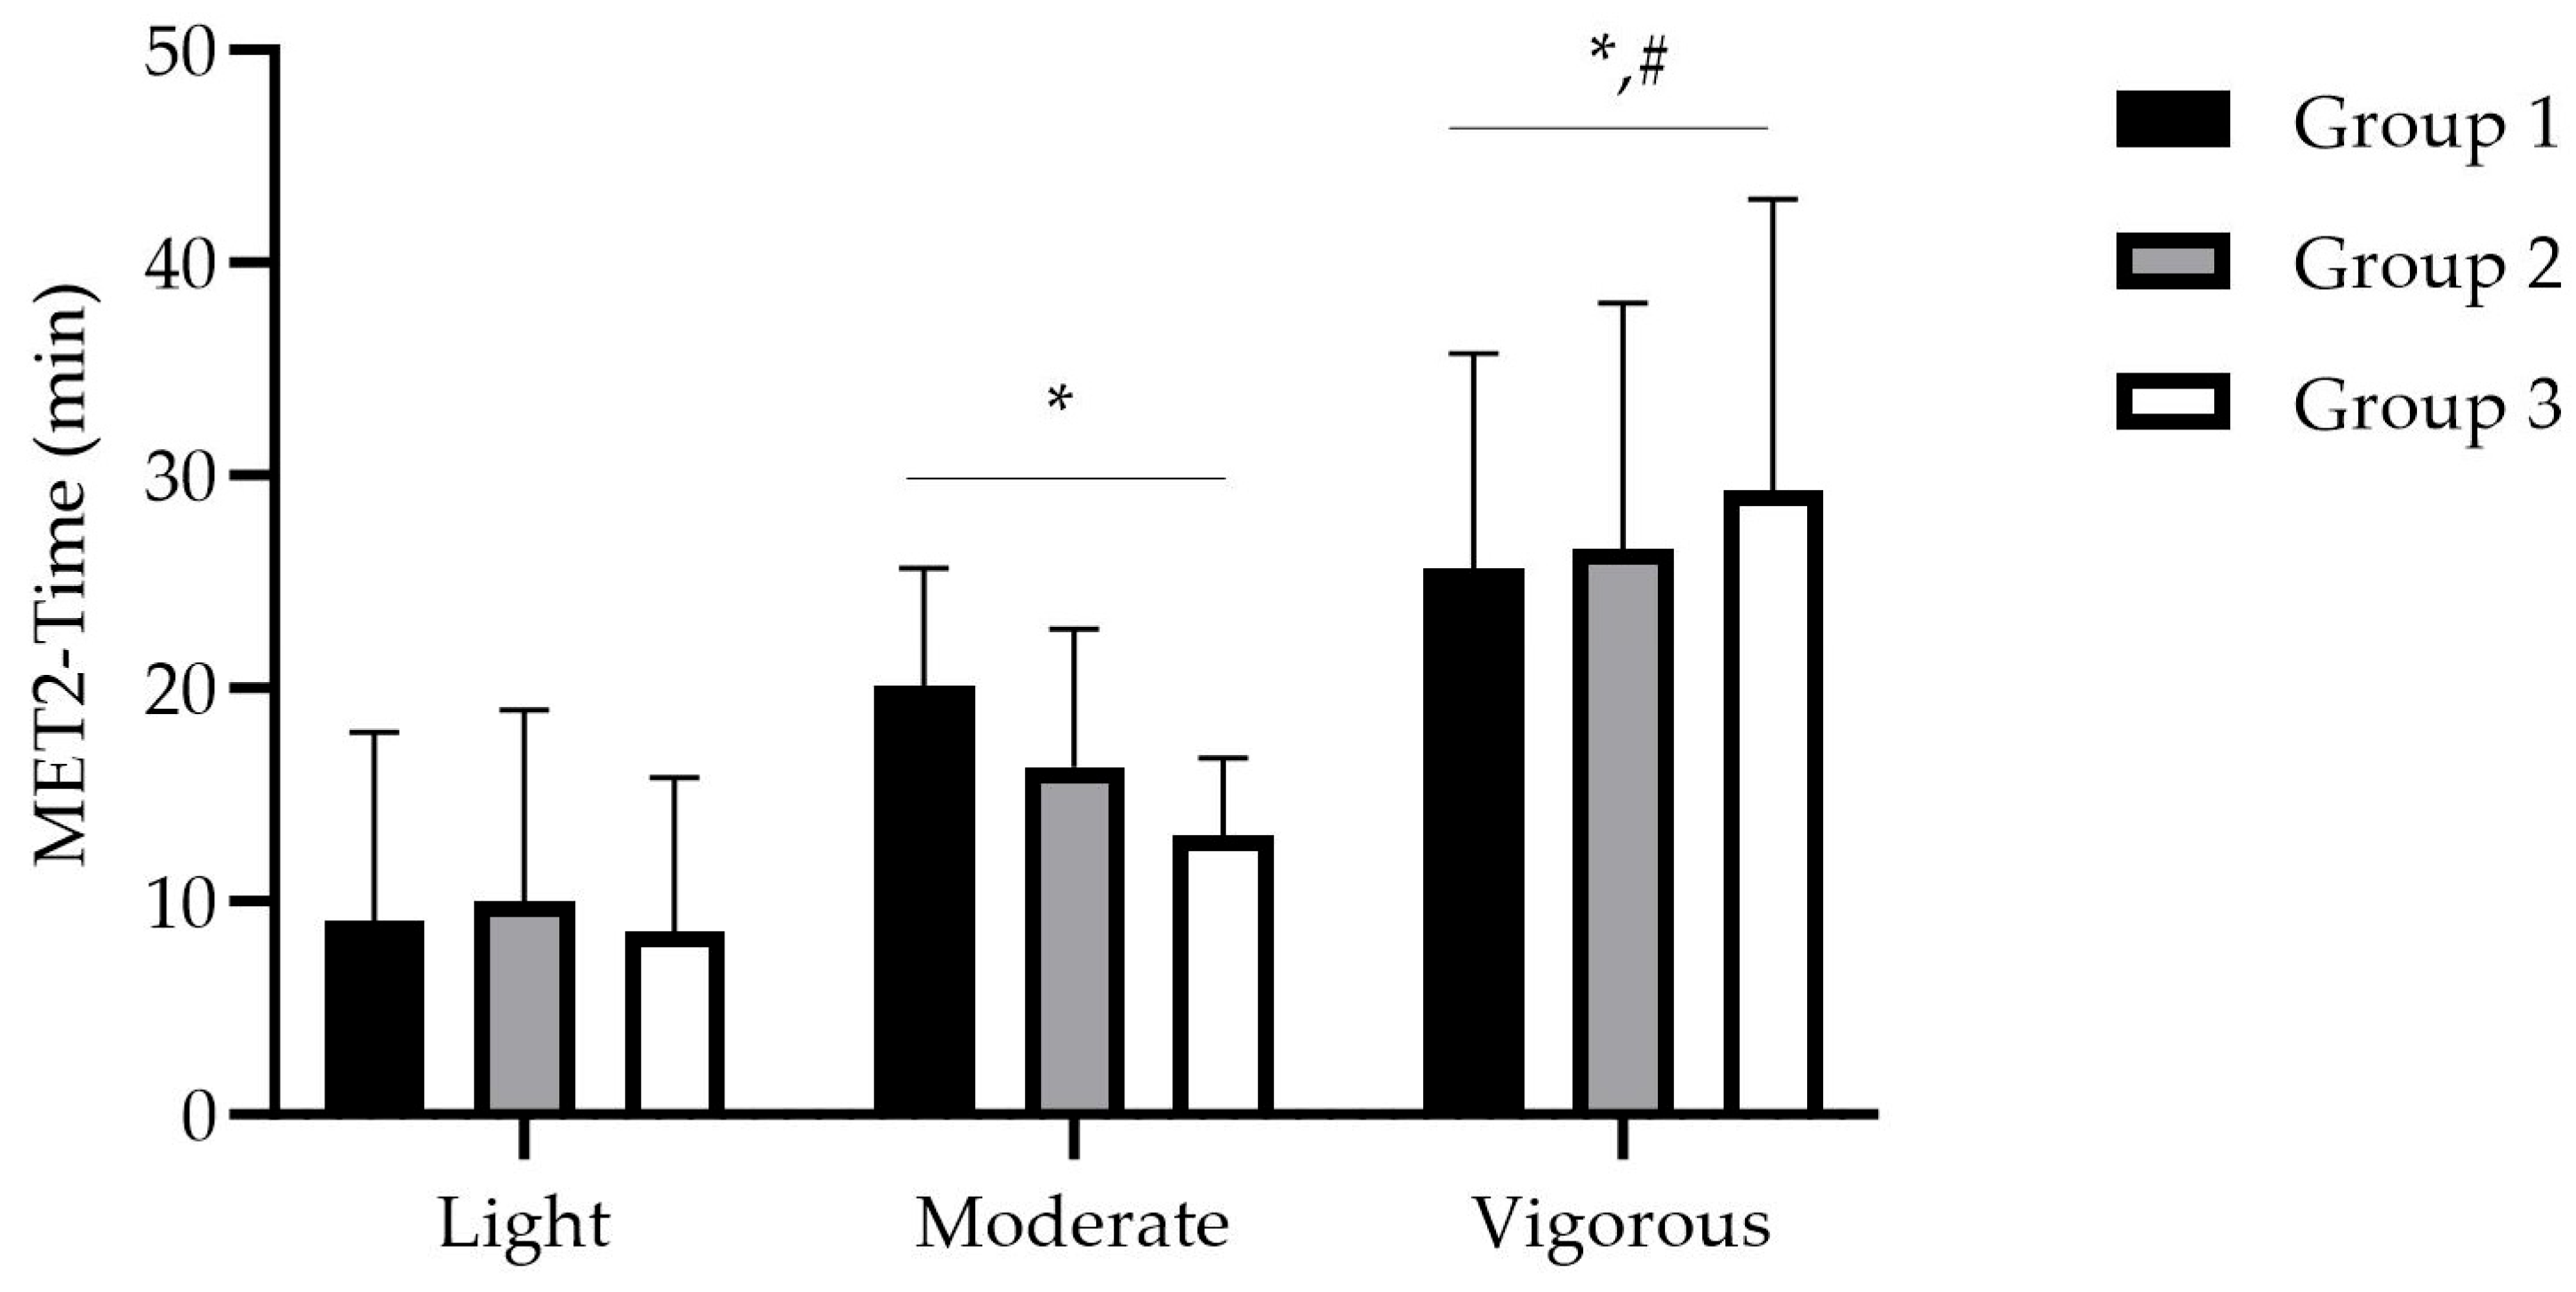
For MET2, the group × intensity zone interaction was not significant, F(4, 152) = 2.04, p = 0.092, and the main effect of PHV stage was again nonsignificant, F(2, 76) = 1.73, p = 0.184, ηp2 = 0.04. The main effect of intensity zone remained significant (Greenhouse–Geisser corrected), F(1.35, 102.49) = 64.21, p < 0.001, ηp2 = 0.46. Post hoc analyses showed a stepwise increase across zones, with significantly more time accumulated in Vigorous than Moderate and in Moderate than Light (all p < 0.001) (Figure 6).
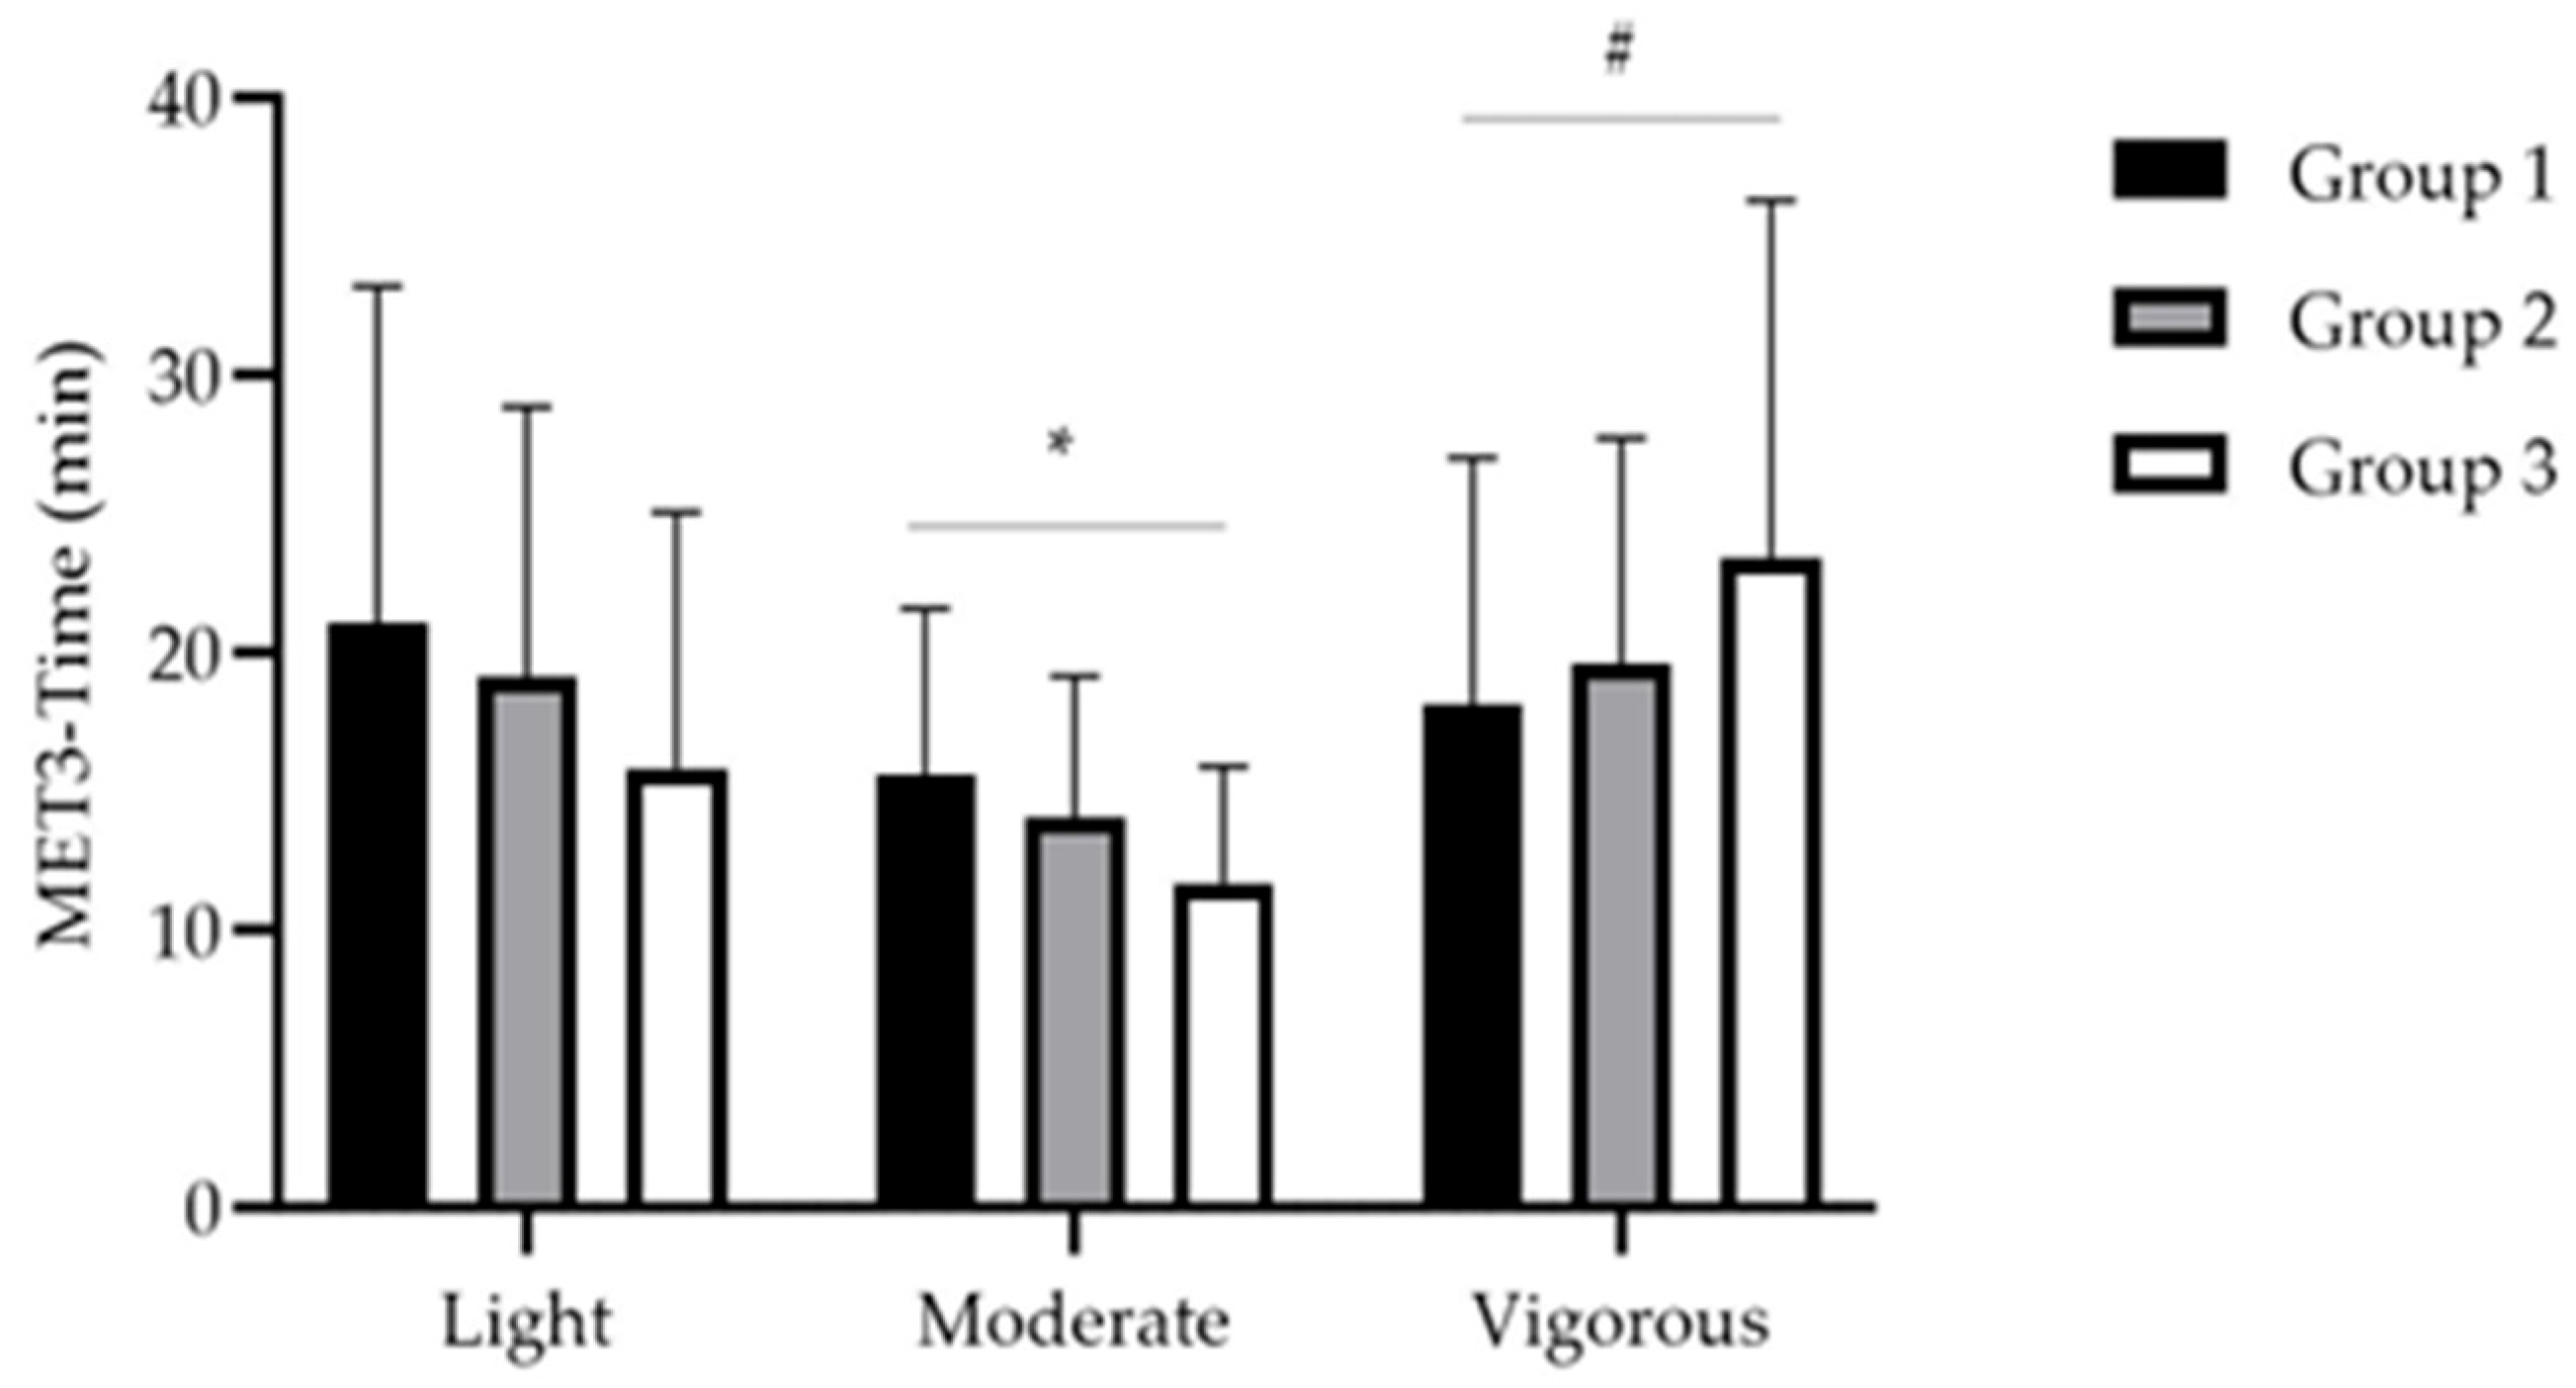
For MET3 zones, the group × zone interaction was not significant, F(4, 152) = 2.04, p = 0.092, and the main effect of PHV stage was nonsignificant, F(2, 76) = 1.73, p = 0.184, ηp2 = 0.04. A significant main effect of MET3 zones was observed (Greenhouse–Geisser corrected), F(1.39, 105.85) = 8.17, p = 0.002, ηp2 = 0.10. Bonferroni-adjusted post hoc tests indicated that time spent in the moderate intensity zone was significantly lower than in the light (p = 0.006) and vigorous (p < 0.001) zones and significantly higher than in the >60% zone, whereas the <40% and >60% zones did not differ (p = 1.00) (Figure 7).

4. Discussion

The purpose of the present study was to examine differences in anthropometric characteristics, physical performance, field performance, training load and physical activity in youth basketball players prior to their entry into competitive age categories. Additionally, the study aimed to investigate whether these variables differ across maturity stages defined by predicted age at peak height velocity (PHV). In addition, the study investigated whether participation in organized basketball training provides adequate exposure to different physical activity intensity zones in relation to biological maturation status. It was hypothesized that more mature players would demonstrate superior performance outcomes in both field test and training load during the training and accumulate greater amounts of moderate-to-vigorous physical activity compared with their less mature counterparts. In addition to statistical significance, the magnitude of the observed effects should be considered, as several findings demonstrated moderate-to-large effect sizes, indicating practical relevance despite variability in statistical outcomes.

4.1. Maturity-Related Differences in Anthropometry and Physical Performance

The children were classified into three categories based on the years’ distance from the PHV period, and it was found that the more mature children showed, in consistency with the study hypothesis, significant differences with groups 1 and 2 in height, body mass, body mass index, chronological age, and maturity offset, with large effect sizes. These findings confirm the strong influence of biological maturation on anthropometric development during early adolescence and align with previous research demonstrating that more mature youth athletes are typically taller and heavier than their less mature peers [26,27,31]. While biological maturation appears to play an important role, the potential influence of contextual and training-related factors should also be considered.
Similarly, physical performance variables related to speed, jumping ability, and upper-body power differed significantly between maturity groups. Players in group 3 outperformed the other two groups in sprint performance, countermovement jump height, handgrip strength, and medicine ball throw. These results are in accordance with earlier studies reporting that maturity-related increases in muscle mass, limb length, and neuromuscular efficiency confer advantages in power- and speed-related tasks [29,31,32].
Moreover, the first two groups differed significantly from each other in the medicine ball throw, a test of upper-limb power, and in the dominant-hand grip strength, with a difference of about 12%, confirming the linear progression of strength with biological maturation. However, the hypothesis of adolescent awkwardness was partially confirmed, as participants in the first two groups did not differ in vertical jump performance or in the time taken to cover 10 m and 20 m, despite the increase in chronological age. This is consistent with the fact that the two groups differed significantly in seated height and leg length [57,58]. This pattern seems to exist in the general population, where a decline in performance was observed in the year before PHV, whereas in football, children showed a linear progression in their performance [59,60,61]. The fact that children involved in sports partially overcome adolescent awkwardness may be due to neuromuscular adaptations resulting from training, as well as training elements such as frequency, intensity, and volume, which, however, need to be thoroughly investigated.

4.2. Field Performance and External Load

Beyond laboratory-based performance tests, the present study demonstrated substantial maturity-related differences in field performance variables derived from IMU and heart rate monitoring.
To the best of our knowledge, this is the first study to present data on children aged 12–14 years in basketball. The period from 12 to 14 years is recognized by the FIBA as a pre-competition period, and clubs prepare young athletes in motor skills, tactics, and physical fitness to successfully participate in competitive activities in the U16 age category in the coming years. The main findings of the study showed that more mature players accumulated greater total distance, higher running intensity, and elevated cardiovascular strain during training sessions, as evidenced by differences in average speed, distance per minute, time spent in moderate heart rate zones, and caloric expenditure. These findings suggest that biological maturation influences not only physical capacities but also how young athletes are exposed to and tolerate sport-specific training loads. These findings may also be interpreted in light of neuromuscular development during growth and maturation. Increases in muscle mass, alterations in limb segment length, and the continuous refinement of neuromuscular coordination can influence both movement efficiency and force production. During the period surrounding PHV, transient disruptions in motor control and inter-limb coordination may occur, potentially affecting movement patterns and the execution of high-intensity actions.
U18 and U16 data indicate that biologically advanced athletes often experience higher external and internal loads during match play and training [62,63]. However, these differences may not solely reflect physiological superiority; they may also be influenced by positional roles, tactical responsibilities, and coach-driven expectations that favor physically developed athletes. Consequently, higher accumulated loads in more mature players should be interpreted within the broader context of developmental stage and training prescription, rather than as definitive indicators of long-term advantage.
The conclusion is that children in the year of PHV produce more work at higher intensity than those before the PHV period. Additionally, children with a distance from PHV of −1.5 to −0.5 showed higher values than those aged −2.5 to −1.5 in the speed zone above 19 km/h, indicating that more mature children can reach higher-intensity areas during training. Considering both performance evaluation from the given tests and evaluation during basketball, there is general agreement that the children in the first two groups show similar values, with partial agreement with adolescent awkwardness [54]. However, the fact that children in Group 2 showed higher speed values somewhat differentiates the data. This differentiation may be partly explained by neuromuscular and coordination-related factors, as well as technical and tactical knowledge; however, these variables were not directly assessed and should be interpreted with caution [64,65]. On the other hand, higher speeds during training and games, when leg length increases, and torso length remains stable, may increase the risk of injury due to the torques generated in the lower-limb joints [50], which warrants attention from coaches of young athletes. General guidelines suggest that during the period around PHV, it is advisable to reduce intensity and overall load, especially if children experience joint and bone pain in the lower limbs [66].

4.3. Physical Activity Patterns and Intensity Distribution

Engagement in organized sports often reflects the choice of parents-guardians and children to meet the need for physical activity and the development of movement-related skills, as well as their psycho-emotional state and skills such as decision-making under pressure, self-confidence, etc. According to the WHO guidelines, children should accumulate about 60 min of moderate-to-vigorous physical activity per day [1,2]. In Greece, training sessions are held 3 times per week, and each typically lasts from 60 to 90 min at these ages. This raises the question of whether basketball training alone is sufficient to meet recommended daily physical activity targets. The results of the present study show that children in all three groups spent 2/3 of the training time in moderate-to-high-intensity physical activity, approximately 40 min in absolute terms. This represents one of the first attempts to quantify physical activity in this context, and the findings provide preliminary evidence that basketball training may contribute toward meeting the WHO minimum values, although additional daily physical activity is likely required.
An additional hypothesis of the study was that biological maturation affects children’s physical activity. The hypothesis was based on the possibility that adolescent awkwardness could affect children’s movement ability and, consequently, their energy expenditure. The absence of significant differences in physical activity intensity across maturation groups should be interpreted with caution. This finding may be influenced by several factors, including limited statistical power, the sensitivity of HR- and MET-based methods in detecting differences during intermittent activity, and the potential influence of unmeasured variables [67,68,69]. Therefore, these results do not necessarily indicate the absence of maturation-related effects, but rather highlight the complexity of assessing physical activity intensity in youth team sports. However, contrary to the original hypothesis, no significant interaction between groups and intensity zones was found in any of the three methods used to assess physical activity. The main finding was that in all groups, independently of the MET-method assessment and the group, the time spent in moderate-to-vigorous physical activity was approximately 40 min, indicating that a basketball training session is not a standalone activity for meeting the recommendations of the WHO. It should be emphasized that the present findings reflect physical activity accumulated during structured basketball training sessions and not total daily physical activity. Therefore, conclusions regarding compliance with WHO recommendations should be interpreted with caution. The lack of maturity-related differences in the distribution of physical activity intensity may also be interpreted in light of adolescent awkwardness [28,29]. During the period of PHV, disruptions in coordination and movement economy may decrease the ability to move throughout the court and/or increase the energetic cost of locomotion without necessarily increasing time spent in higher-intensity zones. These observations may be partly explained by factors such as tactical understanding or movement efficiency; however, these variables were not directly assessed in the present study and should therefore be interpreted with caution. On the other hand, more mature players may have greater knowledge of basketball tactics and perform more economically during basketball training. Thus, this may explain why more mature players covered an average of 600–700 more meters than less mature players. Still, their Physical Activity analysis based on Heart Rate revealed no difference between groups. It should also be considered that the gold standard method for estimating energy expenditure and expressing it in METs is based on direct measurement of oxygen consumption [70]. However, such an approach is not feasible within the context of basketball training. The use of portable gas analyzers would interfere with normal training participation and could increase the risk of injury for both the athlete and their teammates. Therefore, although heart rate–based estimations of energy expenditure may not represent the most valid method, particularly in preadolescent populations, they may constitute the only practical approach for assessing physical activity intensity in applied training settings.
Another possible explanation for the absence of maturity-related differences in heart rate–based physical activity indices is the age-related development of autonomic regulation [71]. With increasing age and training status, children typically exhibit a shift toward greater parasympathetic influence on the heart, which is often accompanied by lower resting and submaximal heart rates [26,72]. In principle, such autonomic changes could lead to an underestimation of physical activity intensity when relying on HR-based MET prediction equations that were not specifically developed for preadolescent athletes. However, in the present study, resting heart rate, heart rate variability (RMSSD), and average RR interval did not differ significantly between PHV groups. These findings suggest that, within this relatively homogeneous, trained sample of preadolescent basketball players, parasympathetic modulation at rest was broadly comparable across maturity stages. Consequently, although autonomic maturation is a plausible source of bias in HR-derived estimates of physical activity at a population level, our data do not provide direct evidence that differences in parasympathetic activity contributed to the similar distribution of time spent in light, moderate, and vigorous intensity zones observed between PHV groups. HRrest, HRV, and average RR interval indicate that resting autonomic markers alone are insufficient to explain the comparable physical activity intensity profiles across maturation stages. Future research should include more comprehensive assessments of autonomic function, such as standardized HRV recordings and heart-rate recovery following exercise, to better characterize the interaction between biological maturation, autonomic regulation, and HR-based estimates of physical activity in youth athletes.

4.4. Practical Applications

From a practical perspective, the present findings indicate that although more biologically mature players demonstrate superior physical and performance characteristics, the distribution of training intensity during basketball sessions appears comparable across maturity groups. On average, youth basketball training provided approximately two-thirds of session time at moderate-to-vigorous intensity (about 40 min per session), contributing meaningfully to the WHO recommendation of 60 min of daily MVPA. Importantly, this exposure to moderate-to-vigorous physical activity was consistent across biological maturation stages.
As physical activity among school-aged children has declined over the last few decades [9,10], structured sport participation may provide an important context for maintaining moderate-to-vigorous activity levels during early adolescence. At the same time, participation in organized basketball training alone may not always be sufficient for all players to meet daily MVPA recommendations, particularly on days with only one training session and low levels of physical activity in school or leisure time. Therefore, coaches and practitioners should view basketball training as a substantial but not exclusive source of health-enhancing physical activity and encourage additional opportunities for active play, physical education, and active transportation throughout the week.
Furthermore, coaches are encouraged to monitor training load using both internal and external metrics and to individualize training intensity based on biological maturation status. Additionally, incorporating supplementary physical activity opportunities (e.g., small-sided games, active play) may help athletes meet daily physical activity recommendations.
In addition, coaches and practitioners should also consider adapting training content according to biological maturation by manipulating task constraints, playing formats, and work–rest ratios to optimize neuromuscular loading and individual responsiveness. Such maturity-sensitive approaches may help minimize injury risk during periods of rapid growth, align training demands with biological readiness, reduce maturity-related bias in talent identification, and enhance physical literacy by fostering movement competence and confidence during a critical developmental window.

4.5. Limitations and Future Research

Although significant work has been done to control all possible errors, several limitations should be acknowledged. First, the cross-sectional design precludes causal inference regarding the effects of biological maturation on performance, internal and external load, and physical activity patterns. Second, maturity status was estimated using anthropometric equations rather than direct assessment of skeletal age, which may introduce classification error, particularly at the individual level, because the chronic distance from PHV may result in a standard error of 0,6 to 1 year, especially for less mature children [27]. Third, data were derived from a limited number of training sessions within a single competitive phase and may not fully represent habitual training and match-related activity patterns across a complete season. Although the club in which the assessment was conducted adhered to the general guidelines of the national federation, the use of a limited number of training sessions may have affected the stability of the observed activity patterns. As a result, the ecological validity of the findings may be limited. Future studies should include a greater number of training sessions or adopt longitudinal designs to provide a more representative assessment of activity patterns. Finally, the sample included only male basketball players from a specific competitive and cultural context, limiting the generalizability of the findings to females, to other sports, and to less trained populations. In addition, the inclusion of participants with at least two years of training experience and regular participation may have introduced selection bias toward more physically active or developed individuals. Furthermore, the absence of detailed control for factors such as individual participation during training sessions may have influenced the observed variability in performance and load-related measures. Additionally, no a priori sample size calculation was performed, as participant recruitment was limited to the available athletes within a single team. Although effect sizes were reported to support the interpretation of the findings, the absence of a formal power analysis may have reduced the ability to detect smaller or interaction effects, particularly in the mixed-design ANOVA models.
In addition, it should be noted that the estimation of METs based on heart rate may introduce bias in pre-adolescent populations, as the prediction equations used were not specifically developed or validated for this age group. Therefore, the classification of physical activity intensity using MET-based methods should be interpreted with caution. This limitation may have affected the accuracy of intensity classification and could partly explain the lack of significant differences observed between maturation groups. Future studies should consider the use of alternative or complementary methods, such as accelerometry or direct measurement approaches, to improve the accuracy of physical activity assessment in youth populations.
Future studies should adopt longitudinal designs to track changes in anthropometry, performance, internal and external load, and activity patterns across the growth spurt, and should incorporate biomechanical and neuromuscular assessments to better characterize adolescent awkwardness. In addition, intervention-based research examining the effects of maturity-tailored training programs on injury risk, physical activity engagement, and long-term athletic development, ideally alongside systematic monitoring of sleep, nutrition, and psychosocial factors.

5. Conclusions

The present findings indicate that more biologically mature players demonstrate superior performance in speed, strength, and power-related tasks, confirming the influence of maturation on physical and field performance outcomes. In addition, a substantial proportion of moderate-to-vigorous physical activity is accumulated during basketball training sessions, corresponding to a meaningful contribution toward daily physical activity recommendations. However, it should be emphasized that the present study assessed physical activity only during structured training sessions and therefore does not reflect total daily physical activity. Although no significant differences in physical activity intensity distribution were observed across maturation groups, this finding should be interpreted with caution. Factors such as limited statistical power, the sensitivity of heart rate– and MET-based methods in intermittent sport settings, and the use of a limited number of training sessions may have influenced the ability to detect potential differences. Overall, while organized basketball training represents an important context for accumulating health-enhancing physical activity, its contribution should be considered within the broader daily activity profile of youth athletes.

Author Contributions

Conceptualization, A.A. and A.C.; methodology, A.A., T.S., C.K., D.D., N.Z., P.F.F. and A.C.; software, N.-O.R., C.K., D.B. and D.P.; validation, A.A., T.S., C.K., D.D., N.Z., P.F.F., A.K., I.S., M.M., I.G.F. and A.C.; formal analysis, N.-O.R., D.B., D.P., D.D. and M.P.; investigation, A.A., N.-O.R., T.S., C.K., D.B., M.P., D.P., P.A. and P.F.F.; resources, A.A., T.S., C.K., D.D., N.Z., P.F.F., A.K., I.S., M.M., I.G.F. and A.C.; data curation, N.-O.R., D.B., M.P., D.P. and P.A.; writing—original draft preparation, A.A., N.-O.R., T.S., C.K. and D.B.; writing—review and editing, A.A., N.-O.R., T.S., C.K., D.B., D.D., N.Z., P.F.F., A.K., I.S., M.M., I.G.F. and A.C.; visualization, N.-O.R., D.B., D.P. and T.S.; supervision, A.C. and A.A.; project administration, A.C. and A.A. All authors have read and agreed to the published version of the manuscript.

Funding

This research received no external funding.

Institutional Review Board Statement

The study was conducted in accordance with the Declaration of Helsinki and approved by the Research Ethics Committee of Democritus University of Thrace (DUTH/EHDE/36699/257, on 25 February 2022).

Informed Consent Statement

Written informed consent has been obtained from the participants’ parents or legal guardians to publish this paper.

Data Availability Statement

The data presented in this study are available on request from the corresponding author due to privacy and ethical reasons.

Conflicts of Interest

The authors declare no conflicts of interest.

References

  1. Bull, F.C.; Al-Ansari, S.S.; Biddle, S.; Borodulin, K.; Buman, M.P.; Cardon, G.; Carty, C.; Chaput, J.-P.; Chastin, S.; Chou, R.; et al. World Health Organization 2020 Guidelines on Physical Activity and Sedentary Behaviour. Br. J. Sports Med. 2020, 54, 1451–1462. [Google Scholar] [CrossRef]
  2. Chaput, J.-P.; Willumsen, J.; Bull, F.; Chou, R.; Ekelund, U.; Firth, J.; Jago, R.; Ortega, F.B.; Katzmarzyk, P.T. 2020 WHO Guidelines on Physical Activity and Sedentary Behaviour for Children and Adolescents Aged 5–17 Years: Summary of the Evidence. Int. J. Behav. Nutr. Phys. Act. 2020, 17, 141. [Google Scholar] [CrossRef]
  3. Behrens, T.K.; Holeva-Eklund, W.M.; Luna, C.; Carpenter, D.; Tucker, E.; Field, J.; Kelly, C. An Evaluation of an Unstructured and Structured Approach to Increasing Recess Physical Activity. J. Sch. Health 2019, 89, 636–642. [Google Scholar] [CrossRef]
  4. Cocca, A.; Cocca, M.; Greier, K.; Ruedl, G. Structured and Unstructured Physical Activity Habits: A Study on Adolescents’ Motivational Characteristics for Exercising. Int. J. Adolesc. Youth 2025, 30, 2446462. [Google Scholar] [CrossRef]
  5. Silvestri, F.; Campanella, M.; Marcelli, L.; Ferrari, D.; Gallotta, M.C.; Hamdi, F.; Albuquerque, M.R.; Bertollo, M.; Curzi, D. Gross-Motor Coordination and Executive Functions Development in Soccer and Artistic Gymnastics Preadolescent Female Athletes. J. Funct. Morphol. Kinesiol. 2025, 10, 85. [Google Scholar] [CrossRef]
  6. Lloyd, R.S.; Cronin, J.B.; Faigenbaum, A.D.; Haff, G.G.; Howard, R.; Kraemer, W.J.; Micheli, L.J.; Myer, G.D.; Oliver, J.L. National Strength and Conditioning Association Position Statement on Long-Term Athletic Development. J. Strength Cond. Res. 2016, 30, 1491–1509. [Google Scholar] [CrossRef] [PubMed]
  7. Tahira, S. The Association Between Sports Participation and Physical Fitness. Int. J. Sport Stud. Health 2021, 4, 13–19. [Google Scholar] [CrossRef]
  8. Logan, K.; Cuff, S.; Council on Sports Medicine and Fitness; LaBella, C.R.; Brooks, M.A.; Canty, G.; Diamond, A.B.; Hennrikus, W.; Moffatt, K.; Nemeth, B.A.; et al. Organized Sports for Children, Preadolescents, and Adolescents. Pediatrics 2019, 143, e20190997. [Google Scholar] [CrossRef] [PubMed]
  9. Guthold, R.; Stevens, G.A.; Riley, L.M.; Bull, F.C. Global Trends in Insufficient Physical Activity among Adolescents: A Pooled Analysis of 298 Population-Based Surveys with 1·6 Million Participants. Lancet Child Adolesc. Health 2020, 4, 23–35. [Google Scholar] [CrossRef]
  10. World Health Organization. WHO Guidelines on Physical Activity and Sedentary Behaviour, 1st ed.; World Health Organization: Geneva, Switzerland, 2020. [Google Scholar]
  11. Song, Y.; Shi, C. Association between Sports Participation and Overall Health in Children and Adolescents. Complement. Ther. Clin. Pract. 2023, 51, 101718. [Google Scholar] [CrossRef]
  12. Ainsworth, B.; Cahalin, L.; Buman, M.; Ross, R. The Current State of Physical Activity Assessment Tools. Prog. Cardiovasc. Dis. 2015, 57, 387–395. [Google Scholar] [CrossRef]
  13. Ekelund, U. Moderate to Vigorous Physical Activity and Sedentary Time and Cardiometabolic Risk Factors in Children and Adolescents. JAMA 2012, 307, 704. [Google Scholar] [CrossRef]
  14. Wickel, E.E.; Eisenmann, J.C. Maturity-Related Differences in Physical Activity among 13- to 14-Year-Old Adolescents. Pediatr. Exerc. Sci. 2007, 19, 384–392. [Google Scholar] [CrossRef]
  15. DiFiori, J.P.; Güllich, A.; Brenner, J.S.; Côté, J.; Hainline, B.; Ryan, E.; Malina, R.M. The NBA and Youth Basketball: Recommendations for Promoting a Healthy and Positive Experience. Sports Med. 2018, 48, 2053–2065. [Google Scholar] [CrossRef]
  16. Basterfield, L.; Reilly, J.K.; Pearce, M.S.; Parkinson, K.N.; Adamson, A.J.; Reilly, J.J.; Vella, S.A. Longitudinal Associations between Sports Participation, Body Composition and Physical Activity from Childhood to Adolescence. J. Sci. Med. Sport 2015, 18, 178–182. [Google Scholar] [CrossRef] [PubMed]
  17. Chatzinikolaou, A.; Draganidis, D.; Avloniti, A.; Karipidis, A.; Jamurtas, A.Z.; Skevaki, C.L.; Tsoukas, D.; Sovatzidis, A.; Theodorou, A.; Kambas, A.; et al. The Microcycle of Inflammation and Performance Changes after a Basketball Match. J. Sports Sci. 2014, 32, 870–882. [Google Scholar] [CrossRef]
  18. Biino, V.; Giustino, V.; Gallotta, M.C.; Bellafiore, M.; Battaglia, G.; Lanza, M.; Baldari, C.; Giuriato, M.; Figlioli, F.; Guidetti, L.; et al. Effects of Sports Experience on Children’s Gross Motor Coordination Level. Front. Sports Act. Living 2023, 5, 1310074. [Google Scholar] [CrossRef] [PubMed]
  19. Popović, B.; Gušić, M.; Radanović, D.; Andrašić, S.; Madić, D.M.; Mačak, D.; Stupar, D.; Đukić, G.; Grujičić, D.; Trajković, N. Evaluation of Gross Motor Coordination and Physical Fitness in Children: Comparison between Soccer and Multisport Activities. Int. J. Environ. Res. Public Health 2020, 17, 5902. [Google Scholar] [CrossRef]
  20. Michalopoulou, M.; Kambas, A.; Leontsini, D.; Chatzinikolaou, A.; Draganidis, D.; Avloniti, A.; Tsoukas, D.; Michopoulou, E.; Lyritis, G.P.; Papaioannou, N.; et al. Physical Activity Is Associated with Bone Geometry of Premenarcheal Girls in a Dose-Dependent Manner. Metabolism 2013, 62, 1811–1818. [Google Scholar] [CrossRef]
  21. Madinabeitia-Cabrera, I.; Alarcón-López, F.; Chirosa-Ríos, L.J.; Pelayo-Tejo, I.; Cárdenas-Vélez, D. The Cognitive Benefits of Basketball Training Compared to a Combined Endurance and Resistance Training Regimen: A Four-Month Intervention Study. Sci. Rep. 2023, 13, 11132. [Google Scholar] [CrossRef] [PubMed]
  22. Pinilla Arbex, J.; Pérez-Tejero, J.; Van Biesen, D.; Polo, I.; Janssens, L.; Vanlandewijck, Y. Cognitive Development and Decision Making in Basketball: A Comparison between Male Players with and without Intellectual Impairment and across Different Age-Groups. J. Hum. Kinet. 2024, 93, 231–243. [Google Scholar] [CrossRef]
  23. Stojanović, E.; Stojiljković, N.; Scanlan, A.T.; Dalbo, V.J.; Berkelmans, D.M.; Milanović, Z. The Activity Demands and Physiological Responses Encountered During Basketball Match-Play: A Systematic Review. Sports Med. 2018, 48, 111–135. [Google Scholar] [CrossRef]
  24. Arrieta, H.; Torres-Unda, J.; Gil, S.M.; Irazusta, J. Relative Age Effect and Performance in the U16, U18 and U20 European Basketball Championships. J. Sports Sci. 2016, 34, 1530–1534. [Google Scholar] [CrossRef]
  25. Alexe, D.I.; Alexe, C.I.; Čović, N.; Abazović, E.; Man, M.C.; Attoh-Mensah, E.; Dragoș, O.; Čaušević, D. Anthropometric and Performance Differences Between U16 and U18 Male Basketball Players in the Post-PHV Phase. Appl. Sci. 2025, 15, 10038. [Google Scholar] [CrossRef]
  26. Malina, R.; Bouchard, C.; Bar-Or, O. Growth, Maturation, and Physical Activity; Human Kinetics: Champaign, IL, USA, 2004. [Google Scholar]
  27. Mirwald, R.L.; Baxter-Jones, A.D.G.; Bailey, D.A.; Beunen, G.P. An Assessment of Maturity from Anthropometric Measurements. Med. Sci. Sports Exerc. 2002, 34, 689–694. [Google Scholar] [CrossRef]
  28. Quatman-Yates, C.C.; Quatman, C.E.; Meszaros, A.J.; Paterno, M.V.; Hewett, T.E. A Systematic Review of Sensorimotor Function during Adolescence: A Developmental Stage of Increased Motor Awkwardness? Br. J. Sports Med. 2012, 46, 649–655. [Google Scholar] [CrossRef]
  29. Lloyd, R.S.; Oliver, J.L.; Faigenbaum, A.D.; Myer, G.D.; De Ste Croix, M.B.A. Chronological Age vs. Biological Maturation: Implications for Exercise Programming in Youth. J. Strength Cond. Res. 2014, 28, 1454–1464. [Google Scholar] [CrossRef] [PubMed]
  30. Lin, G.; Chen, J.; Yan, R.; Deng, B.; Song, W.; Guan, B.; Sun, J. Effects of Maturation Stage on Physical Fitness in Youth Male Team Sports Players After Plyometric Training: A Systematic Review and Meta-Analysis. Sports Med.-Open 2025, 11, 97. [Google Scholar] [CrossRef] [PubMed]
  31. Toselli, S.; Campa, F.; Maietta Latessa, P.; Greco, G.; Loi, A.; Grigoletto, A.; Zaccagni, L. Differences in Maturity and Anthropometric and Morphological Characteristics among Young Male Basketball and Soccer Players and Non-Players. Int. J. Environ. Res. Public Health 2021, 18, 3902. [Google Scholar] [CrossRef]
  32. Malina, R.M.; Rogol, A.D.; Cumming, S.P.; Coelho e Silva, M.J.; Figueiredo, A.J. Biological Maturation of Youth Athletes: Assessment and Implications. Br. J. Sports Med. 2015, 49, 852–859. [Google Scholar] [CrossRef] [PubMed]
  33. Retzepis, N.-O.; Avloniti, A.; Kokkotis, C.; Protopapa, M.; Stampoulis, T.; Gkachtsou, A.; Pantazis, D.; Balampanos, D.; Smilios, I.; Chatzinikolaou, A. Identifying Key Factors for Predicting the Age at Peak Height Velocity in Preadolescent Team Sports Athletes Using Explainable Machine Learning. Sports 2024, 12, 287. [Google Scholar] [CrossRef]
  34. Zhao, Y.; Wei, X.; Zhao, K. Biological Maturation, Anthropometric, and Physical Fitness Variables of Youth Breaking Athletes with Different Competition Levels. PeerJ 2025, 13, e20383. [Google Scholar] [CrossRef]
  35. Tan, B.; Hu, A.; Zheng, Y. Exploring The Physiological and Physical Basis of RPE Responses in Soccer: A Comparative Analysis of Internal and External Load Determinants Across Different Training Drills. J. Sports Sci. Med. 2025, 24, 881–890. [Google Scholar] [CrossRef] [PubMed]
  36. Conners, R.T.; Whitehead, P.N.; Dodds, F.T.; Schott, K.D.; Quick, M.C. Validation of the Polar Team Pro System for Sprint Speed With Ice Hockey Players. J. Strength Cond. Res. 2022, 36, 3468–3472. [Google Scholar] [CrossRef]
  37. Van Den Tillaar, R.; Gaustad Pettersen, F.; Lagestad, P. Reliability and Validity of Polar Team Pro Measurements in Running at Different Velocities in an Indoor Setting. Front. Sports Act. Living 2023, 5, 1165801. [Google Scholar] [CrossRef]
  38. Sandmæl, S.; Van Den Tillaar, R.; Dalen, T. Validity and Reliability of Polar Team Pro and Playermaker for Estimating Running Distance and Speed in Indoor and Outdoor Conditions. Sensors 2023, 23, 8251. [Google Scholar] [CrossRef]
  39. Ziadia, H.; Sassi, I.; Trudeau, F.; Fait, P. Normative Values of Resting Heart Rate Variability in Young Male Contact Sport Athletes: Reference Values for the Assessment and Treatment of Concussion. Front. Sports Act. Living 2023, 4, 730401. [Google Scholar] [CrossRef]
  40. Hermassi, S.; Aouadi, R.; Khalifa, R.; Tillaar, R.V.D.; Shephard, R.J.; Chelly, M.S. Relationships Between the Yo-Yo Intermittent Recovery Test and Anaerobic Performance Tests in Adolescent Handball Players. J. Hum. Kinet. 2015, 45, 197–205. [Google Scholar] [CrossRef] [PubMed][Green Version]
  41. Garber, C.E.; Blissmer, B.; Deschenes, M.R.; Franklin, B.A.; Lamonte, M.J.; Lee, I.-M.; Nieman, D.C.; Swain, D.P. Quantity and Quality of Exercise for Developing and Maintaining Cardiorespiratory, Musculoskeletal, and Neuromotor Fitness in Apparently Healthy Adults: Guidance for Prescribing Exercise. Med. Sci. Sports Exerc. 2011, 43, 1334–1359. [Google Scholar] [CrossRef]
  42. Wicks, J.R.; Oldridge, N.B.; Nielsen, L.K.; Vickers, C.E. HR Index-A Simple Method for the Prediction of Oxygen Uptake. Med. Sci. Sports Exerc. 2011, 43, 2005–2012. [Google Scholar] [CrossRef] [PubMed]
  43. Wicks, J.R.; Oldridge, N.B. How Accurate Is the Prediction of Maximal Oxygen Uptake with Treadmill Testing? PLoS ONE 2016, 11, e0166608. [Google Scholar] [CrossRef]
  44. Gerodimos, V. Reliability of Handgrip Strength Test in Basketball Players. J. Hum. Kinet. 2012, 31, 25–36. [Google Scholar] [CrossRef]
  45. Cools, A.M.; Stubbe, J.; Vanden Bosch, D.; Carlier, L.; Notable, C.; Borms, D. Reference Values and Construct Validity for 4 Upper Limb Physical Performance Tests in Junior Tennis Players. Sports Health Multidiscip. Approach 2026, 18, 22–30. [Google Scholar] [CrossRef] [PubMed]
  46. Pichardo, A.W.; Oliver, J.L.; Harrison, C.B.; Maulder, P.S.; Lloyd, R.S.; Kandoi, R. The Influence of Maturity Offset, Strength, and Movement Competency on Motor Skill Performance in Adolescent Males. Sports 2019, 7, 168. [Google Scholar] [CrossRef] [PubMed]
  47. Guimarães, E.; Maia, J.A.R.; Williams, M.; Sousa, F.; Santos, E.; Tavares, F.; Janeira, M.A.; Baxter-Jones, A.D.G. Muscular Strength Spurts in Adolescent Male Basketball Players: The INEX Study. Int. J. Environ. Res. Public Health 2021, 18, 776. [Google Scholar] [CrossRef] [PubMed]
  48. Gillen, Z.M.; Shoemaker, M.E.; McKay, B.D.; Bohannon, N.A.; Gibson, S.M.; Cramer, J.T. Influences of the Stretch-Shortening Cycle and Arm Swing on Vertical Jump Performance in Children and Adolescents. J. Strength Cond. Res. 2022, 36, 1245–1256. [Google Scholar] [CrossRef]
  49. Fernandez-Fernandez, J.; Canós-Portalés, J.; Martínez-Gallego, R.; Corbi, F.; Baiget, E. Effects of Different Maturity Status on Change of Direction Performance of Youth Tennis Players. Biol. Sport 2023, 40, 867–876. [Google Scholar] [CrossRef]
  50. Fernandez-Fernandez, J.; Canós-Portalés, J.; Martinez-Gallego, R.; Corbi, F.; Baiget, E. Effects of Maturation on Lower-Body Neuromuscular Performance in Youth Tennis Players. J. Strength Cond. Res. 2023, 37, 167–173. [Google Scholar] [CrossRef]
  51. Murtagh, C.F.; Brownlee, T.E.; O’Boyle, A.; Morgans, R.; Drust, B.; Erskine, R.M. Importance of Speed and Power in Elite Youth Soccer Depends on Maturation Status. J. Strength Cond. Res. 2018, 32, 297–303. [Google Scholar] [CrossRef]
  52. Benzo, R.M.; George, S.M.S.; Messiah, S.E.; Lovan, P.; Leite, R.; Patel, A.; Lee, T.K.; Prado, G.J. Physical Fitness Among Adolescents Who Are Hispanic With Overweight or Obesity. Pediatr. Phys. Ther. 2023, 35, 252–258. [Google Scholar] [CrossRef]
  53. Konrad, A.; Bernsteiner, D.; Reiner, M.M.; Nakamura, M.; Tilp, M. An Intense Warm-Up Does Not Potentiate Performance Before or After a Single Bout of Foam Rolling. J. Sports Sci. Med. 2022, 21, 145–152. [Google Scholar] [CrossRef]
  54. Hemmings, R.J.; Maloney, S.J. Are Coordinative Abilities Impaired during Adolescence in Academy Soccer? J. Sports Sci. 2025, 43, 1452–1461. [Google Scholar] [CrossRef] [PubMed]
  55. Gryko, K.; Adamczyk, J.G.; Kopiczko, A.; Calvo, J.L.; Calvo, A.L.; Mikołajec, K. Does Predicted Age at Peak Height Velocity Explain Physical Performance in U13–15 Basketball Female Players? BMC Sports Sci. Med. Rehabil. 2022, 14, 21. [Google Scholar] [CrossRef] [PubMed]
  56. Rodríguez-Rosell, D.; Franco-Márquez, F.; Pareja-Blanco, F.; Mora-Custodio, R.; Yáñez-García, J.M.; González-Suárez, J.M.; González-Badillo, J.J. Effects of 6 Weeks Resistance Training Combined With Plyometric and Speed Exercises on Physical Performance of Pre-Peak-Height-Velocity Soccer Players. Int. J. Sports Physiol. Perform. 2016, 11, 240–246. [Google Scholar] [CrossRef]
  57. Wachholz, F.; Tiribello, F.; Mohr, M.; Van Andel, S.; Federolf, P. Adolescent Awkwardness: Alterations in Temporal Control Characteristics of Posture with Maturation and the Relation to Movement Exploration. Brain Sci. 2020, 10, 216. [Google Scholar] [CrossRef]
  58. Borato, L.A.; Whatman, C.; Walters, S.; Read, P. What Do We Know (and Not Know) about Adolescent Awkwardness in Youth Sports? A Narrative Review. Int. J. Sports Sci. Coach. 2025, 20, 2257–2267. [Google Scholar] [CrossRef]
  59. Philippaerts, R.; Vaeyens, R.; Janssens, M.; Renterghem, B.; Matthys, D.; Craen, R.; Bourgois, J.; Vrijens, J.; Beunen, G.; Malina, R. The Relationship between Peak Height Velocity and Physical Performance in Youth Soccer Players. J. Sports Sci. 2006, 24, 221–230. [Google Scholar] [CrossRef]
  60. Beunen, G.; Malina, R.M. Growth and Biologic Maturation: Relevance to Athletic Performance. In The Young Athlete; Hebestreit, H., Bar-Or, O., Eds.; Wiley: Hoboken, NJ, USA, 2007. [Google Scholar] [CrossRef]
  61. Lloyd, R.S.; Oliver, J.L.; Hughes, M.G.; Williams, C.A. The Influence of Chronological Age on Periods of Accelerated Adaptation of Stretch-Shortening Cycle Performance in Pre and Postpubescent Boys. J. Strength Cond. Res. 2011, 25, 1889–1897. [Google Scholar] [CrossRef] [PubMed]
  62. Ben Abdelkrim, N.; Castagna, C.; Jabri, I.; Battikh, T.; El Fazaa, S.; El Ati, J. Activity Profile and Physiological Requirements of Junior Elite Basketball Players in Relation to Aerobic-Anaerobic Fitness. J. Strength Cond. Res. 2010, 24, 2330–2342. [Google Scholar] [CrossRef]
  63. Arede, J.; Freitas, T.T.; Johnson, D.; Fernandes, J.F.T.; Williams, S.; Moran, J.; Leite, N. Training Load, Maturity Timing and Future National Team Selection in National Youth Basketball Players. J. Funct. Morphol. Kinesiol. 2022, 7, 21. [Google Scholar] [CrossRef]
  64. Guimarães, E.; Ramos, A.; Janeira, M.A.; Baxter-Jones, A.D.G.; Maia, J. How Does Biological Maturation and Training Experience Impact the Physical and Technical Performance of 11–14-Year-Old Male Basketball Players? Sports 2019, 7, 243. [Google Scholar] [CrossRef] [PubMed]
  65. Arede, J.; Cumming, S.; Johnson, D.; Leite, N. The Effects of Maturity Matched and Un-Matched Opposition on Physical Performance and Spatial Exploration Behavior during Youth Basketball Matches. PLoS ONE 2021, 16, e0249739. [Google Scholar] [CrossRef] [PubMed]
  66. Towlson, C.; Salter, J.; Ade, J.D.; Enright, K.; Harper, L.D.; Page, R.M.; Malone, J.J. Maturity-Associated Considerations for Training Load, Injury Risk, and Physical Performance in Youth Soccer: One Size Does Not Fit All. J. Sport Health Sci. 2021, 10, 403–412. [Google Scholar] [CrossRef]
  67. Corder, K.; Ekelund, U.; Steele, R.M.; Wareham, N.J.; Brage, S. Assessment of Physical Activity in Youth. J. Appl. Physiol. 2008, 105, 977–987. [Google Scholar] [CrossRef]
  68. Pate, R.R. Physical Activity Assessment in Children and Adolescents. Crit. Rev. Food Sci. Nutr. 1993, 33, 321–326. [Google Scholar] [CrossRef]
  69. Hibbing, P.R.; Bassett, D.R.; Coe, D.P.; Lamunion, S.R.; Crouter, S.E. Youth Metabolic Equivalents Differ Depending on Operational Definitions. Med. Sci. Sports Exerc. 2020, 52, 1846–1853. [Google Scholar] [CrossRef]
  70. Jetté, M.; Sidney, K.; Blümchen, G. Metabolic Equivalents (METS) in Exercise Testing, Exercise Prescription, and Evaluation of Functional Capacity. Clin. Cardiol. 1990, 13, 555–565. [Google Scholar] [CrossRef]
  71. Parashar, R. Age Related Changes in Autonomic Functions. J. Clin. Diagn. Res. 2016, 10, CC11. [Google Scholar] [CrossRef] [PubMed]
  72. Armstrong, N.; Barker, A.R. Endurance Training and Elite Young Athletes. In Medicine and Sport Science; Armstrong, N., McManus, A.M., Eds.; S. Karger AG: Basel, Switzerland, 2011; Volume 56, pp. 59–83. [Google Scholar]
Figure 1. Time spent in Heart Rate (HR) Zones 1–5. Superscripts a, b, and c indicate significant differences between Groups 1 and 2, 1 and 3, and 2 and 3, respectively.
Applsci 16 03951 g001
Figure 2. Distance covered in Speed Zones 1–5. Superscript b indicates a significant difference between Groups 1 and 3, and c indicates a significant difference between Groups 2 and 3.
Applsci 16 03951 g002
Figure 3. Number of accelerations in Acceleration Zones 1–3. Superscript b indicates a significant difference between Groups 1 and 3, and c indicates a significant difference between Groups 2 and 3.
Applsci 16 03951 g003
Figure 4. Number of decelerations in Deceleration Zones 1–2 (A) and in Speed Zones 3–4 (B). Superscript b indicates a significant difference between Groups 1 and 3.
Applsci 16 03951 g004
Figure 5. Time spent in light, moderate, and vigorous intensities for the MET1 method. *: represents differences between time spent in light intensity versus moderate and vigorous intensities.
Applsci 16 03951 g005
Figure 6. Time spent in light, moderate, and vigorous intensities for the MET2 method. *: significantly different with light intensity, #: significantly different with moderate intensity.
Applsci 16 03951 g006
Figure 7. Time spent in light, moderate, and vigorous intensities for the MET3 method. *: significantly different with light intensity, #: significantly different with moderate intensity.
Applsci 16 03951 g007
Table 1. Subjects’ characteristics.
VariableMean ValueStandard Deviation
Chronological Age (y)12.250.85
Age at Peak Height Velocity (y)−1.00370.967
Height (cm)162.5610.03
Weight (kg)56.8812.87
BMI (kg/m2)21.263.13
Total Fat (kg)25.526.41
Table 2. METs calculation.
METMET FormulasExercise Intensity
MET1HRindex METs = (HRindex × 6) − 5
  • Light = MET < 3
  • Moderate = 3 < MET < 6
  • Vigorous = MET > 6
HRindex = HRa/HRrest
MET2%HRR METs = (%HRR × 0.1516) − 0.9779
  • Light = MET < 3
  • Moderate = 3 < MET < 6
  • Vigorous = MET > 6
%HRR = (HRa-HRrest)/(HRmax-HRrest) × 100
MET3%HRR < 40, 40 < %HRR <60, %HRR > 60
  • Light = %HRR < 40%
  • Moderate =40 < %HRR < 60
  • Vigorous = %HRR > 60
%HRR = (HRa-HRrest)/(HRmax-HRrest) × 100
Table 3. Descriptive characteristics by PHV stages (mean ± SD).
VariableGroup 1Group 2Group 3
Height (cm)151.90 ± 4.17162.71 ± 4.52 a174.34 ± 3.67 b,c
Sitting Height (cm)76.88 ± 1.9381.89 ± 2.60 a88.18 ± 2.82 b,c
Leg Length (cm)75.01 ± 2.8480.83 ± 3.08 a85.21 ± 2.18 b,c
Weight (kg)46.43 ± 7.5855.76 ± 9.48 a69.75 ± 9.26 b,c
BMI (kg/m2)20.10 ± 3.0721.04 ± 3.2622.79 ± 2.56 b,c
Body Fat (%)24.96 ± 6.7926.57 ± 7.7825.04 ± 4.30
Age (years)11.50 ± 0.6212.23 ± 0.64 a13.11 ± 0.34 b,c
PHV (years)−2.03 ± 0.27−1.08 ± 0.29 a0.22 ± 0.33 b,c
Note. Different superscript letters indicate significant differences between PHV categories (Bonferroni-adjusted, p < 0.05). Superscript a indicates a significant difference between groups 1 and 2, b indicates a significant difference between groups 1 and 3, and c indicates a significant difference between groups 2 and 3. BMI: Body Mass Index, PHV: Peak Height Velocity.
Table 4. Performance variables by groups (mean ± SD).
VariableGroup 1Group 2Group 3
HS-D23.87 ± 10.7727.41 ± 8.3530.16 ± 3.60 b
HS-ND23.76 ± 10.1426.00 ± 8.8328.40 ± 3.12
S-R (cm)16.36 ± 4.4917.83 ± 3.3921.38 ± 3.72 b,c
M-T (m)2.34 ± 0.172.82 ± 0.29 a3.59 ± 0.39 b,c
CMJ (cm)19.22 ± 3.6020.33 ± 4.7423.24 ± 3.85 b
CMJas (cm)23.17 ± 4.8123.51 ± 4.7026.34 ± 4.12 b
10 m Sprint (s)2.20 ± 0.132.17 ± 0.192.06 ± 0.13 b
20 m Sprint (s)3.95 ± 0.263.87 ± 0.353.63 ± 0.27 b,c
Note. Different superscript letters indicate significant differences between Groups (Bonferroni-adjusted, p < 0.05). Superscript a indicates a significant difference between Groups 1 and 2, b indicates a significant difference between Groups 1 and 3, and c indicates a significant difference between Groups 2 and 3. HS-D: Handgrip Strength Dominant hand, HS-ND: Handgrip Strength Non-Dominant hand, S-R: Sit and Reach test, M-T: Medical ball Throw, CMJ: Countermovement Jump, CMJas: Countermovement Jump with Arm Swing.
Table 5. Cardiovascular and internal load field performance variables by PHV stages (mean ± SD).
VariableGroup 1Group 2Group 3
Calories [kcal]316.64 ± 79.25379.00 ± 94.40434.76 ± 111.04 b,c
Max RR interval2098.39 ± 1099.102721.50 ± 991.102697.68 ± 1037.02
Min RR interval253.82 ± 8.28253.08 ± 7.74250.64 ± 1.29
Avg RR interval467.14 ± 91.29467.73 ± 86.51475.76 ± 105.91
HRV (RMSSD)41.89 ± 57.9143.38 ± 48.1650.88 ± 57.70
HR max [%]103.32 ± 7.86105.61 ± 7.17104.16 ± 7.58
HR max [bpm]206.50 ± 15.52210.96 ± 14.20208.28 ± 15.06
HR rest [bpm]79.43 ± 8.4281.71 ± 11.5280.40 ± 7.79
HR min [bpm]76.39 ± 35.7970.23 ± 33.7168.56 ± 33.60
HR min [%]38.39 ± 17.8935.38 ± 16.8234.56 ± 16.82
HR avg [%]71.04 ± 7.3371.85 ± 8.3072.32 ± 8.73
Training load score82.21 ± 32.0180.19 ± 30.6085.56 ± 39.93
HR avg [bpm]141.68 ± 14.62143.15 ± 16.45144.12 ± 17.26
Cardio load77.36 ± 27.6977.58 ± 27.0179.92 ± 34.05
Note: Different superscript letters indicate significant differences between PHV categories (Bonferroni-adjusted, p < 0.05). Superscripts b, and c indicate significant differences between PHV stages 1 and 3, and 2 and 3, respectively. HR: Heart Rate, RR: the time elapsed between two consecutive waves, HRV: Heart Rate Variability, RMSSD: Root Mean Square of Successive Differences.
Table 6. External load and locomotor field performance variables by PHV stages (mean ± SD).
VariableGroup 1Group 2Group 3
Average speed [km/h]2.41 ± 0.492.50 ± 0.753.35 ± 0.81 b,c
Total distance [m]2054.66 ± 436.242129.22 ± 733.372799.00 ± 915.17 b,c
Distance/min [m/min]38.52 ± 8.5940.07 ± 14.5554.57 ± 14.37 b,c
Sprints0.25 ± 0.700.65 ± 1.160.48 ± 0.87
Maximum speed [km/h]23.56 ± 2.7823.38 ± 3.0823.78 ± 3.08
Note: Different superscript letters indicate significant differences between PHV categories (Bonferroni-adjusted, p < 0.05). Superscript b indicates a significant difference between Groups 1 and 3, and c indicates a significant difference between Groups 2 and 3.
Disclaimer/Publisher’s Note: The statements, opinions and data contained in all publications are solely those of the individual author(s) and contributor(s) and not of MDPI and/or the editor(s). MDPI and/or the editor(s) disclaim responsibility for any injury to people or property resulting from any ideas, methods, instructions or products referred to in the content.