


Abstract
With the rapid evolution of urbanization and artificial intelligence technology in China, small, intelligent road sweepers have emerged as a highly promising technical solution to address urban cleaning challenges. The development and breakthrough of high-performance dust collection trays (DCT) stand as the core prerequisite for the large-scale practical application of such sweepers. Although blowing–suction integration technology theoretically offers substantial potential for improving dust removal efficiency, it has not received adequate attention in the sweeper field, particularly in the research on its application in unmanned, small-sized models. In this study, a fresh concept of an efficient DCT was proposed, and its numerical method was verified by experiment. Then, the design work for this efficient DCT was efficiently carried out by combining computational fluid dynamics (CFD) numerical simulation with response surface methodology (RSM). Finally, the influence mechanisms of three key operational parameters of nozzle airflow velocity, suction negative pressure, and vehicle travel speed on the dust removal effect were numerically investigated. The results indicated that the parameter combination of DCT with an 18° blowing angle, 20° shoulder angle, and 0.2 diameter-to-length ratio was recommended, and its dust removal efficiency could reach a peak level of 98.7% when the nozzle blowing velocity, negative pressure at suction port, and travel speed were respectively 14 m/s, −1800 Pa, and 1.4 m/s. This research provides important theoretical support and a feasible technical pathway for the design of high-performance DCTs.
1. Introduction
Driven by rapid urbanization in China, urban road networks are expanding continuously, which presents a growing challenge for cleaning work [1]. The manual sweeping method is universal but characterized by inefficiency, secondary dust, and safety hazards for workers [2]. The attraction of large auto-sweepers is constrained by their inefficient sweep-and-suction method and bulky body. The unmanned small sweeper would be a promising solution as artificial intelligence development [3], but its dust removal efficiency should be further improved, which mainly depends on its DCT. The dust removal efficiency of blowing–suction DCT should be more efficient to address road dust, but its achievements are rarely found, especially combined with unmanned small sweepers. Consequently, the attempt to design a blowing–suction DCT with good performance for the unmanned small sweeper is very necessary.
Research on DCT has always been focused on the dust absorption structure of large sweepers. Wu et al. [4] numerically analyzed the effects of negative pressure of DCT with a pure-suction structure and travel speed on the dust removal efficiency for a large-scale sweeper using a gas–solid two-phase flow model. Tai et al. [5] numerically analyzed the airflow organization of the domain under pure-suction DCT for a large sweeper and confirmed the influence of the shoulder inclination angle on dust collection performance. A structural improvement was numerically evaluated by Yang et al. [6], and the outer surface of a pure-suction DCT was redesigned into a streamlined surface. The DCT with the blowing–suction structure is relatively few, especially for unmanned small sweepers. A novel DCT structure was provided by Guo [7], which incorporated a flat, inclined nozzle for blowing and a wider suction nozzle, and its optimal performance at a jet angle of 60° was experimentally demonstrated. Numerical investigations on a dual-blower system were conducted by Fayzullayevich et al. [8], and the improvement of the dust removal efficiency using a secondary blowing airflow was experimentally confirmed. The relationship between the internal airflow organization and the cleaning performance of an L-shaped blowing–suction DCT was analyzed by Xi et al. [9] through numerical and real-vehicle studies. Furthermore, Zhang [10] analyzed the improvement structure of a central-suction with lateral-blowing device by using a two-phase flow model. The characteristics of vortex airflow in the blowing–suction sweep zone were numerically and experimentally investigated by Jing et al. [11].
The efficient design method is a precondition to obtaining an excellent DCT. RSM was used by Shu [12] to efficiently design a DCT for a large auto-sweeper, which indicated the significant advantages of RSM in solving engineering problems under multiple target variable conditions [13].
It is clear that the studies on the DCTs integrated with unmanned small sweepers for city roads have been rarely found, especially experimental results. Firstly, this paper innovatively proposes a blowing–suction DCT for unmanned small sweepers and its efficient structural design method based on CFD-RSM. Secondly, the numerical method will first be verified by a series of experiments on an existing blowing-and-suction DCT. Then, the structure of this efficient DCT will be designed by coupling the methods of CFD and RSM. Finally, the dependence of dust removal performance of an efficient DCT on operational conditions will be found. This paper will serve as an efficient solution and a theoretical basis for the future development of unmanned small, high-efficiency intelligent urban sweepers.
2. An Efficient DCT Concept and Method
2.1. An Efficient DCT Concept
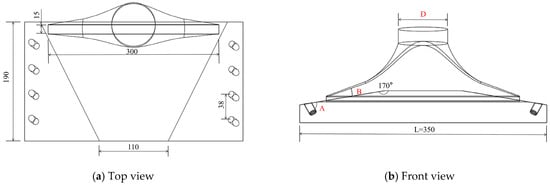
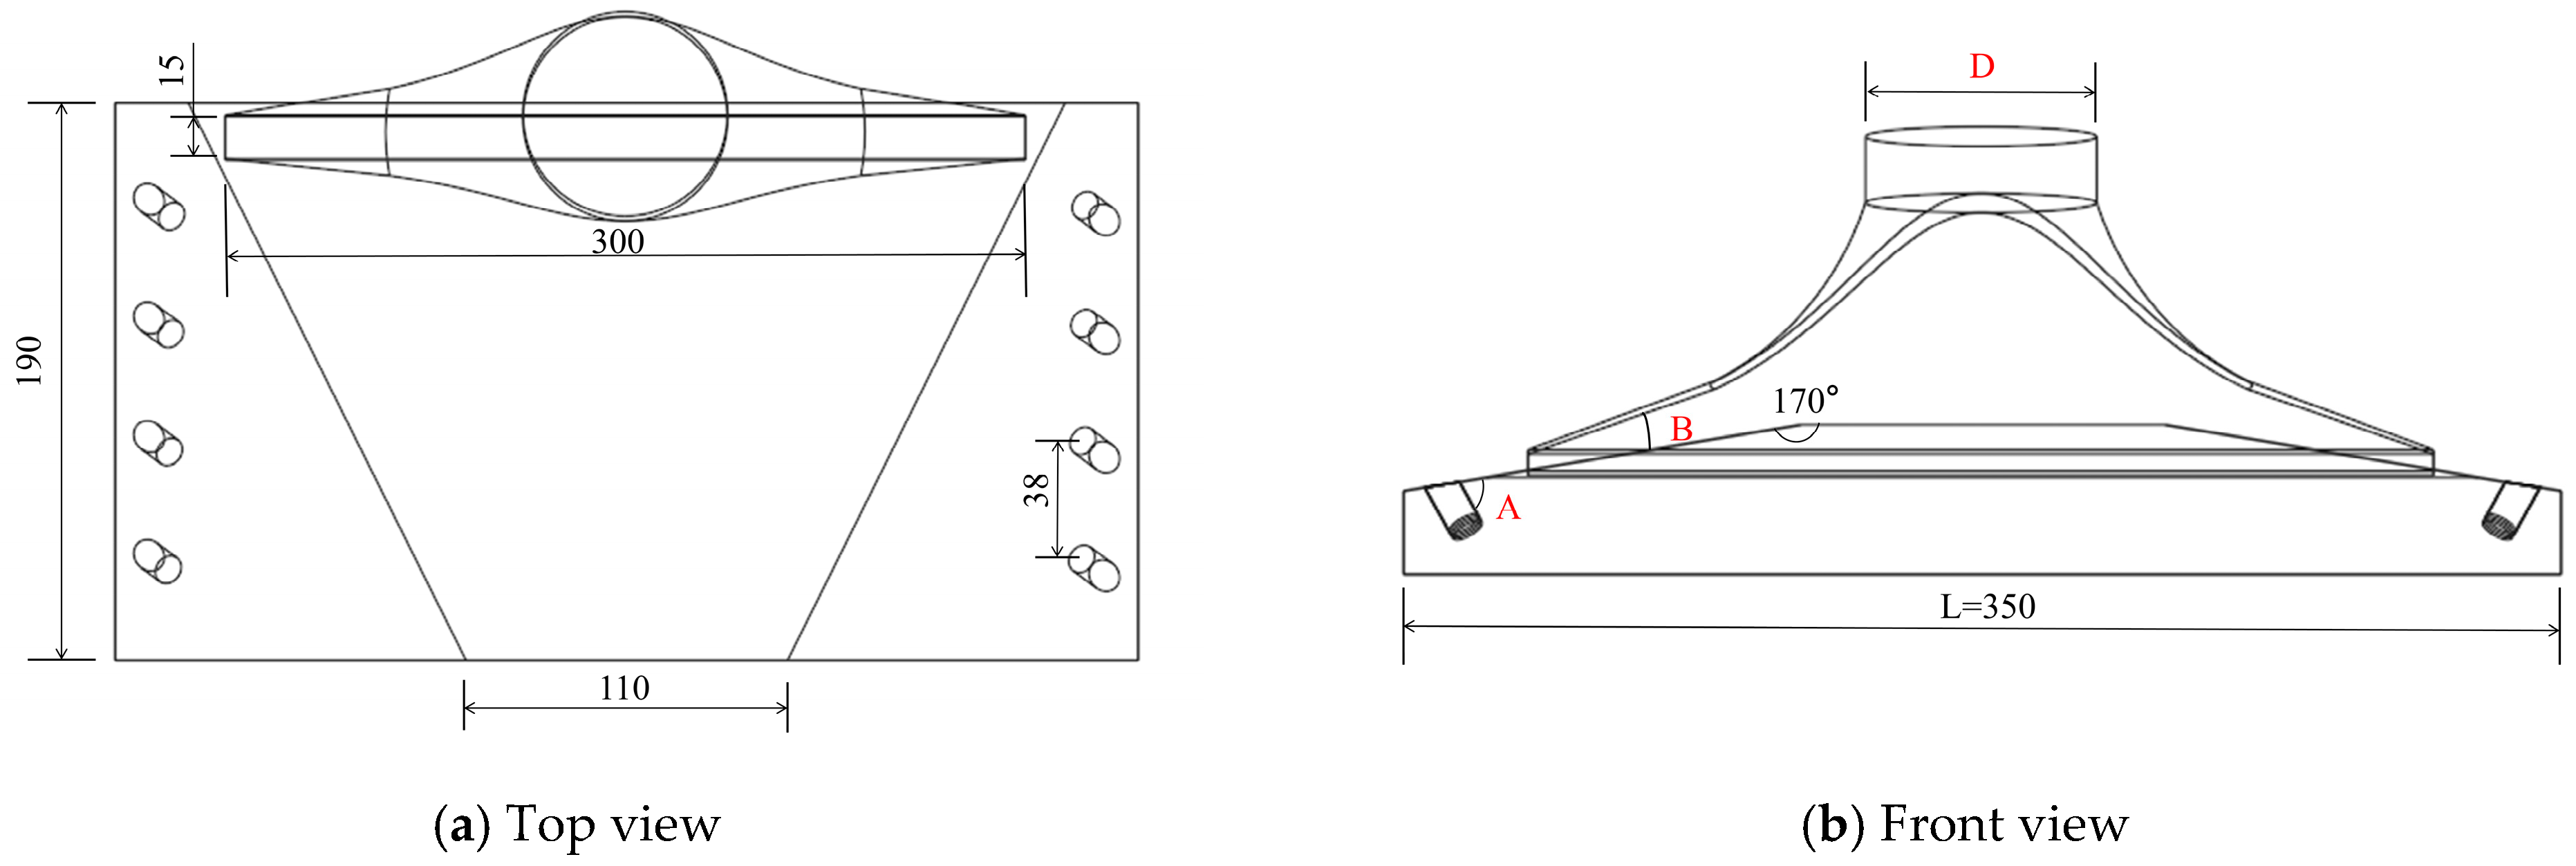
The concept of an efficient DCT shown in Figure 1 is 350 × 190 mm in size. A rear-positioned slit port is introduced in this efficient DCT, which enlarges its control width and negative pressure while reducing its cross-sectional area, compared with the DCT with the circular dust collection port in the center, improving its capture ability for particles. Eight nozzles with a nozzle diameter of 10 mm are used end-to-end to induce an organized vortex and improve the high-speed airflow effectiveness in dislodging dust. Instead of a regular shape, a streamlined upper section of the DCT is incorporated to improve pressure balance, particle rebound, and dust collection efficiency [14]. A 10 mm clearance is preserved between the fence surrounding the DCT and the ground, by which some air outside the domain will be sucked into DCT beside the airflow from the nozzles. In this structure, the nozzle inclination angle relative to the tray plane (A), the inlet shoulder angle (B), and the diameter-to-length ratio (C = D/L, where L = 350 mm) will be mainly focused on in following works.
Figure 1.
Concept of the optimized DCT.
2.2. Design Method
To transform the concept into a real DCT, the design goal is to obtain a reasonable structure–parameter combination and to find its suitable operating parameters, which is difficult work because so many parameter combinations will be attempted in turn. As a statistical modeling technique integrating mathematical, statistical, and computational approach, RSM’s core is to use quadratic polynomials to fit the nonlinear relationship between multiple factors and responses and quickly locate the optimal process/parameter combination [15]. Therefore, RSM is good at design works for multi-variable systems based on limited sample data, such as the structure design of the efficient DCT in this paper.
At first, 20 sets of A, B, and C combinations are randomly selected, and the operating conditions for structure design are determined. Second, the numerical model of the DCT corresponding to each set of A, B, and C combinations is built in turn, and the numerical method is verified. Third, the DCT performance of each model is numerically calculated using the Ansys Fluent 2022 software (CFD) in turn, and their results are exported. Fourth, the resulting data are imported into Design-Expert 13 software based on the Box–Behnken design method [13], which is one of the RSMs, to find the dependence of the dust removal efficiency on A, B, and C. Then, the reasonable combination of A, B, and C corresponding to the highest dust removal efficiency can be found. Finally, considering the dust removal efficiencies of DCT also depends on its operation conditions as well as its structure, the dust removal efficiency of the resulting DCT at various operating conditions are simulation by Ansys Fluent software in turn and calculated to look for suitable operating parameters, such as nozzle velocity, negative pressure, and sweeper speed.
In the numerical calculation process, the following assumptions are adopted: (1) No heat exchange occurs between the internal airflow and the external environment; (2) the boundary conditions are constant; (3) DCT moves at a constant velocity during operation; and (4) air is treated as an incompressible fluid.
3. CFD Numerical Model and Method
3.1. Physical Model
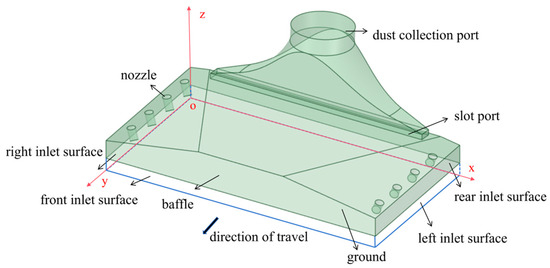
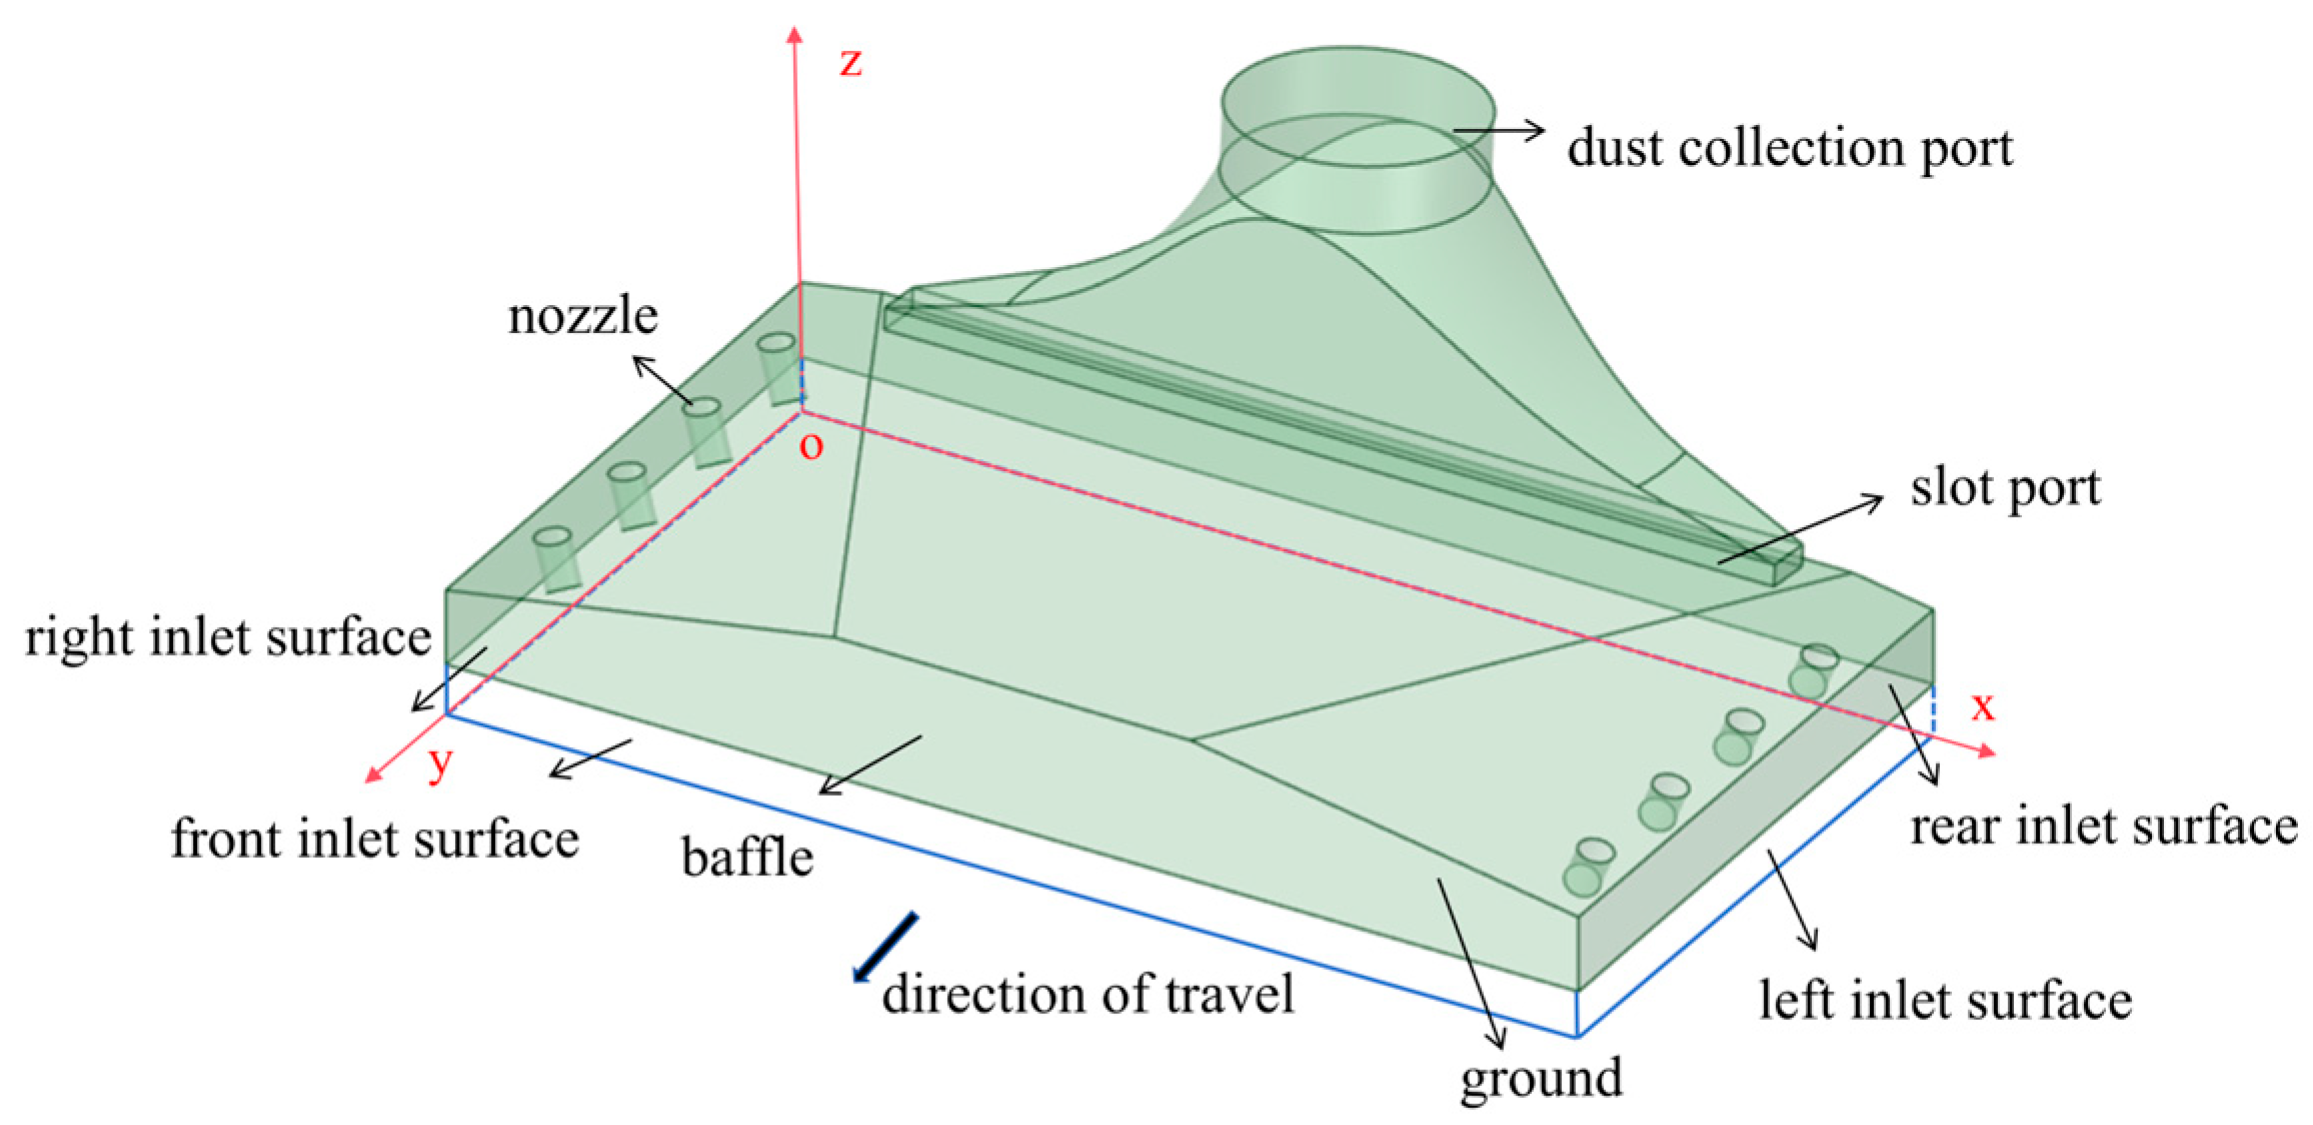
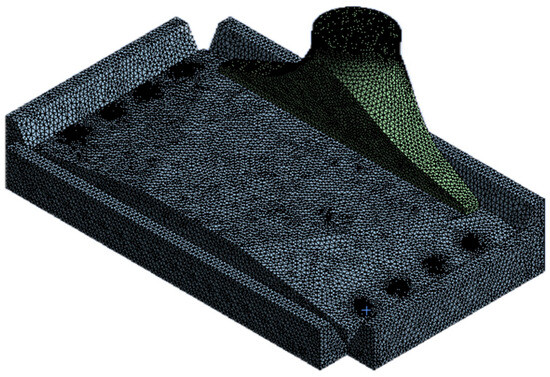
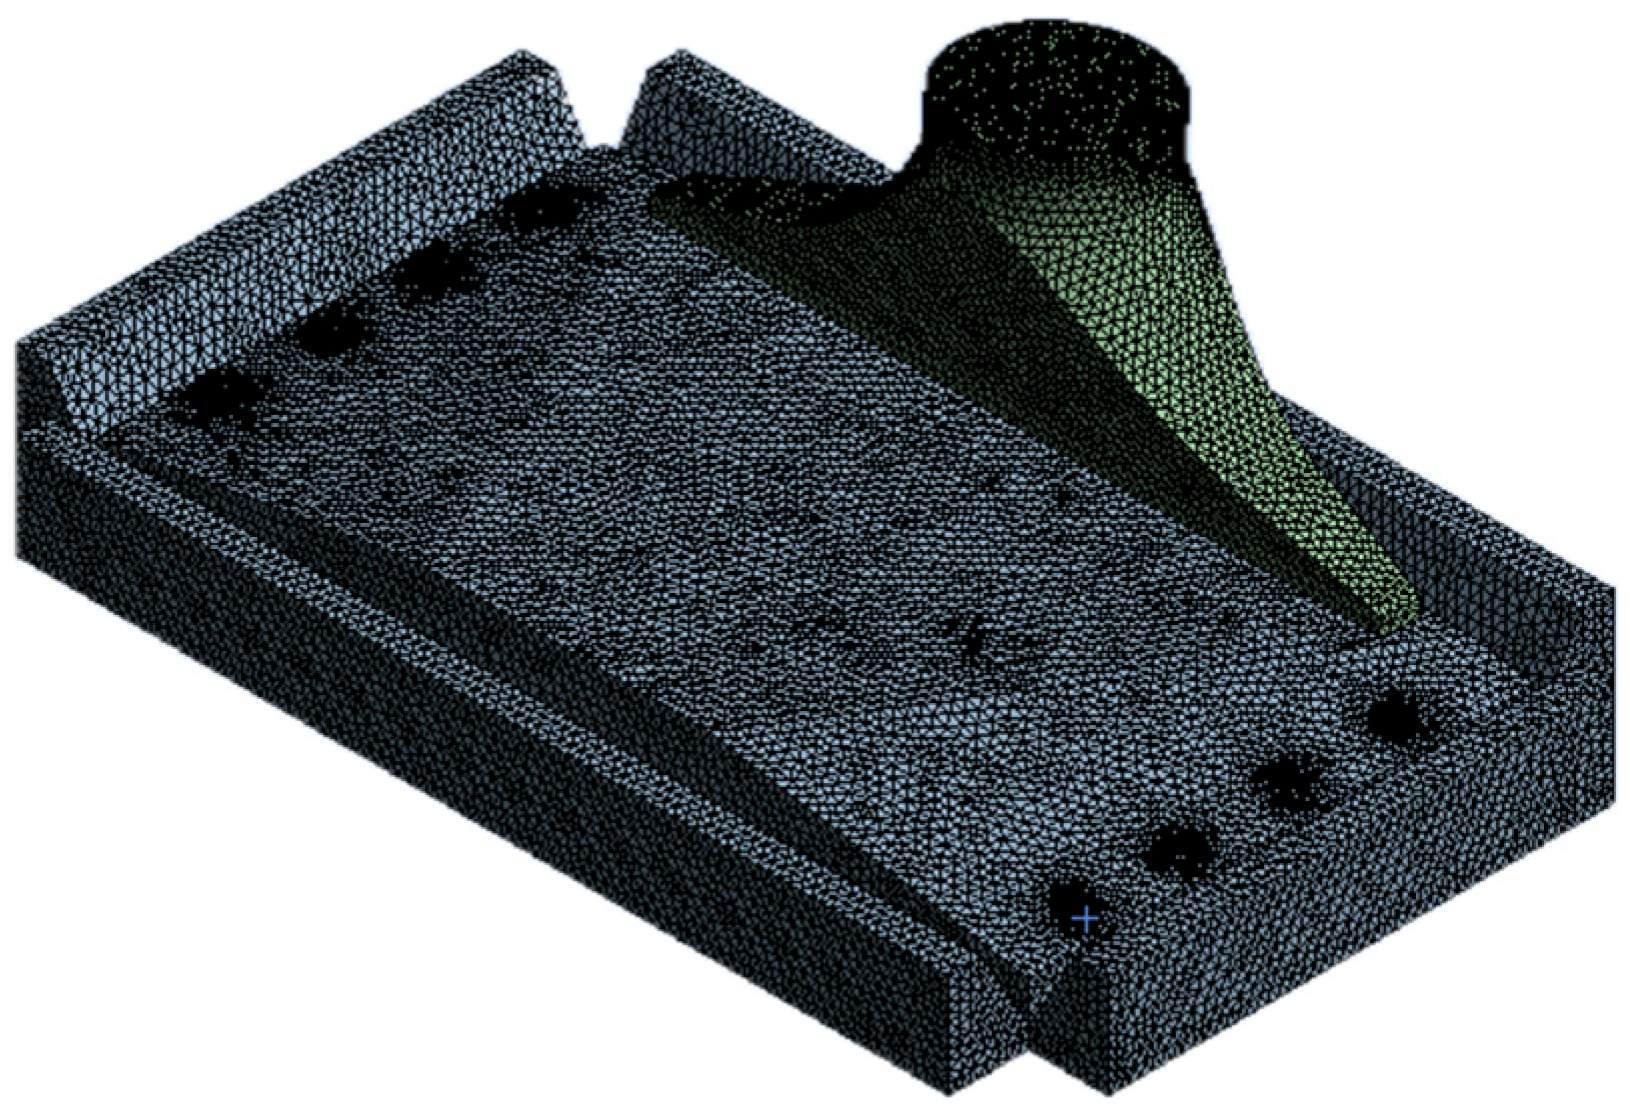
The physical model of the efficient DCT is shown in Figure 2 and Figure 3, which include a 30 mm extension outwards from the tray perimeter to ensure the stability of the entrance conditions.
Figure 2.
Physical model of the efficient DCT.
Figure 3.
Grid division of the efficient DCT.
3.2. Preparation for Dust Particle Samples
3.2.1. Particle Size Test of Dust Samples
Huang X.H. [16] offered the particle size distribution of city road dust, which directly influenced the dust removal performance of DCT. Considering the difference among cities, a verification test for the particle size distribution of road dust in Lanzhou city was carried out. The test data will be used to prepare the dust samples in the following tests and numerical calculations.
Four 200 m roads in Lanzhou City were first selected for litter sampling, including two internal roads and two external roads of the Lanzhou Jiaotong University. Second, the litter on four roads, including dust, gravel, leaves, and other particulates, were thoroughly mixed and weighed by an electronic scale (Model ACS-6, 0–6000 g, ±2 g Zhongshan Hengxin Electronics Co., Ltd., Zhongshan City, China). Then, this mixture was sieved through an 8 mm aperture filter sieve to obtain a final dust sample, which accounted for 96.6% of the mixture weight.
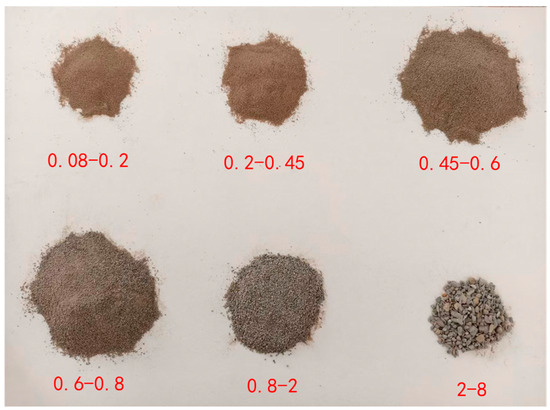
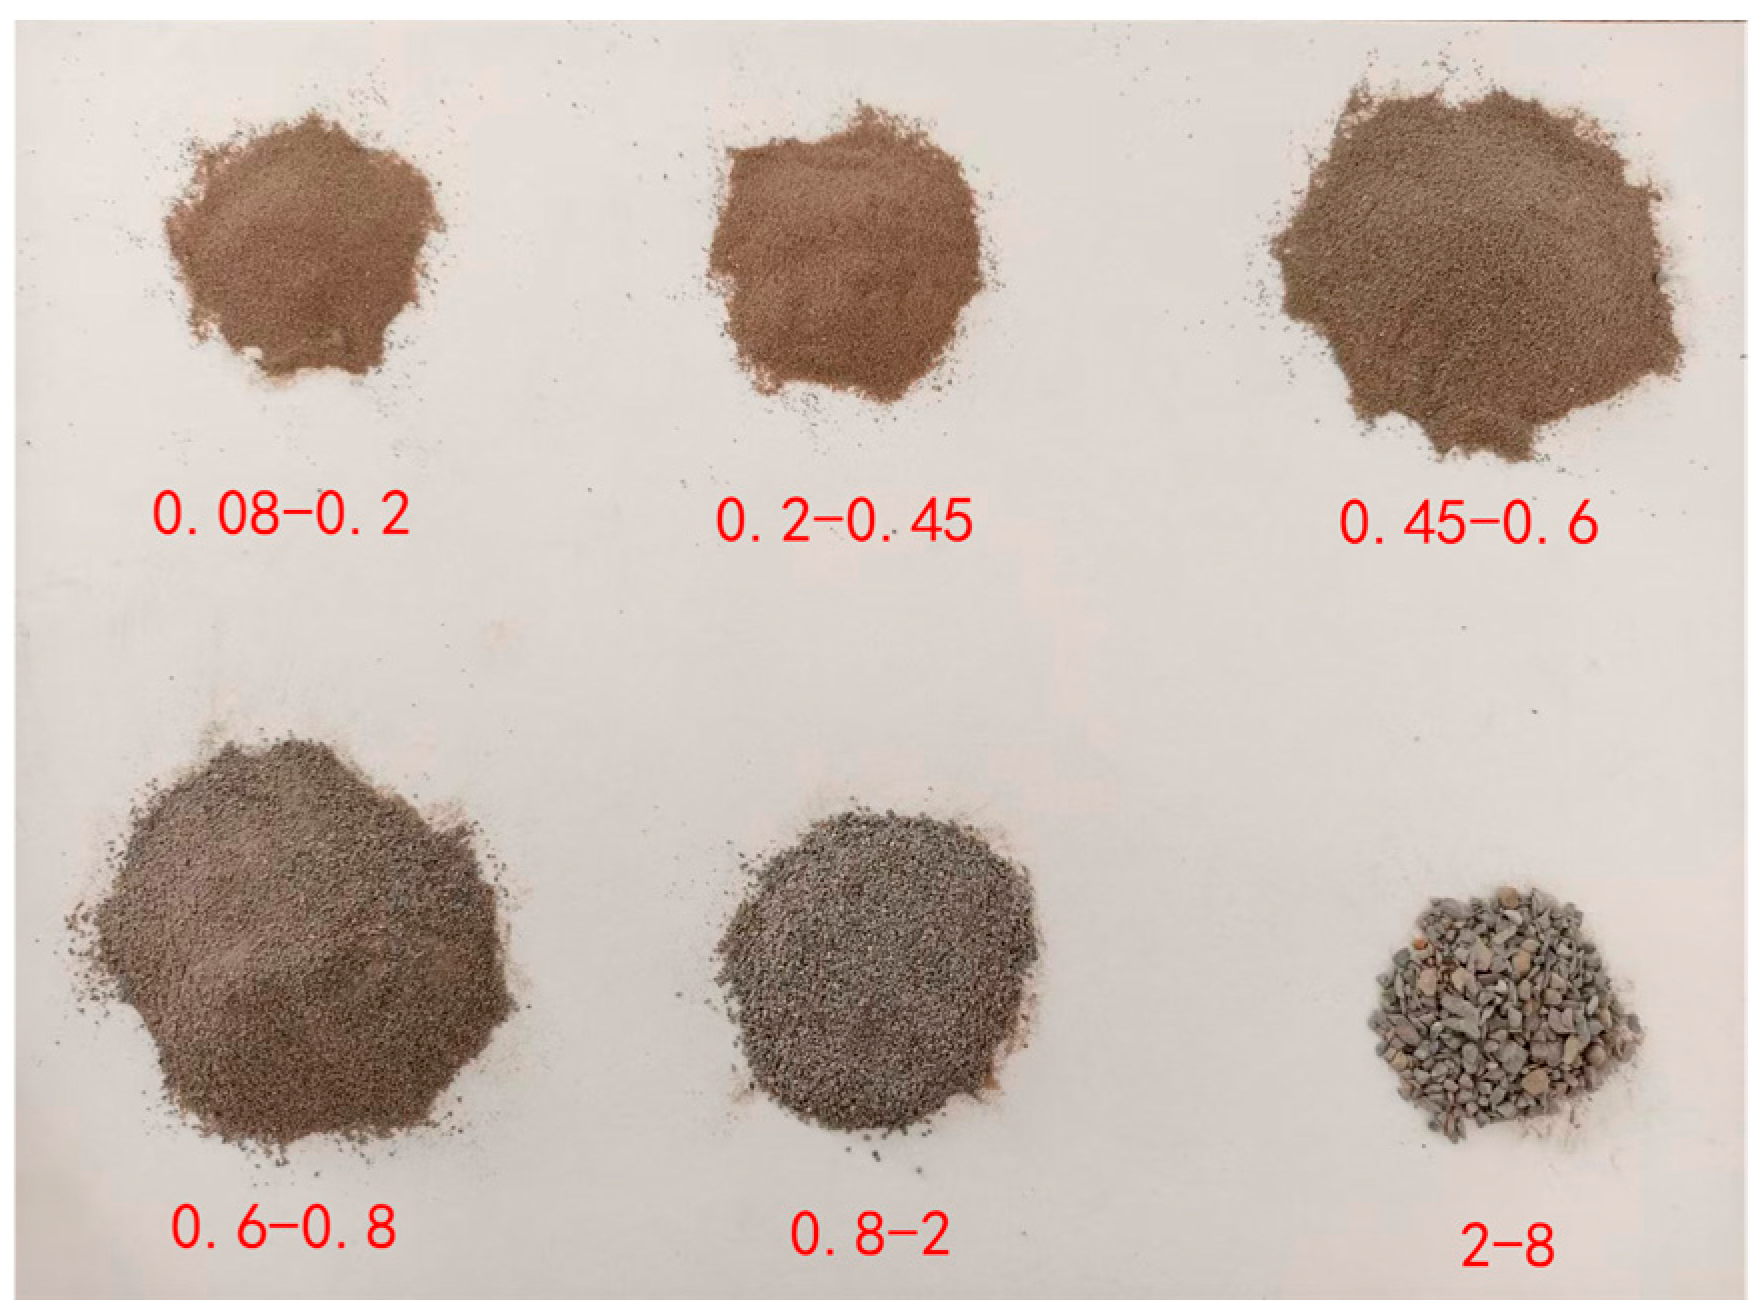
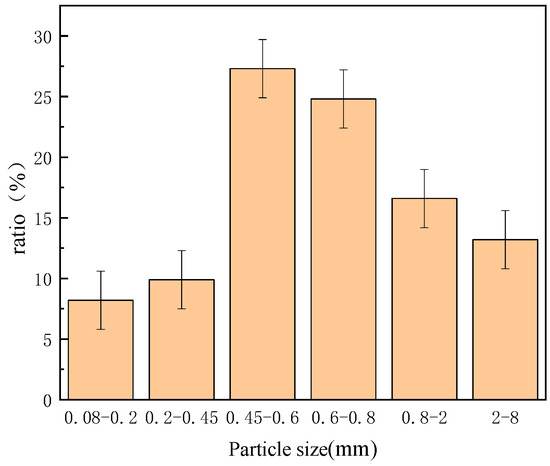
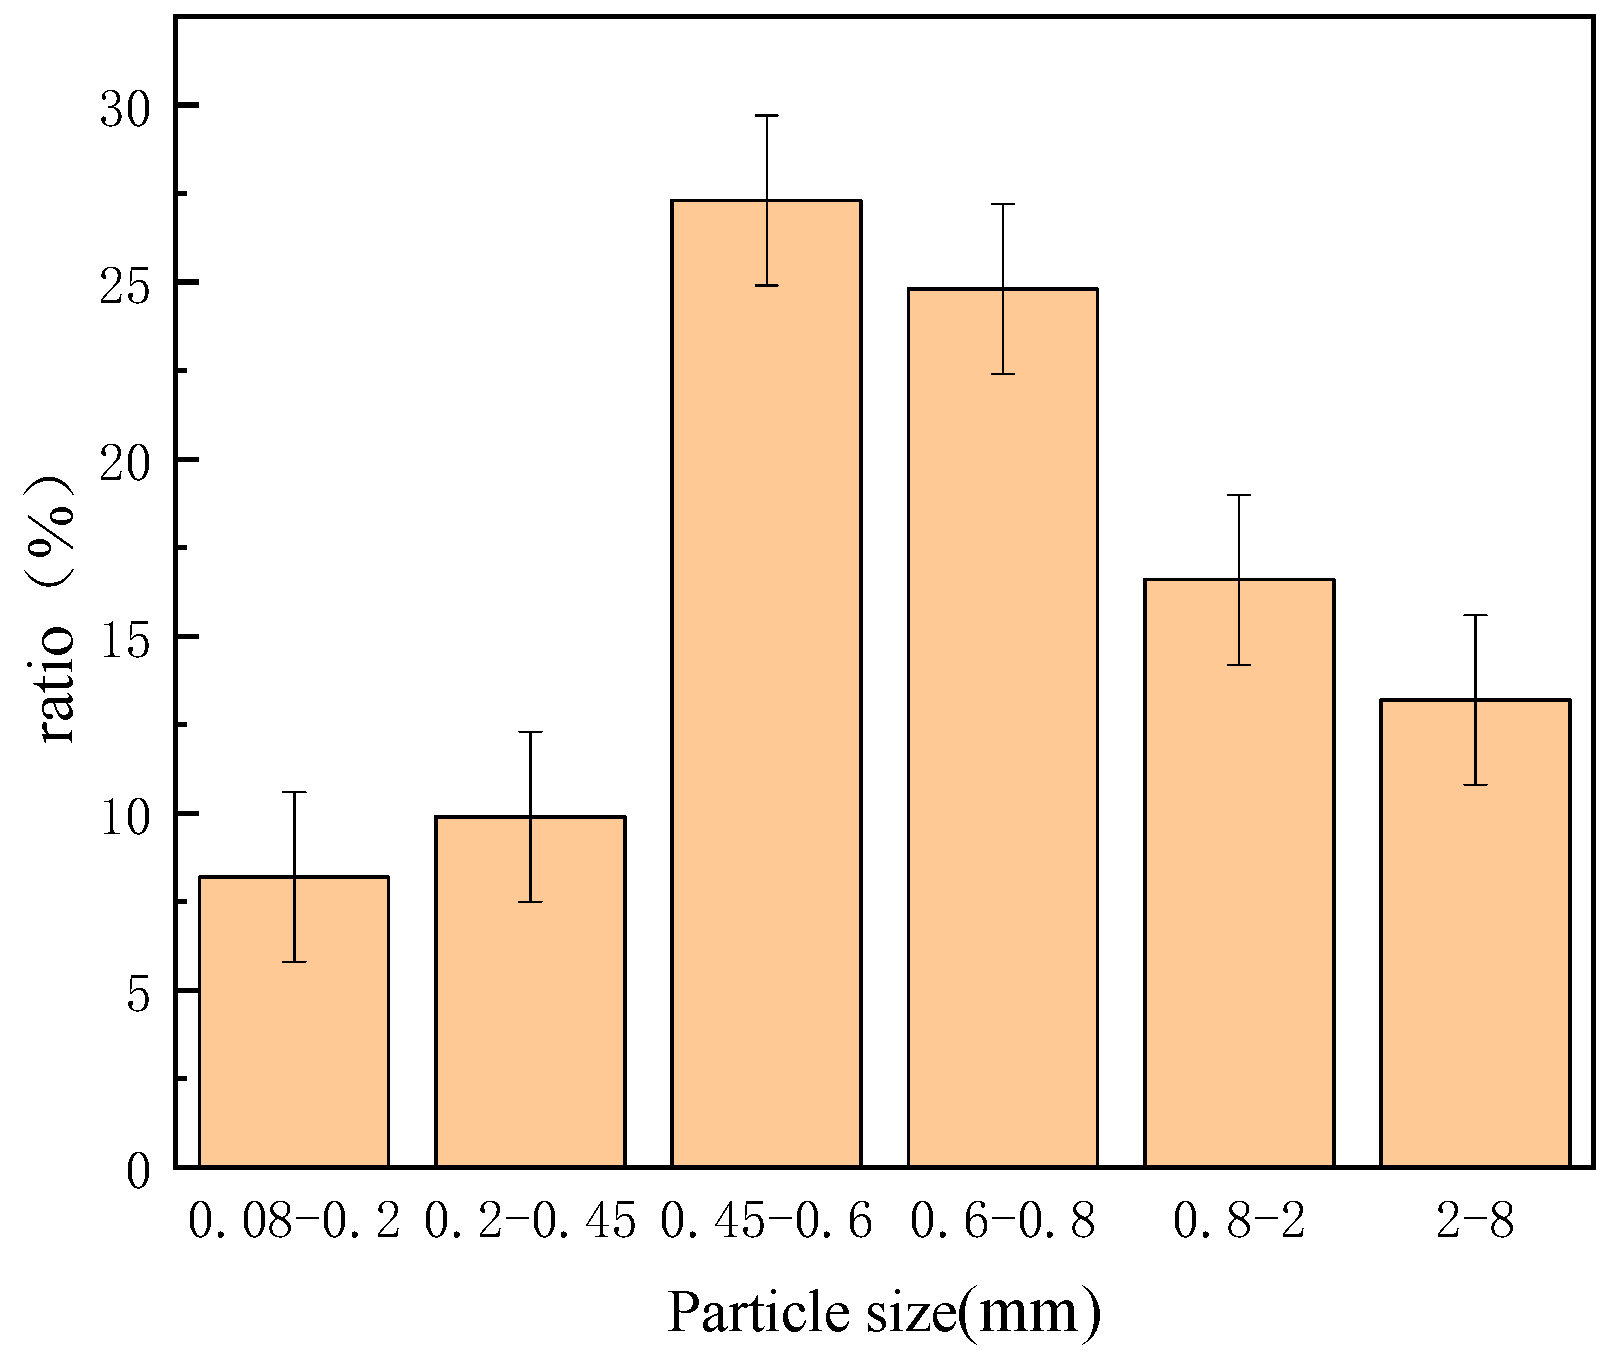
In order to classify the dust sample particles, the standard sieves with filter sieve sizes of 2 mm, 0.8 mm, 0.6 mm, 0.45 mm, and 0.2 mm (GB/T 6003.1-2022 [17], error margin < ±5%) were respectively employed in accordance with the methodology described by Huang X.H. [16]. The screening material by each sieve was weighted by a precision electronic balance (Model HZ-104/55S, 0–100 g, ±0.0001 g, Huazhi (Fujian) Electronic Technology Co., Ltd., Putian City, China). The particle photos and analyzed results are shown in Figure 4 and Figure 5. According to Equation (1) [18], the relative error of the particle classification result was less than 2.398%, of which the calculation involved δ1 = 0.4% (electronic scale), δ2 = 0.0002% (electronic balance), and δ3 = 4.99% (sieves).
Figure 4.
Classification of road dust particle size.
Figure 5.
Particle size distribution of road dust.
3.2.2. Particle Initiation Speed
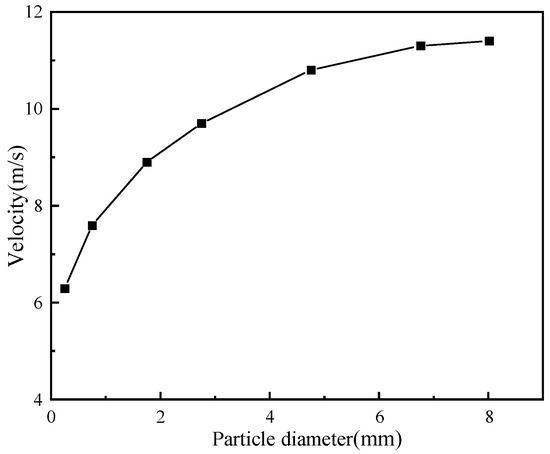
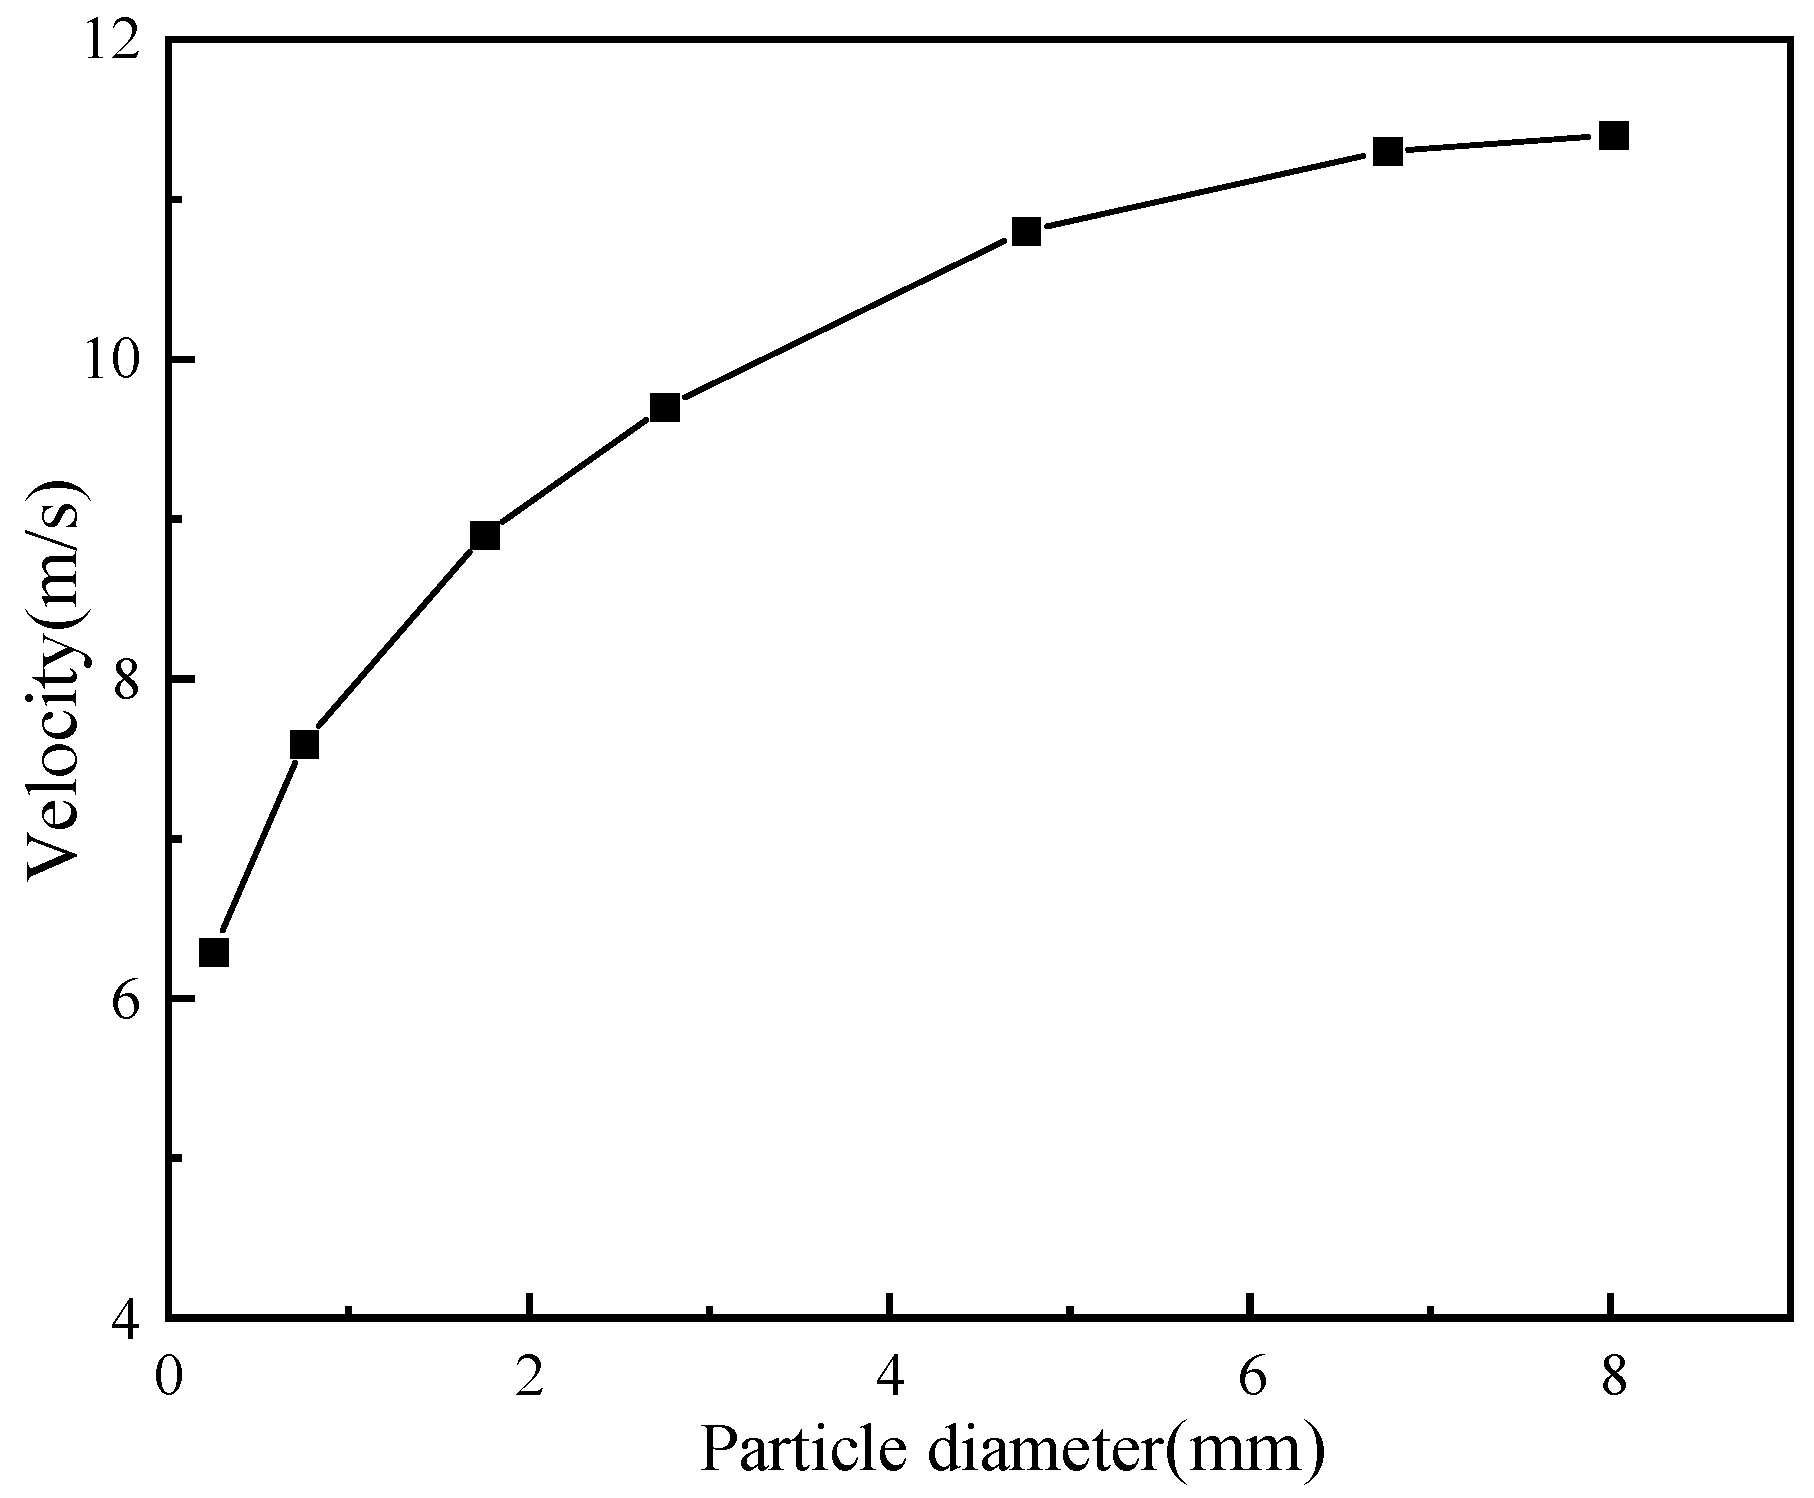
Particle initiation speed is a reference for setting the jet air velocity and blower power of the blowing–suction DCT. In this paper, Equation (2) referenced from Zhu et al. [19] was used to estimate the minimum airflow velocity to move particles in a certain size, in which the air density (ρ) of 1.225 kg/m3 and a particle density (ρp) of 1.86 t/m3 were used, based on the test above. The dependence of the particle initiation speed on particle size is presented in Figure 6.
where U is the particle initiation speed (m/s), dp is the particle diameter (m), g is the gravitational acceleration (m/s2), and a is an empirical coefficient, which depends on particle shape, diameter, and density when the particle diameter is small and can be assumed as a constant when the diameter of the spherical particle is large. In this paper, the particle diameters were between 0.2–8 mm, and their corresponding empirical coefficients (a) were between 1.04–3.26, according to Reference [20]. In fact, the accuracy of a was not needed to pay more attention because the initiation speed U calculated by Equation (2) bzdonly aimed to provide reference conditions of the subsequent experiment and numerical calculation in this paper.
Figure 6.
The start-up speed of dust particles.
3.3. Numerical Models and Methods
The finite volume method with a second-order upwind discretization scheme was employed to solve the governing equations. Because the particle volume fraction was very small (about 0.0537%), the dust airflow in this paper can be regarded as a dilute discrete phase flow; therefore, the Eulerian–Lagrangian approach was selected to simulate the gas–solid two-phase flow [21]. The SIMPLE algorithm was used to handle the pressure–velocity-coupled field in the steady-state condition. The dust-laden airflow within the cleaning zone was described by the following equations as 3-dimensional and incompressible turbulent fluid, which can be sourced from Reference [13]. As the convergence criteria, the residual values used in the numerical calculations were all set as 0.001.
(1) Continuity equation:
where ui is the fluid velocity component along the xi coordinate.
(2) Momentum equation:
where ρ is the fluid density; P is the static pressure; μ is the dynamic viscosity; g is the gravitational acceleration; and Tij = −ρuiuj is the Reynolds stress tensor.
(3) k-ε equation:
Here, k denotes the turbulent kinetic energy, ε represents the turbulent dissipation rate, σk is the turbulent Prandtl number, and Gk is the production term of k due to mean velocity gradients, σk = 1.0, C1ε = 1.44, C2ε = 1.92, and σε = 1.3.
Based on the size distribution of road dust characterized by Huang X.H. [16] and this paper, a discrete phase model (DPM) was utilized to simulate dust particle motion. The corresponding model parameters are summarized in Table 1.
Table 1.
Parameters of dust particles.
3.4. Boundary Conditions
In order to prevent unphysical influences on the internal flow field, the localized single-term approach described in Wu B. [4] was used to treat the gap between the DCT and the ground. The external boundary environment outside the computational domain was set as an atmospheric pressure inlet condition. The dust collection port was defined as the pressure outlet condition of −1800 Pa when other factors were accounted for, and the air nozzle was designated as the speed outlet condition of 14 m/s when other factors were accounted for. When the effect of vehicle speed on the collection performance was accounted for, the ground was modeled as a moving surface with programmable velocity, while DCT was stationary.
The discrete phase was initialized with zero velocity on the ground near the tray inlets. A source jet plane was defined at the inlets, 10 mm above ground surface. Particle–wall collisions (with the ground, tray enclosure, and baffles) were treated as a “rebound” condition using a restitution coefficient. The suction inlet was set to “trap” registering escaped particles as captured, while the clearance between the DCT and the ground was set to “escape” to represent uncaptured particles.
3.5. Assessment of Regional Discretization and Mesh Independence
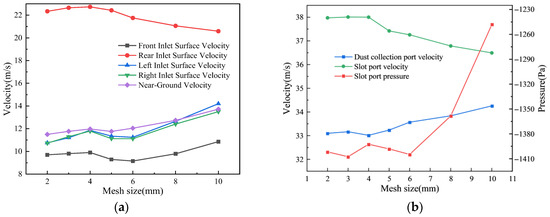
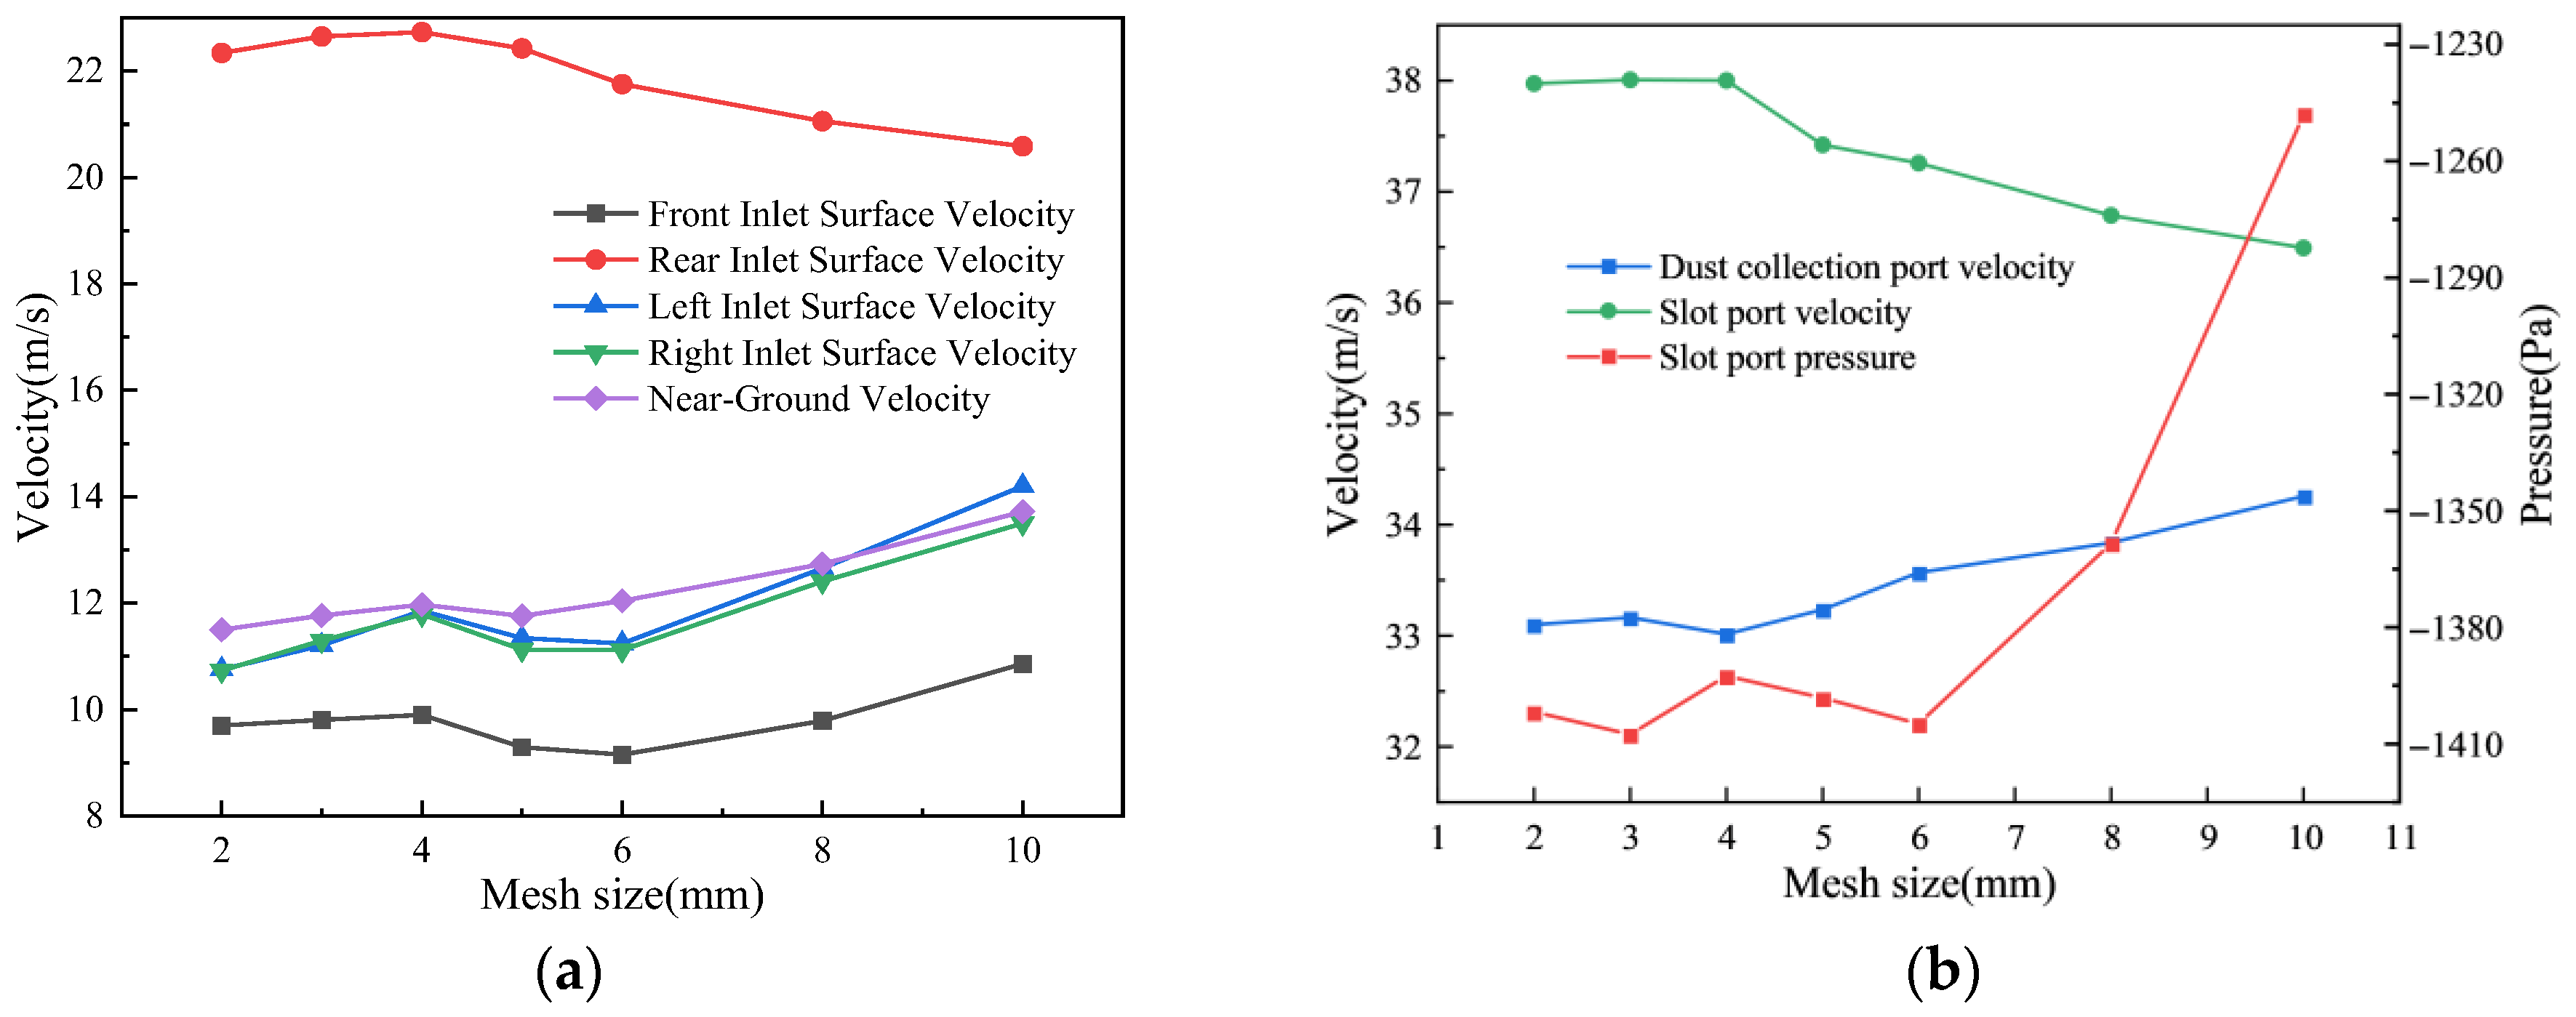
Figure 3 shows that an unstructured mesh system was applied to discretize the computational domain of DCT. Mesh independence was assessed by monitoring the average velocities at the cleaning zone inlet and the dust collection port, together with the system pressure drop [9]. In this assessment process, A, B, and C were assumed as 20°, 20°, and 0.17. The results obtained from several mesh systems are compared in Figure 7. The results indicated that the calculation results were almost independent from the mesh size when the mesh size was less than 4 mm. Therefore, in order to balance computational accuracy and resource efficiency, a mesh system with a size of 4 mm was adopted in the subsequent simulation, and local refinement in regions with large velocity gradient was applied with a 2 mm sized mesh, such as near the dust collection port and air outlet. The final mesh system consisted of 15,976 nodes and 81,687 elements.
Figure 7.
Independence assessment of DCT. (a) Inlet face and near-ground area. (b) Dust collection port and slot port.
3.6. Model and Method Validation
3.6.1. Experimental Setup
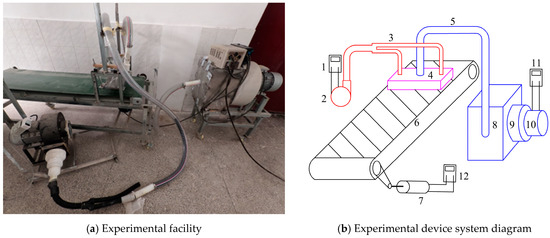
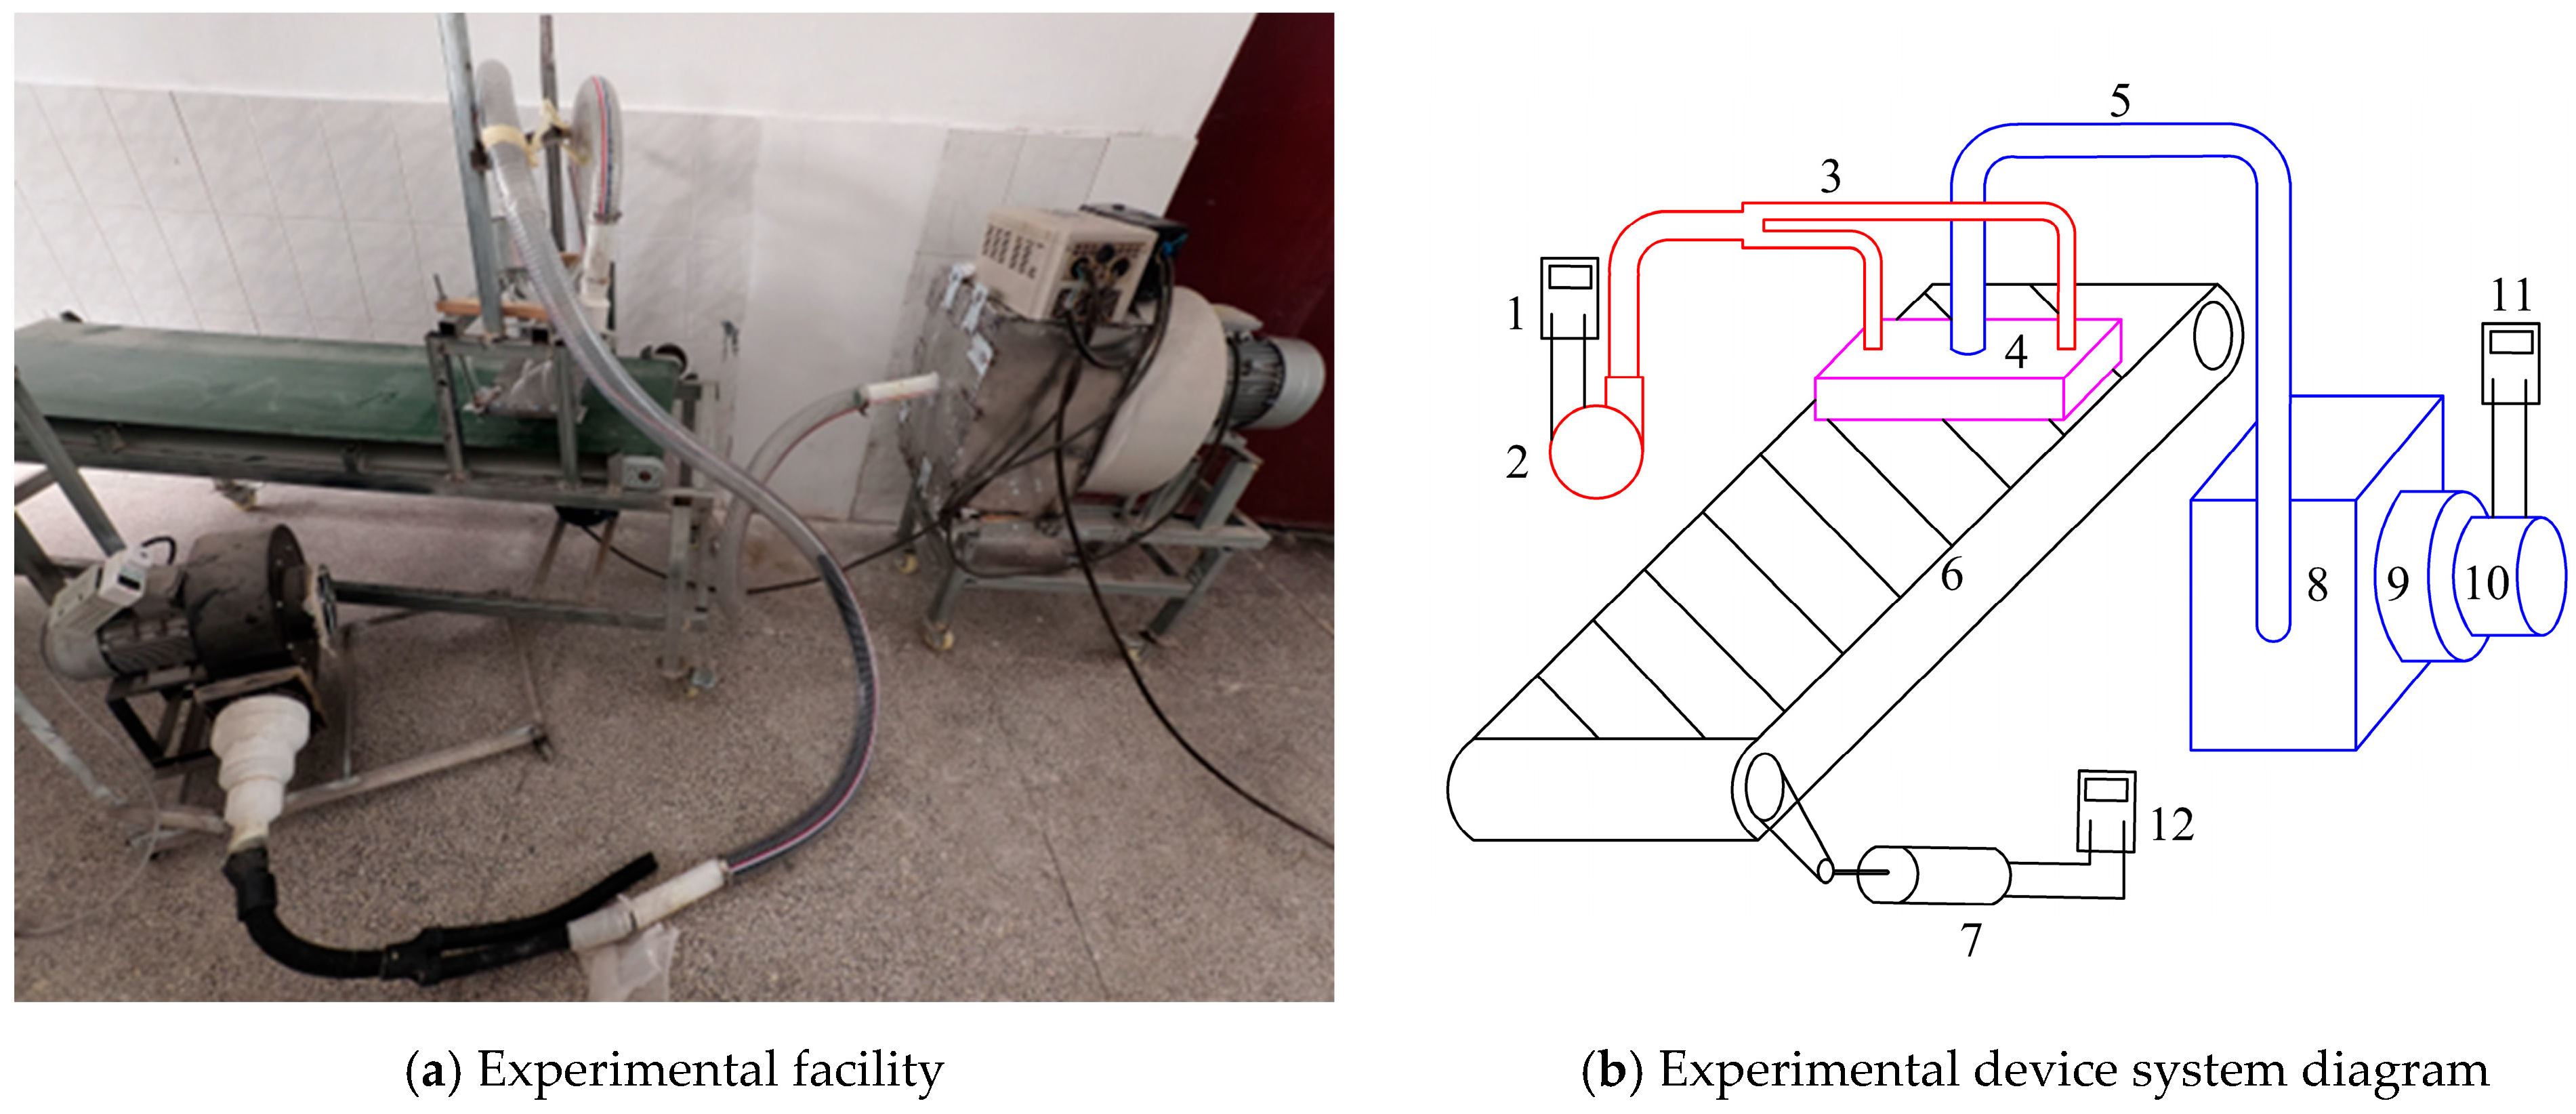
In order to verify the numerical model and method focused on in this paper, a test bench shown in Figure 8 was constructed, by which the airflow parameters in the cleaning zone could also be characterized. The bench comprised of the dust feeding system, the air blowing system, the sir suction system, and the data acquisition system. The equipment specifications are detailed in Table 2, and the feeding speed of dust and the airflow were all adjustable. During the experimental process, the prefabricated dust samples were provided to the DCT by the conveyor at a constant speed. The high-velocity airflow was delivered to the DCT nozzles, and then, swirling airflow formed in the cleaning zone blew up dust particles at certain sizes. Simultaneously, with the help of high vacuum provided by an exhaust fan, the dust-laden air was drawn in the suction port, and then, with the help of the filter in the collection chamber, the dust particles were removed. In order to decrease the influence of external air through the gap on the negative pressure of DCT and at the same time, ensure the passability of the tested sweeper, the gap between the conveyor surface and the baffles surrounding DCT was set as 10 mm.
Figure 8.
Experimental system. 1. Power meter. 2. Blowing fan. 3. Ventilation duct. 4. DCT. 5. Dedusting duct. 6. Conveyor belt, 7. Motor. 8. Dust hopper. 9. Filter element. 10. Suction fan. 11. Inverter. 12. Fan inverter.
Table 2.
Parameters of experimental equipment.
In addition, the instruments employed in this study also included a hot-wire anemometer (Model SG21, 0–80 m/s, ±1.5%, Taishi Electronic Industry Co., Ltd., Guangzhou, China, Aria Tech (Suzhou) Co., Ltd., Suzhou City, China), a micro-manometer (Model GM510, ±10 kPa, ±0.3%, Shenzhen Jumayuan Technology Co., Ltd., Shenzhen City, China), an electronic balance (Model HZ-104/55S, 0–100 g, ±0.0001 g), a power meter (Model P08S-10A, 0–3250 W, ±0.1 W, Ningbo High-tech Zone Xin Cheng Electronics Co., Ltd., Ningbo City, China), and a stopwatch (Model XL-011, 0–1 h, 0.01 s, Shenzhen Dingershi Electronics Co., Ltd., Shenzhen City, China). After system stabilization, the average value of three consecutive readings at 5 s intervals was recorded.
3.6.2. The Tested DCT
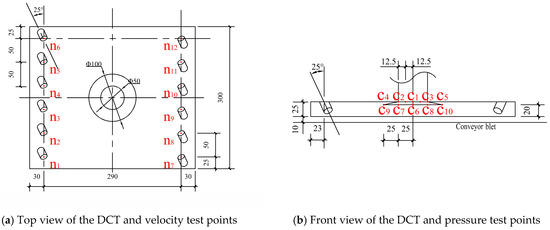
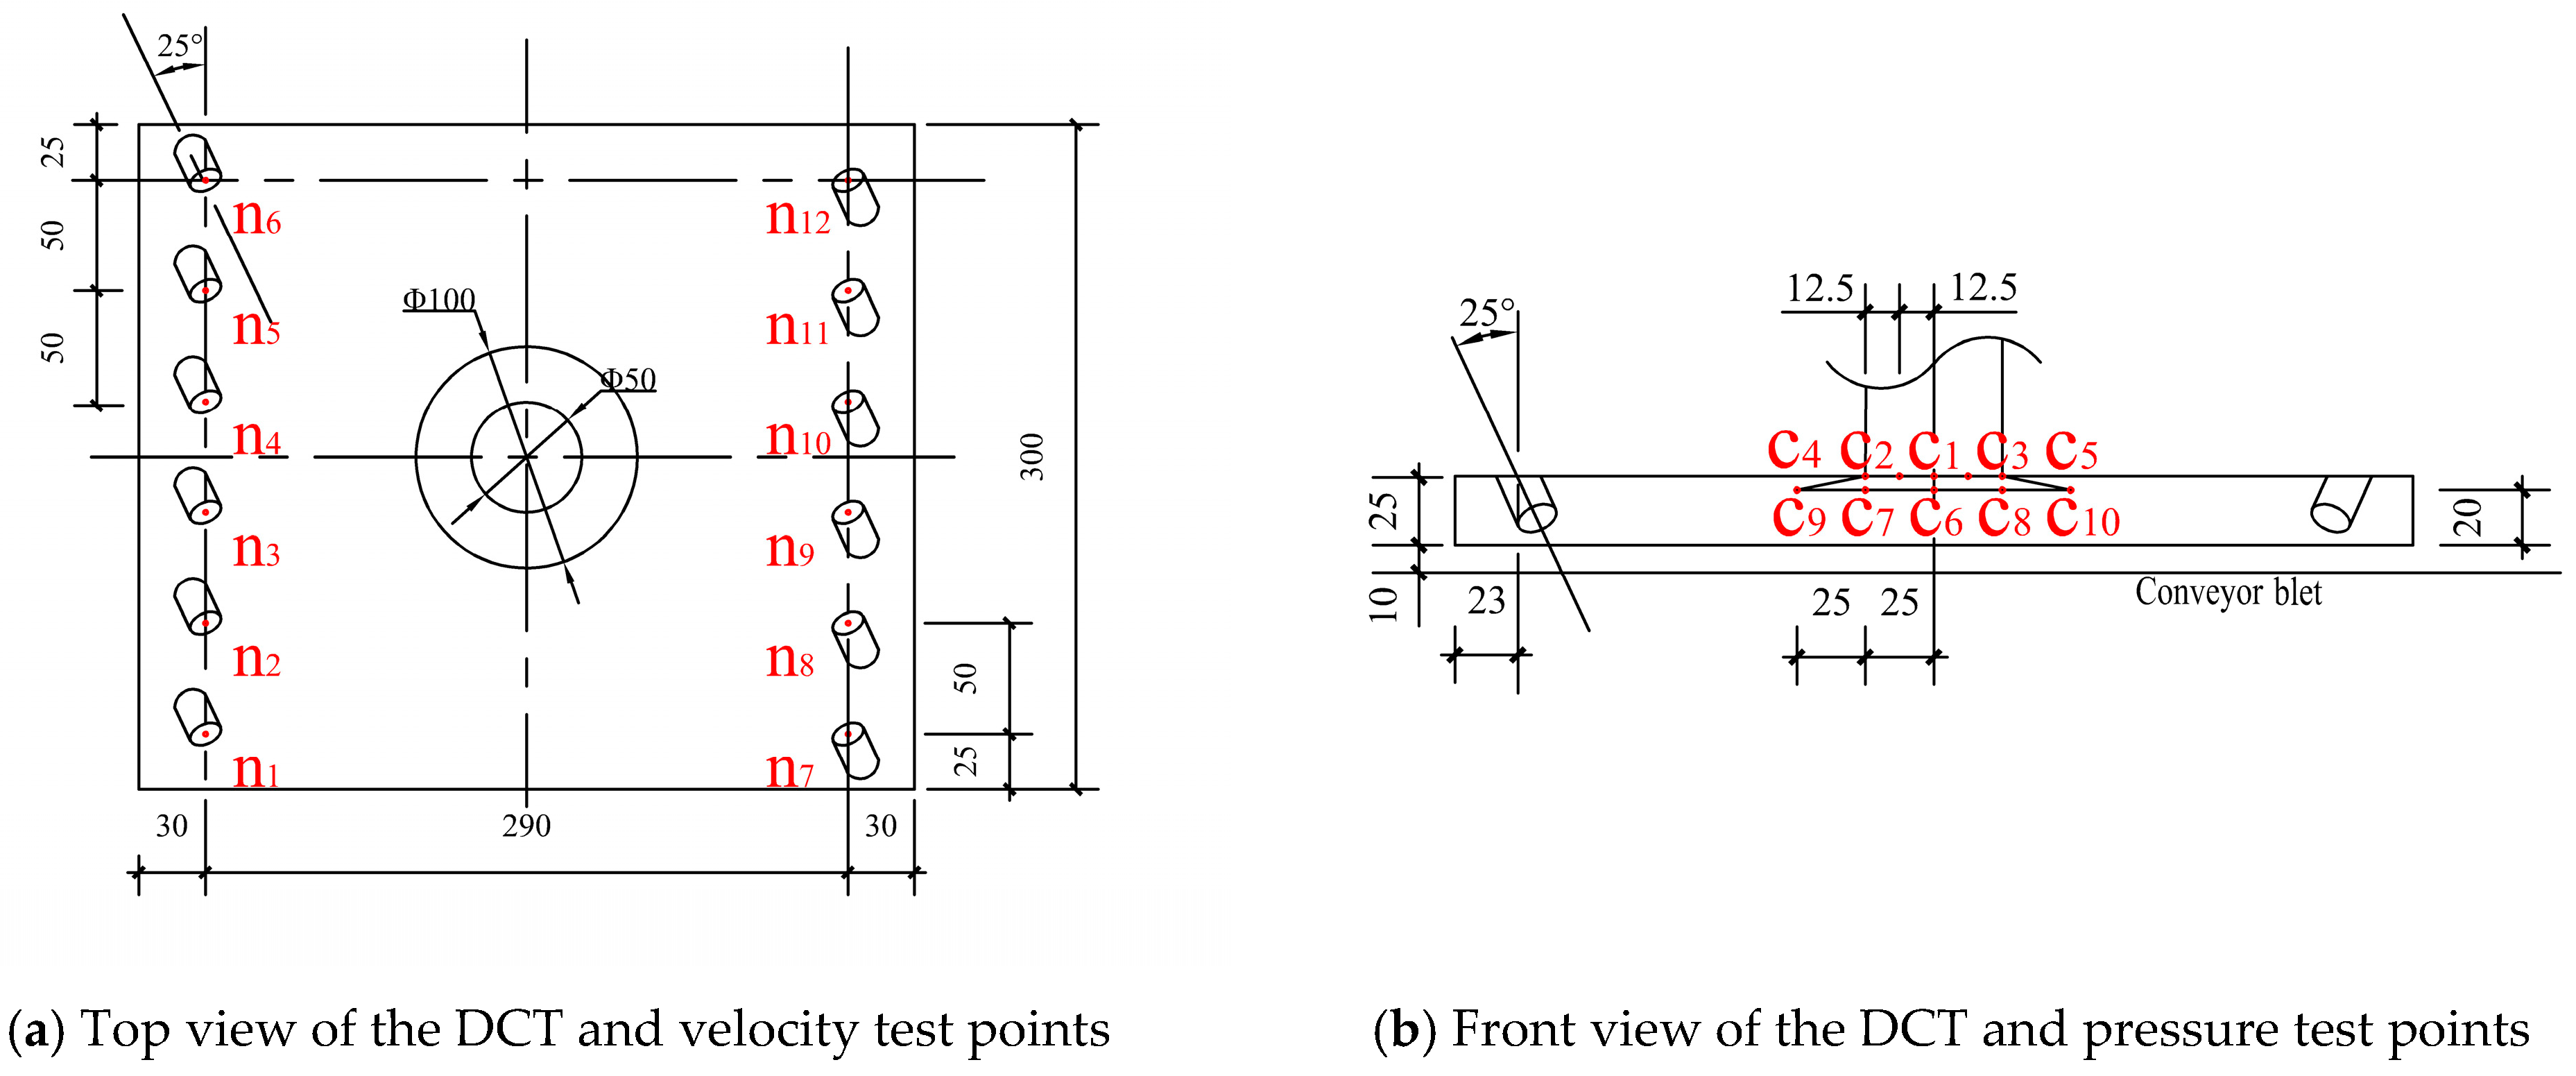
Because the particles were blown up at first and then sucked away, it was easier to be collected, and the blowing–suction method would be more efficient for removing dust than only the vacuum method. An existing blow–suction DCT illustrated in Figure 9 was focused on by our team, which featured a circular suction port at its center and twelve inclined blowing nozzles along both sides. Dai G.M. [22] offered a reference of the value ranges of the parameters of the DCT, which were different from those of this paper, with a circular suction in its middle, and a nozzle angle range of 10–30°, port shoulder angle of 10–30°, diameter-to-length ratio of 0.17–0.23, suction fan power of 1100 to 1350 W, blowing fan power of 200 to 300 W, and travel speed of the sweeper of 1.3 m/s were proposed. This configuration induced some vortex airflows in the cleaning zone to enforce dust particles into the suction port and thereby improved dust removal efficiency. The existing DCT in this paper was dimensioned at 350 mm × 300 mm. A cone-shaped suction port was at the tray center, with a lower mouth diameter of 100 mm and an upper opening diameter of 50 mm, and twelve nozzles with a diameter of 15 mm were arranged on both columns.
Figure 9.
Existing DCT and measurement point locations.
In order to easily obtain its performance by test, Figure 9a shows the locations of twelve velocity measurement points (n1–n12) at twelve blowing ports, which were 25 mm from the ground. Figure 9b shows the locations of ten pressure measurement points at the suction port. The points c1–c5 in the upper cross-section were 35 mm from the ground, and the points c6–c10 in the lower cross-section were 30 mm from the ground.
3.6.3. Experimental Results and Analysis
Four experimental conditions of X1/220 W, X2/260 W, X3/300 W, and X4/340 W were obtained by adjusting the blower power. After each condition stabilized, the pitot tube(TES-1340, 0-50m/s, 0.01m/s, Guangzhou Zhongyu Wang Electronic Technology Co., Ltd., Guangzhou City, China) was used to test the velocity at nozzle port in turn, and the velocity of each nozzle (n1–n12) was obtained by averaging three measurements, which were 6.35 m/s, 7.33 m/s, 8.65 m/s, and 10.14 m/s, respectively, corresponding to the four power conditions.
Four experimental conditions of Y1/800 W, Y2/900 W, Y3/1000 W, and Y4/1100 W were obtained by adjusting the suction fan power. After each condition stabilized, the differential pressure gauge (GM520, ±35 kPa, 0.01 kPa, Shenzhen Jumayuan Technology Co., Ltd., Shenzhen City, China) was used to test the negative pressure of each point at the dust collection port in turn, and the pressure of each point (c1–c10) was obtained by averaging three measurements. Among four conditions, the negative pressure of the Y4 condition was the greatest one, whose average value at the upper cross-section (section of c1–c5) was −1760 Pa and that at the lower cross-section (section of c6–c10) was −1024 Pa.
By cooperatively adjusting the blower power and the suction fan power, the sixteen experimental conditions combining blowing–suction were obtained. When the conveyor speed was kept at 1.3 m/s, referenced from Dai [22], the dust sample on the city road was released in a mass of 10 g on the conveyor, and the dust mass captured in the dust collection box was weighted by the precision electronic balance (Model HZ-104/55S, 0–100 g, ±0.0001 g). The same test work was repeated three times, and the corresponding dust collection efficiencies Y were obtained according to Equation (7).
where M1 denotes the mass of particles captured by the suction nozzle, and M2 represents the total mass of particles in the computational domain.
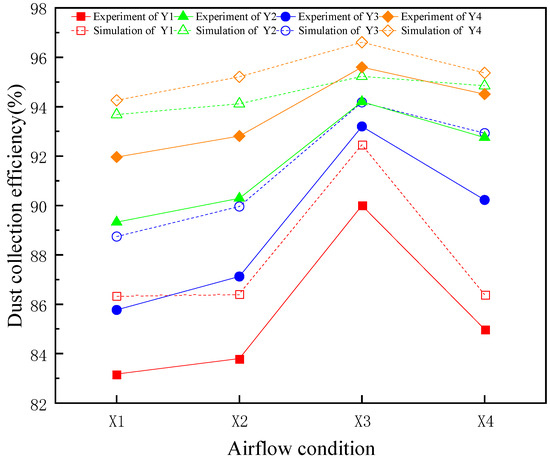
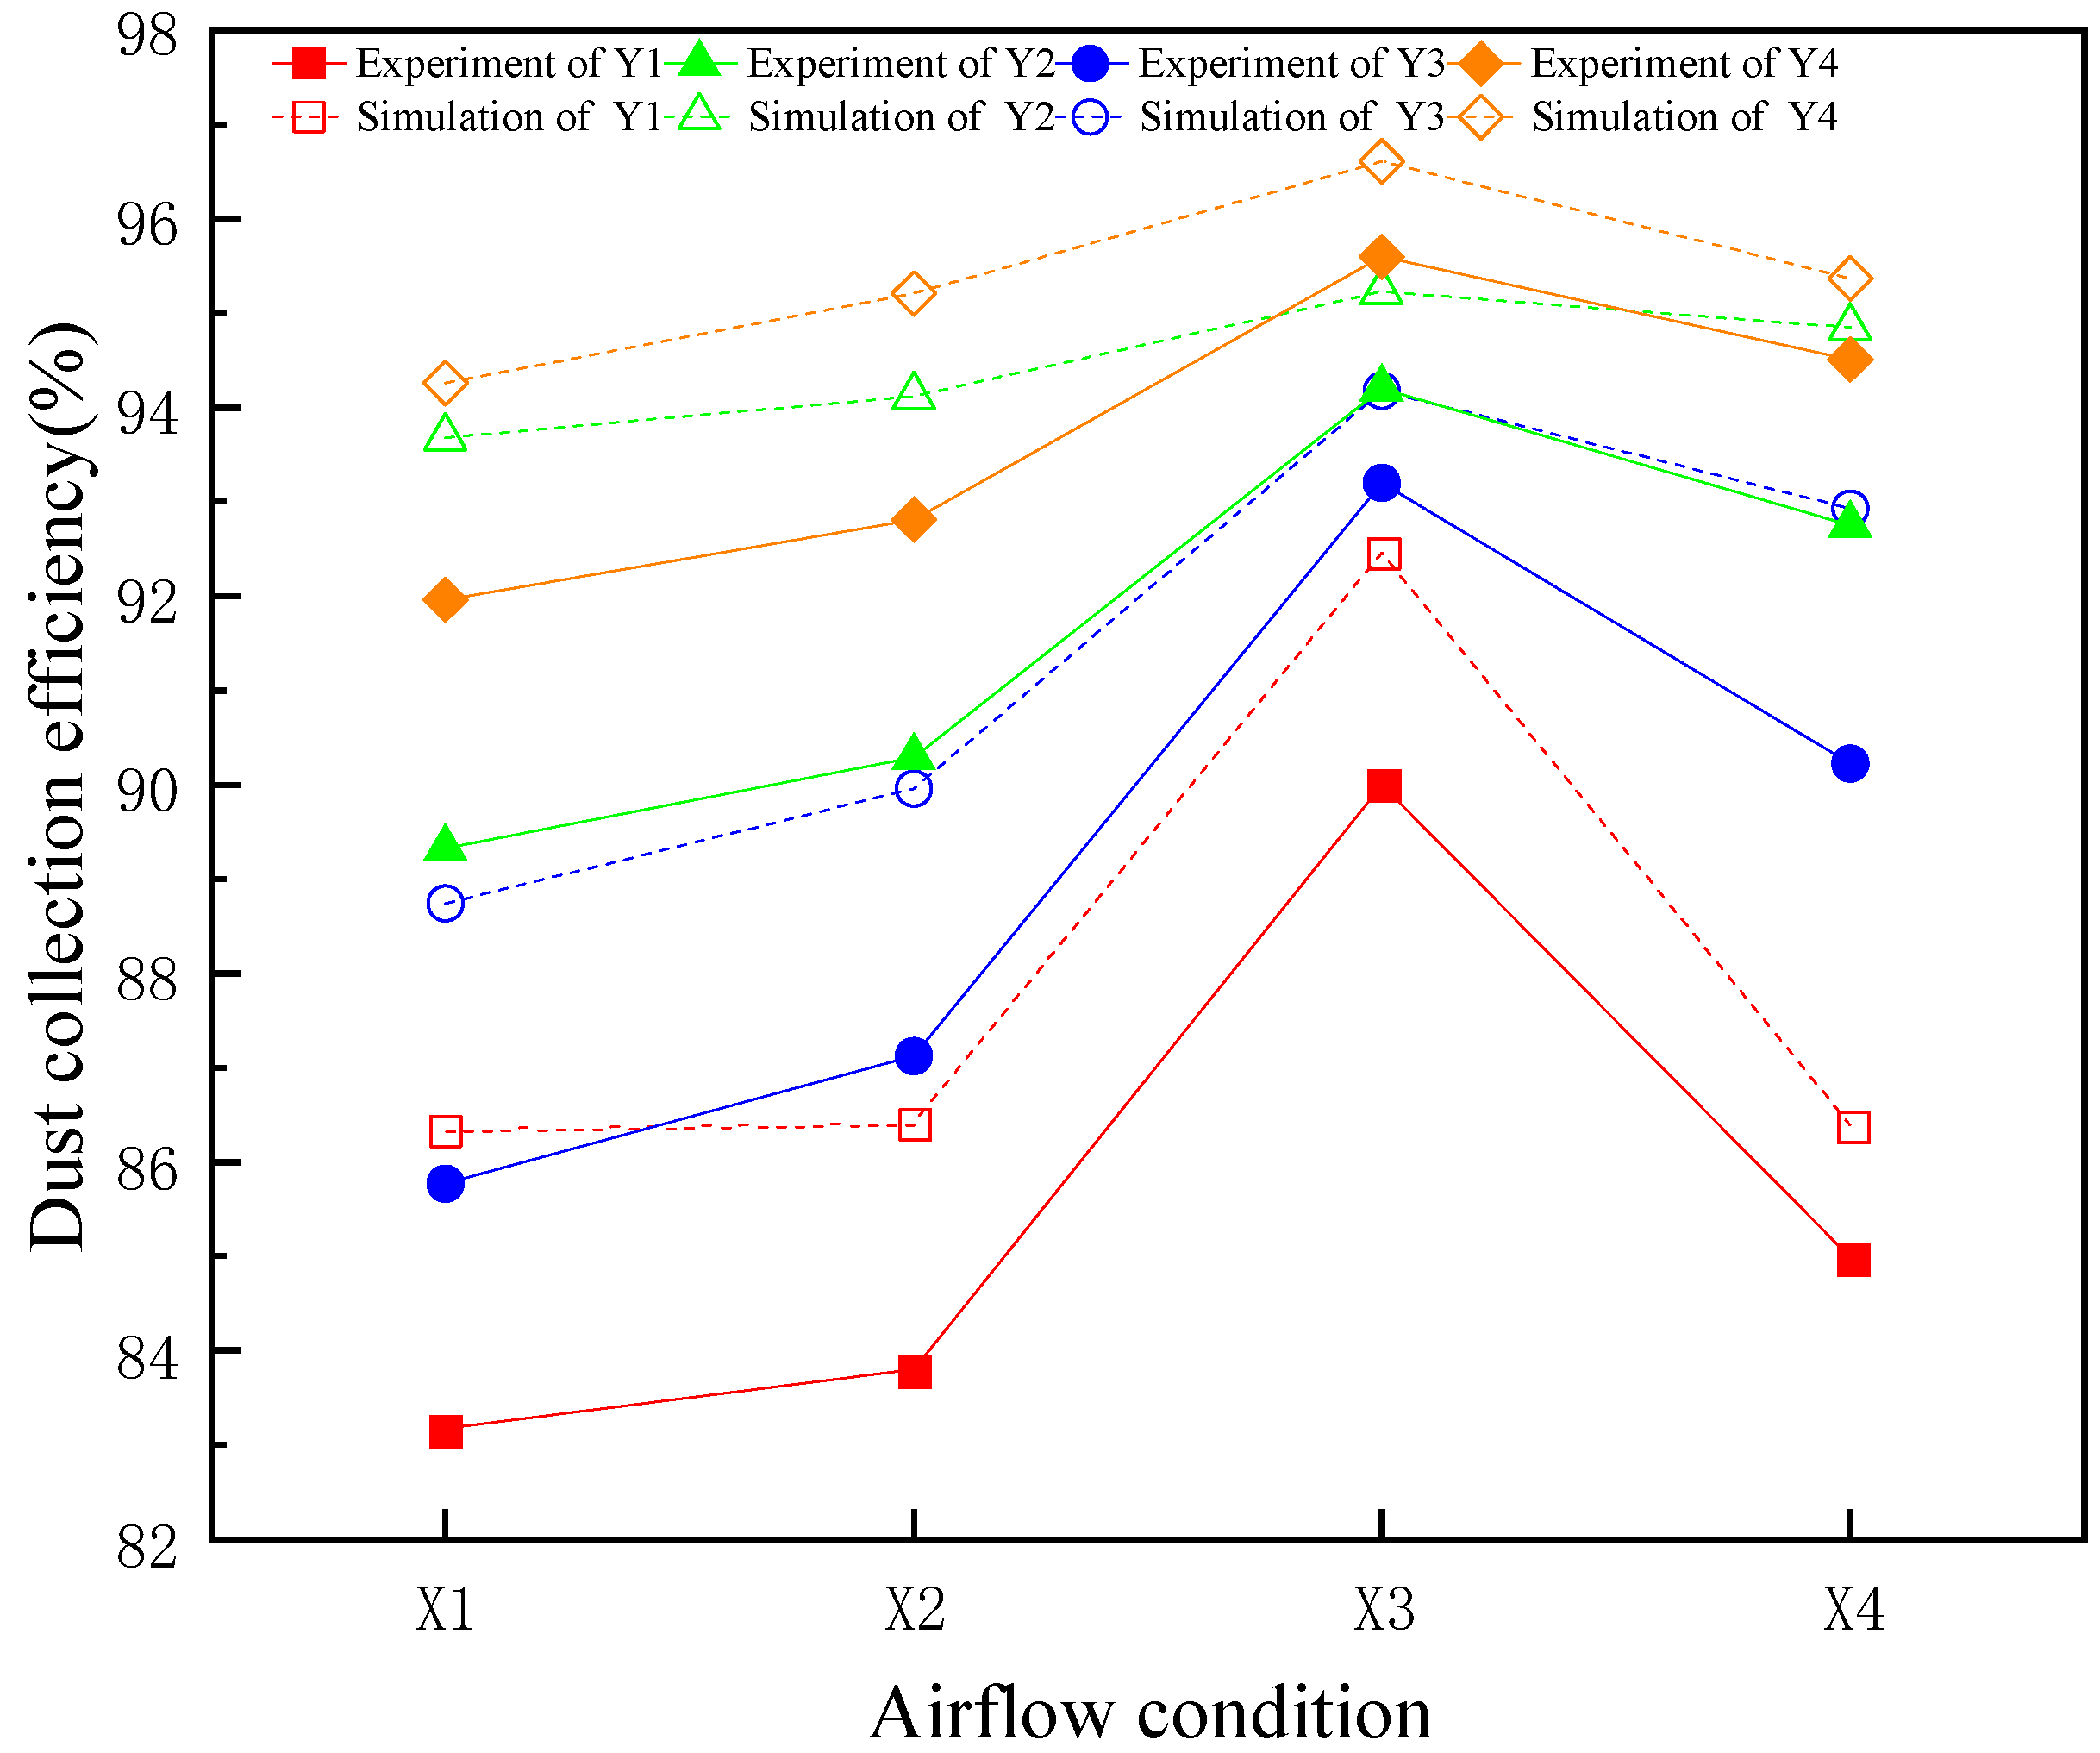
The dust removal efficiencies are presented in Figure 10. As the air velocities from the nozzles increased at the same negative pressure condition, the dust removal efficiency of the DCT obviously increased at first until the condition X3 was reached. Then, the efficiency sharply decreased. This was because the overall aerodynamic energy and the resulting overall particle inertia impeded the dust collection work of the suction port. As the suction fan power increased under the same blowing airflow condition, the dust removal efficiency of the DCT increased but gradually slowed down. This was because the overall external air was sucked into the suction port of the DCT, due to the overall negative pressure. Under operating conditions of Y1X3, Y2X3, Y3X3, and Y4X3, the dust collection efficiency could reach 90%, 93.2%, 94.2%, and 95.6%, respectively.
Figure 10.
Dust removal efficiency of DCT.
To validate the numerical model and method of the DCT used in the following section, the dust removal efficiency experiments under sixteen conditions were reproduced using the numerical method. The numerical results are also shown in Figure 10, and the maximum efficiency under the conditions of X3Y1, X3Y2, X3Y3, and X3Y4 were 92.46%, 94.18%, 95.23%, and 96.61%, respectively. Because it was very difficult to accurately obtain the experimental condition by adjusting both fan powers corresponding to the numerical condition, and the acting conditions on dust particles were more idealized, the discrepancy between the simulated results and the experimental data can be found. In view of the near consistency between both efficiency trends and the maximum error being only 4.8%, the numerical model and method of the DCT used in the following section can effectively predict the DCT performance. Table 3 shows the differences between the experimental data and the simulation results in each XY situation.
Table 3.
Comparison between the experimental data and the simulation results.
Based on the above works, the following conclusions can be drawn: (1) reasonable structure and an efficient DCT still need to rely on reasonable matching between the air velocity at the nozzles and the negative pressure at the suction port, and (2) the adverse interference among airflows will easily happen when velocities from twelve nozzles are so high.
4. DCT Design and Performance Analysis
4.1. Parameter Conditions
Referring to previous research results of our team’s Dai G.M. [22], which were characterized by a circular dust collection port at the center, the structural design work of this paper aimed to look for a reasonable combination among so many A, B, and C candidates of DCT characterized by a slit suction port in the rear section. Firstly, 20 sets of combination conditions (A, B and C) are detailed in Table 4. Then, the flow fields corresponding to these 20 conditions were simulated, respectively, by the help of Ansys Fluent software in turn, and their dust collection efficiencies were simultaneously calculated, which are also shown in Table 4.
Table 4.
Test conditions and their corresponding efficiency.
When C was constant, a non-monotonic relationship between Y and A and B can be found, and A had a more dominant effect on Y than that of B. When A was constant, Y increased as B and C increased, but the improvement rate gradually slowed down. When A and C, respectively, increased at a constant B, Y firstly increased until the peak value and then decreased.
4.2. Design Process and Results
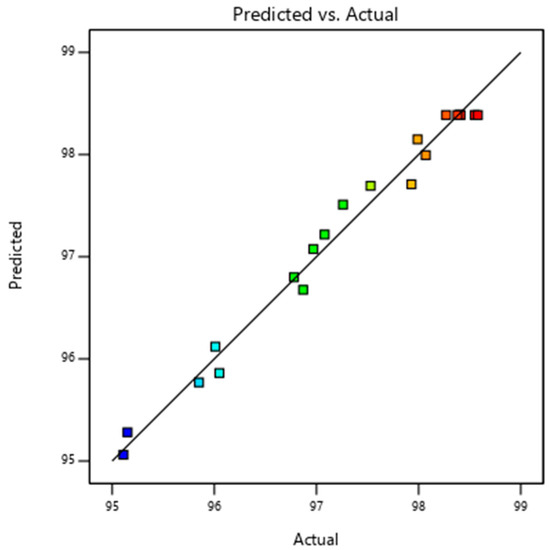
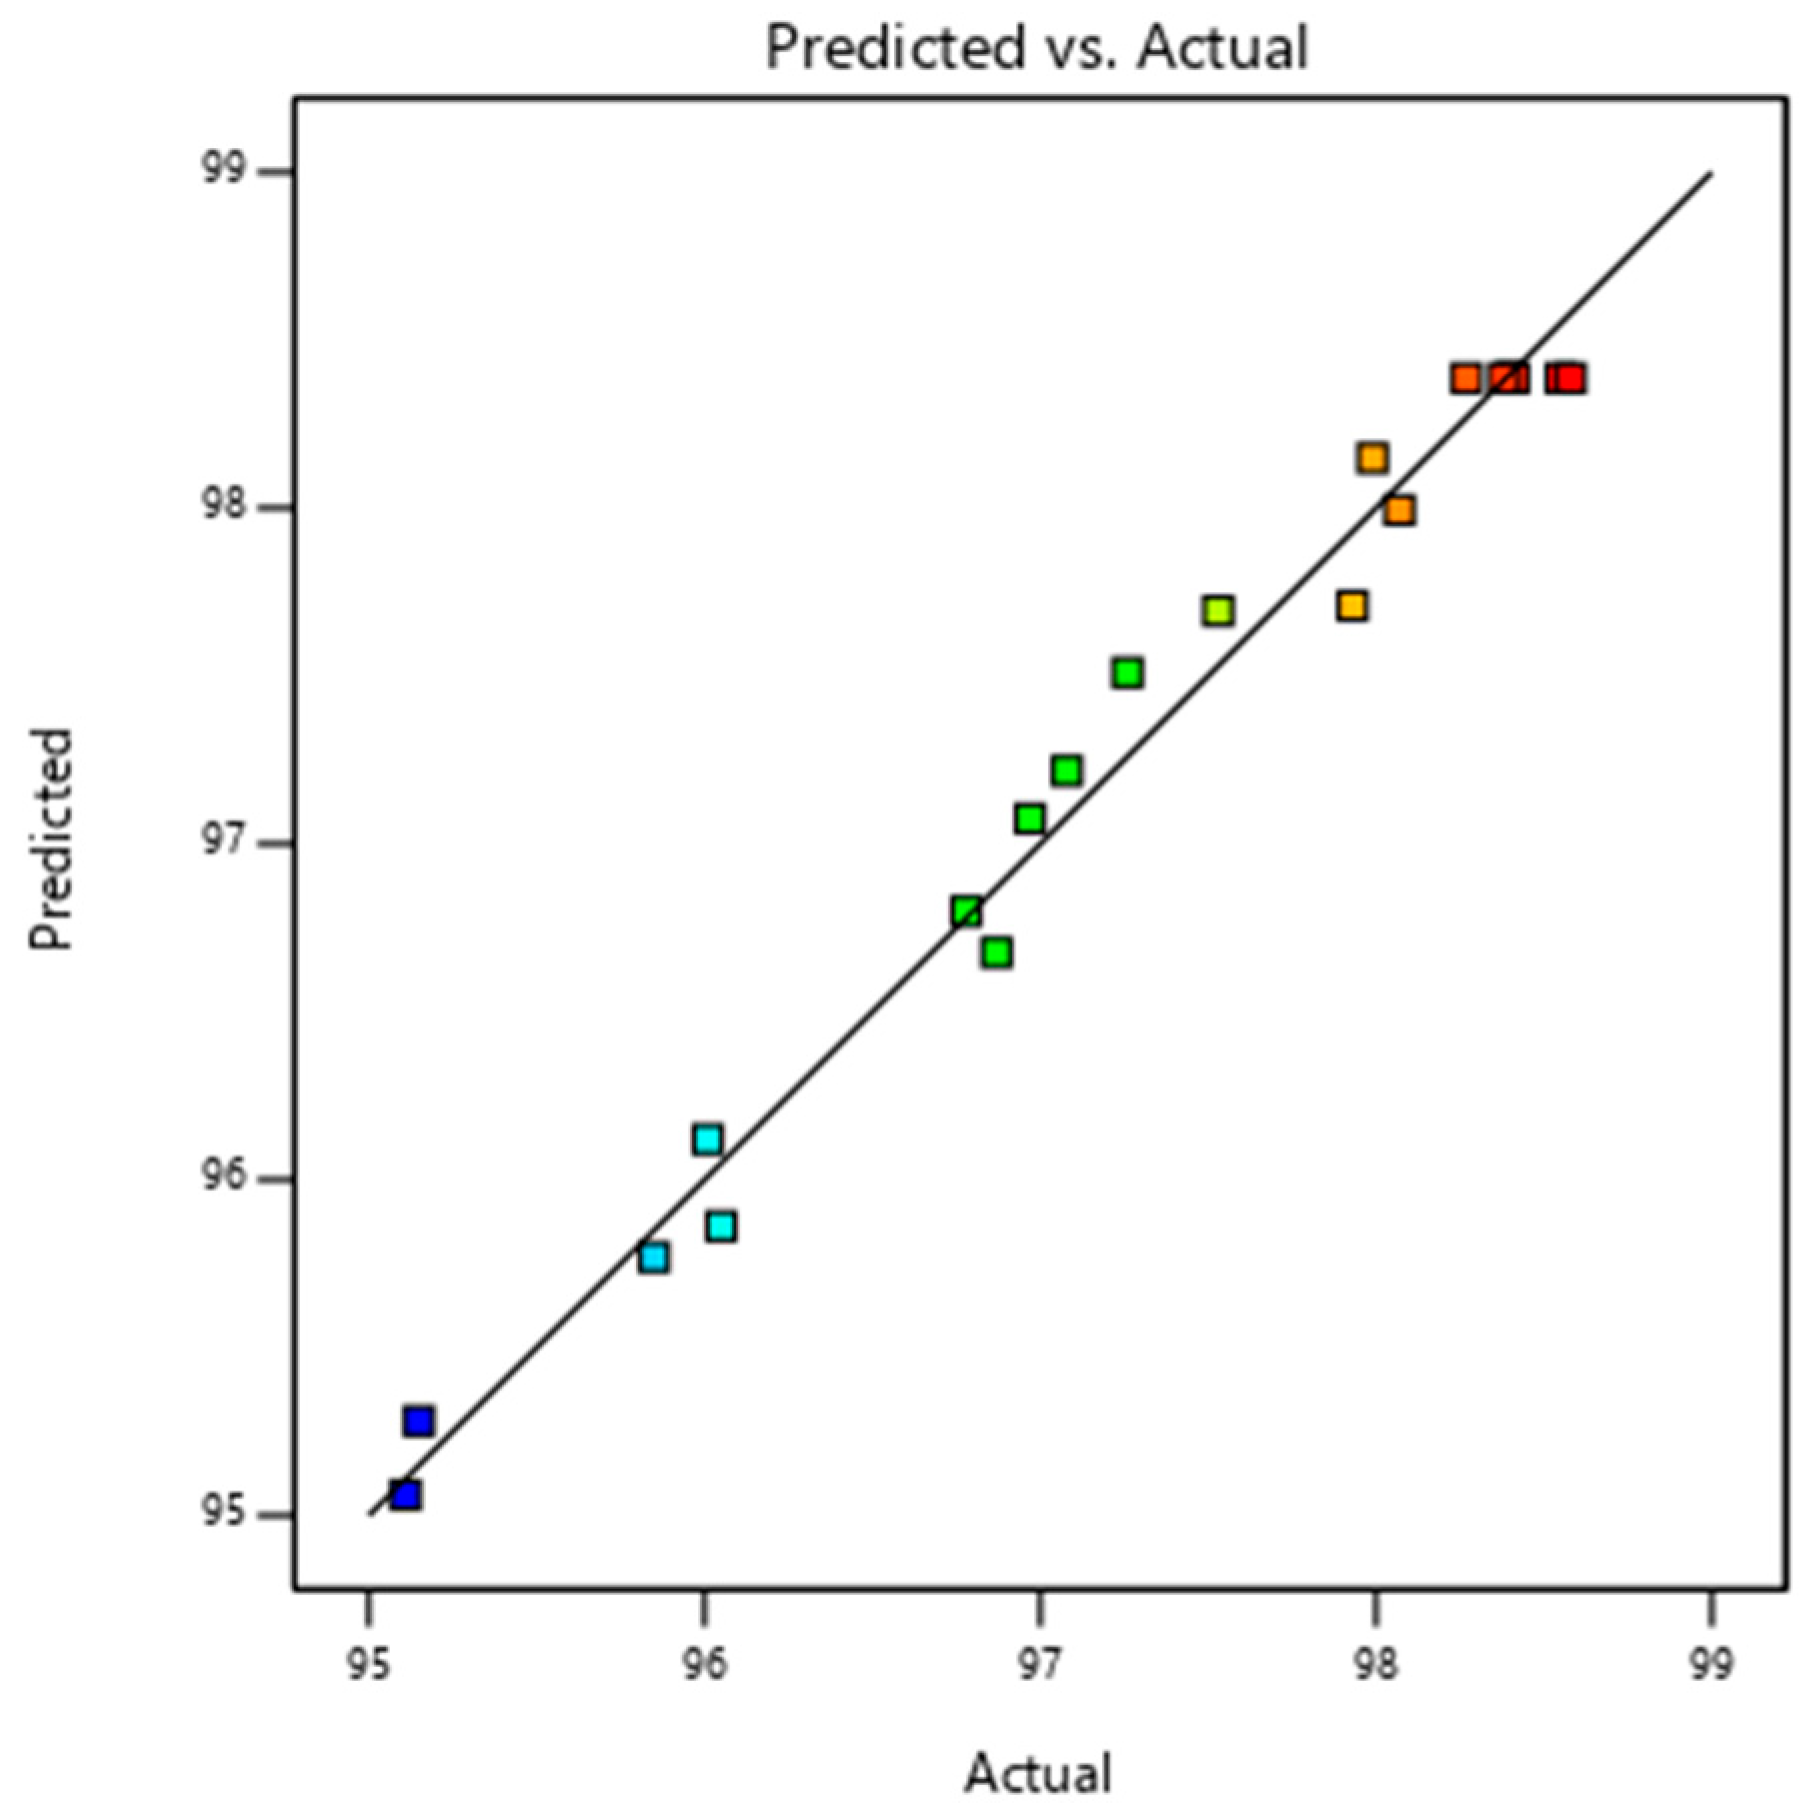
The design software of DCT needs a relationship to predict the dust collection efficiency corresponding to various structure parameter conditions (A, B, and C). The dust collection efficiencies corresponding to 20 sets of conditions in Table 4 are presented in Figure 11 as scattered dots. Using the multiple regression analysis method, the fitted curve of the dust removal efficiency Y was obtained and is also shown in Figure 11 as a line, whose relational equation is mathematically represented by Equation (8). Then, the dust removal efficiencies of DCT at various structures can be predicted by the design software and directly exported.
Figure 11.
Y-value curve fitting the graph.
The determination coefficient (R2) between the prediction model of Equation (8) and the calculation results of Y corresponding to 20 sets of combination conditions was 0.9842, which indicates that the fitting quality was very good. In order to further verify the prediction accuracy of Equation (8), the variance analysis was carried out with the help of the design software and presented in Table 4. It is clear that the prediction model of Equation (8) shows high statistical significance based on the fact that p < 0.0001, with a signal-to-noise ratio of 23.84 and a lack-of-fit F-value of 4.87. In addition, a weighted analysis was conducted to evaluate the influence level of each factor (A, B, and C), whose results are also presented in Table 5. The effect weight coefficients of A, B, and C on the dust collection efficiency were assigned values of 3, 2, and 3 because the effects of A and C on the dust collection efficiency were similar but much larger than that of B. The design software can provide a better result based on the reasonable weight coefficients imported.
Table 5.
Analysis of variance of the approximate model of dust removal efficiency.
Structure parameters of the resulted DCT are provided in Table 6, and its dust removal efficiency reached 98.7%.
Table 6.
Optimization results.
4.3. Effects of Operating Conditions
In order to find operational parameters that are more suitable for DCT, the air distributions in the cleaning zone of DCT were numerically analyzed to indicate the influence of the inlet airflow velocity, the suction negative pressure, and the vehicle speed on the dust collection efficiency of DCT. The dust collection efficiencies can be calculated by the design software according to Equation (7).
(1) Effects of blowing air velocity at the nozzle
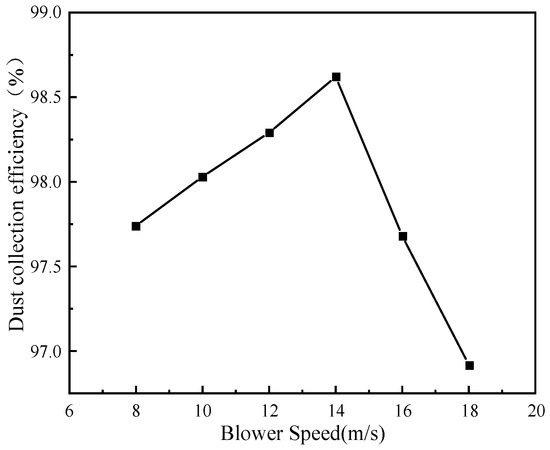
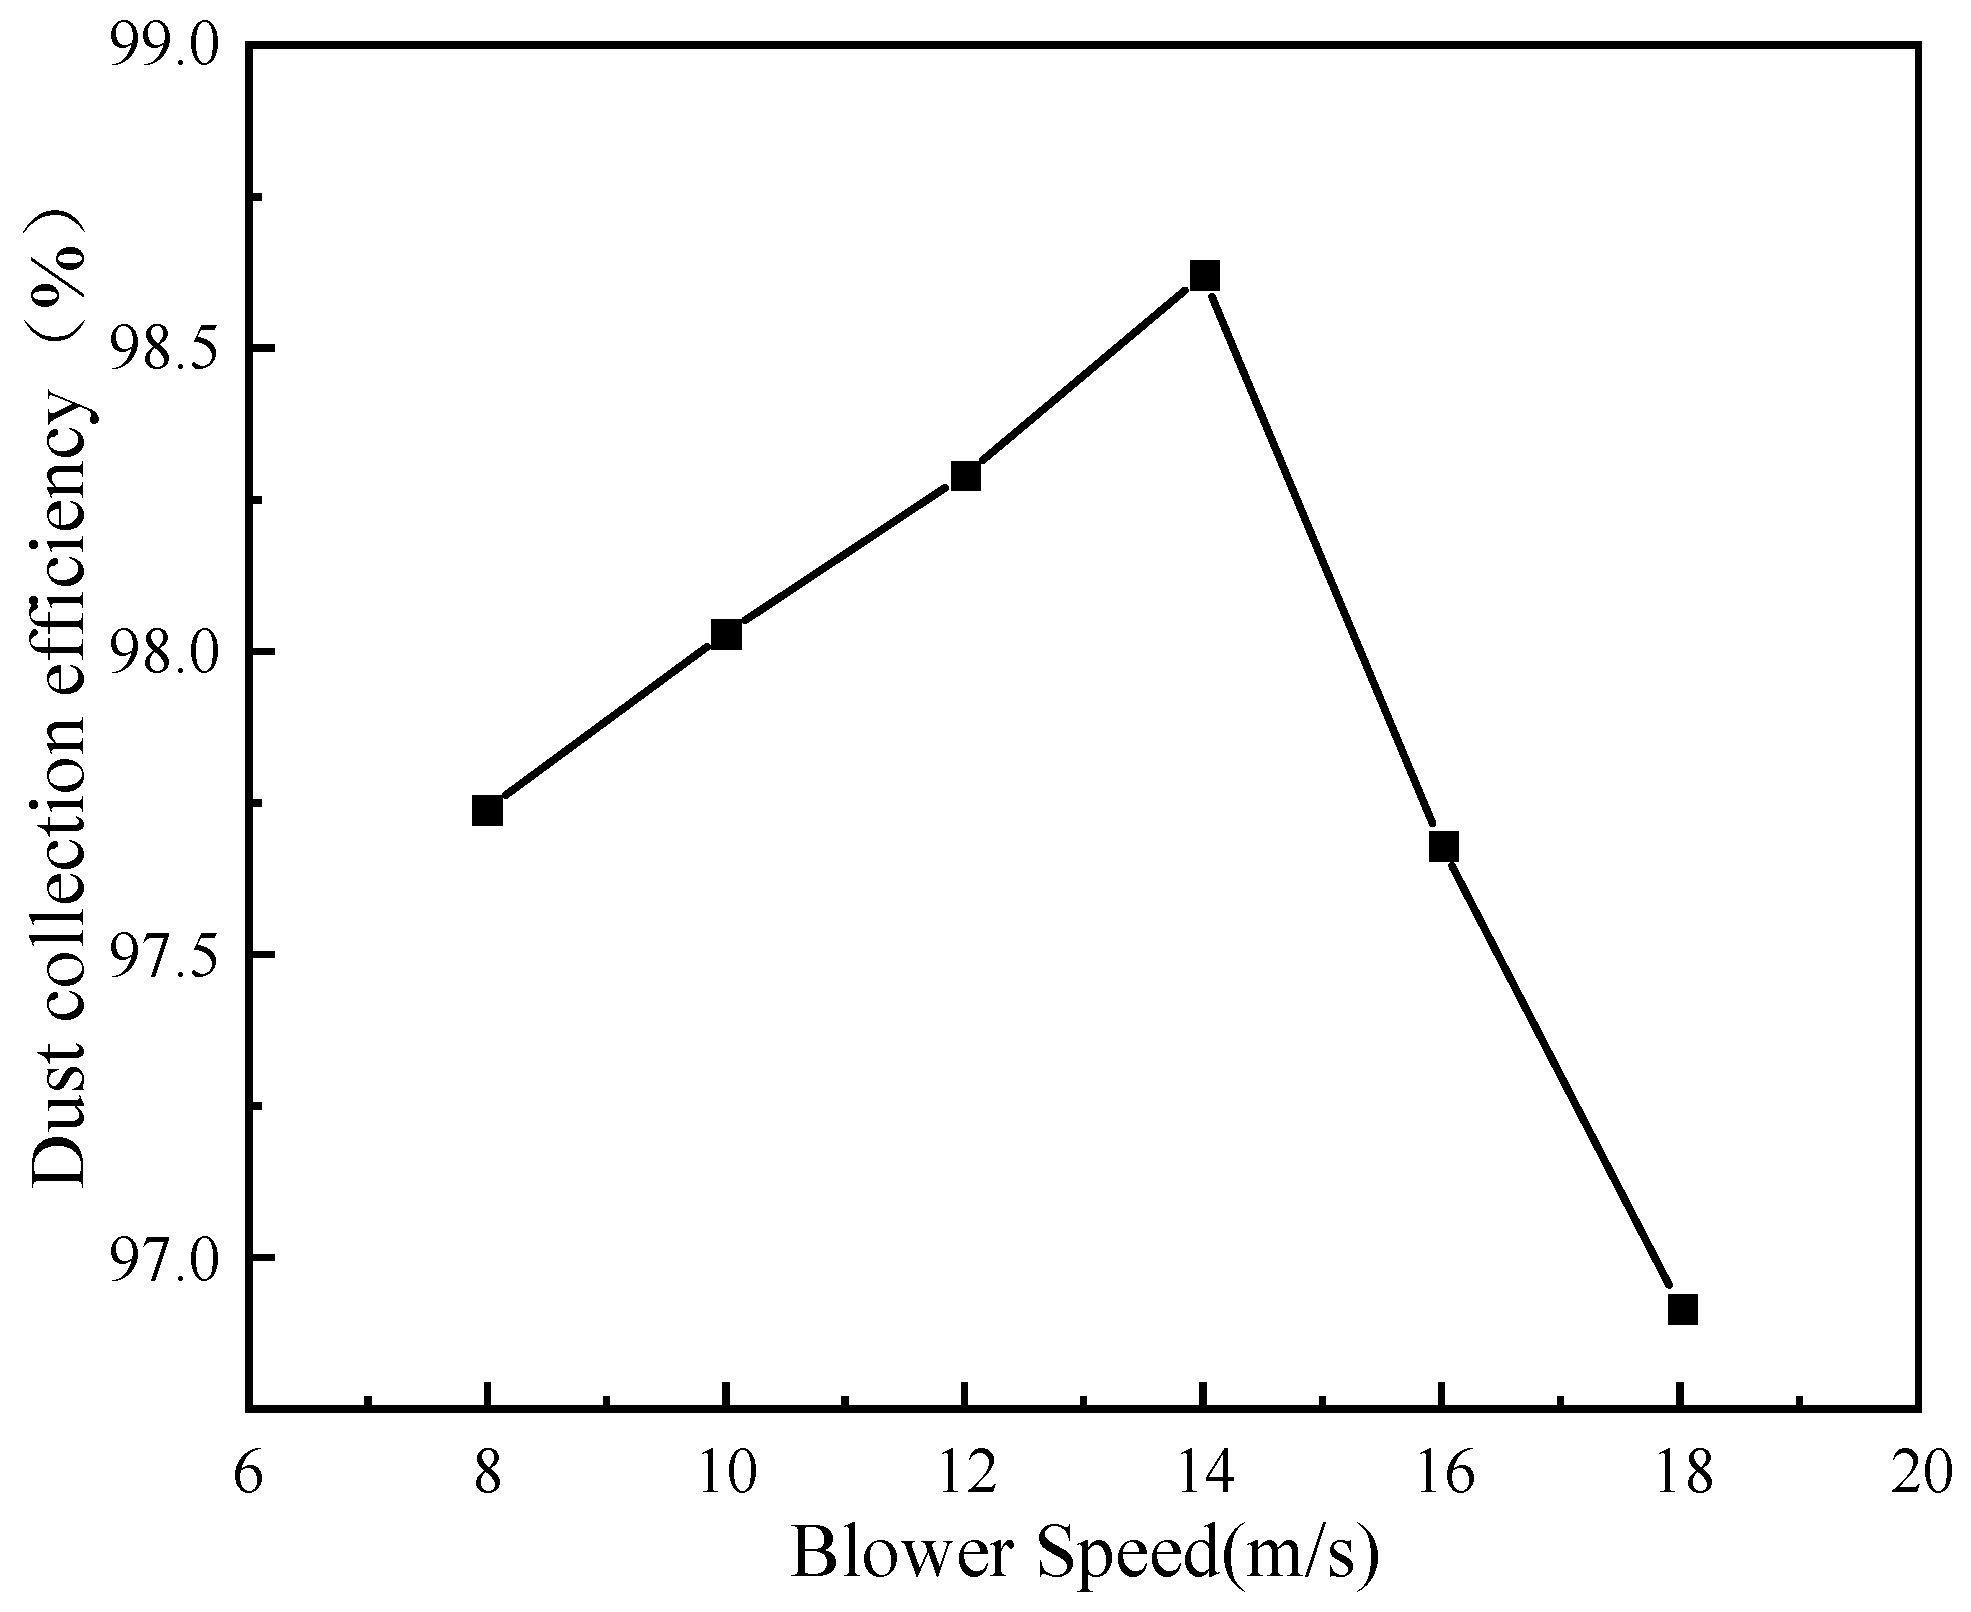
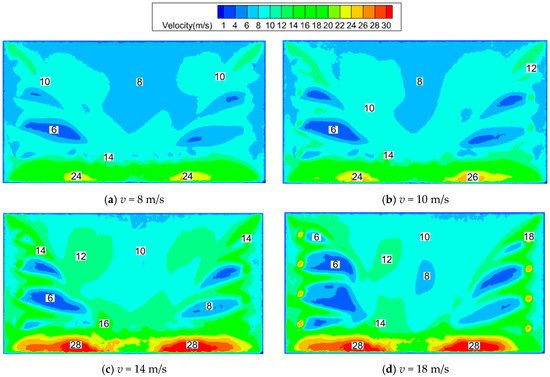
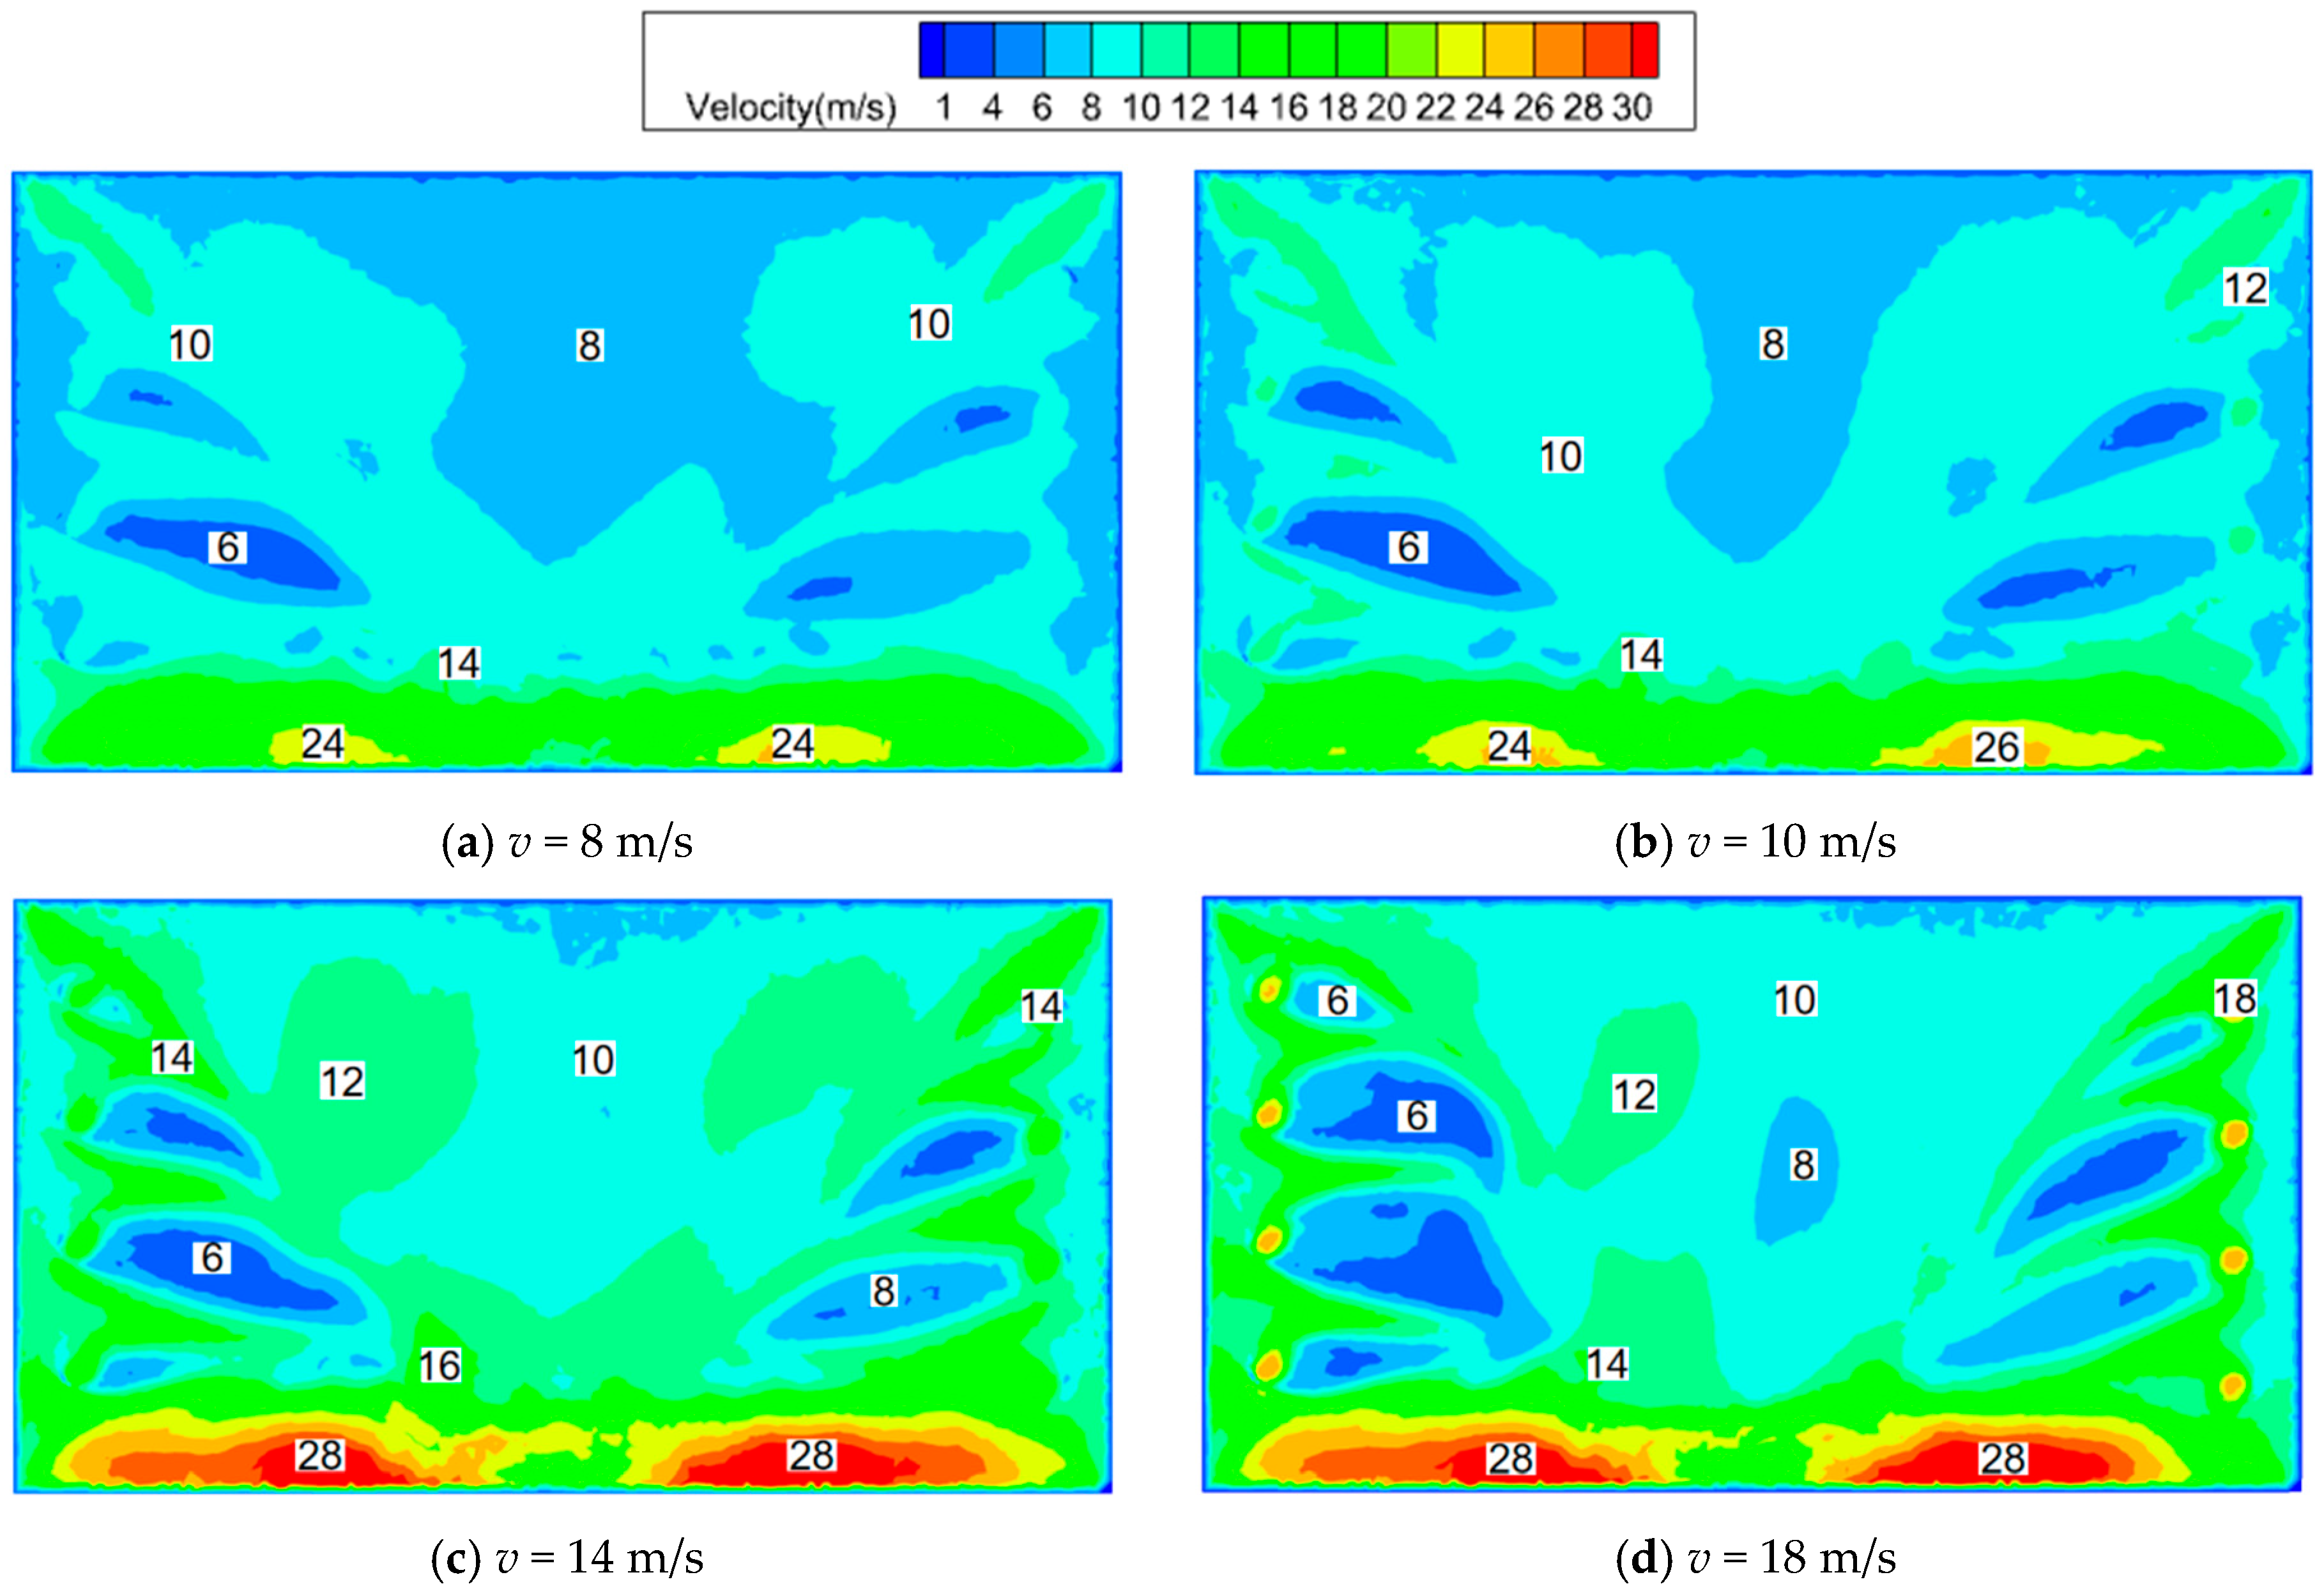
Under the conditions of sweeper speed of 1.4 m/s and suction port pressure of −1800 Pa, the dependence of the dust removal efficiency of DCT on the nozzle air velocity was numerically calculated and is shown in Figure 12. As blowing air velocity increased, the efficiency initially increases until air velocity was up to 14 m/s and then sharply decreased. The peaking efficiency was 98.5%, and the efficiency minimum was 96.9% at an air velocity of 18 m/s. This was because the insufficient near-surface air speed at a lower nozzle velocity happened, which failed to generate an effective vortex, resulting in low efficiency. When the nozzle air velocity is higher under constant exhaust air conditions, the airflow interference among nozzles will disrupt the formation of a rotating airflow, the external air volume sucked into DCT will be impeded, and the dust particles with higher inertia will not be easily to be captured, causing adverse effects on the dust removal efficiency. The near-surface air velocity distributions shown in Figure 13 also further verified the above explanations.
Figure 12.
The influence of air blowing speed.
Figure 13.
Velocity cloud image of DCT at the near-ground section (z = 1 mm).
(2) Effects of negative pressure at the suction port
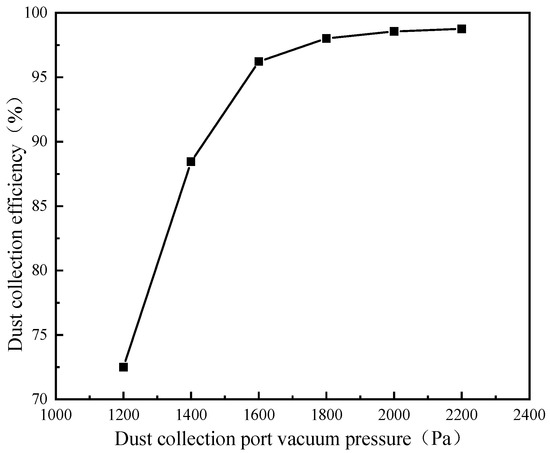
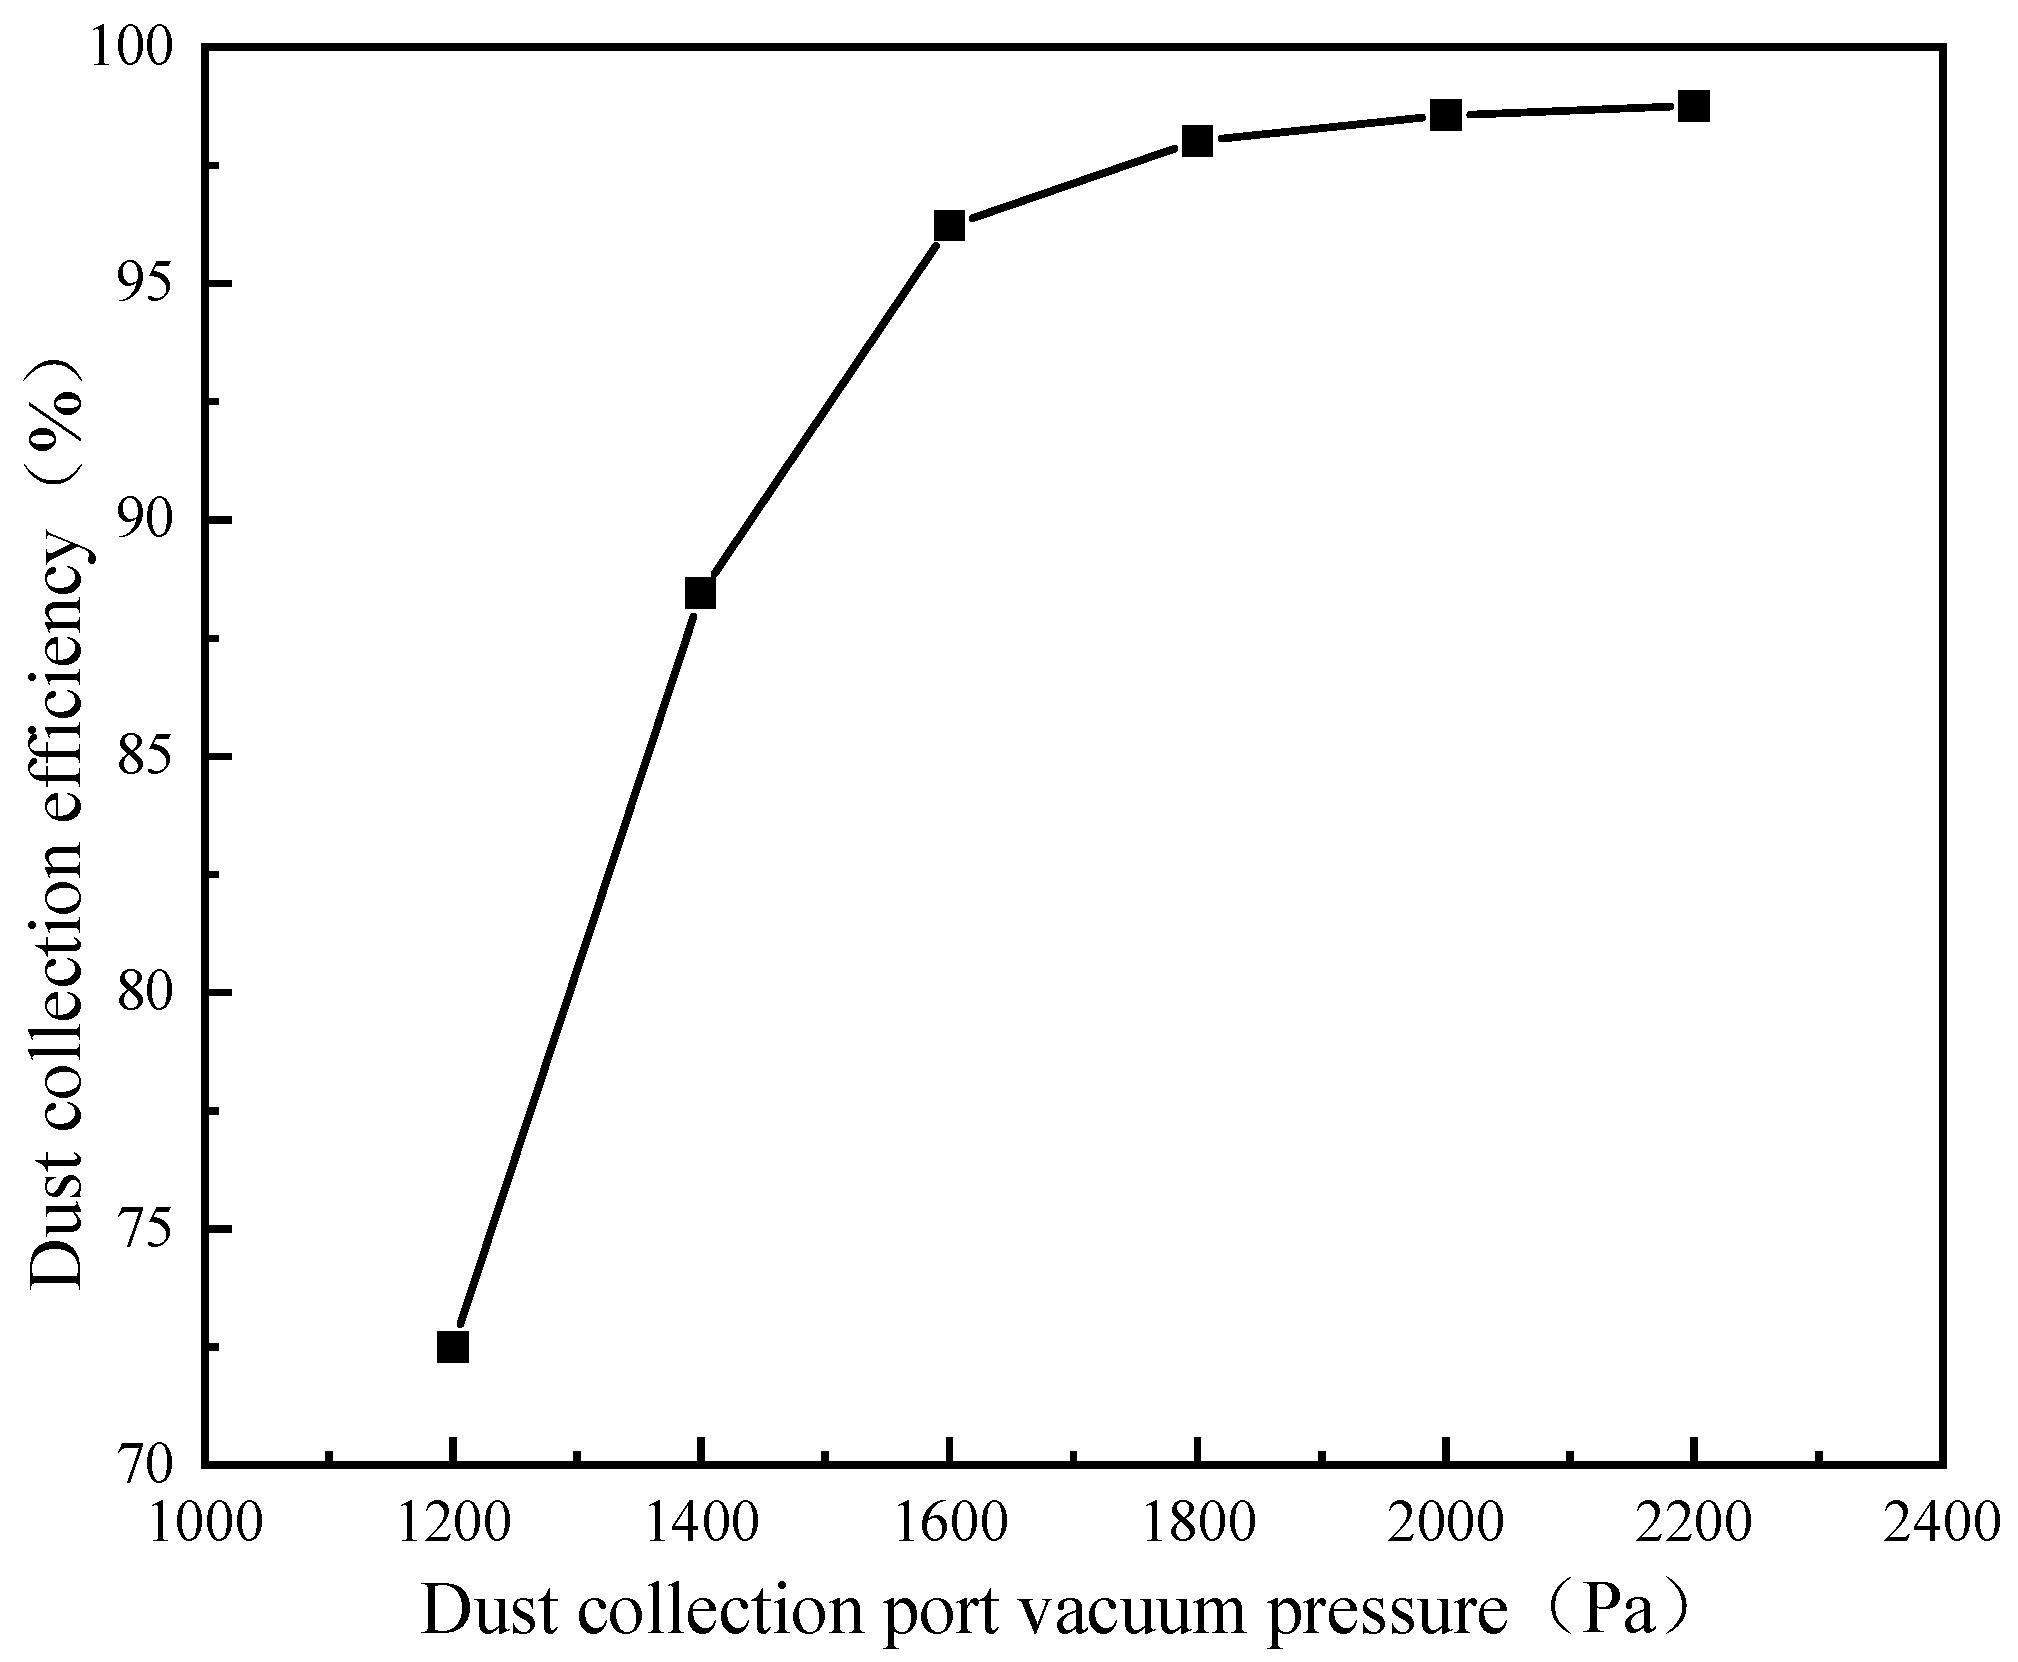
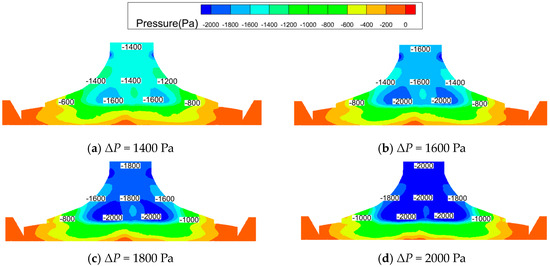
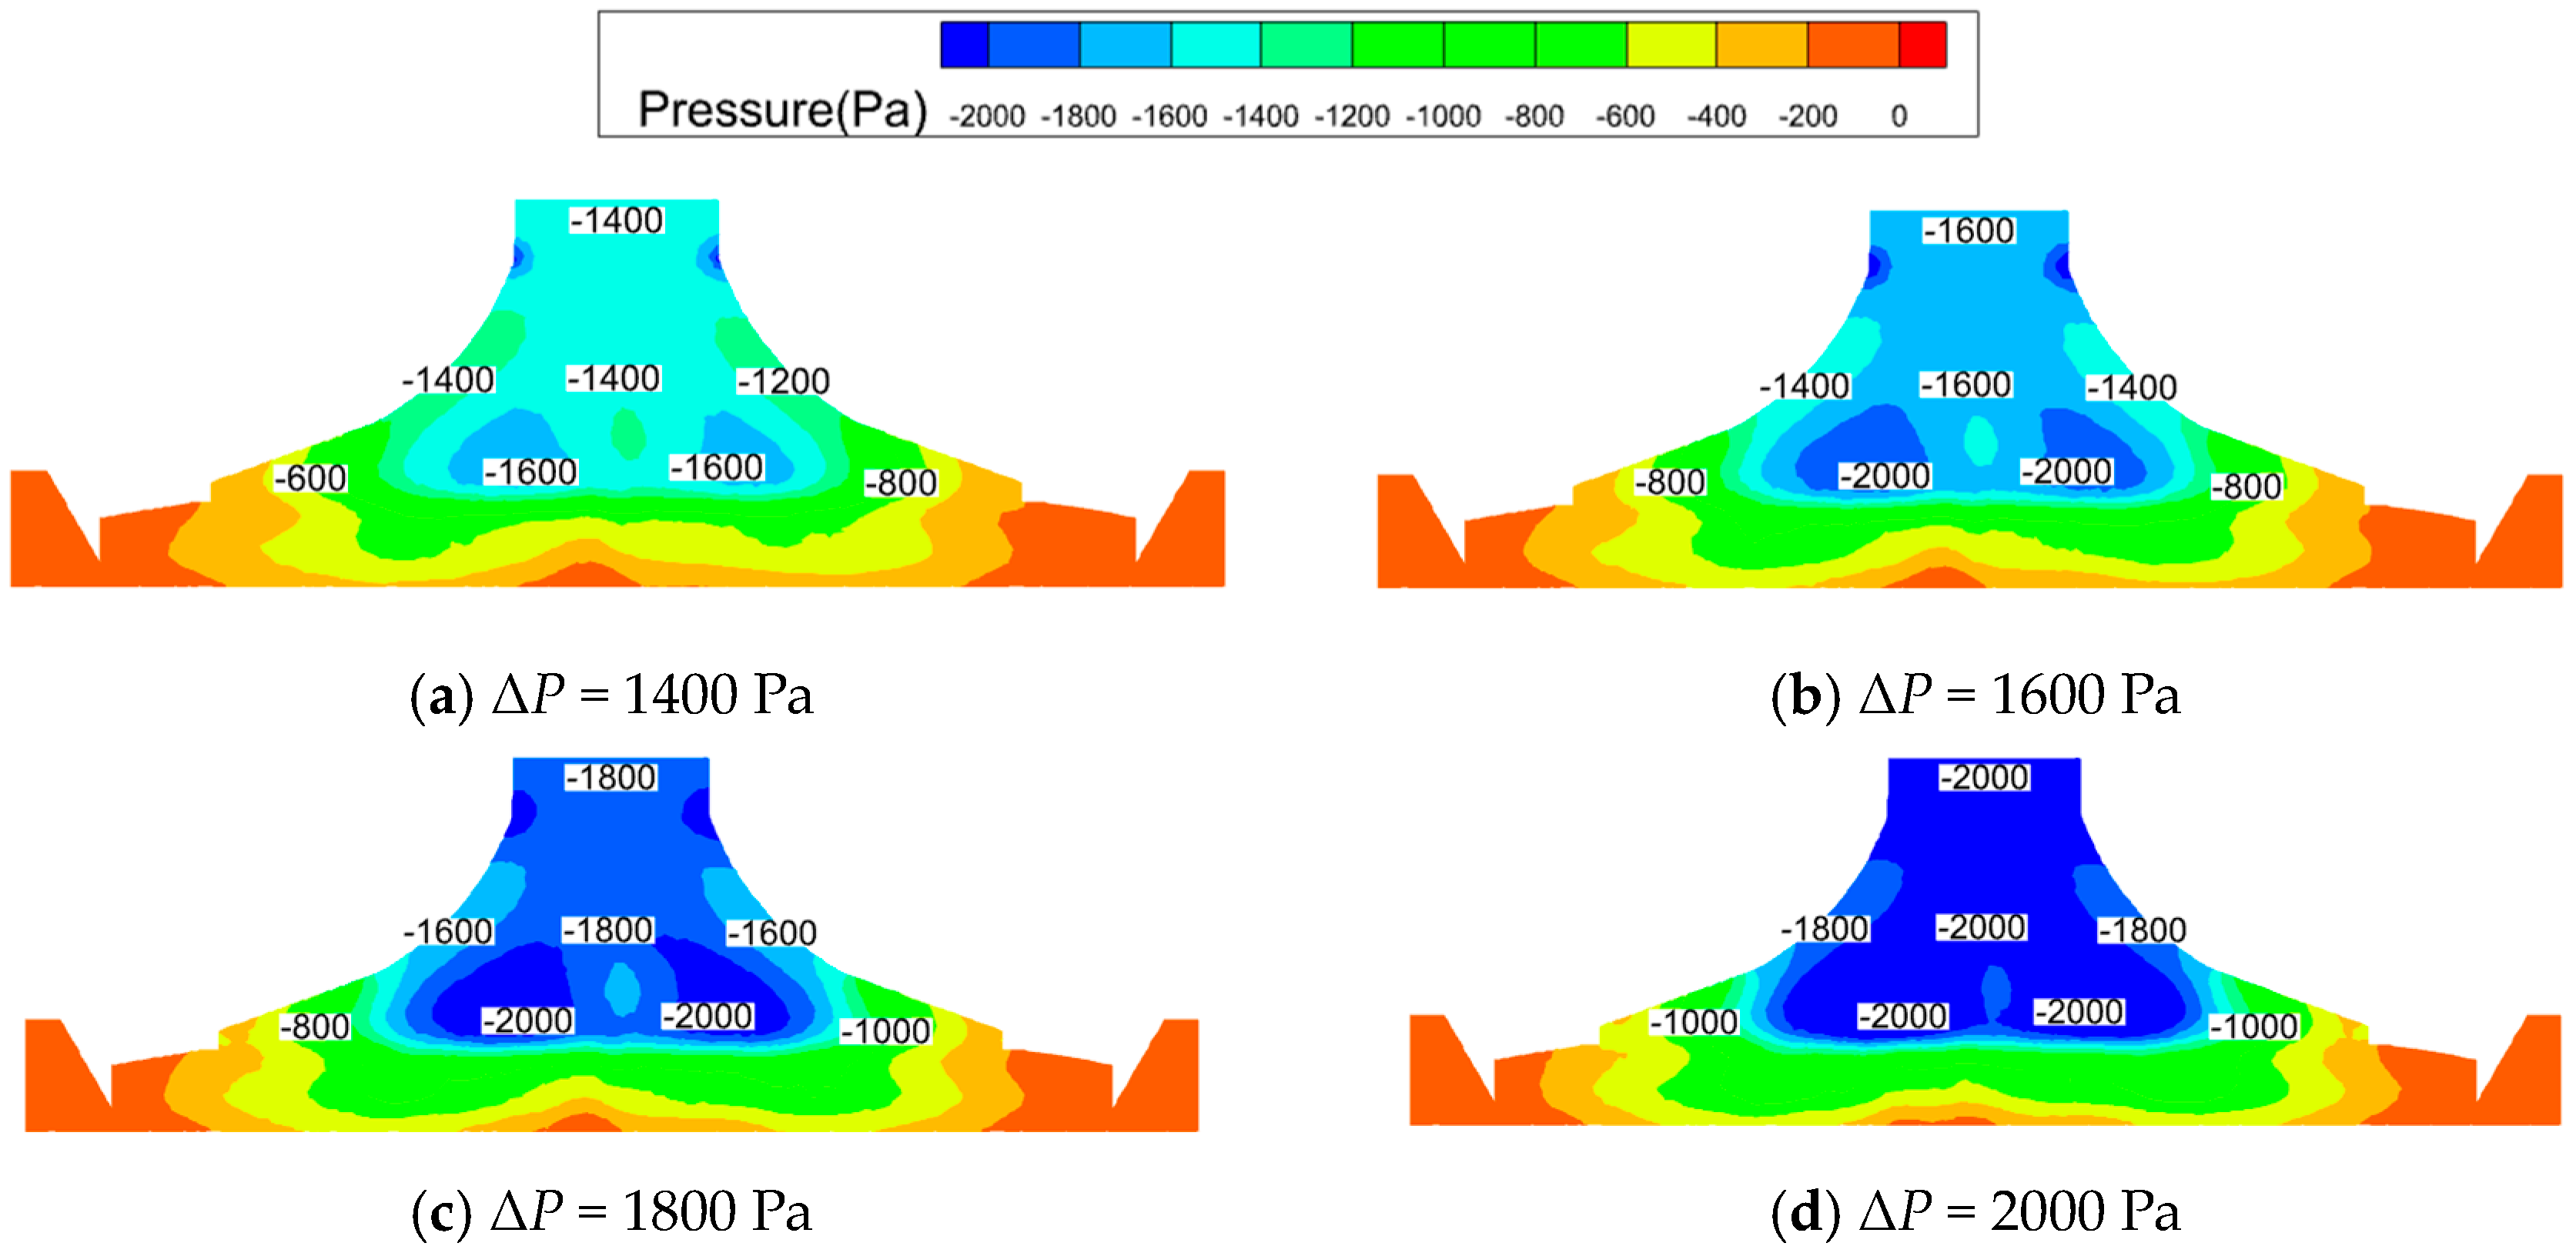
Under the conditions of sweeper speed of 1.4 m/s and blowing velocity of 14 m/s, the effects of the negative pressure at the collection port on the dust collection efficiency was evaluated, and the results are illustrated in Figure 14. When the negative pressure increased, the efficiency sharply increased at first. Then, this increase slowed down after −1600 Pa. This was because when the quantity of dust particles was constant at the same blowing air velocity, the excessive negative pressure at the suction port had no obvious effect on the dust removal efficiency, except drawing in more external air and adding more resistance loss. The efficiency maximum was 98.56% at −1800 Pa. Further validation of this analysis can be found in Figure 15, which shows the corresponding pressure contours.
Figure 14.
Negative pressure influence at the dust collection port.
Figure 15.
Pressure cloud diagram of DCT at the longitudinal section (y = 10 mm).
(3) Effects of Sweeper Speed
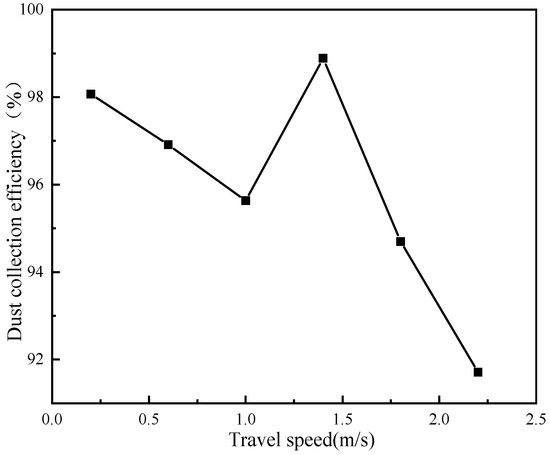
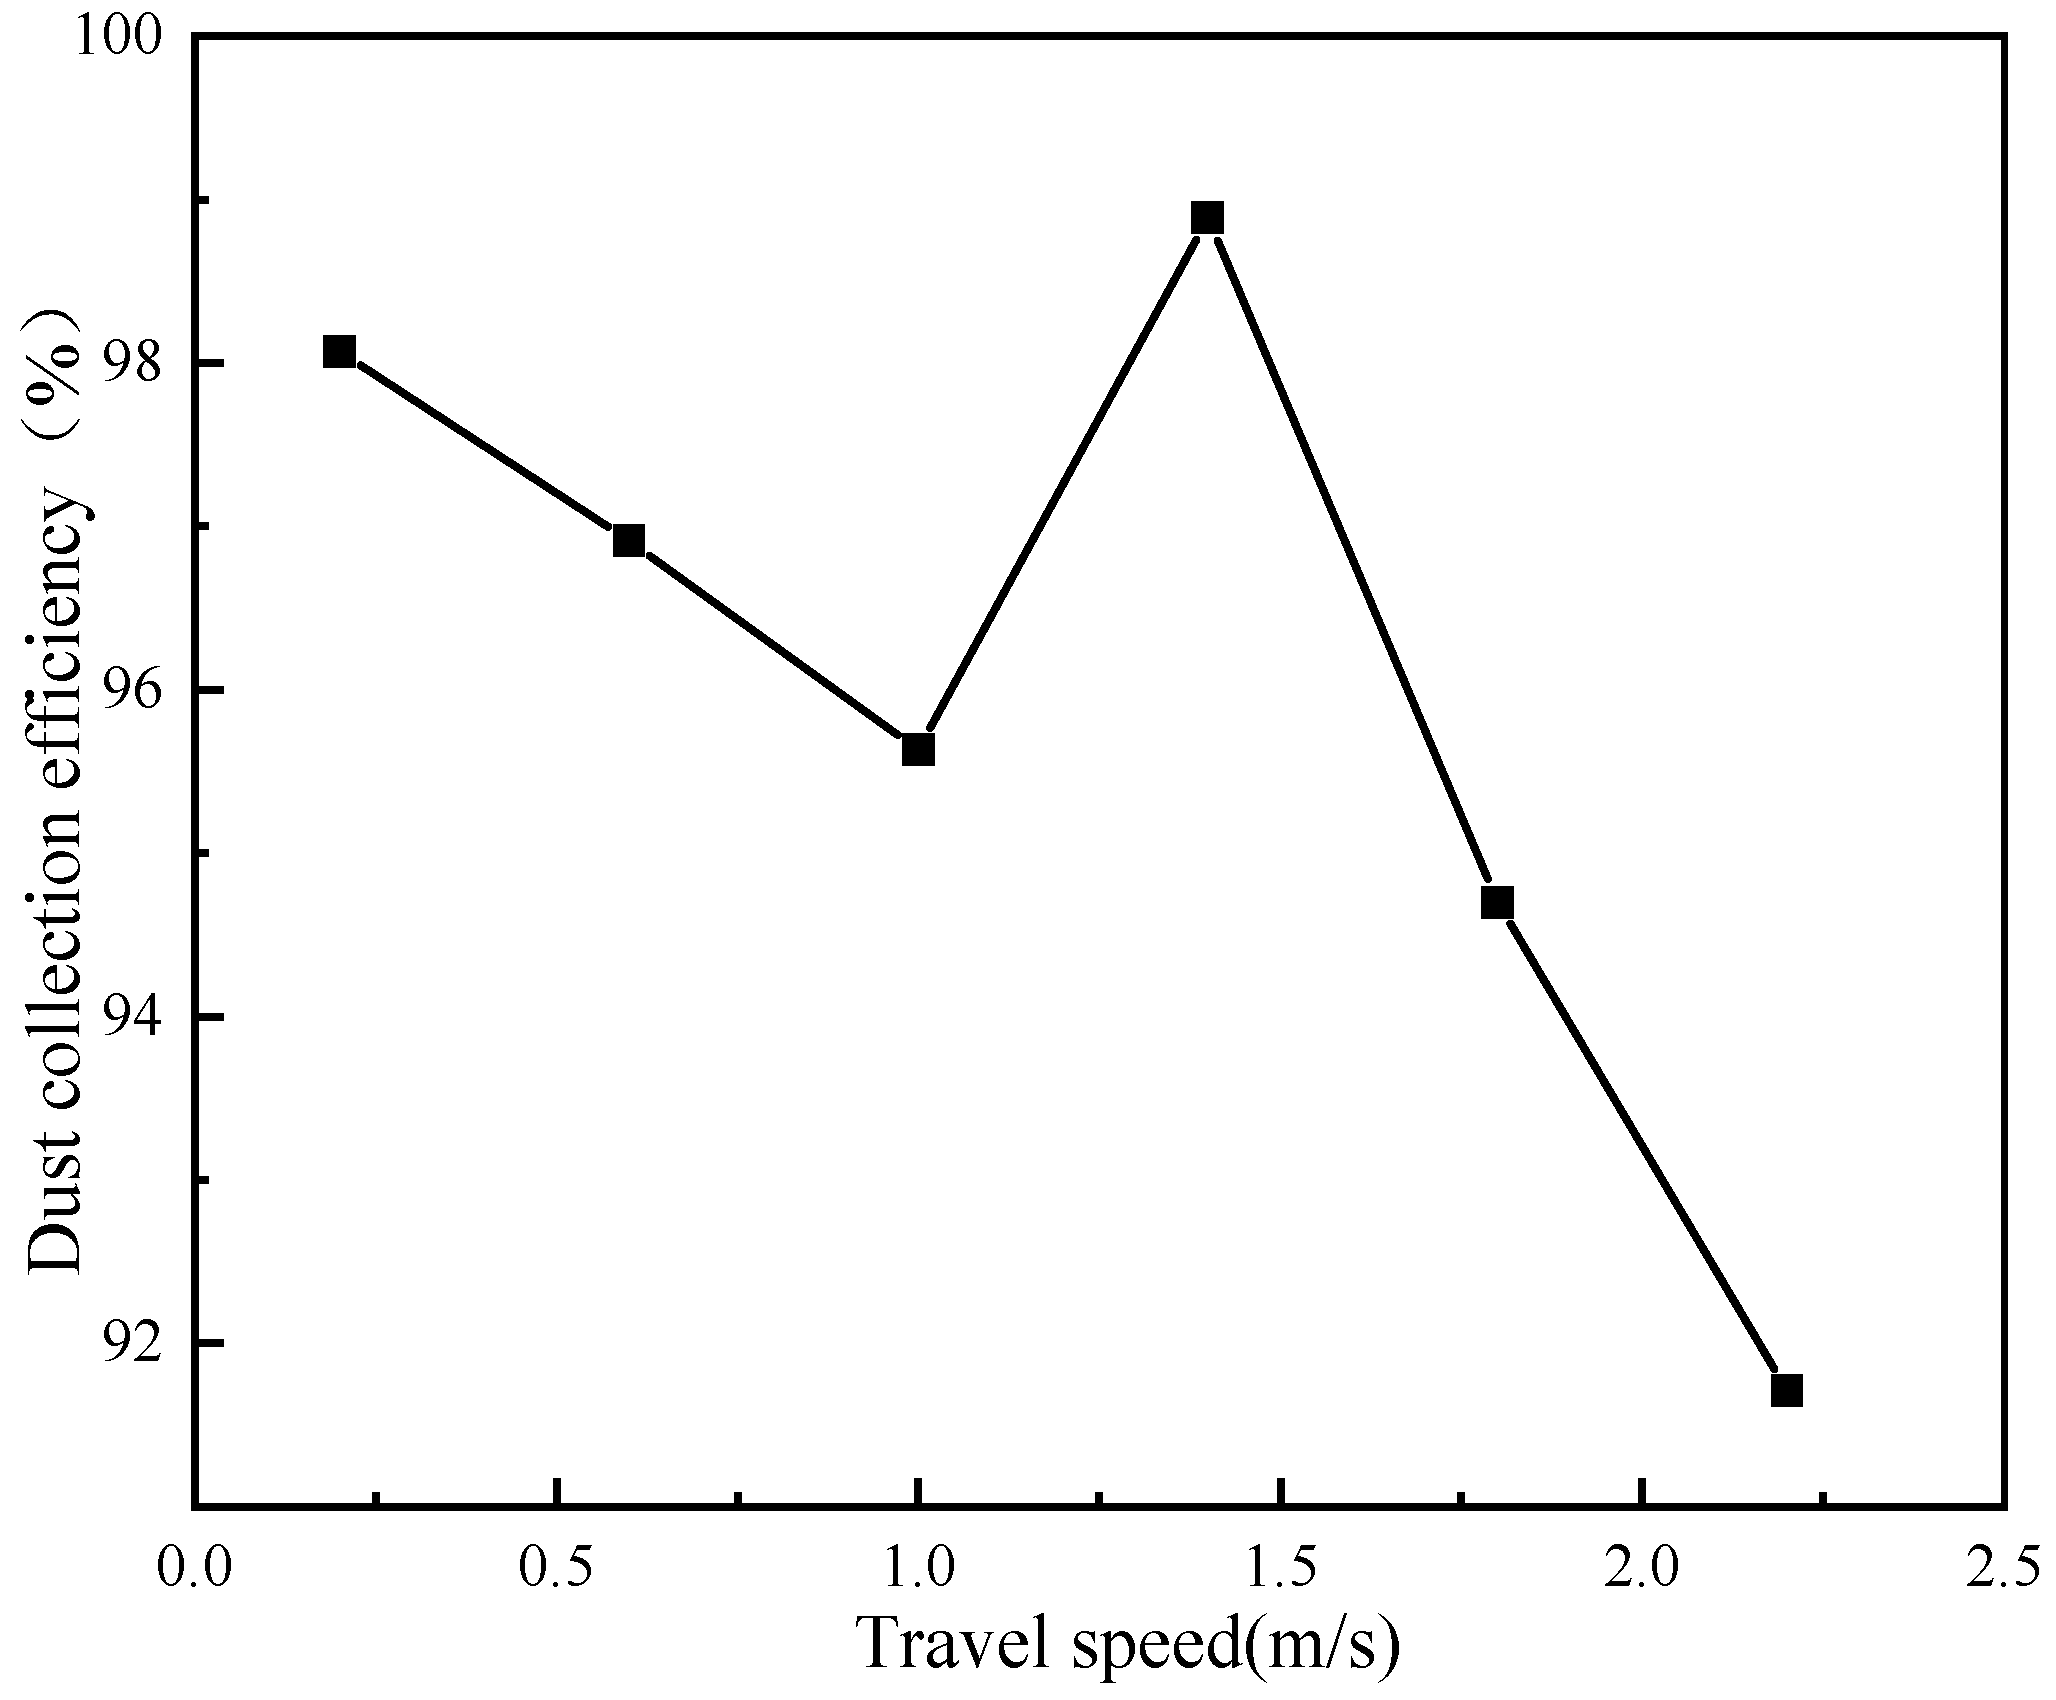
Under the conditions of a negative pressure of −1800 Pa and a blowing velocity of 14 m/s, the relationship between vehicle speed and dust removal efficiency was calculated, and the result is shown in Figure 16. When vehicle speed was low, the dust removal efficiency of DCT was high, but the cleaning work efficiency was low. As the sweeper speed increased, the dust removal efficiency decreased until 1.0 m/s. An efficiency maximum of 98.7% was observed at a travel speed of 1.4 m/s. Then, the efficiency sharply decreased as the vehicle speed further decreased. This was because the capture efficiency for dust particles was impeded by a shorter residence time of particles in DCT at a larger sweeper speed, and there was an efficient combination among operation conditions.
Figure 16.
The influence of airflow vehicle speed on dust removal efficiency.
5. Conclusions
To address the cleaning burden of city roads, an efficient DCT for the unmanned small and smart cleaning vehicle is outlined, and an efficient design method for its structure is suggested and verified by experimental data. With the help of the combination of the design method of CFD technology and software and the RSM method and software, the structure of this efficient DCT is obtained, and its reasonable operation conditions are found. Conclusions can be drawn as follows.
(1) The DCT under the combination mode of blowing and suction is a very promising structure for obtaining efficient dust removal efficiency. The efficient DCT with a size of 190 mmx350 mm is featured with A = 18°, B = 20°, and C = 0.2, and the dust collection efficiency of the resulting DCT can be up to 98.7% under the conditions of 14 m/s airflow velocity, −1800 Pa suction pressure, and 1.4 m/s travel speed.
(2) The design method combining the CFD method and the RSM method is a very efficient design method to address problems of muti-factors to muti-objectives.
The high-efficiency blow–suction DCT presented herein is just for the urban roads, not for extreme environments or complex roads, which will be focused in the next work.
Author Contributions
Conceptualization: W.Z.; project administration: W.Z.; methodology: J.Y.; formal analysis and investigation: J.Y.; validation: J.B.; data curation: F.H.; writing—review and editing: W.Z. and J.Y.; funding acquisition: W.Z.; resources: W.Z. and Y.L.; supervision: Y.L. All authors have read and agreed to the published version of the manuscript.
Funding
This research was funded by Gansu Provincial Department of Education grant number 2024QB-040 and Gansu Provincial Department of Science and Technology grant number 24JRRA246.
Data Availability Statement
The raw data supporting the conclusions of this article will be made available by the authors on request.
Conflicts of Interest
The authors declare no conflict of interest.
References
- Berrill, P.; Nachtigall, F.; Javaid, A. Comparing urban form influences on travel distance, car ownership, and mode choice. Transp. Res. Part D Transp. Environ. 2024, 128, 104087. [Google Scholar] [CrossRef] [Scilit]
- Li, X.; Yu, Y.; Zheng, N. Exposure of street sweepers to cadmium, lead, and arsenic in dust based on variable exposureduration in zinc smelting district. Northeast China. Chemosphere 2021, 272, 129850. [Google Scholar] [CrossRef] [Scilit] [PubMed]
- Roche, C.I. The Potential of Autonomous and Connected Sweepers for Smart and Sustainable Cities. Int. J. Transp. Dev. Integr. 2021, 6, 37–57. [Google Scholar] [CrossRef] [Scilit]
- Wu, B.; Men, J.; Chen, J. Numerical study on particle removal performance of pickup head for a street vacuum sweeper. Powder Technol. Int. J. Sci. Technol. Wet Dry Part. Syst. 2010, 200, 16–24. [Google Scholar] [CrossRef] [Scilit]
- Tai, B.F.; Wu, J.L. Optimized Design of Suction Mouth of Sweeper. Spec. Purp. Veh. 2014, 96–98. [Google Scholar]
- Yang, C.C.; Zhang, Y.C.; Ouyang, Z.J. Parametric design of dust collection port of vacuum sweeper based on flow simulation. J. Cent. South Univ. (Nat. Sci. Ed.) 2012, 43, 3704–3709. [Google Scholar]
- Guo, G.Z. Research on the Waste Suction Capacity of New Track Waste Suction Apparatus. China Railw. Sci. 2012, 33, 76–81. [Google Scholar]
- Fayzullayevich, J.V.; Tan, G.F.; Alex, F.J. Numerical Study of Factors Affecting Particle Suction Efficiency of Pick-Up Head of a Regenerative Air Vacuum Sweeper. Processes 2022, 10, 1252. [Google Scholar] [CrossRef] [Scilit]
- Xi, Y.; Dai, Y.; Zhang, X. Prediction of Particle-Collection Efficiency for Vacuum-Blowing Cleaning System Based on Operational Conditions. Processes 2020, 8, 809. [Google Scholar] [CrossRef] [Scilit]
- Zhang, L.; Shi, T.L. Numerical simulation of flow field and optimization of blowing–suction apparatus for railway ballast bed cleaning truck. J. Railw. Sci. Eng. 2015, 12, 419–423. [Google Scholar]
- Jing, D.; Jia, X.; Ge, S. Numerical simulation and experimental study of vortex blowing suction dust control in a coal yard with multiple dust production points. Powder Technol. 2021, 388, 554–565. [Google Scholar] [CrossRef] [Scilit]
- Shu, S.W. Research on Flow Field Characteristics of Pneumatic Conveying System of Sweeping and Suction Sweeper. Master’s Thesis, Wuhan University of Technology, Wuhan, China, 2018. [Google Scholar]
- Lu, X.Y. Research on Pneumatic Conveying System and High Speed Flow Field of Sweeper. Master’s Thesis, Chang’an University, Xi’an, China, 2022. [Google Scholar]
- Ma, C.B. Design of Small Hand-pushed Garbage Sweeper MAChenbin. Mech. Eng. 2024, 85–87+90. [Google Scholar]
- Cha, X.Y.; Xu, L.Z.; Sun, Y.X.; Liang, Z.W.; Lu, E.; Li, Y.M. Development of a cleaning fan for a rice combine harvester using computational fluid dynamics and response surface methodology to optimise outlet airflow distribution. Biosyst. Eng. 2020, 192, 232–244. [Google Scholar] [CrossRef] [Scilit]
- Huang, X.H.; Ye, J.Y.; Xiong, J. Optimized Design and Test of Suction Nozzle for Small-sized Sweeper. Mech. Des. Res. 2019, 35, 168–172. [Google Scholar]
- GB/T 6003.1-2022; Technical Requirements and Testing. Standards Press of China: Beijing, China, 2022.
- Tao, B.Z.; Qiu, W.N. Error Theory and Foundation of Surveying Adjustment; Wuhan University Press: Wuhan, China, 2003. [Google Scholar]
- Zhu, F.L.; Zhang, G.Z.; Chen, J. Flow Field analysis and Structure Optimization of Vacuum sweeper suction mouth. Mech. Des. Manuf. 2008, 11, 50–52. [Google Scholar]
- Bagnold, R.A. The Physics of Blown Sand and Desert Dunes; Springer Netherlands: Dordrecht, The Netherlands, 1971. [Google Scholar]
- Manuel, A.T.; Martin, S. Effect of wall-collision models on the transport of rigid, elongated non-spherical particles in a turbulent channel flow using an Euler/Lagrange approach. Comput. Fluids 2026, 306, 106940. [Google Scholar]
- Dai, G.M. Analysis of Dust Collection Structure and Airflow Organization in Sweeping Area of Sweeper. Master’s Thesis, Lanzhou Jiaotong University, Lanzhou, China, 2024. [Google Scholar]

Disclaimer/Publisher’s Note: The statements, opinions and data contained in all publications are solely those of the individual author(s) and contributor(s) and not of MDPI and/or the editor(s). MDPI and/or the editor(s) disclaim responsibility for any injury to people or property resulting from any ideas, methods, instructions or products referred to in the content. |
© 2026 by the authors. Licensee MDPI, Basel, Switzerland. This article is an open access article distributed under the terms and conditions of the Creative Commons Attribution (CC BY) license.