1. Introduction
The goal of mammography is the early detection of breast cancer precursors by screening for microscopic calcifications, here referred to as specks, composed of calcium hydroxyapatite (HA) [
1,
2]. X-ray mammography has demonstrated strong clinical performance for identifying early-stage breast cancer over the past decades [
3]. However, the high X-ray absorption due to heterogeneously distributed dense tissue morphologies, or the presence of breast implants, limits image quality and reduces lesion visibility, leading to decreased detection sensitivity. This can lead to both false-positive and false-negative findings and reduce diagnostic performance in women with breast implants [
4] or very dense breasts [
5].
Imaging of dense breasts remains particularly challenging despite technological advances. This limitation is clinically relevant because women with dense breasts have an elevated cancer risk, and more than 50% of women under 50 years old exhibit high mammographic density [
6,
7,
8,
9]. Increased attenuation reduces contrast between lesions and surrounding tissues, often requiring higher radiation exposure to maintain image quality. Alternative modalities, such as digital breast tomosynthesis, MRI, ultrasound, and molecular breast imaging, have been proposed; however, these approaches involve higher costs, longer acquisition times, or limited accessibility [
10]. Consequently, ultrasound is often used as an adjunct to mammography to improve detection rates [
11,
12].
Breast augmentation surgery has also become increasingly common. It is estimated that 35 million women worldwide have breast implants [
13], and recent reports indicate continued growth in cosmetic breast procedures [
14]. Implants significantly attenuate X-rays due to their high silicon content, obscuring between 22% and 83% of the glandular tissue. Although specialized displacement techniques exist to improve visualization [
15], these procedures are technically challenging, increase radiation exposure, and may elevate the risk of implant damage [
16]. As a result, screening mammography may miss a substantially higher proportion of cancers in women with implants compared to women without augmentation [
17].
Given the large population of patients with dense or augmented breasts, optimizing mammographic imaging for these conditions is of practical importance. Simply increasing exposure is not desirable due to radiation risk. Therefore, alternative detector technologies and spectrum optimization strategies are required to enhance contrast while maintaining similar or lower radiation exposure levels.
From a technological perspective, conventional mammography systems employ charge-integrating flat-panel detectors and K-edge filtering to tailor the emitted spectrum to detector characteristics. However, the high-energy spectral tail can degrade image quality in charge-integrating systems because higher-energy photons contribute disproportionately to the collected charge, reducing dynamic range and lesion contrast. Photon-counting detectors (PCDs) mitigate this challenge by assigning equal weight to each detected photon, independent of energy. When combined with high-efficiency sensor materials, PCDs can exploit higher-energy photons to improve visibility through dense tissue and implants [
18]. Spectroscopic photon-counting detectors (SPCDs), such as Timepix3 [
19], additionally measure photon energy, enabling energy-resolved imaging and spectral optimization. The spectral grading identified here for the present CdTe SPCD should therefore not be transferred directly to conventional charge-integrating detectors, which weight the spectrum differently.
Previous studies have demonstrated that CdTe-based photon-counting detectors can improve image quality and potentially reduce radiation dose in mammography [
20,
21,
22,
23]. Earlier implementations using strip detectors and scanning geometries also indicated dose reductions [
24], while simulation studies suggested further improvements through energy-resolved imaging and material decomposition [
25]. Other related studies on spectral mammography can be classified in two groups: those that use spectroscopic information to improve image quality and those that use it for material decomposition and classification. Studies have shown that spectroscopic photon-counting systems can benefit from energy weighting, observer-model optimization, task-based beam quality optimization in dual-energy imaging systems, and dose optimizations, while also enabling the classification of breast microcalcifications from energy-resolved measurements [
25,
26,
27,
28,
29,
30,
31,
32]. These results highlight the potential of energy-resolved photon-counting technology for enhancing mammographic performance and have motivated ongoing industrial development of next-generation systems [
33,
34,
35,
36].
While earlier mammography studies with photon-counting detectors have already suggested benefits from harder spectra and energy-resolved imaging [
20,
21,
22,
23,
24,
25], the specific reason why Rh filtration becomes suboptimal in highly attenuating conditions has remained less obvious. Those results still leave open a broad interpretation, namely, that increased spectral hardness or penetration is itself the main reason for improved detectability. The present study aims to narrow that claim, with the energy-resolved CNR(E) analysis showing that, for HA speck detection behind dense-breast tissue or silicone, the relevant mechanism is to selectively keep the high-energy photon interval removed by Rh filtration that still contributes to detectability, and not simply hardening the spectrum through increased tube voltages. The results apply specifically for 1 mm CdTe spectroscopic detectors, for which these higher-energy photons remain efficiently absorbed and can be analyzed spectrally. The same spectral performance cannot therefore be assumed for thinner or lower-Z PCDs, or for conventional charge-integrating detectors, whose signal weighting is fundamentally different [
18].
The objective of the present work is to evaluate, for the specific imaging tasks considered here, whether preserving the high-energy tail of the spectrum improves the visibility of high-density structures, and to identify which of the tested spectra performs best within the present simulation framework. The study simulates only the radiation–matter interactions most relevant to image quality and complements the results with a qualitative experimental feasibility check in a challenging implant imaging scenario. Detailed Monte Carlo simulations of a standard mammographic setup were performed in the 10–50 keV range using clinically relevant spectra with aluminum (Al) and rhodium (Rh) filtration. Image quality was assessed using energy-resolved CNR calculations. Dense-breast phantoms were designed using a representative HA speck size within the 49.5 μm to 445.5 μm range reported for accreditation phantoms such as CIRS015 [
37]. The aim is not to establish a general mammographic optimization result, but to test the present detector-task hypothesis under controlled simulation conditions.
2. Materials and Methods
2.1. Contrast-to-Noise Ratio (CNR): Definition and Analytical Model
The CNR was selected as the figure of merit for image quality evaluation, as it incorporates both HA contrast, governed by material attenuation properties, and the statistical noise associated with background photon detection. A reduction in CNR directly corresponds to reduced speck visibility. CNR is defined in terms of the normalized contrast (
), and the coefficient of variation (
):
where
and
are the mean pixel intensities in the signal and background regions, respectively, and
is the standard deviation of background pixel intensities.
An analytical model for CNR was constructed as a theoretical reference for validating Monte Carlo results. The model expresses
and
using the Beer–Lambert law [
38], and assumes Poisson statistics for photon detection with an ideal noiseless detector. For an intensity, measured in incident number of photons
over the sample entrance surface, the expected number of photons detectable behind the background region of the sample is as follows:
where
is the breast tissue thickness and
is the corresponding linear attenuation coefficient. For a region containing an HA inclusion of thickness
and attenuation coefficient
, the expected number of detectable photons in the signal region becomes the following:
Assuming Poisson-limited noise,
and
. Combining these expressions leads to an energy-dependent CNR in the mono-energetic limit:
Here, “spectroscopic” means that the CNR is expressed as a function of incident photon energy and that detection (and imaging) can be decomposed into energy bins that discretize the detected continuous polychromatic spectrum. Material attenuation coefficients were computed using homogeneous compound mixing based on mass-attenuation coefficients and densities from the NIST (Gaithersburg, MD, USA) X-ray attenuation database [
39].
The model does not include readout electronics and assumes that quantum noise dominates. This is a reasonable approximation for photon-counting detectors operating with energy thresholds that substantially suppress electronic noise and at count rates below the pile-up regime [
22]; it does not include threshold dispersion, charge sharing/K-fluorescence, charge-transport losses, or long-term CdTe polarization drift. In addition, flat-field corrections compensate for fixed-pattern and structural gain variations between pixels [
40], so quantum (Poisson) noise becomes the dominant noise source. Accordingly, the mathematical model assumes
for the background counts.
When applied to a pixelated detection system, the CNR defined in Equation (4) is proportional to the area ratio between the signal and background regions, as each region detects only a fraction of the total number of photons . This consideration also becomes important when estimating the minimum required number of simulated photons to achieve high-quality results.
2.2. Mammography X-Ray Spectra
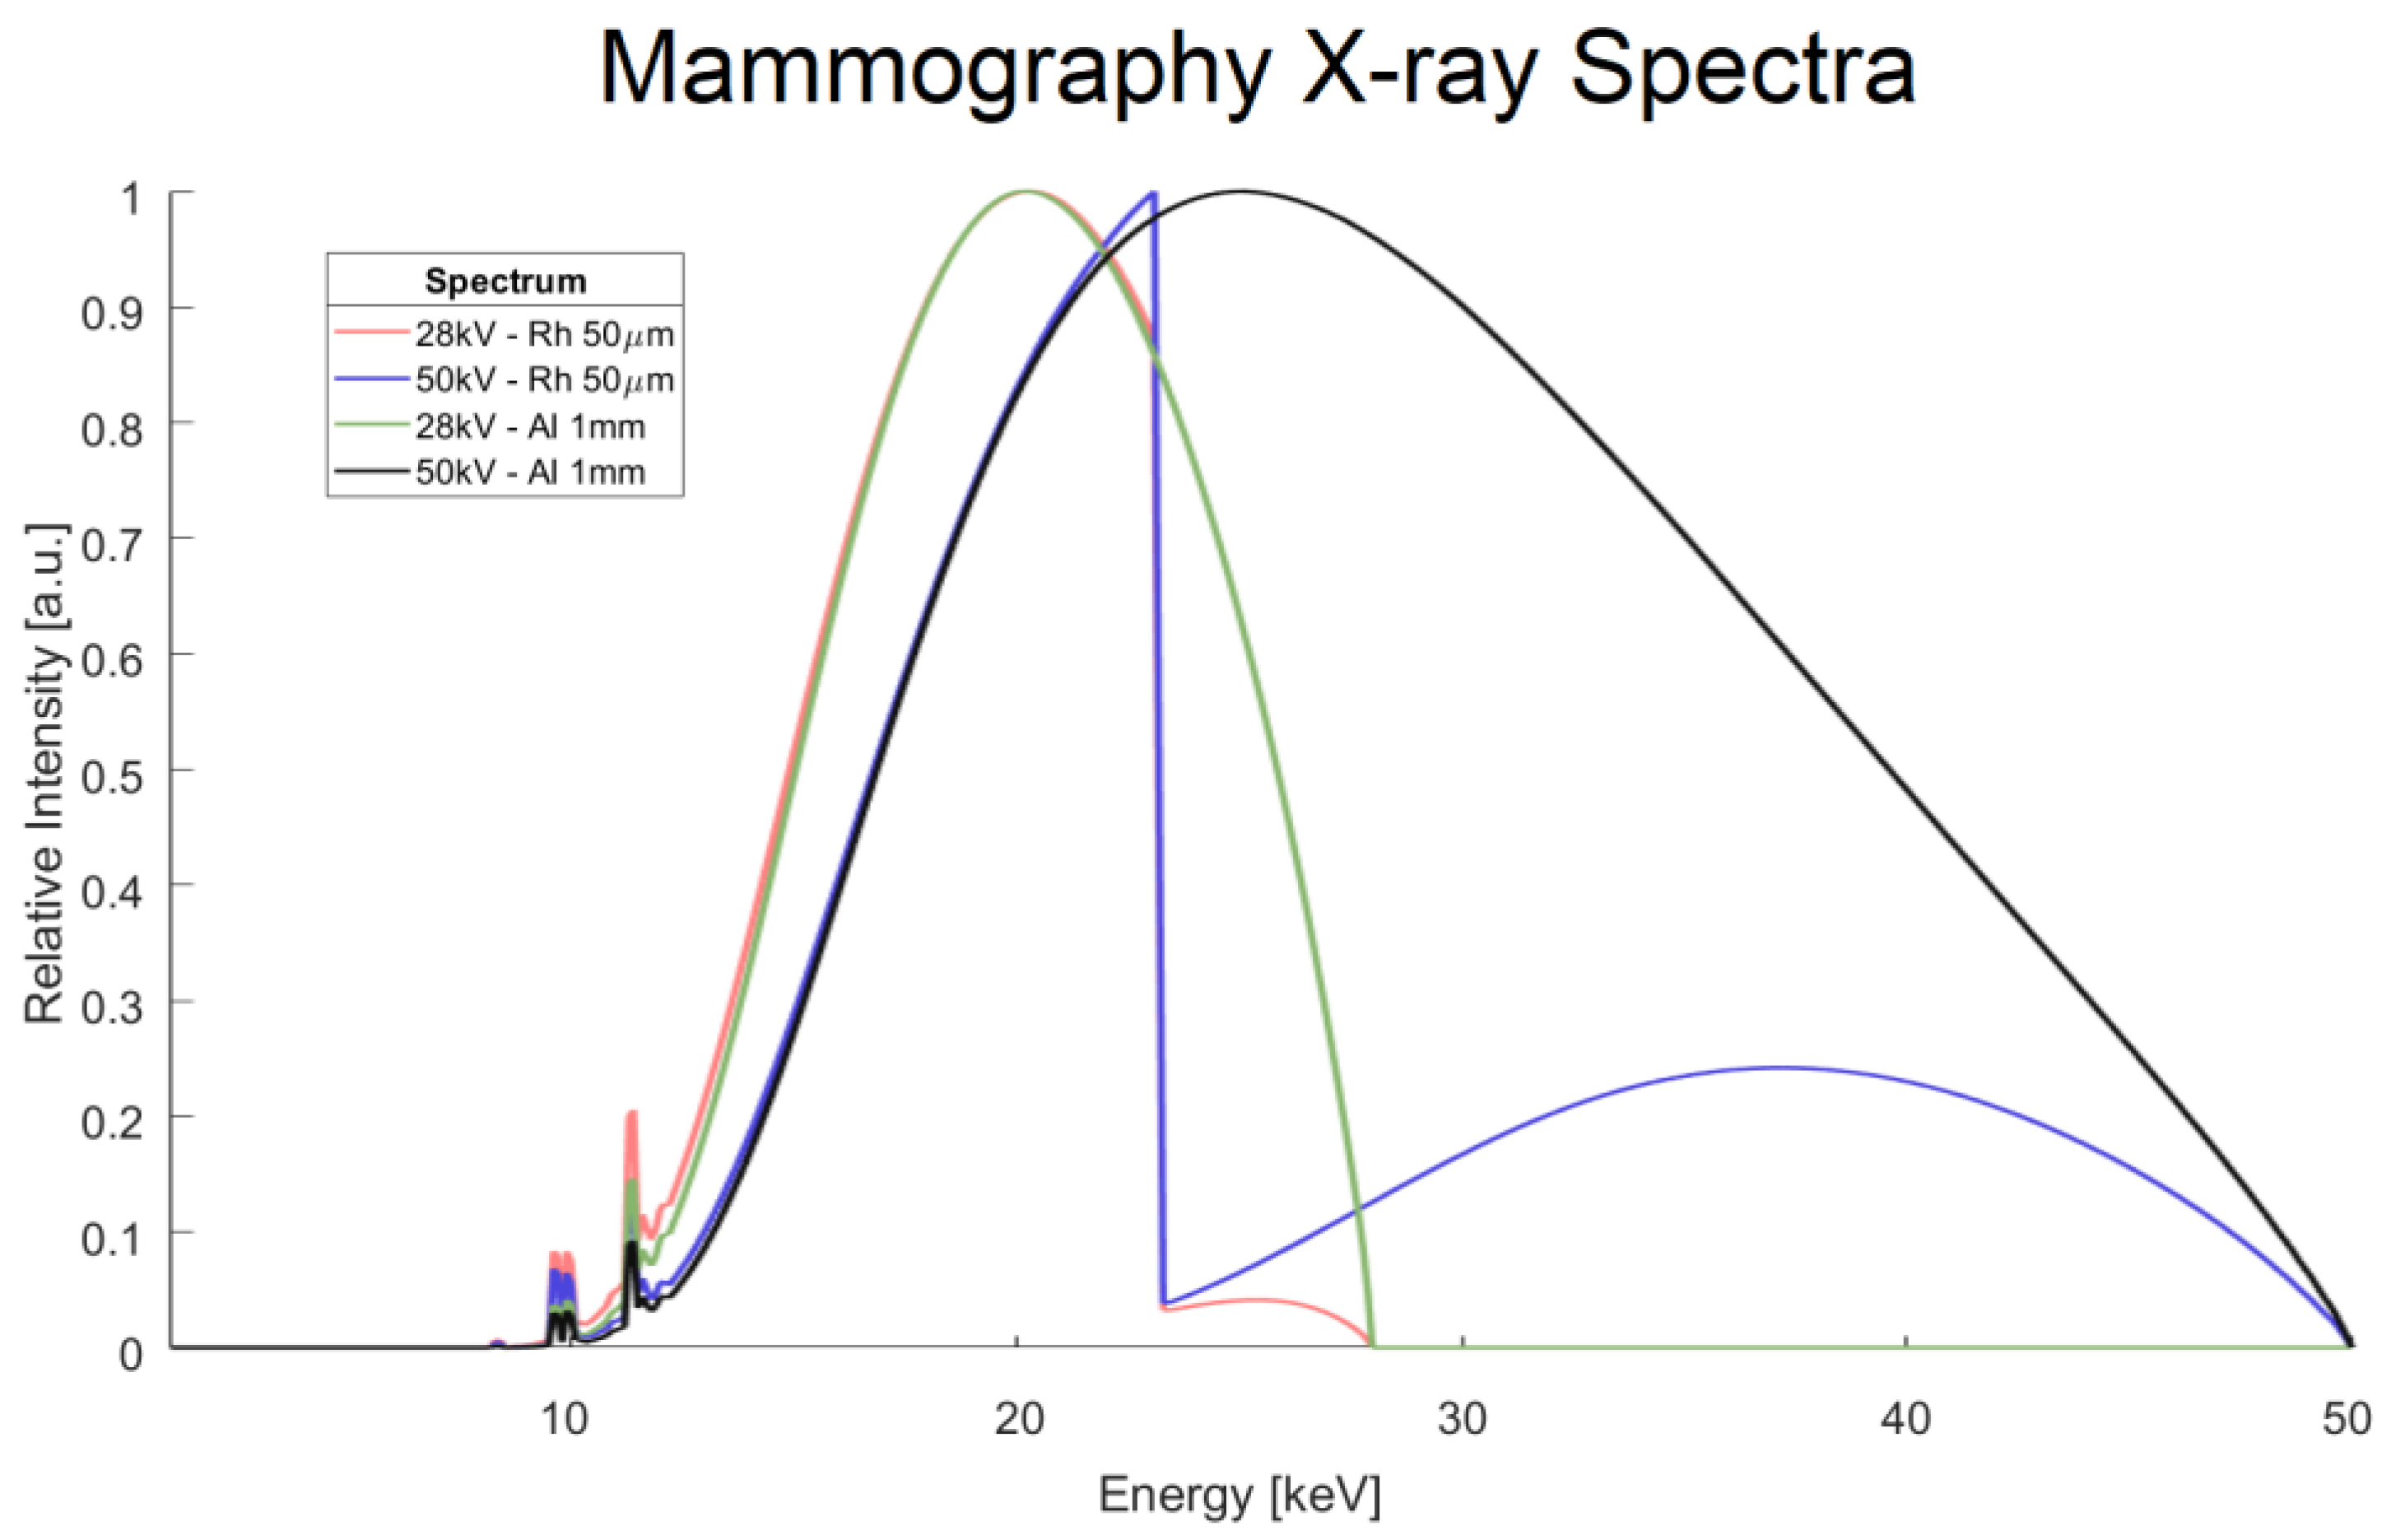
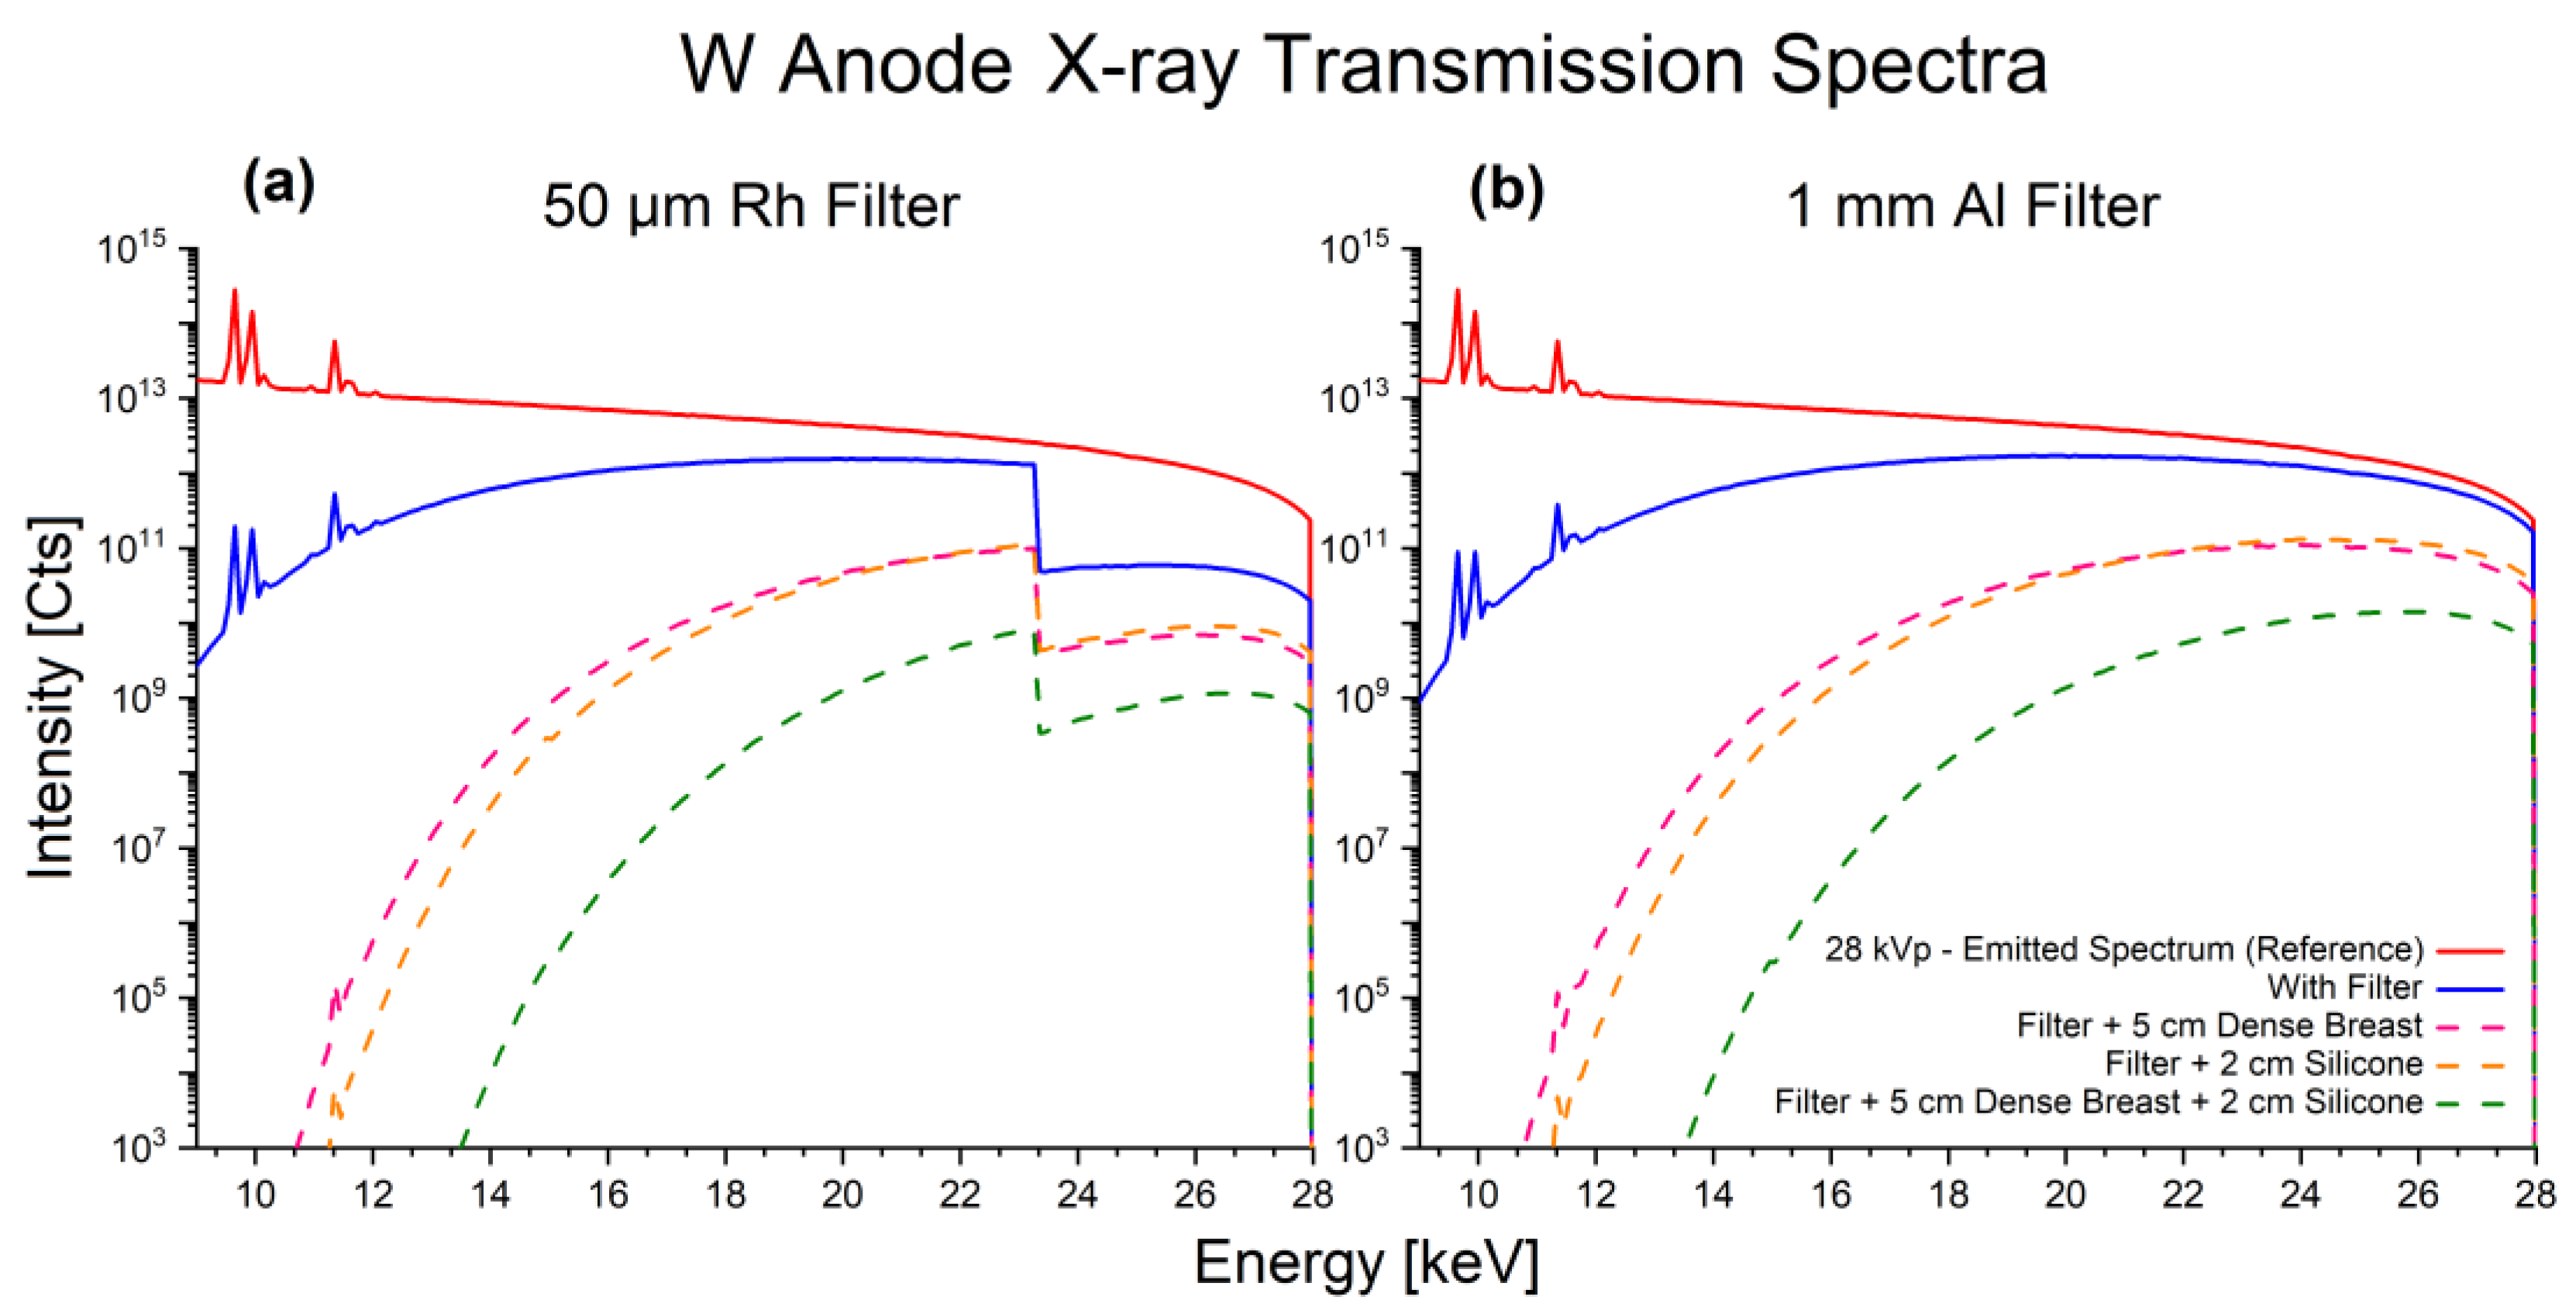
Four theoretical spectra were calculated and used for the main simulation in this study (
Figure 1). These input spectra cover relevant energy ranges for mammography imaging, and were recreated using the tool SpekPy, version 2.0.8 [
41,
42]. A tungsten (W) anode X-ray source was taken as the reference, and four tube voltage/filter combinations were then applied:
Standard mammography spectrum (): 28 kVp tube voltage, 50 µm Rh filter;
Filter-modified spectrum (): with 1 mm Al filter instead;
Voltage-modified spectrum (): 50 kVp tube voltage instead;
Filter-Voltage-modified spectrum (): 50 kVp tube voltage, 1 mm Al filter.
The spectral set was intentionally limited to four cases to isolate the effect of preserving the high-energy interval removed by Rh filtration, rather than to perform a global optimization over all mammography filter materials. All input spectra were normalized to their maximum value. Supplementary Monte Carlo simulations were performed to validate the SpekPy spectra, yielding virtually identical results. These simulations can be found in
Appendix B.1.
2.3. Mammography Simulations and Analysis
All simulations were performed using GATE (Geant4 Application for Tomographic Emission) version 9.2, a Monte Carlo framework designed to simulate physical processes in medical imaging modalities, including X-ray imaging, PET, and CT [
43,
44]. GATE provides a command interpreter that enables straightforward system configuration through manual command entry or batch scripts that define the simulation geometry and execution sequence. The standard emstandard_opt4 electromagnetic physics list was used for all simulations. No charge transport or carrier collection was modeled, and all results are based solely on radiation–matter interactions and the corresponding energy depositions in a voxelated sensor matrix. Accordingly, the detector should be interpreted as a first-order interaction model. It reproduces photon transport and deposited energy in CdTe, but does not include charge drift and diffusion, carrier trapping, incomplete carrier collection, threshold dispersion, or pile-up. The simulated energy response is therefore narrower than in a real detector, and the reported CNR values should be interpreted as idealized with respect to detector electronics. For a detailed profile of the simulation stack, please refer to
Appendix A.
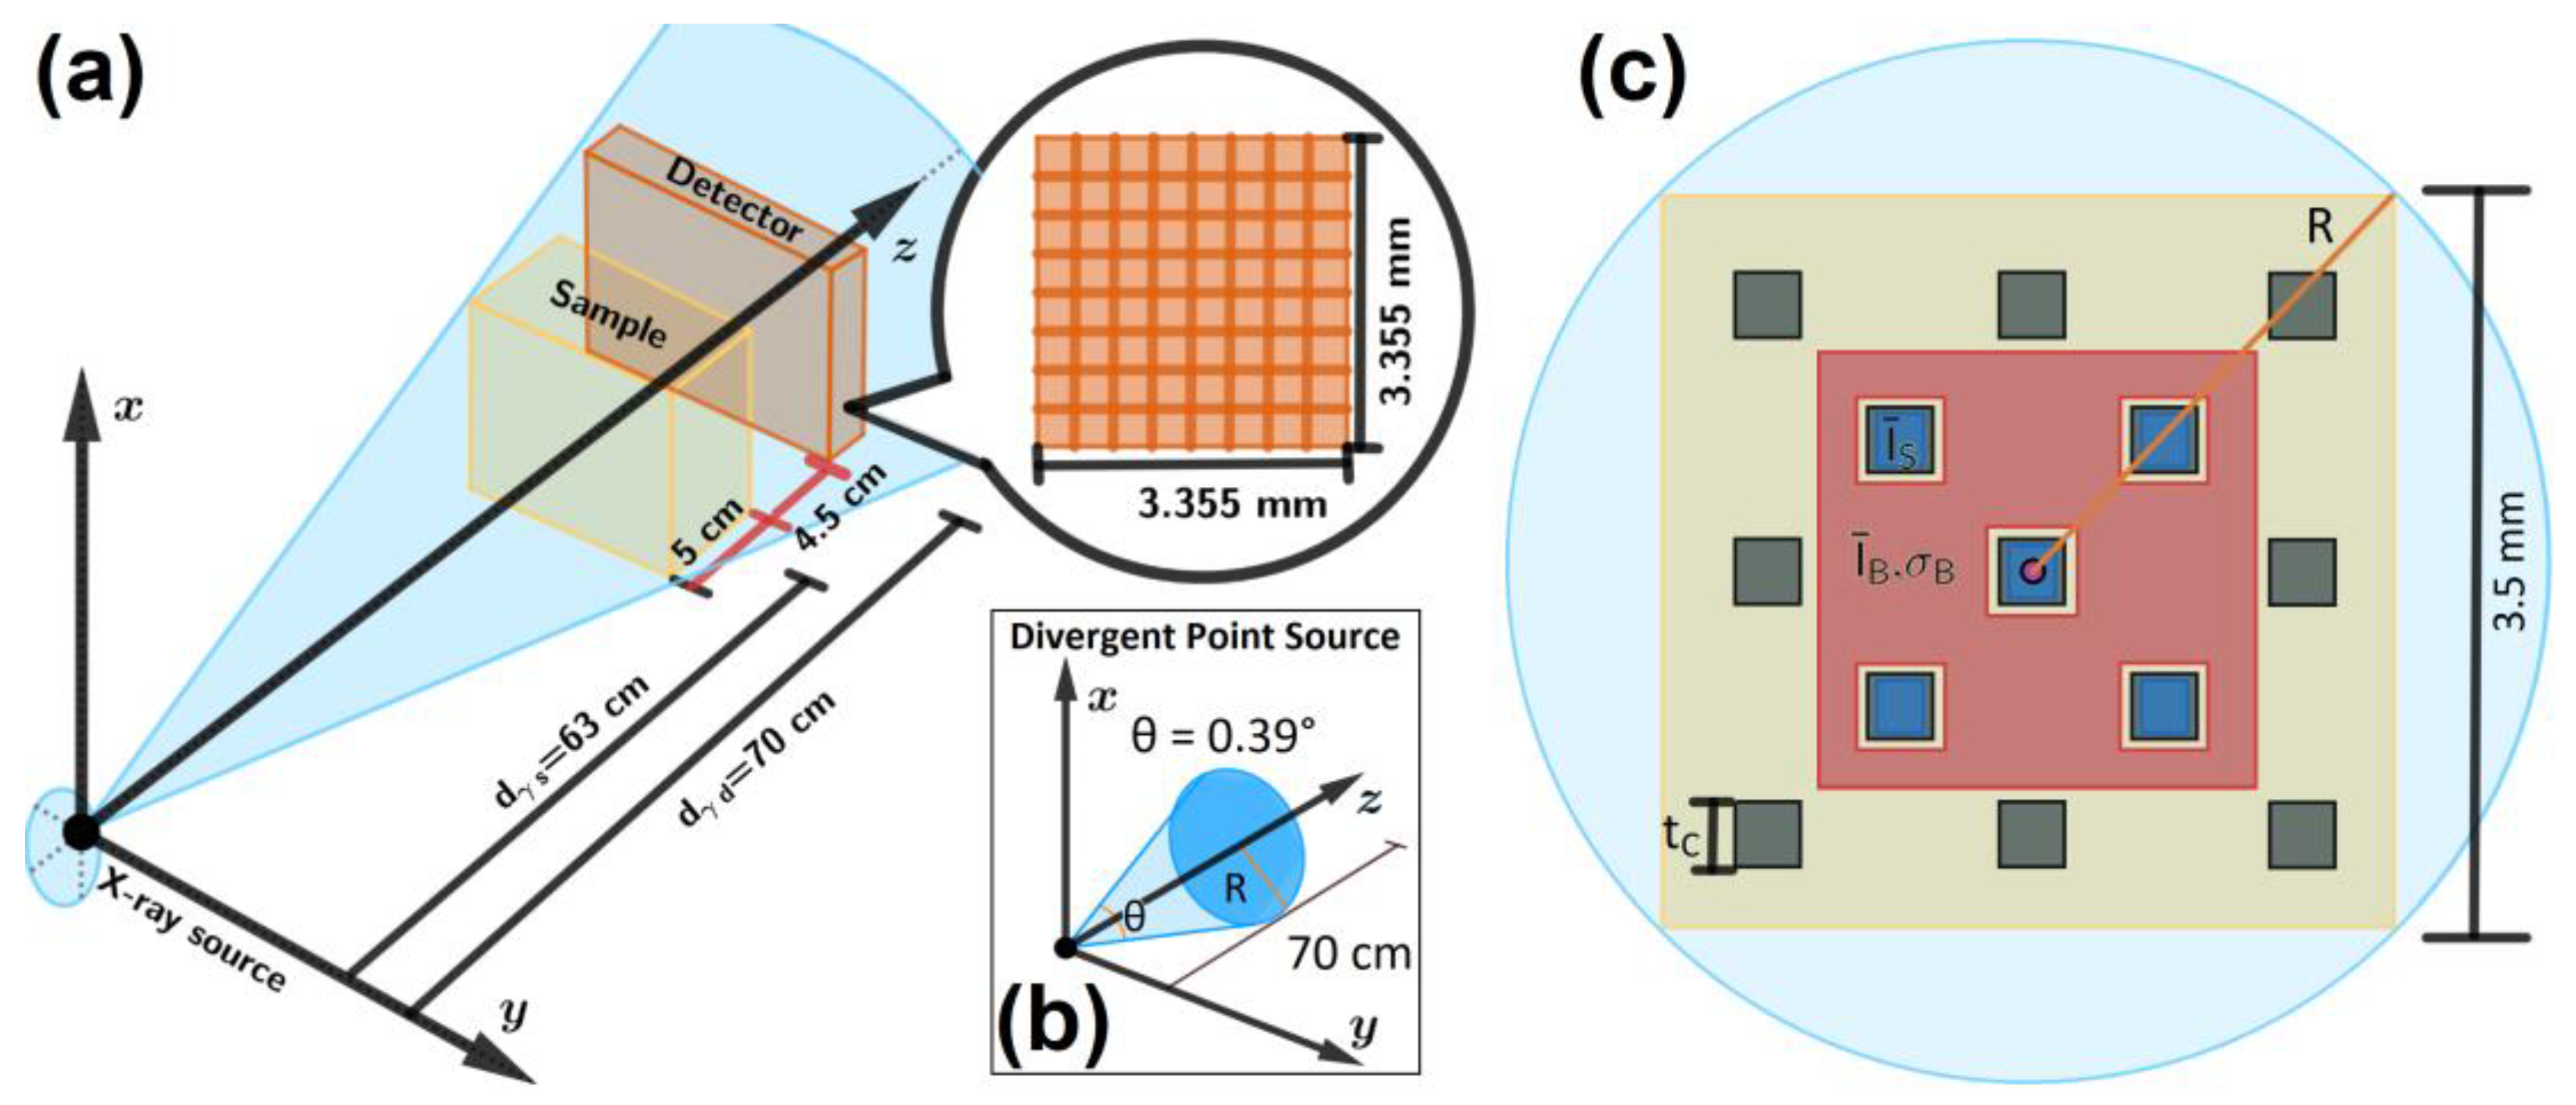
Figure 2 shows the simulation setup schematic in three sections: the imaging geometry, the X-ray source definition, and the sample geometry and segmentation scheme.
2.3.1. Imaging Geometry
The simulated imaging configuration was replicated from the geometrical parameters used in the Hologic, Inc. (Marlborough, MA, USA) Selenia Dimensions AWS5000 digital mammography system [
45]. The detector was modeled as a sensor voxel array with dimensions based on the physical characteristics of the SPCD Timepix3: a 1 mm thick CdTe semiconductor array with 55 µm pixel pitch. Each simulated voxel corresponds to one detector pixel. This sensor thickness is sufficient to achieve close to total photon absorption efficiency at mammographic X-ray energies [
23]. This supports the CdTe-specific implementation, while not excluding other high-absorption sensor materials or thicknesses capable of achieving near-total attenuation. It also matches the sensor thickness used in previous experimental studies by this research group [
20].
To optimize simulation time, a small 61 × 61 voxel matrix was defined, enough to confirm the feasibility of the proposed methods and their underlying physical principles. The detector was used for local CNR analysis, and no large-detector-size convergence study was performed, so absolute photon scatter is likely underestimated relative to a full-field breast geometry. The scatter contribution is nevertheless expected to be very low and was therefore not considered in this model. The center of the detector’s front surface was located at the position (0, 0, 70) cm, as shown in
Figure 2a.
2.3.2. X-Ray Source
The geometry of the source is shown in
Figure 2b. For ease of analysis, the X-ray source was modeled as an ideal divergent cone-beam point source with uniform intensity, allowing source-related effects such as penumbra to be decoupled from the detected intensity [
46]. It was located at the world origin, with an opening angle
and radius
chosen to cover the entire detector area while avoiding unnecessary computations for wide-angle photons that do not reach the detector. Using an ideal point source should have only a limited effect on the results, and is justified because the expected geometric unsharpness in typical mammography systems is on the order of 30 µm, below the typical detector pixel pitches of more than 70 µm. It was adopted to decouple spectral effects from source penumbra, which yields optimistic spatial resolution. Therefore, the present results do not represent full-system-level image sharpness performance.
2.3.3. Phantom
Breast density depends on the proportion of fibroglandular to adipose tissue, with denser breasts having a higher fibroglandular-to-adipose tissue ratio. The Breast Imaging Reporting and Data System (BI-RADS) [
47,
48] is a widely used framework that reduces variability in diagnostic imaging reports among radiologists. Breast composition is classified into four categories based on the visual assessment of fibroglandular content: A, almost entirely fatty; B, scattered areas of fibroglandular density; C, heterogeneously dense, which may obscure small masses; and D, extremely dense, while foregoing quantitative classification. Previous editions classified images by fibroglandular content. Categories A–D corresponded approximately to <25%, 25–50%, 50–75%, and 75–100%, respectively.
To simulate a dense breast, a block measuring 3.5 mm × 3.5 mm × 5 cm was defined, composed of 85% fibroglandular tissue and 15% adipose tissue (BI-RADS category D, 4th Edition). Its center was positioned at (0, 0, 63) cm, resulting in a geometric magnification of
. The 5 cm thickness was selected based on values reported in mammographic studies of dense breasts [
49]. Length and width were chosen to be large enough for the projected image to completely cover the detector area.
The phantom contains 13 cubic HA specks embedded in the center of the tissue block to emulate malignant lesions within the breast. They were arranged laterally in a spaced checkerboard pattern (
Figure 2c), with sufficient separation to observe each speck’s edge behavior. This number of specks provided a good compromise between sufficient statistical sampling of the attenuation signal and a reasonably short simulation time.
The speck side length
was defined such that the projected shadows aligned with the voxels’ entrance surface, avoiding intensity drops caused by partial voxel coverage.
μm was selected, which projected a shadow of 385 μm (7 voxels). This speck size is in the mid-range of those found in accreditation phantoms such as the CIRS011A [
50] and CIRS015 [
37], represents a small feature size, and should be readily detectable by mammography systems. Because a 2-pixel border was excluded from the CNR calculations, the measured signal was taken from the central region of the speck’s projection. The reported CNR is therefore expected to be only weakly sensitive to subpixel offsets, whereas smaller calcifications would be more affected by partial voxel coverage. The voxel-aligned placement defines a controlled reference case for the selected object size. In general, subpixel offsets and smaller or irregular inclusions would reduce the measured contrast.
Materials were defined using the same compound homogeneous material mixing method [
39] employed in the analytical CNR(E) model. GATE handles the calculations internally, requiring the user only to specify the constituent elements and their weight fractions. Both adipose and glandular tissues were defined as indicated in
Table 1.
2.3.4. Simulation Statistics
According to the Rose criterion, developed to evaluate the detectability of a signal in a noisy image, a CNR of 5 allows a signal to be detected with less than one part-per-million uncertainty [
51,
52]. To this end, Equation (4) can be inverted to calculate the number of detected photons required to achieve a target CNR at a specific energy for a defined set of materials and morphology:
Using Equation (5), the minimum photon intensity required to satisfy the Rose criterion can be estimated by taking 15 keV as a guide for a photon-starved low-energy bin, yielding . For the defined detector (3721 voxels), the minimum number of photons required is . Thus, emitted photons were simulated per energy bin to ensure high-statistics results with negligible quantum noise.
Equal simulation statistics were applied to flat-field calibration images. Flat-field calibration is a well-known, easily implemented standard procedure used in X-ray imaging with digital detectors [
40]. It is applied in the standard manner:
. The
operator denotes Hadamard (matrix element-wise) division. It can be mathematically proven that the final expression for Equation (4) remains invariant under a flat-field correction, provided the correction images have high statistics.
In physical detectors, flat-field images map variations in detector electronics between pixels and sensor defects, appearing as image inhomogeneities and visual artifacts. Although the simulated detector contains no defects, this standard procedure was retained to mirror standard X-ray imaging workflows, allowing methodological comparisons with experimental X-ray imaging pipelines.
2.3.5. Spectroscopic Analysis
The main polychromatic X-ray mammography simulation results were derived from a set of individual high-statistics mono-energetic simulations, performed at discrete energies
, over the range
10 keV to
50 keV in 0.5 keV increments, resulting in a batch of 81 spectral flat-field-corrected images
. The polychromatic mammography spectra were then introduced post-simulation by weighting the intensity of each mono-energetic image with the corresponding spectrum’s mono-energetic intensity at each energy step,
. The final polychromatic images were obtained by summing all weighted mono-energetic images to form the integrated-spectrum (
IS) image
(Equation (6)), which corresponds to the type of images recorded by a simple PCD without spectroscopic information:
The CNR values for the simulated
IS images were calculated using Equation (1), with the signal and background voxel regions as depicted in
Figure 2c, whereas the simulated CNR(E) curves were calculated for each energy bin from the corresponding individual spectral image, namely
. The analytical results were obtained by applying Equation (4), using the mammography spectra, the material thickness, and NIST attenuation data. All curves were normalized to allow for a direct shape comparison, revealing energy ranges of importance. CNR values calculated from these
IS images quantify image quality after spectral integration, whereas the spectroscopic CNR(E) curves are used only to identify the energy intervals that govern the behavior of the
IS images.
2.4. Monte Carlo Validation Setup
In real-life detectors, energy deposited by a single incident photon may be shared between multiple pixels. During detection, partial energy absorption occurs at the primary interaction site, while secondary photons and electrons are generated through local scattering processes within the sensor material. If the range of these particles extends beyond the primary pixel pitch, a fraction of the deposited energy will be recorded in neighboring pixels and manifest in the image as multi-pixel clusters of false low-energy photons, thereby reducing contrast and blurring edges. This effect is called charge sharing. The extent of charge sharing depends on the incident photon energy, the proximity of the primary interaction site to pixel boundaries, and the pixel size.
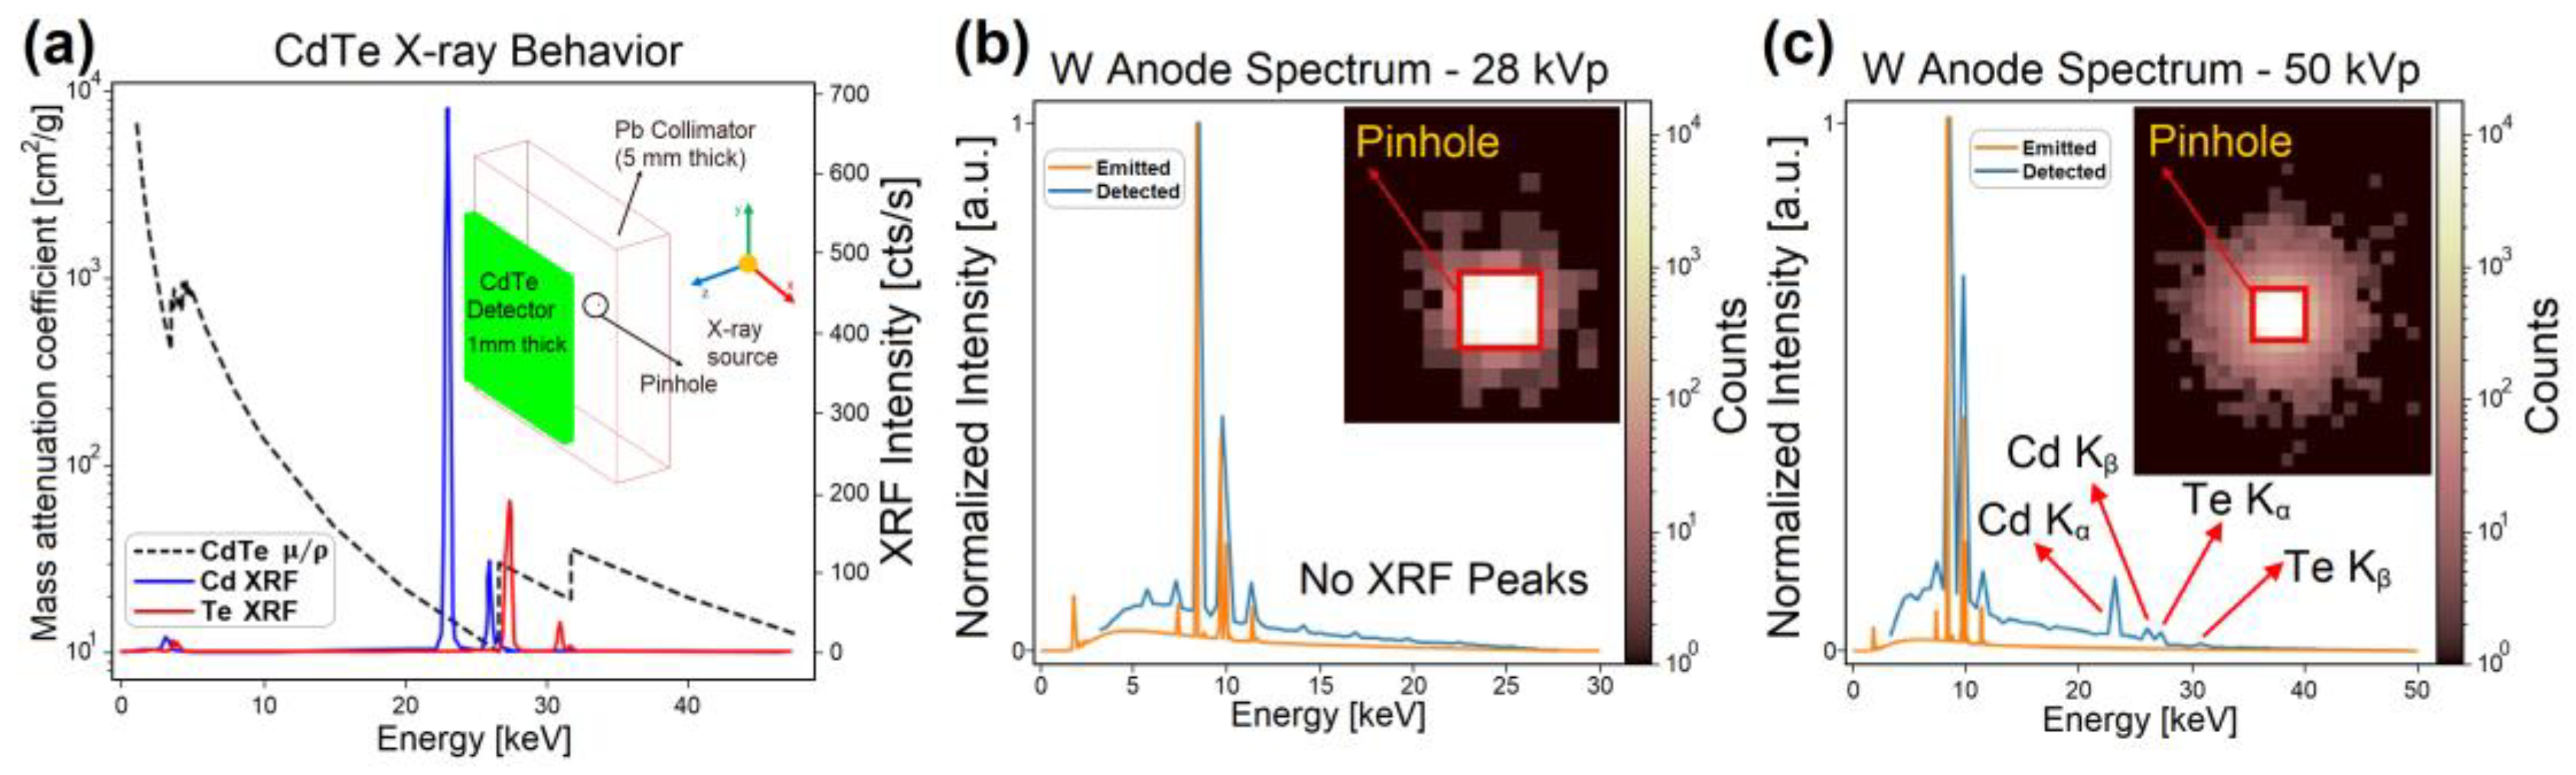
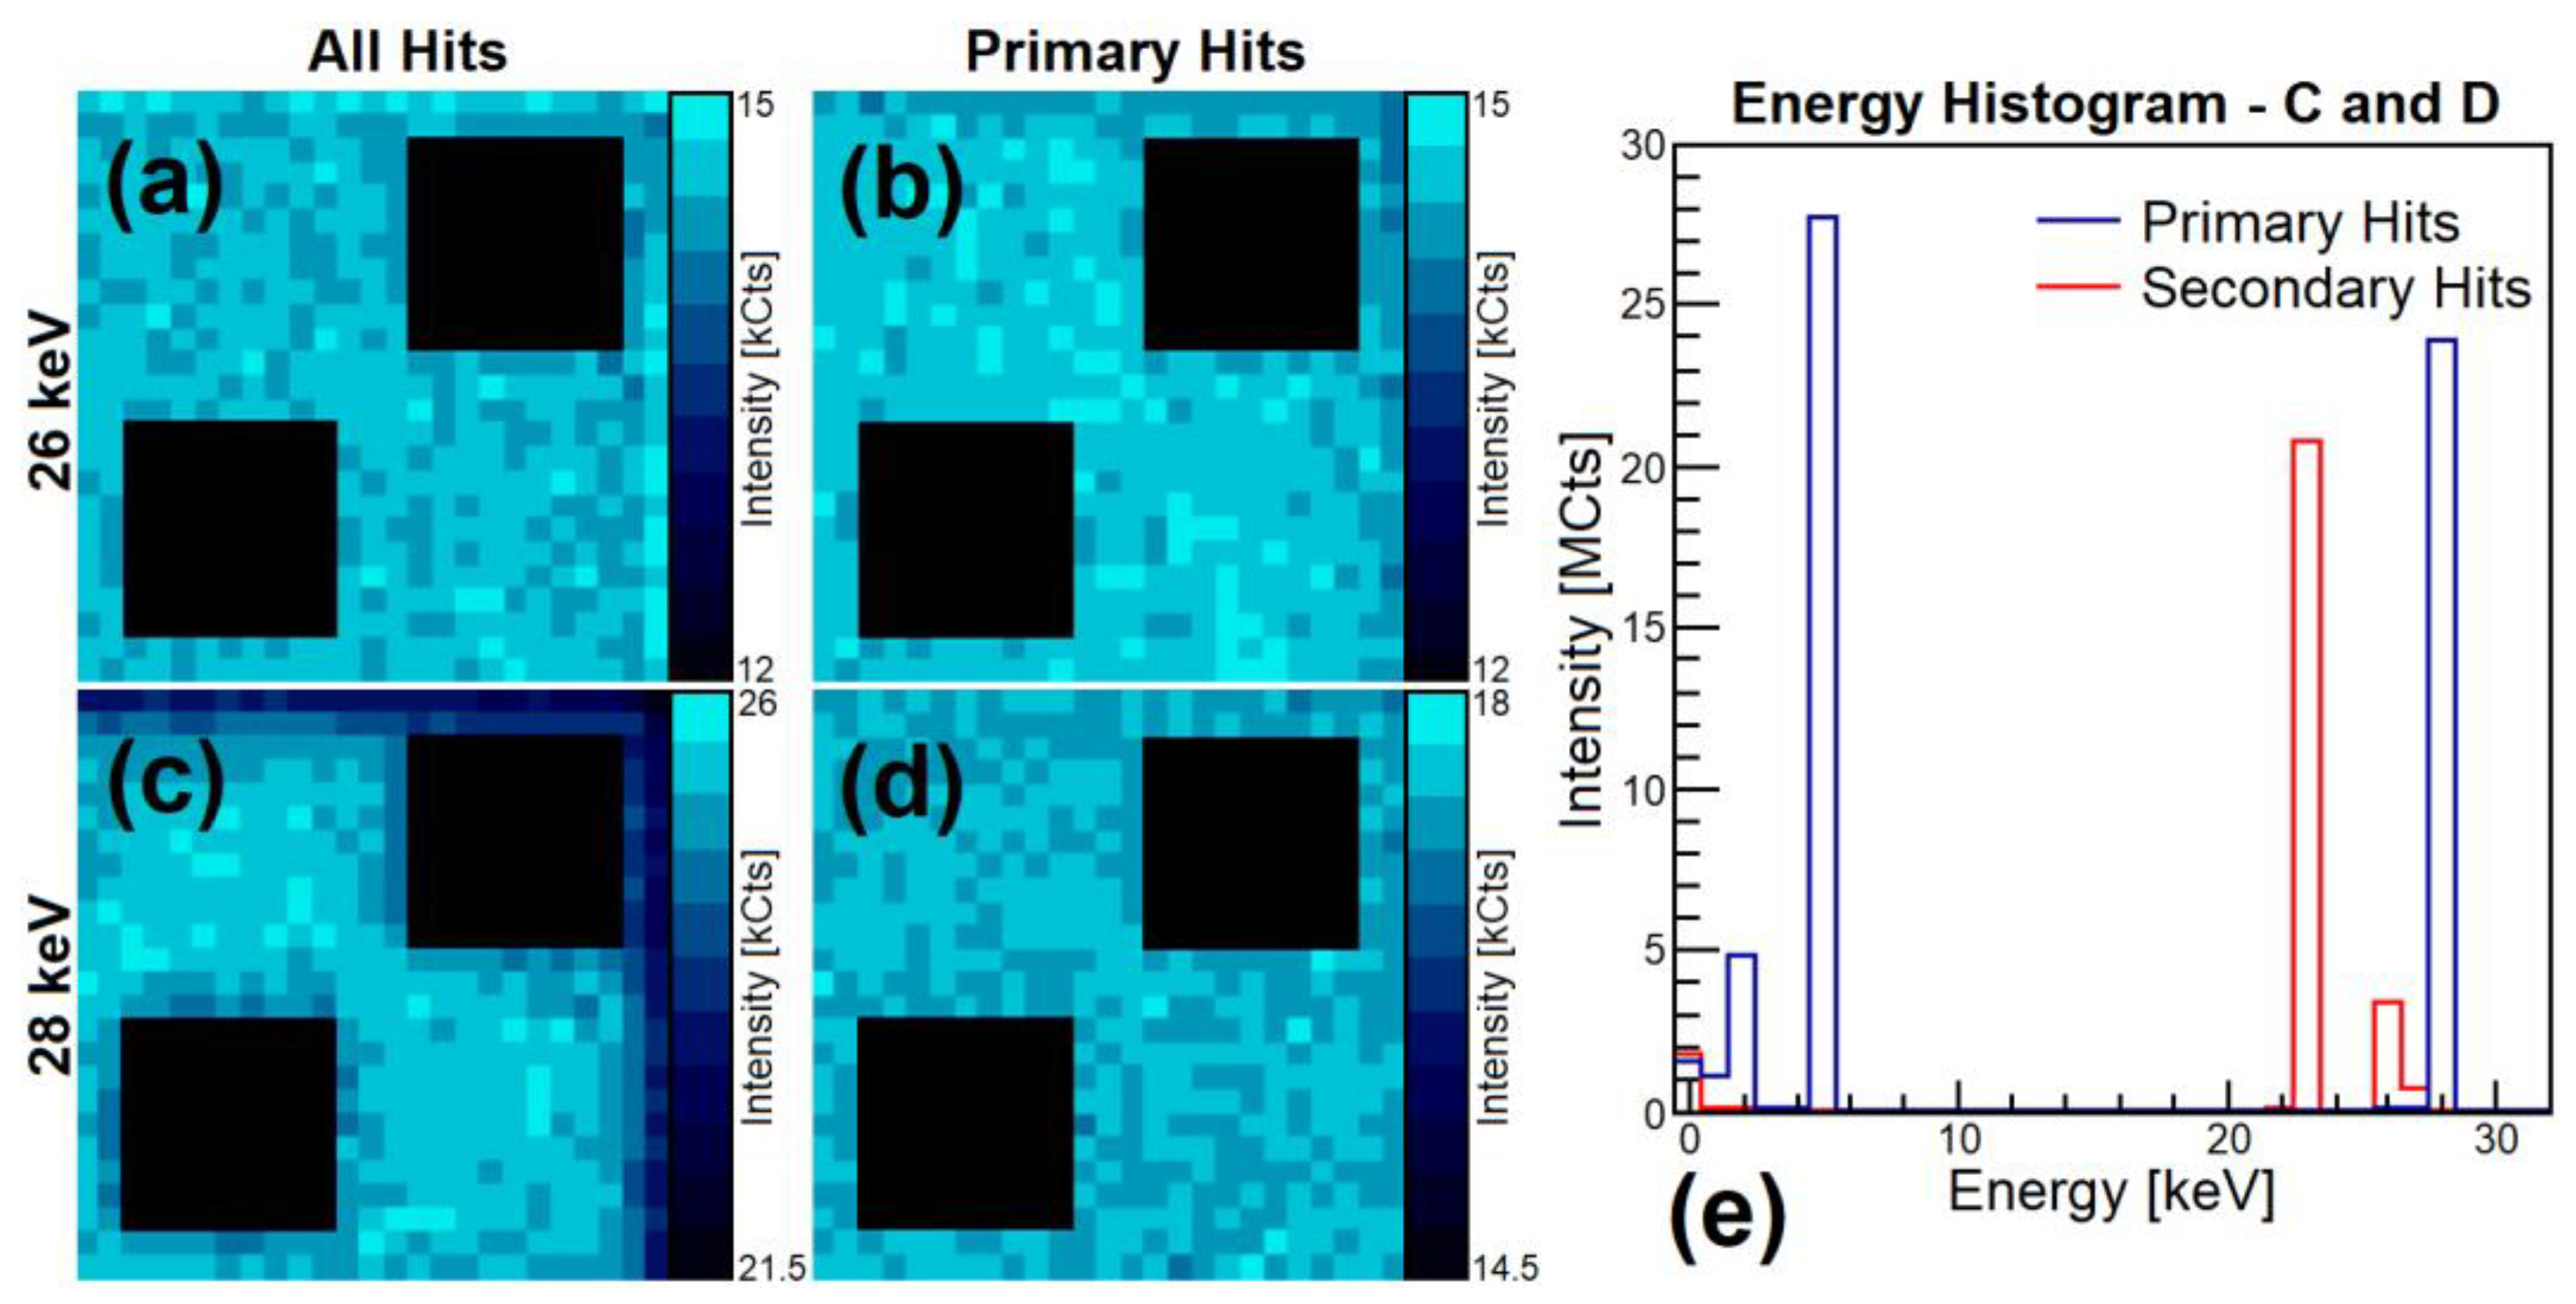
Sensor X-ray fluorescence is a particular form of charge sharing in high-Z sensor materials such as CdTe, which preferentially absorb photons at K-edge energies (26.7 keV for Cd, 31.8 keV for Te). Subsequent fluorescence photon emission occurs across the 22–32 keV energy range, with
,
, and other emission lines from both materials appearing as relaxation by-products of sensor ionization [
53], and with an expected fluorescence yield above 80% [
54]. With a mean free path of around 100 µm in CdTe, these photons can travel beyond the primary pixel boundary in pixels smaller than this scale.
It is important to confirm that sensor fluorescence is properly simulated with the defined sensor geometry and to assess its impact on the results, in a manner analogous to charge sharing in real detectors, where this effect can degrade spatial resolution and spectral fidelity if not properly accounted for [
23,
55]. Although no charge-transport dynamics are simulated, lateral energy redistribution through secondary particle generation in the sensor is expected due to the high-aspect-ratio detector elements and the mean free path of Cd K-fluorescence photons in CdTe. Therefore, this study goes beyond an attenuation comparison, because the model geometrically includes CdTe spectral effects that shift the detector response away from the ideal case.
The first validation simulation consisted of a 5 mm thick Pb slab with a square, 5-voxel-wide pinhole aperture that collimated an ideal point source, thereby limiting primary photon lateral spread. The collimator was positioned a few mm away from the sensor surface. The sensor was voxelated and sized the same as for the main mono-energetic simulation set. Two simulations were performed using the unfiltered polychromatic W emission spectra at 28 kVp (
) and 50 kVp (
), obtained from supplementary Monte Carlo simulations (see
Appendix B,
Figure A1).
The second verification test was conducted using the same imaging setup as the main mono-energetic simulation set. It was performed to investigate intense halo artifacts appearing around specks and detector edges. Two separate mono-energetic simulations were executed at 26 keV and 28 keV, surrounding the Cd K-edge energy. Detected events were classified according to their creation vertex as either primary interactions within the initial voxel or secondary particles escaping to neighboring voxels.
2.5. Experimental Validation—Breast Implant X-Ray Imaging
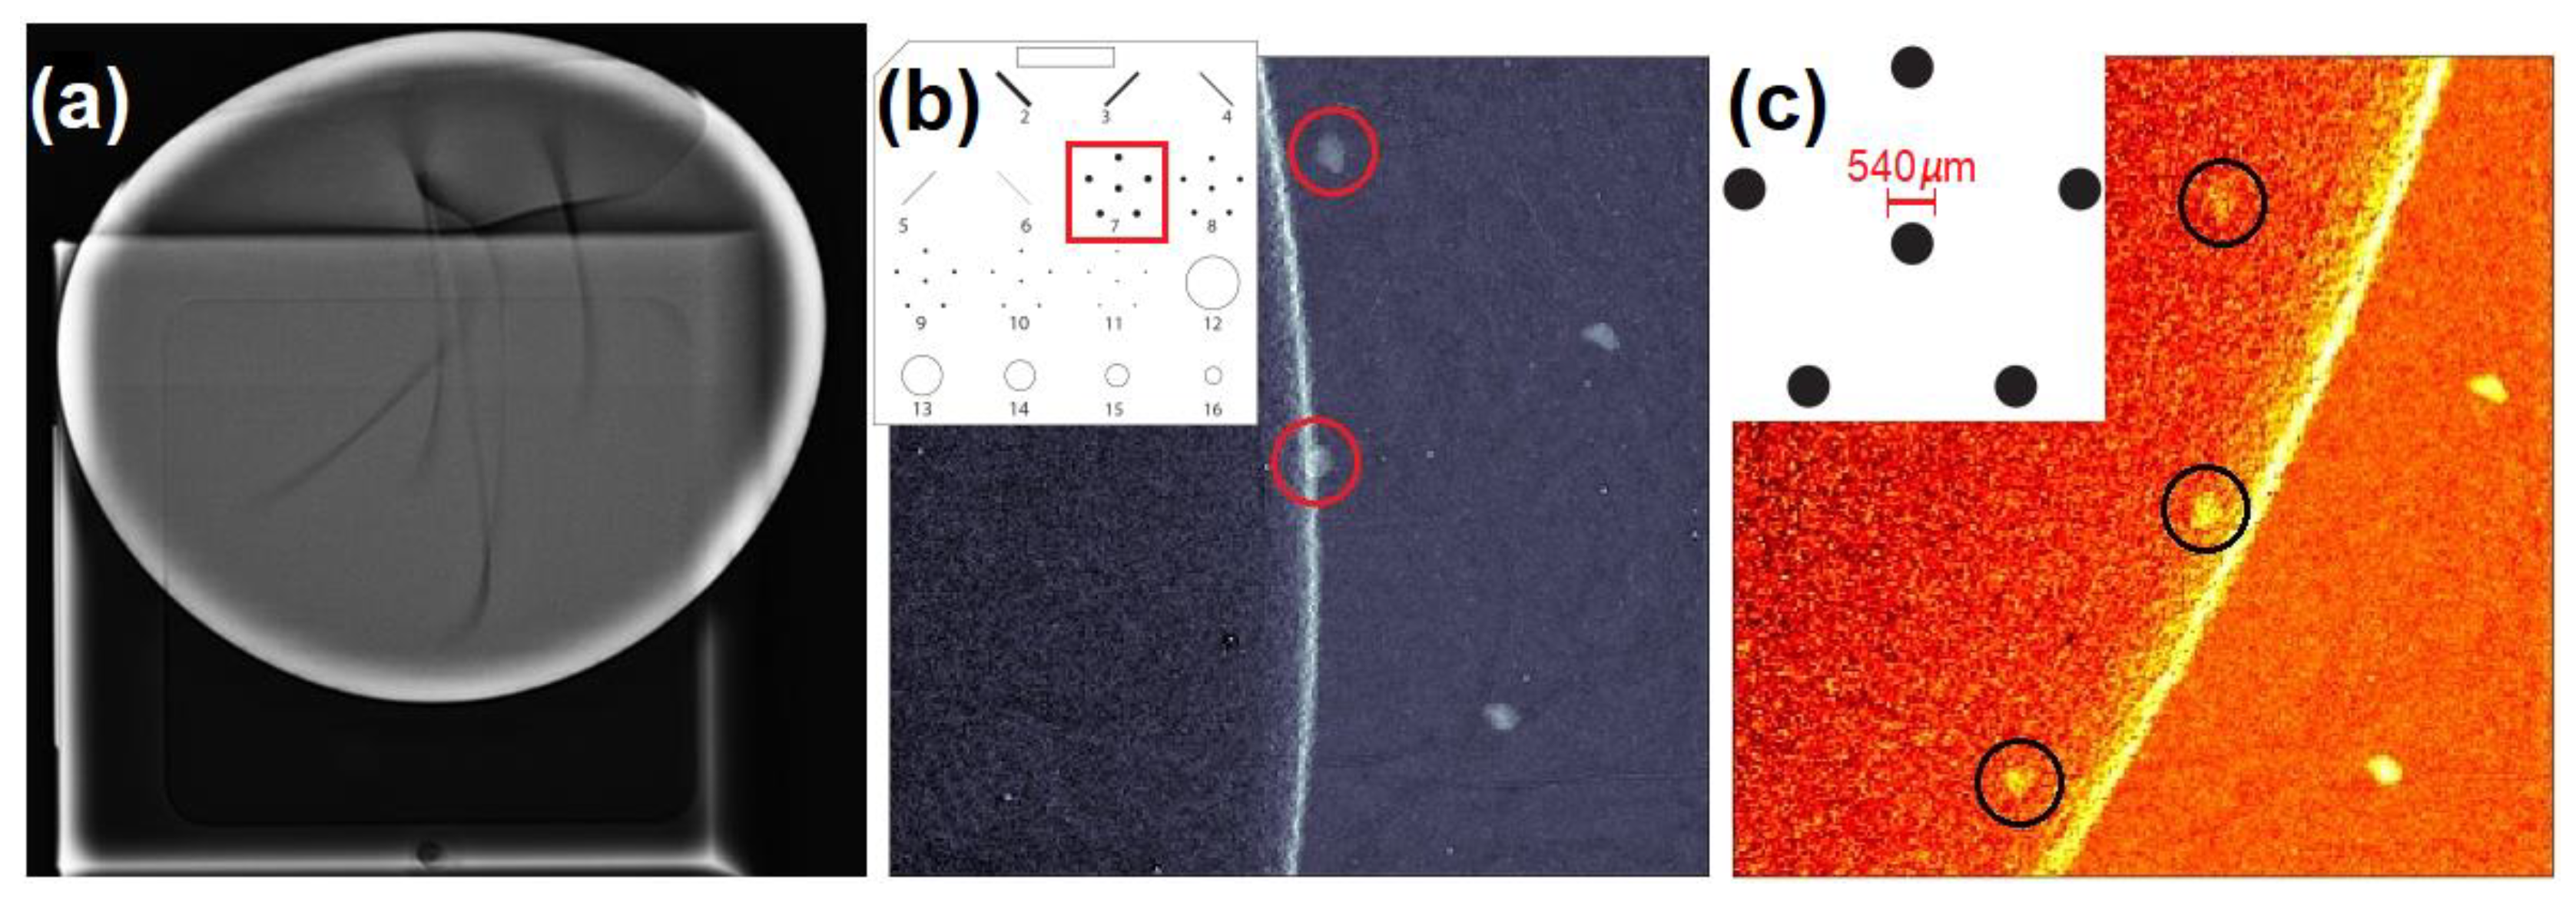
To test the study hypothesis experimentally, the extreme case of breast-implant mammography imaging was selected. The recorded sample was a CIRS015 mammography accreditation phantom [
37] with a 250 cm
3 silicone implant partially covering the region of interest (Alumina specks, diameter 540 µm). The X-ray setup was configured for mammography imaging at the Uniandes High Energy Physics Laboratory [
20]. The detector used was a Medipix3RX, supplied by the Medipix Collaboration at CERN (Geneva, Switzerland) [
21], bump-bonded to a 1 mm thick CdTe sensor, sourced from Acrorad Co., Ltd. (Okinawa, Japan), and processed at the Freiburg Materials Research Center (Freiburg, Germany). This imaging geometry replicates that of the Hologic, Inc. Selenia Dimensions AWS5000 digital mammography system [
45], consistent with the mammography simulations shown in
Figure 2, but using a Hamamatsu Photonics K.K. (Hamamatsu, Japan) µFocus polychromatic X-ray source. This imaging system had been previously dose-calibrated for a
spectrum, to allow for direct comparisons with commercial mammography systems.
Three experimental images were acquired using two different spectra. The reference image was taken in the Hologic, Inc. system, using the spectrum, delivering a standard Entrance Surface Dose (ESD) of 1.5 mGy to the sample. The second image was acquired in the laboratory at 5× the standard ESD in an attempt to increase speck visibility. The third image was also acquired in the laboratory using the spectrum and the same exposure time required to achieve one standard ESD with the spectrum. This allows for dose comparability across all images without the practical difficulties associated with system recalibration. Mean glandular dose was not used for comparability because, under the laboratory imaging conditions, the absence of a dedicated breast-dosimetry model would introduce an additional level of model dependence beyond the scope of the current study.
For the vendor system, the default CC view protocol was used, without implant displacement or access to vendor-proprietary post-processing, besides flat-field correction; for the lab system, only flat-field correction was applied. This experiment was designed as a qualitative feasibility check under implant attenuation conditions. It was not intended as a controlled cross-system comparison between the laboratory setup and the vendor system.
4. Discussion
4.1. Modified Mammography X-Ray Spectra
By analyzing the relative intensities of the recorded spectra, the energy ranges contributing most significantly to image formation can be identified. As a practical guideline, high-quality images generally require photon counts on the order of several thousand per energy bin. Energy intervals in which the CNR falls below approximately 30% of its maximum value can therefore be considered negligible, as only a minimal number of photons are detected in these regions. In all cases presented, photon energies below 14 keV contribute negligibly to image formation.
In the case of K-edge-filtered spectra, photons with energies above the filter’s K-edge can also be neglected, because any image structure that might be formed by detecting these photons is effectively lost. This has direct consequences for dense-breast and implant mammography imaging, as confirmed by both simulated and experimental results: increased CNR on simulated dense-breast material and increased microcalcification detectability through the implant. In both cases, the effect is driven by transmitted high-energy photons.
Previous studies already suggested that harder spectra and energy-resolved imaging can improve photon-counting mammography, but those results remain broad, implying that improved penetration alone is the main cause of the gain. The current results give a more precise interpretation: if beam hardening alone were responsible, the 50 kVp spectra would be expected to perform at least as well as the 28 kVp + 1 mm Al case, but they do not. This suggests that, for the present task, the optimum spectrum should at least include the high-energy tail removed by the Rh filter, which still carries useful HA speck contrast, but simply increasing photon energy up to 50 keV is actually detrimental. Therefore, there is an optimal upper photon energy, above which imaging performance deteriorates.
Because the detector is modeled as a 1 mm thick CdTe sensor, the preserved high-energy photons are still efficiently absorbed and contribute to the measured CNR. The Monte Carlo results also show that their recorded contribution is modified by Cd/Te fluorescence and inter-voxel energy redistribution, so the effect is not described by attenuation alone [
23,
56]. The result is therefore specific to the present task and detector, and should not be transferred directly to conventional charge-integrating mammography detectors without a separate analysis.
Supplementary simulations confirm that the attenuation of 2 cm of silicone closely matches that of 5 cm dense-breast tissue, supporting transferability of the result within the specific task–detector–material combinations (see
Appendix B,
Figure A1).
4.2. Mammography Simulations – Analysis
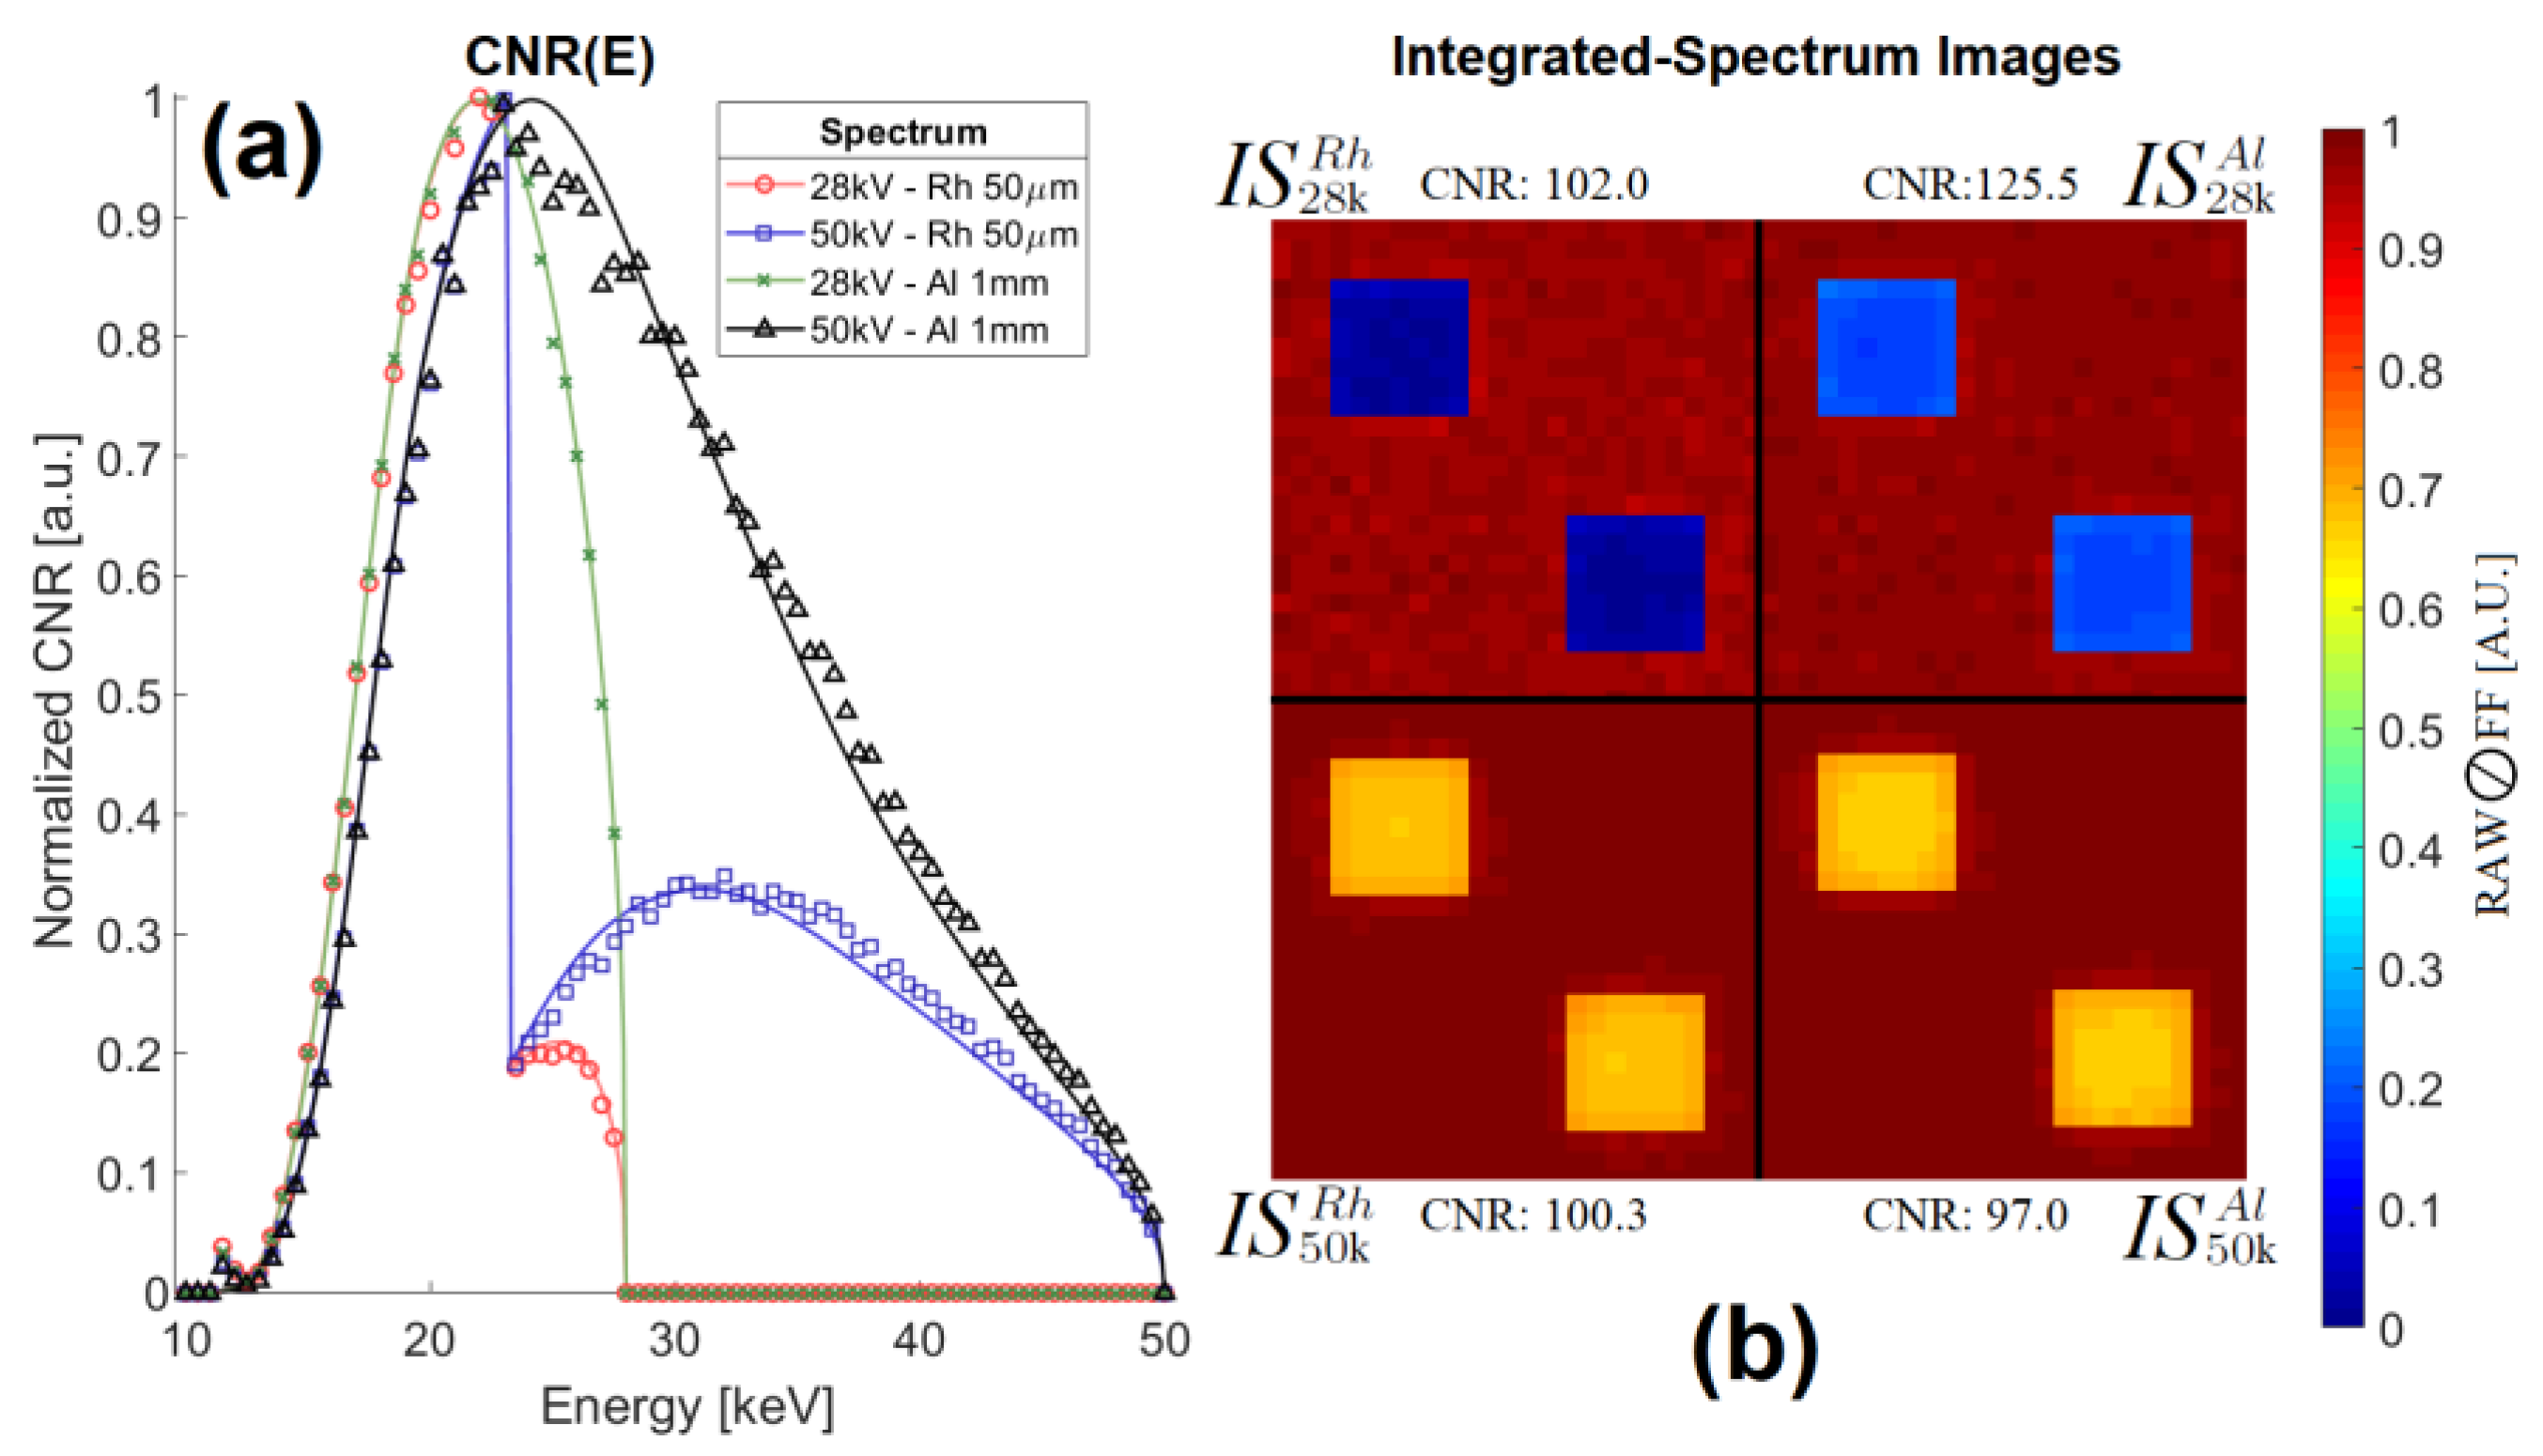
As seen in
Figure 5a, CNR is a spectrally resolved quantity. The simulated CNR(E) results are in close agreement with the analytical model (Equation (4)), confirming that the simulation behaves as expected and serves as a reliable tool for spectral analysis in the high-statistics limit, despite the absence of charge-transport calculations.
The residual differences are dominated by photon scattering, K-shell fluorescence emission with partial escape of characteristic X-rays, and inter-voxel energy redistribution caused by secondary particle generation and reabsorption. Although scattering has a low yield in the energy range used in this study, fluorescence has been shown to play an important role, and is therefore the primary source of the discrepancy. The halo artifacts persist in all monochromatic images above the Cd K-edge energy. By carefully segmenting the sample and leaving edge margins, this effect was largely mitigated in the spectroscopic results; however, its impact on spatial resolution remains evident because object edges appear blurred.
The analytical CNR(E) model should be interpreted only as a photon-statistics estimate. A full detectability analysis would require MTF/NPS or model-observer methods that account for charge transport, focal-spot blur, and subpixel object placement, all of which reduce the capture of high spatial frequencies and would lower the visibility of smaller or subpixel microcalcifications.
This is especially relevant for the simulation CNR results. Given the projected HA speck shadow sizes (385 μm, 7 image pixels), and the edge-pixel exclusions from CNR calculations (
Figure 2c), the reported CNR is less sensitive to edge blur than it would be for calcifications closer to the pixel size. These conditions support the relevance of the results for the chosen speck size, but they do not show that a full-system MTF treatment would preserve the relative grading of the tested spectra: the omitted detector- and source-level effects would reduce the absolute CNR values, but their effect on the relative grading between spectra was not quantified here. The results should therefore be interpreted as task-specific first-order spectral comparisons for the selected object size, geometry, and detector, as the study was not intended to probe the spatial-resolution limits of the system.
The simulation-based CNR(E) curves obtained represent an idealized first-order detector response limit. In practice, electron cloud broadening, threshold dispersion, charge-transport properties, bulk defects, fluorescence and residual undetected charge sharing below the threshold, all contribute to broadening, biasing and shifting the measured spectrum [
55]. For Medipix3RX CdTe/CZT systems, reported energy resolution around 27 keV is on the order of a few keV FWHM rather than sub-keV [
57]. Under a realistic detector response, the CNR(E) curves in
Figure 5a would therefore be smoother, with reduced local structure, and the apparent optimal spectral intervals would become detector-dependent, particularly near K-edges and in the fluorescence-affected region. However, spectral broadening redistributes detected counts across neighboring bins; it does not restore photons removed from photon-starved energy bins. Thus, the broader distinction between the Al- and Rh-filtered cases is expected to remain qualitatively similar for the present task, whereas the exact local maxima and optimal spectral energy ranges should not be interpreted as detector-invariant.
CNR curves show an interplay between image noise, contrast, and material attenuation. For example, the standard spectrum produced images with higher contrast but also comparatively higher noise, whereas the spectrum yielded lower-contrast images because HA becomes more transparent at higher energies, even when the background noise is reduced by the likewise greater transparency of the breast tissue. In other words, noise reduction does not always directly translate into improved object visibility.
Among the IS images obtained from Equation (6), the case had the highest CNR, whereas both performed worse. It can therefore be said that imaging performance is not monotonic with beam hardness, with the improvement coming from the retention of the transmitted photons removed by the Rh filter, combined with the high absorption efficiency of the 1 mm CdTe sensor. Conversely, simply adding higher and higher energy photons becomes detrimental above some energy value, which in this case lies below 50 keV. Finally, although the standard image exhibits the highest contrast, the background noise is also the highest. This is a direct consequence of removing the high-energy tail of the spectrum, between 23.2 keV and 28 keV.
4.3. Breast Implant X-Ray Imaging – Analysis
According to the estimated primary-incident air kerma obtained using SpekPy, the dose rates associated with the standard
spectrum and the modified
spectrum differ by approximately 5%. This is reflected in the corresponding spectra plots (
Figure 1 and
Figure A1), where the high-energy tail of the
represents a relatively small area under the curve, while the remainders of both spectra closely overlap.
Changing the filtration to 1 mm Al produces measurable image quality gains with only a small increase in estimated primary-incident air kerma: it changed the outcome from no visible specks to clear speck visibility. The spectrum performed best among the four spectra studied for the chosen task, in agreement with the trend seen in the simulations. However, this result should be interpreted as a feasibility test only, as the experimental comparison was not designed as a controlled quantitative study of CNR optimization or overall system performance.
Figure 6b also confirms that the most important factor for visibility behind dense objects in the breast is the emitted spectrum, as even a fivefold increase in emitted fluence using the standard spectrum was insufficient to achieve speck visibility with a Medipix3RX 1 mm CdTe PCD.
5. Conclusions
A Monte Carlo simulation framework for detailed spectroscopic analysis in mammography imaging was successfully implemented by constructing a voxelated detector matrix that reproduces the most relevant physical phenomena. The virtual setup simulates a standard mammography system and allows the application of any energy spectrum of interest with a flexibility that is difficult to achieve in a real clinical setting.
This flexibility enabled investigation of the spectroscopic nature of the CNR and of the additional information it can provide for image quality enhancement. These curves serve an additional purpose: they can be combined with post-processing techniques in real systems with spectroscopic capabilities to further enhance object contrast and detectability without increasing radiation exposure. Techniques such as energy weighting and material decomposition have been demonstrated to be effective analytically, in simulations, and experimentally [
22,
25,
56,
58,
59]. Yet, the spectroscopic CNR curves were used only as an analysis tool to explain the behavior of the
IS images. Any post-processing methods remained outside the scope of this study.
The simulations also confirmed CdTe sensor fluorescence, with photons above 26.72 keV generating clusters of lower-energy hits. This explains the notable discrepancies between the analytical and simulation results. In real measurements, photon clustering techniques combined with SPCDs such as Timepix3 or HEXITEC MHz allow recovery of the undistorted energy spectrum [
59], a basic post-processing step required when implementing spectroscopic techniques.
These results show that simulation-based spectral optimization is a promising approach for improving image quality in X-ray mammography of dense breasts. Among the four spectra studied, under the present simulation assumptions, the image had the highest CNR for HA speck detection in the task considered here, with a 23.11% increase relative to the standard image, while both images had worse performance. The improvement is therefore not due simply to generic beam hardening. It reflects retention of the transmitted energy interval removed by Rh filtration, together with the high absorption efficiency of a 1 mm thick CdTe sensor. The result also suggests an optimal upper photon energy above which imaging performance degrades. This conclusion is specific to the selected object size, geometry, and detector. The present study did not quantify whether full-system MTF degradation would preserve the same relative performance between spectra.
Simulation-informed spectral optimizations under laboratory conditions resulted in promising qualitative improvements in implant X-ray imaging. However, the experimental evidence in the present study is limited in scope and does not establish a general optimization result for mammography. These findings should be interpreted as a feasibility check only and not as a controlled quantitative study of CNR optimization or full-system performance.
Future work can extend this study in several directions. Subsequent studies can extend the present comparison by incorporating MTF/NPS or model-observer analysis, using a more realistic detector response, and systematically exploring tube potentials and filtration using different materials, including clinically common mammography filters and other candidate materials for dense-breast imaging. They should also consider sample size, shape, and subpixel-position sweeps in heterogeneous breast backgrounds.
The new capabilities of SPCDs open additional possibilities for X-ray imaging optimization by enabling the study of appropriate filter/spectrum combinations and post-processing algorithms that leverage the available spectroscopic information, potentially increasing image quality and/or reducing radiation exposure. Furthermore, SPCDs will be crucial for the continued development and refinement of medical X-ray imaging as spectroscopic information becomes increasingly available in clinical settings.



 ,
,