


Featured Application
Combining ultrasound-derived assessment of vastus lateralis cross-sectional area at the mid-thigh (35–50% of femur length) with force–velocity profiling provides a practical framework to individualize hypertrophy-oriented resistance training programs aimed at improving squat-specific force–power performance in young elite acrobatic gymnasts. Targeted development of vastus lateralis muscle size may be particularly relevant for optimizing performance in athletes performing the base role.
Abstract
Muscle size and architecture’s contribution to force and power production in young female acrobatic gymnasts (ACROs) remains unclear. This cross-sectional study examined the associations between quadriceps muscle size and architecture and strength–power performance in young elite female ACROs. Twenty base athletes (12–18 years) underwent ultrasound assessment of rectus femoris (RF) and vastus lateralis (VL) cross-sectional area (CSA), VL muscle volume, VL fascicle length, and VL pennation angle. Participants were additionally classified as pre/mid-pubertal (Tanner stages 1–3) and post-pubertal (Tanner stages 4–5) for descriptive analyses. Performance testing included one-repetition maximum (1RM) squat and hang power clean (HHPC), squat power (Pmax), and countermovement jump (CMJ). In adjusted (Tanner stage and height) linear regression models, VL CSA at 35% and 50% of femur length was positively associated with 1RM squat (β = 2.38–2.31 kg·cm−2; p = 0.031–0.011) and Pmax (β = 45.75–38.43 W·cm−2; p < 0.001). No associations were observed for CMJ, HHPC, or RF variables. Mid-thigh VL size appears to be an independent predictor of squat strength and power in ACRO.
1. Introduction
In sport performance contexts, athletes’ morphological and neuromuscular characteristics are shaped by both sport-specific demands and training exposure, and these features may partly explain inter-individual differences in strength and power capacities [1,2]. Acrobatic gymnastics is an early-specialization discipline that has grown substantially among young female athletes and combines highly technical choreographic elements with demanding strength-based tasks performed individually and in pairs or groups [1,3]. Within this sport, athletes typically adopt distinct roles. “Bases”, who are generally taller and heavier than “tops”, must generate high levels of lower-limb force and maintain stability to support partner loading during static pyramids and transitional phases, whereas “tops” rely relatively more on low body mass and flexibility [1]. Consequently, lower-limb force and power are central determinants of performance, particularly for bases who repeatedly execute forceful actions under time constraints and partner-induced loads [4,5].
Strength and power are not only determined by neural factors and training status but are also strongly influenced by skeletal muscle morphology and architecture. Muscle cross-sectional area (CSA) is a primary determinant of maximal force-generating capacity, while architectural features such as fascicle length and pennation angle modulate force transmission and contraction velocity, thereby contributing to power output and force–velocity behavior [6]. These muscle parameters can be assessed non-invasively and reliably using ultrasonography [7], enabling sport-specific profiling, and potentially informing individualized training prescriptions [6]. In parallel, the force–velocity (F–V) relationship provides an integrative description of an athlete’s mechanical capacities across the spectrum from high-force/low-velocity to low-force/high-velocity actions, and it has been widely used to characterize performance profiles in multi-joint tasks such as squatting and jumping [8,9]. In the present context, F–V profiling was included to provide a mechanical characterization of squat performance (e.g., maximal power), which may be influenced by underlying muscle morphology. In gymnastics sports, the ability to produce high force rapidly is critical for both explosive actions (e.g., take-offs) and quasi-isometric/static elements requiring high joint moments and postural control [5,10].
Despite the relevance of muscle architecture and mechanical profiling in youth athletes, evidence remains limited in young female acrobatic gymnasts, and especially in bases, who face unique loading patterns (partner support, sustained static holds, and repeated transitions). Previous studies have examined anthropometric profiles across acrobatic gymnastics categories [1] and neuromuscular training’s effects on muscle architecture and stretch–shortening cycle function in trained female young gymnasts [10], but not their direct association with strength and power performance in base athletes. However, it is still unclear whether quadriceps femoris architecture is independently associated with strength and power outcomes once biological maturation and body size are considered. This gap is practically relevant because identifying the morphological correlates of performance may help practitioners optimize strength and power development while accounting for maturation-related changes in adolescence [6].
Therefore, this study aimed to examine the associations between quadriceps muscle size and architecture, focusing on rectus femoris (RF) and vastus lateralis (VL) CSA, muscle volume, VL fascicle length, and VL pennation angle, and strength and power performance outcomes (one-repetition maximum (1RM) in the back squat (SQ), hang power clean from the mid-thigh position (HHPC), squat power, and countermovement jump height (CMJ)) in young elite female acrobatic gymnasts performing the base role. Additionally, we evaluated whether these associations remained after adjustment for pubertal maturation (Tanner stage) and height. We hypothesized that vastus lateralis muscle morphology would be positively associated with squat strength and power, given its role in knee extensor torque during multi-joint movements, and that these relationships would persist after controlling for maturation and height.
2. Materials and Methods
2.1. Participants
Twenty young elite female acrobatic gymnasts (12–18 years) performing the base role voluntarily participated in this cross-sectional study. Athletes were recruited from a single high-level acrobatic gymnastics club (Acrobatik, Comunidad Valenciana, Spain) and were actively training (~4 sessions·week−1, 90–120 min·session−1). Initial contact was established with the coaching staff to obtain permission to conduct the study; however, coaches were not involved in participant recruitment or in the decision-making process. Subsequently, the research team conducted an informational meeting with athletes and their legal guardians, during which all study procedures, potential risks, and benefits were explained in detail. Participants were explicitly informed that their participation was entirely voluntary and that their decision would not influence their training conditions, team status, or relationship with coaches. All participants had at least one year of experience with structured resistance training and were familiar with the exercises and testing procedures. Inclusion criteria were (i) current participation in acrobatic gymnastics as a base athlete; (ii) competitive level (national or international); and (iii) ability to perform maximal-effort testing. Exclusion criteria were (i) performing the top role; (ii) current musculoskeletal injury or recent injury limiting maximal performance; and (iii) any medical condition or contraindication to intense exercise. All eligible athletes who met the inclusion criteria and agreed to participate were included in the study. The final sample size (n = 20) reflects the limited availability of athletes fulfilling the specific characteristics required (young elite acrobatic gymnasts performing the base role), representing a highly specialized population. Participants and their legal guardians received written and verbal information about study procedures, potential risks, and benefits, and provided written informed consent prior to testing. Athletes were instructed to avoid strenuous exercise for 48 h before each testing session and to attend the training facility in a rested state. The study was conducted in accordance with the Declaration of Helsinki and approved by the Ethics Committee of the Technical University of Madrid (approval code: 2022-038).
2.2. Experimental Approach to the Problem
The present study was a cross-sectional, observational, non-controlled design aimed at examining the associations between quadriceps muscle morphology and strength–power performance in young elite female acrobatic gymnasts (ACROs) performing the base role. Two testing sessions were carried out, separated by 48–72 h, by the same evaluators during the competitive season (July 2024) at the athletes’ regular training facilities (Club Acrobatik, Comunidad Valenciana, Spain). At the first testing session, biological maturation, anthropometry, body composition, ultrasound-derived muscle architecture, and CMJ performance were assessed. At the second session, participants performed an incremental squat loading protocol to determine the individual force–velocity (F-V) relationship, followed by one-repetition maximum (1RM) testing in the squat and hang power clean exercises. All testing sessions were conducted in the morning to minimize circadian variability.
2.3. Procedures
2.3.1. Biological Maturation
Biological maturation was assessed using self-reported pubertal development according to the Tanner scale (stages I–V). Participants received standardized instructions on how to complete the questionnaire to improve the accuracy of self-assessment. This method has been previously validated and shown to provide acceptable agreement with clinician-assessed Tanner staging in adolescent populations [11]. Participants completed a standardized questionnaire based on schematic drawings representing breast and pubic hair development, selecting the stage that best matched their status. Tanner stage was used both as a continuous variable in regression models to account for maturation-related variability and as a categorical variable for descriptive comparisons. For descriptive purposes, athletes were classified as pre/mid-pubertal (Tanner stages 1–3) or post-pubertal (Tanner stages 4–5) [12]. This approach allowed us to account for maturation as a confounding factor while also providing a descriptive characterization of the sample.
2.3.2. Anthropometry and Body Composition
Height was measured using a calibrated stadiometer (±0.1 cm) (Seca, Hamburg, Germany), with participants barefoot and positioned according to standardized procedures previously reported. Body composition was assessed by a segmental bioelectrical impedance analyzer (Tanita BC-601 Segment, Tanita Corp., Tokyo, Japan). All participants followed a standardized protocol (e.g., removal of metal accessories, voiding immediately beforehand, and in absence of menstruation) to minimize measurement variability. The variables obtained included body fat percentage (%), fat mass (kg), fat mass index (FMI; kg·m−2), muscle mass (% and kg), and muscle mass index (MMI; kg·m−2). Body mass index (BMI) was calculated as body mass divided by height squared (kg·m−2). FMI and MMI were calculated as fat mass and muscle mass divided by height squared, respectively. All measurements were performed in the morning under standardized conditions [13].
2.3.3. Muscle Architecture Assessment
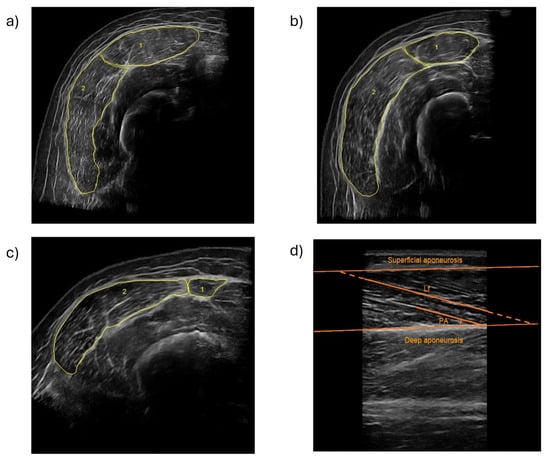
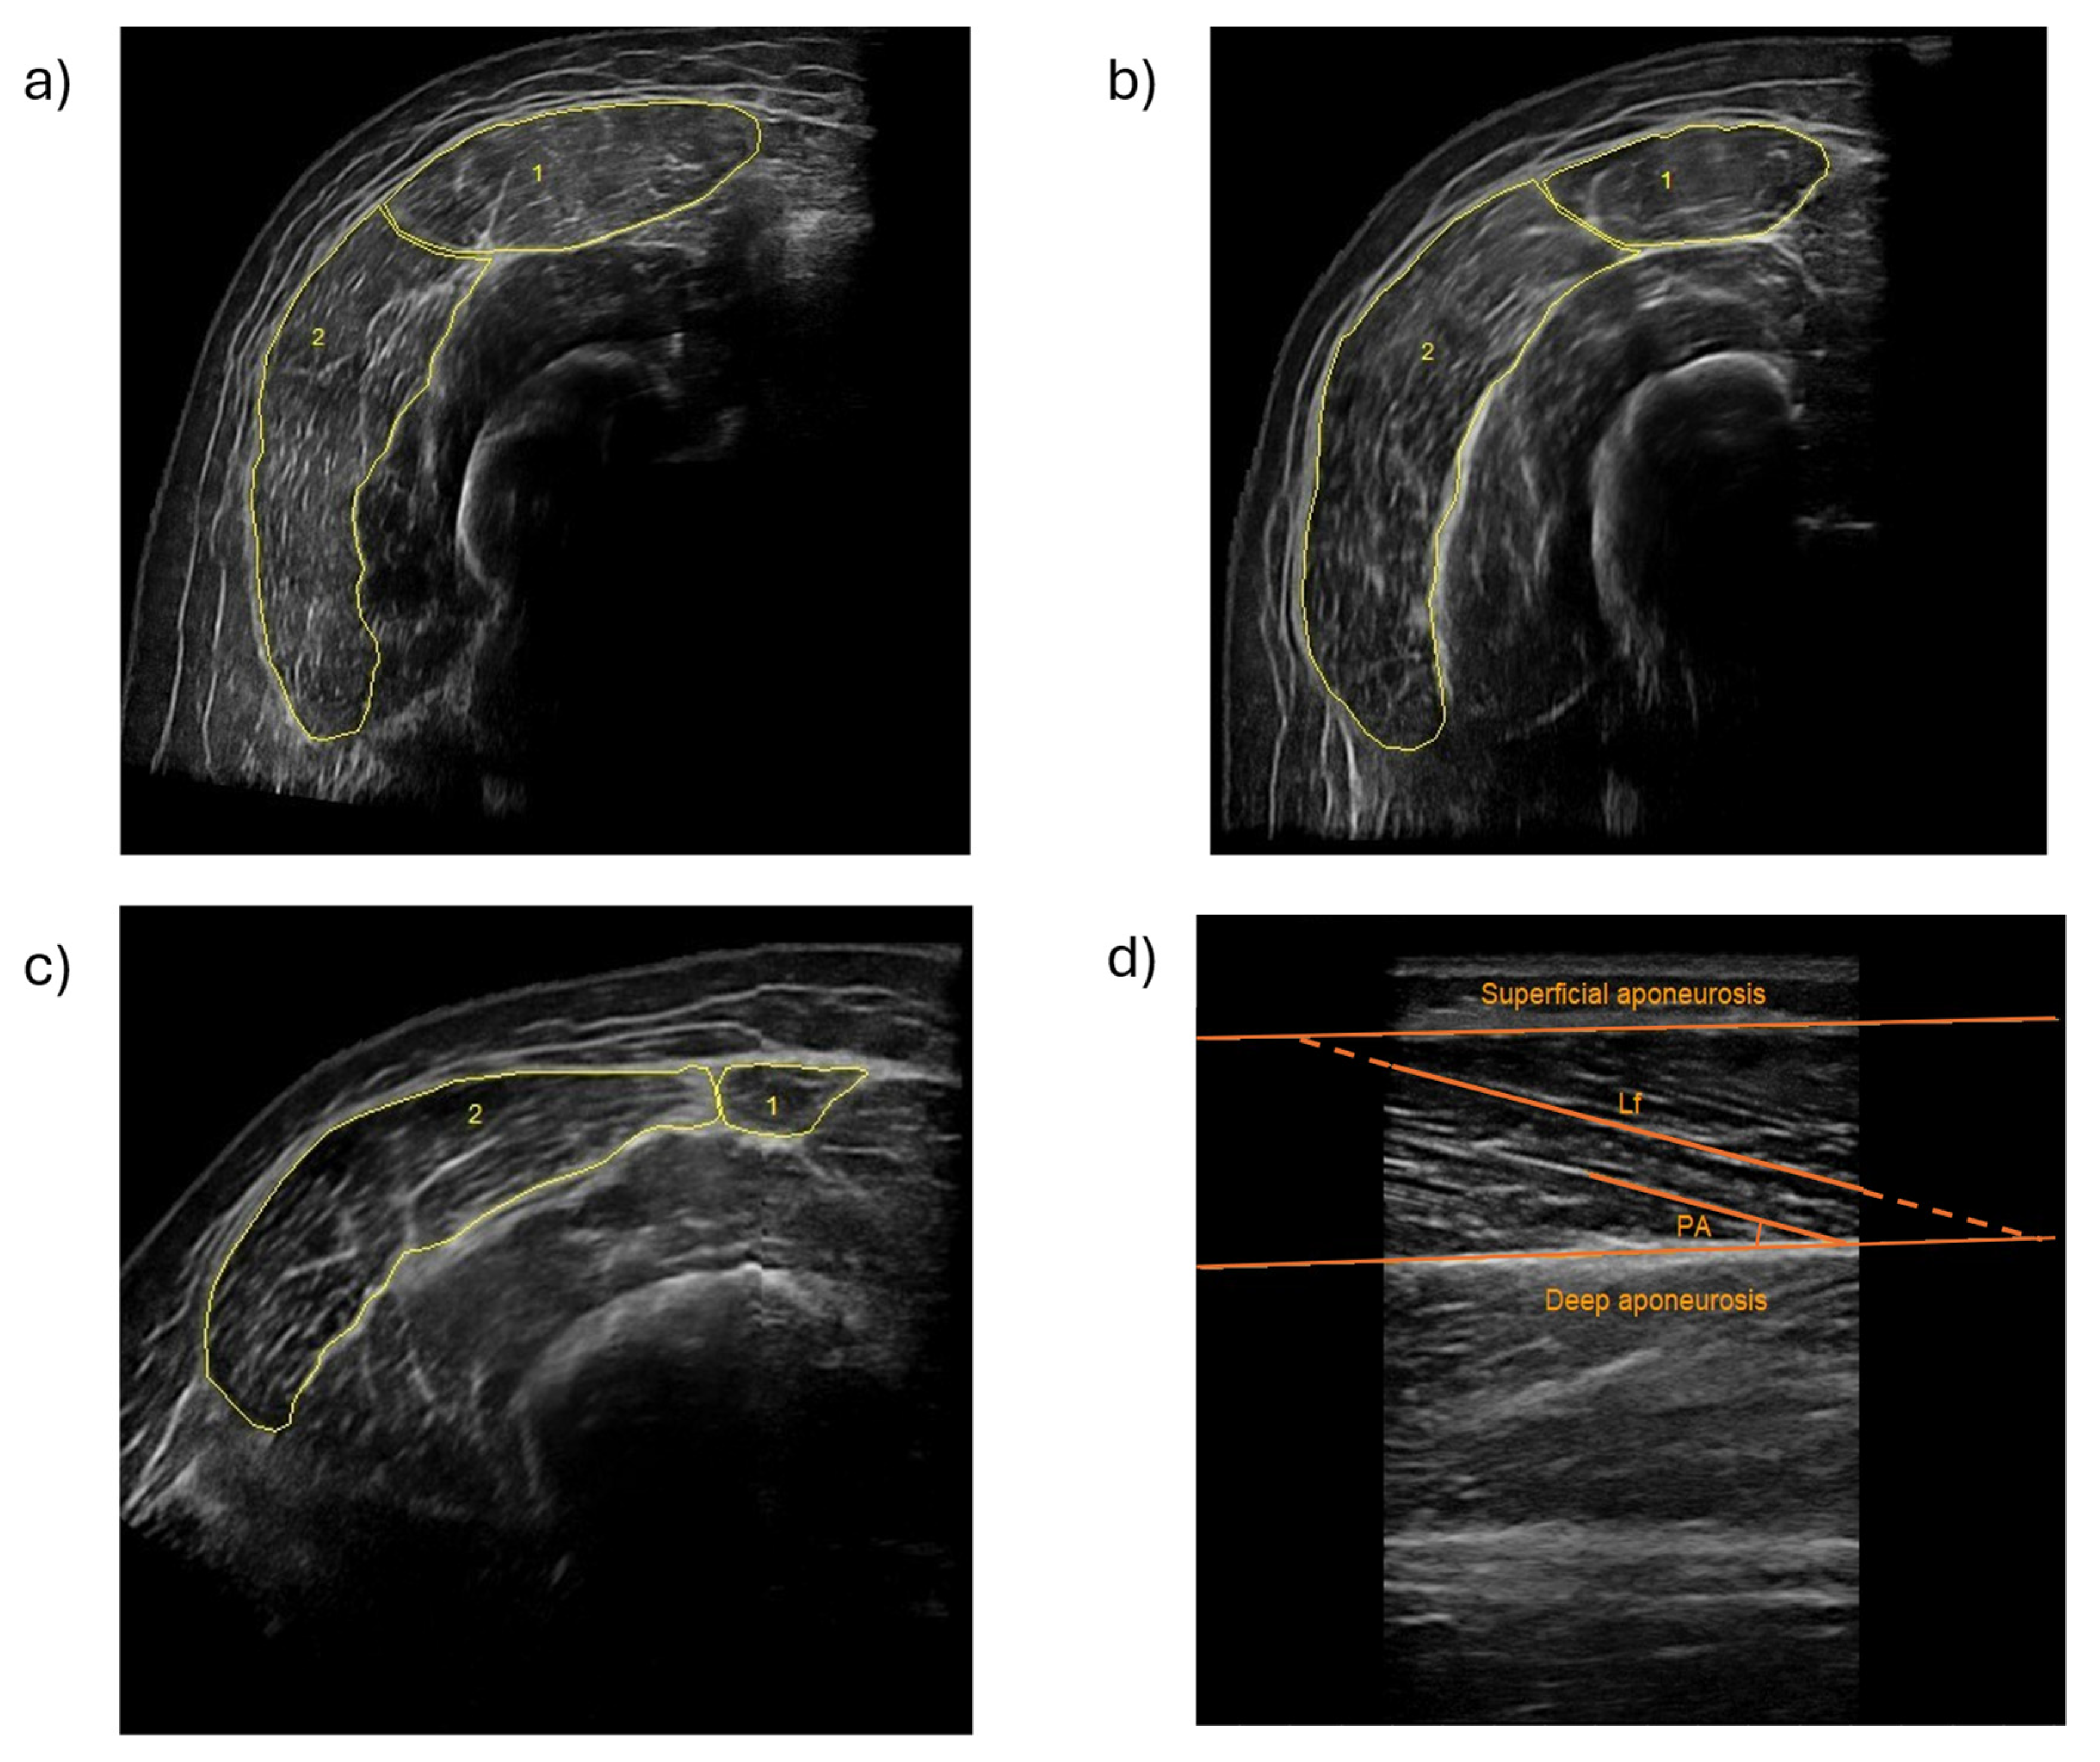
Muscle size and architecture of the RF and VL were assessed using B-mode ultrasonography (MyLab 25, Esaote Biomedica, Genoa, Italy) equipped with a 5 cm, 7.5–12 MHz linear-array probe. All scans were performed by the same experienced technician (>200 h) to minimize inter-operator variability. Participants were positioned supine with the lower limbs relaxed and fully extended. Femur length was measured as the distance between the greater trochanter (0% of the distance) and the inferior border of the lateral epicondyle of the femur using a flexible anthropometric tape. Transverse panoramic ultrasound images were obtained at 35%, 50%, and 65% of femur length. These thigh lengths were found to be valid and highly repeatable to measure the quadriceps femoris [14]. Anatomical landmarks were identified and marked prior to scanning to ensure consistent probe placement across sites. Minimal probe pressure and a generous amount of water-soluble gel were used to avoid muscle compression. Representative transverse ultrasound images of RF and VL at each measurement site are shown in Figure 1. RF (1) and VL (2) were manually delineated using image analysis software to determine muscle CSA. CSA was quantified from transverse images using Fiji software (ImageJ, version 1.53, National Institutes of Health, Bethesda, MD, USA). Two independent measurements were obtained for each site. The coefficient of variation (CV) between measurements was calculated as (standard deviation (SD)/mean) × 100. If the CV exceeded 5%, a third measurement was performed and the final CSA value was calculated as the average of the three measurements [14]; otherwise, the mean of the two measurements was retained. VL fascicle length and VL pennation angle were assessed from longitudinal images at 50% of femur length using SMA software (LISiN-Politecnico di Torino, Turin, Italy). When the entire fascicle was not visible within the image frame, linear extrapolation was applied according to established procedures [15]. VL muscle volume was estimated from the VL CSA obtained at 35%, 50%, and 65% of the femur length and insertion points of the VL muscle in the femur (5 and 80% of the femur length) [16]. Calculations were performed using OriginPro software (v. 2024, OriginLab Corporation, Northampton, MA, USA). Ultrasound assessment in adolescents has demonstrated high intra-rater reliability for the VL and RF muscles (intraclass correlation coefficient: 0.998–1.00) [17].
Figure 1.
Representative B-mode ultrasound images of quadriceps cross-sectional area (CSA) at different femur lengths. Transverse panoramic scans obtained at (a) 35%, (b) 50%, and (c) 65% of femur length (measured from the greater trochanter to the lateral epicondyle). The rectus femoris (RF) is indicated as (1) and the vastus lateralis as (2). Yellow outlines represent manually traced muscle boundaries used for CSA calculation. Fascicle length; vastus lateralis pennation angle (PA) and vastus lateralis fascicle length (Lf) are presented in (d).
2.3.4. Countermovement Jump
Vertical jump performance was assessed using the CMJ test performed on dual force plates (Hawkin Dynamics Inc., Westbrook, ME, USA; sampling frequency = 1000 Hz), in accordance with previously described procedures [18]. Participants stepped onto the force plates and stood upright, motionless, for at least 1 s to allow body weight determination prior to movement onset. All jumps were performed with hands placed on the hips (arms akimbo) to minimize upper-limb contribution. Athletes were instructed to jump “as fast and as high as possible” while maintaining full lower-limb extension during flight and avoiding knee tucking. Each participant performed three maximal CMJ trials, separated by ~60 s of passive recovery. A minimum of three technically valid trials was required. If a trial was deemed invalid (e.g., arm swing, excessive countermovement strategy deviation, or knee flexion during flight), an additional attempt was allowed. Vertical ground reaction force (vGRF) data were low-pass-filtered using a 50 Hz cut-off frequency and analyzed using proprietary software (Hawkin Dynamics Inc., Westbrook, ME, USA). Jump height was calculated from take-off velocity using the impulse–momentum method [18].
2.3.5. Force–Velocity Profiling
The individual F–V relationship was assessed during the concentric phase of the free-weight parallel back squat using a linear position transducer (ADR device, Toledo, Spain). Following a standardized warm-up, participants performed an incremental loading protocol consisting of progressively increasing external loads, starting with a light load (~20 kg) and increasing in 5–10 kg increments until mean concentric velocity fell below ~0.60 m·s−1 [8]. Two repetitions were performed at each load with maximal intended concentric velocity. Mean propulsive velocity (MPV) was recorded for each repetition, and the highest velocity value per load was retained for analysis. If a repetition deviated by >0.05 m·s−1 from the expected individual linear regression, an additional repetition was performed to ensure data consistency. A linear F-V equation was fitted over F-V data between 45% and 100% of theoretical maximal force (F0) [8]. This linear model and the selected intensity range (45–100% F0) have been shown to provide highly reliable F-V parameters. From this relationship, theoretical maximal unloaded velocity (V0) and maximal mechanical power (Pmax) were calculated. Optimal force (Fopt) and optimal velocity (Vopt) were calculated as the coordinates corresponding to maximal power output [8,19].
2.3.6. Maximal Dynamic Strength
After completion of the incremental F–V protocol, maximal dynamic strength was assessed through SQ and HHPC 1RM. A passive recovery period of ~10 min was provided between the F–V protocol and the 1RM SQ test, and an additional 10–15 min of rest was allowed before the HHPC test to minimize fatigue effects. Both exercises were selected due to their high mechanical and neuromuscular relevance for the base role in acrobatic gymnastics, which requires high levels of lower-limb force production and explosive strength during propulsions and receptions. All strength assessments were performed under the supervision of experienced strength and conditioning professionals and following established youth resistance training guidelines [20]. For the SQ 1RM, load was progressively increased until failure, defined as the inability to complete a repetition through the predefined range of motion (≈90° knee flexion) while maintaining correct technique. Rest intervals of 2–3 min were provided between attempts. The highest successfully lifted load was recorded as the 1RM. For the HHPC, participants initiated the lift from the mid-thigh hang position and performed an explosive triple extension followed by bar reception in a partial front rack position. Load was progressively increased until technical failure occurred. The 1RM HHPC corresponded to the maximal successfully lifted load.
2.4. Statistical Analysis
Statistical analyses were performed using SPSS Statistics (version 28, IBM Corp., Armonk, NY, USA). Data distribution was assessed using the Shapiro–Wilk test and visual inspection of Q–Q plots. Homogeneity of variances between maturational groups was evaluated using Levene’s test. Descriptive statistics are presented as mean ± SD. Between-group differences according to maturational status (pre/mid-pubertal: Tanner stages 1–3; post-pubertal: Tanner stages 4–5) were examined using independent-sample t-tests for normal distribution variables and Mann–Whitney test for non-parametric variables. Effect sizes for group comparisons were calculated using Cohen’s d and interpreted as small (0.2), moderate (0.5), and large (0.8) [21]. To examine the associations between muscle morphological variables (RF and VL CSA at 35%, 50%, and 65% of femur length; VL muscle volume; VL fascicle length; VL pennation angle) and performance outcomes (1RM SQ, squat Pmax, CMJmax, and 1RM HHPC), separate multiple linear regression analyses were performed. Three models were constructed for each outcome: Model 1 was unadjusted; Model 2 was adjusted for pubertal maturation (Tanner scale); and Model 3 was additionally adjusted for Tanner stage and height. Assumptions of linear regression (linearity, normality of residuals, homoscedasticity, and absence of multicollinearity) were verified. Adjustment for Tanner scale was conducted due to differences between groups in different maturational status. Multicollinearity was assessed using variance inflation factor (VIF), with VIF < 3 considered acceptable. Standardized β coefficients, unstandardized β coefficients with 95% confidence intervals (CI), adjusted R2 values, and p-values were reported. Statistical significance was set at p < 0.05.
3. Results
Twenty female acrobatic gymnasts (base role) aged 12 to 18 years (14.1 ± 1.7 years) participated in the study. Descriptive characteristics for the overall sample and stratified by maturational status are presented in Table 1. Additionally, between-group differences were assessed, and corresponding p-values are reported to compare pre/mid-pubertal vs. post-pubertal gymnasts. Post-pubertal athletes presented significantly greater body mass (p = 0.003; d = 1.53), BMI (p = 0.006; d = 1.33), fat mass (p = 0.028; d = 1.21), FMI (p = 0.031; d = 1.09), and absolute muscle mass (p = 0.032; d = 1.12) compared with pre/mid-pubertal athletes. Relative muscle percentage was higher in the pre/mid-pubertal group (p = 0.006; d = 1.41). Despite these differences in body composition, no significant between-group differences were observed in quadriceps CSA, muscle volume, VL fascicle length, or VL pennation angle (all p > 0.20; d values < 0.60). Regarding mechanical performance, post-pubertal athletes demonstrated greater theoretical maximal force (F0; p = 0.006; d = 1.28), optimal force (Fopt; p = 0.004; d = 1.31), 1RM SQ (p = 0.037; d = 0.99), and squat Pmax (p = 0.039; d = 0.96). In contrast, CMJ height (p = 0.351; d = 0.25) and 1RM HHPC (p = 0.259; d = 0.56) did not significantly differ between groups. A post hoc power analysis was conducted using G*Power (version 3.1, Heinrich Heine University Düsseldorf, Düsseldorf, Germany), based on the regression models that showed statistically significant associations. For squat 1RM, statistical power ranged from 0.563 to 0.850, indicating moderate to high power depending on the predictor included in the model. For squat power, the estimated power ranged from 0.786 to 0.870, suggesting an overall acceptable to high level of statistical sensitivity.
Table 1.
Participant characteristics stratified by maturational status.
Associations of Muscle Size and Architecture with Performance Outcomes
Linear regression analyses were performed to examine the associations of muscle size and architecture with strength–power performance outcomes (Table 2, Table 3, Table 4 and Table 5). For 1RM SQ performance (Table 2), VL CSA at 35% of femur length was positively associated with maximal strength in unadjusted analyses (β = 2.91 kg·cm−2, 95% CI 0.66 to 5.16; p = 0.014; adjusted R2 = 0.25). After adjustment for maturational status and height, VL CSA at both 35% (β = 2.38 kg·cm−2, 95% CI 0.24 to 4.51; p = 0.031) and 50% of femur length (β = 2.31 kg·cm−2, 95% CI 0.60 to 4.01; p = 0.011) remained independently associated with 1RM SQ performance, explaining up to 46% of the variance. No significant associations were observed for RF CSA, muscle volume, VL fascicle length, or VL pennation angle.
Table 2.
Associations between quadriceps muscle morphology and one-repetition maximum (1RM) squat performance.
Table 3.
Associations between quadriceps muscle morphology and maximal power squat performance.
Table 4.
Associations between quadriceps muscle morphology and maximal countermovement jump height.
Table 5.
Associations between quadriceps muscle morphology and one-repetition maximum in hang power clean from the mid-thigh position.
Stronger associations were observed for SQ Pmax (Table 3). In Model 1 (unadjusted), VL CSA at 35% (β = 49.55 W·cm−2, 95% CI 26.93 to 72.17; p < 0.001; adjusted R2 = 0.52) and 50% (β = 38.43 W·cm−2, 95% CI 17.58 to 59.27; p < 0.001; adjusted R2 = 0.42) were significantly associated with Pmax. These relationships persisted after adjustment for maturational status and height, with VL CSA at 35% (β = 45.75 W·cm−2, 95% CI 21.74 to 69.77; p < 0.001) and 50% (β = 38.43 W·cm−2, 95% CI 17.93 to 58.94; p < 0.001) independently predicting SQ Pmax (adjusted R2 ≈ 0.50). VL muscle volume was also positively associated with Pmax across models (p ≤ 0.003), although variance explained was lower compared with site-specific CSA. No significant associations were identified for RF morphology or architectural variables.
In contrast, quadriceps morphological variables were not significantly associated with CMJ height in either unadjusted or adjusted models (all p > 0.05; Table 4). Similarly, for 1RM HHPC (Table 5), VL CSA at 35% and 50% showed non-significant associations in unadjusted analyses (p = 0.060 and p = 0.051, respectively), which did not remain significant after adjustment for maturational status and height.
Additional analyses were conducted using body-mass-normalized strength variables (1RM squat/body mass and 1RM HHPC/body mass). These analyses did not reveal significant associations with muscle morphology. Overall, mid-thigh VL CSA (35–50% of femur length) emerged as the only morphological variable consistently associated with SQ-specific strength and power performance in this cohort.
4. Discussion
The main finding of this study is that mid-thigh VL CSA was consistently associated with SQ-specific strength and power performance in young elite female acrobatic gymnasts, independently of pubertal maturation and height. Specifically, VL CSA at 35–50% of femur length explained a substantial proportion of the variance in 1RM SQ and SQ Pmax, whereas RF variables were not associated with performance outcomes. This is physiologically plausible, since muscle CSA is closely related to force production capacity through its relationship with physiological CSA and the number of sarcomeres arranged in parallel [22]. In multi-joint lower-limb exercises such as the SQ, the VL is typically one of the primary contributors to knee extensor torque [23]. Task-specific activation patterns may partly explain the stronger associations observed for VL compared with RF; however, it is important to recognize that the quadriceps muscles act synergistically during multi-joint movements such as the squat. Therefore, the lack of significant associations for RF should not be interpreted as evidence of a lack of functional relevance. Several alternative explanations may account for these findings. First, the biarticular nature of the RF and its involvement in both hip flexion and knee extension may result in a different functional contribution during loaded squatting tasks, potentially reducing its direct association with maximal force and power production in this movement [23]. Moreover, because the RF simultaneously contributes to hip flexion, its net mechanical contribution to knee extension torque during squatting may be constrained by inter-joint coordination demands, further attenuating the relationship between its size and squat-specific performance [24].
Interestingly, the associations were stronger for SQ Pmax than for 1RM. This suggests that mid-thigh muscle size may be particularly relevant for the F-V characteristics underpinning Pmax production [25]. Whilst 1RM primarily reflects maximal force output under near-zero-velocity conditions, Pmax is derived from the individual F-V profile and represents the optimal balance between F and V (i.e., the product of F and V at the point of Pmax) [25]. Therefore, its stronger association with VL CSA indicates that muscle size may influence performance across a broader mechanical spectrum rather than solely under maximal loading conditions. Within the F-V framework, greater muscle CSA is associated with increased force-generating capacity (higher theoretical F0). An upward shift in the F-V relationship due to increased F capacity may consequently elevate power output at intermediate velocities, even if maximal velocity (V0) remains unchanged [25]. In this context, larger VL CSA may enhance the ability to sustain higher force levels at moderate contraction velocities, thereby increasing the mechanical power produced during the concentric phase of the SQ. This interpretation is consistent with the observed stronger relationships between VL CSA and Pmax compared with 1RM. Moreover, Pmax may be more sensitive than 1RM to morphological differences because it reflects integrated mechanical performance across multiple loading conditions rather than performance at a single high-load point. From a sport-specific perspective, this may be particularly relevant for acrobatic gymnastics bases, who are required to generate substantial force rapidly during dynamic transitions and partner lifts, where both force magnitude and movement velocity are critical. Our findings are consistent with those reported by Cornejo-Daza et al. in young males [14], who observed significant associations between quadriceps morphology and F-V-derived power parameters, reinforcing the notion that muscle size contributes meaningfully to mechanical power output during multi-joint lower-limb tasks in youth athletes. The fact that these relationships remained significant after adjusting for Tanner stage and height suggests that they are not explained solely by maturational growth but may also reflect training-related neuromuscular adaptations in these athletes [6]. Although causal inference cannot be established due to the cross-sectional design, these findings are compatible with the possibility that inter-individual differences in training exposure and neuromuscular specialization contribute to squat force–power performance beyond biological maturation alone.
Relative strength variables (normalized to body mass) did not reveal significant associations with muscle morphology. This finding suggests that the observed relationships between VL CSA and performance are more closely related to absolute force production than relative strength. In contrast, quadriceps morphology was not significantly associated with CMJ performance or 1RM HHPC. CMJ performance is influenced by a wide range of mechanical and neuromuscular determinants beyond isolated muscle size, including intermuscular coordination, stretch–shortening cycle efficiency, tendon stiffness, and neuromuscular timing. Previous research has shown that differences in jumping ability are not solely explained by muscle size but also by variations in neuromechanical strategies and force application patterns [26]. Accordingly, CMJ performance likely reflects the integrated function of the entire lower-limb neuromuscular system rather than the size of a single muscle group [27]. Variability in coordination strategies or neuromuscular efficiency may therefore account for a larger proportion of performance variance than differences in quadriceps CSA alone. Additionally, the rate of force development (RFD) is a key determinant of explosive performance and reflects the ability to rapidly generate force within short time frames. RFD is strongly influenced by neural factors, including motor unit recruitment, firing frequency, and intermuscular coordination, which are not directly captured by muscle cross-sectional area. Therefore, the lack of association between quadriceps morphology and CMJ performance in the present study may be partly explained by the greater contribution of neuromuscular and tendon-related factors compared to isolated muscle size [28].
A similar rationale may explain the absence of independent predictors for 1RM HHPC after adjustment. The HHPC is a technically complex, multi-joint movement characterized by coordinated triple extension and phase-specific kinetic demands [29]. Performance in this lift requires rapid force transmission through the kinetic chain, precise intermuscular coordination, and high rates of force development across multiple joints. In addition, successful execution of the HHPC depends on phase-specific motor control and technical proficiency, particularly during the transition and catch phases. These complex neuromechanical and coordinative demands may attenuate the relative contribution of isolated muscle size variables, such as VL CSA, particularly after adjusting for maturation and body size. Consequently, whole-body mechanical integration and technical proficiency may play a more prominent role than the morphology of an individual muscle such as the VL. The associations observed in unadjusted models did not reach statistical significance after adjustment, suggesting that shared variance with maturation or overall body size may partly explain the initial relationships.
Several limitations should be acknowledged. First, the relatively small sample size, inherent to studies involving elite populations, may limit statistical power, increase the risk of type II error, particularly for multivariable models, and limit the generalizability of the findings. The relatively large number of statistical analyses performed may increase the risk of type I error. As no correction for multiple comparisons was applied, the findings should be interpreted with caution, particularly those with non-significant findings close to the significance threshold. In addition, only linear associations were examined. Although nonlinear relationships between muscle morphology and performance cannot be excluded, the present sample size limited our ability to explore more complex models without increasing the risk of overfitting. However, this constraint reflects the inherent difficulty of recruiting homogeneous groups of elite acrobatic gymnasts performing the base role, a highly specialized and limited athletic population. Furthermore, due to the study design, the observed results should be interpreted as associations rather than causal relationships. Future studies, including larger cohorts and longitudinal designs, are warranted to confirm these findings and to further clarify the relationships between muscle architecture, F-V characteristics, and sport-specific performance. We assessed the muscle size of VL and RF muscles, whereas other hip or trunk muscles may also contribute substantially to SQ and HHPC performance. Future studies should evaluate other muscle groups to provide a more comprehensive understanding of performance in elite acrobatic gymnastics bases. Longitudinal training studies would be particularly valuable to determine whether targeted increases in VL CSA translate into measurable improvements in SQ F-V parameters and competitive performance. Additionally, biological maturation was assessed using self-reported Tanner staging, which, although widely used and validated, may be subject to some degree of misclassification compared to clinical assessment. However, Tanner stage was included primarily as a covariate rather than a primary outcome, which likely mitigates its impact on the main findings. Additionally, inter-limb asymmetries were not assessed in the present study. Given their potential relevance for neuromuscular performance and injury risk, future research should incorporate bilateral assessments to examine the influence of asymmetries in relation to muscle morphology and performance in young acrobatic gymnasts.
Despite these limitations, a notable strength of the present study is the low multicollinearity observed between predictors (variance inflation factor < 3). However, given the relatively small sample size and the number of predictors and covariates included in the regression models, some degree of model overfitting should be considered, and the results should be interpreted cautiously. In addition, the combined assessment of ultrasound-derived muscle morphology and F-V profiling provides a sport-specific and mechanically grounded characterization of performance determinants in this population.
Taken together, these findings indicate that mid-thigh VL CSA represents a meaningful structural correlation of SQ-specific F-P performance in young elite acrobatic gymnastics bases. While muscle size alone does not determine performance in complex whole-body tasks, its association with F-V-derived power highlights its relevance within mechanically constrained movements such as the SQ and may offer a useful framework for monitoring structural and mechanical adaptations during adolescent training.
5. Conclusions
Mid-thigh VL CSA was independently associated with SQ-specific strength and Pmax in young elite female acrobatic gymnasts performing the base role, even after adjustment for pubertal maturation and height. In contrast, RF CSA and the VL architectural parameters assessed were not significant predictors of SQ performance. In addition, CMJ and HHPC were not associated with muscle size and architecture.
These findings indicate that mid-thigh VL muscle size represents a key determinant of SQ mechanical capacity within this population. While muscle size alone does not fully determine performance in complex multi-joint tasks, its association with power highlights its importance in mechanically constrained movements such as the SQ. From a practical perspective, ultrasound-based assessment of mid-thigh VL CSA may provide a useful tool to monitor structural adaptations and inform strength development strategies during adolescence in elite acrobatic gymnastics bases. From a practical perspective, these findings suggest that resistance training programs in young acrobatic gymnasts should prioritize exercises that promote hypertrophy of the vastus lateralis, particularly in the mid-thigh region, as this may enhance squat-specific force–power capabilities. Integrating ultrasound-based monitoring of muscle size with force–velocity profiling may provide a useful approach for tailoring training interventions and tracking neuromuscular adaptations during development. Furthermore, it offers a non-invasive approach to indicate performance potential without the neuromuscular fatigue associated with maximal exercise testing, which could be particularly advantageous for coaches during the competitive season.
Author Contributions
The individual contributions to this paper were as follows: conceptualization, A.G.-G., S.M. and M.A.S.; methodology, J.A., M.A.S., L.M.A. and Á.D.-H.; formal analysis, Á.D.-H. and I.R.-G.; investigation, A.G.-G. and S.M.; resources, L.M.A. and M.A.S.; data curation, I.R.-G. and Á.D.-H.; writing—original draft preparation, Á.D.-H.; writing—review and editing, A.G.-G., L.M.A., I.R.-G. and Á.B.-R.; supervision, A.G.-G. and J.A. All authors have read and agreed to the published version of the manuscript.
Funding
Á.D.-H. was supported by a contract from the Fundación del Hospital Nacional de Parapléjicos funded through the Programa Investigo and co-financed by the European Social Fund Plus (FSE+) of Castilla-La Mancha 2021–2027 (PINVE-00-0024/2025). Á.B.-R. is supported by a postdoctoral contract granted by the Spanish Ministry of Science and Innovation (JDC2023-052593-I, funded by MCIU/AEI/10.13039/501100011033).
Institutional Review Board Statement
The study was conducted in accordance with the Declaration of Helsinki and approved by the Ethics Committee of the Technical University of Madrid (approval code 2022-038 and date of approval 17 June 2022).
Informed Consent Statement
Informed consent was obtained from all subjects involved in the study. For participants under 18 years of age, written informed consent was obtained from their parents or legal guardians.
Data Availability Statement
The data supporting the findings of this study are available from the corresponding author upon reasonable request. The data are not publicly available due to privacy and ethical restrictions involving minor participants.
Acknowledgments
The authors would like to thank María del Carmen Gómez-Cabrera (University of Valencia) for kindly providing access to the bioimpedance equipment used in this study. The authors also thank Héctor Soto Paniagua for his technical assistance during the ultrasound assessments. We are especially grateful to the athletes and their parents or legal guardians for their commitment and cooperation, as well as to the coaching staff for their collaboration throughout the study. During the preparation of this manuscript, the authors used ChatGPT (OpenAI, GPT-4) for language refinement and structural editing. The authors have reviewed and edited the output and take full responsibility for the content of this publication.
Conflicts of Interest
The authors declare no conflicts of interest.
Abbreviations
The following abbreviations are used in this manuscript:
| ACRO | Acrobatic Gymnastics |
| BMI | Body Mass Index |
| CSA | Cross-Sectional Area |
| RF | Rectus Femoris |
| VL | Vastus Lateralis |
| HHPC | High Hang Power Clean |
| SQ | Squat |
| CMJ | Countermovement Jump |
| 1RM | One-Repetition Maximum |
| Pmax | Maximal Mechanical Power |
| F–V | Force–Velocity |
| F0 | Theoretical Maximal Force |
| V0 | Theoretical Maximal Velocity |
| Fopt | Optimal Force |
| Vopt | Optimal Velocity |
| FMI | Fat Mass Index |
| MMI | Muscle Mass Index |
| SD | Standard Deviation |
| CI | Confidence Interval |
| VIF | Variance Inflation Factor |
| R2 | Coefficient of Determination |
| β | Standardized Regression Coefficient |
References
- Taboada-Iglesias, Y.; Santana, M.V.; Gutierrez-Sanchez, A. Anthropometric Profile in Different Event Categories of Acrobatic Gymnastics. J. Hum. Kinet. 2017, 57, 169–179. [Google Scholar] [CrossRef] [Scilit] [PubMed]
- Leite, I.; Gomez-Landero, L.A.; Avila-Carvalho, L.; Vilas-Boas, J.P.; Goethel, M.; Conceicao, F.; Mochizuki, L. Acrobatic gymnastics: The effect of experience, interpersonal coordination and variability in partner-assisted flight. J. Sports Sci. 2025, 43, 1227–1236. [Google Scholar] [CrossRef] [Scilit]
- Gene-Morales, J.; Gene-Sampedro, A.; Martin-Portugues, A.; Bueno-Gimeno, I. Do Age and Sex Play a Role in the Intraocular Pressure Changes after Acrobatic Gymnastics? J. Clin. Med. 2021, 10, 4700. [Google Scholar] [CrossRef] [Scilit]
- Leite, I.; Gomez-Landero, L.A.; Vilas-Boas, J.P.; Goethel, M.; Mochizuki, L.; Conceicao, F. The interplay between individual capacities and pair performance according to the experience in Acrobatic Gymnastics. Sports Biomech. 2025, 24, 2362–2375. [Google Scholar] [CrossRef] [Scilit]
- Gomez-Dolader, I.; Martinez-Cruces, A.; Leal-Del-Ojo, P.; Gomez-Landero, L.A. Strength Proxies Explain Balance Task Performance by Proximity to Peak Height Velocity in Young Acrobatic Gymnasts. J. Funct. Morphol. Kinesiol. 2024, 9, 255. [Google Scholar] [CrossRef] [Scilit]
- Tumkur Anil Kumar, N.; Oliver, J.L.; Lloyd, R.S.; Pedley, J.S.; Radnor, J.M. The Influence of Growth, Maturation and Resistance Training on Muscle-Tendon and Neuromuscular Adaptations: A Narrative Review. Sports 2021, 9, 59. [Google Scholar] [CrossRef] [Scilit]
- Hernández-Belmonte, A.; Martínez-Cava, A.; Pallarés, J.G. Panoramic ultrasound requires a trained operator and specific evaluation sites to maximize its sensitivity: A comprehensive analysis of the measurement errors. Physiol. Behav. 2022, 248, 113737. [Google Scholar] [CrossRef] [Scilit] [PubMed]
- Alcazar, J.; Rodriguez-Lopez, C.; Ara, I.; Alfaro-Acha, A.; Manas-Bote, A.; Guadalupe-Grau, A.; Garcia-Garcia, F.J.; Alegre, L.M. The Force-Velocity Relationship in Older People: Reliability and Validity of a Systematic Procedure. Int. J. Sports Med. 2017, 38, 1097–1104. [Google Scholar] [CrossRef] [Scilit] [PubMed]
- Nakatani, M.; Murata, K.; Kanehisa, H.; Takai, Y. Force-velocity relationship profile of elbow flexors in male gymnasts. PeerJ 2021, 9, e10907. [Google Scholar] [CrossRef] [Scilit]
- Moeskops, S.; Oliver, J.L.; Radnor, J.M.; Haff, G.G.; Myer, G.D.; Ramachandran, A.K.; Kember, L.S.; Pedley, J.S.; Lloyd, R.S. Effects of Neuromuscular Training on Muscle Architecture, Isometric Force Production, and Stretch-Shortening Cycle Function in Trained Young Female Gymnasts. J. Strength Cond. Res. 2024, 38, 1640–1650. [Google Scholar] [CrossRef] [Scilit] [PubMed]
- Marshall, W.A.; Tanner, J.M. Variations in pattern of pubertal changes in girls. Arch. Dis. Child. 1969, 44, 291–303. [Google Scholar] [CrossRef] [Scilit]
- Béghin, L.; Vanhelst, J.; Drumez, E.; Migueles, J.H.; Androutsos, O.; Widhalm, K.; Julian, C.; Moreno, L.A.; De Henauw, S.; Gottrand, F. Gender influences physical activity changes during adolescence: The HELENA study. Clin. Nutr. 2019, 38, 2900–2905. [Google Scholar] [CrossRef] [Scilit]
- Ward, L.C.; Brantlov, S. Bioimpedance basics and phase angle fundamentals. Rev. Endocr. Metab. Disord. 2023, 24, 381–391. [Google Scholar] [CrossRef] [Scilit] [PubMed]
- Cornejo-Daza, P.J.; Sanchez-Valdepenas, J.; Rodiles-Guerrero, L.; Paez-Maldonado, J.A.; Ara, I.; Leon-Prados, J.A.; Alegre, L.M.; Pareja-Blanco, F.; Alcazar, J. Vastus Lateralis Muscle Size Is Differently Associated with the Different Regions of the Squat Force-Velocity and Load-Velocity Relationships, Rate of Force Development, and Physical Performance Young Men. J. Strength Cond. Res. 2024, 38, 450–458. [Google Scholar] [CrossRef] [Scilit] [PubMed]
- Rodriguez-Lopez, C.; Alcazar, J.; Sanchez-Martin, C.; Baltasar-Fernandez, I.; Ara, I.; Csapo, R.; Alegre, L.M. Neuromuscular adaptations after 12 weeks of light- vs. heavy-load power-oriented resistance training in older adults. Scand. J. Med. Sci. Sports 2022, 32, 324–337. [Google Scholar] [CrossRef] [Scilit]
- Hogrel, J.Y.; Barnouin, Y.; Azzabou, N.; Butler-Browne, G.; Voit, T.; Moraux, A.; Leroux, G.; Behin, A.; McPhee, J.S.; Carlier, P.G. NMR imaging estimates of muscle volume and intramuscular fat infiltration in the thigh: Variations with muscle, gender, and age. Age 2015, 37, 9798. [Google Scholar] [CrossRef] [Scilit]
- Rock, K.; Nelson, C.; Addison, O.; Marchese, V. Assessing the Reliability of Handheld Dynamometry and Ultrasonography to Measure Quadriceps Strength and Muscle Thickness in Children, Adolescents, and Young Adults. Phys. Occup. Ther. Pediatr. 2021, 41, 540–554. [Google Scholar] [CrossRef] [Scilit] [PubMed]
- Badby, A.J.; Comfort, P.; Ripley, N.J.; Mundy, P.D.; Soriano, M.A.; Robles-Palazon, F.J.; Fahey, J.; Sindall, P.; Bramah, C.; McMahon, J.J. Normative data and objective benchmarks for selected force plate tests for professional and youth soccer players in the English Football League. J. Sports Sci. 2025, 43, 2306–2323. [Google Scholar] [CrossRef] [Scilit]
- Maffiuletti, N.A.; Aagaard, P.; Blazevich, A.J.; Folland, J.; Tillin, N.; Duchateau, J. Rate of force development: Physiological and methodological considerations. Eur. J. Appl. Physiol. 2016, 116, 1091–1116. [Google Scholar] [CrossRef] [Scilit]
- Lloyd, R.S.; Faigenbaum, A.D.; Stone, M.H.; Oliver, J.L.; Jeffreys, I.; Moody, J.A.; Brewer, C.; Pierce, K.C.; McCambridge, T.M.; Howard, R.; et al. Position statement on youth resistance training: The 2014 International Consensus. Br. J. Sports Med. 2014, 48, 498–505. [Google Scholar] [CrossRef] [Scilit]
- Cohen, J. Statistical Power Analysis for the Behavioral Sciences, 2nd ed.; L. Erlbaum Associates: Hillsdale, NJ, USA, 1988. [Google Scholar]
- Lieber, R.L.; Ward, S.R. Skeletal muscle design to meet functional demands. Philos. Trans. R. Soc. Lond. B Biol. Sci. 2011, 366, 1466–1476. [Google Scholar] [CrossRef] [Scilit]
- Marchetti, P.H.; Jarbas da Silva, J.; Jon Schoenfeld, B.; Nardi, P.S.; Pecoraro, S.L.; D’Andrea Greve, J.M.; Hartigan, E. Muscle Activation Differs between Three Different Knee Joint-Angle Positions during a Maximal Isometric Back Squat Exercise. J. Sports Med. 2016, 2016, 3846123. [Google Scholar] [CrossRef] [Scilit] [PubMed]
- Stien, N.; Saeterbakken, A.H.; Andersen, V. Electromyographic Comparison of Five Lower-Limb Muscles between Single- and Multi-Joint Exercises among Trained Men. J. Sports Sci. Med. 2021, 20, 56–61. [Google Scholar] [CrossRef] [Scilit] [PubMed]
- Samozino, P.; Rejc, E.; Di Prampero, P.E.; Belli, A.; Morin, J.B. Optimal force-velocity profile in ballistic movements–altius: Citius or fortius? Med. Sci. Sports Exerc. 2012, 44, 313–322. [Google Scholar] [CrossRef] [Scilit]
- Jo, I.; Lee, H.D. Joint Coordination and Muscle-Tendon Interaction Differ Depending on The Level of Jumping Performance. J. Sports Sci. Med. 2023, 22, 189–195. [Google Scholar] [CrossRef] [Scilit]
- Bygate-Smith, M.K.; Beaven, C.M.; Drury, M. Physical and Biomechanical Relationships with Countermovement Jump Performance in Team Sports: Implications for Athletic Development and Injury Risk. Sports 2025, 13, 277. [Google Scholar] [CrossRef] [Scilit]
- Aagaard, P.; Simonsen, E.B.; Andersen, J.L.; Magnusson, P.; Dyhre-Poulsen, P. Increased rate of force development and neural drive of human skeletal muscle following resistance training. J. Appl. Physiol. 2002, 93, 1318–1326. [Google Scholar] [CrossRef] [Scilit] [PubMed]
- Hayashi, R.; Yoshida, T.; Kariyama, Y. Differences in Kinetics during One- and Two-Leg Hang Power Clean. Sports 2021, 9, 45. [Google Scholar] [CrossRef] [Scilit]

Disclaimer/Publisher’s Note: The statements, opinions and data contained in all publications are solely those of the individual author(s) and contributor(s) and not of MDPI and/or the editor(s). MDPI and/or the editor(s) disclaim responsibility for any injury to people or property resulting from any ideas, methods, instructions or products referred to in the content. |
© 2026 by the authors. Licensee MDPI, Basel, Switzerland. This article is an open access article distributed under the terms and conditions of the Creative Commons Attribution (CC BY) license.