Article

Deformation Mechanisms and Coordinated Support–Relief Control of Deep Roadways Under Multi-Dynamic Pressure Conditions


1
School of Energy and Mining Engineering, China University of Mining and Technology-Beijing, Beijing 100083, China
2
Beijing Key Laboratory for Precise Mining of Intergrown Energy and Resources, China University of Mining and Technology-Beijing, Beijing 100083, China
3
Shanxi Lu’an Chemical Group Wuyang Coal Mine, Changzhi 046204, China
4
School of Mine Safety, North China Institute of Science and Technology, Langfang 065201, China
*
Authors to whom correspondence should be addressed.
Appl. Sci. 2026, 16(7), 3382; https://doi.org/10.3390/app16073382
Submission received: 21 February 2026 / Revised: 26 March 2026 / Accepted: 27 March 2026 / Published: 31 March 2026
(This article belongs to the Section Earth Sciences)

Abstract

To address the pronounced asymmetric deformation of roadway-surrounding rock under deep multi-dynamic pressure, the N8003 tailgate of the Wuyang Mine was adopted as the engineering background, and the deformation–failure characteristics of the roadway sidewalls and the evolution of deviatoric stress under dynamic loading were analyzed. Based on numerical simulation, the maximum principal deviatoric stress S1 was employed as the core indicator for evaluating pressure-relief effectiveness, upon which a three–dimensional Pressure Relief Efficiency Index (PREI) considering strength, range, and position was developed. The key parameters of large-diameter hydraulic cavitation pressure–relief boreholes were optimized, and the evolution patterns of deviatoric stress under static and dynamic conditions were further revealed. To overcome the limitations of conventional high-strength bolt–cable combined support in controlling large deformation, a layered support–relief collaborative control technology featuring “external reinforcement fixation (ERF), near-surface modification and grouting (NSMG), and deep targeted destressing (DTD)” was proposed. Field tests demonstrated that this technology can significantly suppress sidewall deformation, maintain support system stability, and exhibit strong adaptability and application potential in deep roadways influenced by multi-dynamic pressure.

1. Introduction

With the exhaustion of shallow coal resources, mining activities have progressively extended to deeper levels, where geological structures become more complex and in situ stresses significantly increase, making conventional support systems inadequate for the high-deviatoric-stress environment induced by deep high stress and intense dynamic loading [1,2]. Deep mining roadways are susceptible to large deformation or even instability due to strong excavation-induced unloading, posing a serious threat to safe and efficient production. Therefore, elucidating the deformation mechanisms of roadway-surrounding rock under deep multi-dynamic pressure and developing effective control technologies have become urgent issues.
At present, substantial progress has been made in understanding the instability mechanisms of deep roadway-surrounding rock and in developing related control technologies. Mechanistically [3,4,5,6,7], researchers have investigated stress redistribution, plastic zone expansion, and structural degradation of surrounding rock, revealing the significant influence of dynamic disturbances on the mechanical state and structural evolution of the rock mass. For failure-criterion indicators, traditional parameters such as vertical stress [8], principal stress difference [9,10,11], and strain energy [12,13] have been widely used for instability identification and control-effect evaluation; however, due to their reliance on single response variables, they are insufficient for accurately revealing the dominant failure pathways and critical zones under complex stress conditions. Given that the essence of pressure-relief roadway control lies in releasing or redistributing concentrated stress, evaluation indicators should be capable of comprehensively reflecting three-dimensional stress characteristics. The deviatoric stress index simultaneously incorporates the interactions among the maximum, intermediate, and minimum principal stresses, providing a more scientific basis for clarifying the relationship between pressure-relief parameters and their effectiveness. In terms of pressure-relief technology, current deep-roadway control strategies generally prioritize pressure relief over support. Common pressure-relief methods include cutting pressure-relief slots [14], conventional drilling-based pressure relief [15,16], blasting-induced pressure relief [17], and roof-cutting destressing [18,19,20], all of which can effectively reduce local stress concentration. Among them, in-roadway drilling-based pressure relief is the most widely used because of its simplicity and high adaptability [21]. It has evolved from conventional large-diameter drilling to segmented reaming to enlarge the range of stress redistribution [22,23]. However, under complex conditions involving high in situ stress and strong dynamic disturbances, the existing pressure-relief techniques still suffer from limited relief range, insufficient long-term effectiveness, and construction-induced weakening of the anchorage system, as well as inadequate equipment adaptability.
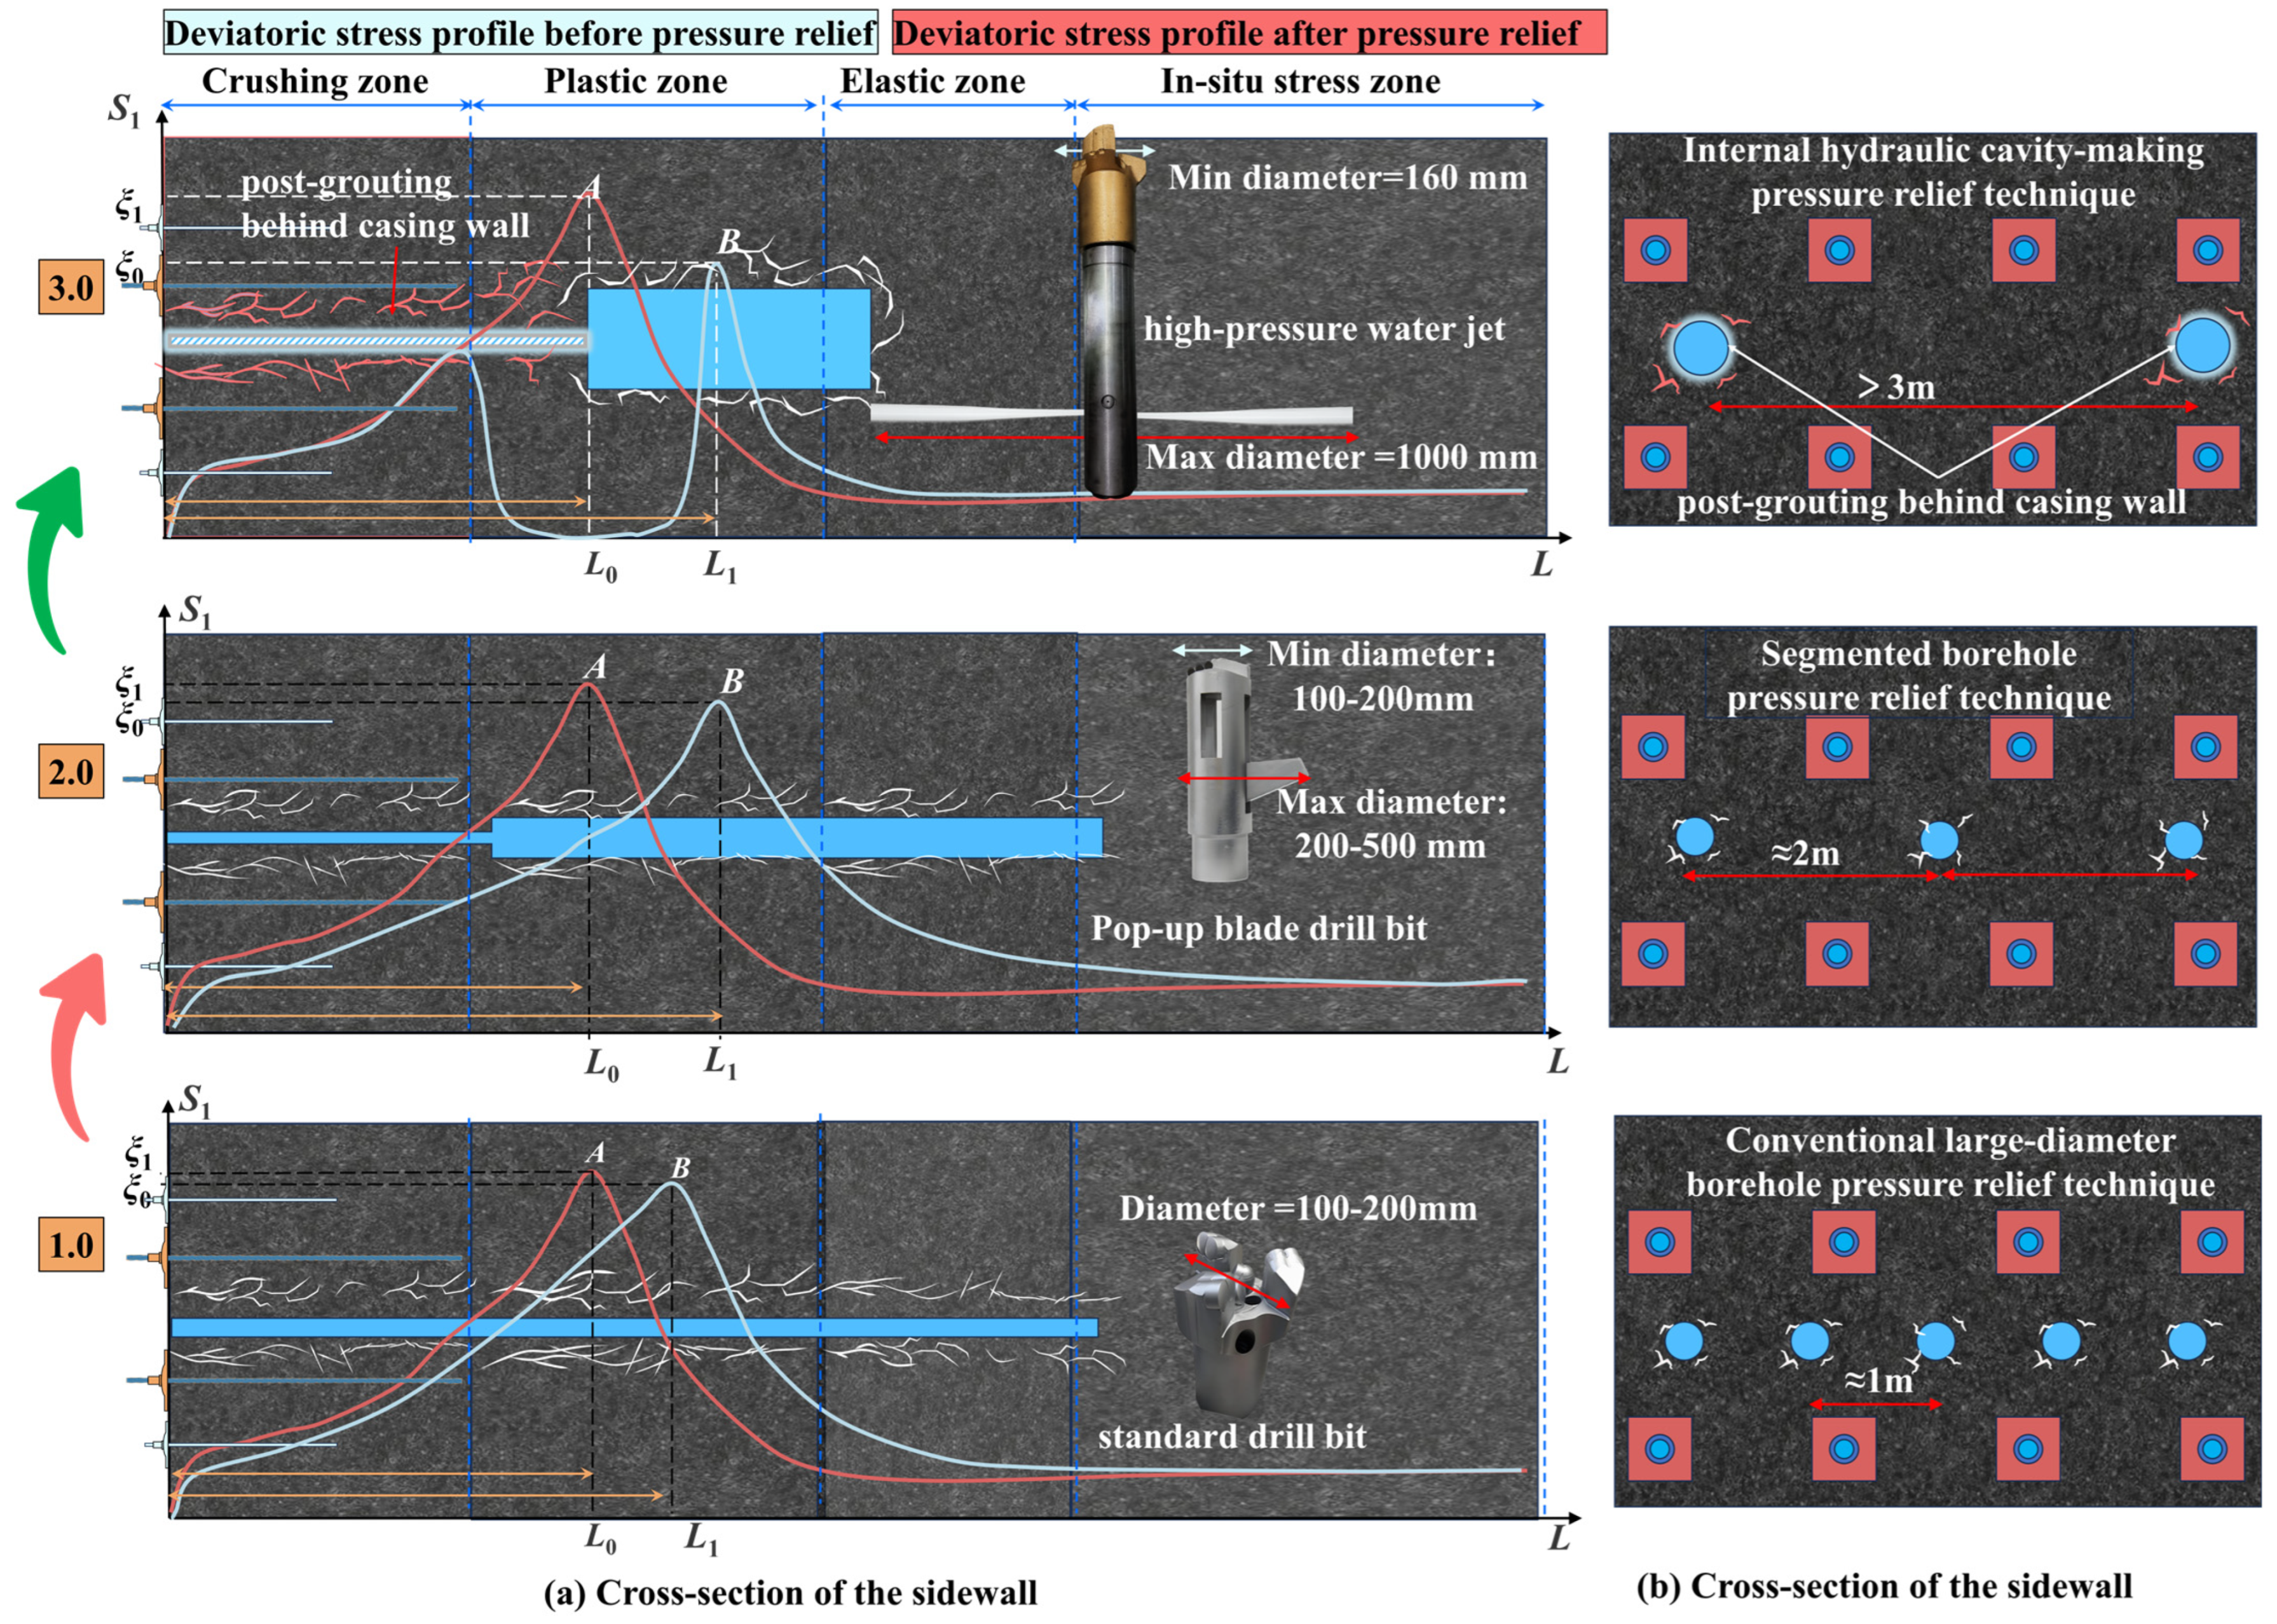
To address these limitations, this study proposes and systematically investigates a novel hydraulic cavitation pressure-relief technology. By integrating external strong anchorage of the sidewalls, near-surface modification and grouting behind the borehole wall, and deep large-diameter hydraulic cavitation to release peak stress, this technology effectively reconciles the contradiction between shallow anchorage strength and drilling-induced disturbance. To intuitively present the characteristics of different technologies and highlight the necessity for further innovation, Figure 1 summarizes the major differences among three typical pressure-relief techniques.

2. Engineering Overview and Failure Features

2.1. Engineering Background

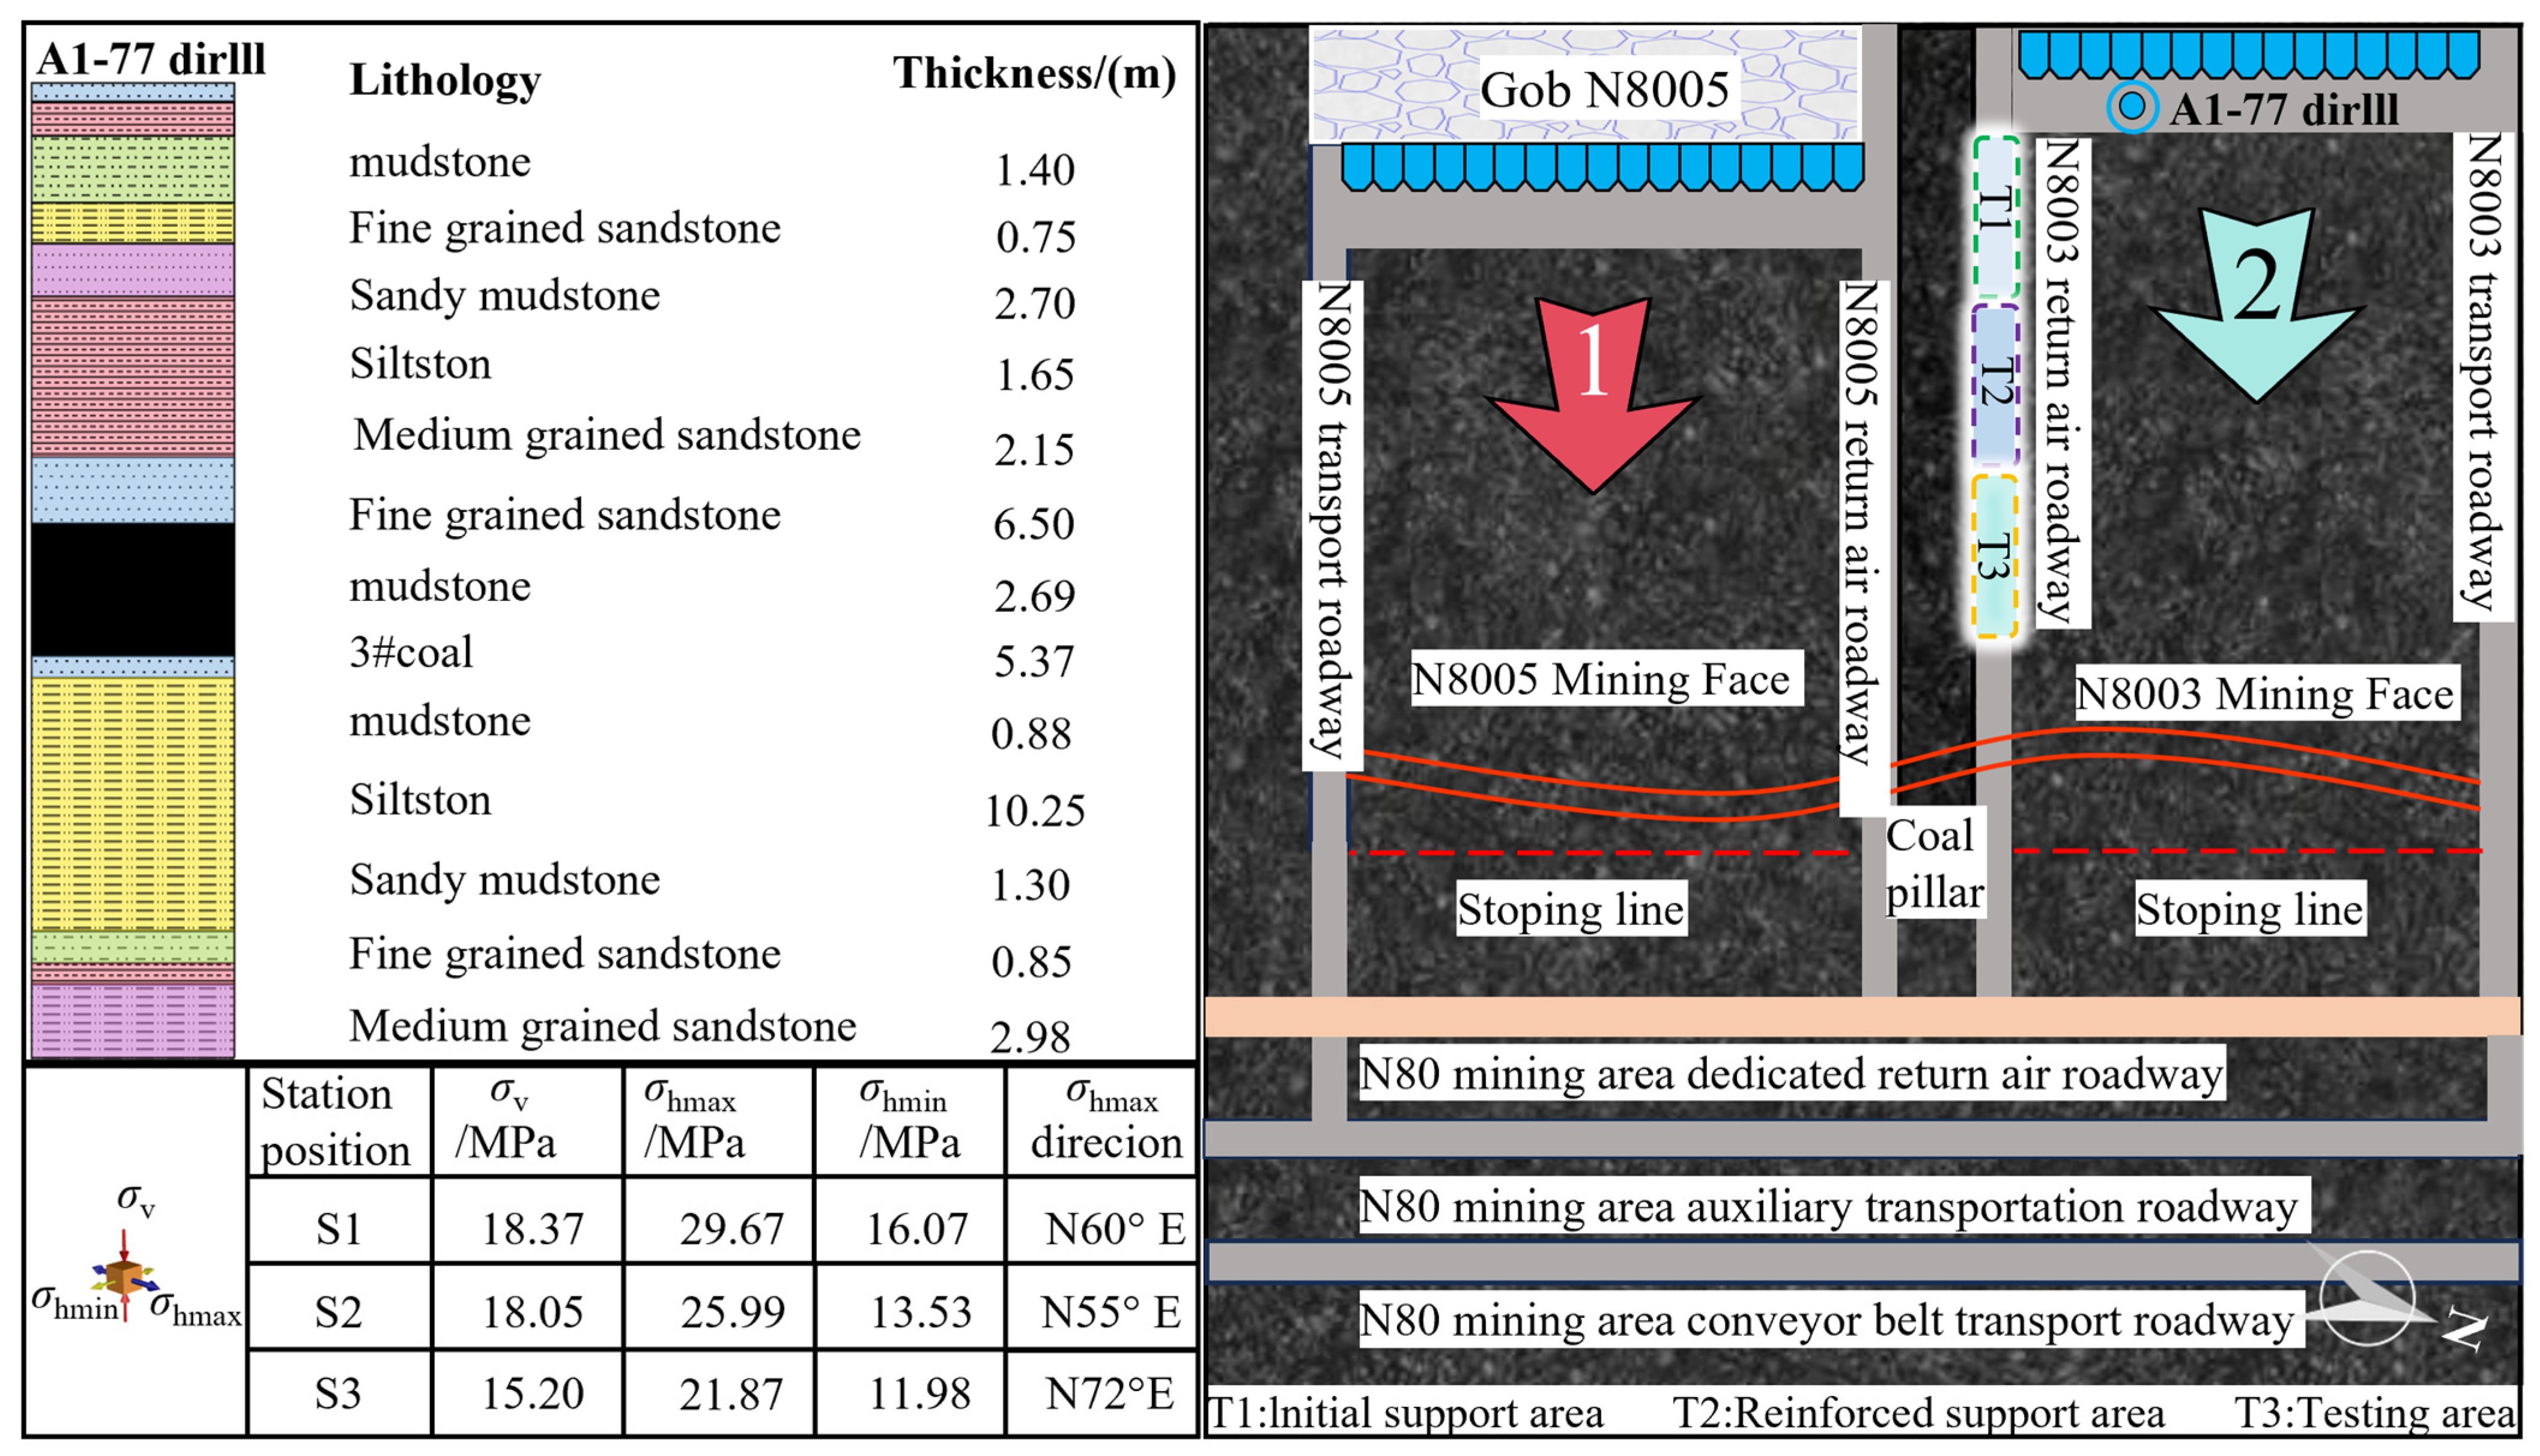
The test roadway is the N8003 tailgate of the Wuyang Mine. It has a cross-section of 5.5 m × 4.0 m and forms a twin-entry layout with the N8005 tailgate through a 40 m coal pillar. In situ measurements report a maximum principal stress of 29.67 MPa, and the readings at monitoring points S1 to S3 confirm that the district is exposed to high- to ultra-high-geostress conditions. The maximum burial depth of the roadway is approximately 750 m, and the coal seam is about 5.5 m thick.
During its service life, the roadway is sequentially affected by the mining activities of both the N8005 and N8003 working faces. When the N8005 face advances to nearly 200 m, the sidewalls of the N8003 tailgate undergo a significant loss of structural integrity and develop pronounced asymmetric deformation in the T1 area. The maximum convergence exceeds 3.0 m, while the coal-pillar side alone experiences more than 1.7 m of deformation. The original support system is unable to maintain stability, and widespread support failures occur.
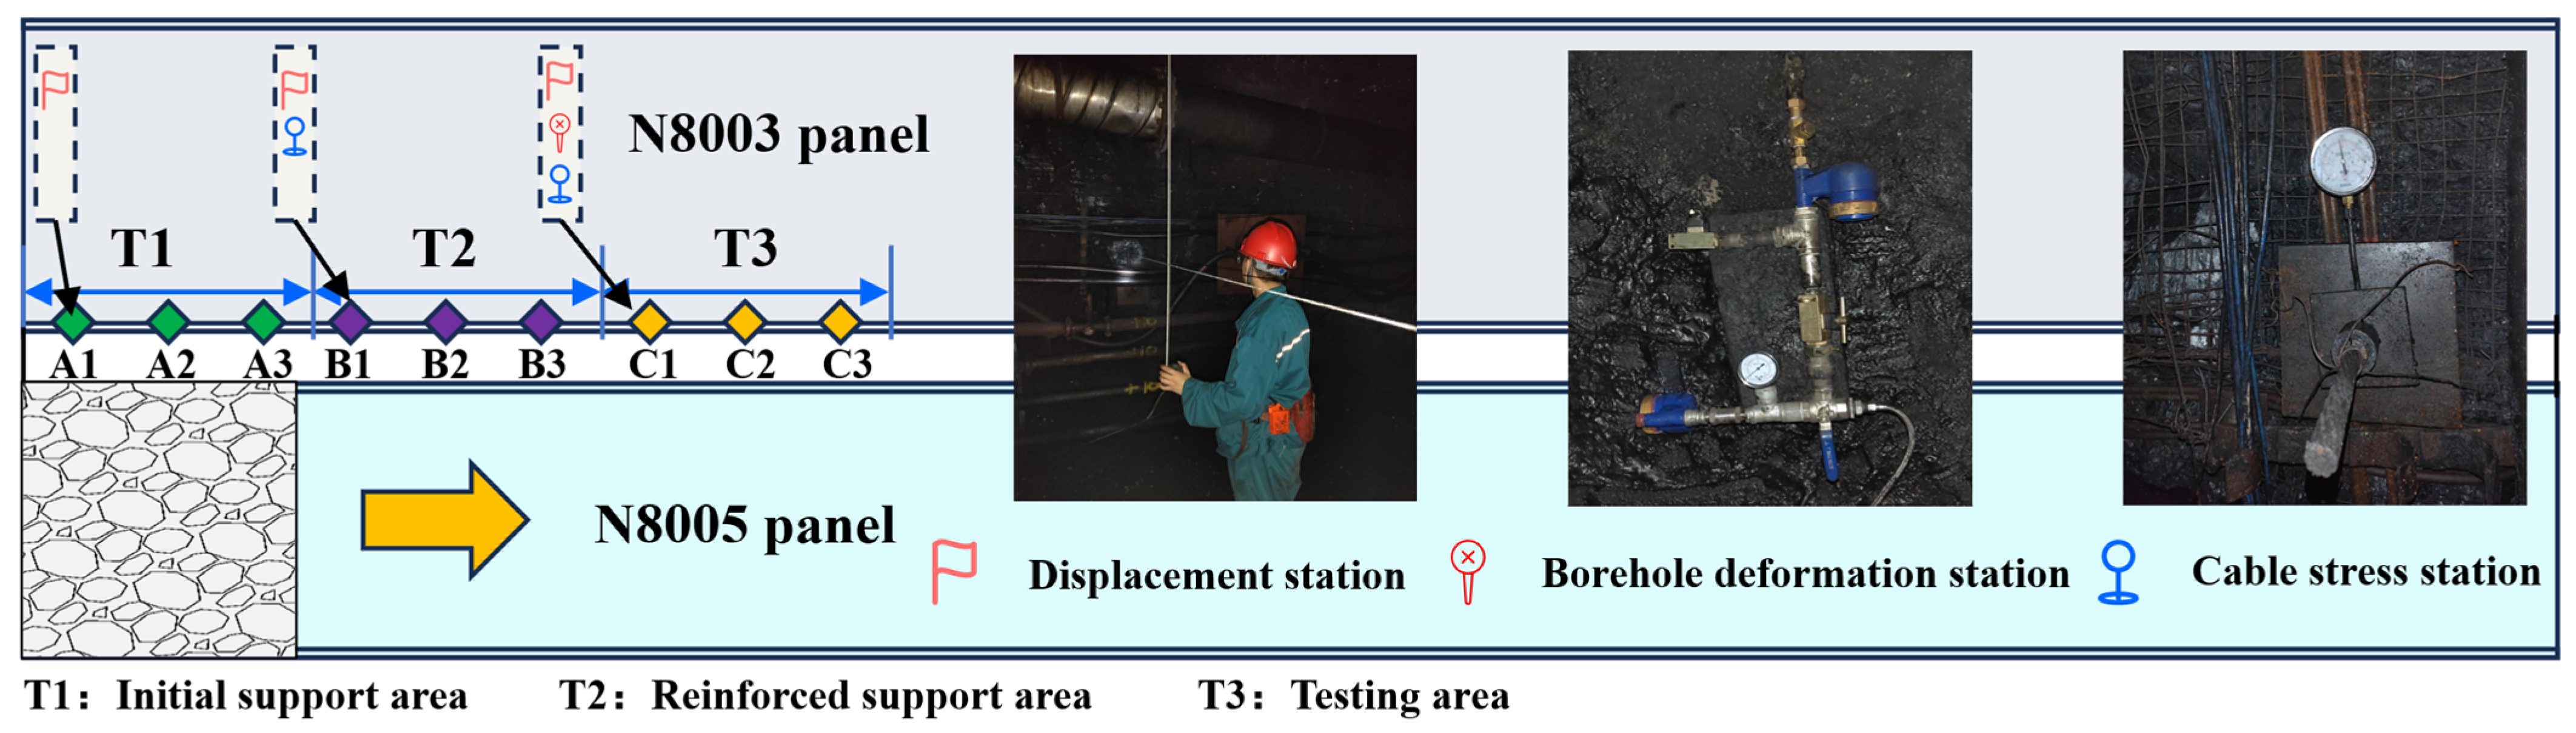
To facilitate targeted investigation, three comparative test areas are established along the roadway. T1 represents the original support configuration. T2 includes enhanced support only. T3 applies a coordinated support–relief control technique. The engineering geological conditions and test areas are shown in Figure 2.

2.2. Characteristics of Roadway Deformation and Failure

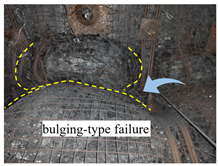
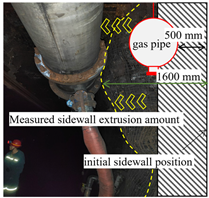
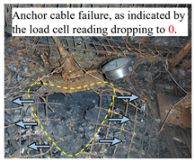
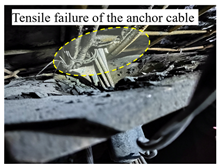
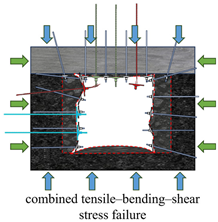
Under the combined influence of high in situ stress and strong mining-induced disturbances, the roadway-surrounding rock is prone to plastic failure. Its structural integrity decreases significantly, and its load-bearing capacity is greatly reduced, leading to pronounced asymmetric deformation of the sidewalls [24]. As the failure zone propagates deeper, rock fragmentation and dilation intensify, making the support system more susceptible to instability. At the same time, the roadway cross-section continues to contract. Field photographs and sketches of representative failure locations are presented in Table 1. Further analysis shows that the failure mechanisms can be summarized as follows:
(1) Bulging deformation at the coal-pillar shoulder corner (tensile–shear deformation).
This region lies along the coal–rock interface where stress concentration occurs, and its structure is loose with well-developed joints and fissures. Under long-term high stress, creep develops in the shoulder-corner rock, and local stress concentration triggers shear slip and outward bulging, ultimately forming pronounced bulge-like deformation.
(2) Overall large deformation of the sidewall (shear–slip deformation).
The roof strata are relatively thick and possess strong energy-release capacity. After fracturing, the large free movement space above the gob facilitates the fall of massive rock blocks, frequently generating intense dynamic loads that severely disturb the roadway, producing considerable damage depth. Under the joint influence of these dynamic loads and high in situ stress, shear–slip occurs along the coal–rock interface, manifested as shear bulging, crack propagation, and overall sliding, eventually resulting in asymmetric convergence of the roadway cross-section.
(3) Anchor-cable breakage (tensile–shear composite deformation).
Intense dynamic loading renders the original rock strength insufficient. When the surrounding rock bulges toward the roadway or undergoes shear slip, anchor cables experience tensile forces exceeding their design capacity, leading to breakage or pull-out. The wire mesh cannot accommodate the severe bulging deformation and is often stretched or torn. Local stress concentration further causes deformation or failure of surface-support components, and insufficient support stiffness prevents the formation of an effective load-bearing structure.

2.3. Structural Degradation of Surrounding Rock

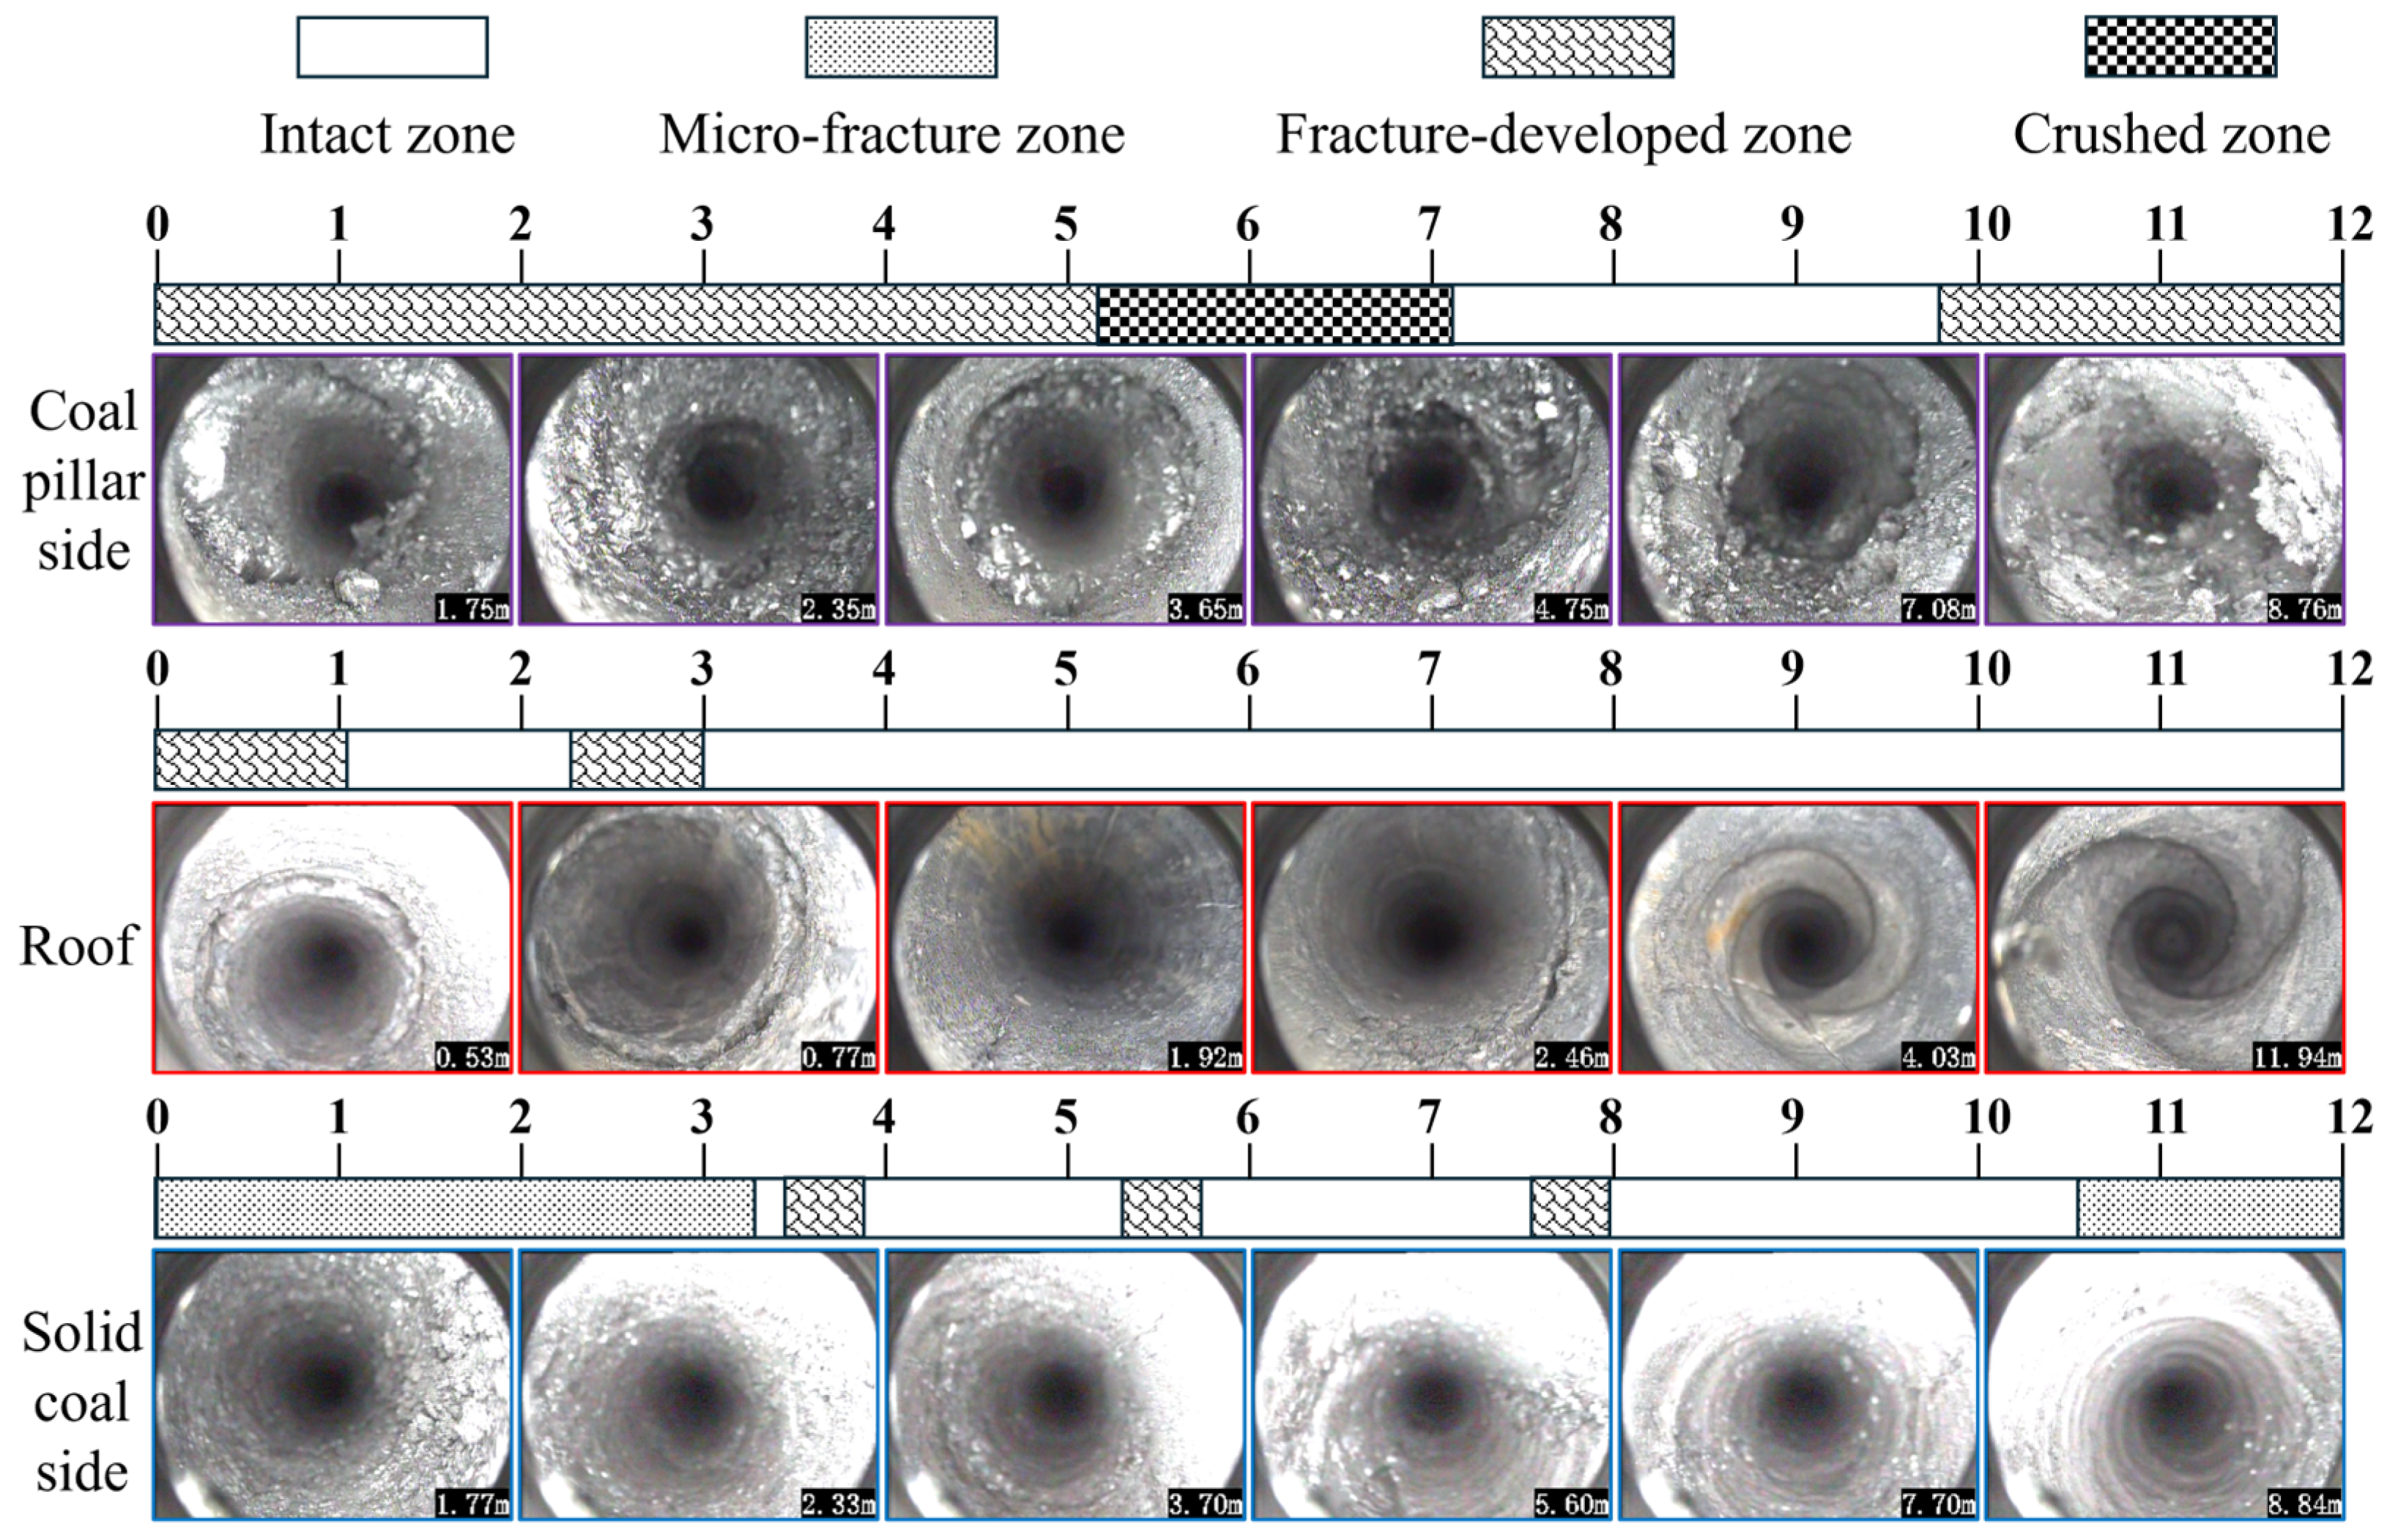
To reveal the spatial deterioration characteristics of the surrounding rock structure in deep roadways, five borehole camera observation holes (12 m in depth) were arranged at the roof, shoulder corners, and both sidewalls within the same roadway cross-section for in situ structural investigation. By identifying fracture morphology, aperture, and distribution characteristics, the integrity of the surrounding rock at different locations and depths was systematically evaluated. A structural deterioration schematic was subsequently established, and the surrounding rock was classified into four grades: intact zone, micro-fracture zone, fracture-developed zone, and fractured zone, as shown in Figure 3.
The structural deterioration of the roadway-surrounding rock exhibits pronounced spatial asymmetry. The coal-pillar sidewall shows the most severe deterioration, characterized by a wide range and high degree of damage. In the shallow zone, fractures are well-developed with large apertures and include annular and oblique fractures. In the middle zone (5–7 m), fracture-induced fragmentation occurs under high stress, accompanied by cavities and densely intersecting composite fractures. Beyond 7 m, the coal tends to become more intact, although free-face spalling still appears at the borehole bottom due to high deviatoric stress.
The roof exhibits an overall intact structure with uniform lithology, showing only a few annular fractures and minor delamination in the shallow zone. The structural deterioration on the solid-coal sidewall is considerably less pronounced than that on the coal-pillar side. The shallow 0–4 m zone is classified as a micro-fractured zone with fish-scale fracture patterns. From 5 to 9 m, fracture density increases slightly but the rock mass remains relatively intact. With increasing depth, parts of the rock mass gradually transition to an intact zone, while the deep high-stress region exhibits the development of micro-fractures.

3. Numerical Simulation Analysis

3.1. Numerical Model and Simulation Scheme

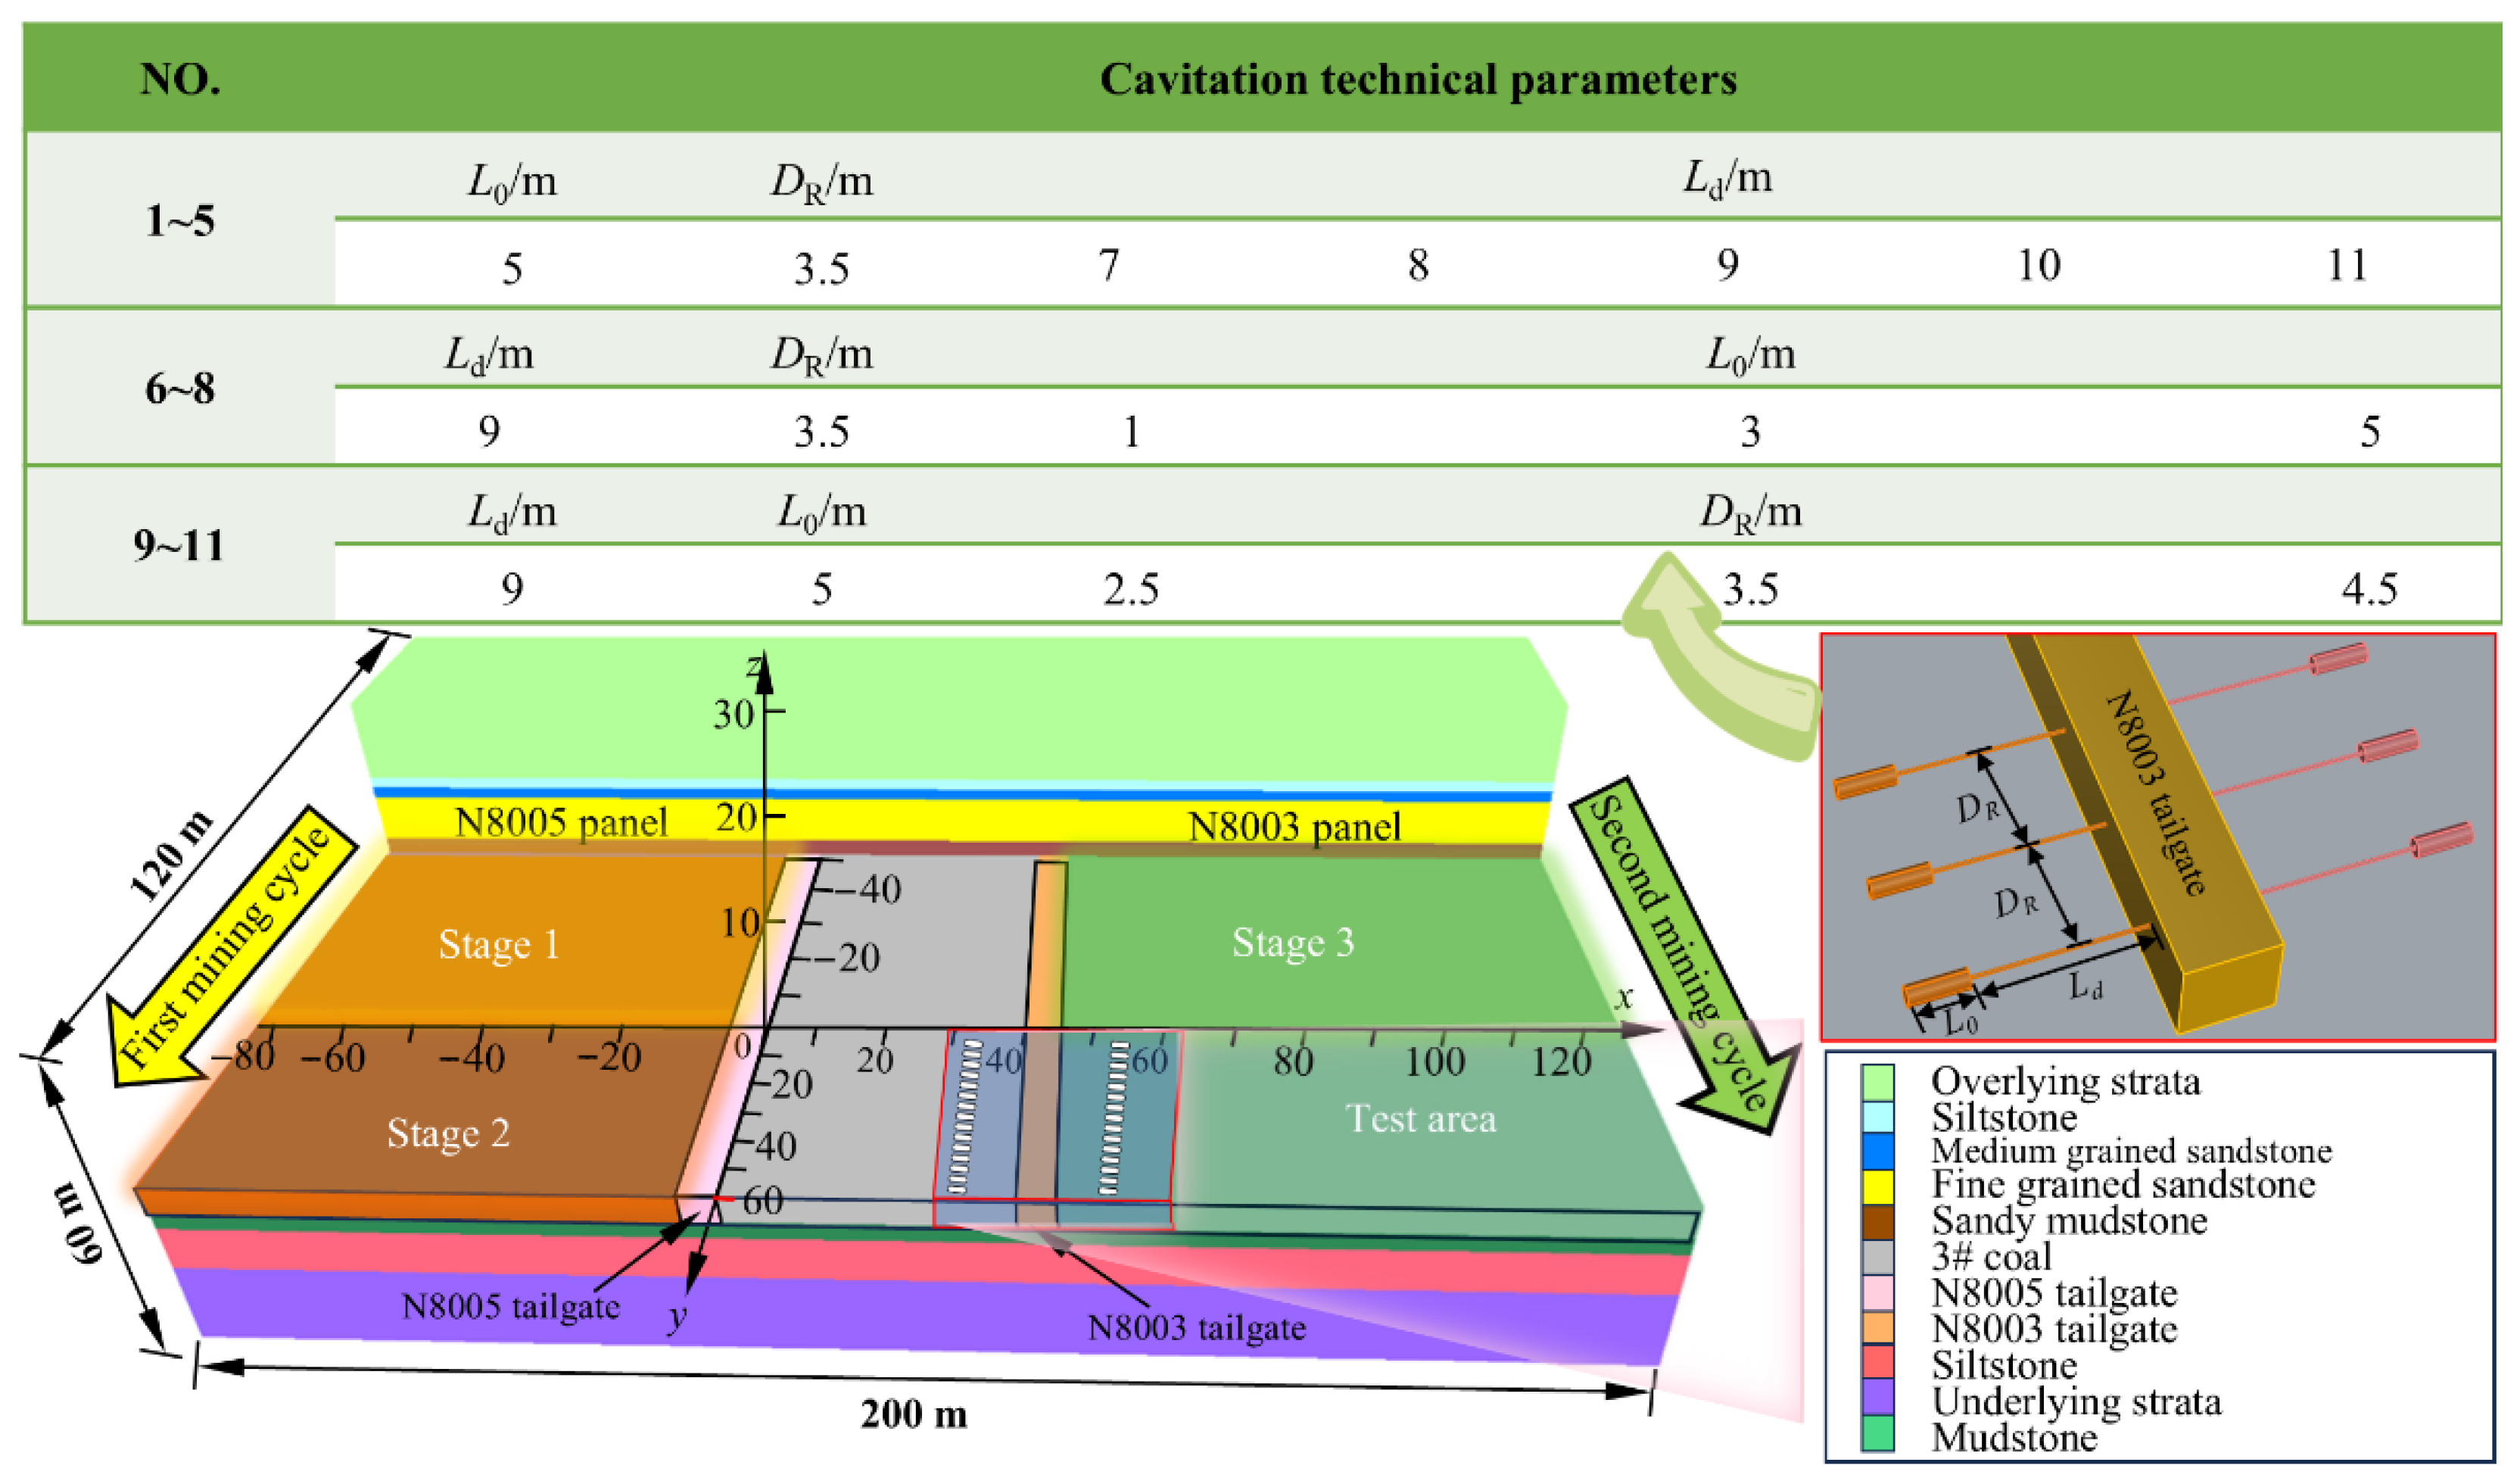
To systematically investigate the dynamic response of the pressure-relief performance in deep roadway-surrounding rock under different cavitation parameters (cavitation position Ld, cavitation length L0, and borehole spacing DR) and multiple mining-induced disturbances, a three-dimensional numerical model was developed using FLAC3D. A vertical stress of 18.36 MPa was applied to the top boundary to simulate the overburden load, whereas the lateral boundaries and the bottom boundary were fixed. The Mohr–Coulomb constitutive model was employed, and the lateral pressure coefficient was set to 1.2.
To improve numerical modeling efficiency and emphasize the main research focus, the conventional shallow and middle boreholes with regular diameters were simplified in this study. Considering that these boreholes were protected by casing and post-grouting after field construction, their influence on the overall stress state of the surrounding rock was limited. In addition, based on our team’s previous numerical studies, explicitly modeling such regular-diameter small boreholes has little effect on the macro-scale stress distribution and overall stress migration pattern of the surrounding rock. Therefore, these shallow boreholes were not modeled separately in the present numerical simulation, and the analysis focused on the mechanical response and pressure-relief mechanism of the internal cavitation pressure-relief boreholes.
The model simulated the mining process by means of stepwise excavation, in which the N8005 and N8003 working faces were excavated successively with an excavation step of 10 m, so that the experimental roadway was subjected to mining disturbances from the two working faces in sequence. According to the disturbance characteristics experienced by the experimental roadway during its service period, the stress evolution process can be divided into the static pressure stage and the mining-induced dynamic pressure stages (Stages 1–3). The following analysis focuses on the evolution characteristics of deviatoric stress at each stage. To investigate how key cavitation parameters influence the deviatoric stress field of the roadway-surrounding rock, an orthogonal test was designed with cavitation depth Ld, cavitation length L0 and borehole spacing DR as the main factors. Previous studies have primarily arranged pressure-relief boreholes on the solid-coal side [25,26,27], while research on cavitation within the coal-pillar section is almost absent. Since the cavitation parameters for the solid-coal side have already been determined, this study places its focus on optimizing the parameters for the coal-pillar side. The numerical model and simulation scheme are shown in Figure 4, and the mechanical properties of the strata are summarized in Table 2.

3.2. Deviatoric Stress Evaluation System for Deep Targeted Destressing (DTD)

Rock failure is essentially governed by deviatoric stress. According to elastoplastic theory, the stress state at any point can be decomposed into spherical (hydrostatic) stress and deviatoric stress, where the former reflects volumetric change and the latter controls plastic deformation and shear failure. Therefore, deviatoric stress is a key parameter for revealing the deformation and instability mechanisms of coal and rock masses. Compared with vertical stress or principal stress that characterizes loading in a single direction, deviatoric stress comprehensively reflects the relative relationships among the three principal stress components, and thus more effectively captures the heterogeneity and evolutionary characteristics of the local stress field [28,29]. Accordingly, the maximum principal deviatoric stress, S1 = σ1 − (σ1 + σ2 + σ3)/3, is adopted in this study as the core indicator for evaluating the stability of surrounding rock in deep mining roadways, to quantitatively characterize the stress concentration level in the dominant shear direction and identify the potential failure zones and their propagation patterns.

3.3. Evaluation of Pressure-Relief Effect Under Static Loading Conditions

Accurate determination of cavitation parameters is essential for achieving an orderly migration of peak stress toward the deep zone, forming a continuous pressure-relief belt, and maintaining the integrity of the shallow anchorage zone. The cavitation depth should adequately cover the peak-stress zone: an excessively shallow depth intensifies shallow stress concentration, whereas an overly deep depth may bypass the peak-stress band, resulting in “misaligned pressure relief” and reduced efficiency. The cavitation length must provide sufficient relief space to facilitate stress diffusion toward the deep zone; if it is too short, a continuous relief belt cannot be formed, whereas an excessively long length increases construction workload. The borehole spacing should balance the continuity of the relief belt and construction economy. An overly small spacing increases disturbance to the shallow surrounding rock and leads to excessive ineffective work, whereas an overly large spacing prevents effective stress relief between boreholes and induces stress concentration.
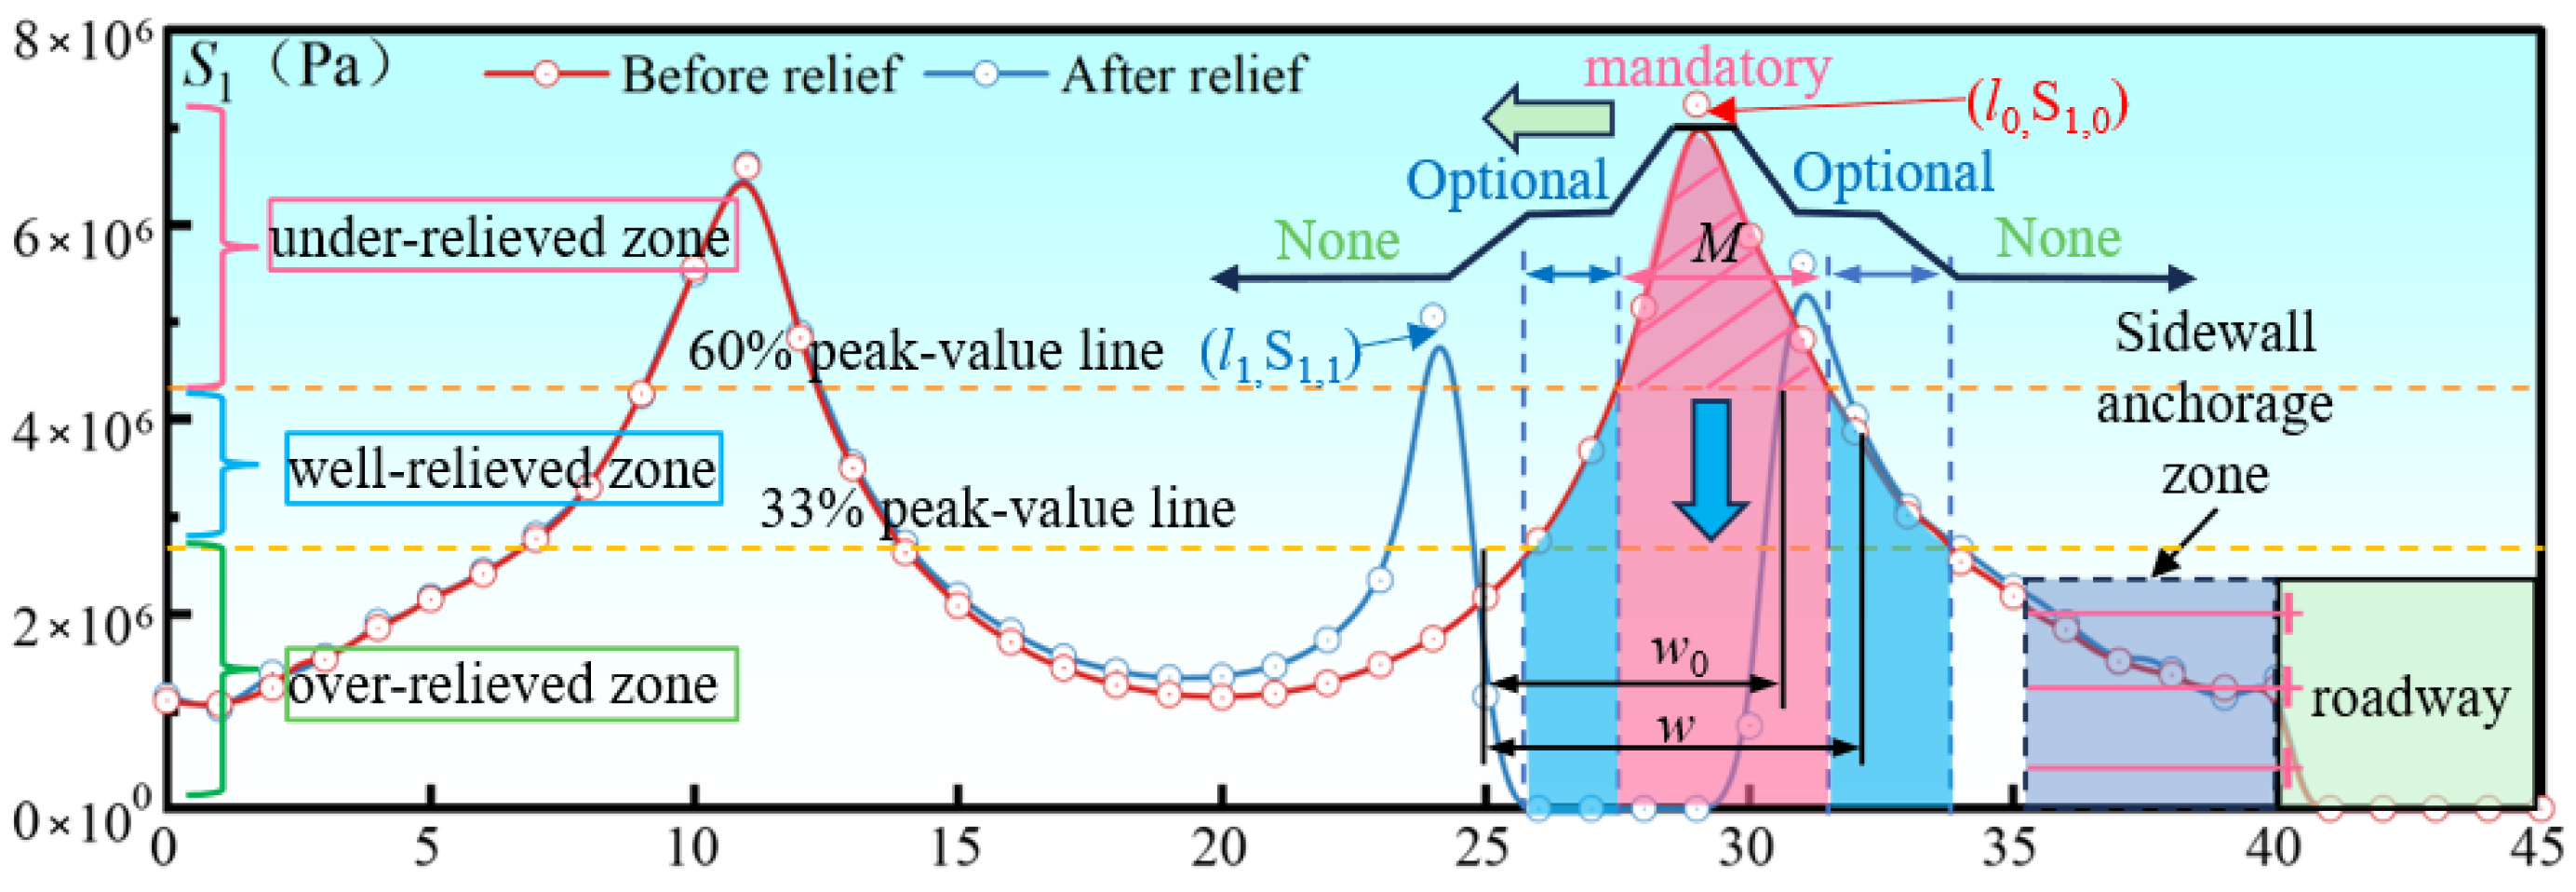
In engineering practice, the effectiveness of pressure relief is typically evaluated based on the reduction ratio of the deviatoric-stress peak and the extent to which the high-stress zone is reduced [30,31,32]. For example, when the peak deviatoric stress on the coal-pillar sidewall is 7.2 MPa, a post-relief reduction of 30–50%, accompanied by outward migration and shrinkage of the high-stress zone, is generally regarded as effective pressure relief. To achieve quantitative classification, 60% and 33% of the peak deviatoric stress are adopted as thresholds in this study, based on which the pressure-relief effect is divided into three levels:
(1) S1,1 > 4.32 MPa, Mandatory Pressure-Relief Zone (M-zone);
(2) 2.38 < S1,1 ≤ 4.32 MPa, Optional Pressure-Relief Zone (O-zone);
(3) S1,1 ≤ 2.38 MPa, Non-Relief Zone (N-zone).
The definitions of the evaluation indices for cavitation-induced pressure relief in this study are summarized in Table 3.
To systematically evaluate the influence of pressure-relief borehole parameters on the regulation of deviatoric stress in the surrounding rock, this study compares the spatial distribution, reduction amplitude, and migration characteristics of the maximum principal deviatoric stress (S1) under different combinations of key parameters, so as to determine the pressure-relief and stress-transfer effects of each scheme. Considering that a single indicator is insufficient to comprehensively characterize the pressure-relief intensity [25,26,27], the extent of the effective pressure-relief zone, and the migration of the stress peak, the Pressure Relief Efficiency Index (PREI) is introduced to provide a unified evaluation of different cavitation parameter schemes from the three dimensions of strength–range–position, thereby quantifying their overall contribution to the formation of the effective pressure-relief zone and the stress-transfer effect. The calculation expression of PREI is as follows:
I 1 = S 1 , 0 S 1 , 1 S 1 , 0 , I 2 = w 0 w m w 0 w , I 3 = l 0 l 0
To eliminate the influence of dimensional and magnitude differences, all indices were normalized to the interval [0, 1] using:
I i * = I i I min I max I min
The comprehensive evaluation after normalization is expressed as:
PREI = 0.2   I 1 * + 0.45   I 2 * + 0.35   I 3 *
According to the calculated PREI values Figure 5, three evaluation levels are defined:
Level I: PREI ≥ 0.7 (significant pressure-relief effect); Level II: 0.5 ≤ PREI < 0.7 (moderate effect); Level III: PREI < 0.5 (insufficient effect).
(1) Determination of the cavitation depth Ld on the coal-pillar side
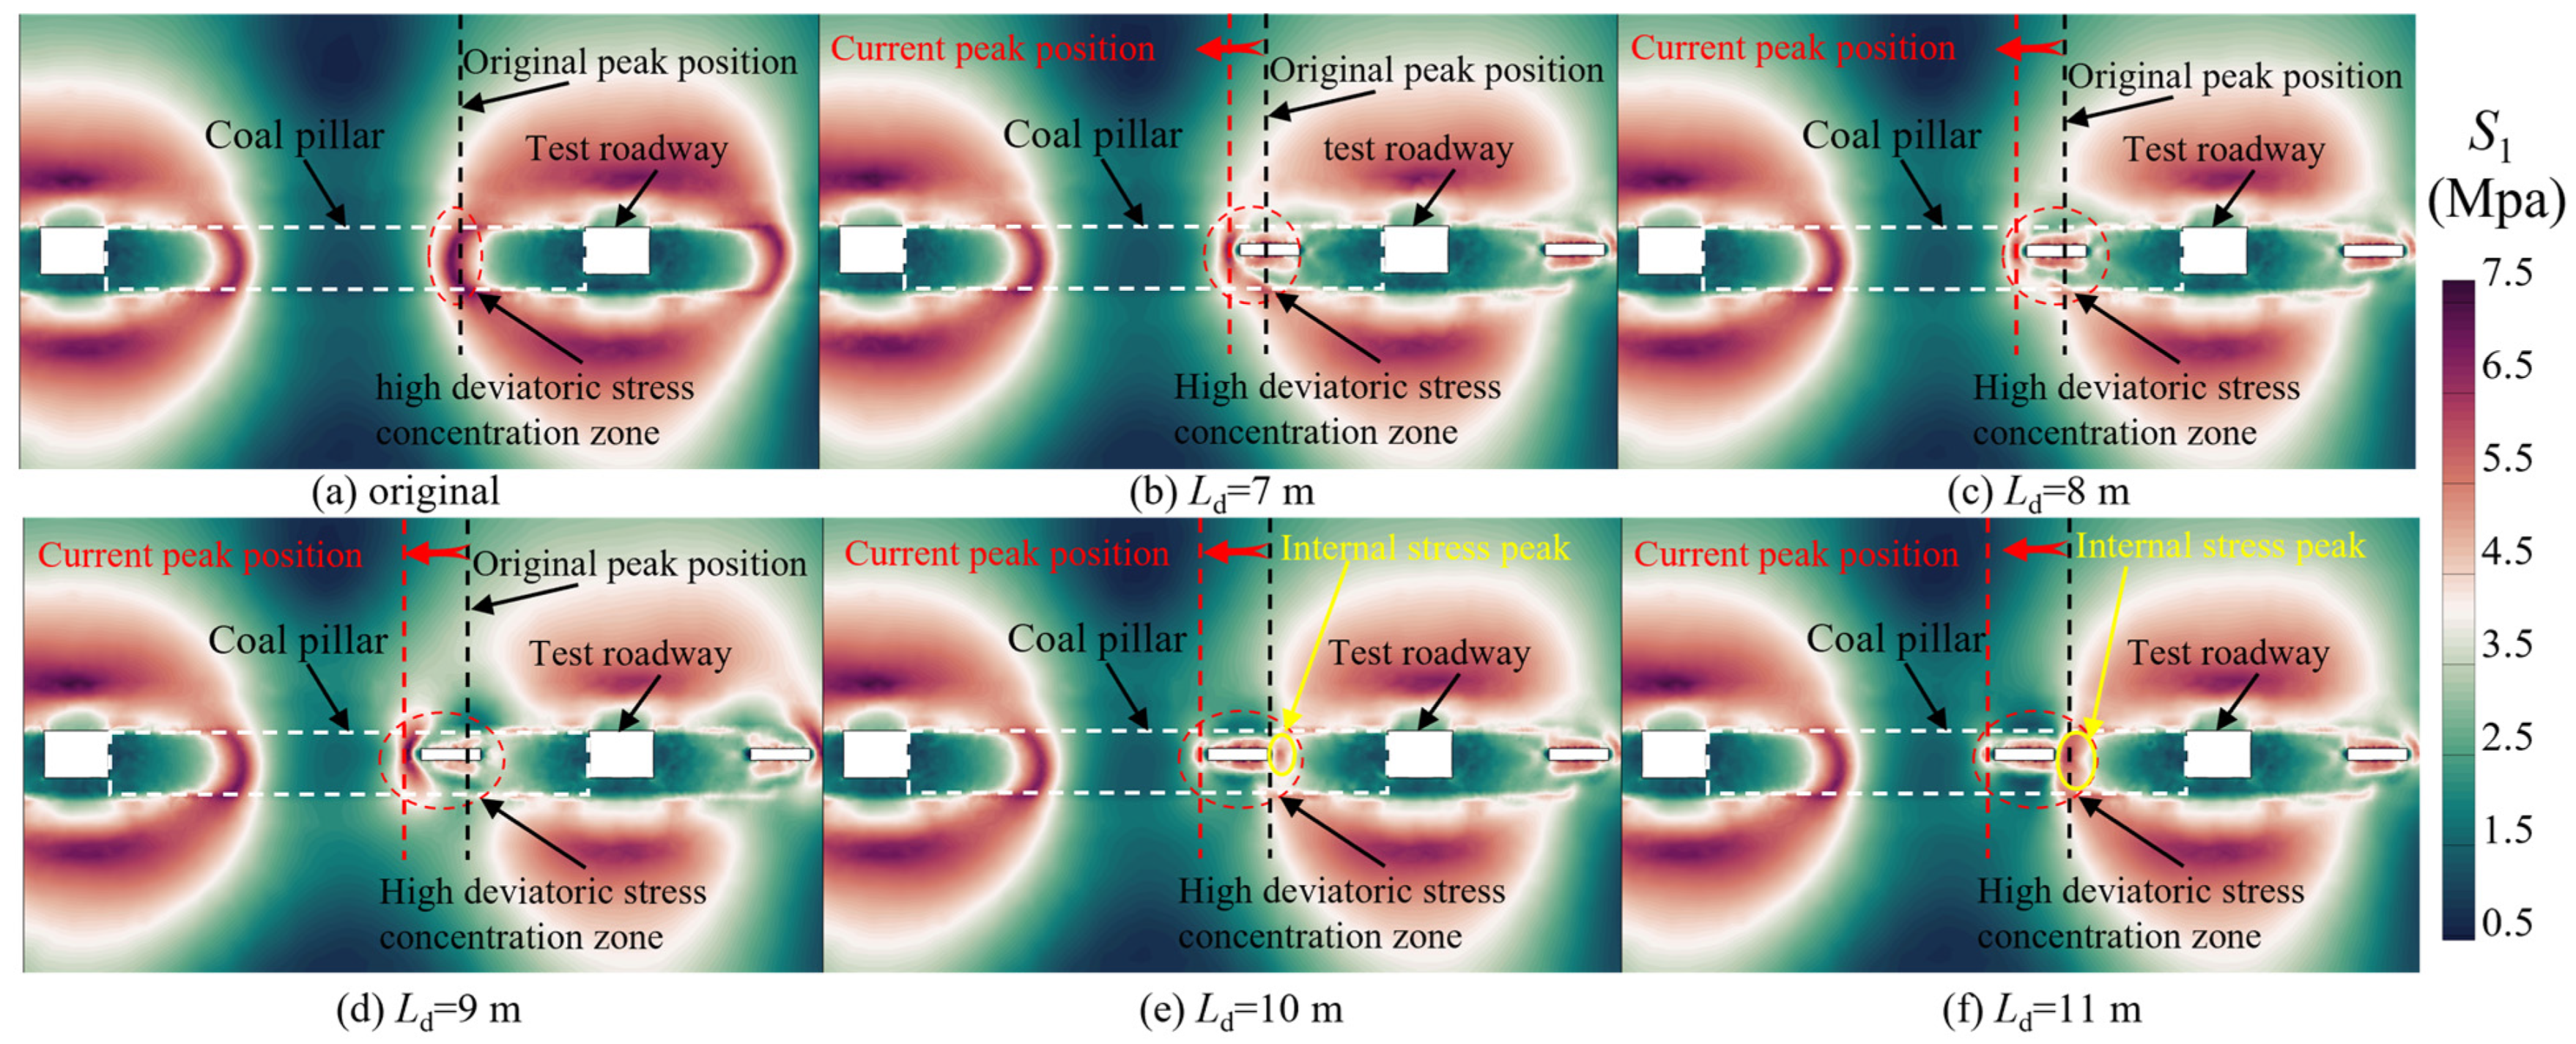
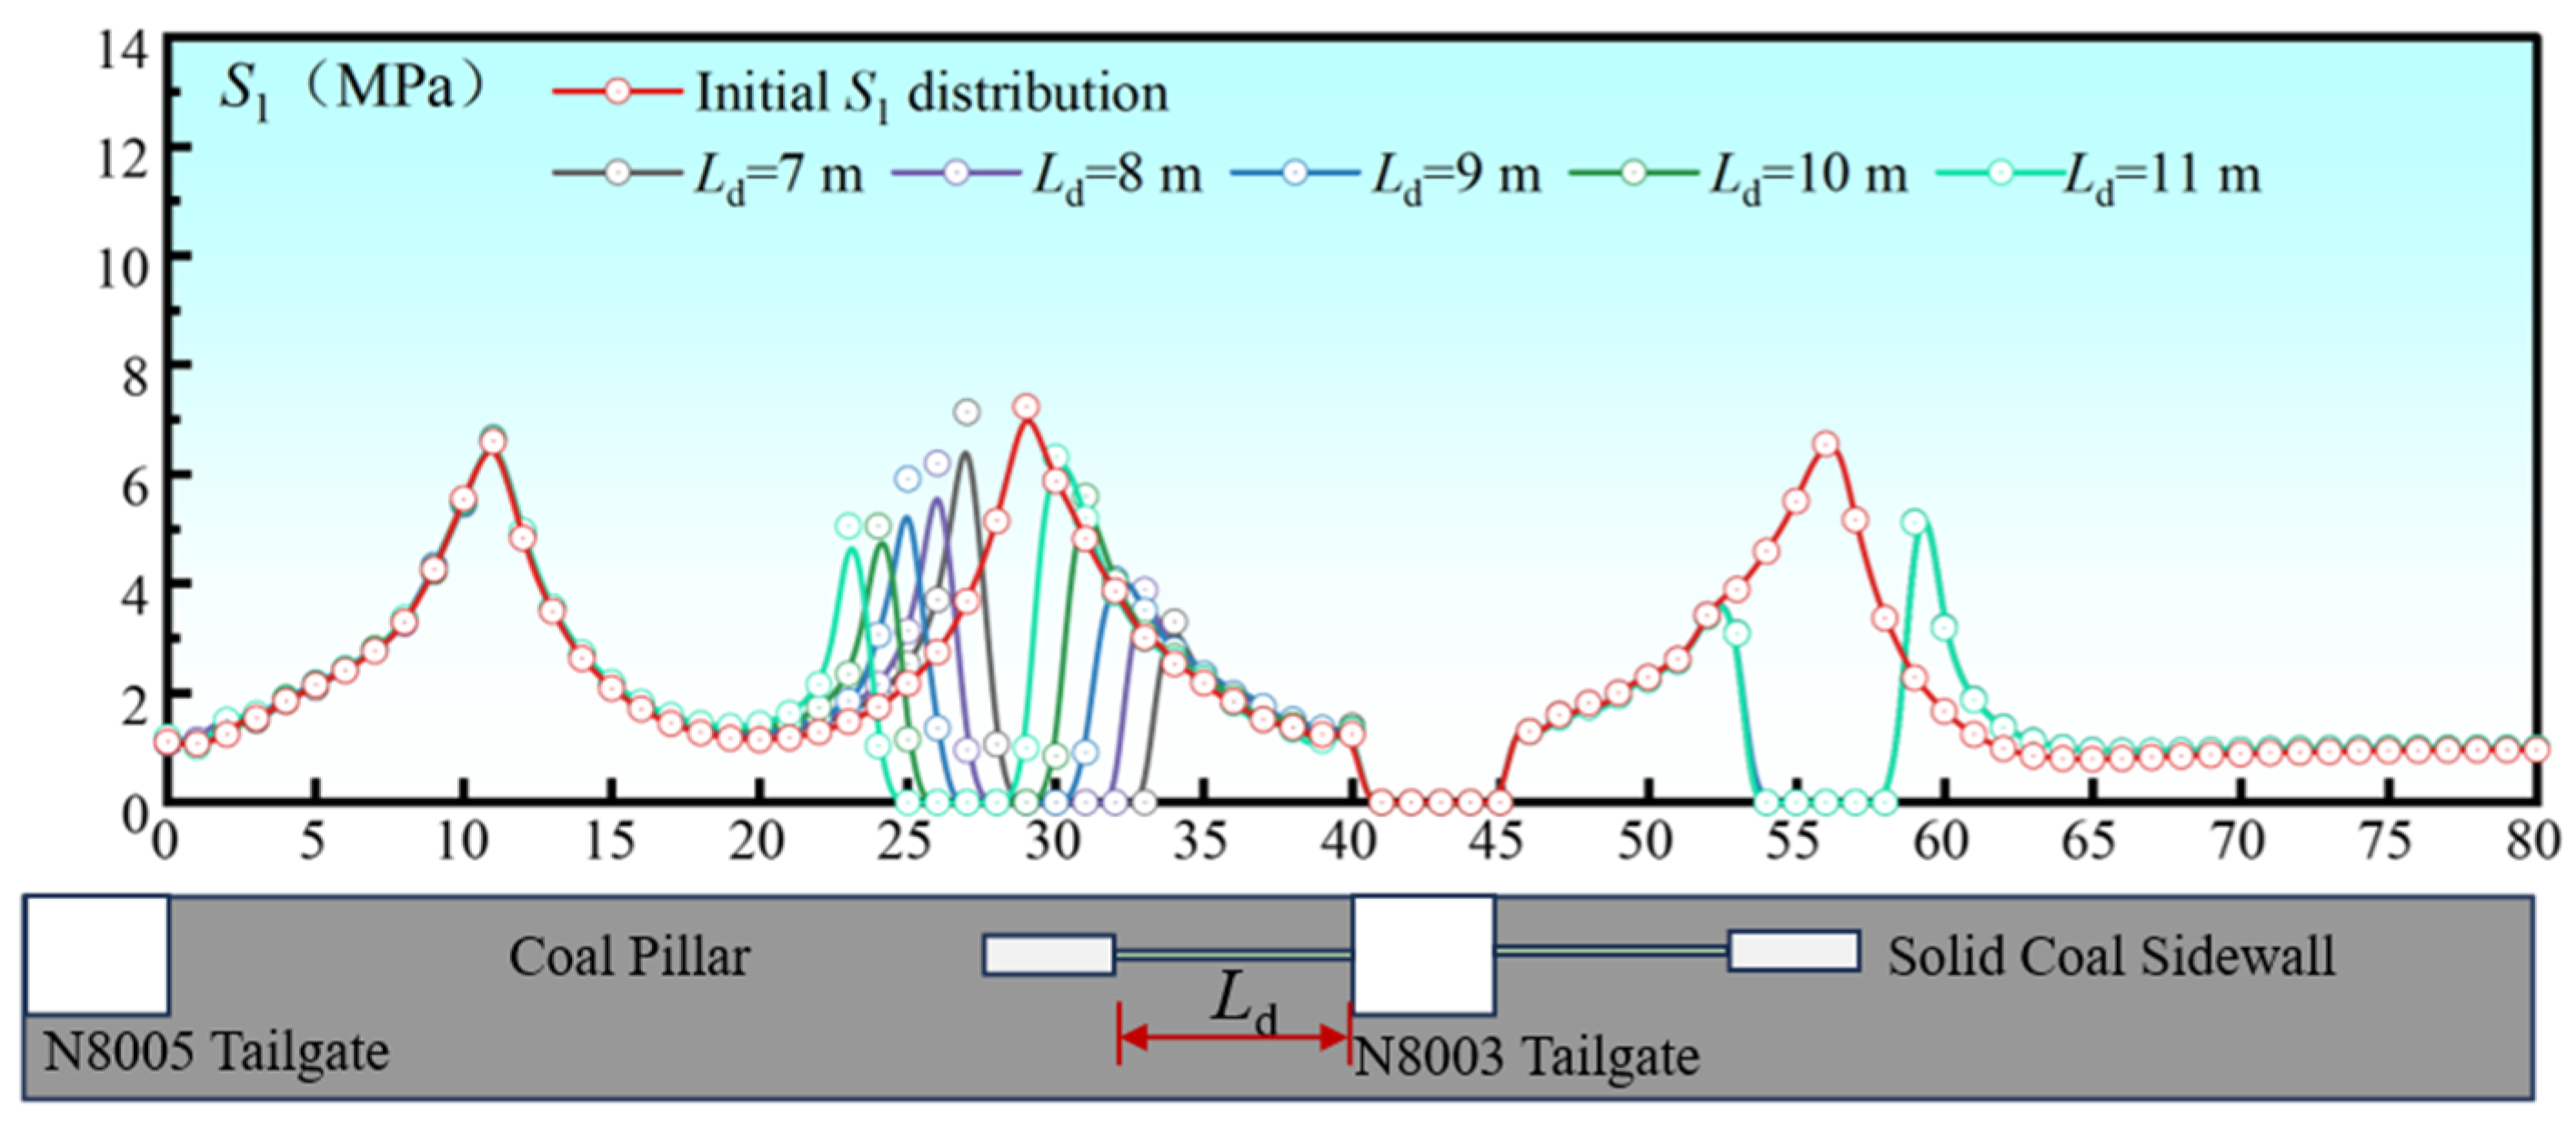
Figure 6 and Figure 7 illustrate the influence of different cavitation depths Ld on the deviatoric-stress distribution along the roadway sidewalls, revealing the migration of stress peaks and the evolution of high-stress zones with increasing borehole depth. In Figure 6a, representing the non-relief condition, pronounced high-deviatoric-stress concentrations are observed along both sidewalls as well as the roof and floor, forming a ring-shaped distribution. From Figure 6b–f, as Ld increases from 7 m to 11 m, the stress peak on the coal-pillar side progressively migrates toward the deep zone (the black dashed line marks the original peak location, whereas the red dashed line marks the current one), and the extent of the high-stress zone gradually narrows. When the borehole depth exceeds 9 m, a new stress-concentration core emerges inside the original peak location. When Ld ≤ 9 m, the pressure-relief effect enhances with increasing depth. However, when Ld > 9 m, deep-zone plastic yielding reduces the bearing capacity, causing load to transfer back toward the shallow region, where a secondary high-deviatoric-stress peak forms, thereby weakening the relief effect. Further increases in borehole depth provide only marginal improvement in stress transfer. Based on the overall observations from Figure 6a–f, a cavitation depth of Ld = 9 m is identified as the optimal relief depth, at which the high-deviatoric-stress zone is substantially reduced without inducing secondary shallow-zone concentration, achieving the best balance between pressure relief and load-bearing capacity.
(2) Determination of the cavitation length L0 on the coal-pillar side
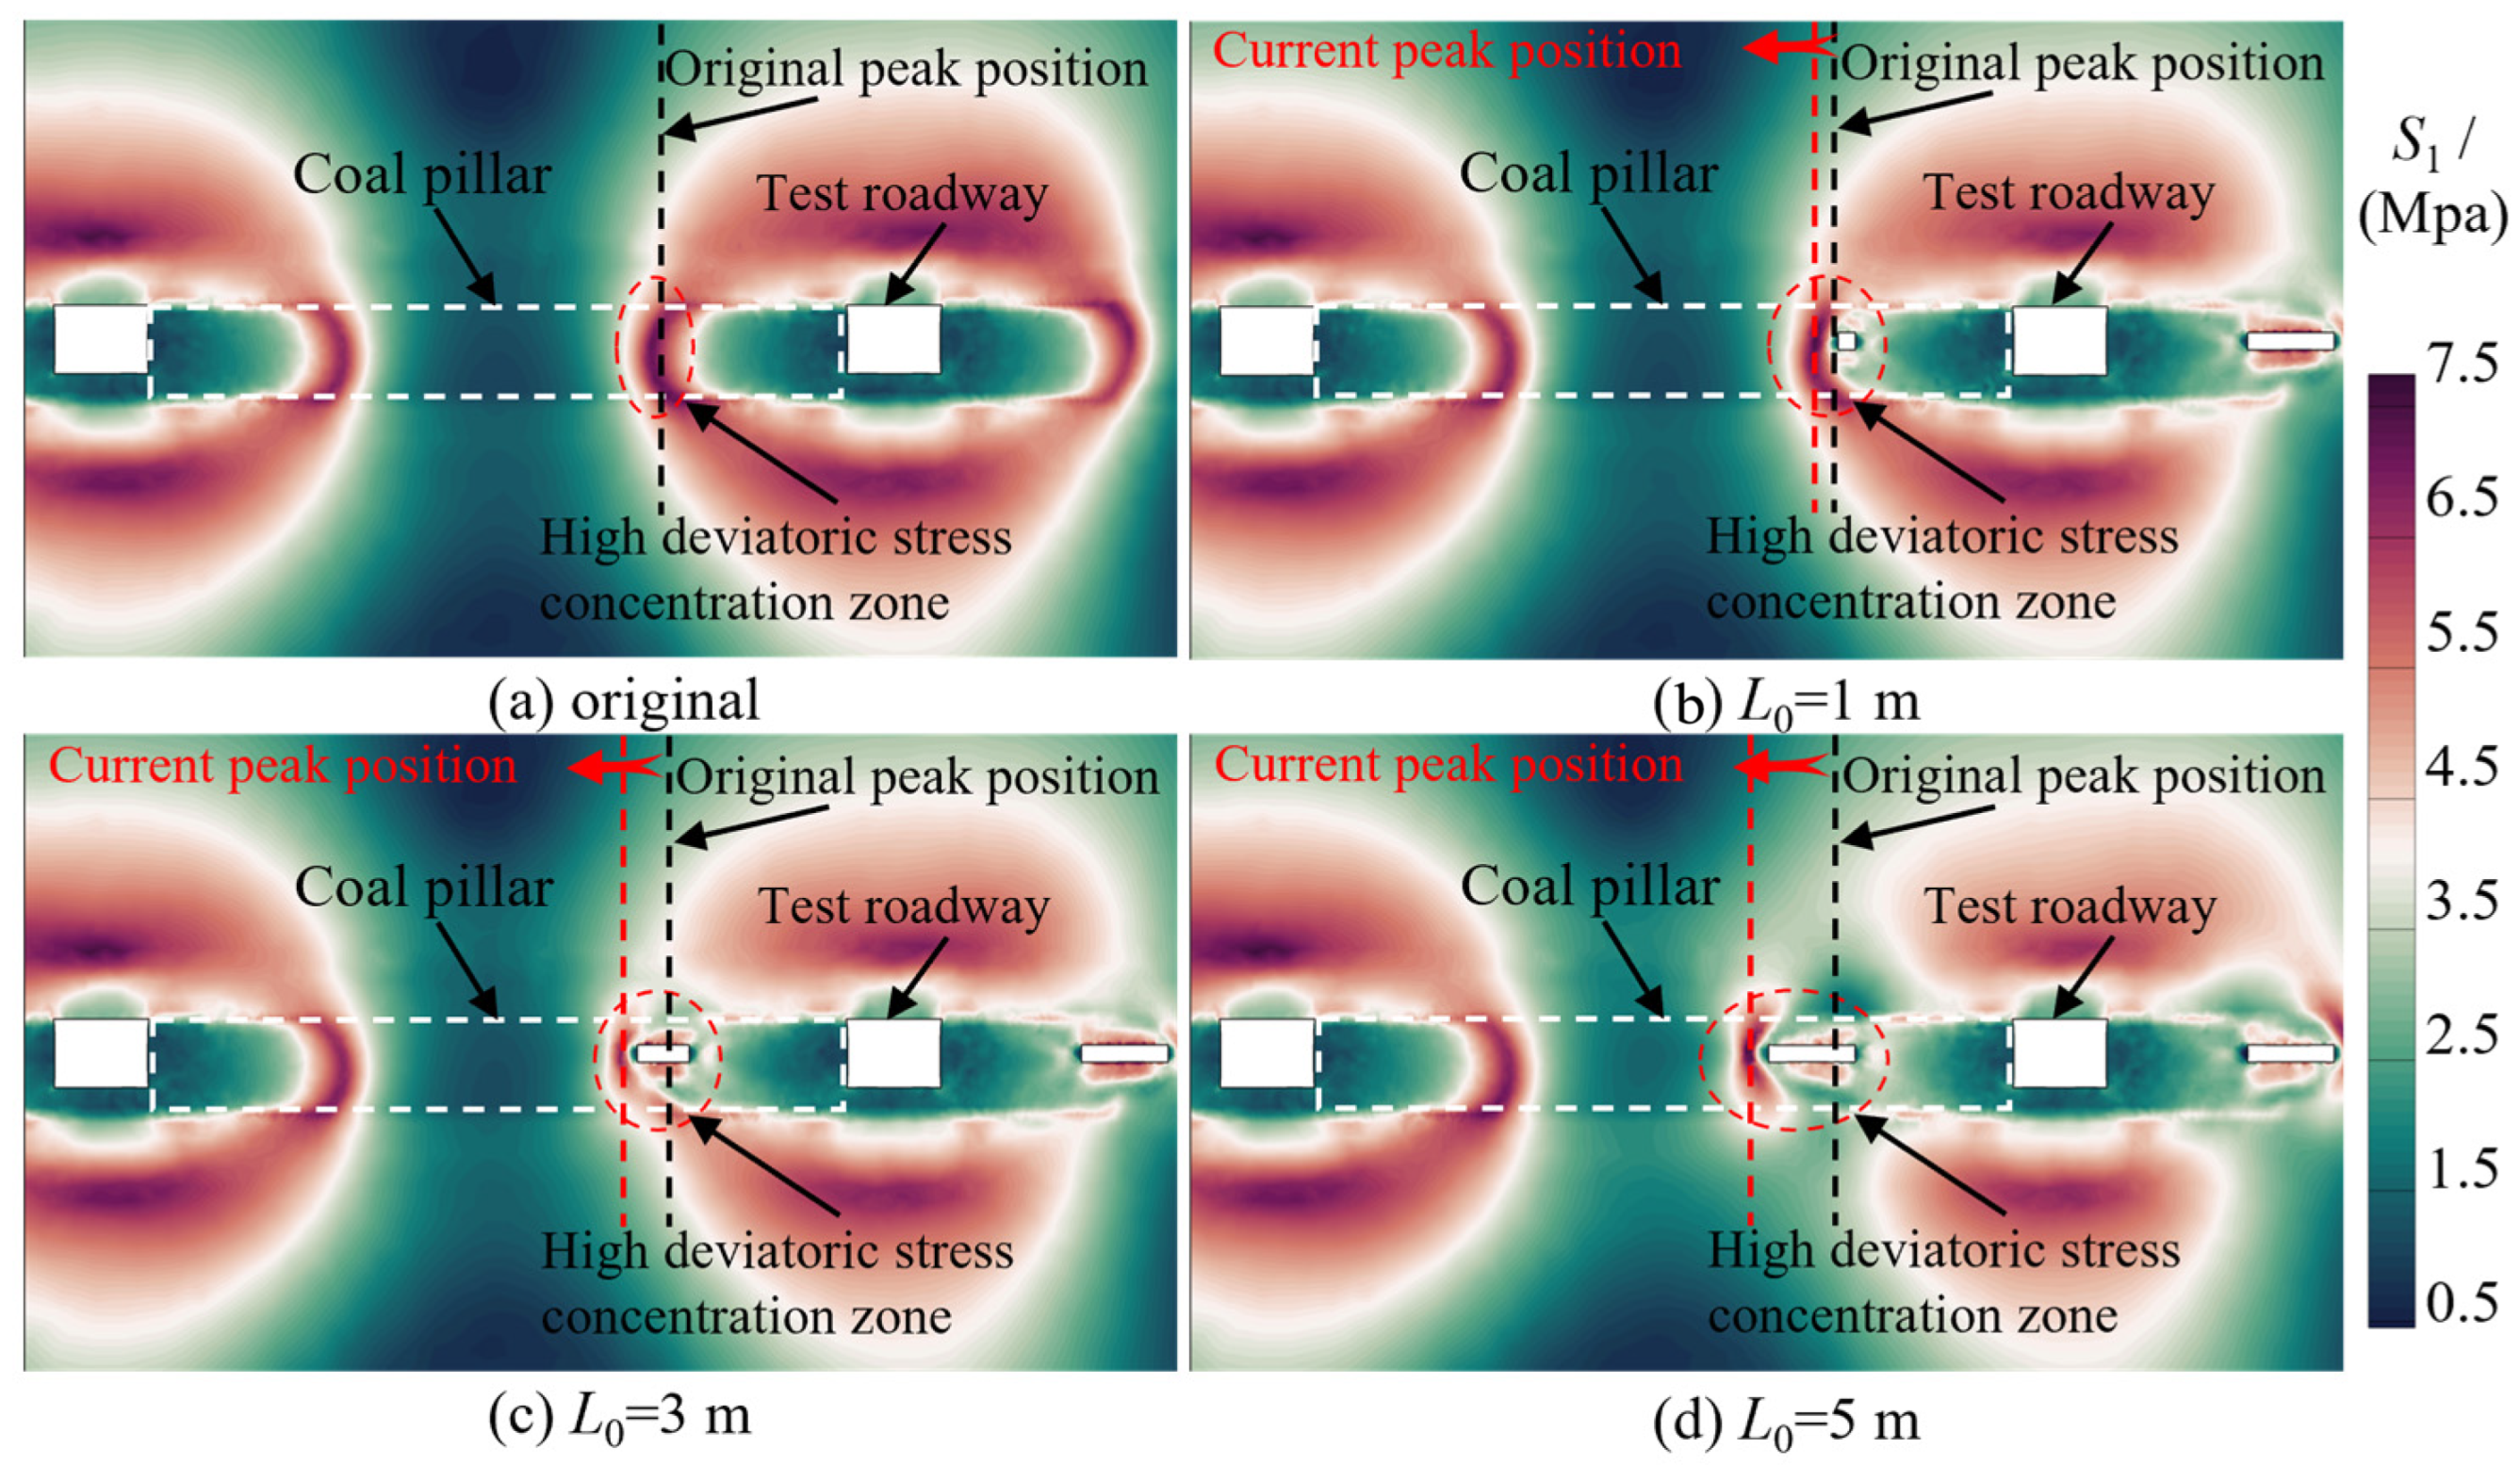
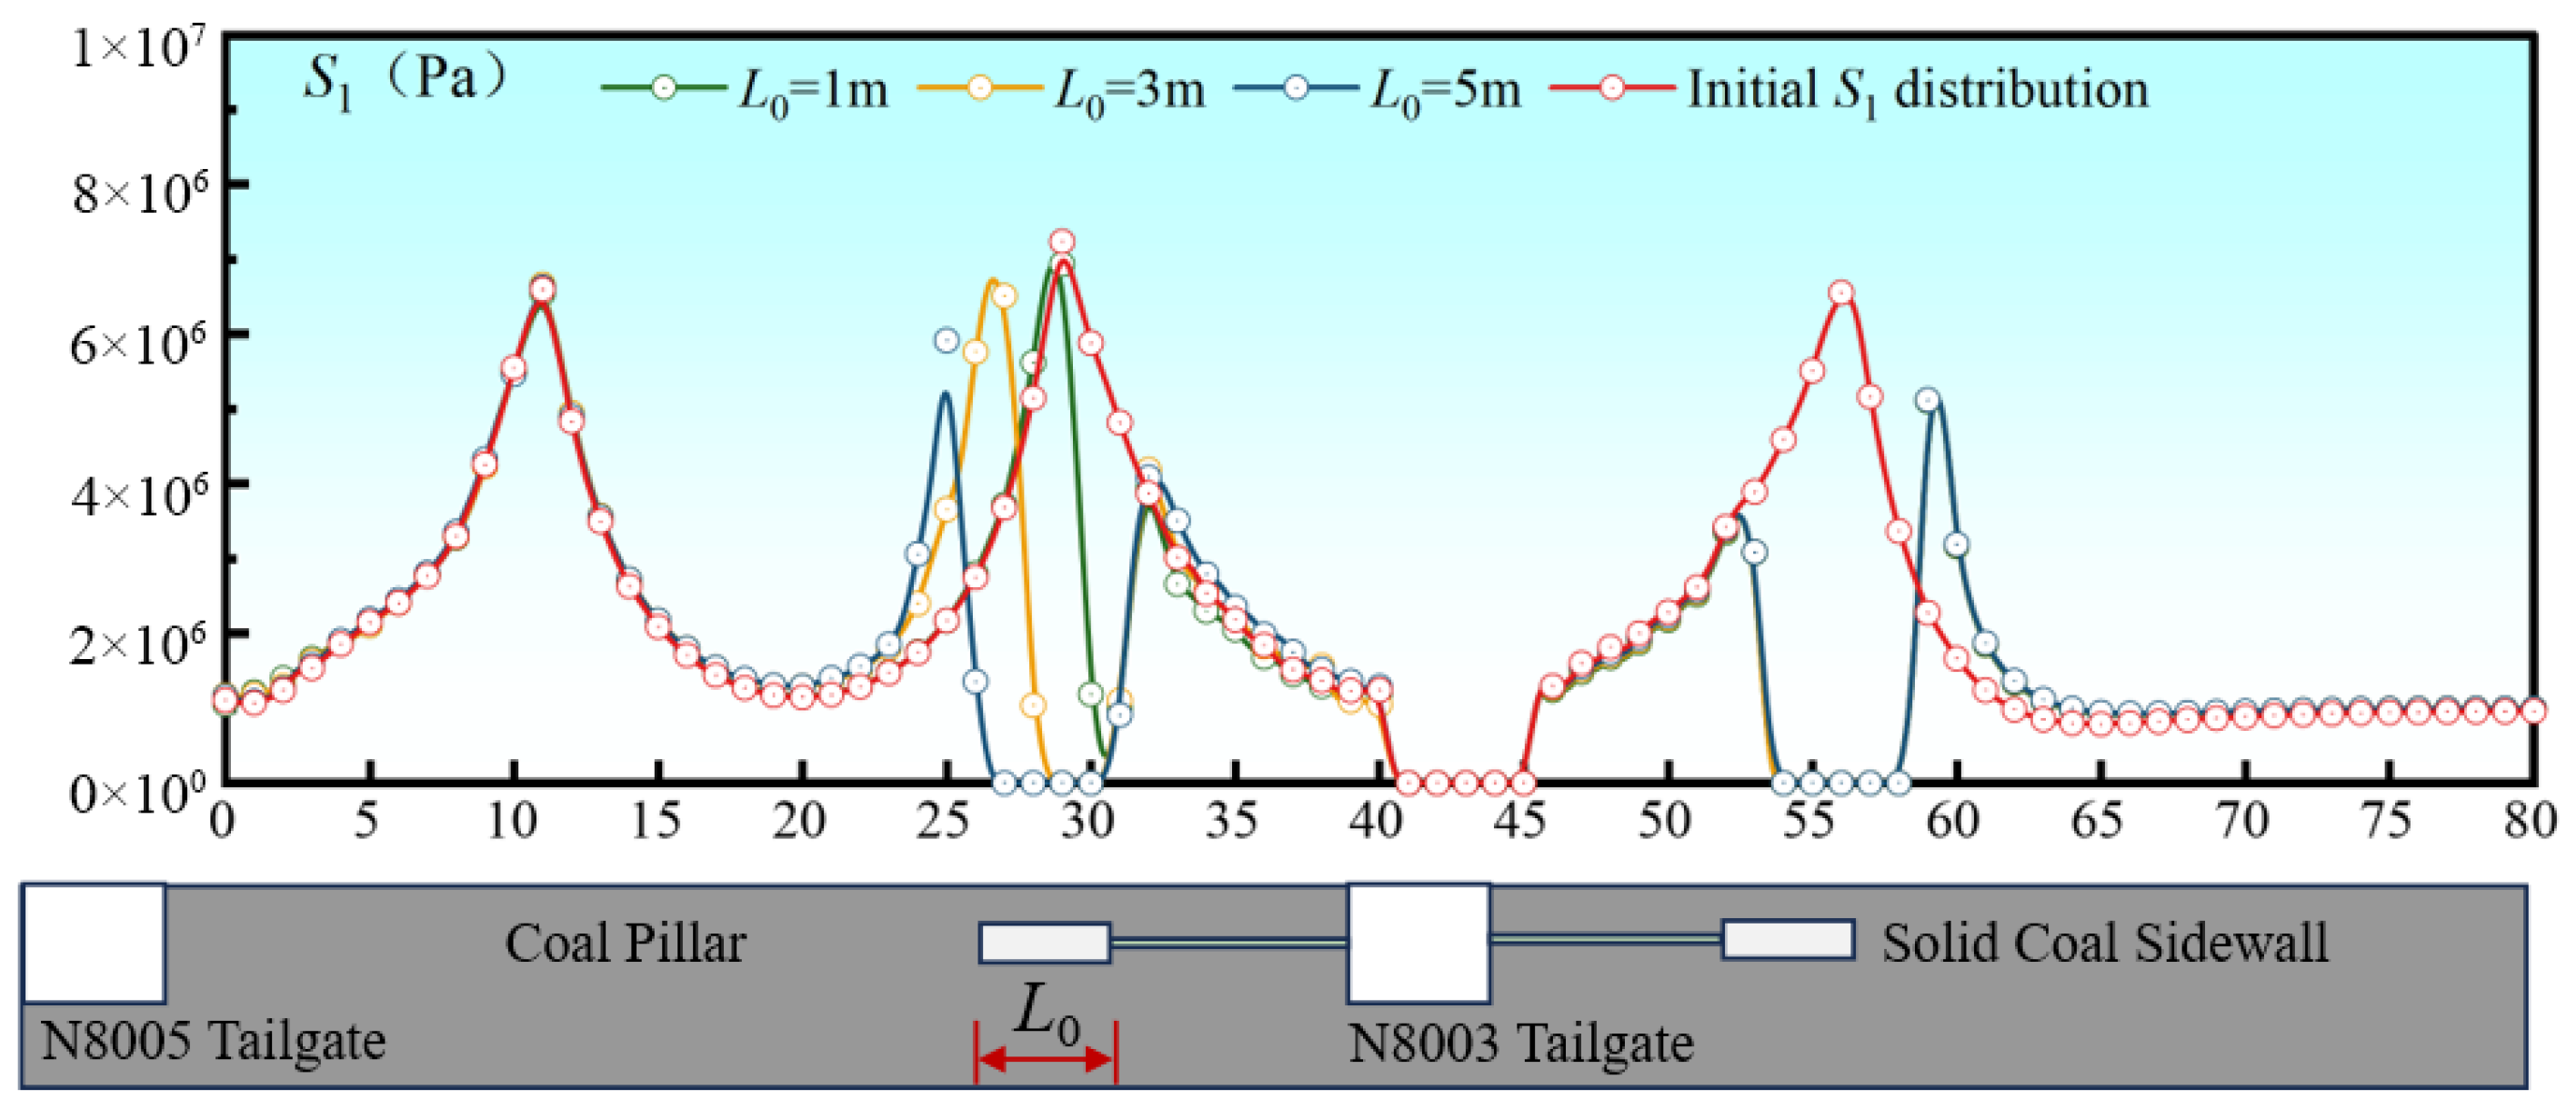
To examine how the pressure-relief cavity length L0 affects roadway-surrounding-rock stability, numerical simulations were carried out with a fixed cavitation position of Ld = 9 m for three cases with L0 equal to 1 m, 3 m and 5 m. The resulting distributions of the maximum principal deviatoric stress are shown in Figure 8 and Figure 9. The simulations indicate that the overall S1 patterns on the coal-pillar side remain broadly consistent across different L0, while the degree of stress weakening and the extent of peak movement vary markedly.
After the pressure-relief cavity is formed, the shallow anchorage zone remains stable and is not affected by the unloading process, confirming the rationality of selecting Ld = 9 m as the cavitation position. With increasing L0 the extent of the high-deviatoric-stress zone progressively narrows, while the peak stress decreases significantly and migrates toward the deep region, effectively reducing the high-stress concentration near the sidewall surface. When L0 = 1 m, the relief range is limited and stress transfer is minimal; when L0 = 3 m, the high-stress region contracts noticeably and the stress peak shifts outward toward the deep zone; when L0 = 5 m, the relief effect is the most pronounced, yielding the largest peak reduction and the deepest migration. The migration behavior of the deviatoric-stress peak demonstrates that increasing the cavitation length strengthens the pressure-relief effect; however, construction economy and technical feasibility must also be considered. In engineering practice, a relatively large L0 is recommended to achieve an optimal balance.
A summary of the evaluation indices under different Ld and L0 conditions in the static-loading stage is presented in Table 4.
(3) Determination of the cavitation spacing DR on the coal-pillar side
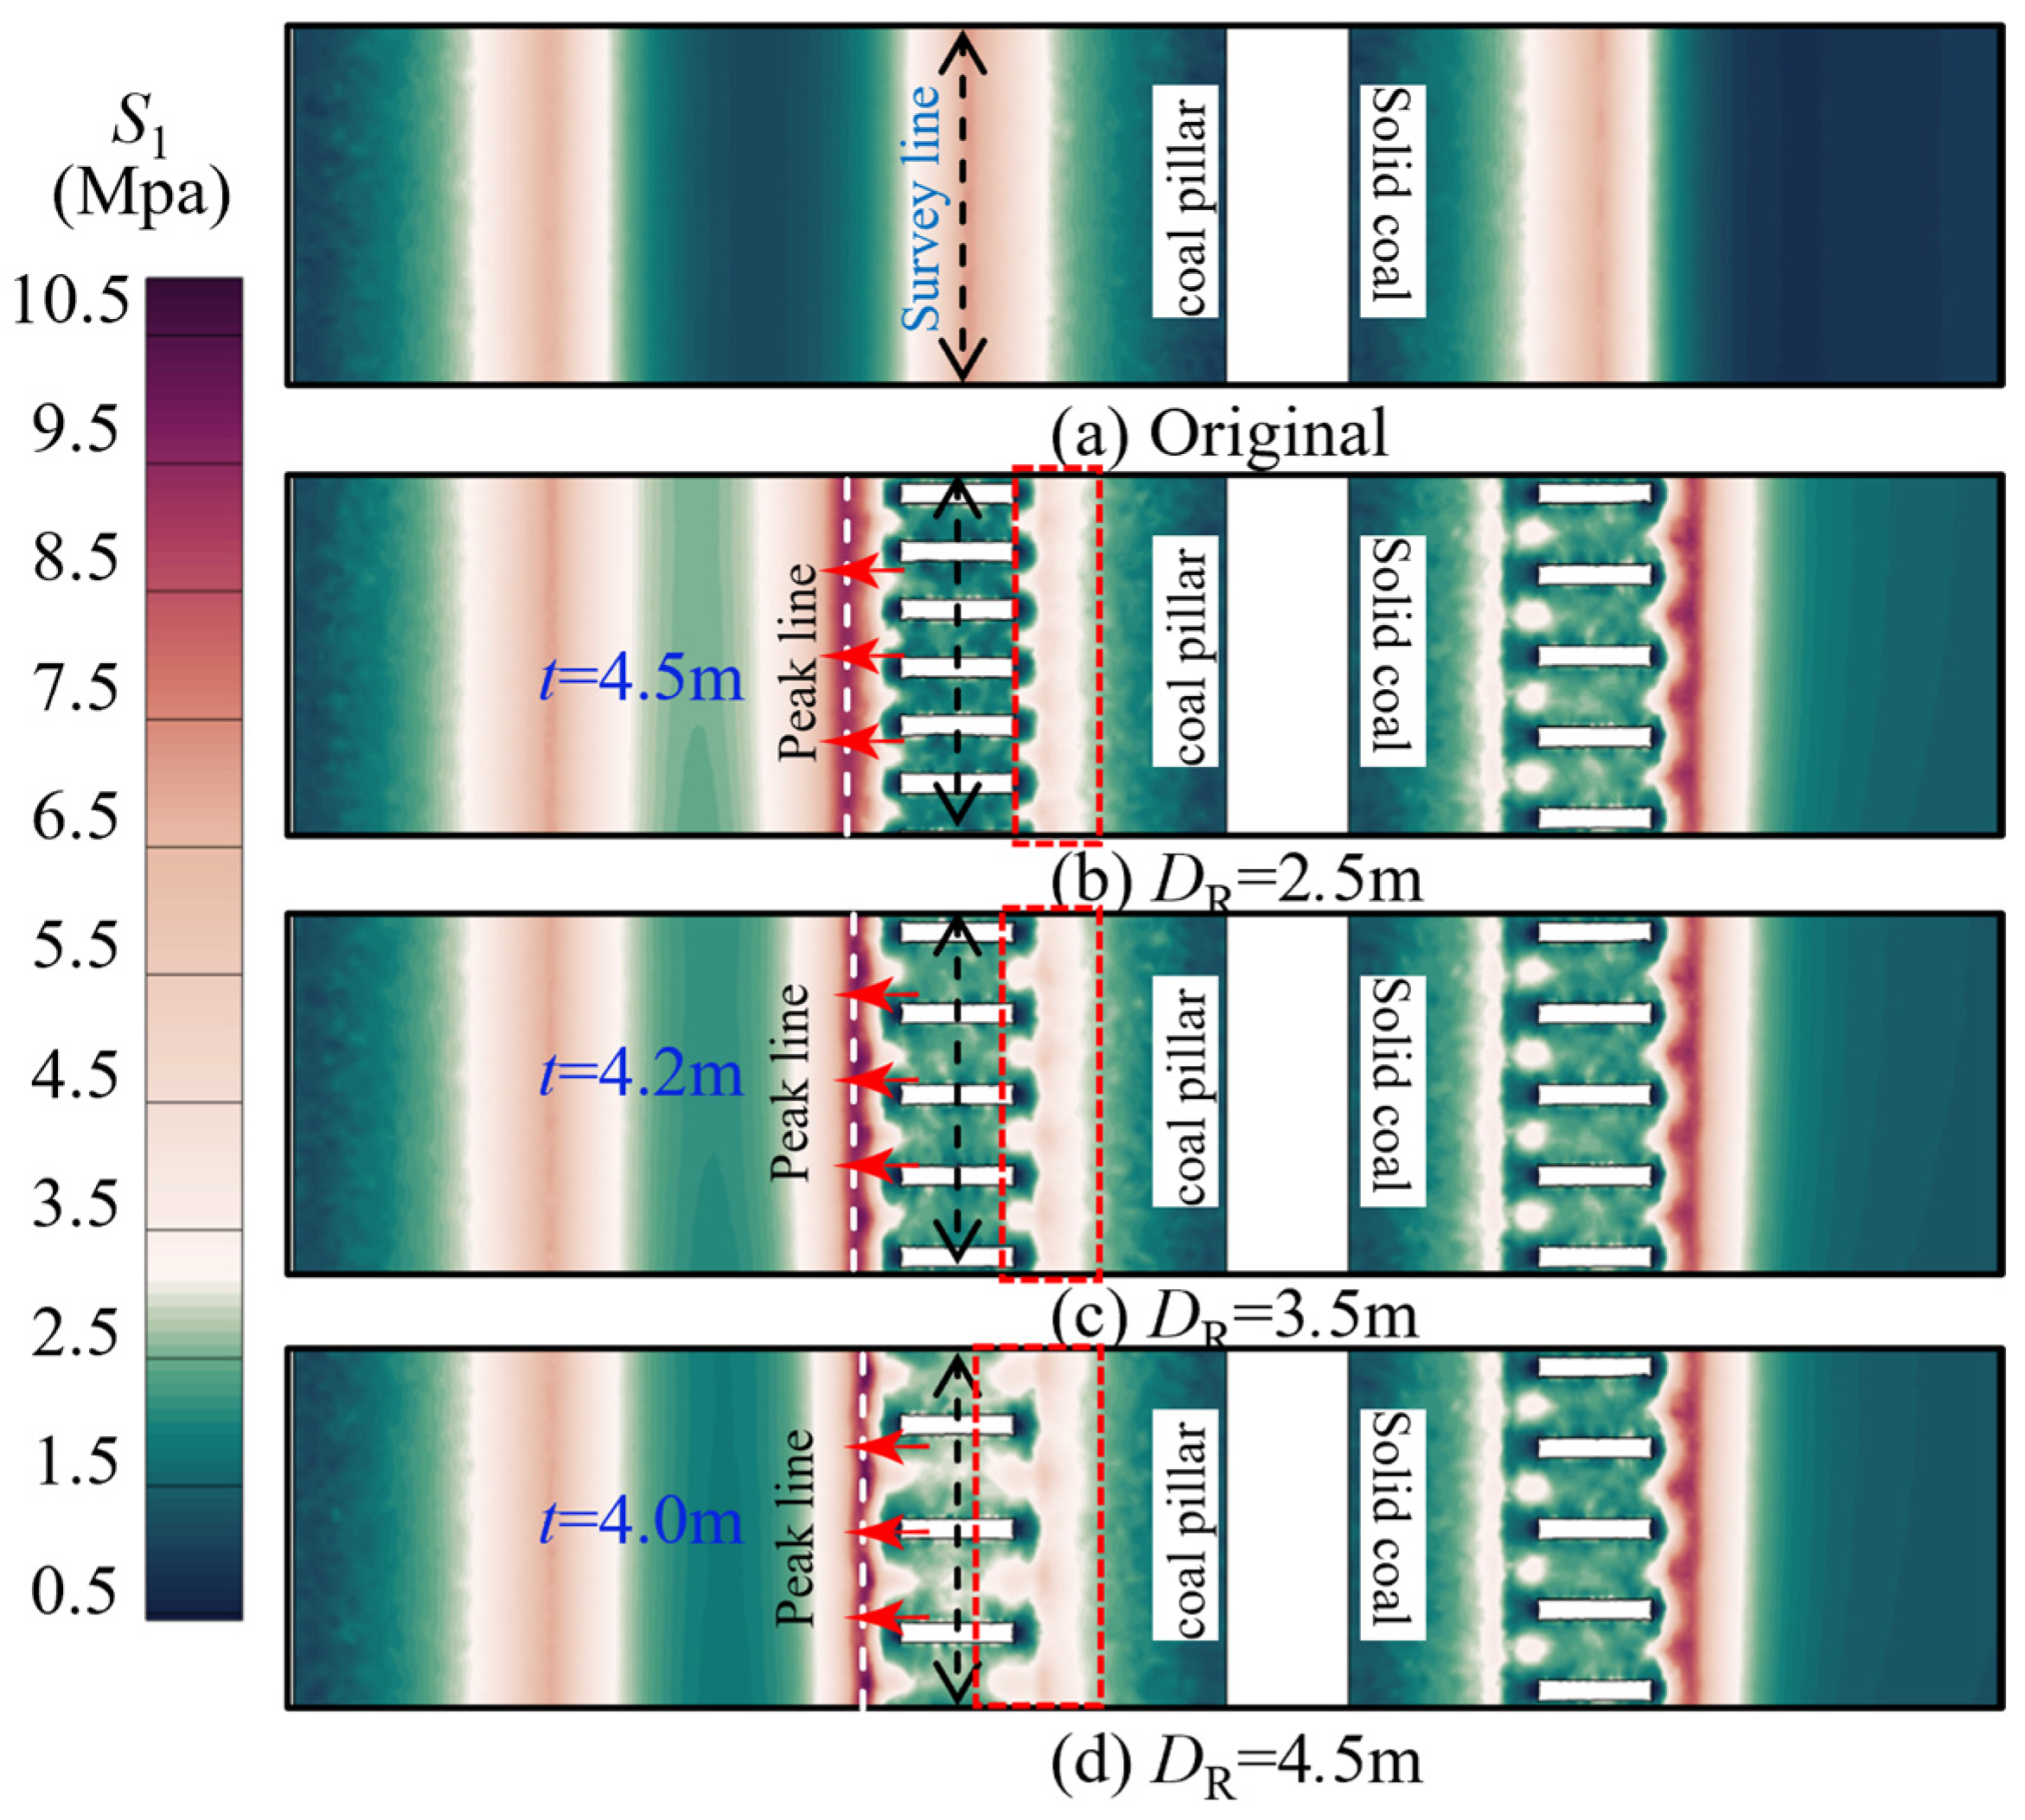
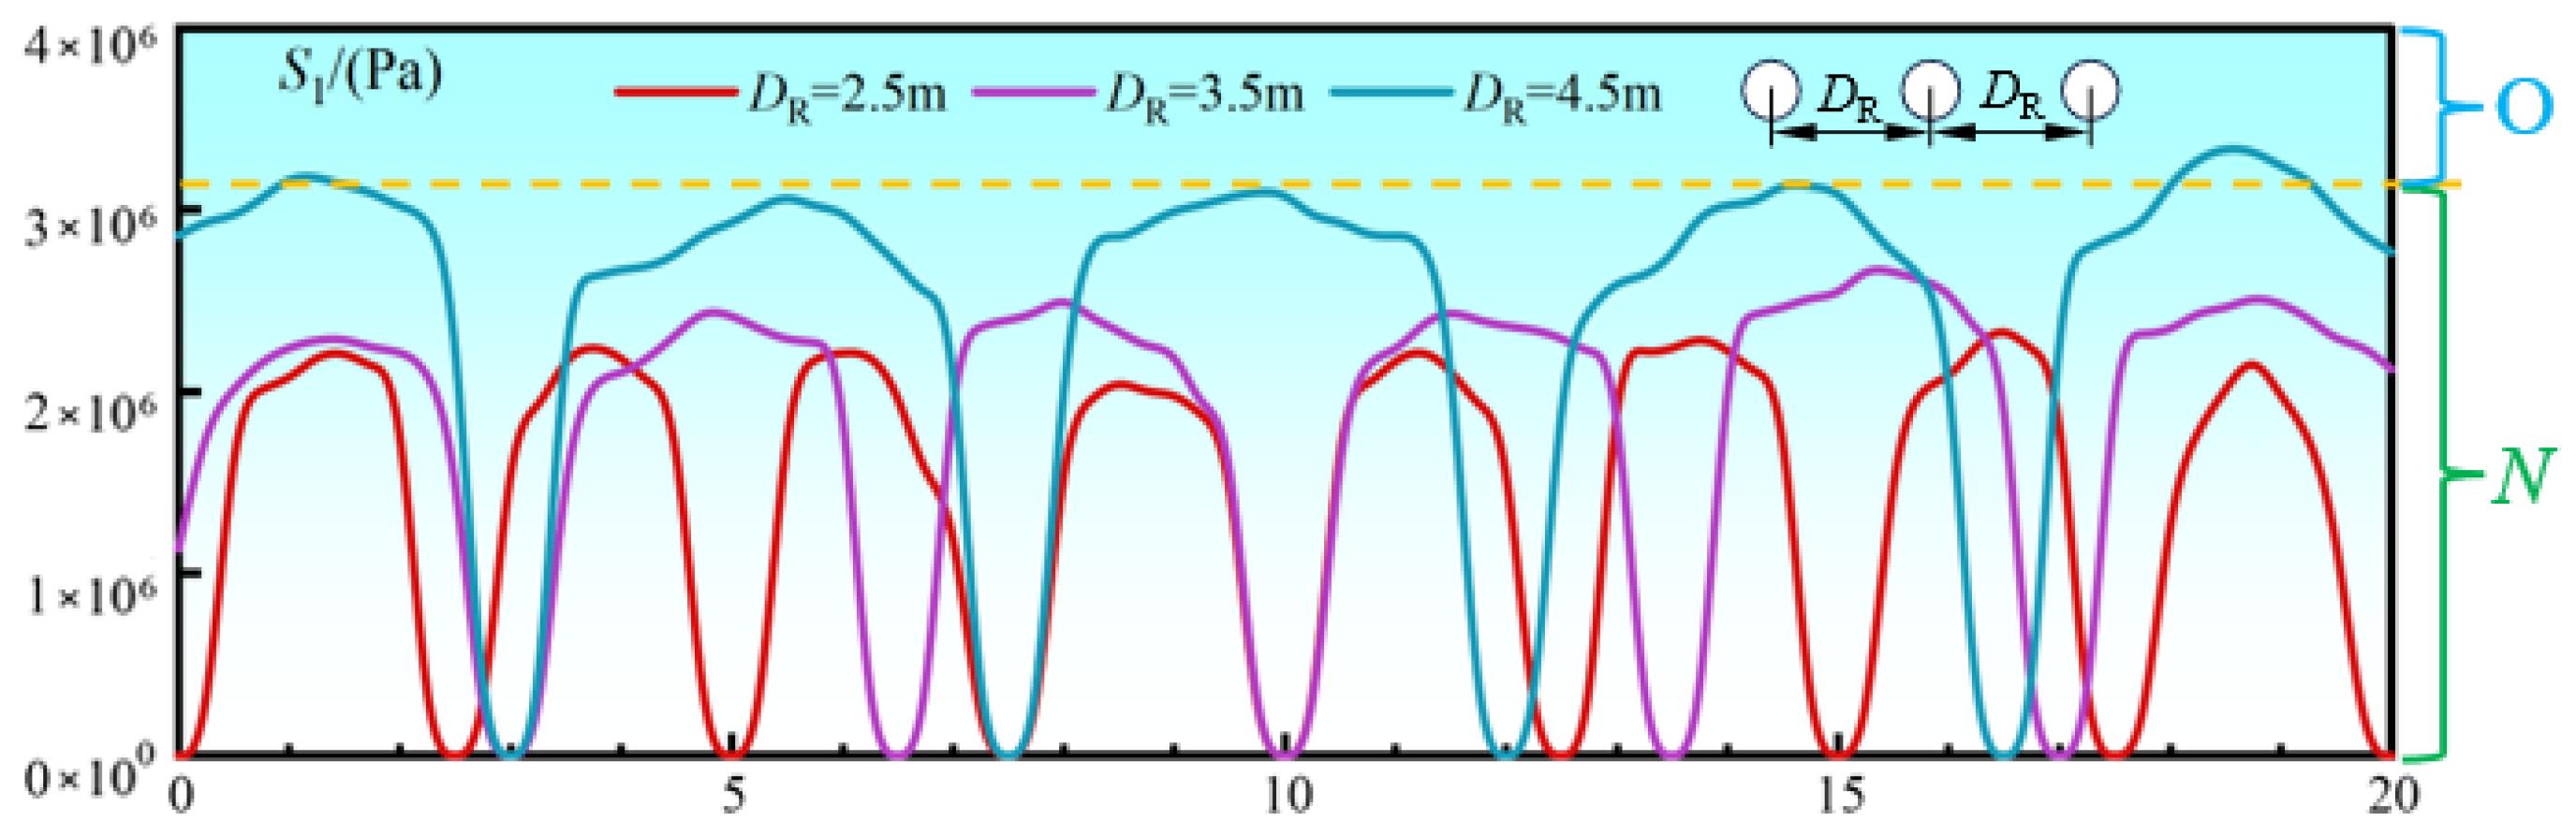
A properly selected cavitation position enables the high-deviatoric-stress peak near the sidewall to migrate toward the deep zone without affecting the shallow stress level, while an appropriate increase in cavitation length enlarges the weak structural buffer zone and enhances its capacity to accommodate deformation and dynamic stress waves. Based on the rational determination of the cavitation position and cavity length, reducing the cavitation spacing contributes to a more sufficient release of high deviatoric stress. Therefore, after determining the cavitation spacing for the solid-coal side, its influence on the stress distribution of the coal-pillar side was further analyzed, as illustrated in Figure 10 and Figure 11.
After roadway excavation, two deviatoric-stress peak lines are formed within the coal pillar. A measurement line was arranged along the peak line closest to the sidewall to analyze the deviatoric-stress distribution under different cavitation spacings. The results show that the outward migration of the peak line decreases progressively as the cavitation spacing increases. When the spacing increases from 2.5 m to 4.5 m, the migration distance t of the stress peak decreases from 4.5 m to 4.2 m and 4.0 m, indicating that smaller spacing induces more pronounced deep-zone peak migration and stronger pressure-relief performance. Along the roadway axis, the deviatoric-stress peaks between adjacent cavities typically appear near the mid-distance between two holes, and their magnitudes rise with increasing spacing, accompanied by changes in stress-distribution patterns and influence range.
Detailed analysis shows that when the cavitation spacing is 2.5 m or 3.5 m, the peak deviatoric stress along the measurement line remains below 2.38 MPa, falling within the previously defined “no-relief zone,” which indicates that the inter-cavity rock mass has been fully relieved. In particular, a spacing of 3.5 m maintains shallow stability while achieving sustained weakening and stable energy absorption. When the spacing increases to 4.5 m, the inter-cavity peak rises to 3.3 MPa, entering the “optional-relief zone,” indicating only partial stress release. If the residual high stress between cavities is not sufficiently weakened, new concentration zones may form; therefore, the inter-cavity region must fall within the full-relief range to ensure continuous stress transfer and adequate energy dissipation.
Considering the deviatoric-stress distribution, evolution patterns, and surrounding-rock response, and in view of the geological conditions of the test roadway, the optimal cavitation parameters for deep roadway sidewalls are determined as: cavitation depth Ld = 9 m, cavitation length Ld = 9 m, and spacing DR = 3.5 m.

3.4. Evaluation of Pressure-Relief Effect Under Dynamic Conditions

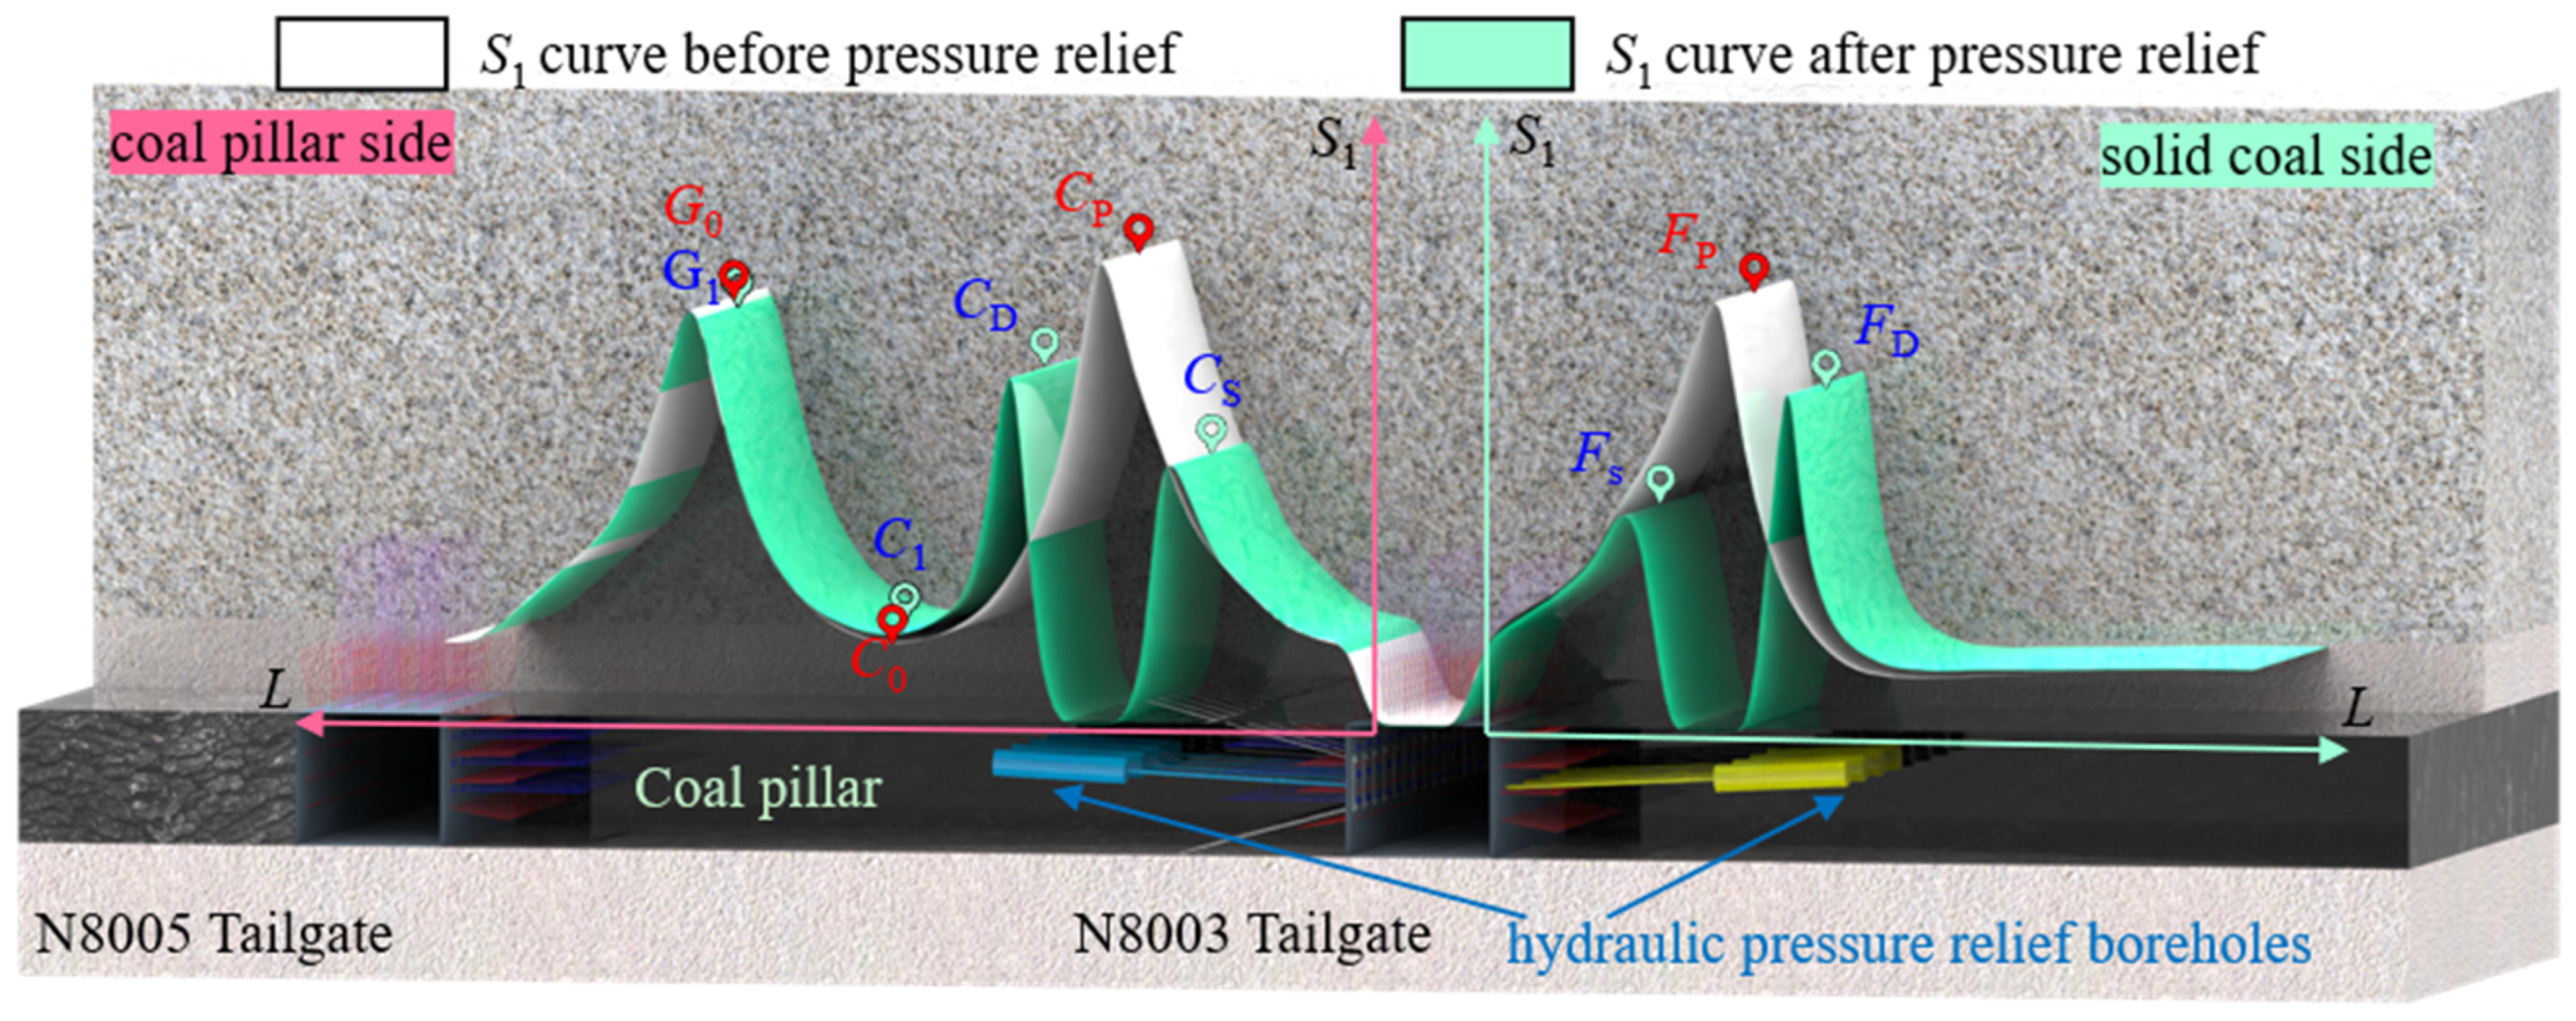
Under static loading conditions, the spatial distribution of the maximum principal deviatoric stress and the corresponding pressure-relief effect were analyzed based on the optimal cavitation parameters. Building on this basis, the deviatoric-stress distribution under dynamic loading was further extended into a multi-feature-point analytical framework, with key feature points defined in Figure 12. The specific meanings are described as follows.
Before pressure relief, peak points CP and FP correspond respectively to the maximum principal deviatoric-stress concentrations on the coal-pillar side and the solid-coal side under dynamic loading. After pressure relief, peak points CD and FD indicate the migration of the stress peaks toward the deep zone, whereas shallow-zone peaks CS and FS characterize the deviatoric-stress level in the shallow sidewall region, serving to evaluate the degree of dynamic-loading influence on the shallow surrounding rock. Valley points C0 and C1, located in the middle of the sectional coal pillar, represent the deviatoric-stress levels before and after pressure relief and reflect changes in the overall pillar stability. In addition, peak points G1 and G0 in the upper tailgate section characterize the evolution of stress concentration during the mining process. By integrating the spatial migration and stress variation of all feature points, the effects of pressure relief on peak-stress attenuation, deep-zone migration, and coal-pillar stability can be clearly revealed.
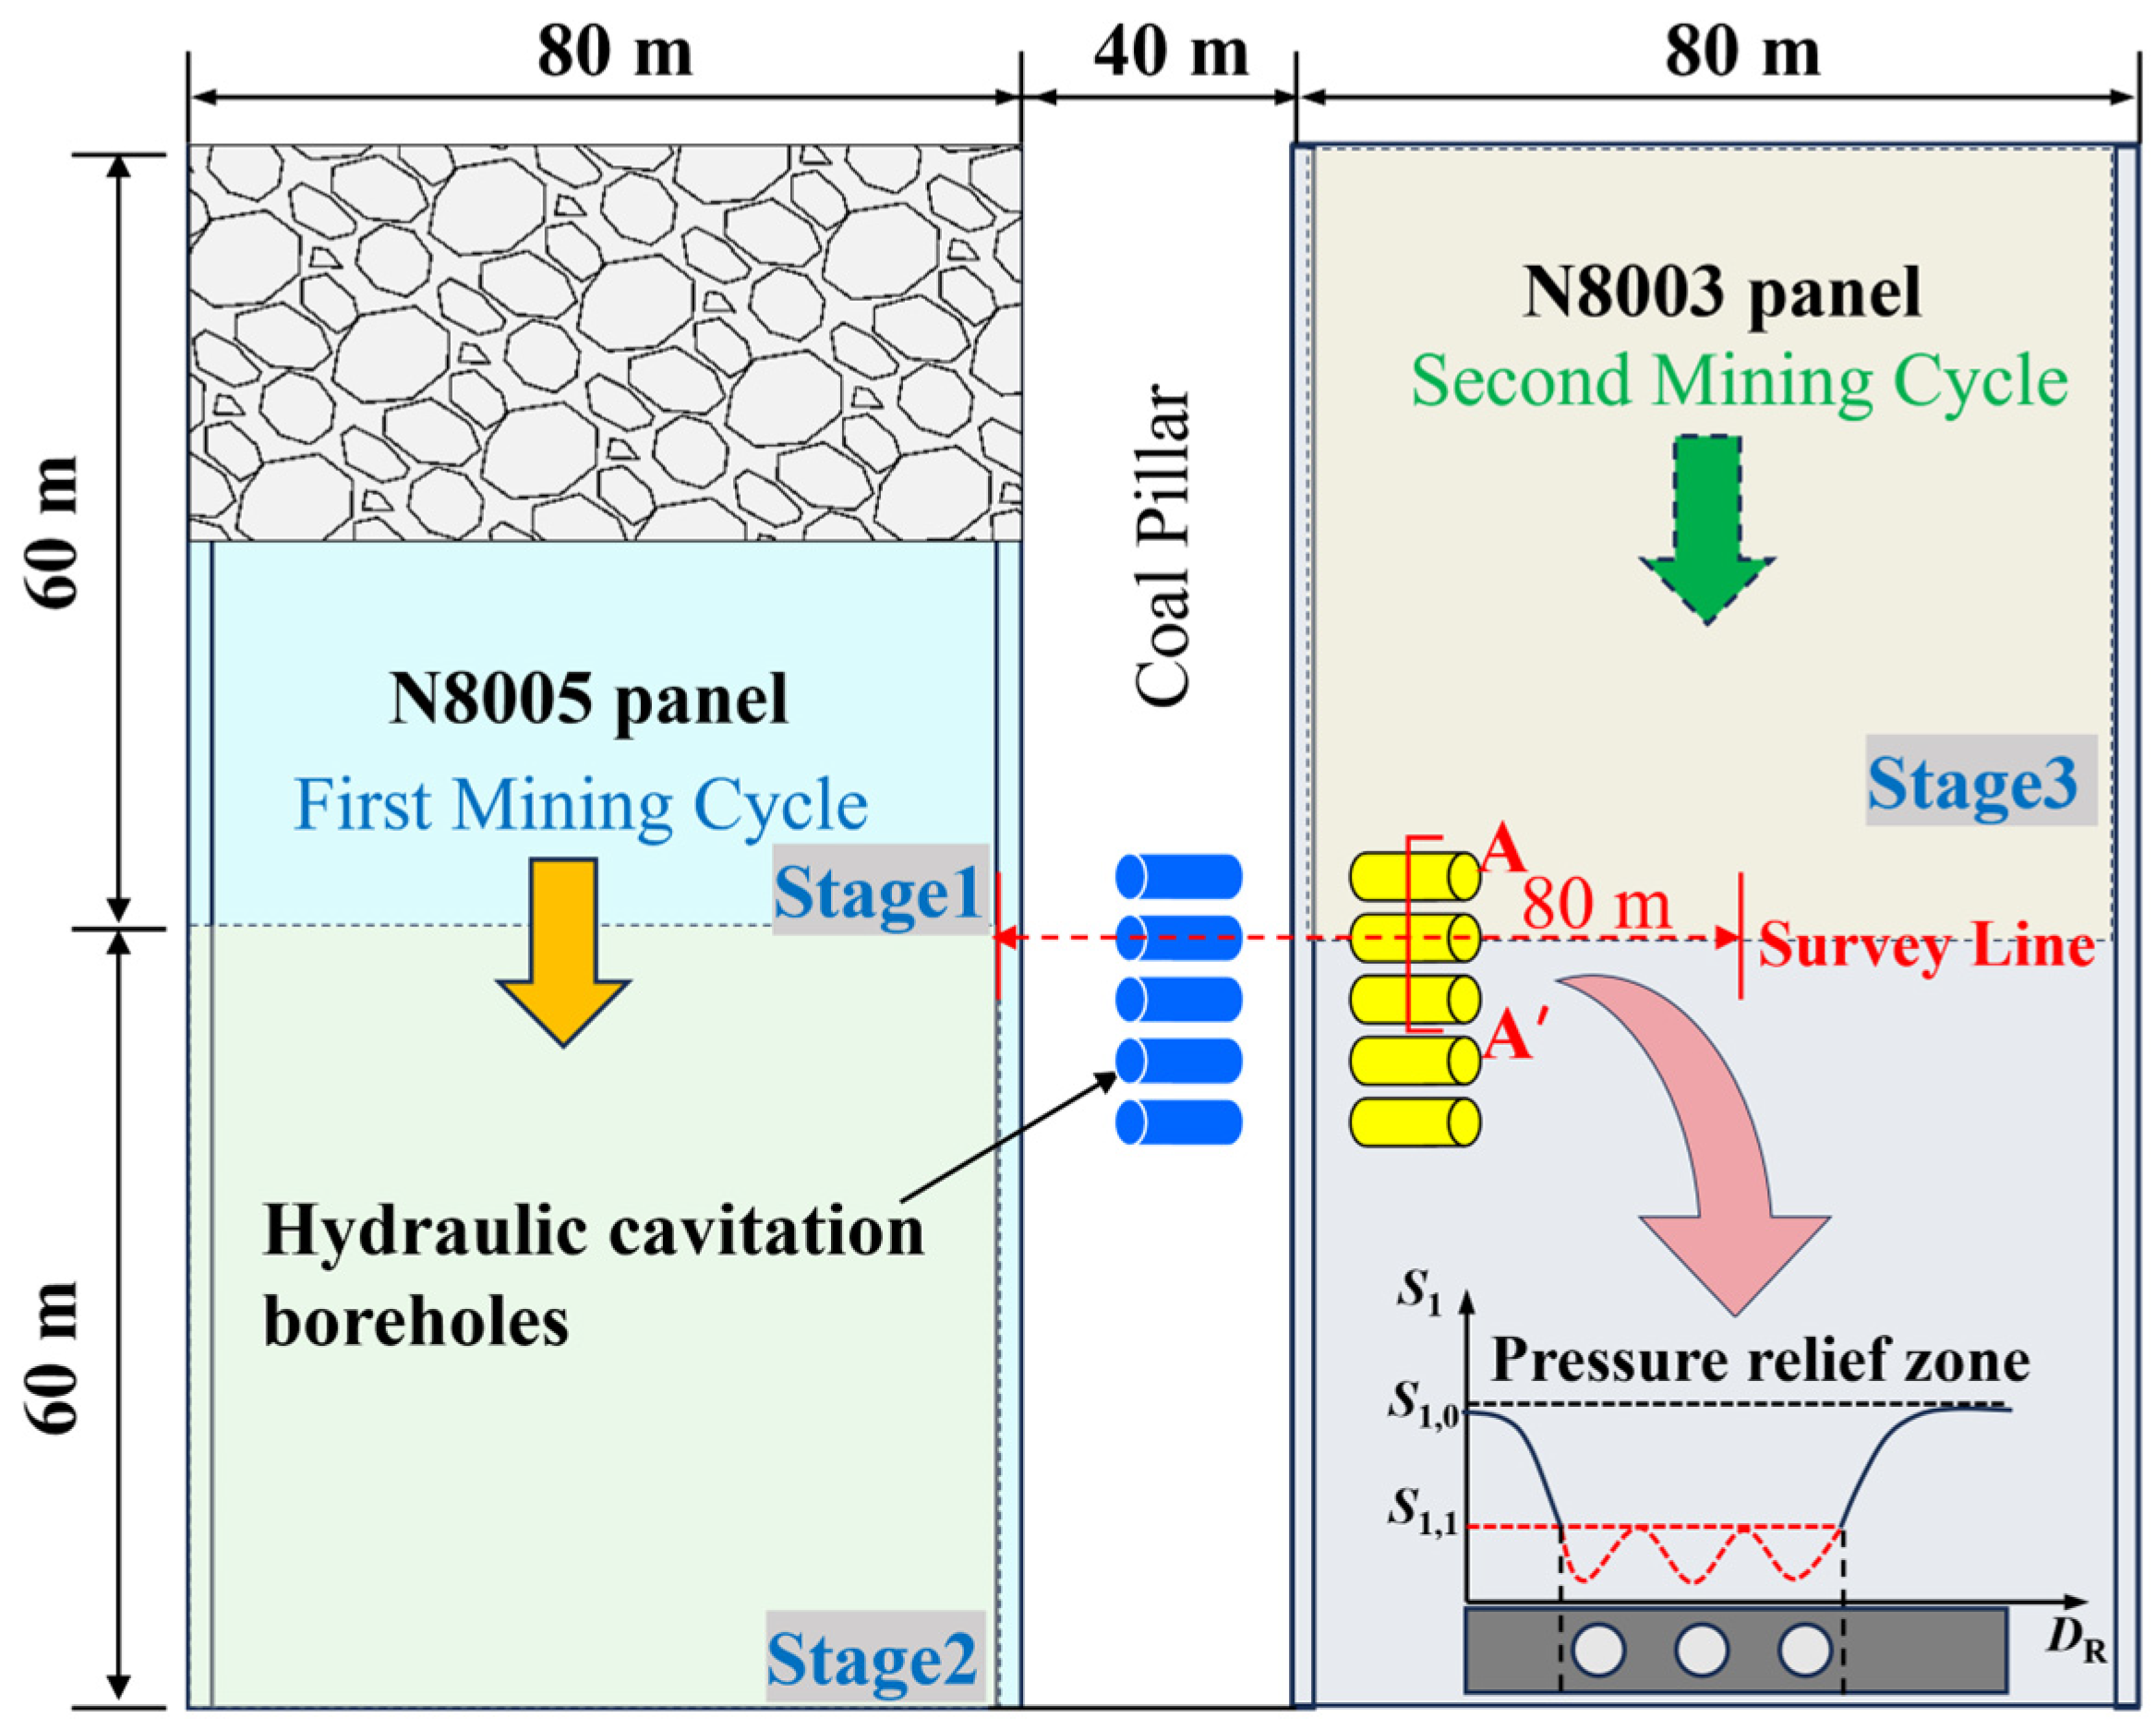
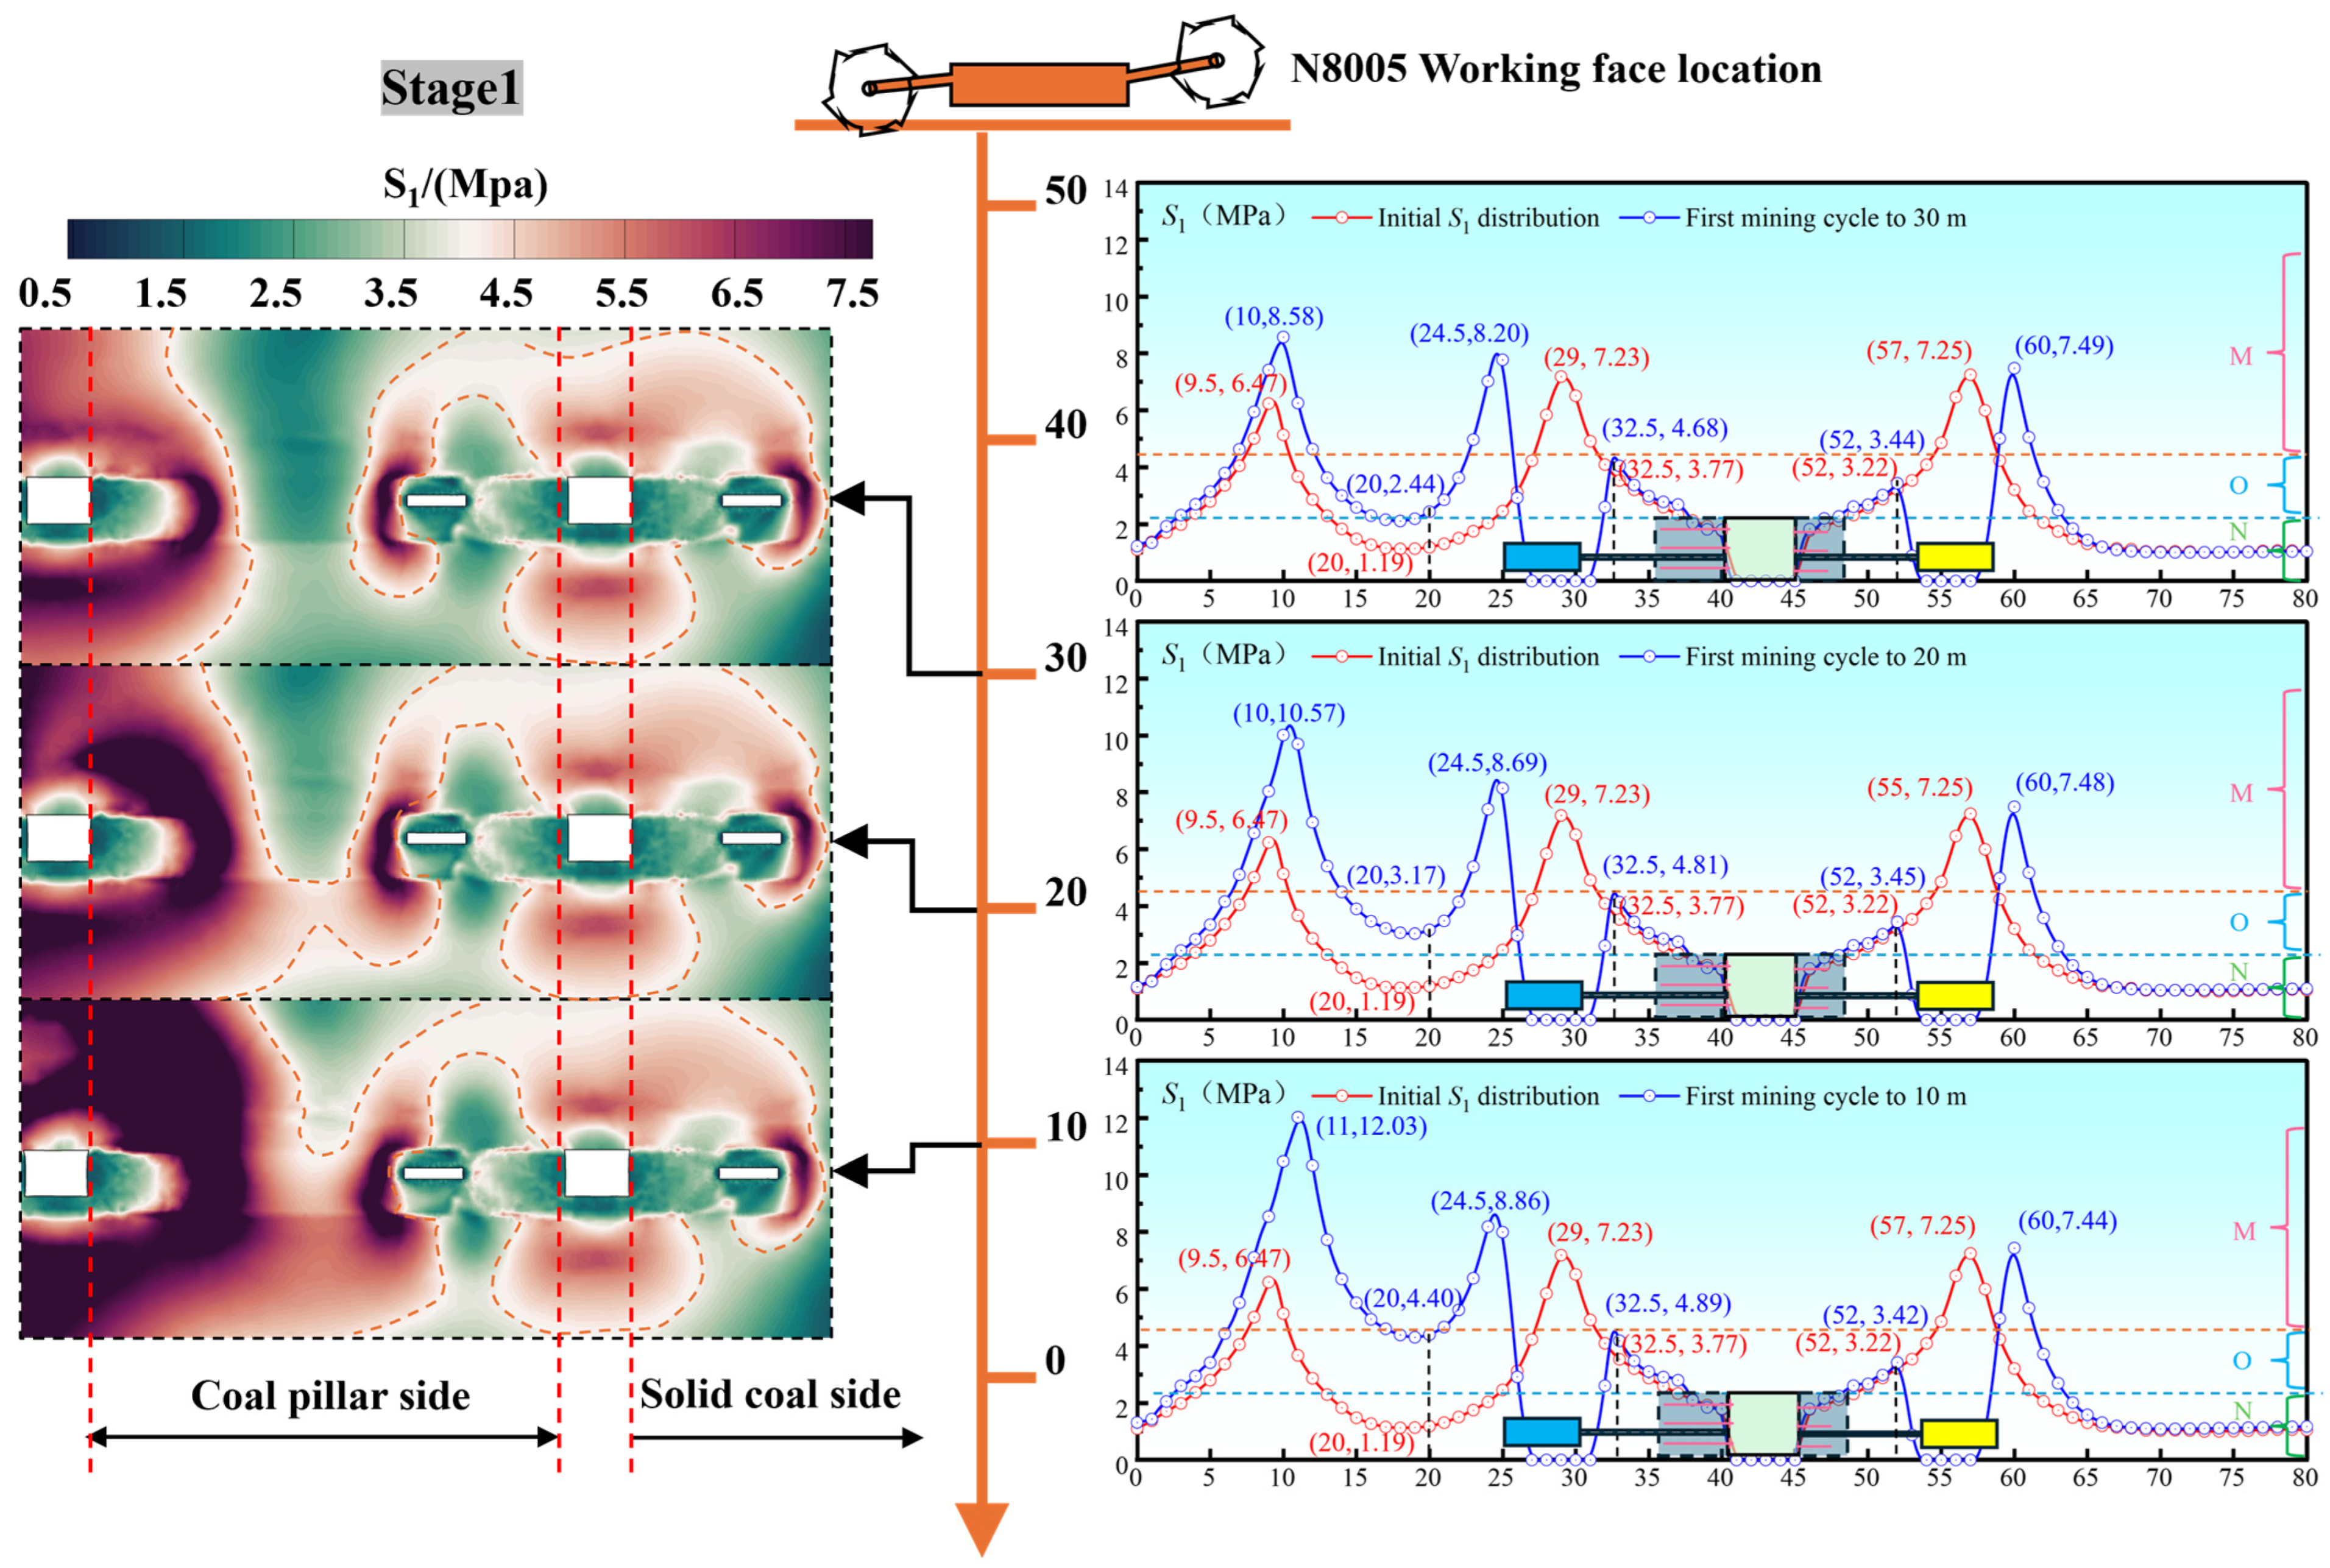
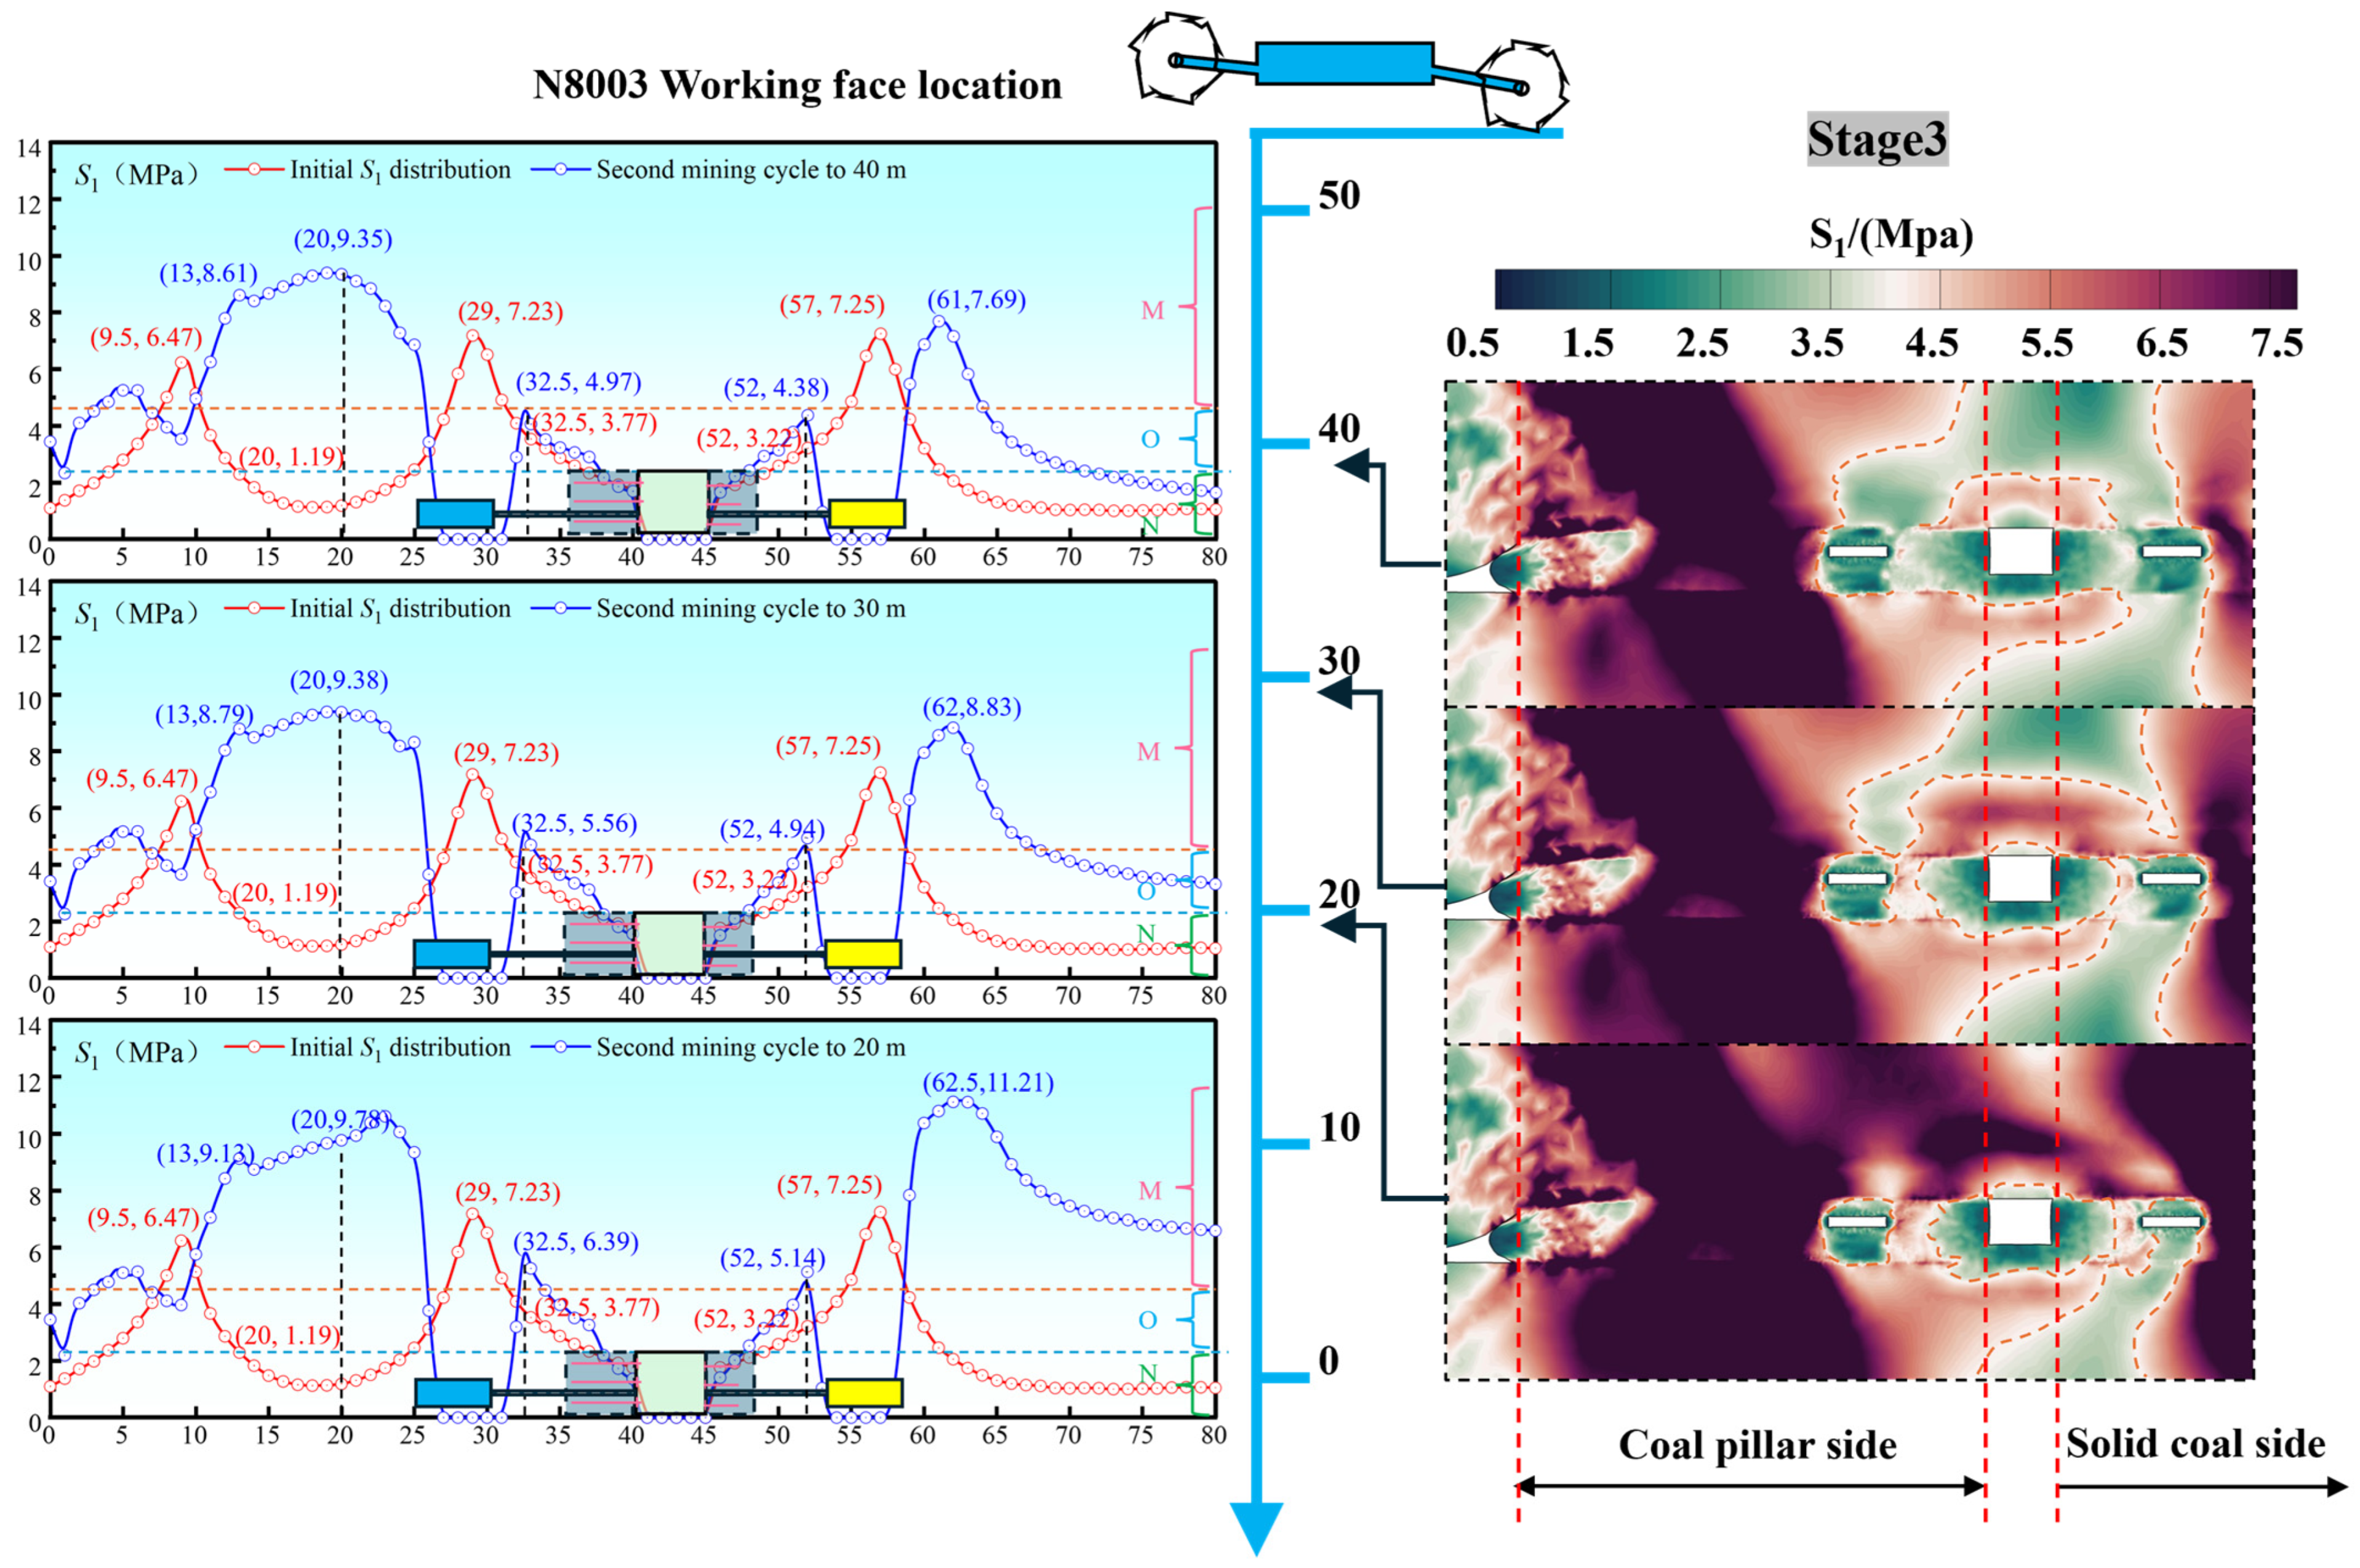
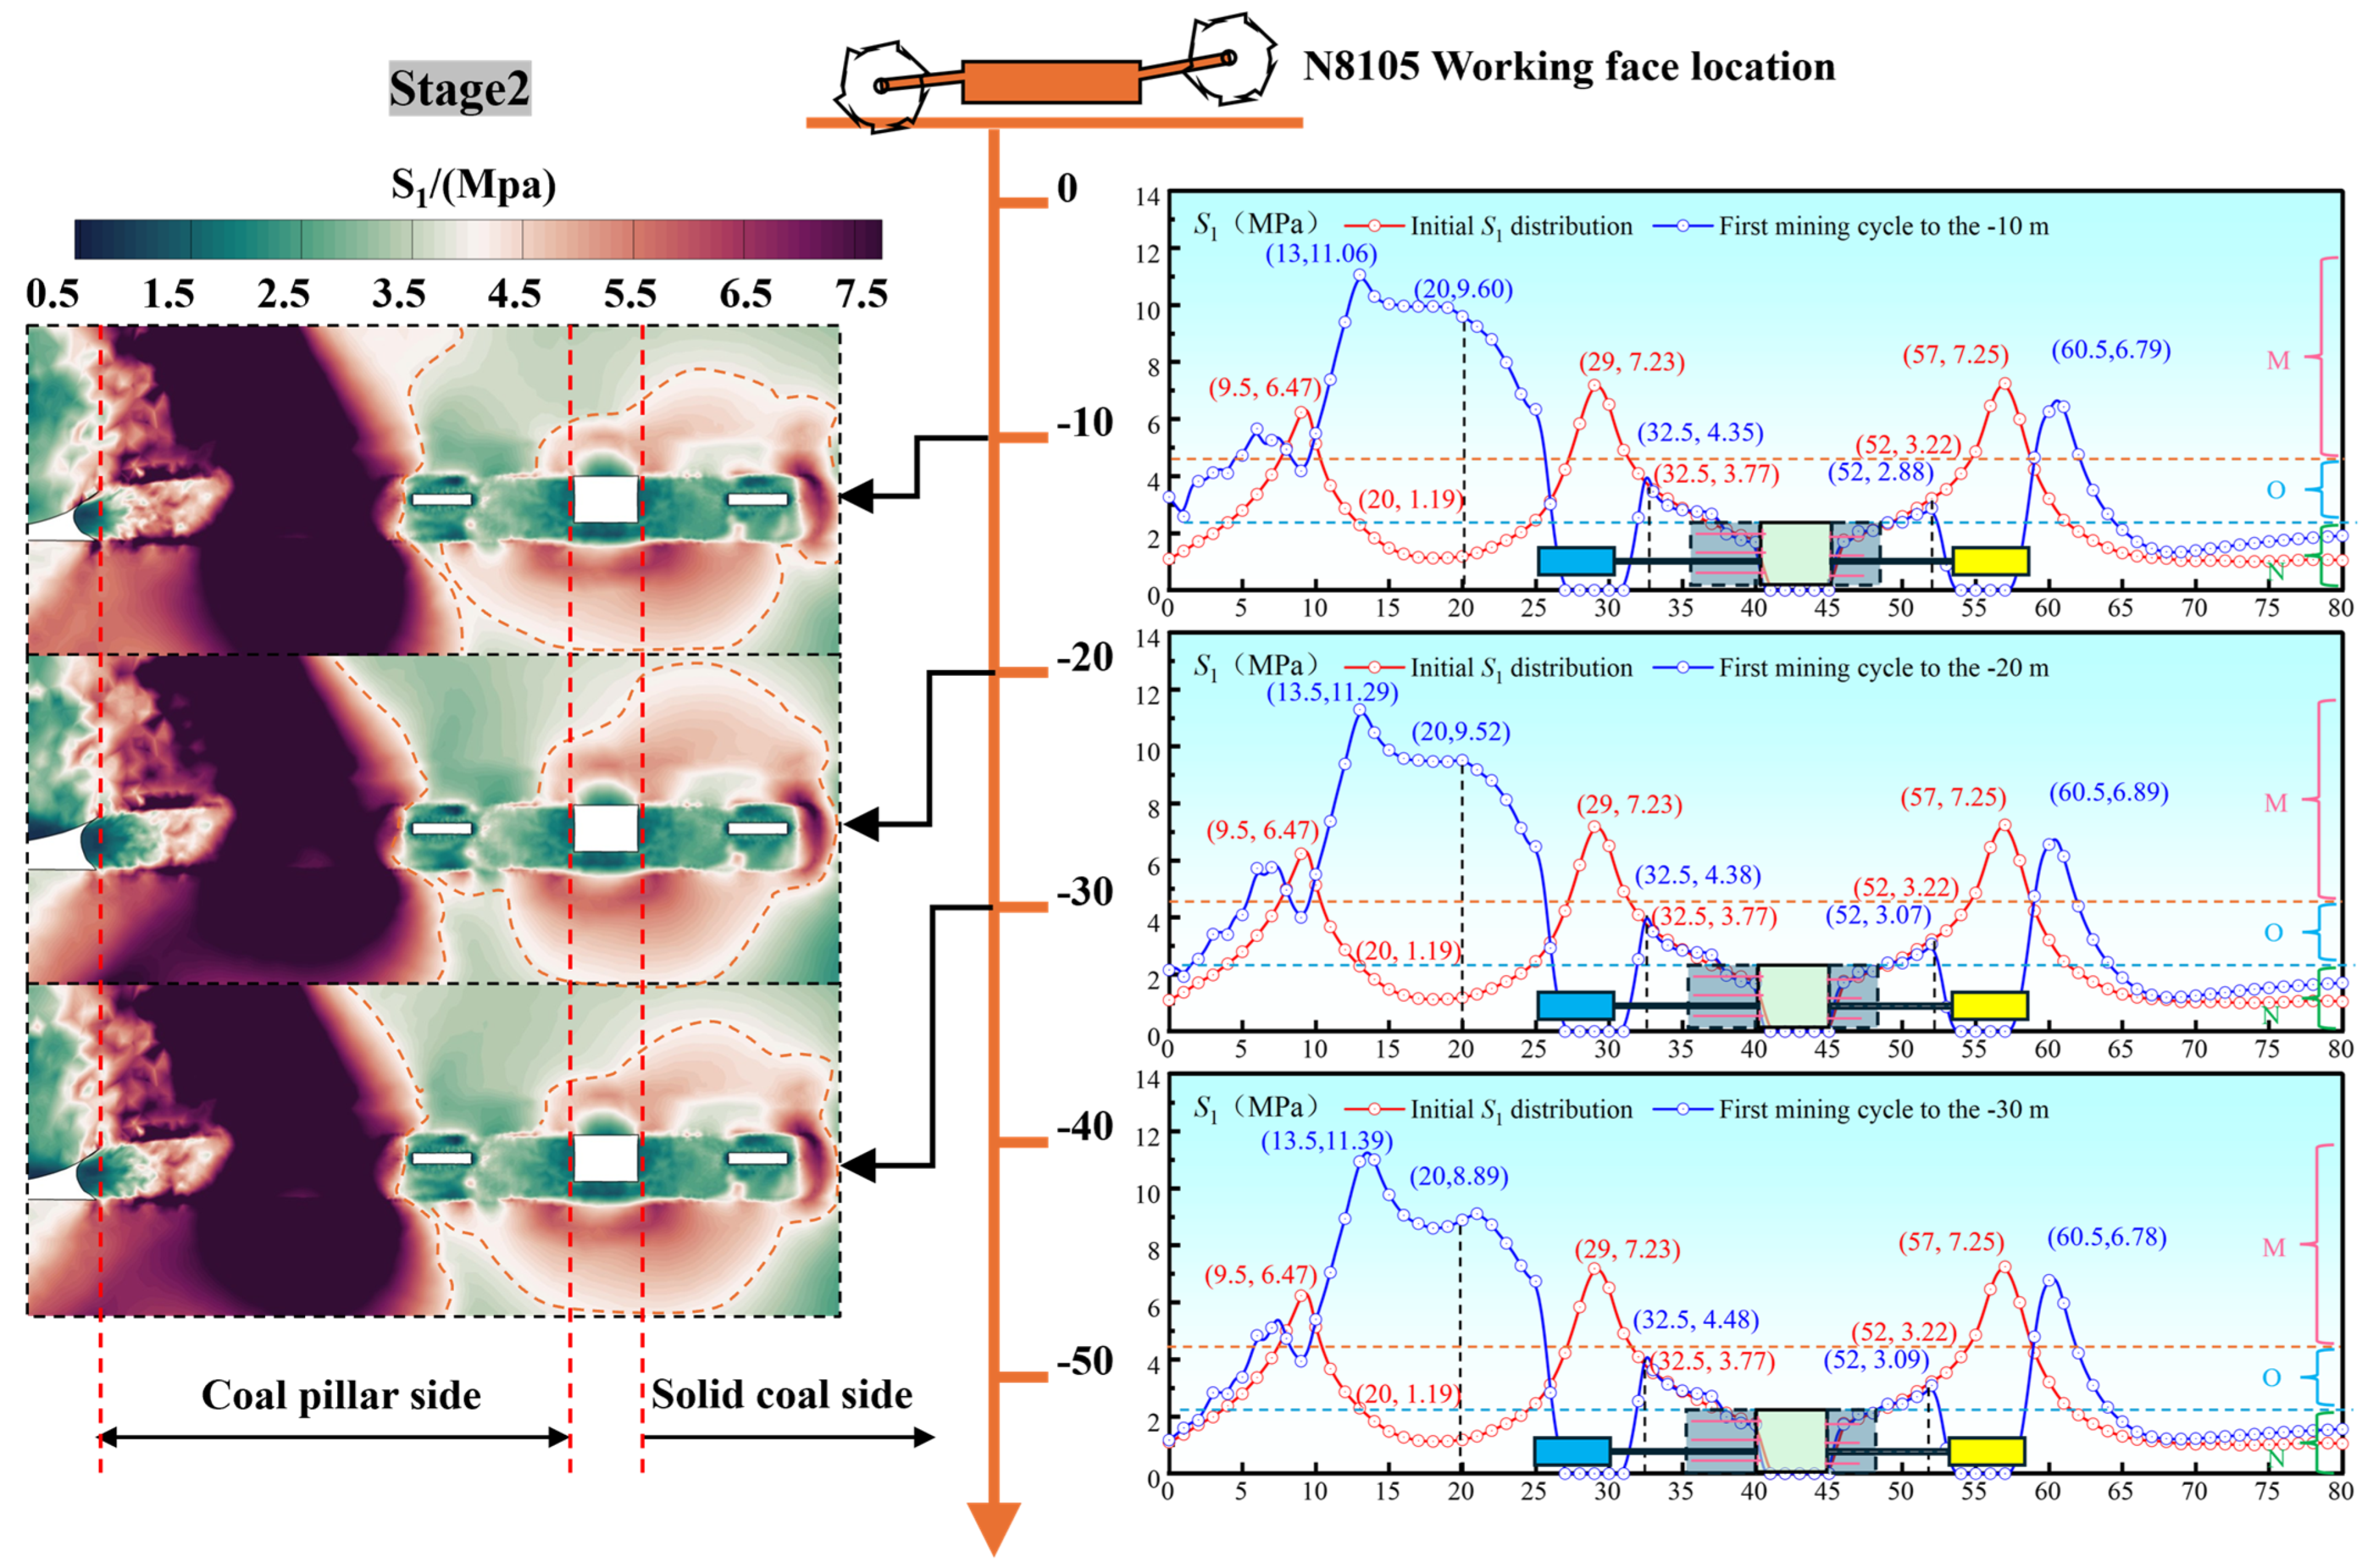
Figure 13 presents a schematic plan view of the mining model. A representative borehole was selected, along which an 80 m measurement line was arranged in the x-direction to monitor the evolution of the maximum deviatoric stress during the mining process. The test roadway was influenced successively by two working faces, and based on the measurement-line position and stress characteristics, the mining-induced loading process was divided into three stages (Stages 1–3). Under identical stress conditions, the spatial morphology of the plastic zone in the surrounding rock corresponds closely to the distribution of the maximum principal deviatoric stress. Figure 14, Figure 15 and Figure 16 show the cloud maps of the S1 distribution along the measurement section for each stage, together with the variations in key parameters affected by dynamic loading.
In Figure 13, a planar mining schematic of the numerical model is presented. A representative borehole was selected in the model, and an 80 m monitoring line was arranged along the x direction to track the evolution of the maximum deviatoric stress during the retreat process. The test roadway is affected successively by the extraction of two working faces. According to the position of the monitoring line and the associated stress characteristics, the entire mining process is divided into three stages (1–3). Under identical stress conditions, the spatial pattern of the plastic zone in the surrounding rock corresponds closely to the distribution of the maximum principal deviatoric stress. Figure 14, Figure 15 and Figure 16 show the S1 distribution contours along the monitoring section for each stage, together with the key parameter variations under dynamic loading.
In Stage 1 (30 m → 20 m → 10 m), the dynamic influence of the upper working face begins to emerge. As the working face approaches, the deviatoric stresses at the coal-pillar feature points generally increase. The locations of peak points CD and CS remain essentially unchanged, while the CD peak increases from 8.20 MPa to 8.86 MPa. Peak point G1 migrates inward toward the pillar center by approximately 1 m, increasing from 8.58 MPa to 12.03 MPa, representing an amplification of about 40.2%. Meanwhile, the internal peak deviatoric stress rises from 2.44 MPa to 4.40 MPa, about 1.8 times the original value, indicating that dynamic loading significantly alters the coal-pillar internal stress distribution. In contrast, the solid-coal side is less affected by dynamic loading, with only minor fluctuations observed at shallow point FS and deep point FD, and the overall state remains stable.
Dynamic-loading Stage 2 (−10 m → −20 m → −30 m) corresponds to the lagging segment of the upper working face. When the working face advances to −30 m, the roof in the upper section behind the measurement line collapses and rotates, causing point G1 on the coal-pillar side to migrate inward by approximately 4 m relative to its initial position. Meanwhile, the CD peak continues to increase, reaching 11.39 MPa, which represents a 32.7% rise over the initial value. With the superposition of mining-induced stress and the intrinsic load of the coal pillar, the CD and C0 values gradually converge, and the distinct CD peak becomes less recognizable. Thus, C0 is used as the representative point in subsequent analyses. During this stage, the deviatoric stress in the pillar’s mid-region remains high, placing it within the high-stress zone (M zone). As the goaf gradually compacts and assumes part of the load, the C0 value decreases slightly. The shallow-sidewall peaks CS and FS both increase, although CS becomes slightly lower than in Stage 1 and FS remains lower than its initial level. The stress cloud maps further indicate that the cavitation cavities effectively impede stress transfer from the coal pillar to the roadway, demonstrating that the unloading structure continues to provide buffering effects during the lagging period. Stage 3 (40 m → 30 m → 20 m) lies within the advanced influence zone of the second mining cycle. Dynamic loading intensifies sharply, and the surrounding rock undergoes renewed strong disturbances, resulting in significant changes in both the stress structure and the unloading performance. As the working face advances, mining-induced stresses strengthen markedly and superimpose with the initial in situ stress, causing pronounced changes on both the coal-pillar and solid-coal sides. The C0 value rises to 9.78 MPa, while G1 shifts outward toward the goaf by 0.5 m. When the working face approaches 30 m, the shallow-sidewall peaks CS and FS enter the “must-relief zone,” and at 20 m, CS increases to 6.39 MPa (69.5% above the initial value) and FS to 5.14 MPa (59.7% above the initial value). The deviatoric-stress cloud maps show a progressive contraction of the low-stress ring around the roadway and a pronounced overall elevation in deviatoric stress. The deep peak FD on the solid-coal side continues to migrate 2.5 m deeper and reaches approximately 1.5 times its Stage 1 value at 30 m.
Although the cavitated pressure-relief boreholes modify the stress-transmission path to some extent and reduce the dynamic loading, the elevated deviatoric-stress field remains highly unfavorable for the shallow surrounding rock. When the second-round retreat advances to within approximately 30 m ahead of the roadway, the shallow stress in the peak zone rises sharply, causing severe compaction and damage to the preformed pressure-relief cavities and significantly weakening their regulation capacity. During this stage, ensuring the overall stability of the roadway-surrounding rock becomes critical, and enhancing the strength of advanced support is recommended.
The advance of the working face under multiple dynamic pressures produces clear stage-dependent variations in the stress structure of both roadway sidewalls. The coal-pillar side is subjected to the strongest mining-induced disturbances, characterized by continuously rising stress peaks and the emergence of secondary stress concentrations. In contrast, the solid-coal side experiences weaker dynamic influence due to delayed stress transmission, mainly demonstrating a stable shallow response followed by a lagged increase in stress.
The typical patterns of peak migration, stress evolution, and pressure-relief performance observed on both sidewalls provide a sound basis for optimizing support parameters and controlling dynamic loading. For example, for point G1, t(G1) denotes the migration distance of the peak position; S(G1) represents its maximum principal stress; and R(G1) is the rate of change defined as R(G1) = (S(G1) − S(G0))/S(G0). Following these definitions, the major characteristic points at each stage are statistically extracted and compared. The evolution trends of key parameters across the three dynamic-loading stages are summarized in Table 5.

4. Coordinated Support–Relief Control Technology and Scheme Design

4.1. Concept and Engineering Mechanism of the Coordinated Support–Relief Approach

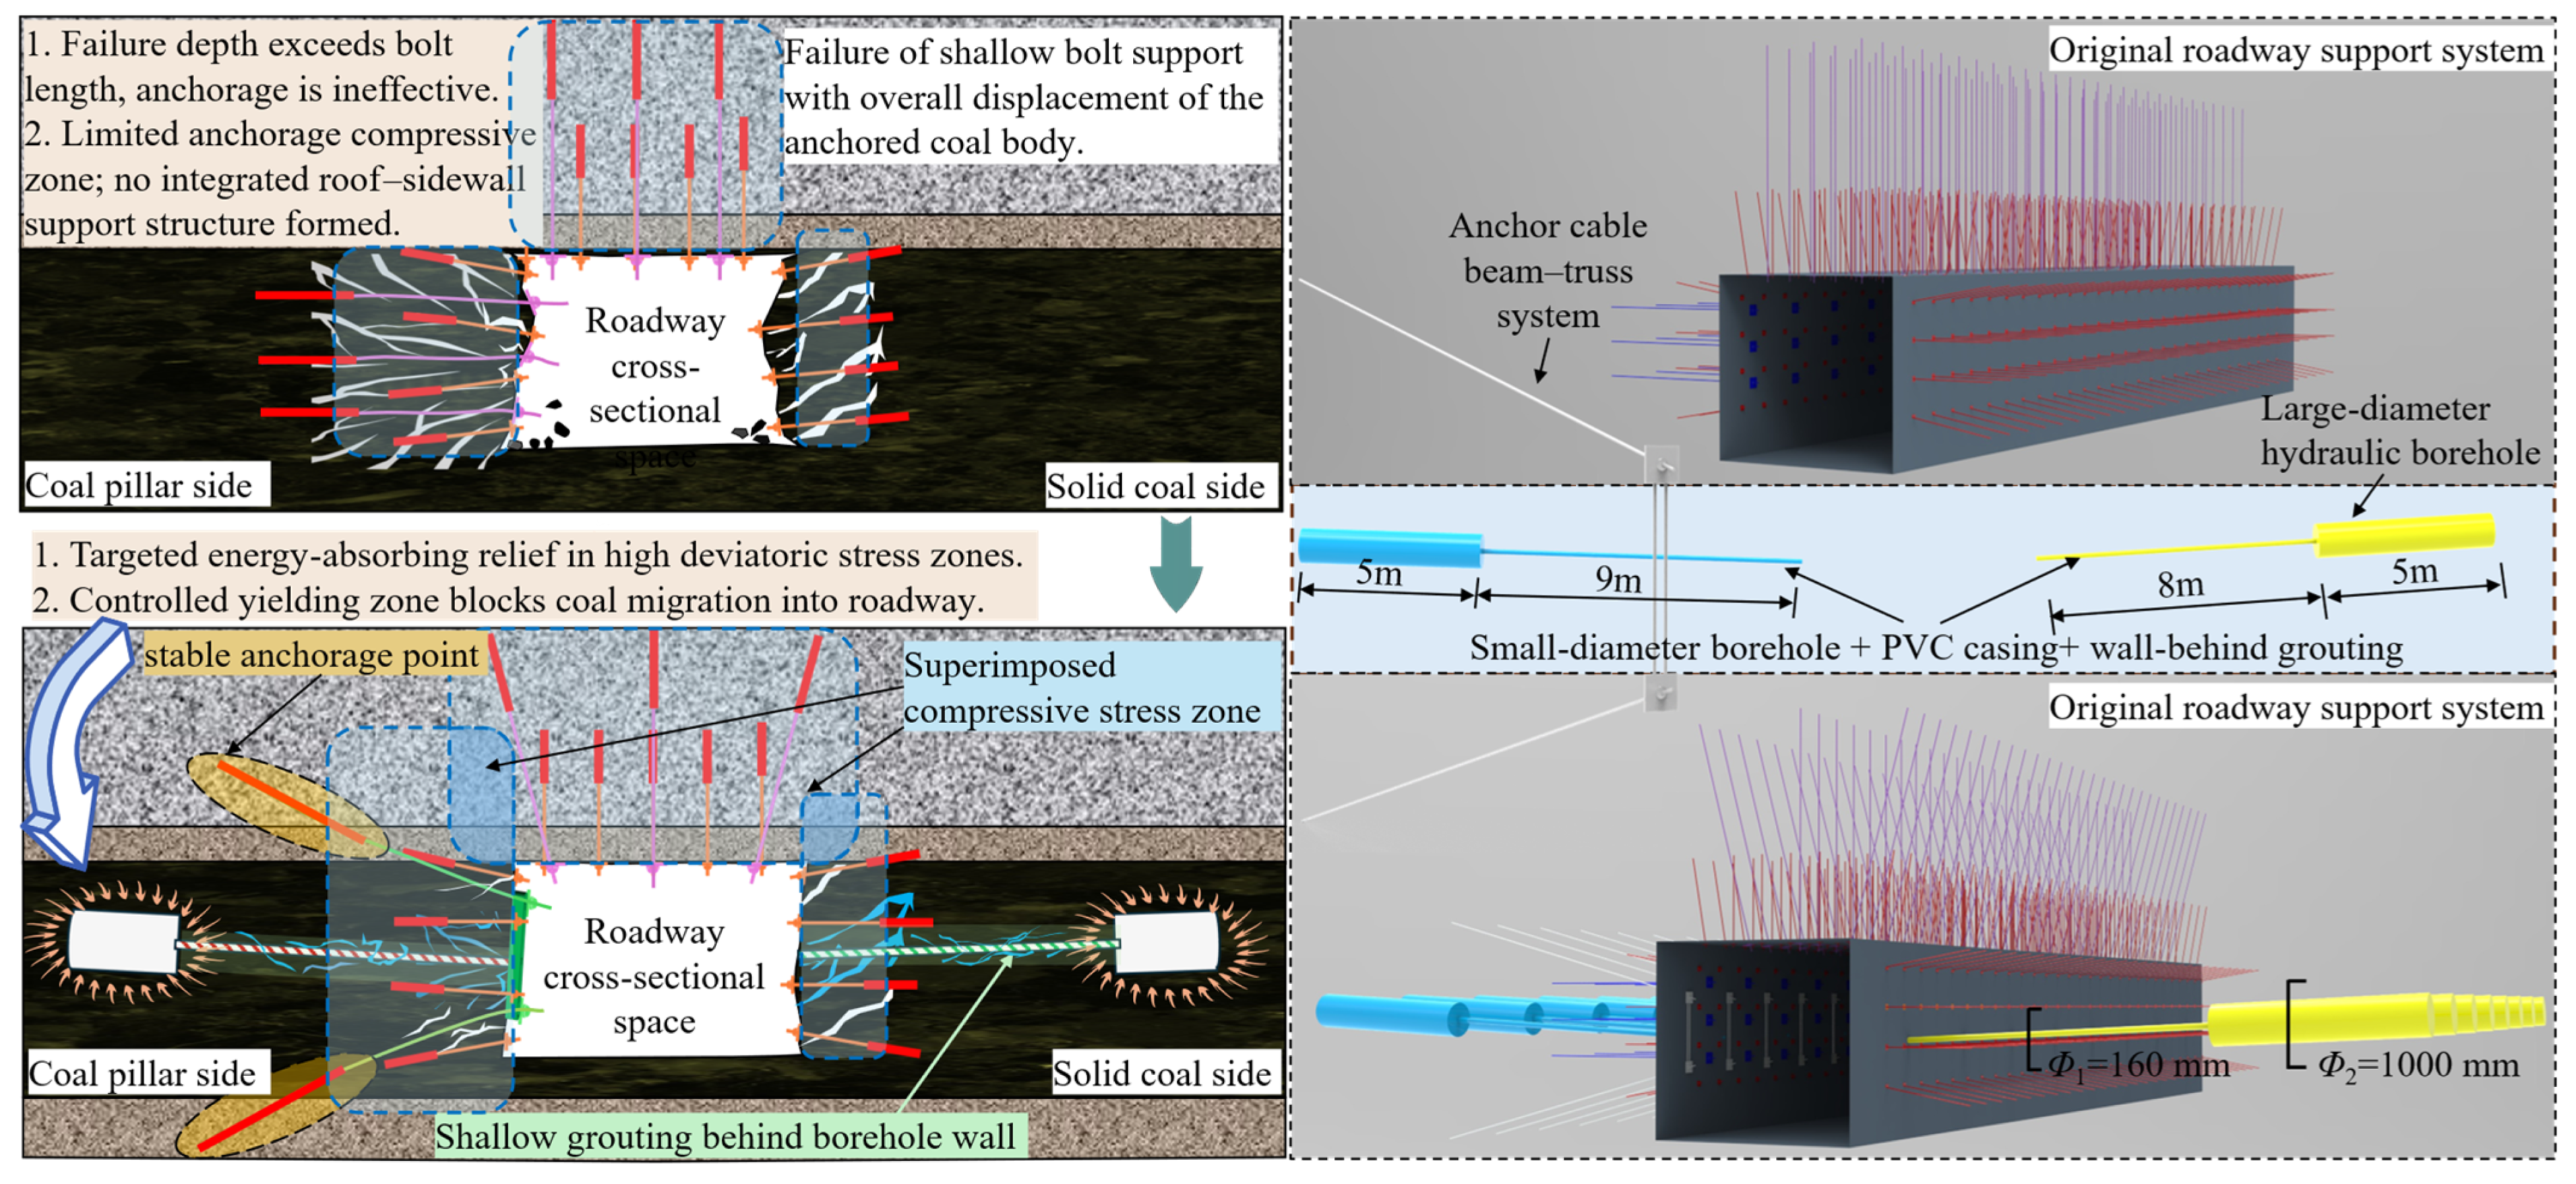
In deep coal roadways, the sidewalls are typically composed of fractured or even broken rock masses, and the extent of fracturing often exceeds the effective anchorage length of rock bolts. Under such conditions, the cohesion of the coal mass is markedly reduced, and the anchorage body primarily bears compressive and shear loads while being unable to sustain tensile forces [33,34,35]. Under the original support system, the fracturing depth of the surrounding rock surpasses the anchorage length, which leads to further propagation of shallow fractures, a reduction in effective anchorage thickness, and inward convergence of both sidewalls under dynamic loading. Because the roof, floor, and sidewalls fail to form a continuous integrated load-bearing structure, a cyclic instability process emerges, characterized by roof bending, sidewall fragmentation and collapse, support weakening, and progressive failure expansion [36,37,38], ultimately resulting in the continuous deterioration of roadway stability.
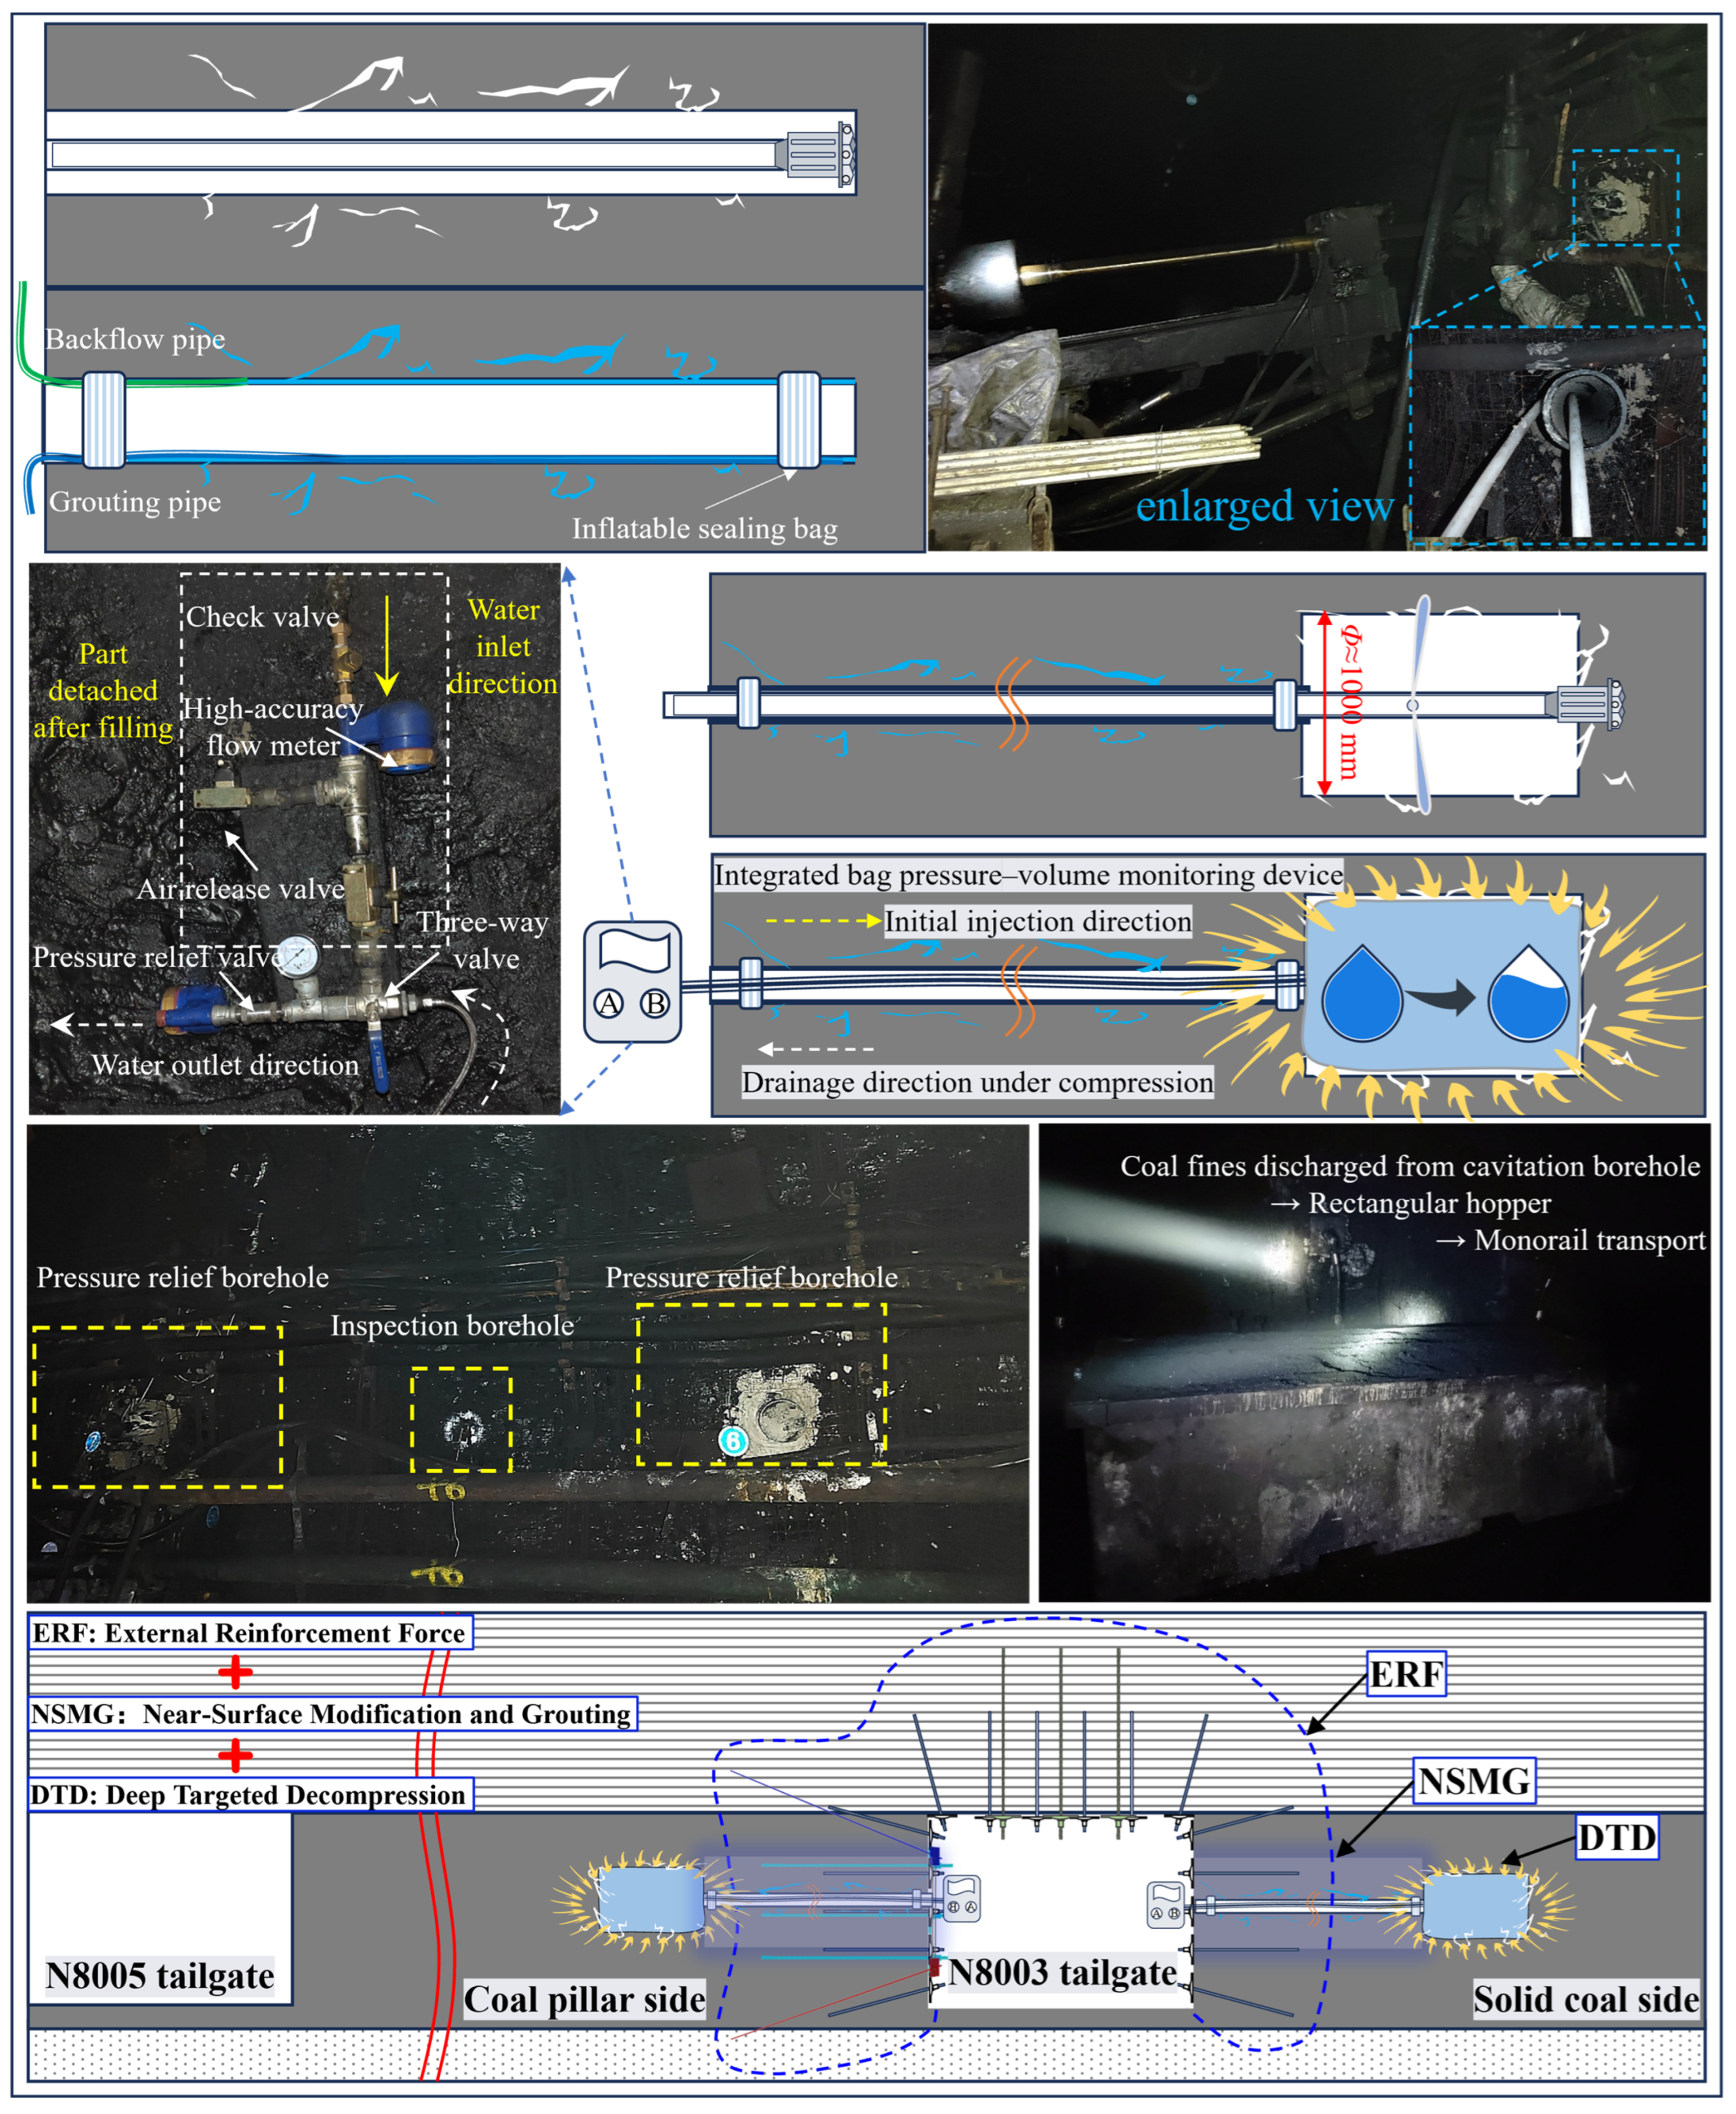
The proposed technology follows the “External Reinforcement Fixation (ERF)—Near-Surface Modification and Grouting (NSMG)—Deep Targeted Destressing (DTD)” concept, as shown in Figure 17, and is designed to meet the layered support requirements of the roadway sidewalls. At shallow depths, no pressure relief is applied. Instead, conventional-diameter boreholes (Φ1 = 160 mm) are used for behind-wall grouting to repair the fractured coal mass, restore the self-supporting capacity of the shallow surrounding rock, and enhance its cohesion and post-peak strength, thereby increasing the effective thickness of the load-bearing anchorage zone. Meanwhile, the roof-corner anchor cables are inclined appropriately to connect the compressive stress zones between the roof and sidewalls, forming an integrated roof–sidewall load-bearing ring.
On the coal-pillar side, a simplified anchor-cable truss system is installed. The 8.3 m anchor cables are anchored into competent rock and prestressed, while paired rebar ladder beams are adopted to diffuse the pretension and enhance surface control and confinement. Unlike the conventional one-size-fits-all approach in which large-diameter pressure-relief boreholes are applied uniformly to both shallow and deep zones, the proposed method places a large-diameter borehole (Φ2 ≈ 1000 mm) precisely within the high-deviatoric-stress band. A high-pressure water-jet cavitation process creates an internal cavity that provides deep energy absorption, stress relief, and controlled deformation, thereby weakening the driving force of deep stress transfer toward the roadway. This realizes a coordinated “external reinforcement anchorage–shallow–middle modification–deep pressure relief” control mechanism.

4.2. Coordinated Support–Relief Control Technology

As shown in Figure 18, the overall structure and process flow of the layered coordinated support–relief control technology consist of external strong anchorage, shallow–middle modification, and deep targeted pressure relief. To address the pronounced asymmetry in loading and deformation between the coal-pillar side and the solid-coal side, coordinated stabilization of the surrounding rock is achieved through a layered control strategy.
At shallow depth, Φ200 mm boreholes are drilled and fitted with Φ160 mm PVC casing, followed by behind-wall grouting using a bag-type sealing device. The grouting material consists of cement slurry (A-solution) and sodium-silicate solution (B-solution), which infiltrate and fill fractures under pressure, thereby repairing the shallow fractured coal mass and improving the integrity of the shallow surrounding rock. After grouting solidification, the clean-water pumping station was pressurized to 15–25 MPa, and backward reaming was carried out at the cavitation position using a hydraulic cavitation drill bit under a water pressure of about 20 MPa, thereby forming a deep targeted pressure-relief cavity with a diameter of approximately 1000 mm inside the coal mass. The cavity size was controlled according to the designed coal output; once the actual coal output reached the design requirement, the reaming operation at the current borehole was stopped and transferred to the next cavitation position. During the pressure-relief process, a bag-type pressure–water volume monitoring device was used to record the water pressure and water volume inside the borehole in real time, so as to quantify the cavity volume and the evolution characteristics of surrounding rock deformation. The coal fines generated during reaming were collected by a rectangular hopper and transported out of the roadway by a monorail crane.

5. Observation and Analysis of the Coordinated Support–Relief Control Effectiveness in the Roadway

To systematically evaluate the field performance of the layered coordinated support–relief control technology, a multi-parameter coordinated monitoring system was established to enable integrated observation of roadway deformation, support loading, and cavity responses. The system comprises three monitoring methods: a portable displacement gauge for measuring sidewall convergence; anchor-cable load cells for monitoring support loading; and a bag-type pressure–volume monitoring system for recording changes in cavity volume and internal pressure, which indirectly reveal the evolution of surrounding-rock stress and the effectiveness of pressure relief. Three monitoring stations were installed at each of the T1–T3 sections along the roadway axis at intervals of approximately 50 m, forming a longitudinally distributed monitoring array, as shown in Figure 19. By integrating and comparing multisource data, the control effectiveness of the coordinated support–relief technology can be dynamically evaluated.
It should be noted that the monitoring data in sections T2 and T3 were obtained from continuous in situ monitoring at fixed stations during face advance. Therefore, this section focuses on deformation evolution, convergence characteristics, and final stabilized deformation levels under different control schemes, rather than inferential statistical comparison between independent replicated samples.

5.1. Monitoring of Sidewall Coal-Mass Convergence

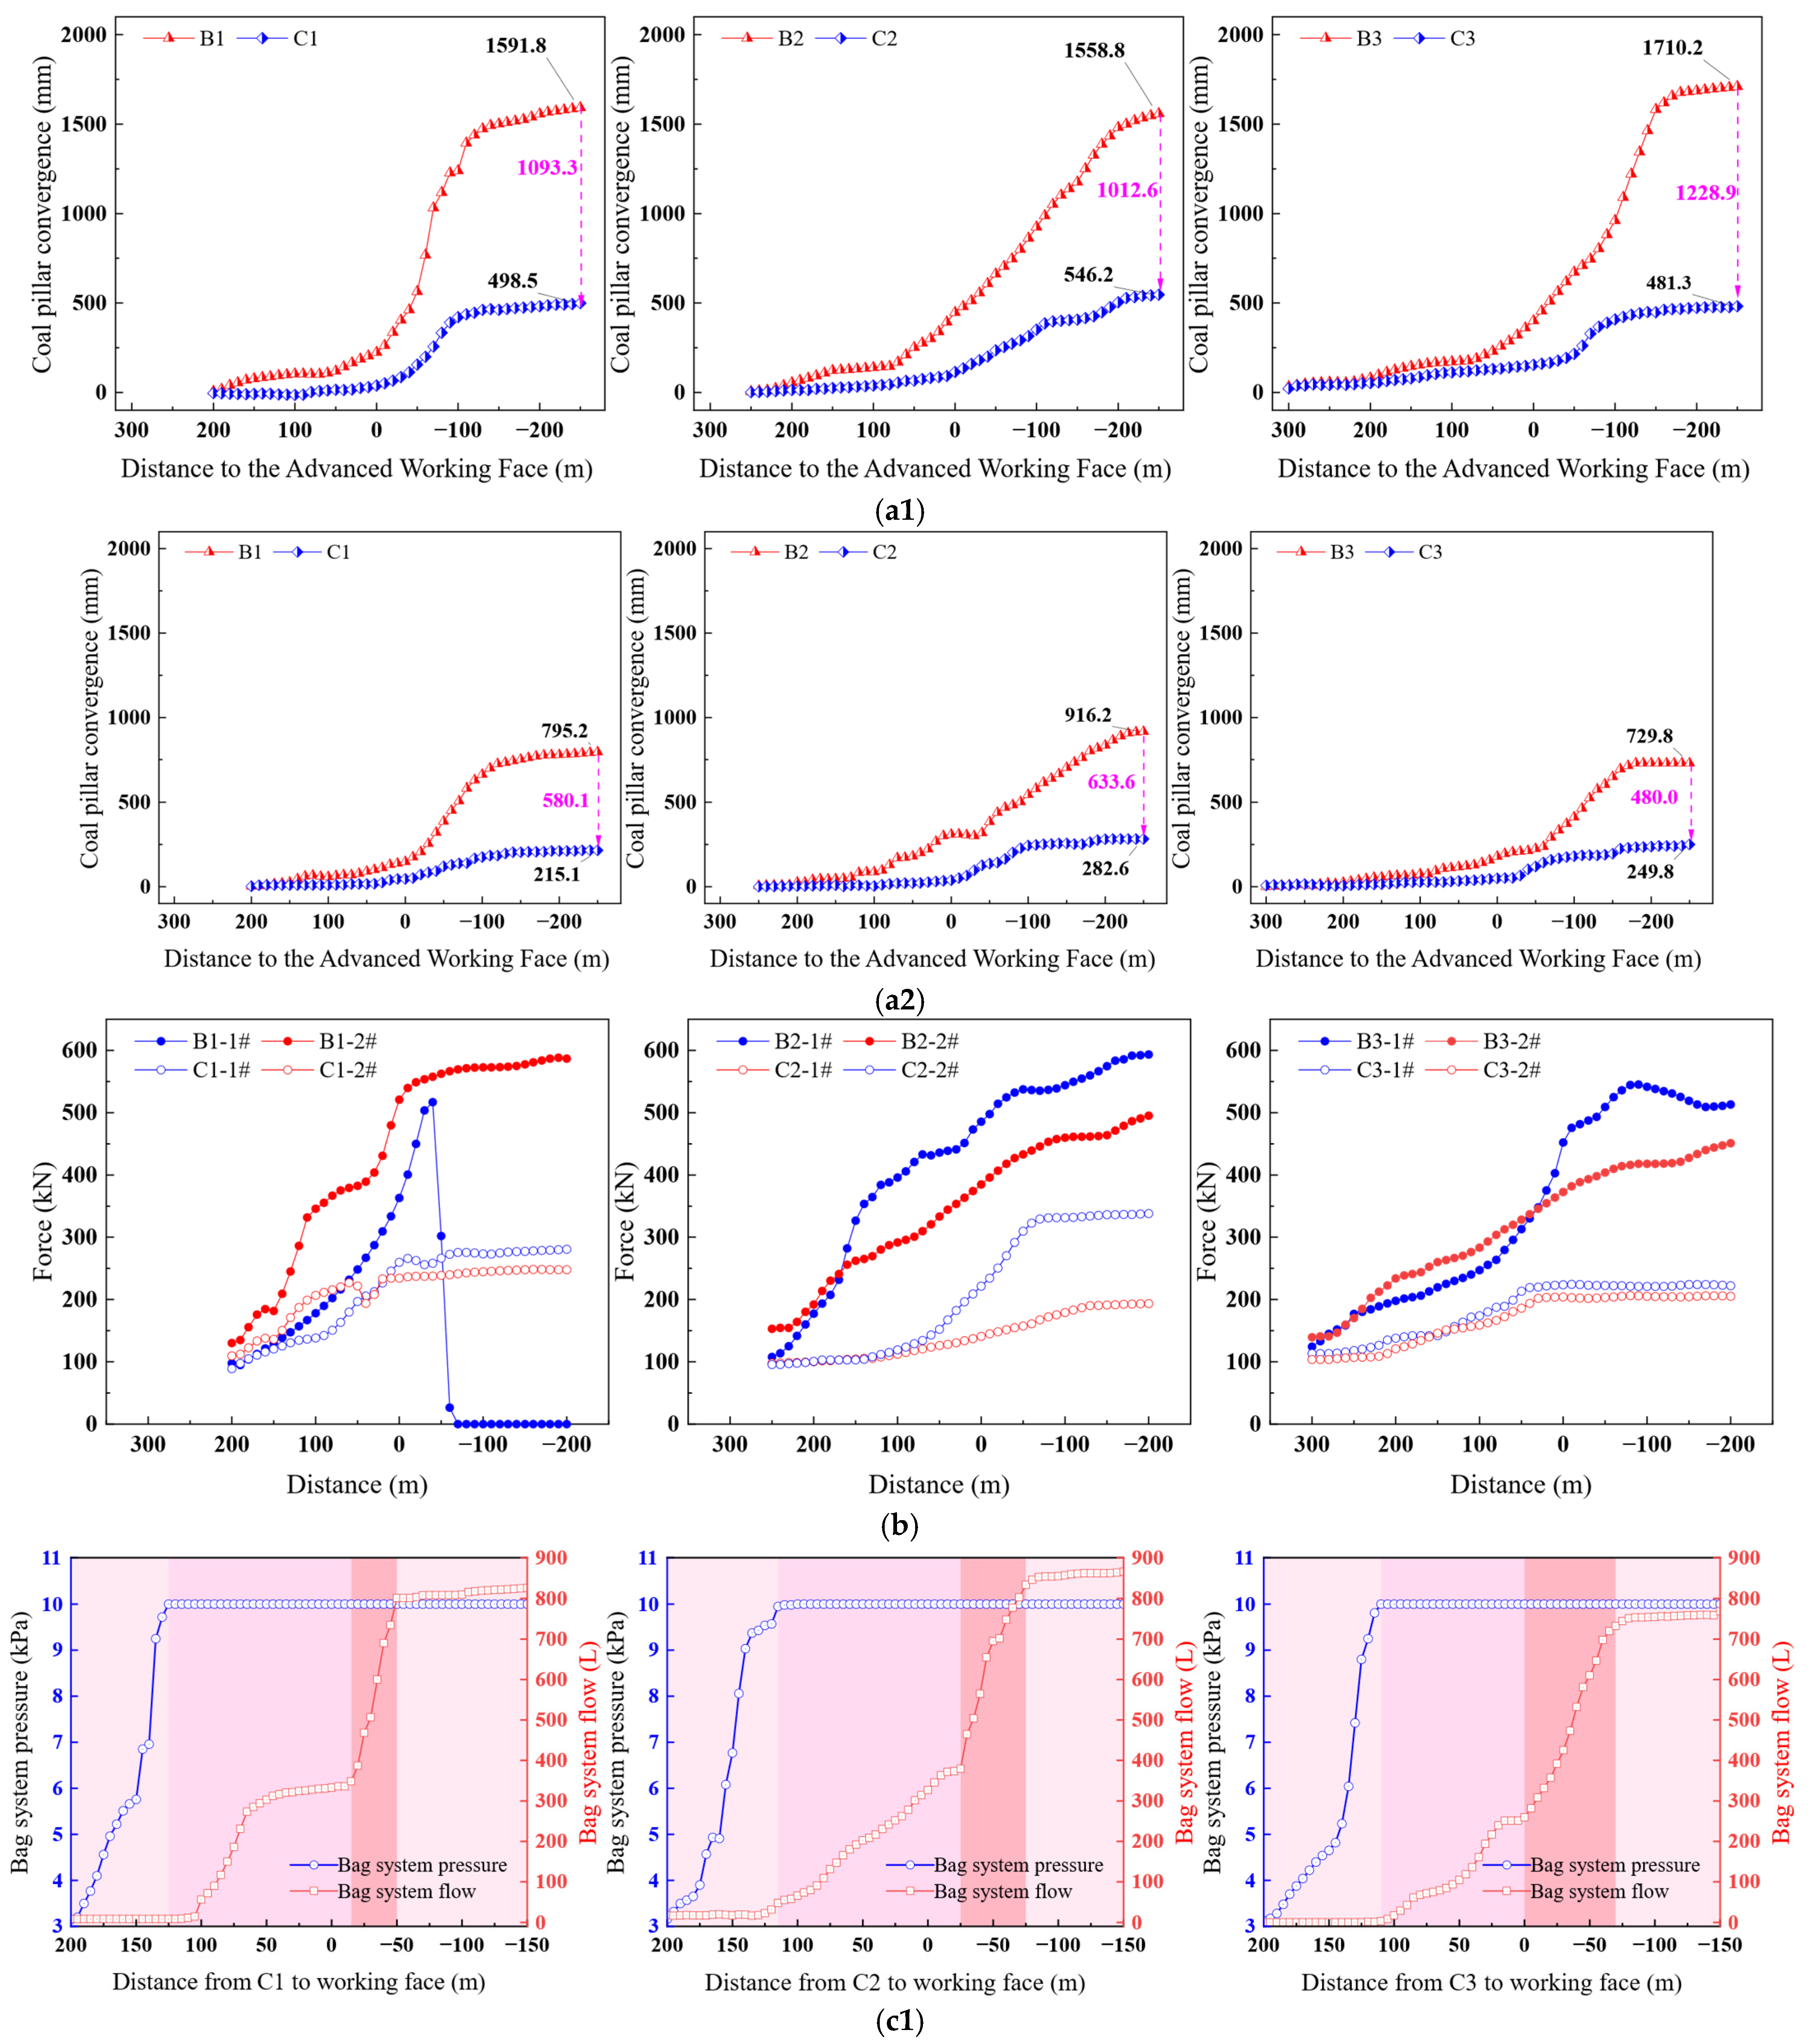
For the three monitoring stations (A1–A3) in section T1, the maximum convergences of the two sidewalls were 2851 mm, 2832 mm, and 2917 mm, respectively. Among them, the maximum convergences of the coal-pillar side reached 2115 mm, 1987.5 mm, and 2051.4 mm, accounting for 74.17%, 70.18%, and 70.33% of the total deformation, respectively. In contrast, the maximum convergences of the solid-coal side were 736 mm, 844.5 mm, and 865.6 mm. These results indicate that the overall roadway deformation in section T1 was dominated by large deformation of the coal-pillar side.
As shown in Figure 20(a1,a2), the displacement monitoring results of the T2 section (reinforced support only) and the T3 section (coordinated support–relief) were compared to further analyze the deformation behavior of the coal-pillar and solid-coal sidewalls.
(1) Deformation behavior of the coal-pillar side
In section T2, the convergence of the coal-pillar side increased continuously with face advance. The influence of dynamic loading became apparent when the working face was approximately 140 m from the monitoring point. The deformation rate increased markedly when the face approached about 70 m and gradually stabilized after the face passed approximately −150 m.
In section T3, the overall deformation pattern was similar, but the deformation onset was delayed, the rapid-growth stage occurred later at around 0 m, and the deformation stabilized earlier, at approximately −100 m. The maximum convergences in section T2 were 1591.8 mm, 1558.8 mm, and 1710.2 mm at stations B1–B3, whereas those in section T3 were 498.5 mm, 546.2 mm, and 481.3 mm at the corresponding stations, corresponding to reductions of 68.70%, 64.96%, and 71.88%, respectively. These results indicate that the coordinated support–relief control effectively reduced the deformation intensity of the coal-pillar side and improved its deformation stability during face advance.
(2) Deformation behavior of the solid-coal side
After the coordinated support–relief technology was applied in section T3, the deformation process of the solid-coal side was further improved. Specifically, the onset of deformation was delayed, the final convergence values were lower, and the evolution curves became smoother. The maximum convergences in section T2 were 795.2 mm, 916.2 mm, and 729.8 mm, whereas the corresponding values in section T3 were 308.7 mm, 351.4 mm, and 296.5 mm, representing reductions of 61.18%, 61.64%, and 59.37%, respectively. This demonstrates that the coordinated support–relief control also mitigated deformation on the solid-coal side, although its primary effect was more pronounced on the coal-pillar side.
(3) Comparative analysis
A comparison of the monitoring results from sections T1–T3 shows that the overall deformation level of the roadway sidewalls decreased progressively under different control schemes. In section T1, the maximum overall sidewall convergence was about 2867 mm. In section T2, it decreased to about 2434 mm, representing a reduction of 15.1% relative to T1, which indicates that reinforced support alone could alleviate surrounding-rock deformation to some extent. However, the deformation magnitude remained high, suggesting that its ability to control large deformation under strong dynamic loading was still limited.
In section T3, the maximum overall sidewall convergence further decreased to about 827.5 mm, which was 66.0% lower than that in section T2. More importantly, the monitoring curves at all stations showed the same overall evolution pattern, namely delayed deformation onset, lower deformation growth rate, and earlier stabilization. Although the reduction magnitudes varied among stations, the final convergence values at all monitoring points on both the coal-pillar side and the solid-coal side were consistently lower in T3 than in T2, showing an overall relationship of T3 < T2 < T1. This indicates that the layered coordinated support–relief control played a clear role in suppressing sidewall deformation and improving roadway stability under repeated mining conditions.
Considering the limited number of monitoring stations in each section and the time-dependent nature of field monitoring data, the above comparison is intended to reflect the overall engineering response trend and field control effectiveness of different schemes.

5.2. Monitoring of Reinforcement Anchor-Cable Loading on Roadway Sidewalls

Similar to the sidewall convergence data, the anchor-cable loading data were obtained from continuous field monitoring at fixed stations, and are therefore analyzed mainly in terms of their evolution characteristics and final response under different control schemes. As shown in Figure 20b, B1-1# and B1-2# represent the upper and lower load cells of the truss anchor cables at monitoring station B1 in the T2 section, while C1-1# and C1-2# represent the upper and lower load cells at station C1 in the T3 section. The three subfigures collectively illustrate the evolution characteristics of anchor-cable loading at the three monitoring stations in the T2 section (reinforced support only) and the T3 section (coordinated support–relief). Overall, the solid-circle curves (T2 section) exhibit higher loading levels with a continuously increasing trend, indicating that, without pressure relief, the coal-pillar side is strongly affected by dynamic loading and the anchor cables remain under high load for a long period, with local pull-out failure occurring in some cases (e.g., B1-1#). In contrast, the hollow-circle curves (T3 section) show markedly lower loading levels with a gentler growth trend, indicating that deep pressure relief effectively weakened the dynamic-loading concentration effect and greatly reduced anchor-cable loading. In general, both the loading magnitude and the growth rate of the No. 1 anchor cable are higher than those of the No. 2 cable, indicating that the upper portion of the sidewall is the main load-bearing zone.
At monitoring station B1 in the T2 section, the upper anchor-cable stress rises rapidly, reaching a peak of 588 kN; in comparison, the peak stress of the upper cable at station C1 in the T3 section is only about 280 kN, less than half of the former, indicating that pressure relief significantly reduced high-deviatoric-stress concentration and improved the overall stress state of the surrounding rock. At monitoring station B1 in the T2 section, the load of the upper anchor cable rises rapidly, reaching a peak of 588 kN; in comparison, the peak load of the corresponding upper cable at station C1 in the T3 section is only about 280 kN, less than half of the former, indicating that pressure relief effectively reduced the high-load response associated with stress concentration and improved the overall loading condition of the surrounding rock. The lower anchor cables also show a “T2 > T3” pattern: the stress at station B2 in the T2 section continues to increase and remains at a high level, while that at station C2 in the T3 section stabilizes after mid-term fluctuations, with an overall reduction of approximately 30–40%. The lower anchor cables also show a clear “T2 > T3” pattern: the load at station B2 in the T2 section continues to increase and remains at a high level, while that at station C2 in the T3 section stabilizes after mid-term fluctuations, with an overall reduction of approximately 30–40%. The overall stress level at station C3 is relatively low but still maintains the consistent trend of “T2 significantly higher than T3,” and the upper and lower cables in the pressure-relief section exhibit smooth, stable curves in the later period. The overall loading level at station C3 is relatively low but still maintains the consistent trend of “T2 > T3,” and the upper and lower cables in the pressure-relief section exhibit smooth, stable curves in the later period. The B3-1# anchor cable remains under high load for an extended period with low safety redundancy, and shows a load drop when the working face advances to −90 to −170 m, indicating displacement and shear–slip occurring in the upper sidewall.
The consistent evolution patterns observed across the three monitoring stations indicate that the coordinated support–relief technology effectively reduced anchor-cable peak loading and slowed the load growth rate by attenuating dynamic-stress concentration and redistributing the surrounding-rock stress field, thereby improving the stability and safety of the support system under multiple dynamic-loading conditions.

5.3. Bag-Type Pressure–Volume Monitoring System

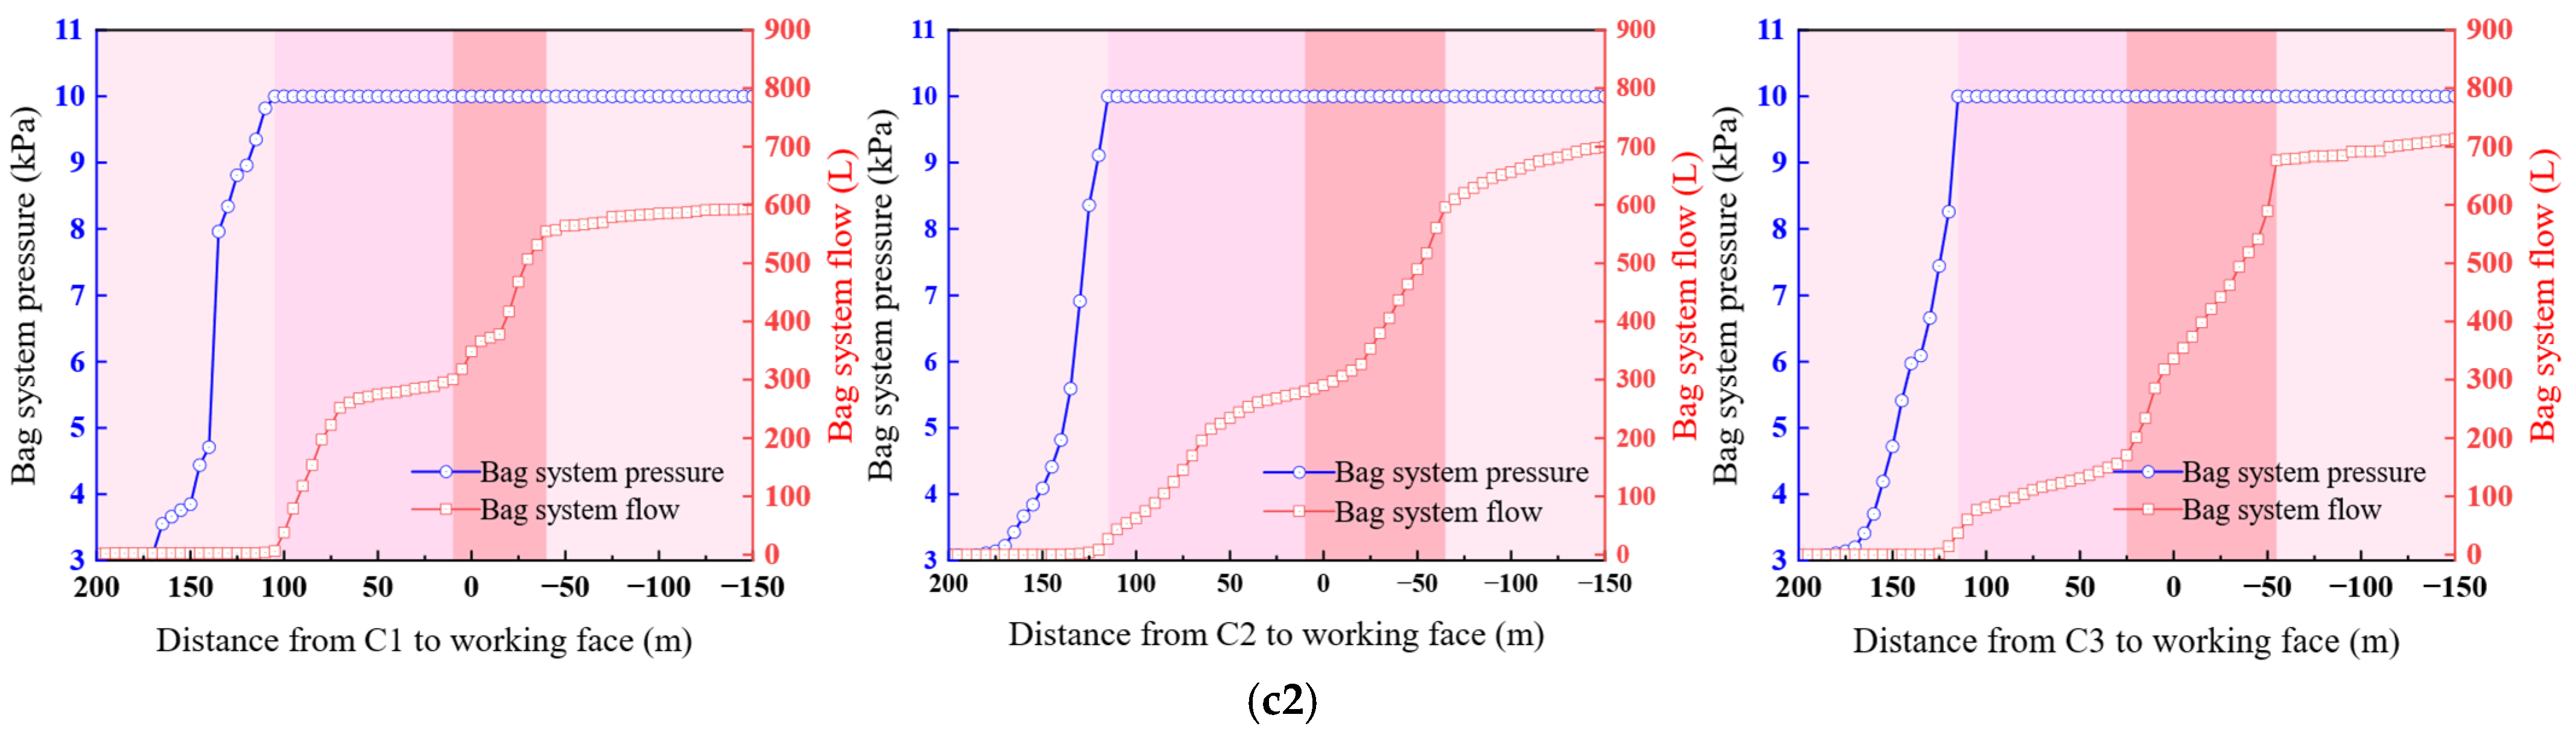
As shown in Figure 20(c1,c2), the monitoring curves of the bag-type system on the coal-pillar side and the solid-coal side are presented. A bag-type monitoring system was installed inside both sidewalls, with an initial injected water volume of approximately 2300 L, and the pressure-release valve threshold was set to 10 kPa. The monitoring results indicate that the curves of the three measurement stations follow a generally consistent trend, although some differences in response magnitude are observed among stations. The monitoring results on the coal-pillar side can be divided into three stages. In the initial stage, when the working face had not yet entered the influence zone, the bag pressure rapidly increased due to slight borehole deformation and remained at a relatively high level, while the water volume showed no significant change. At distances of approximately 125 m, 115 m, and 110 m from the working face, the pressure at the three monitoring stations reached the 10 kPa threshold, after which water discharge began and the pressure remained constant. As the working face advanced into the dynamic-pressure influence zone, the bag pressure continued to remain high while the internal water volume increased significantly, indicating that the shallow coal-pillar sidewall was subjected to strong compressive deformation under concentrated dynamic loading. After the working face passed the monitoring section, at approximately −50 m, −75 m, and −70 m, the water volume continued increasing and then stabilized, implying that the large-diameter pressure-relief cavities were partially closed and a new stress equilibrium was established.
In contrast, the solid-coal side exhibited a much more gradual response. Although its bag-type monitoring curves showed trends similar to those of the coal-pillar side, the response occurred with a noticeable delay. During the initial stage, both pressure and water volume exhibited negligible changes, suggesting that the coal mass was structurally intact with strong bearing capacity, and dynamic disturbance effects had not yet manifested. When the working face advanced to within approximately 30 m, both pressure and water volume started to increase, though the magnitudes were markedly smaller than those on the coal-pillar side. After the working face passed, both values quickly stabilized, reflecting the solid-coal side’s strong self-stability and recovery capability.
Throughout the entire monitoring period, the cumulative maximum relieved water volumes for the coal-pillar side were 826 L, 866 L, and 768 L, while the solid-coal side values were 593 L, 700 L, and 713 L; the corresponding residual volume ratios were approximately 62–67% and 69–74%, respectively. These results indicate that, although the bags experienced certain compressive deformation under strong dynamic loading, more than 60% of their effective volume was retained and no structural failure occurred. This indicates that although the internal pressure-relief cavities experienced partial closure, they were not completely compacted under dynamic loading, and the bag-type system continued to provide effective yielding and buffering capacity. The monitoring data further demonstrate that the system can reliably modulate the pressure-relief response and sustain the long-term stability of the surrounding rock under multi-dynamic-pressure conditions.

6. Conclusions

To investigate the mechanisms of asymmetric deformation and stability control of roadway-surrounding rock under deep multi-dynamic-pressure conditions, this study examined the evolution of deviatoric stress and the performance of a layered support–relief coordinated control system through theoretical analysis, numerical modeling and on-site monitoring. The main findings are summarized as follows:
(1) The maximum principal deviatoric stress S1 was introduced as an innovative core indicator for evaluating surrounding-rock stability, which enabled the identification of the stress-evolution characteristics on the coal-pillar and solid-coal sides under multi-dynamic-pressure conditions. A Pressure Relief Efficiency Index (PREI) was developed by integrating the three dimensions of intensity, range and position, through which the optimal hydraulic-cavitation parameters were determined as Ld = 9 m, L0 = 5 m, and DR = 3.5 m. The findings demonstrate that the cavitated pressure-relief boreholes effectively hinder the transmission of high dynamic stress toward the shallow anchorage zone, thereby acting as a stabilizing barrier for the shallow surrounding rock.
(2) To address the large sidewall deformation in retreat roadways, the surrounding-rock deformation and failure patterns were analyzed and used to guide enhancements to the original support system. On the coal-pillar side, a cable-truss structure was added to provide strong external confinement. In the shallow and middle zones of both sidewalls, behind-wall grouting was applied through boreholes to repair fractured rock and restore post-peak strength. In the deep zone, large-diameter pressure-relief boreholes were arranged to achieve targeted destressing and transfer high stress. These measures form a layered support–relief coordinated control system characterized by “External Reinforcement Fixation (ERF), Near-Surface Modification and Grouting (NSMG), and Deep Targeted Destressing (DTD),” which enables effective and stable control of roadway-surrounding rock under deep multi-dynamic-pressure conditions.
(3) Field observations based on the multi-parameter collaborative monitoring system indicate that roadway deformation follows the trend “T3 ≪ T2 < T1.” The maximum convergence on the coal-pillar side was reduced by approximately 65–70%, and that on the solid-coal side by about 60%. The peak cable forces decreased by more than 40%, and the support system remained stable with a high safety margin. The bag-type pressure–volume system retained more than 60% of its effective volume, demonstrating its sustained pressure-relief capability. The coordinated support–relief technology thus provides effective control of large sidewall deformation and offers theoretical and practical guidance for stability control and support optimization in similar deep thick-seam dynamic-pressure roadways.

Author Contributions

Y.R. provided the concept and edited the draft of the manuscript; H.G., S.X., D.C. and E.W. provided ideological assistance and valuable suggestions; J.C. (Jiaming Chang), J.C. (Jianlai Cao), Y.L., D.L. and Y.Q. provided on-site research data and implementation. All authors have read and agreed to the published version of the manuscript.

Funding

This research was funded by the National Natural Science Foundation of China (Grant Nos. 52074296 and 52004286), the Natural Science Foundation of Hebei Province of China (No. E2026508001), and the Science and Technology Project of the Hebei Provincial Department of Education (No. ZC2026144).

Data Availability Statement

The data supporting the findings of this study, including numerical simulation results and experimental measurements, are available within the article. Further data are available from the corresponding author upon reasonable request.

Acknowledgments

The authors would like to thank all the individuals and organizations that contributed to this study.

Conflicts of Interest

The authors declare no conflicts of interest.

References

  1. Zhao, Y.X.; Zhou, J.L.; Zhang, C.; Liu, B.; Ling, C.W.; Liu, W.C.; Han, C.J. Failure mechanism of gob-side roadway in deep coal mining in the Xinjie mining area: Theoretical analysis and numerical simulation. J. Cent. South Univ. 2023, 30, 1631–1648. [Google Scholar] [CrossRef]
  2. Li, X.B.; Qiu, J.D.; Zhao, Y.Z.; Chen, Z.H.; Li, D.Y. Instantaneous and long-term deformation characteristics of deep room-pillar system induced by pillar recovery. Trans. Nonferrous Met. Soc. China 2020, 30, 2775–2791. [Google Scholar] [CrossRef]
  3. Wang, Z.Q.; Zhang, J.; Li, J.K.; Wang, P.; Wu, C.; Shi, L. Research of Surrounding Rock Control of Gob-Side Entry Retaining Based on Deviatoric Stress Distribution Characteristics. Sustainability 2022, 14, 5660. [Google Scholar] [CrossRef]
  4. Zhang, S.C.; Li, Y.Y.; Shen, B.T.; Sun, X.Z.; Gao, L.Q. Effective evaluation of pressure relief drilling for reducing rock bursts and its application in underground coal mines. Int. J. Rock Mech. Min. Sci. 2019, 114, 7–16. [Google Scholar] [CrossRef]
  5. Wu, Y.H.; Liu, X.S.; Tan, Y.L.; Wang, W.; Li, X.B.; Wang, X. Mechanism of bolt breakage in deep mining roadway under dynamic load and advanced strengthening support technology. Eng. Fail. Anal. 2024, 161, 108255. [Google Scholar] [CrossRef]
  6. Lv, J.K.; Wan, Z.J.; Yang, Y.J.; Wang, J.H.; Zhang, Y.; Liu, S.F. Failure characteristics and stability control technology of dynamic pressure roadway affected by the mining activity: A case study. Eng. Fail. Anal. 2022, 131, 105857. [Google Scholar] [CrossRef]
  7. Wang, E.; Yin, S.F.; Kang, Q.T.; Zhao, X.B.; Lan, Q.K.; Sheng, H.Y.; Liang, H.Y. Coupling control technology of anchoring and unloading in deep intense-mining and large-deformation roadway: A case study. Sci. Rep. 2024, 14, 12075. [Google Scholar] [CrossRef] [PubMed]
  8. Wang, M.; Wang, W.Y.; Xu, Y.L.; Xie, G.L.; Qin, J.Y.; Liu, H.L.; Wei, S.J.; Xu, Q.Y. Study on the new layout pattern about the gob-side entry under dynamic pressure and its surrounding rock stability control. Energy Sci. Eng. 2024, 12, 1389–1410. [Google Scholar] [CrossRef]
  9. Pu, S.J.; Wu, R.Q.; Wu, S.C.; Cheng, H.Y.; Cao, L.; Ren, Z.J. Analysis of Deformation Characteristics and Failure Mechanism of Interbedded Surrounding Rock Tunnels Based on Principal Stress Difference. Int. J. Geomech. 2024, 24, 04024197. [Google Scholar] [CrossRef]
  10. Li, J.; Qiang, X.B.; Wang, W.S.; Wang, F. Distribution Law of Principal Stress Difference of Deep Surrounding Rock of Gob-side Entry and Optimum Design of Coal Pillar Width. Teh. Vjesn. 2019, 26, 1743–1752. [Google Scholar] [CrossRef]
  11. Chen, D.D.; Jiang, Z.S.; Ma, X.; Xie, S.R.; Wang, E.; Li, H. Evolution law and engineering application on main stress difference for a novel stress relief technology in two ribs on deep coal roadway. J. Cent. South Univ. 2023, 30, 2266–2283. [Google Scholar] [CrossRef]
  12. Cui, F.; Zhang, S.L.; Chen, J.Q.; Jia, C. Numerical Study on the Pressure Relief Characteristics of a Large-Diameter Borehole. Appl. Sci. 2022, 12, 7967. [Google Scholar] [CrossRef]
  13. Li, J.Z.; Zhou, W.; Chu, J.Q.; Ren, W.T.; Dou, L.M.; Song, S.K. Energy Transfer and Destabilizing Impulse Inducing Mechanism of Coal-Rock System in Roadway through Coal Seam in Deep Zone. Fractal Fract. 2023, 7, 550. [Google Scholar] [CrossRef]
  14. Yang, S.; Ning, J.G.; Zhang, X.L.; Wang, J.; Shi, X.S. Analysis of stress environment and deformation failure of surrounding rock in deep roadway after pressure relief: A case study. Eng. Fail. Anal. 2024, 160, 108173. [Google Scholar] [CrossRef]
  15. Zhang, H.; Li, T.; Ouyang, Z.H.; Liu, S.; Yi, H.Y. Research on Optimization of Coal Pressure Relief Borehole Parameters under High-Stress Conditions. Geofluids 2021, 2021, 4673152. [Google Scholar] [CrossRef]
  16. Dai, L.P.; Pan, Y.S.; Xiao, Y.H.; Wang, A.W.; Wang, W.; Wei, C.C.; Fan, D.W. Parameter Design Method for Destressing Boreholes to Mitigate Roadway Coal Bursts: Theory and Verification. Rock Mech. Rock Eng. 2024, 57, 9539–9556. [Google Scholar] [CrossRef]
  17. Luo, Y.; Xu, K.; Huang, J.H.; Li, X.P.; Liu, T.T.; Qu, D.X.; Chen, P.P. Impact analysis of pressure-relief blasting on roadway stability in a deep mining area under high stress. Tunn. Undergr. Space Technol. 2021, 110, 103781. [Google Scholar] [CrossRef]
  18. Wu, W.D.; Wang, T.C.; Bai, J.B.; Liu, J.H.; Wang, X.Y.; Xu, H.Y.; Feng, G.R. Failure Characteristics and Cooperative Control Strategies for Gob-Side Entry Driving near an Advancing Working Face: A Case Study. Processes 2024, 12, 1398. [Google Scholar] [CrossRef]
  19. Wu, Y.Y.; Ye, Q.C.; Gao, Y.B.; Zhang, X.X.; He, M.C. Innovative pillar recovery method integrating gob-side entry driving and directional roof-cutting for thick-hard roof coal seams. J. Cent. South Univ. 2025, 32, 3493–3513. [Google Scholar] [CrossRef]
  20. Wu, K.B.; Zou, J.P.; Jiao, Y.Y.; He, S.J.; Wang, G.M. Insight and Effectiveness of Working-Face Deep-Hole Blasting for Prevention of Strong Seismicity Induced by Deep Coal Mining. Rock Mech. Rock Eng. 2023, 56, 8693–8709. [Google Scholar] [CrossRef]
  21. Wang, M.; Li, Z.X.; Xu, Y.L.; Li, Z.H.; Yuan, R.F.; Zhao, H.C.; Li, G.D. Impact of Depressurizing Boreholes on Energy Dissipation in Deep Roadway. Geofluids 2022, 2022, 6821810. [Google Scholar] [CrossRef]
  22. Lyu, J.; Qi, L.F.; Pan, Y.S.; Dai, L.P.; Tang, Z.; Wang, X.B. Study on the pressure relief energy dissipation law of variable-diameter boreholes in roadway surrounding rock under dynamic and static loads. PLoS ONE 2024, 19, e0306449. [Google Scholar] [CrossRef]
  23. Zhang, L.; Huang, P.; Liu, S.J.; He, G.; Li, B.; Cao, Y.W. Relief Mechanism of Segmented Hole Reaming and Stress Distribution Characteristics of Drilling Holes in Deep Coal Mine. Processes 2022, 10, 1566. [Google Scholar] [CrossRef]
  24. Chen, D.D.; Jia, Q.B.; Zhang, Z.F.; Xie, S.R.; Wang, Y.Y.; Wang, Z.Q.; Li, Z.J.; Tian, C.Y.; Xie, F.X. Study on the Failure Mechanism and a New Monitoring Method of Borehole Stress Gauge Monitoring Coal Seam Mining Stress. Rock Mech. Rock Eng. 2025, 59, 2505–2525. [Google Scholar] [CrossRef]
  25. Xie, S.R.; Li, H.; Chen, D.D.; Feng, S.H.; Yang, J.H.; Ma, X.; Jiang, Z.S.; Xing, S.K. Research on the Control Technology and Key Parameters of External Anchor-Internal Unloading of Surrounding Rock During Gob-Side Entry Driving Under Severe Mining of 1000-m-Deep Mine. Rock Mech. Rock Eng. 2024, 57, 2913–2932. [Google Scholar] [CrossRef]
  26. Xie, S.R.; Jiang, Z.S.; Chen, D.D.; Wang, E.; Lv, F. A New Pressure Relief Technology by Internal Hole-Making to Protect Roadway in Two Sides of Deep Coal Roadway: A Case Study. Rock Mech. Rock Eng. 2023, 56, 1537–1561. [Google Scholar] [CrossRef]
  27. Xie, S.R.; Jiang, Z.S.; Chen, D.D.; Wang, E.; Lv, F. Failure mechanism of continuous large deformation and a novel pressure relief control technology on the two sides of deep coal roadway. Eng. Fail. Anal. 2023, 144, 106941. [Google Scholar] [CrossRef]
  28. Thornton, C.; Zhang, L. On the evolution of stress and microstructure during general 3D deviatoric straining of granular media. Géotechnique 2010, 60, 333–341. [Google Scholar] [CrossRef]
  29. Liu, H.T.; Han, Z.; Han, Z.J.; Chen, Z.H.; Liu, Q.Y.; Zhang, H.K.; Zhang, R.G.; Guo, L.F. Nonlinear empirical failure criterion for rocks under triaxial compression. Int. J. Min. Sci. Technol. 2024, 34, 351–369. [Google Scholar] [CrossRef]
  30. Wang, M.; Zheng, D.J.; Shen, W.L.; Wang, X.Y.; Li, W.F. Depressurizing boreholes for mitigating large deformation of the main entry. Energy Sci. Eng. 2020, 8, 1404–1417. [Google Scholar] [CrossRef]
  31. Wang, M.; Wang, X.; Xiao, T. Borehole destressing mechanism and determination method of its key parameters in deep roadway. J. China Coal Soc. 2017, 42, 1138–1145. [Google Scholar] [CrossRef]
  32. Wang, M.; Zheng, D.; WAng, X.; Xiao, T.; Shen, W.; Song, Z. Deformation characteristics and creeping control ofdeep roadway with pressure-relief borehole. J. Min. Saf. Eng. 2019, 36, 437–445. [Google Scholar] [CrossRef]
  33. Yang, S.S.; Niu, S.Q. Thick Board Theory on the Bolting Support of the Ribs in Coal Mine Roadway. In Proceedings of the International Conference on Civil Engineering and Building Materials (CEBM), Kunming, China, 29–31 July 2011; pp. 3775–3779. [Google Scholar] [CrossRef]
  34. He, F.L.; Yang, Y.; Li, L.; Feng, L.; Xiao, Z.; Lihong, F. Determining reasonable position of roadway for close coal seam. J. Min. Sci. Technol. 2022, 7, 505–512. [Google Scholar] [CrossRef]
  35. Liu, H.T.; Liang, J.L.; Han, Z.J.; Qinyu, L.; Zhongjin, Q. Approximate solution of plastic zone in surrounding rock under three-dimensional stress field based on Drucker-Prager strength criterion. J. Min. Sci. Technol. 2024, 9, 909–920. [Google Scholar] [CrossRef]
  36. Yuan, X.; Yang, S.S. Interaction Principle of Rock-Bolt Structure and RIB Control in Large Deformation Roadways. Arch. Min. Sci. 2021, 66, 227–248. [Google Scholar] [CrossRef]
  37. Zhao, T.; Guo, W.; Zhang, D.; Tan, Y.; Yin, Y.; Tan, Y.; Jiang, Y.; Yao, J. Theoretical framework for stress relief-support reinforcement cooperative control of rock bursts in deep coal mining. Geohazard Mech. 2024, 2, 49–57. [Google Scholar] [CrossRef]
  38. Han, Z.; Liu, H.; Guo, X.; Liang, J.; Qiao, Z.; Cao, C.; Guo, L.; Chen, X. Damage evolution and failure warning in early-age flexible-formwork concrete for underground support. Geohazard Mech. 2025, 3, 187–196. [Google Scholar] [CrossRef]
Figure 1. Comparison and evolution of three key borehole-based pressure-relief techniques.
Applsci 16 03382 g001
Figure 2. Engineering geological conditions and test area layout.
Applsci 16 03382 g002
Figure 3. Borehole imaging results of the roadway-surrounding rock.
Applsci 16 03382 g003
Figure 4. Numerical calculation model and simulation scheme.
Applsci 16 03382 g004
Figure 5. Schematic diagram of the PREI evaluation system based on S1.
Applsci 16 03382 g005
Figure 6. Numerical simulation of S1 distribution under different Ld.
Applsci 16 03382 g006
Figure 7. S1 variation curves under different Ld.
Applsci 16 03382 g007
Figure 8. Numerical simulation of S1 distribution under different L0.
Applsci 16 03382 g008
Figure 9. S1 variation curves under different L0.
Applsci 16 03382 g009
Figure 10. Numerical simulation of S1 distribution under different DR.
Applsci 16 03382 g010
Figure 11. S1 variation curves under different DR.
Applsci 16 03382 g011
Figure 12. Typical S1 distribution curve and key parameter points.
Applsci 16 03382 g012
Figure 13. Plan view of the mining model.
Applsci 16 03382 g013
Figure 14. S1 distribution and key parameter evolution in dynamic-pressure Stage 1.
Applsci 16 03382 g014
Figure 15. S1 distribution and key parameter evolution in dynamic-pressure Stage 2.
Applsci 16 03382 g015
Figure 16. S1 distribution and key parameter evolution in dynamic-pressure Stage 3.
Applsci 16 03382 g016
Figure 17. Conceptual framework of the layered ERF–NSMG–DTD coordinated support–relief approach.
Applsci 16 03382 g017
Figure 18. Overall structure and process flow of the layered coordinated support–relief control technology.
Applsci 16 03382 g018
Figure 19. Plan view of the monitoring-station layout.
Applsci 16 03382 g019
Figure 20. Support–relief coordinated control performance observed through the multi-parameter collaborative monitoring system. (a1) Convergence of the coal-pillar side. (a2) Convergence of the solid-coal side. (b) Monitoring curves of the anchor load cells. (c1) Monitoring curves of the bag-type system on the coal-pillar side. (c2) Monitoring curves of the bag-type system on the solid-coal side.
Applsci 16 03382 g020aApplsci 16 03382 g020b
Table 1. Field photographs and sketches of actual failure conditions.
Failure TypeOn-Site PhotographDeformation Schematic and
Failure Mechanism
Shoulder
corner
bulging
deformation
Applsci 16 03382 i001Applsci 16 03382 i002Applsci 16 03382 i003
Integral
sidewall
displacement
Applsci 16 03382 i004Applsci 16 03382 i005Applsci 16 03382 i006
Support
system
failure
Applsci 16 03382 i007Applsci 16 03382 i008Applsci 16 03382 i009
Table 2. Mechanical parameters of the strata.
StratumDensity/
(kg·m−3)
Bulk/
(GPa)
Shear/
(GPa)
Cohesion/
(GPa)
Friction/
(°)
Tension/
(MPa)
Siltstone250011.08.03.0341.6
Medium-grained sandstone265015.011.53.6331.4
Fine-grained sandstone260015.011.53.5361.7
Sandy mudstone23002.62.41.8321.0
3# coal14001.50.91.2270.7
Mudstone24002.62.41.9321.0
Table 3. Definitions of the evaluation indices for cavitation-induced pressure relief.
NO.Pressure-Relief Evaluation IndicesSymbolDefinition
1Width of the pressure-relief zonewThe range over which the deviatoric stress decreases compared with its initial state after pressure relief
2Width of the effective relief zonew0The range where the post-relief deviatoric stress reduction reaches 40% of the peak value
3Inward migration distance of the deviatoric-stress peaktThe distance between the original and post-relief peak deviatoric-stress points
4Width of the original peak-stress zonewmThe region where the deviatoric stress exceeds 60% of the original peak value
5Pressure Relief Efficiency IndexPREIThe degree to which different cavitation lengths generate an effective pressure-relief zone
Table 4. Deviatoric-stress-based pressure-relief indices under different cavitation depths in the static-loading stage.
IndicatorsLd/(m)L0/(m)
7891011135
Basic
parameters
t/(m)234560.52.54
w0/(m)6.136.056.195.725.542.514.376.19
w/(m)6.136.056.195.936.003.134.376.19
w0/w1.001.001.000.960.920.8011
w0/wm1.531.511.551.431.390.631.091.55
S1,0/(MPa)7.237.237.237.237.237.237.237.23
S1,1/(MPa)7.146.205.915.055.057.026.955.91
Individual
indices
I10.010.140.180.300.300.030.040.18
I21.531.511.551.381.280.501.091.55
I32.03.04.05.06.00.52.54
I 1 * 00.450.591.001.0000.061
I 2 * 0.940.871.000.37000.561
I 3 * 00.250.500.751.0000.571
Composite
index
PREI0.420.570.740.630.5500.371
LevelIIIIIIIIIIIIIIII
Table 5. Summary of the variation characteristics of key parameters at each stage under dynamic loading conditions.
IndicatorsStage1Stage2Stage3
302010−10−20−30−40−30−20
Coal pillart(G1)/(m)0.50.51.03.54.04.03.53.53.5
S(G1)/(MPa)8.5810.5712.0311.0611.2911.398.618.799.13
S(C1)/(MPa)2.443.174.409.609.528.899.359.389.78
S(CD)/(MPa)8.208.698.86//////
S(CS)/(MPa)4.684.814.894.354.384.484.975.566.39
R(G1)/(%)32.663.485.970.970.976.033.135.941.1
R(C1)/(%)105.0166.4269.7706.7700.0647.9685.7688.2722.7
R(CD)/(%)13.420.220.2//////
R(CS)/(%)24.127.629.715.416.218.831.847.569.5
Solid coal sidet(FD)/(m)3.03.03.03.53.53.54.04.55.0
S(FS)/(MPa)3.443.453.422.883.073.094.384.945.14
S(FD)/(MPa)7.497.487.446.796.896.787.698.8311.21
R(FS)/(%)6.87.16.2−10.6−4.7−4.036.053.459.6
R(FD)/(%)3.33.22.6−6.3−5.0−6.56.121.854.5
Disclaimer/Publisher’s Note: The statements, opinions and data contained in all publications are solely those of the individual author(s) and contributor(s) and not of MDPI and/or the editor(s). MDPI and/or the editor(s) disclaim responsibility for any injury to people or property resulting from any ideas, methods, instructions or products referred to in the content.