High-Performance WebGL-Based Visual Analytics Framework for Large-Scale Behavioral Embeddings: System Architecture and Rendering Optimization

Abstract
1. Introduction
1.1. Technical Challenges: Rendering Scalability vs. Information Density
1.2. Research Contribution
- Theoretical Integration: We propose a dual-process model merging CLT and SDT to guide the interface design strategy.
- System Architecture: We detail the implementation of a full-stack visualization pipeline, from Behavior2Vec embedding generation to a high-performance WebGL-based frontend.
- Semantic Exploration Walkthrough: We demonstrate the system’s operational feasibility through a semantic exploration walkthrough of smart appliance data.
2. Theoretical Background and Related Work
2.1. Behavioral Embeddings and Visualization Challenges
2.2. Cognitive Load in Visualization
2.3. Autonomy and Interaction
3. The Cognitive Autonomy Framework
3.1. Dual-Process Interaction Model
3.2. Design Principles (DP)
- DP1: Context-Aware Density: The system must dynamically adjust the number of visible nodes (intrinsic load) based on the user’s zoom level and semantic focus, preventing “visual noise”.
- DP2: Scaffolded Navigation: To support autonomy without inducing disorientation, the system should offer “Guided” modes that act as cognitive rails, reducing extraneous load during complex tasks.
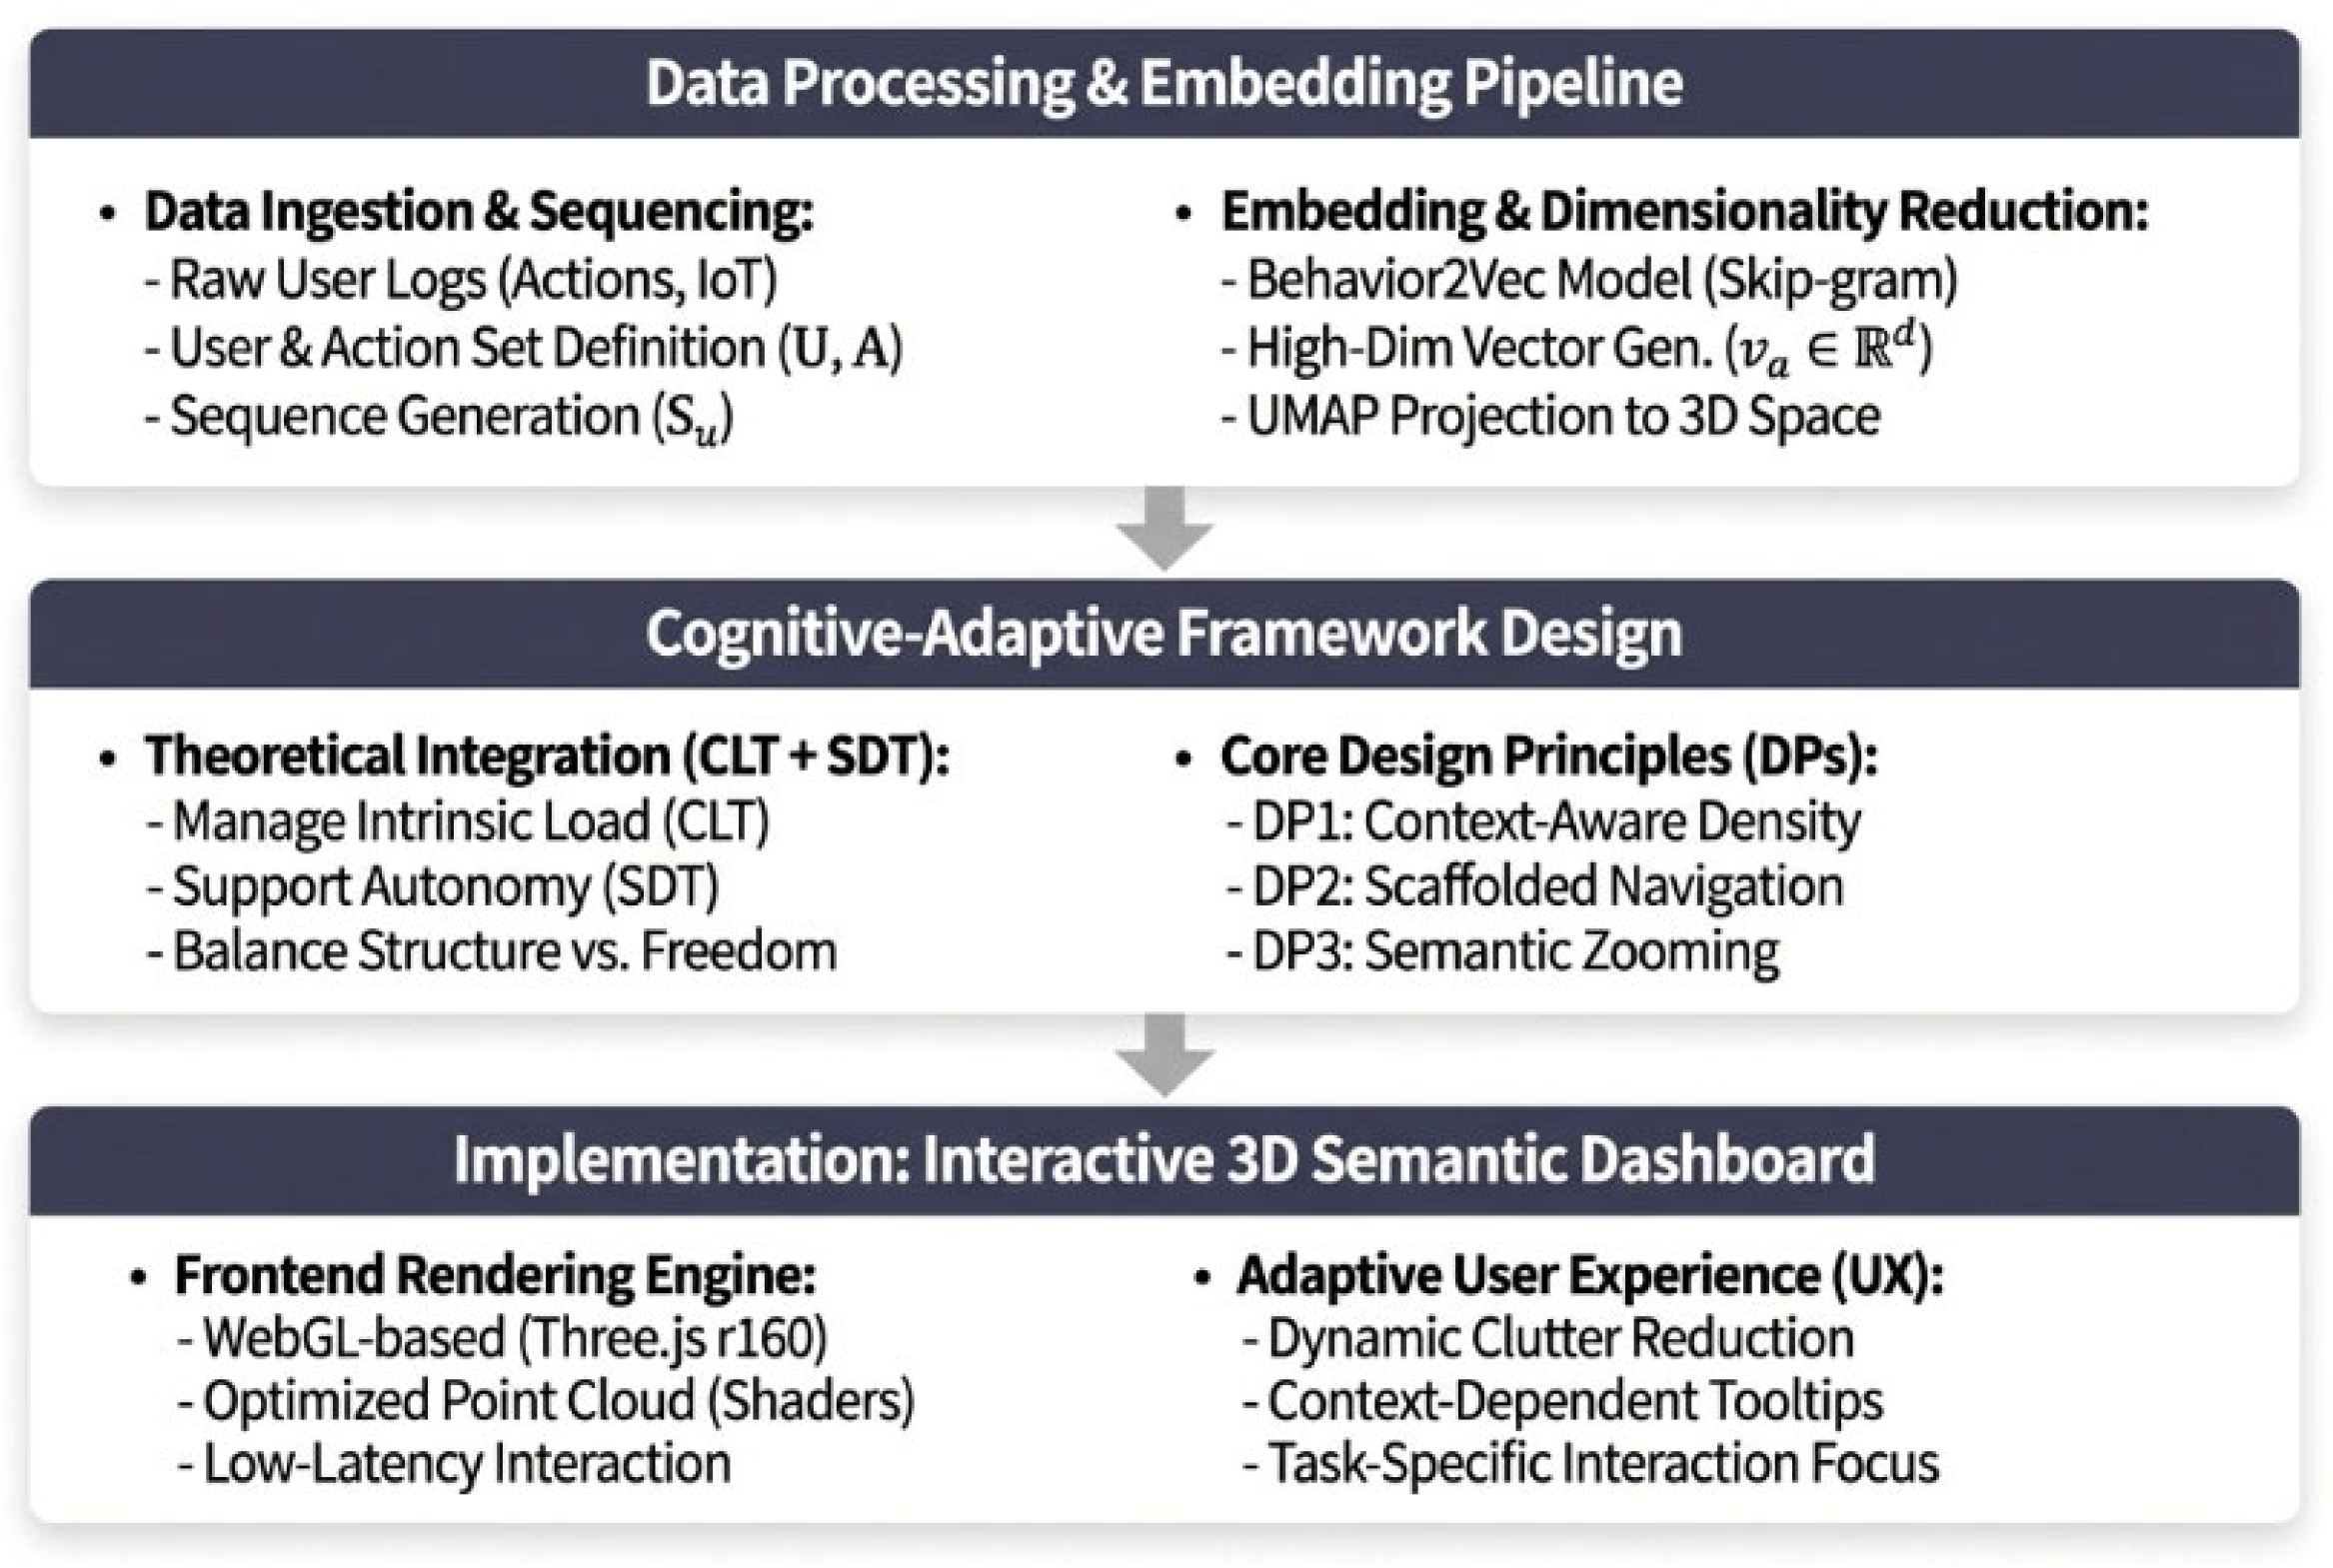
- DP3: Semantic Zooming: Information should be disclosed progressively. High-level clusters are shown first; detailed behavioral attributes appear only on demand or at high zoom levels [25]. Operationally, DP3 is implemented as a distance-threshold disclosure rule, where zoomed-out views restrict labels to cluster-level cues, and zoomed-in views progressively reveal finer-grained action/user labels within the current focus region. Figure 1 summarizes the proposed Cognitive Autonomy Framework and its relationship to the three design principles.
4. Materials and Methods
4.1. Data Processing Pipeline and Embedding Generation
4.2. Reproducibility Specification: Synthetic Data Generation
- User Nodes (Anchors): Generated using a Gaussian Mixture Model (GMM) to simulate distinct user segments clustered around latent centroids. These serve as the primary entities in the visualization.
- Attribute Nodes (Contexts): Defined as cluster centroids (K = 4) representing static user characteristics (e.g., ‘Nocturnal’, ‘Family’). These nodes act as gravitational centers for the GMM generation.
- Action Nodes (Satellites): Injected using a Zipfian distribution (Power Law, α = 1.5) [26] to mimic the long-tail distribution of device usage logs. These nodes densely surround User nodes, creating significant visual occlusion challenges typical of real-world behavioral sequences.
- -
- Standard Domain Scale (~5000 nodes): Represents the typical complexity of smart home behavioral attributes, as utilized in the Semantic Exploration Walkthrough (Section 6).
- -
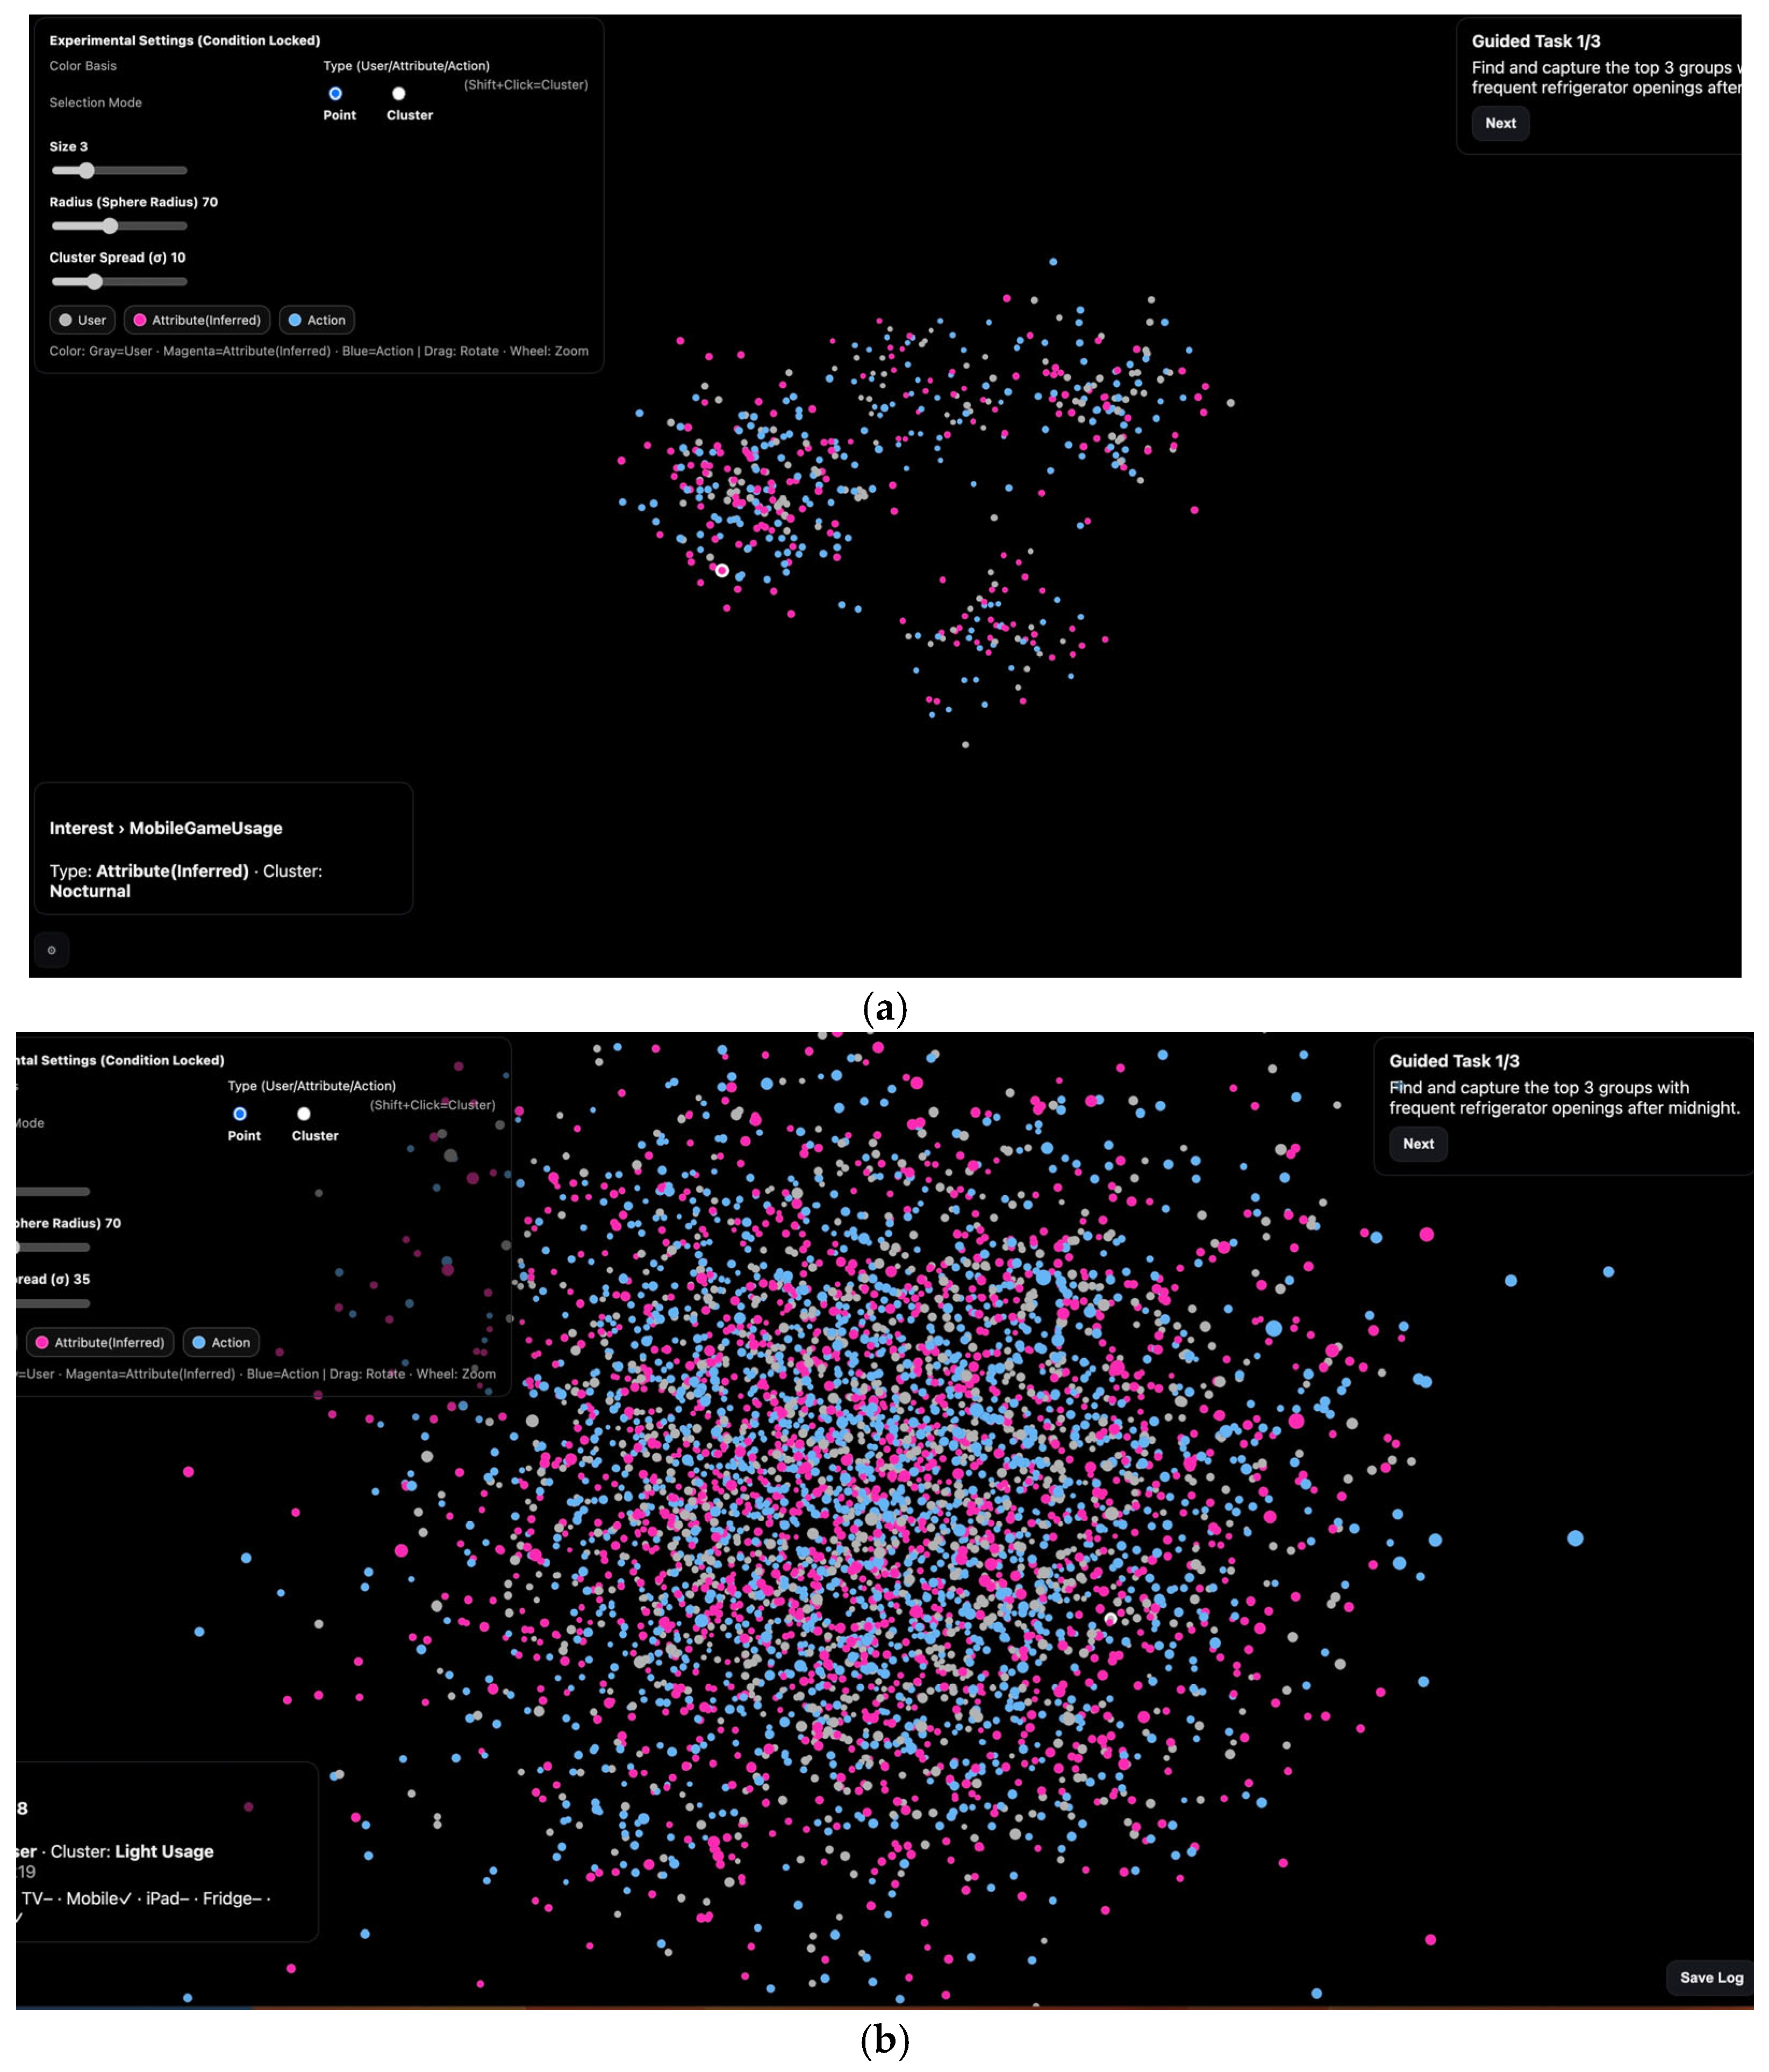
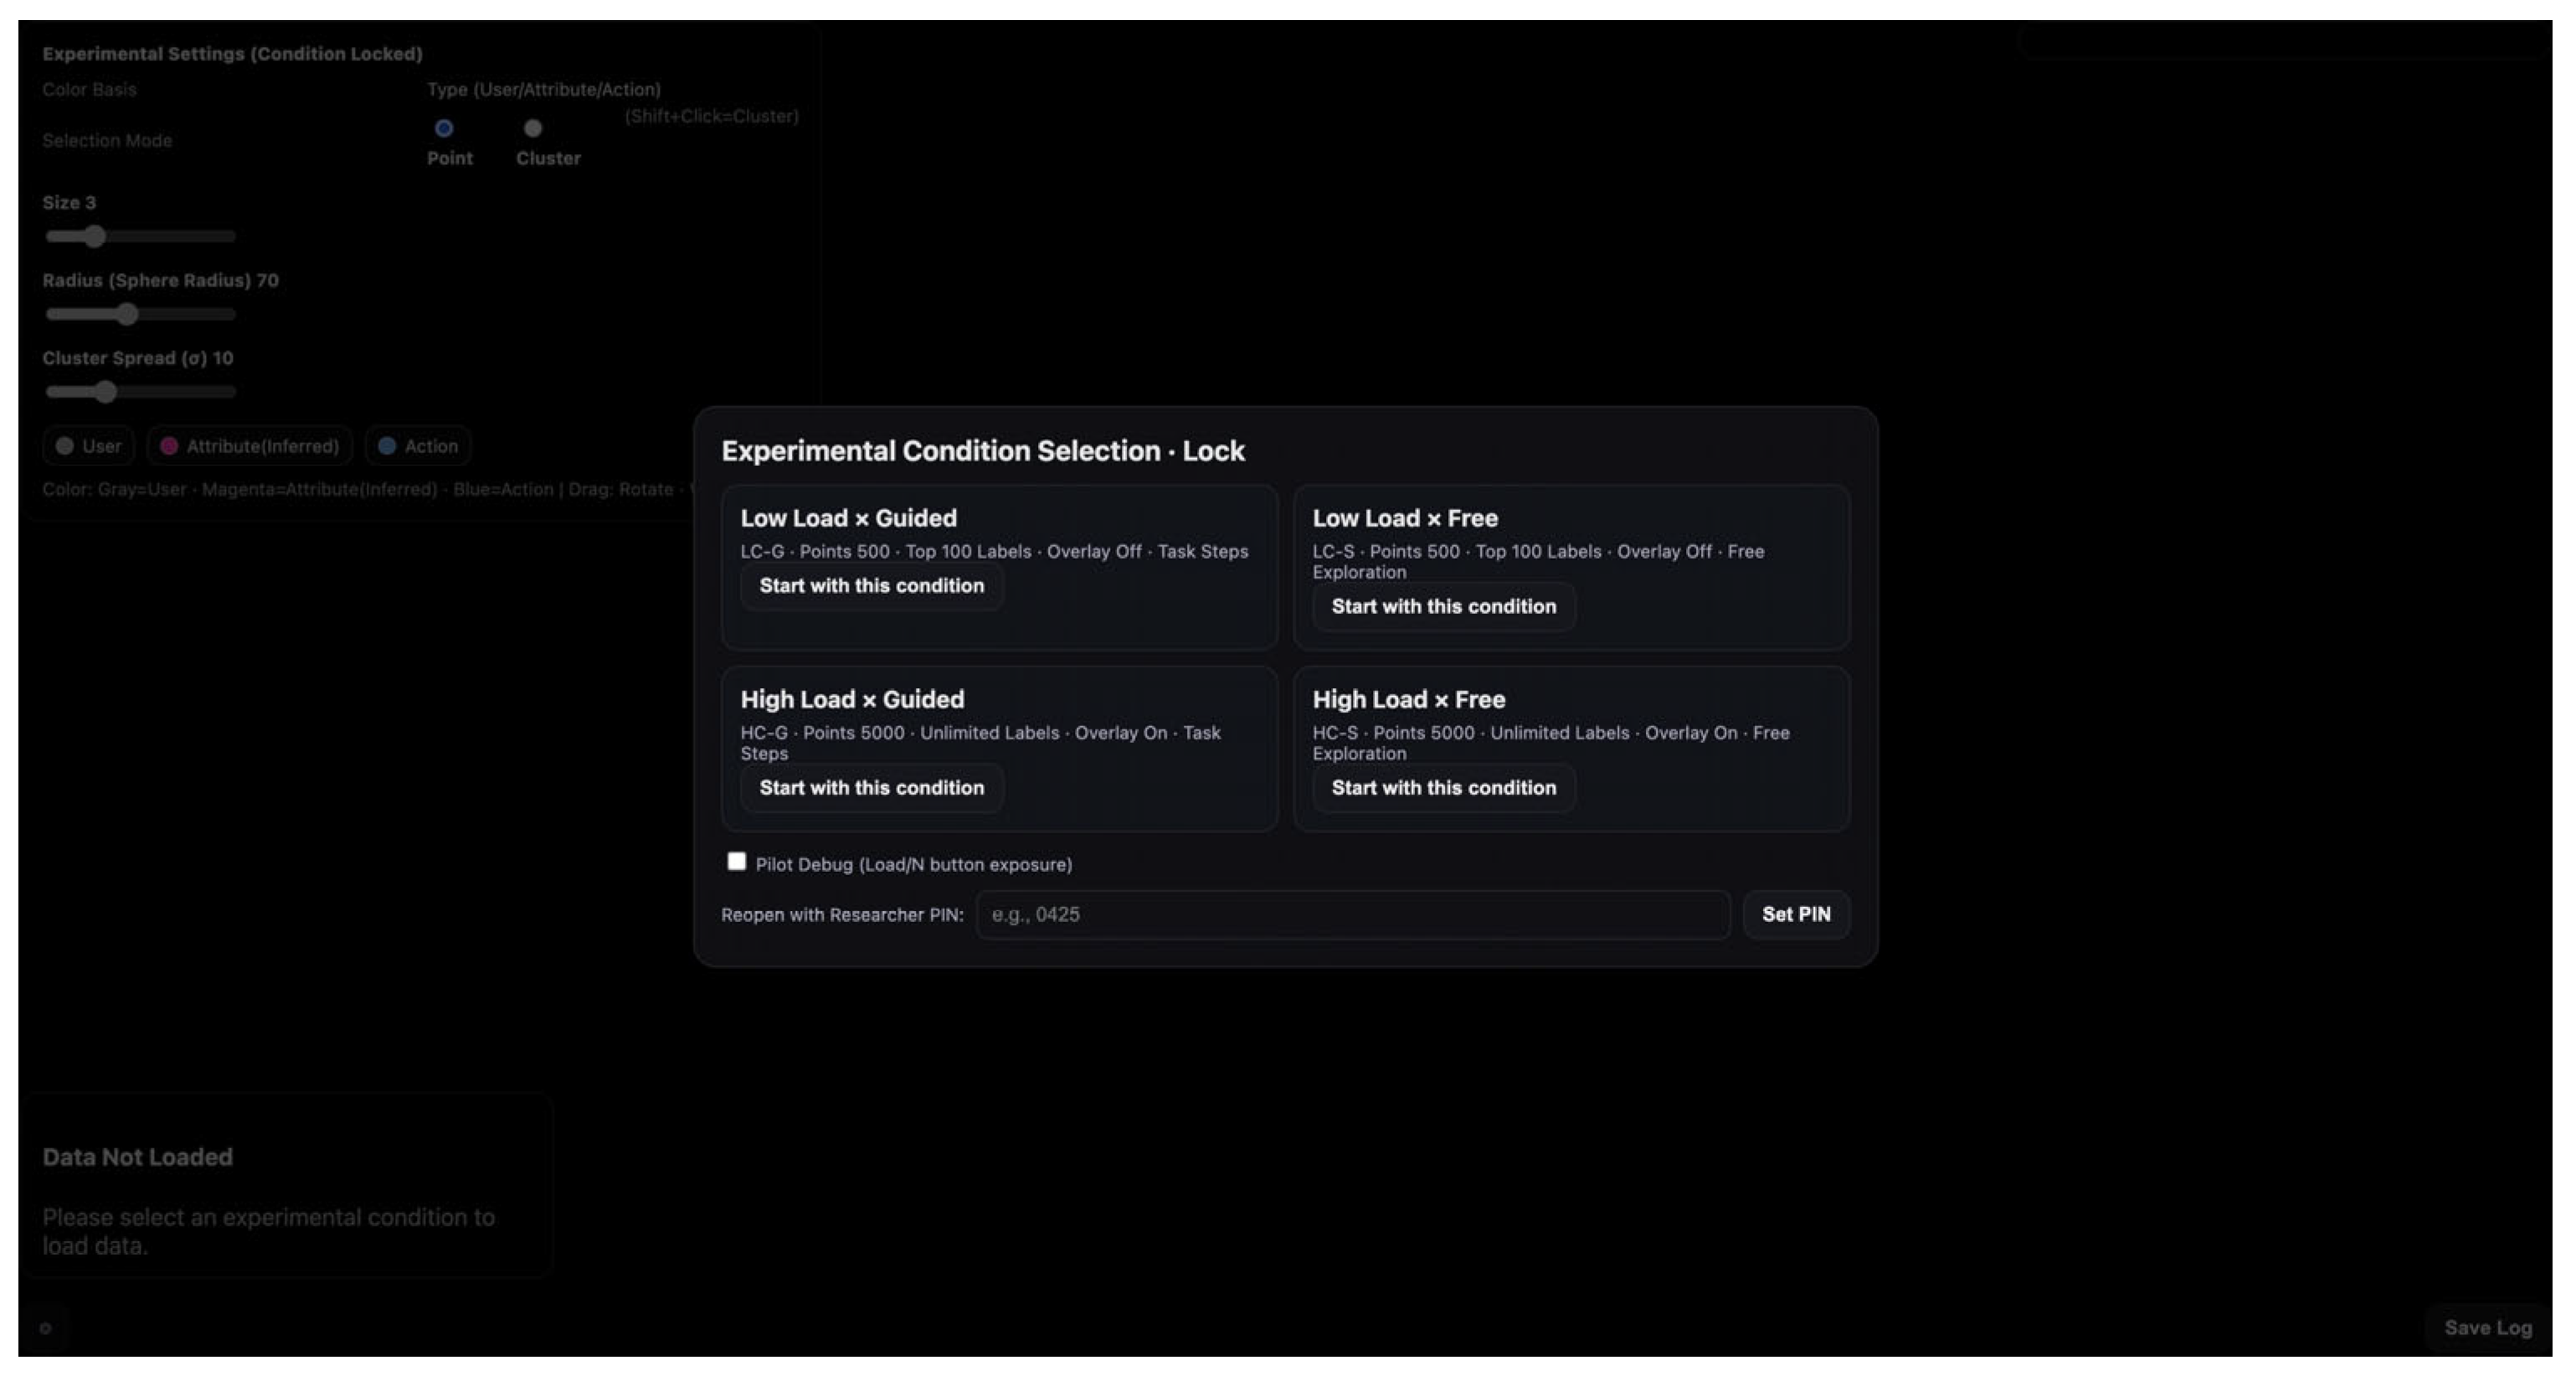
- Worst-case Label Overload Scenario (HC-S; N = 5000 nodes, σ = 35, labelLimit = ∞): Used to benchmark the worst-case visual occlusion and label overload condition. This scenario is contrasted with the Guided/Adaptive mode (HC-G; labelLimit = 500). Table 2 summarizes the reproducibility checklist for the experimental system.
5. Technical Evaluation
5.1. System Performance Benchmark
- Rendering Latency (FPS): Measures the frame rate stability during continuous camera manipulation (Target: >30 FPS).
- Interaction Latency (ms): Measures the delay between a cursor hover event and the display of the corresponding tooltip (Raycasting overhead, Target: <100 ms).
- Visual Clutter Ratio (%): Quantifies the reduction in screen occlusion, defined as the ratio of displayed labels to the total number of visible nodes.
5.2. Ablation Study: Visual Clutter Reduction
6. Result: Semantic Exploration Walkthrough
6.1. System Performance (Quantitative Evaluation)
- -
- Rendering Latency (FPS): As shown in the benchmark results (Table 3), the proposed system maintained a stable 58.2 FPS even under the maximum load (N = 5000), ensuring real-time interactivity. In contrast, the standard mesh-based baseline dropped to 8.5 FPS, resulting in significant interaction lag that disrupts the cognitive flow. This demonstrates that our WebGL-based architecture successfully eliminates the rendering bottleneck, achieving an approximately 7× performance improvement over traditional methods.
- -
- Visual Clutter Reduction: In the ‘Free/Raw’ mode (labelLimit = ∞), the screen suffered from extreme overdraw with 5000 overlapping labels, making individual data points indistinguishable. However, in the ‘Guided/Adaptive’ mode, the system’s Context-Aware Density algorithm effectively filtered 90% of the visual occlusion (limiting visible labels to 500 high-priority nodes). This reduction provided a clear visual structure without compromising the system’s responsiveness or losing the semantic context.
6.2. Case Study: Analyzing Smart Home Behaviors (Qualitative Walkthrough)
7. Discussion
7.1. Comparative Analysis
- Failure of Raw Viewers: Tools like TensorBoard Projector allow for 3D exploration but fail to manage Extraneous Cognitive Load. By rendering all data points with equal weight, they create a “visual noise” that overwhelms the user’s germane processing capabilities. The complexity leads to analysis paralysis.
- Limitation of Standard BI: Conversely, standard dashboards reduce load by aggregating data, but this results in Context Loss. They answer “what” happened but obscure the “why”—the latent semantic relationships captured by embeddings.
- The Proposed Solution: The proposed framework aims to provide a practical interface pattern for high-dimensional embedding exploration by dynamically adjusting information resolution (DP1 & DP3) to mitigate cognitive overload while preserving semantic structure.
7.2. Implications for Explainable AI (XAI)
7.3. Limitations and Validity of Data
8. Conclusions
Author Contributions
Funding
Institutional Review Board Statement
Informed Consent Statement
Data Availability Statement
Conflicts of Interest
References
- Chen, H.-H. Behavior2Vec: Generating Distributed Representations of Users’ Behaviors on Products for Recommender Systems. ACM Trans. Knowl. Discov. Data 2018, 12, 43. [Google Scholar] [CrossRef] [Scilit]
- Wang, Y.; Zhang, Z.; Liu, S. Visual Analytics for Foundation Models: A Survey. IEEE Trans. Vis. Comput. Graph. 2024, 30, 1–20. [Google Scholar] [PubMed]
- Espadoto, M.; Hirata, N.S.T.; Telea, A.C. Quantitative Evaluation of Dimensionality Reduction Techniques for Visual Analysis. IEEE Trans. Vis. Comput. Graph. 2023, 29, 1234–1245. [Google Scholar]
- Keim, D.; Andrienko, G.; Fekete, J.-D.; Görg, C.; Kohlhammer, J.; Melançon, G. Visual Analytics: Definition, Process, and Challenges. In Information Visualization: Human-Centered Issues and Perspectives; Kerren, A., Stasko, J.T., Fekete, J.-D., North, C., Eds.; Lecture Notes in Computer Science; Springer: Berlin/Heidelberg, Germany, 2008; Volume 4950, pp. 154–175. [Google Scholar] [CrossRef] [Scilit]
- Wang, J.; Xu, Z.; Li, Y. A WebGL-Based Interactive Visualization Framework for Large-Scale Urban Seismic Simulations with a Dual Multi-LOD Strategy. Buildings 2025, 15, 2916. [Google Scholar] [CrossRef] [Scilit]
- AboArab, M.A.; Potsika, V.T.; Skalski, A.; Stanuch, M.; Gkois, G.; Koncar, L.; Matejevic, D.; Theodorou, A.; Vagena, S.; Sigala, F.; et al. DECODE-3DViz: Efficient WebGL-Based High-Fidelity Visualization of Large-Scale Images using Level of Detail and Data Chunk Streaming. J. Imaging Inform. Med. 2025, 38, 4148–4166. [Google Scholar] [CrossRef] [Scilit]
- Boutsi, A.-M.; Ioannidis, C.; Verykokou, S. Multi-Resolution 3D Rendering for High-Performance Web AR. Sensors 2023, 23, 6885. [Google Scholar] [CrossRef] [Scilit]
- Rave, H.; Molchanov, V.; Linsen, L. De-Cluttering Scatterplots With Integral Images. IEEE Trans. Vis. Comput. Graph. 2025, 31, 2114–2126. [Google Scholar] [CrossRef] [Scilit]
- Chen, L.; Liu, Z.; Ma, M. Interactive Visualization of Geographic Vector Big Data Based on Viewport Generalization Model. Appl. Sci. 2022, 12, 7710. [Google Scholar] [CrossRef] [Scilit]
- Mikolov, T.; Sutskever, I.; Chen, K.; Corrado, G.S.; Dean, J. Distributed Representations of Words and Phrases and Their Compositionality. In Advances in Neural Information Processing Systems 26 (NIPS 2013); Burges, C.J.C., Bottou, L., Welling, M., Ghahramani, Z., Weinberger, K.Q., Eds.; Curran Associates, Inc.: Red Hook, NY, USA, 2013; pp. 3111–3119. [Google Scholar]
- Tennenholtz, G.; Chow, Y.; Hsu, C.-W.; Jeong, J.; Shani, L.; Tulepbergenov, A.; Ramachandran, D.; Mladenov, M.; Boutilier, C. Demystifying Embedding Spaces using Large Language Models. In Proceedings of the International Conference on Learning Representations (ICLR 2024), Vienna, Austria, 7–11 May 2024. [Google Scholar]
- Xue, Y.; Paetzold, P.; Kehlbeck, R.; Chen, B.; Kwan, K.C.; Wang, Y.; Deussen, O. Reducing Ambiguities in Line-Based Density Plots by Image-Space Colorization. IEEE Trans. Vis. Comput. Graph. 2024, 30, 825–835. [Google Scholar] [CrossRef] [Scilit] [PubMed]
- McInnes, L.; Healy, J.; Saul, N.; Großberger, L. UMAP: Uniform Manifold Approximation and Projection. J. Open Source Softw. 2018, 3, 861. [Google Scholar] [CrossRef] [Scilit]
- van der Maaten, L.; Hinton, G. Visualizing Data using t-SNE. J. Mach. Learn. Res. 2008, 9, 2579–2605. [Google Scholar]
- Sweller, J. Cognitive Load During Problem Solving: Effects on Learning. Cogn. Sci. 1988, 12, 257–285. [Google Scholar] [CrossRef]
- Ellis, G.; Dix, A. A taxonomy of clutter reduction for information visualisation. IEEE Trans. Vis. Comput. Graph. 2007, 13, 1216–1223. [Google Scholar] [CrossRef] [Scilit]
- Lam, H. A Framework of Interaction Costs in Information Visualization. IEEE Trans. Vis. Comput. Graph. 2008, 14, 1149–1156. [Google Scholar] [CrossRef] [PubMed]
- Yi, J.S.; Kang, Y.A.; Stasko, J.T.; Jacko, J.A. Toward a Deeper Understanding of the Role of Interaction in Information Visualization. IEEE Trans. Vis. Comput. Graph. 2007, 13, 1224–1231. [Google Scholar] [CrossRef] [Scilit]
- Heer, J.; Shneiderman, B. Interactive Dynamics for Visual Analysis. Commun. ACM 2012, 55, 45–54. [Google Scholar] [CrossRef] [Scilit]
- Kim, J.; Lee, S.; Jeon, H.; Lee, K.-J.; Bae, H.-J.; Kim, B.; Seo, J. PhenoFlow: A Human-LLM Driven Visual Analytics System for Exploring Large and Complex Stroke Datasets. IEEE Trans. Vis. Comput. Graph. 2025, 31, 470–480. [Google Scholar] [CrossRef] [Scilit] [PubMed]
- Alsayahani, H.; Alhamadi, M.; Harper, S.; Vigo, M. The Effects of Customisation on the Usability of Visual Analytics Dashboards: The Good, the Bad, and the Ugly. In Proceedings of the 30th International Conference on Intelligent User Interfaces (IUI ‘25); ACM: New York, NY, USA, 2025; pp. 1426–1439. [Google Scholar] [CrossRef] [Scilit]
- Liu, Z.; Heer, J. The Effects of Interactive Latency on Exploratory Visual Analysis. IEEE Trans. Vis. Comput. Graph. 2014, 20, 2122–2131. [Google Scholar] [CrossRef] [Scilit]
- Deci, E.L.; Ryan, R.M. The general causality orientations scale: Self-determination in personality. J. Res. Pers. 1985, 19, 109–134. [Google Scholar] [CrossRef] [Scilit]
- Vansteenkiste, M.; Ryan, R.M. On psychological growth and vulnerability: Basic psychological need satisfaction and need frustration as a unifying principle. J. Psychother. Integr. 2013, 23, 263–280. [Google Scholar] [CrossRef] [Scilit]
- Shneiderman, B. The Eyes Have It: A Task by Data Type Taxonomy for Information Visualizations. In Proceedings of the IEEE Symposium on Visual Languages, Boulder, CO, USA, 3–6 September 1996; IEEE: New York, NY, USA, 1996; pp. 336–343. [Google Scholar] [CrossRef] [Scilit]
- Clauset, A.; Shalizi, C.R.; Newman, M.E.J. Power-Law Distributions in Empirical Data. SIAM Rev. 2009, 51, 661–703. [Google Scholar] [CrossRef] [Scilit]
- Rosenholtz, R.; Li, Y.; Mansfield, J.; Jin, Z. Feature Congestion: A Measure of Display Clutter. In Proceedings of the SIGCHI Conference on Human Factors in Computing Systems (CHI ’05), Portland, OR, USA, 2–7 April 2005; ACM: New York, NY, USA, 2005; pp. 761–770. [Google Scholar] [CrossRef] [Scilit]
- Eiband, M.; Schneider, H.; Bilandzic, M.; Fazekas-Con, J.; Haug, M.; Hussmann, H. Bringing Transparency Design into Practice. In Proceedings of the 23rd International Conference on Intelligent User Interfaces (IUI ’18), Tokyo, Japan, 7–11 March 2018; ACM: New York, NY, USA, 2018; pp. 211–223. [Google Scholar] [CrossRef] [Scilit]
- Schmidt, P.; Biessmann, F.; Teubner, T. Transparency and Trust in Artificial Intelligence Systems. J. Decis. Syst. 2020, 29, 260–278. [Google Scholar] [CrossRef] [Scilit]
- La Rosa, B.; Blasilli, G.; Bourqui, R.; Auber, D.; Santucci, G.; Capobianco, R.; Bertini, E.; Giot, R.; Angelini, M. State of the Art of Visual Analytics for Explainable Deep Learning. Comput. Graph. Forum 2023, 42, 319–355. [Google Scholar] [CrossRef] [Scilit]
- Sacha, D.; Senaratne, H.; Kwon, B.C.; Ellis, G.; Keim, D.A. The Role of Uncertainty, Awareness, and Trust in Visual Analytics. IEEE Trans. Vis. Comput. Graph. 2016, 22, 240–249. [Google Scholar] [CrossRef] [Scilit] [PubMed]



| Data Characteristic | Real-World Complexity (Literature Ref.) | Synthetic Parameter Configuration | Technical Justification for System Evaluation |
|---|---|---|---|
| Distribution Skewness | Power-Law (Long-tail) Most actions are rare; a few are dominant (e.g., ‘Fridge Open’) | Zipf’s Law Distribution | To verify if the rendering engine handles visual occlusion in dense clusters while preserving visibility of rare tail-events. |
| Cluster Ambiguity | High Semantic Overlap: Behavioral boundaries are often fuzzy (e.g., Cooking vs. Cleaning) | Gaussian Mixture Model (High Variance) Standard Deviation σ = 35.0 (High Load) | To stress-test the ‘Context-Aware Density’ (DP1) algorithm under conditions of extreme spatial ambiguity (overlapping coordinates). |
| Data Volatility | Sensor Noise & Outliers: Erratic IoT signals or logging errors | Uniform Random Noise Injection Noise Ratio ϵ = 15% of total nodes | To demonstrate the robustness of the ‘Scaffolded Navigation’ (DP2) when users encounter non-semantic visual artifacts. |
| Dimensionality | High-Dimensional Embeddings: Latent vectors from deep learning models | Surrogate 3D layout calibrated to emulate overlap patterns observed after manifold projection (e.g., UMAP [13]); the reproduction package benchmarks rendering/label bottlenecks under controlled spatial density rather than claiming metric-faithful DR reconstruction. | Ensures the spatial topology mirrors the complexity of actual manifold learning outputs, rather than random Cartesian coordinates. |
| Data Scale | Scalability Requirements: Smart home logs accumulate rapidly over time | Variable Node Count (N): N_low = 500 to N_high = 5000 | To benchmark rendering latency (FPS) and interaction lag across varying orders of magnitude. |
| Component | Parameter/Configuration | Value/Description |
|---|---|---|
| Visualization | Library | Three.js (r160) |
| Camera Configuration | PerspectiveCamera (FOV: 50, Near: 0.1, Far: 5000) | |
| Controls | OrbitControls with Damping (Factor: 0.05) | |
| Data Generation | Synthetic Clusters (K) | 4 (Nocturnal, Family, Regular, Light Usage) |
| Distribution Model | Gaussian (Sample in Ball) | |
| Random Seed | seed = 42 (Linear Congruential Generator) | |
| Exp. Conditions | Low Load (LC) | N = 500, labelLimit = 20, size = 3.0, sigma = 10 |
| High Load (HC) | N = 5000, labelLimit = Variable (500 or ∞), size = 3.6, sigma = 35 | |
| Interaction | Selection Radius | 16 pixels (Screen Space) |
| Event Handling | PointerMove (Raycasting on buffer attributes) |
| Metric | Condition | Low Load (N = 500) | High Load (N = 5000) | Threshold |
|---|---|---|---|---|
| Average FPS | Optimized (Points) | 58.2 fps | 58.2 fps | >30 FPS |
| Standard (Mesh) | 60.0 fps | 8.5 fps | ||
| Initial Loading | Optimized (Points) | <10 ms | 120 ms | <5000 ms |
| Standard (Mesh) | 120 ms | 4500 ms | - |
| Metric | Free Mode (HC-S) | Guided Mode (HC-G) | Reduction Ratio |
|---|---|---|---|
| Total Points | 5000 | 5000 | 0% |
| Visible Labels | 5000 (Overlapping) | 500 (Top-k) | 90% |
| Active Tooltips | Unrestricted | Context Dependent | - |
| Interaction Focus | Global | Task-Specific | - |
Disclaimer/Publisher’s Note: The statements, opinions and data contained in all publications are solely those of the individual author(s) and contributor(s) and not of MDPI and/or the editor(s). MDPI and/or the editor(s) disclaim responsibility for any injury to people or property resulting from any ideas, methods, instructions or products referred to in the content. |
© 2026 by the authors. Licensee MDPI, Basel, Switzerland. This article is an open access article distributed under the terms and conditions of the Creative Commons Attribution (CC BY) license.
Share and Cite
Jo, J.; Choi, J. High-Performance WebGL-Based Visual Analytics Framework for Large-Scale Behavioral Embeddings: System Architecture and Rendering Optimization. Appl. Sci. 2026, 16, 3307. https://doi.org/10.3390/app16073307
Jo J, Choi J. High-Performance WebGL-Based Visual Analytics Framework for Large-Scale Behavioral Embeddings: System Architecture and Rendering Optimization. Applied Sciences. 2026; 16(7):3307. https://doi.org/10.3390/app16073307
Chicago/Turabian StyleJo, Junghee, and Junho Choi. 2026. "High-Performance WebGL-Based Visual Analytics Framework for Large-Scale Behavioral Embeddings: System Architecture and Rendering Optimization" Applied Sciences 16, no. 7: 3307. https://doi.org/10.3390/app16073307
APA StyleJo, J., & Choi, J. (2026). High-Performance WebGL-Based Visual Analytics Framework for Large-Scale Behavioral Embeddings: System Architecture and Rendering Optimization. Applied Sciences, 16(7), 3307. https://doi.org/10.3390/app16073307