


Abstract
In the automotive industry, the most critical factor affecting dimensional stability during the forming of Advanced High-Strength Steels (AHSSs) is the springback phenomenon. This study systematically investigates the springback behavior of four distinct dual-phase steel grades (DP450, DP600, DP800, and DP1000) in U-shaped body-in-white (BIW) structures across 180 distinct scenarios. The experimental design varied sheet thicknesses (1.2, 1.6, 2 mm), die clearance angles (5°, 10°, 15°), and bending radii (R6, R8, R10, R12, R14). Numerical simulations using Autoform R8 were validated against Atos 3D optical scanning data, achieving values exceeding 0.90 for all grades. Quantitative validation metrics showed exceptional fidelity for lower-strength grades with error margins below 1.1%, while the maximum deviation was limited to 3.1% for the ultra-high-strength DP1000 grade. The findings demonstrate that while increasing material strength substantially intensifies springback, the strategic augmentation of sheet thickness and optimization of die radius effectively mitigate these deviations, thereby enhancing process stability.
1. Introduction
The automotive industry has placed significant emphasis on sustainable lightweighting strategies, with the objective of adhering to global emission standards and enhancing fuel efficiency [1,2,3,4]. This strategic shift has necessitated the use of Advanced High-Strength Steels (AHSSs), which replace traditional steels and offer a high strength-to-weight ratio [5,6,7,8,9]. In the field of AHSSs, dual-phase (dual phase—DP) steels have emerged as the preferred material group within automotive body-in-white (BIW) structures. These steels possess a microstructure characterized by the presence of hard martensite islands dispersed within a soft ferrite matrix. The superior tensile strength and energy absorption capacity exhibited by these steels have led to their widespread adoption in automotive applications [10,11]. However, the most fundamental technical obstacle encountered in cold forming processes of DP steels is the springback phenomenon, which is caused by internal stresses within the material when the forming force is removed [12,13,14,15]. Springback is a critical quality control problem that compromises the dimensional accuracy of the part removed from the die, leading to assembly errors and a dramatic increase in die design costs [16,17].
A review of the extant literature reveals that research on the prediction and control of creep can be grouped into three main categories: advanced constitutive modeling studies, statistical optimization methods, and experimental parameter analyses. In the domain of constitutive modeling, it has been noted that classical isotropic hardening models are inadequate for the precise prediction of creep. Consequently, the development of advanced models capable of capturing stress imbalance and the Bauschinger effect during load removal is imperative. The two-surface kinematic hardening model developed by Yoshida and Uemori (Y-U) is widely regarded as one of the most successful approaches for modeling the behavior of AHSS sheets under cyclic loading and changes in chord modulus, which decreases with plastic deformation [18,19,20,21]. In recent work, Lee et al. [22] investigated the role of strength difference (SD) and nonlinear loading path (NLLP) effects in the prediction of springback in martensitic steels, reporting that including complex phase interactions in the model improves accuracy. In a similar vein, Liu et al. [23] employed machine learning algorithms to model the Bauschinger effect in QP steels with a strength of 1500 MPa over a broad strain range. This approach enhanced the accuracy of FE simulations by 42%, thereby demonstrating the potential for advanced methodologies in enhancing the precision of material modeling. Furthermore, Zhang and Lou [24] investigated the effects of varying plastic behavior of sheet material under different stress states on elastic recovery analysis and reported that considering yield surface deformations increases prediction accuracy. Hajiahmadi and colleagues [25] compared different constitutive models for perforated U-shaped profiles during the roll forming process and emphasized that the selectivity of the material model is critical in the complex deformation paths of AHSSs.
In research focused on statistical and process optimization, techniques such as Response Surface Methodology (RSM) and Analysis of Variance (ANOVA) are frequently employed to comprehend the interaction of process parameters [26,27,28]. Mithu and colleagues [28] demonstrated that the load applied and the duration of the loading process during V-bending operations have a stabilizing effect on springback, thereby reducing dimensional error. In their study, Wasif et al. [29] employed machine learning techniques, including gradient boosting and random forest, to predict the springback angle in high-strength steels. Their findings indicated that the LightGBM model offered the optimal alignment between the model’s predictions and the experimental data. Sathish [30] employed the GAC-ANN (Genetic Algorithm–Artificial Neural Network) technique to predict the springback effect in sheet metal bending operations, achieving a higher prediction accuracy compared to traditional ANN approaches. Srinivasan and colleagues [31] optimized parameter interactions in air bending operations using the Response Surface Method (RSM) and developed regression models for industrial processes.
The focal point of experimental studies has been restricted alterations in mold geometry and material thickness. In their study, Karabulut and Esen [32] exclusively focused on SCGA1180DUB material with a thickness of 0.8 mm, conducting analyses based on specific wall angles and limited mold radii. In a similar vein, Pritima and colleagues [33] based their research solely on the bending behavior of AISI 1045 sheet metal, while Esener and colleagues evaluated only 0.8 mm thick SP600 material in their parameter sensitivity analyses [34]. Wasif and colleagues [35] limited their optimization studies aimed at reducing springback to JSC-590 sheet metals only; Rahdiana and colleagues [36] analyzed the characteristics of high-strength stainless steels in V-bending processes only. While these studies offer valuable data for specific material groups, a significant portion of extant experimental research in the literature has either concentrated on a single material grade or been constrained to a limited set of geometric parameters. There is still a need for comprehensive, high-volume data sets that systematically compare steel sheets of different strength classes under the same experimental setup, sheet thickness, and die geometry.
The primary value of this study lies in its examination of the springback behavior of four distinct DP grades (DP450, DP600, DP800, and DP1000) in U-shaped components commonly utilized in the automotive industry across a broad parametric spectrum. In the course of the study, a total of 180 distinct scenarios were analyzed using three different sheet thicknesses (1.2, 1.6, 2 mm), three different die angles (5°, 10°, 15°), and five different radius values (R6, R8, R10, R12, R14). Finite element analyses (FEAs) performed using Autoform R8 software (AutoForm Engineering GmbH, Pfäffikon, Switzerland) were directly validated with Atos 3D optical scanning data, and the findings were statistically evaluated using Minitab. This systematic approach furnishes automotive designers with a comprehensive design guide and an industrial solution set, thereby enabling direct comparison of the springback characteristics of DP steels at different strength levels.
While the springback characteristics of individual high-strength steel grades have been documented, there is a paucity of comparative data across different strength levels under identical experimental conditions [32,33,36]. As recent reviews have highlighted, predicting springback in Advanced High-Strength Steels (AHSSs) remains a complex challenge due to the interplay between microstructure and geometry [37]. To situate the present research within the existing academic landscape, a comparative summary of key previous studies on AHSS springback, including their material grades and modeling approaches, is provided in Table 1. According to Table 1, the present study is distinctive in that it provides a comprehensive evaluation of a broad spectrum of automotive dual-phase steels (DP450, DP600, DP800, and DP1000) across 180 distinct forming scenarios. This research establishes a robust parametric framework for body-in-white (BIW) design by systematically varying sheet thicknesses (1.2, 1.6, 2 mm), die angles (5°, 10°, 15°), and bending radii (R6, R8, R10, R12, R14). Finite element analyses (FEAs) were performed using Autoform R8 software and directly validated with Atos 3D optical scanning data. The statistical significance of the process parameters and the analysis of variance (ANOVA) were performed using Minitab v21.1 (Minitab LLC, State College, PA, USA). This systematic approach furnishes automotive designers with a comprehensive design guide and an industrial solution set, moving beyond the isolated grade analyses common in the existing literature.
Table 1.
Summary and comparison of key previous studies on AHSS springback characteristics in the literature.
2. Materials and Methods
This study entailed the execution of a series of experiments, which were designed to investigate the springback behavior of U-shaped dual-phase (DP) sheet materials that are frequently utilized in the automotive industry. The experiments were performed on DP sheet materials with varying thicknesses, qualities, and die parameters [40].
2.1. Experimental Specimens
The present study investigates the springback behavior of sheet materials of varying qualities during the stamping process. This investigation is conducted through a combination of experimental and numerical methods. In the experimental phase, material quality, material thickness, mold opening angle and die and punch radius were designated as variables. The chemical compositions of the sheet materials utilized in the experiments are enumerated in Table 2. The experiments were conducted using sheet materials of DP450, DP600, DP800, and DP1000 quality, with thicknesses of 1.2 mm, 1.6 mm, and 2 mm, respectively. These materials are dual-phase steels that are frequently utilized in the automotive industry due to their high strength and formability properties. The sheet samples were prepared using the laser cutting method in dimensions of 100 × 500 mm.
Table 2.
Chemical compositions of the sheet materials used (wt%).
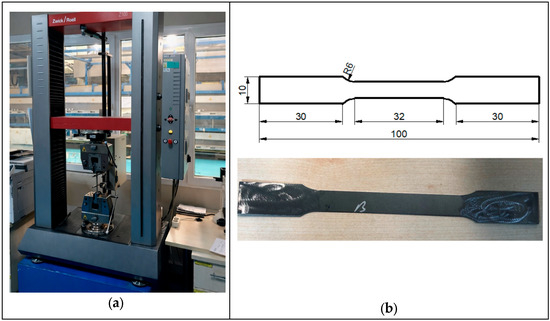
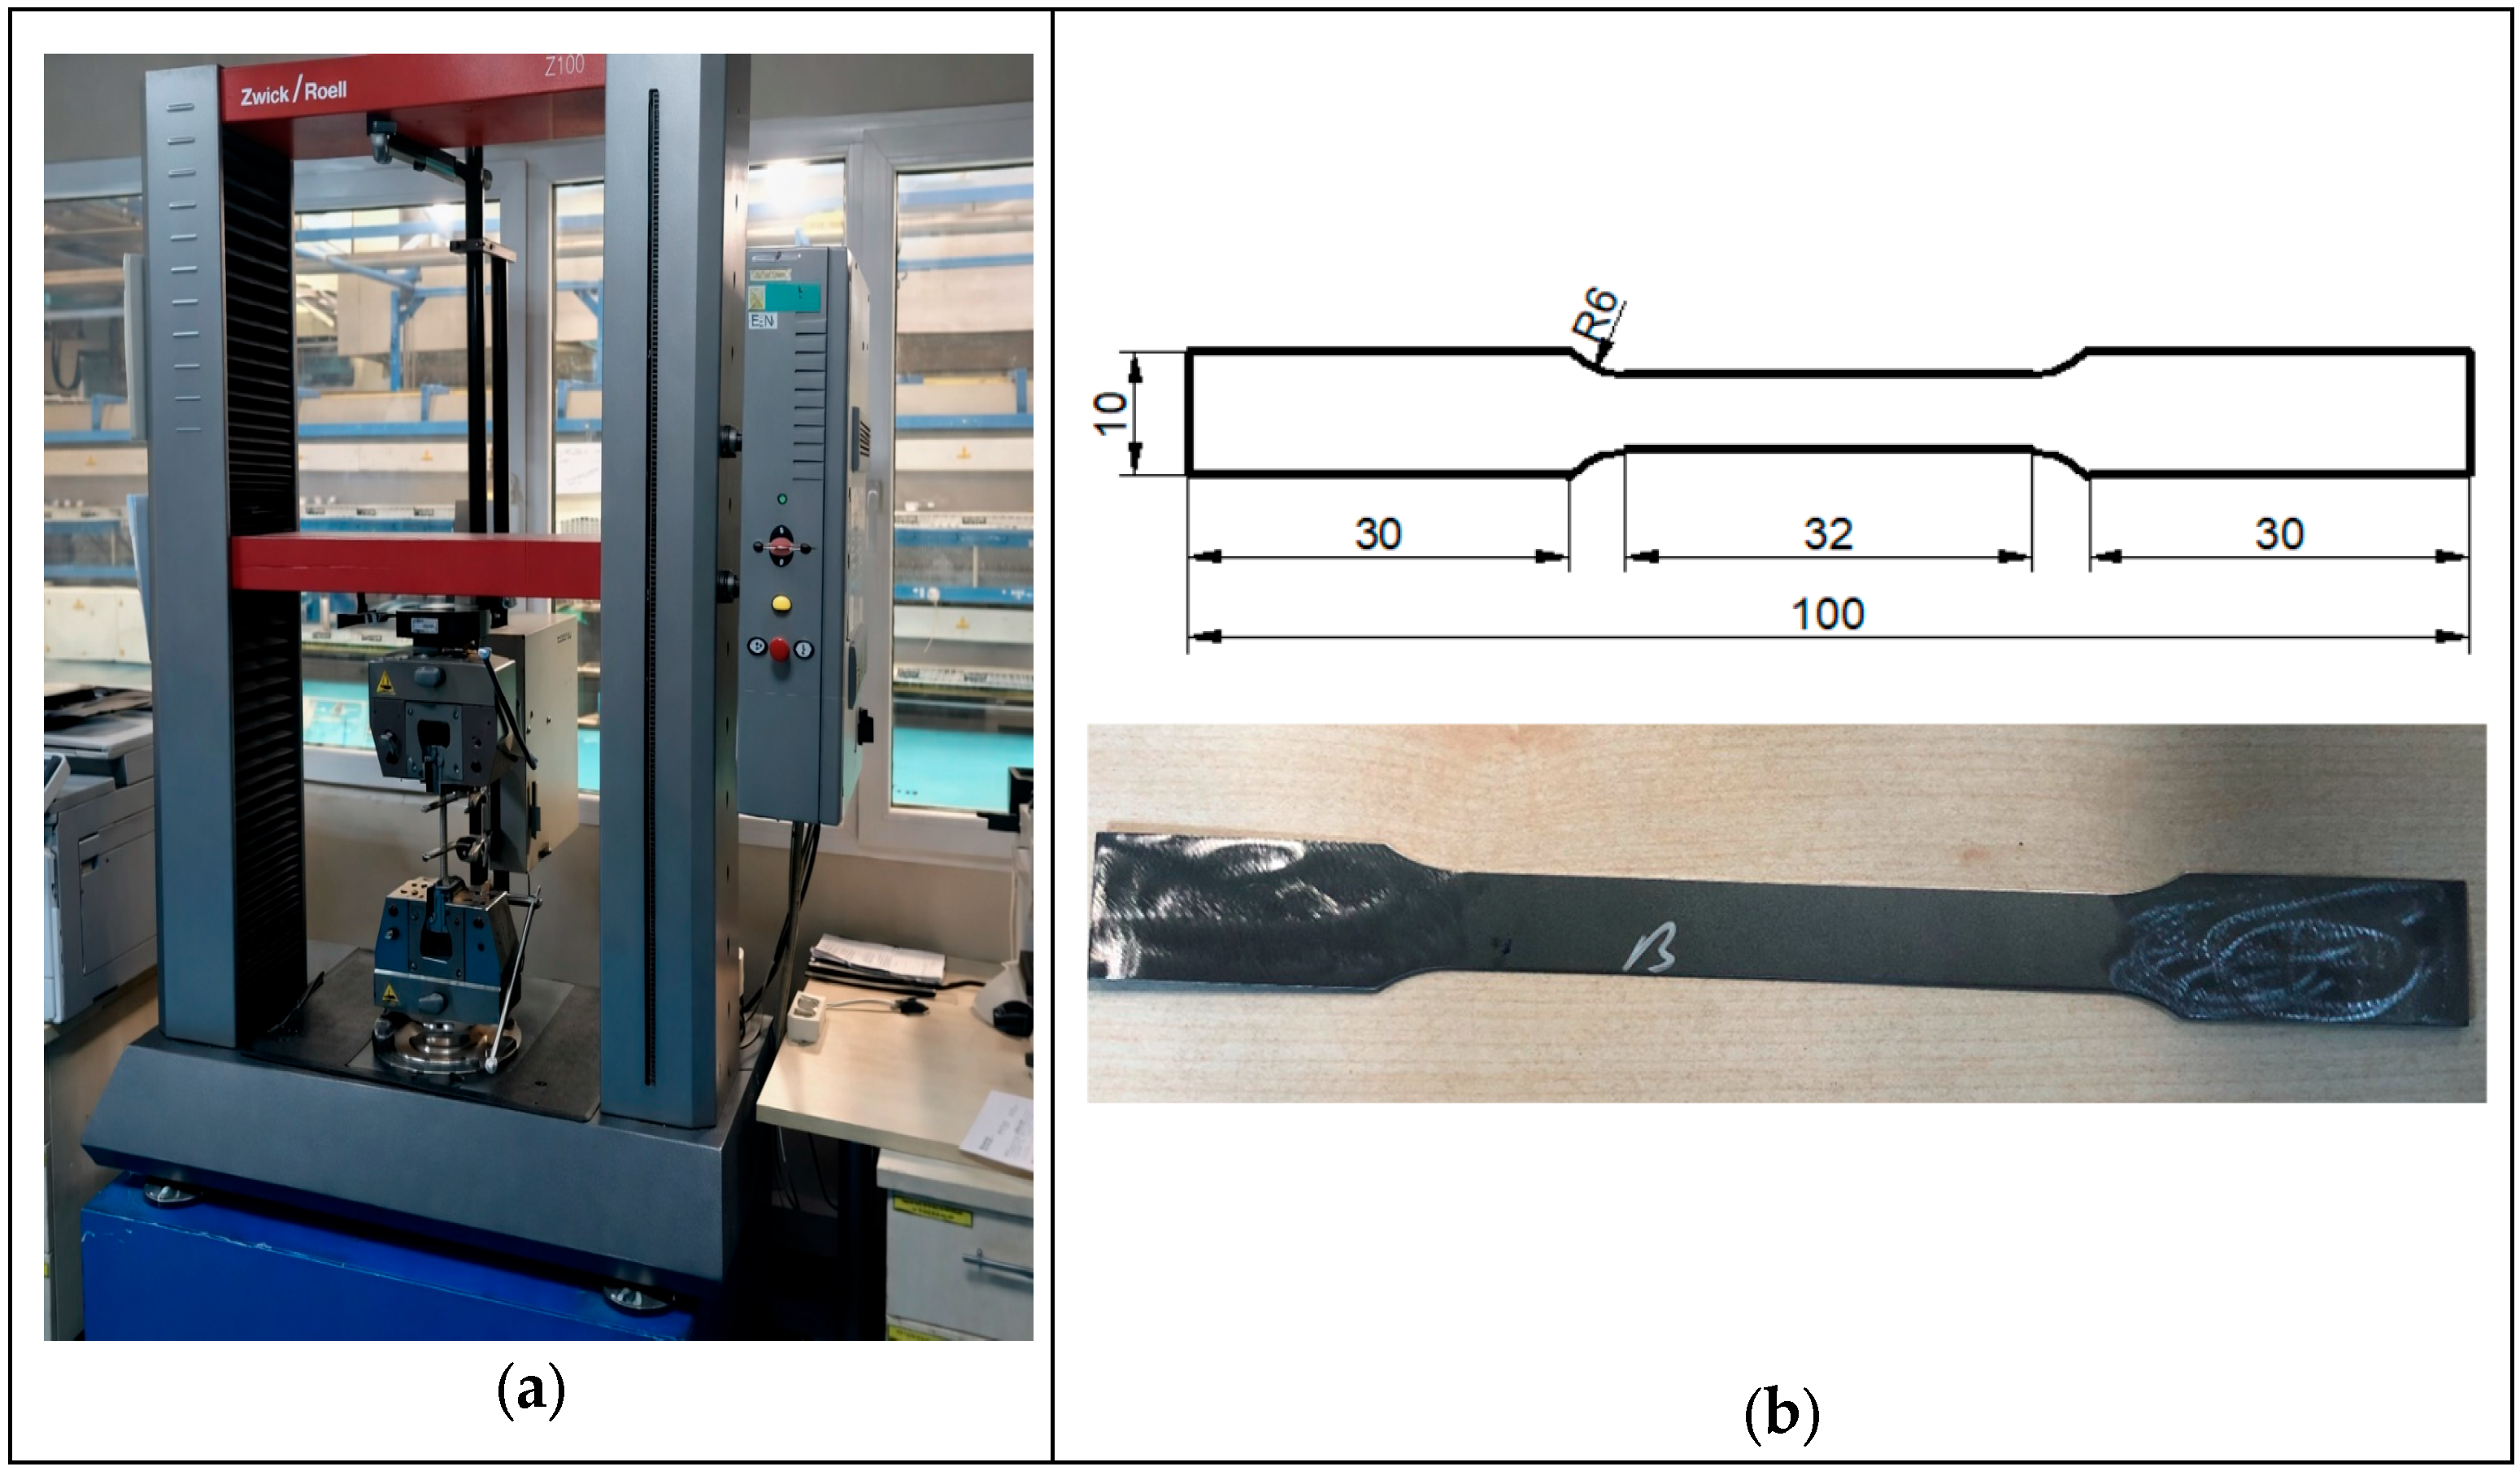
The mechanical properties of the sheet materials were determined through the implementation of tensile tests, which were conducted at a rate of 10 mm/min using a Zwick Z100 tensile testing machine (ZwickRoell GmbH & Co. KG, Ulm, Germany) with a capacity of 100 kN (see Figure 1a). The specimens utilized in the experimental procedures were meticulously prepared for tensile testing in accordance with the stringent standards outlined in the ASTM-E8 standard [41] (see Figure 1b). The mechanical properties obtained as a result of the tests are listed in Table 3. To confirm the material limits and ensure accurate characterization, all uniaxial tensile tests were conducted until final fracture.
Figure 1.
(a) Zwick Z100 tensile testing machine. (b) Test specimen and dimensions according to ASTM-E8 standard.
Table 3.
Mechanical properties of the sheet materials used.
2.2. Mold and Test Setup
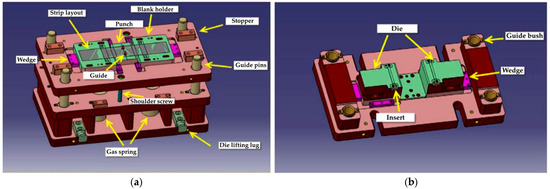
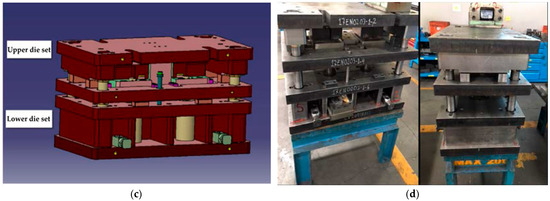
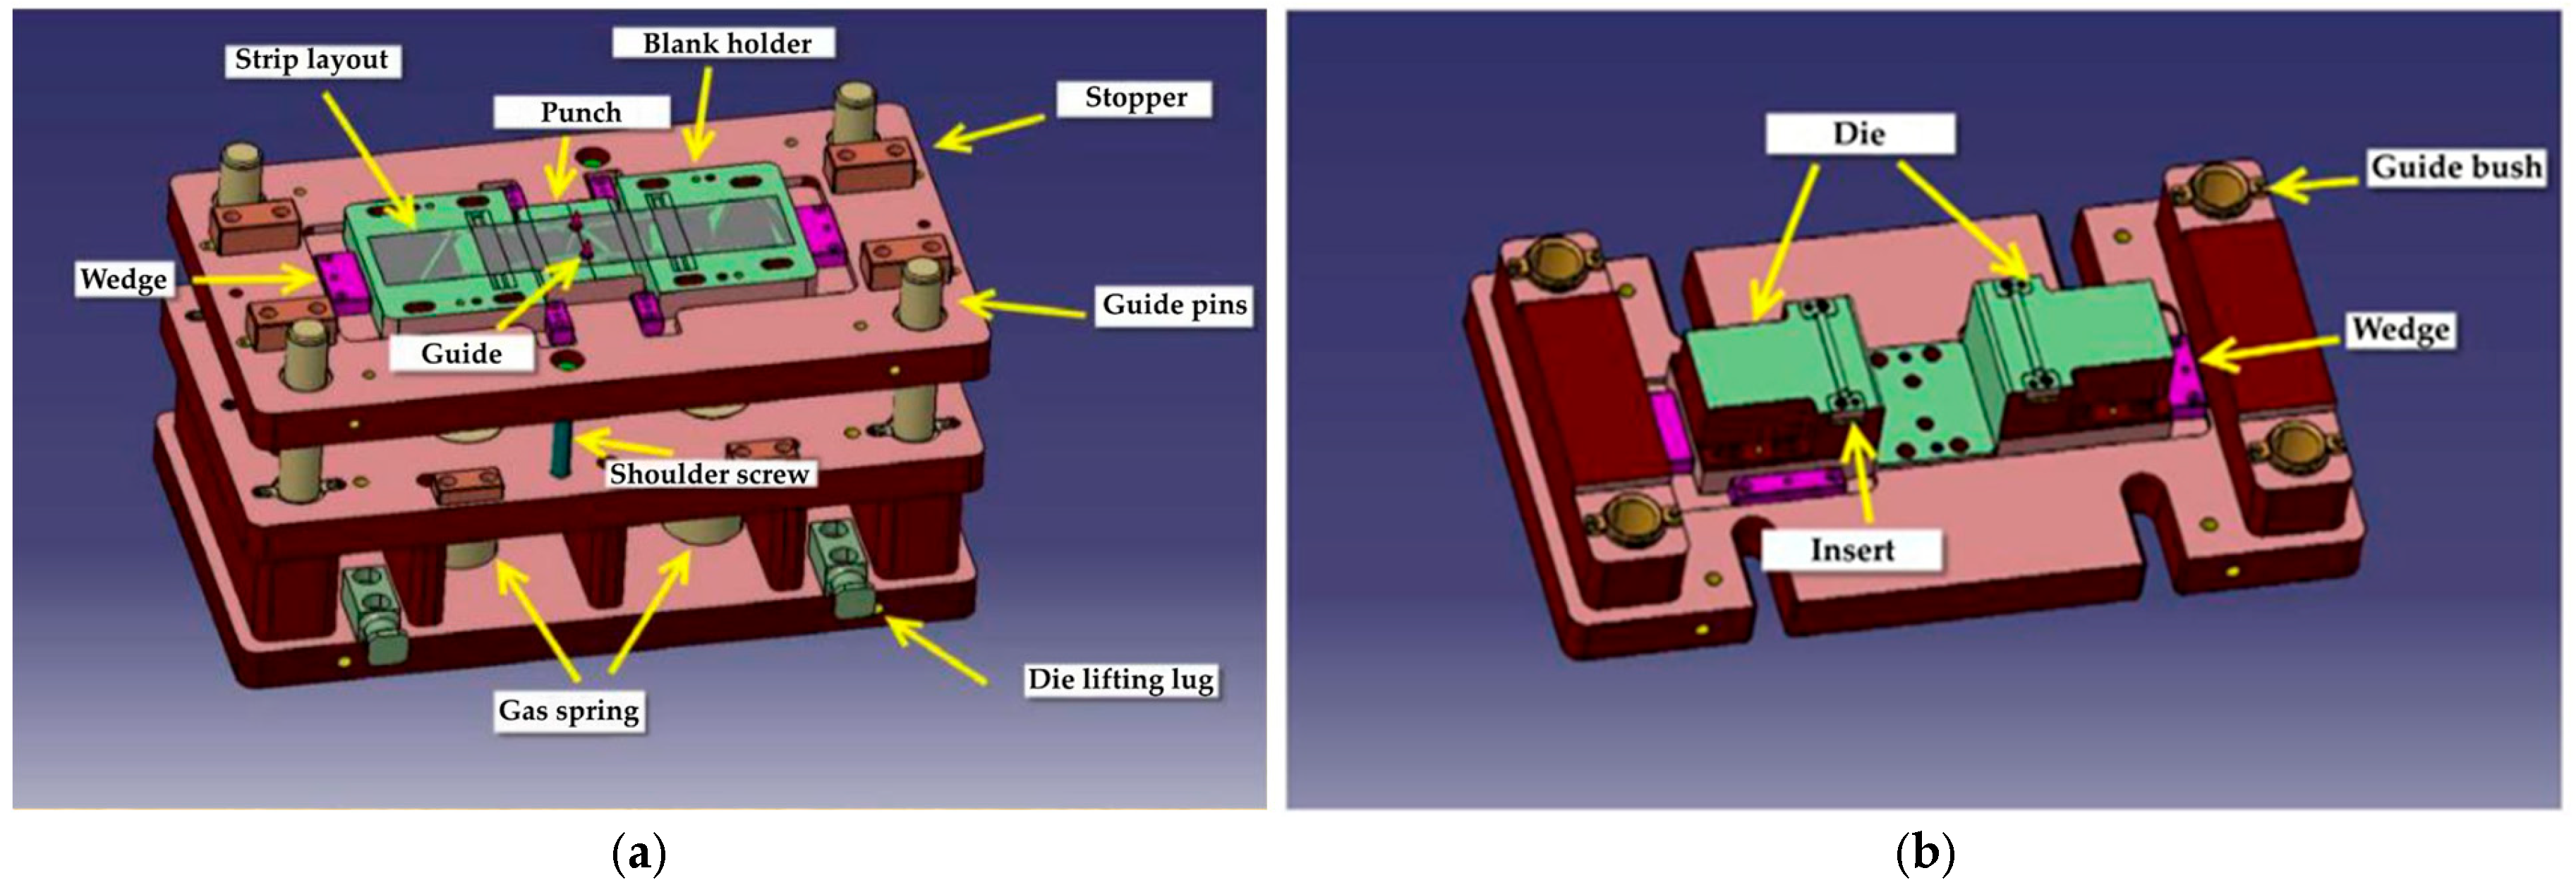
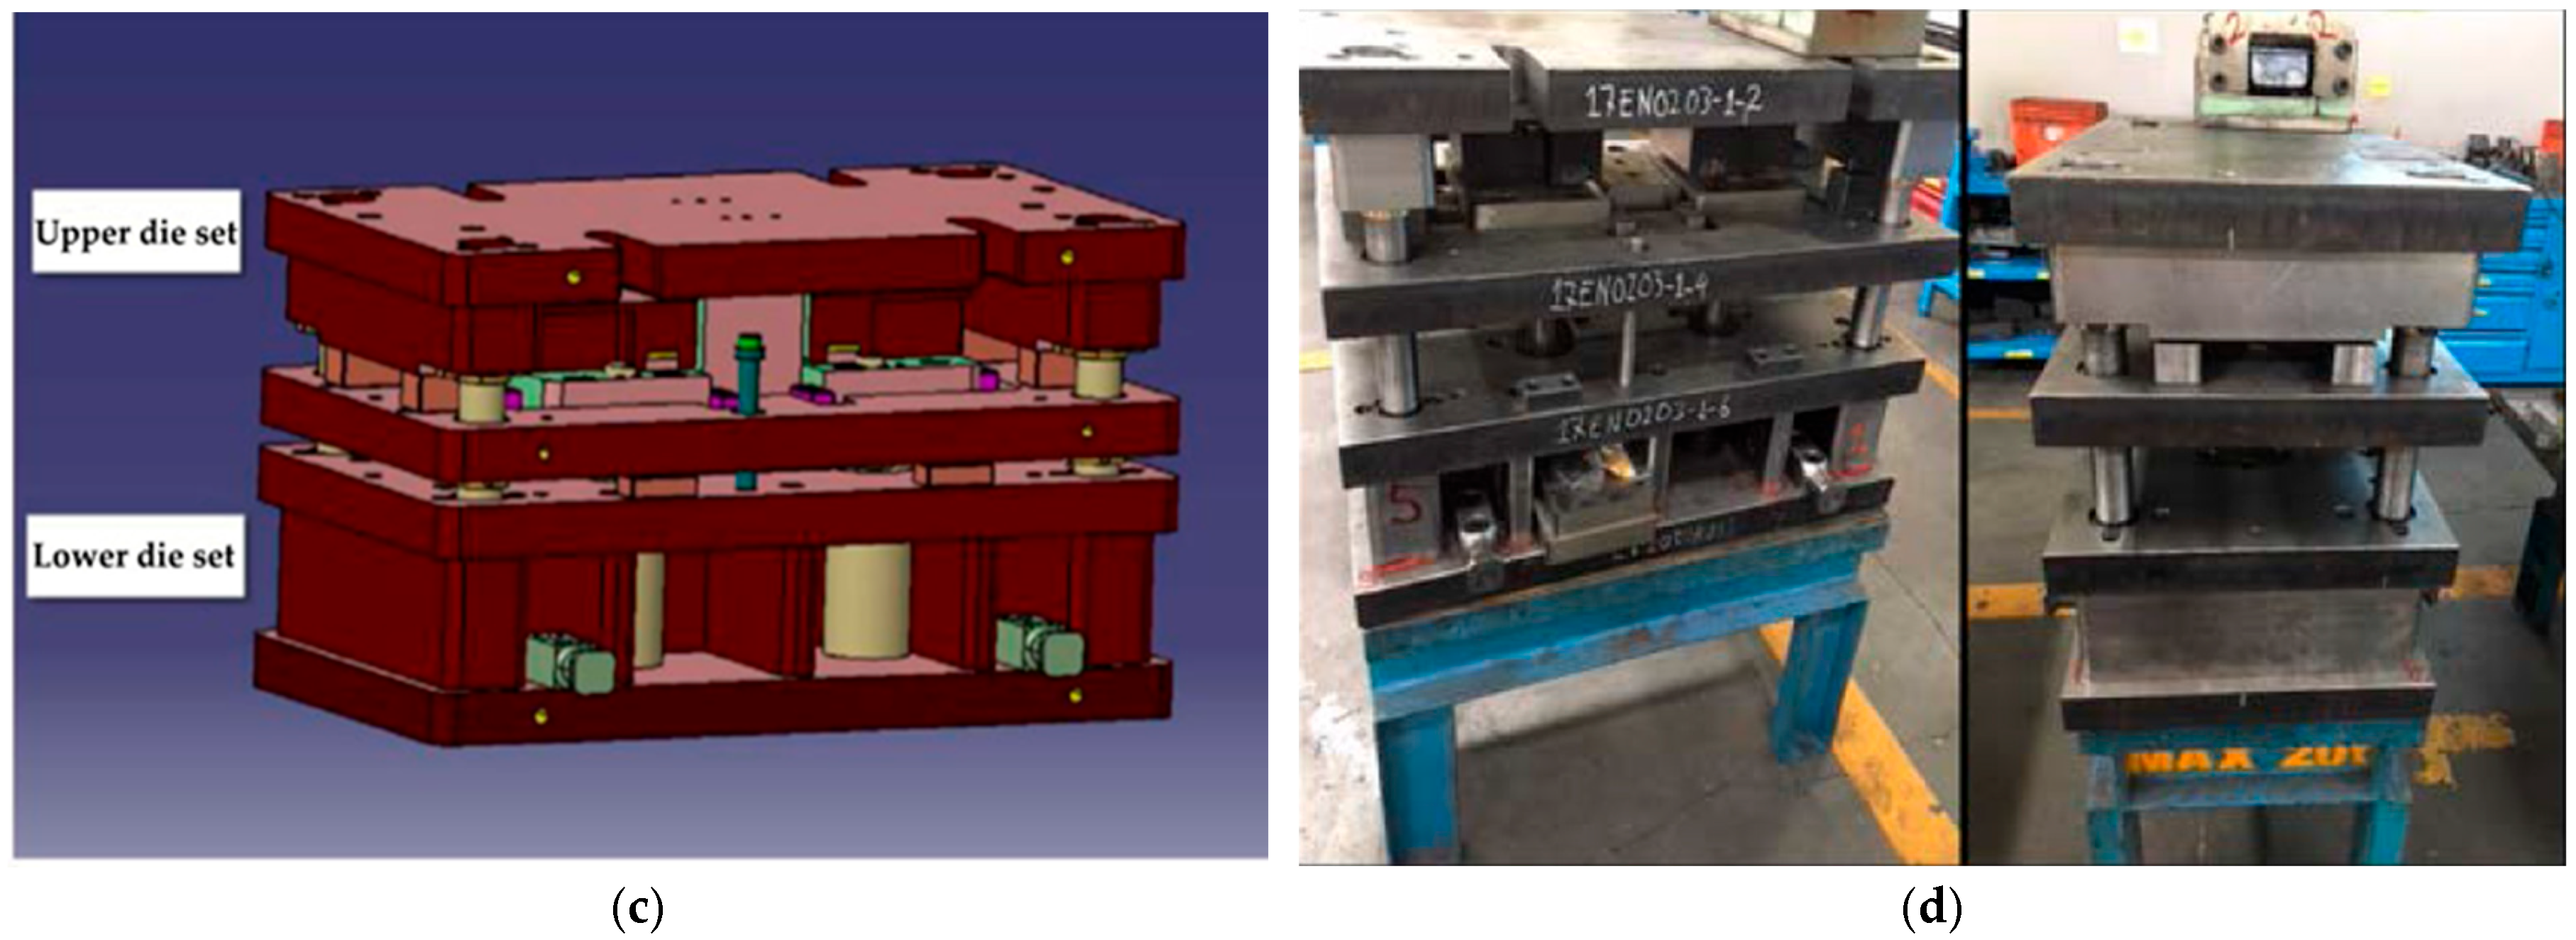
In experimental studies, tests were conducted on the forming of sheets with different parameters using the roll forming method. The roll forming mold was designed using the CAD program Catia V5 (Dassault Systèmes, Vélizy-Villacoublay, France). Detailed drawings of the designed mold are shown in Figure 2. The dimensions of the sheet metal utilized for testing are 100 mm in length and 500 mm in width. The sheet metal, supplied in rolls, was meticulously cut into the desired sample sizes in the laser cutting workshop. The designed mold consists of a female mold, a male mold, and a pot. The pot is a movable mechanism due to the presence of gas springs within it. The sheet metal between the female mold and the pot ring begins to take shape when the press closes. Standard manufacturing materials were utilized in the mold construction. Given the necessity of stamping a total of 180 pieces, two reference holes were strategically drilled at the center of the sheet metal. This method ensured that all sheets entering the mold would be stamped in the same position, facilitating consistent alignment. The sheet metal was then referenced from these holes, enabling precise alignment during the stamping process.
Figure 2.
(a–c) General view of the casting mold. (d) View of the casting mold after assembly.
The experimental apparatus consists of a specialized U-forming mold featuring female dies for precise orientation and male dies (punches) for the primary forming operation. In this setup, the mold opening (MO) angle is defined as the die clearance, which directly regulates the ‘free bending’ zone where elastic recovery occurs. To evaluate its influence on springback, MO was investigated at three distinct levels: 5°, 10°, and 15°. In order to maintain dimensional integrity and provide controlled tensioning, pot dies (blank holders) integrated with nitrogen gas springs were utilized to apply constant blank holder forces at the sheet edges. As illustrated in Figure 2, this high-precision configuration ensures consistent forming kinematics across the 180 analyzed scenarios. This configuration facilitates accurate springback measurement through Atos 3D optical scanning.
2.3. Experimental Design
The experimental matrix was established as a full-factorial design, resulting in 180 unique scenarios by combining four material grades, three levels of thickness, three mold opening angles, and five die radii, as summarized in Table 4.
Table 4.
Experimental design factors and their respective levels utilized to generate the 180 distinct forming scenarios.
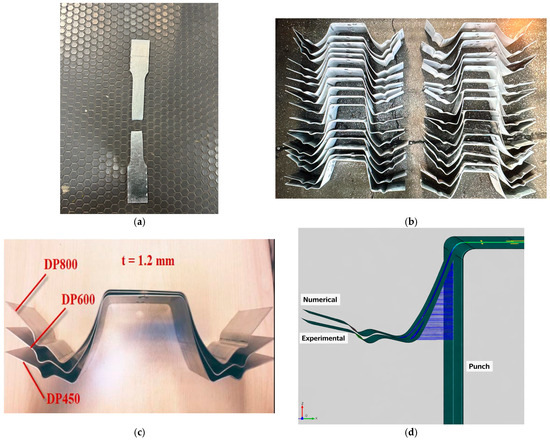
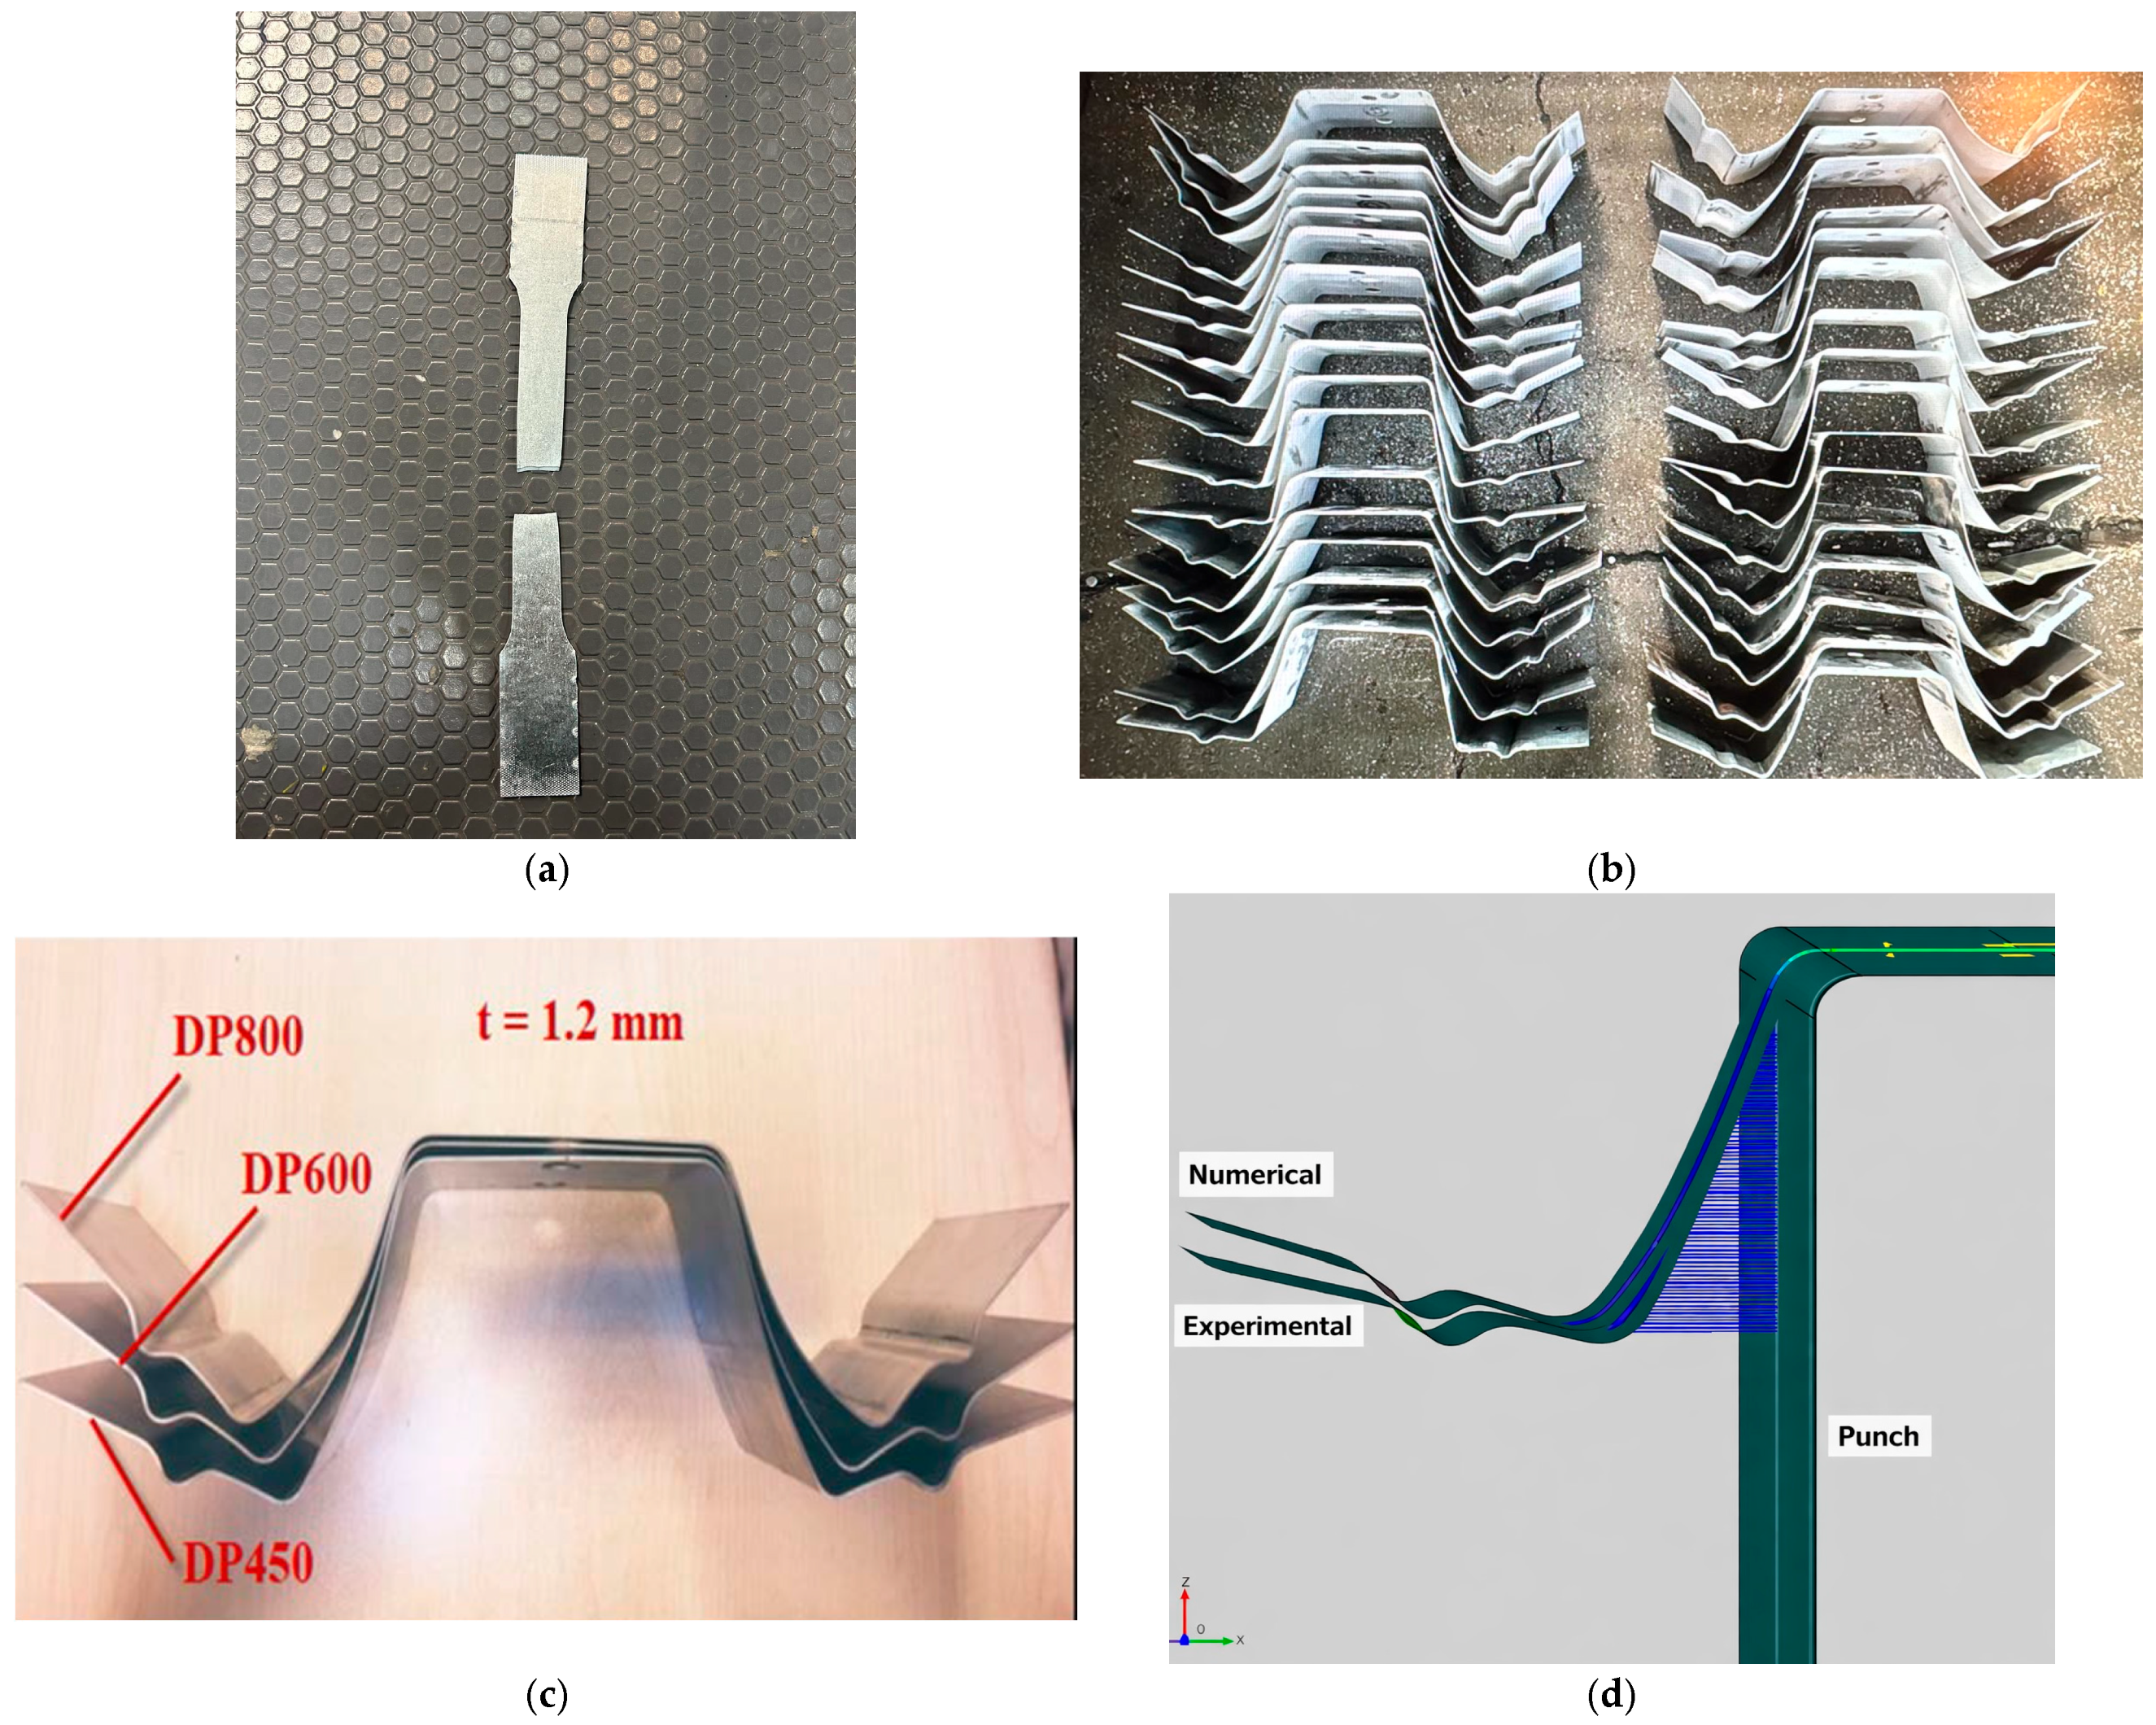
The post-test state of a representative fractured specimen is shown in Figure 3a. Additionally, Figure 3b provides a qualitative comparison of springback intensity for representative grades, whereas the full quantitative comparison for all four grades, including DP1000, is detailed in Section 3. The prepared sheet metal samples were shaped using a high-precision U-forming mold. Subsequent to the removal of the components from the mold, it was observed that they exhibited a springback phenomenon contingent upon the parameters employed (see Figure 3c). To provide definitive proof of the experimental work, the physical realization of the 180 forming scenarios and the resulting specimen library are documented in Figure 3b, verifying the consistency of the experimental procedure. The formed components were then subjected to 3D optical scanning using an Atos Core system (GOM GmbH, Braunschweig, Germany). To ensure the reliability of the experimental results, the system was calibrated prior to the scanning process, achieving a certified measurement uncertainty of approximately ±0.02 mm [42]. This level of precision is consistent with established photogrammetric benchmarks for industrial quality control in sheet metal forming [43]. The repeatability of the data was verified by performing three consecutive scans for representative samples, where the geometric deviation between measurements remained consistently below 0.01 mm. This high level of precision is essential for capturing the complex springback deviations in AHSS parts, as the scanner’s resolution allows for a detailed point-cloud comparison against the numerical STL data [44]. A quantitative comparison was made between the scanned parts and the STL data obtained from the numerical simulation. This superimposition process was performed using the Atos core software to evaluate the accuracy of the numerical predictions (see Figure 3d). Furthermore, the physical male wall of the mold was utilized as a reference to assess the geometric deviation in the springback specimens, where the radius of the part base was precisely measured.
Figure 3.
Visual documentation of experimental and verification stages: (a) tensile specimen fractured after final failure to determine ductility limits; (b) physical overview of the extensive specimen library documenting 180 forming scenarios; (c) qualitative comparison of springback intensity for representative DP grades; and (d) superimposition of numerical and experimental profiles within the Atos Viewer environment to visualize the geometric transition.
2.4. Numerical Modeling and Experimental Analysis
The experimental data obtained using the Incremental Solver module of the Autoform program was analyzed to determine the factors affecting the amount of springback and compared with the analytical results obtained using finite element analysis (FEA). In these analyses, Autoform R8 software was utilized, and the agreement between experimental data and analytical predictions was evaluated. The graphs presented demonstrated the correlation between analytical and experimental outcomes and the impact of parameter alterations on springback behavior.
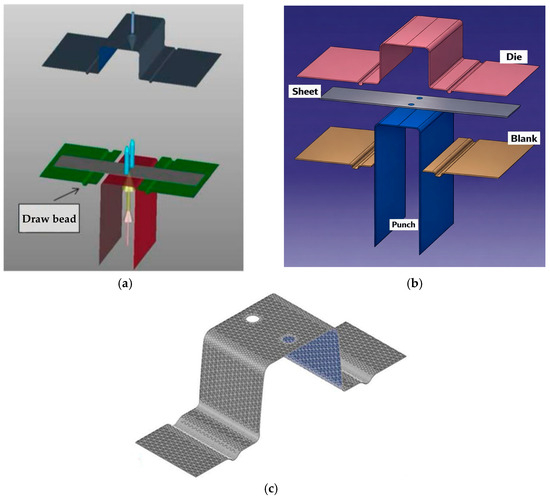
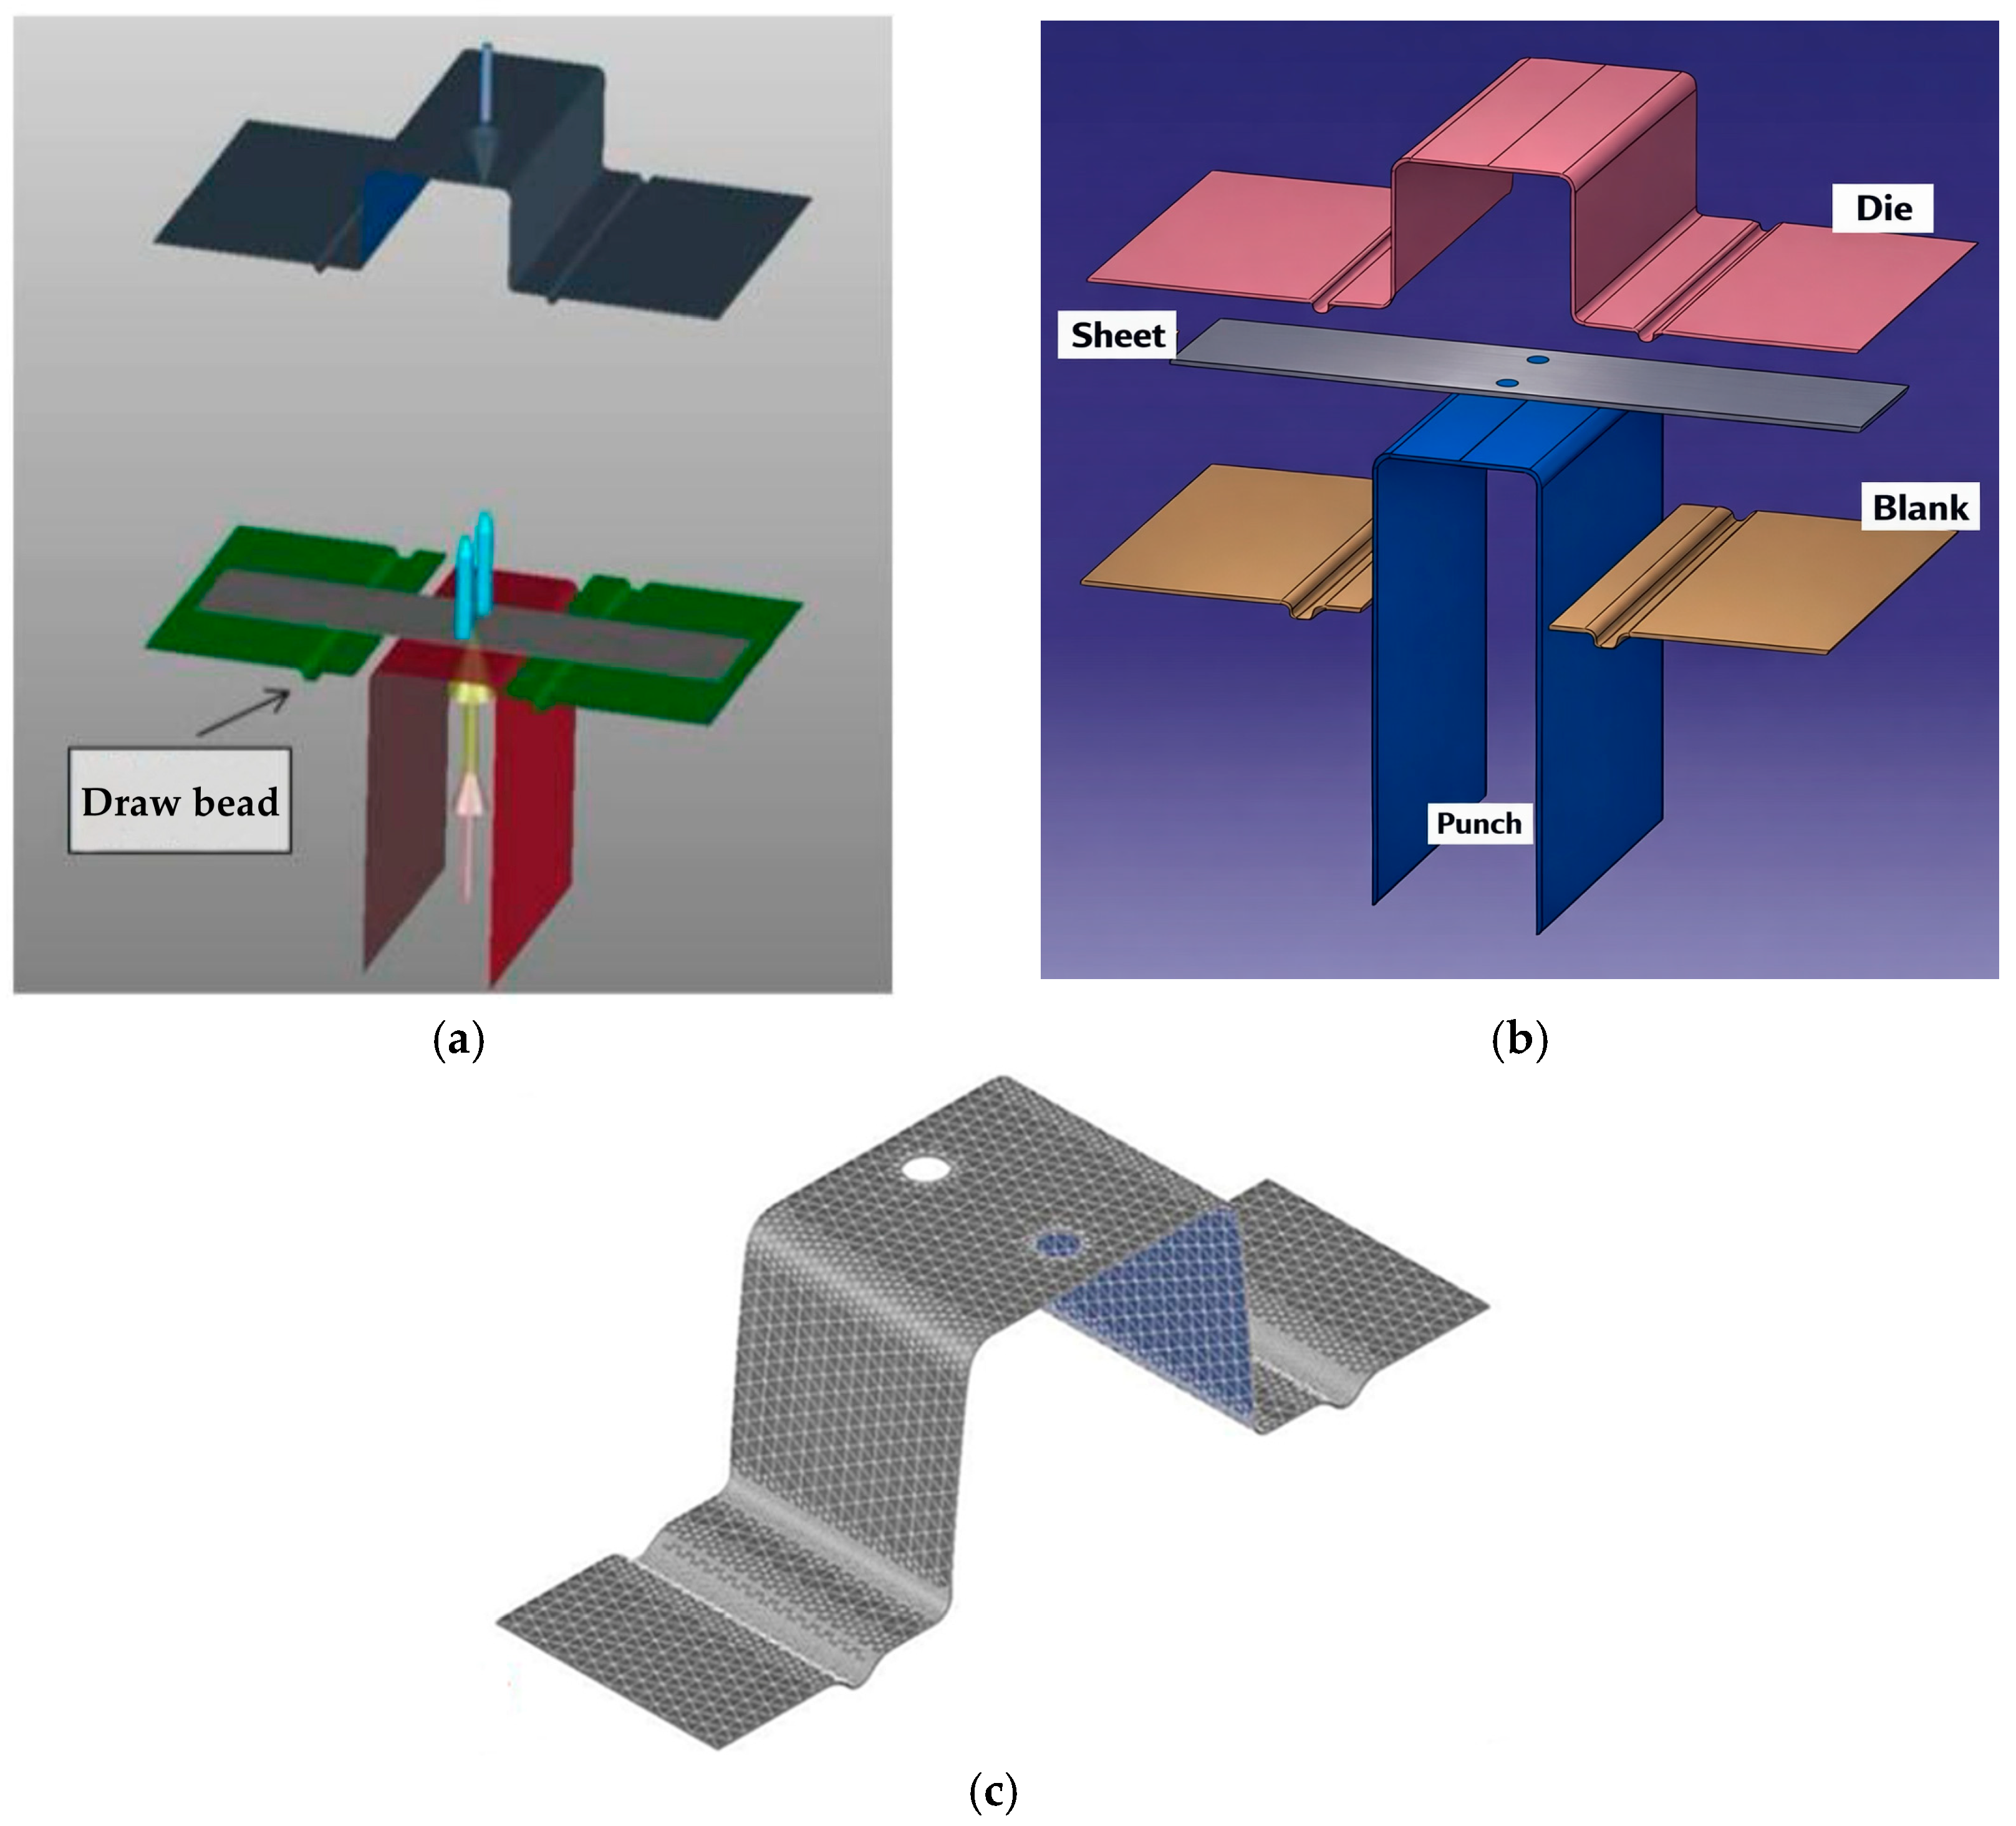
The numerical simulation environment was constructed by defining operational surfaces in Autoform R8, as illustrated in Figure 4a. To ensure a realistic representation of the technological process, the model incorporates drawbeads on the blank holder surfaces to regulate material flow and prevent wrinkling. The simulation follows a static-implicit formulation where the lower die components and blank holder serve as static constraints (fixed boundary conditions), while the punch follows a strictly controlled kinematic loading path along the Z-axis.
Figure 4.
(a) Numerical simulation scheme and operational surfaces in Autoform R8, explicitly showing the drawbeads and contact regions; (b) schematic representation of die assembly and blank positioning; and (c) adaptive mesh distribution with 1147 elements ensuring numerical convergence.
The plastic deformation and anisotropic behavior of the DP steel series were governed by the Hill48 yield criterion [45]. This quadratic formulation is a recognized industrial benchmark for capturing directional dependencies in sheet metal forming. The yield function is expressed as follows [45]:
where and are anisotropic coefficients calibrated based on the experimental Lankford parameters (r-values) for each grade. Furthermore, to ensure numerical stability and accuracy, an adaptive mesh configuration of 1147 elements was implemented (Figure 4c), which was validated through a convergence analysis showing a deviation of less than 1.0% compared to higher-density models.
To ensure numerical consistency and physical accuracy, the FE analyses were conducted under strictly defined boundary conditions. A constant Coulomb friction coefficient of μ = 0.12 was utilized, following industrial standards for lubricated dual-phase steel forming [7,46]. To minimize the influence of dynamic effects and ensure a quasi-static deformation state, the punch velocity was set to a constant rate, consistent with established springback benchmarks [47]. Furthermore, a quarter-model symmetry was employed to reduce computational cost while maintaining high mesh density in critical deformation zones. The contact between the tools and the blank was modeled using a surface-to-surface algorithm, assuming the mold components to be rigid bodies.
The number of meshes employed in the simulation was 1147 (Figure 4c). To verify the numerical stability of this discretization, a mesh convergence analysis was performed [48]. It was determined that increasing the element count to 1500 resulted in a negligible deviation (variation < 1.0%) in springback predictions, confirming that the 1147-mesh model had reached sufficient convergence. The mesh distribution was determined by the software’s adaptive meshing capability, which aligns element density with part curvature to maintain high precision in high-stress regions while optimizing computational costs [49]. Furthermore, the pot surface was modified with the addition of drawbeads to enhance forming conditions (see Figure 4a).
3. Results and Discussion
The present study investigated the effects of sheet thickness, die gap, and female die radius on springback behavior for four distinct sheet materials. The data obtained from experimental measurements and numerical analysis are presented in Appendix A.
3.1. Experimental Results
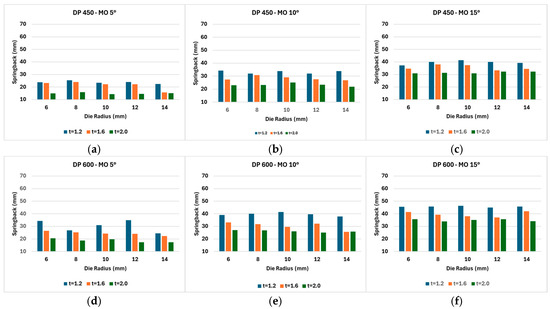
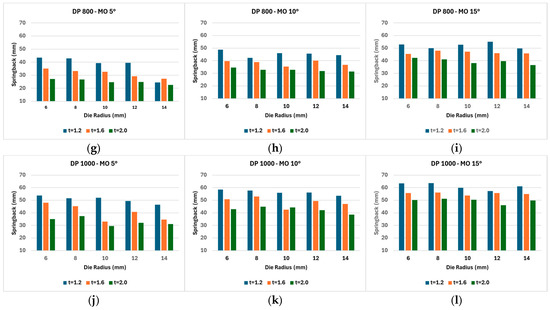
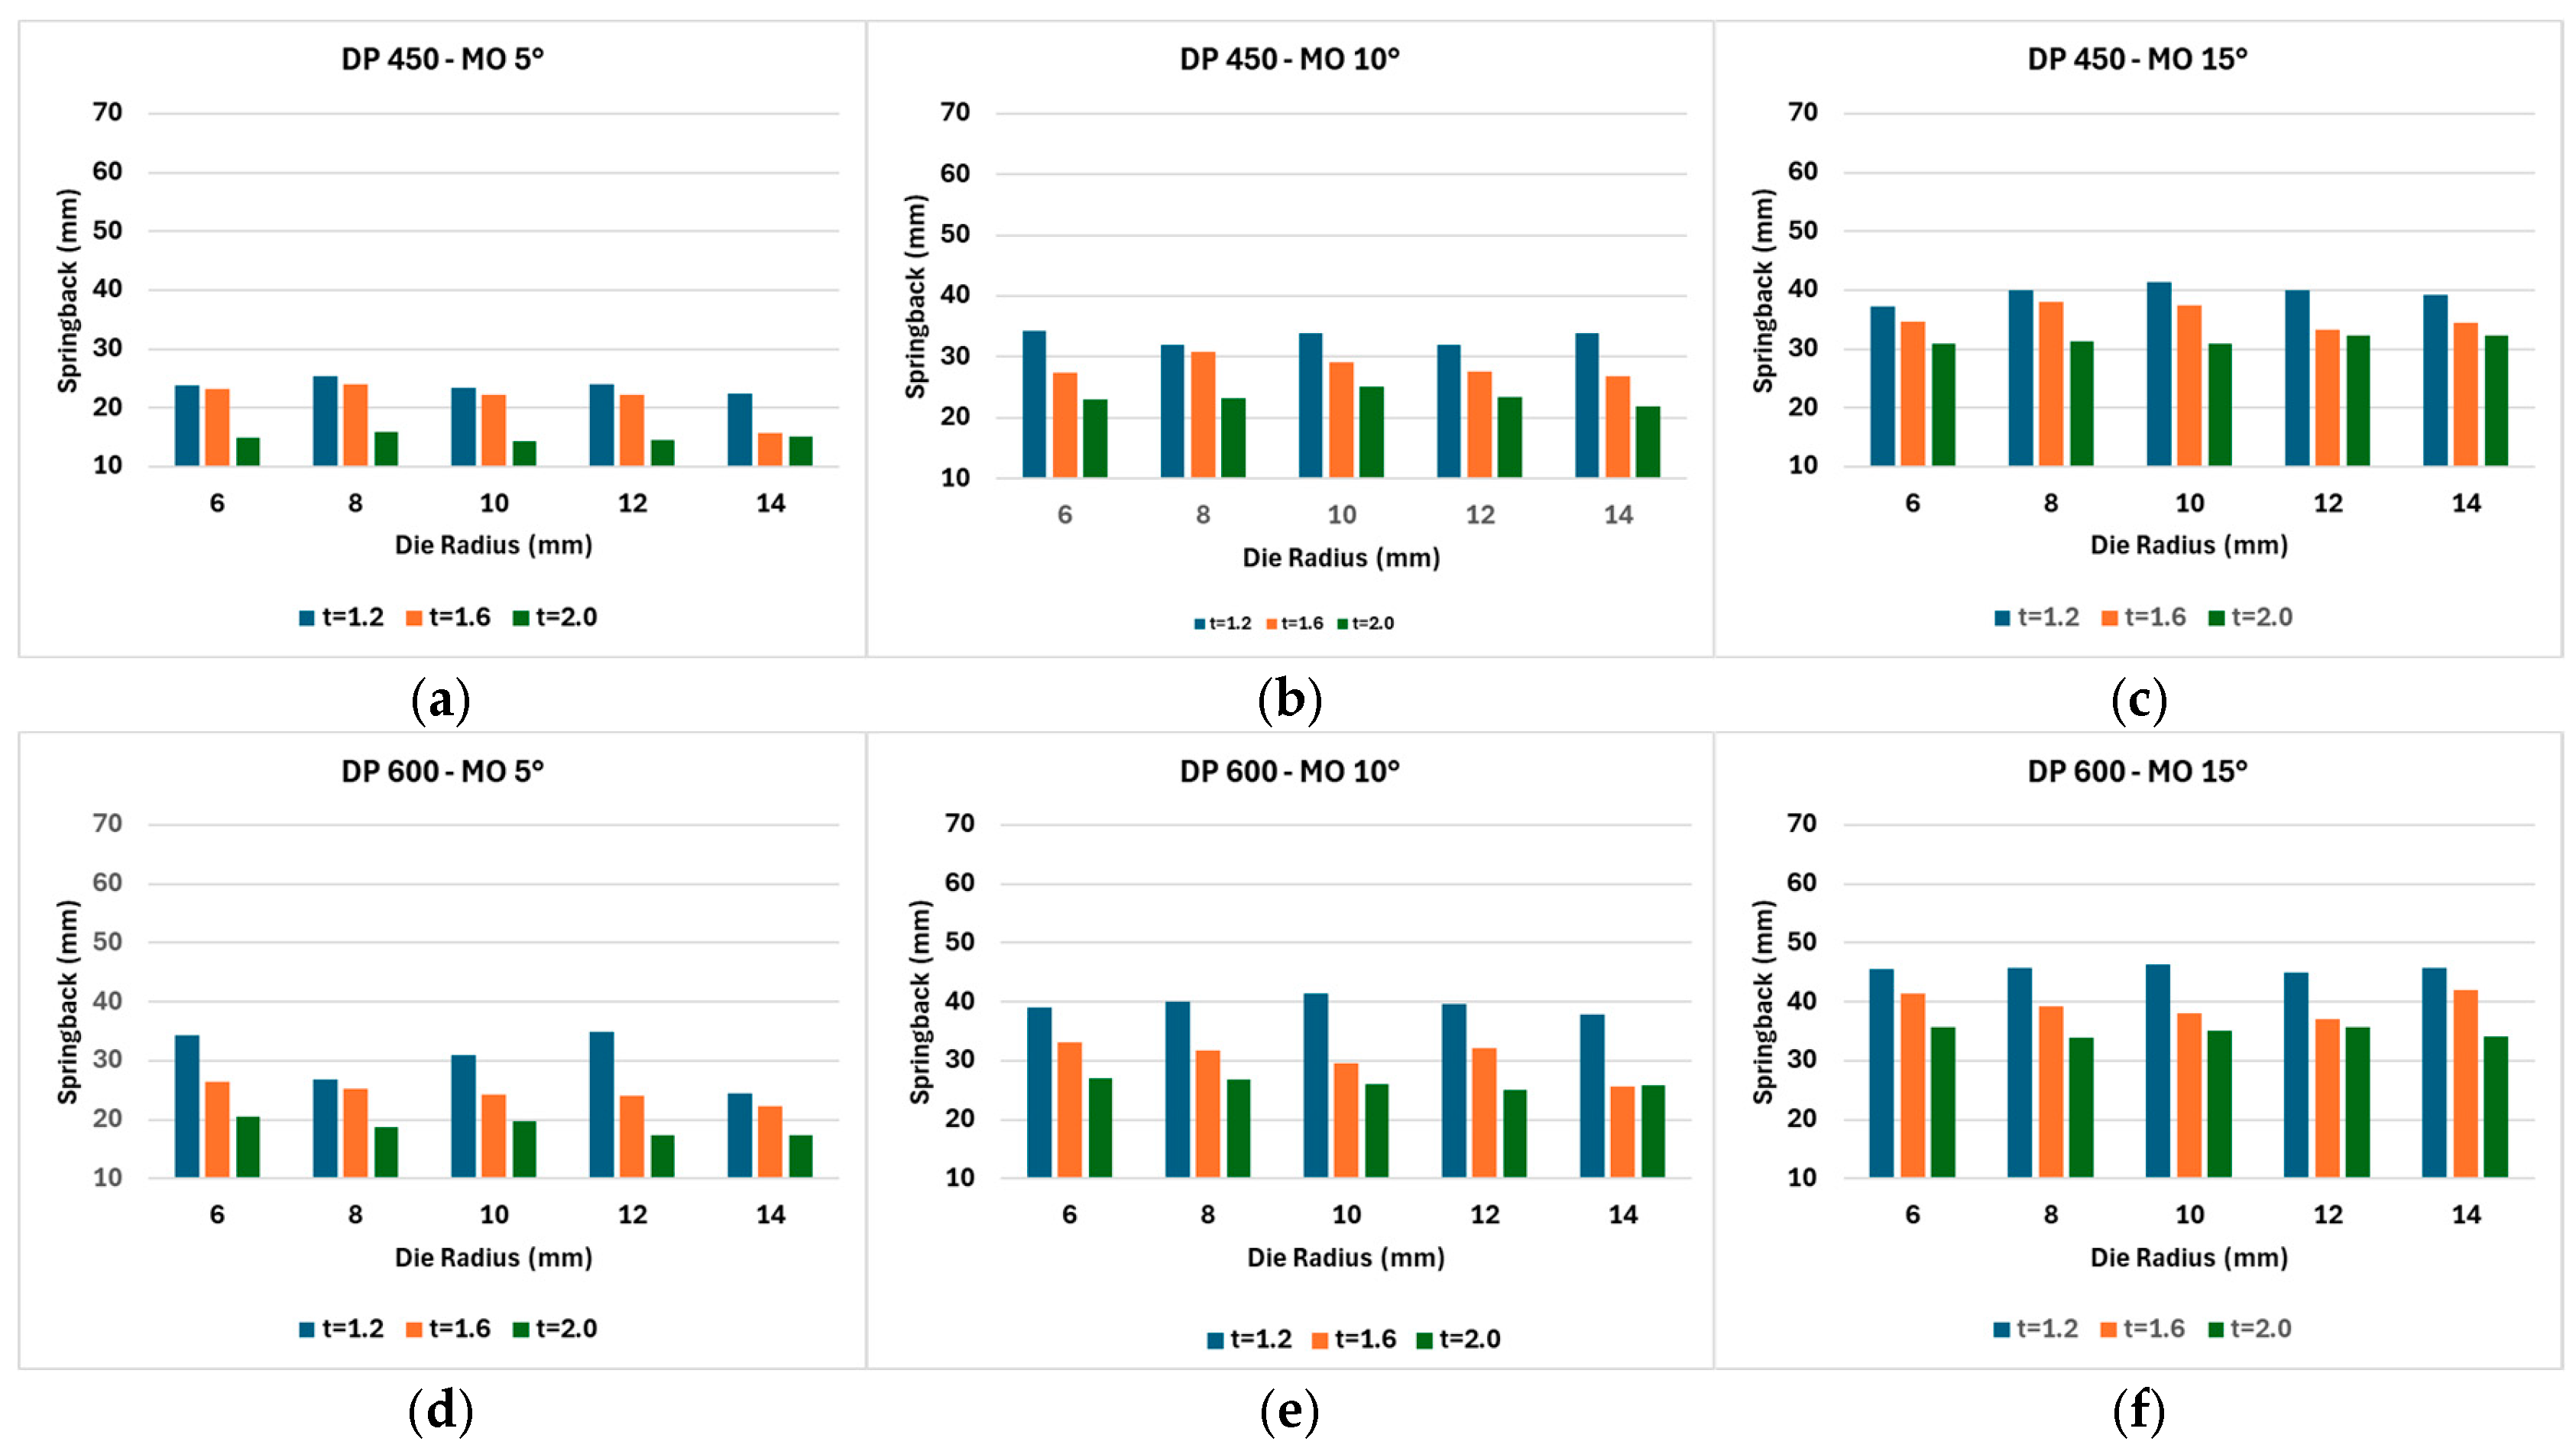
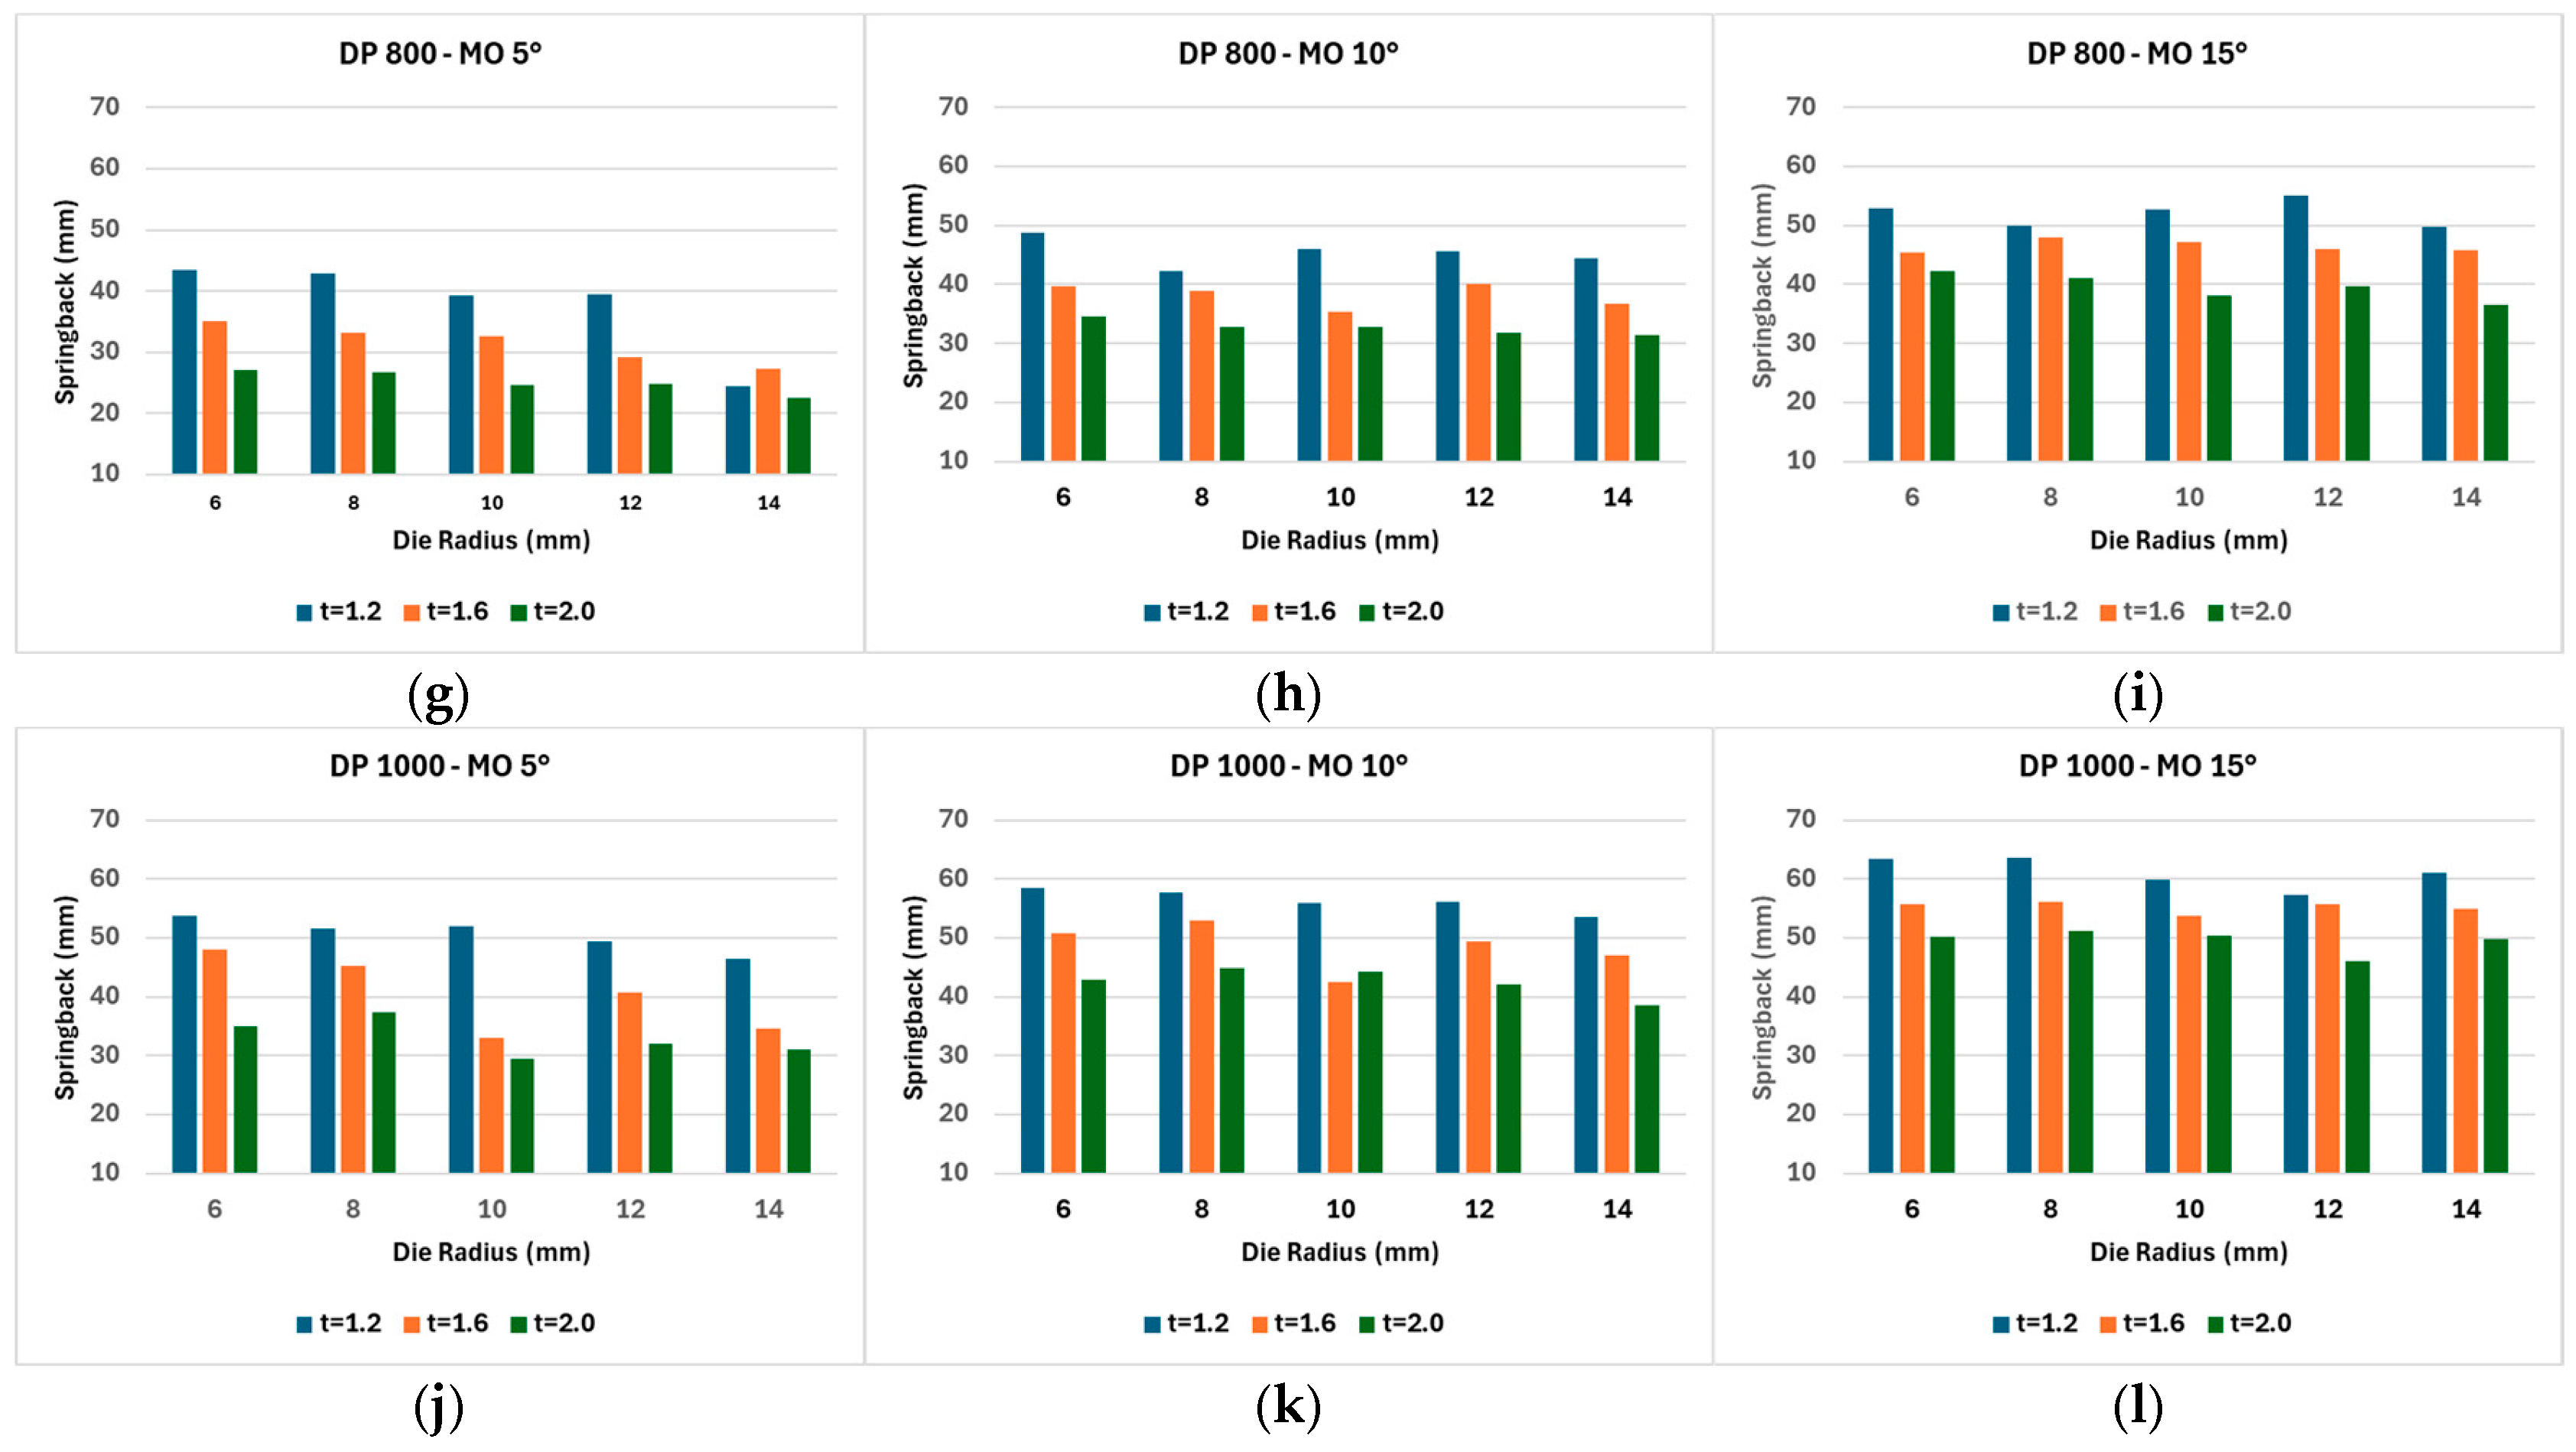
A comprehensive analysis of the springback behavior for all 180 scenarios is presented in Figure 5a–l, representing DP450, DP600, DP800, and DP1000 grades, respectively. This de-consolidated layout eliminates data overlap and clearly illustrates the dominant influence of material grade and mold opening on geometric stability.
Figure 5.
Comprehensive experimental springback data for 180 forming scenarios, categorized by material grade and mold opening angle (MO): (a–c) DP450, (d–f) DP600, (g–i) DP800, and (j–l) DP1000. All charts are standardized to a 10–70 mm scale for direct comparison.
A collective evaluation of the results presented in Figure 5a–l reveals that sheet quality, driven by its constituent phases, is the paramount parameter influencing springback. The substantial increase in springback observed from DP450 (min 14.16 mm) to DP1000 (up to 64 mm) is documented in the literature as a function of the rising ratio of yield strength to elastic modulus [38]. It should be noted that the FE model utilized in this study follows a macroscopic continuum approach based on the Hill48 criterion. While the simulation does not explicitly model individual phase transformations, the observed springback behavior is mechanistically interpreted through independent microstructural data obtained from laboratory analysis and the literature. Mechanistically, this behavior is governed by the martensite volume fraction (MVF), which reaches approximately 50% in DP1000 [5]. As the MVF increases, the material’s microstructural hardness and overall yield strength rise, allowing for significantly higher accumulation of elastic energy (σ2/2E) during plastic deformation [5,38]. Furthermore, the hard martensite islands embedded within the soft ferritic matrix act as rigid barriers to dislocation motion during forming, creating high stress gradients at the phase interfaces [39,50]. Upon unloading, these trapped residual stresses trigger an aggressive elastic return. While an increase in sheet thickness (from 1.2 mm to 2.0 mm) enhances the bending stiffness and provides a more resistant structure against these forces, this geometric reinforcement alone is insufficient to curb the aggressive springback in ultra-high-strength grades like DP1000. As illustrated in Figure 5, the utilization of 2 mm thick sheets yielded the most stable outcomes across all mold geometries.
An increase in the mold opening angle, from 5° to 15°, resulted in a corresponding rise in the amount of springback across all grades. The reduction in contact area between the sheet and the mold, caused by wider MO angles, led to an expansion in the “free bending” zone. This, in turn, resulted in elastic recovery occurring over a wider area. In the context of the radius effect, it was observed that small radii (R6) preserved the shape by making plastic deformation more localized and intense. Conversely, as the radius increased (R14), the stress gradient in the deformation zone decreased and springback was triggered. The extant literature suggests a direct correlation between die gap and stress distribution in the bending zone of the sheet. Furthermore, an increase in the unsupported flange area appeared to result in a maximal geometric deviation.
The fundamental springback characteristics of the four distinct DP sheet metal grades (DP450, DP600, DP800, and DP1000) utilized in the experimental study are presented in a systematic matrix in Table 5, along with the implications of these findings for industrial manufacturing. This table offers a strategic decision support guide for die designers and manufacturing engineers working on automotive body-in-white (BIW) components.
Table 5.
Comprehensive comparative analysis of forming characteristics and industrial feasibility for DP450, DP600, DP800, and DP1000 steel grades.
A thorough analysis of the data presented in the table reveals that DP450 sheets are regarded as the industrial “gold standard” for precision-tolerance parts, a distinction attributable to their low deviation tolerances and stable geometric form. In contrast, DP1000 grade, which is at the top of the strength spectrum, exhibits an “aggressive” springback tendency as a result of the deployed elastic energy associated with its high yield strength. This scenario necessitates the implementation of meticulous compensation methodologies during the die design phase of the manufacturing process for ultra-high-strength sheets.
The synthesized findings also reveal a critical distinction regarding parameter interactions: in sheet groups with low strength (DP450 and DP600), the enhancement in sheet thickness exerts a substantial balancing effect, thereby mitigating springback. However, as the strength level increases, particularly in DP1000 sheets, it has been determined that the thickness effect alone cannot curb this aggressive springback. Dimensional control can only be achieved by optimizing the mold geometry (MO ≤ 10°). The findings of this study provide a fundamental data set for minimizing mold revision costs and trial-and-error processes in the mass production of complex U-shaped parts.
To ensure industrial applicability, the numerical simulations were based on the Hill48 yield criterion [45], which remains the benchmark for industrial body-in-white (BIW) design due to its balance between predictive accuracy and computational stability across diverse parametric ranges. While Hill48 is highly effective for global springback trends, its inherent limitations in capturing the Bauschinger effect and nonlinear elastic recovery (chord modulus degradation) must be acknowledged, particularly for ultra-high-strength grades like DP1000 [20]. In these materials, high martensite volume fractions lead to complex stress distributions that isotropic hardening models may not fully represent. However, within the scope of this 180-scenario comparative study, the Hill48 model provided a reliable and practically applicable framework, with a maximum numerical–experimental deviation of only 3.1% observed in the DP1000 group.
Based on the experimental results, the recommended parameter values for obtaining the minimum springback values for each material class are also provided in Table 5. Under the conditions where the mold opening angle (MO) is 5°, the die radius (R) is 14 mm, and the sheet thickness (Thickness) is 2 mm, minimum springback values can be obtained for all material classes.
3.2. Comparison of Experimental and Numerical Analysis Results
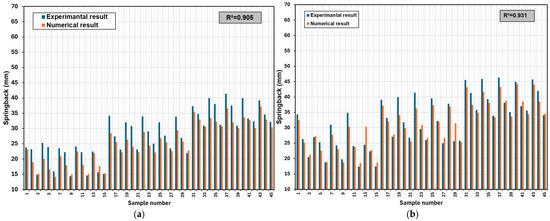
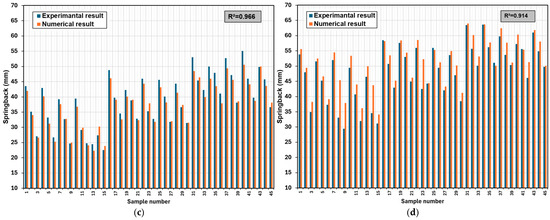
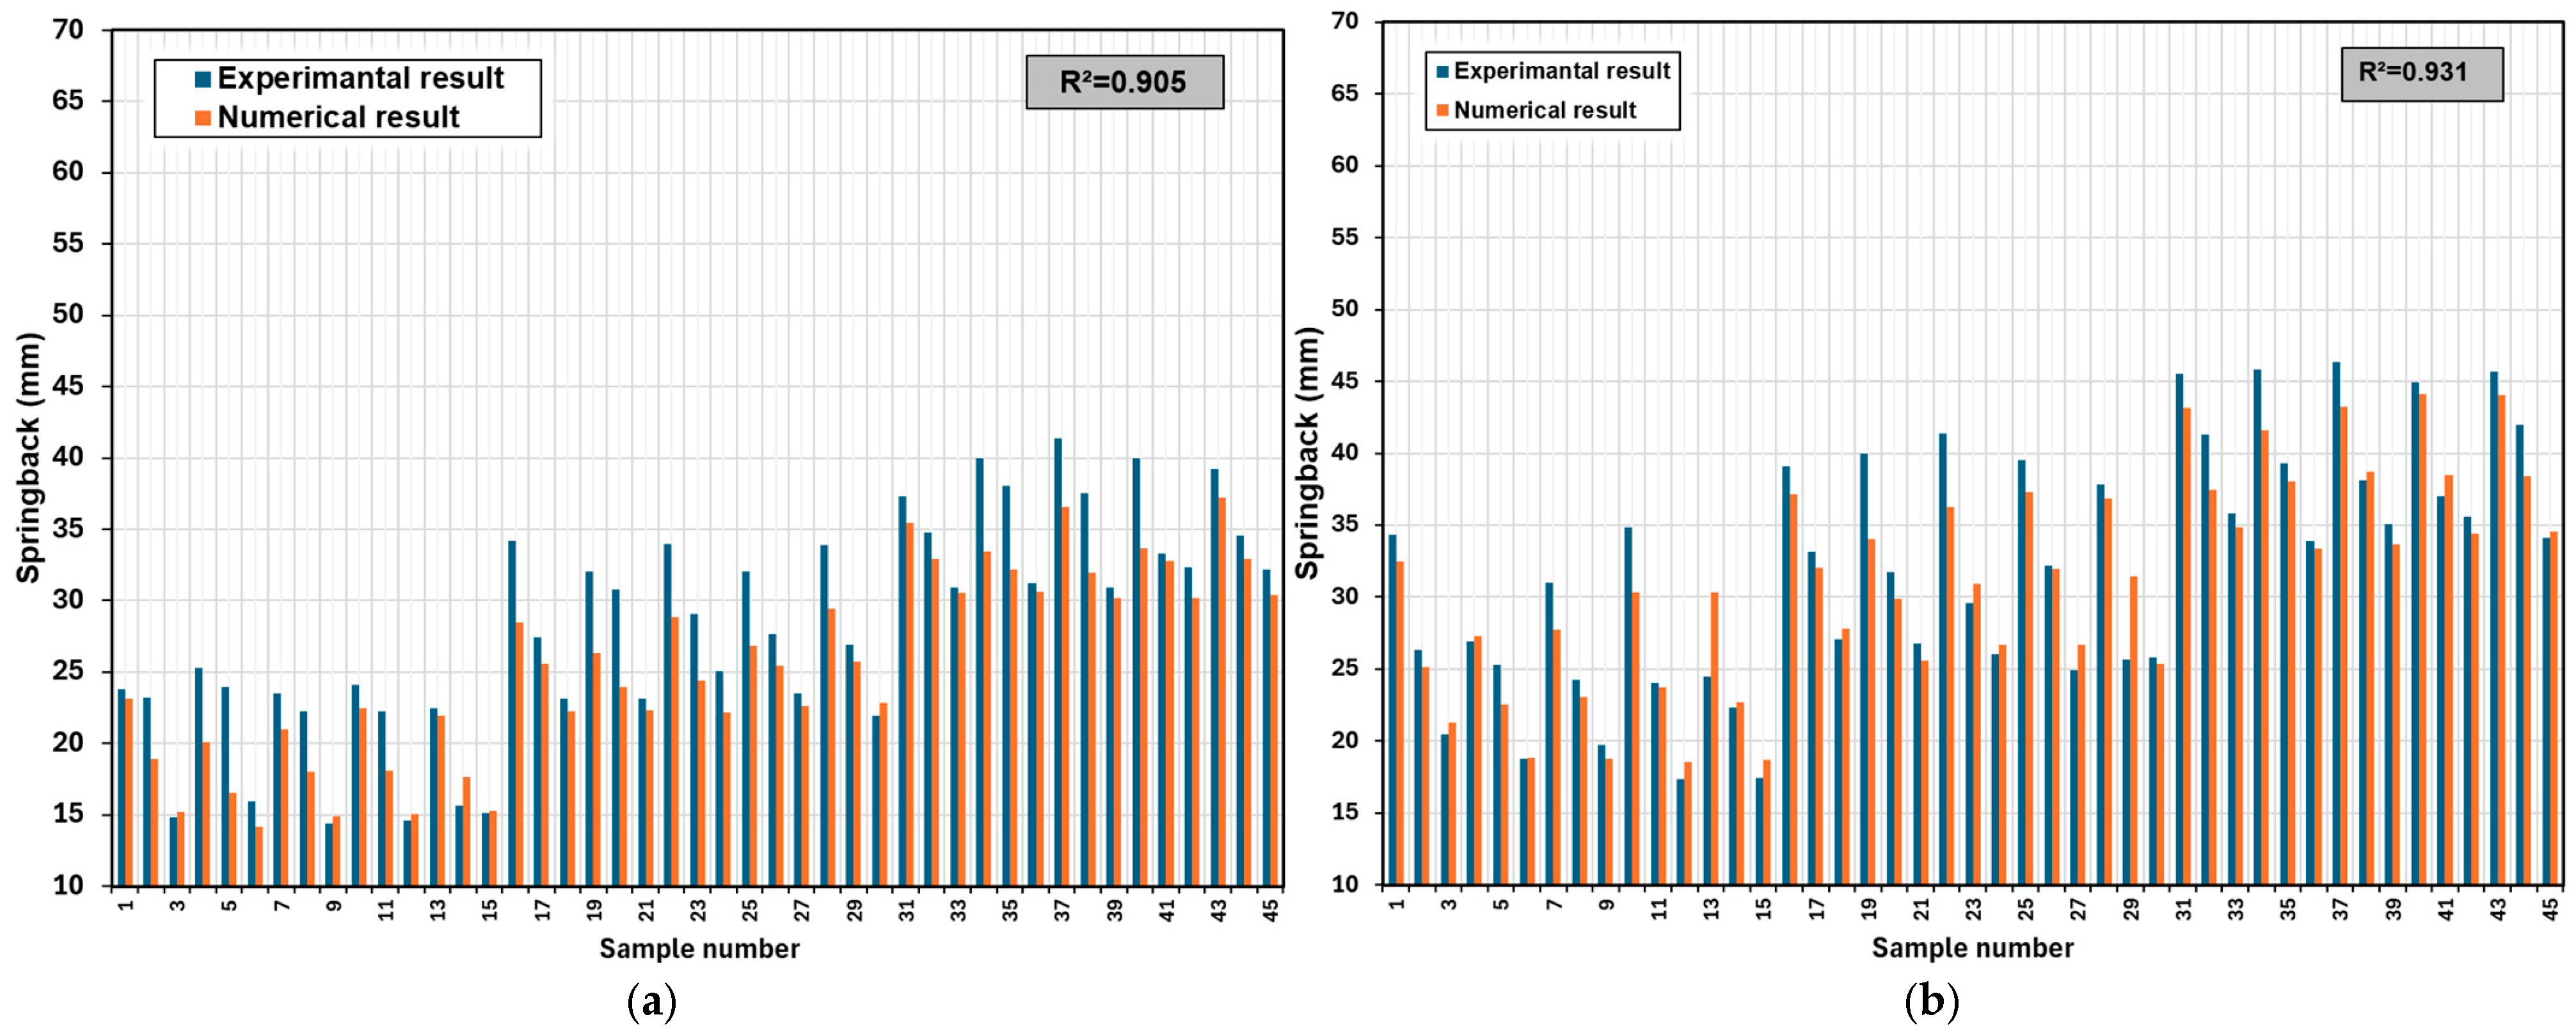
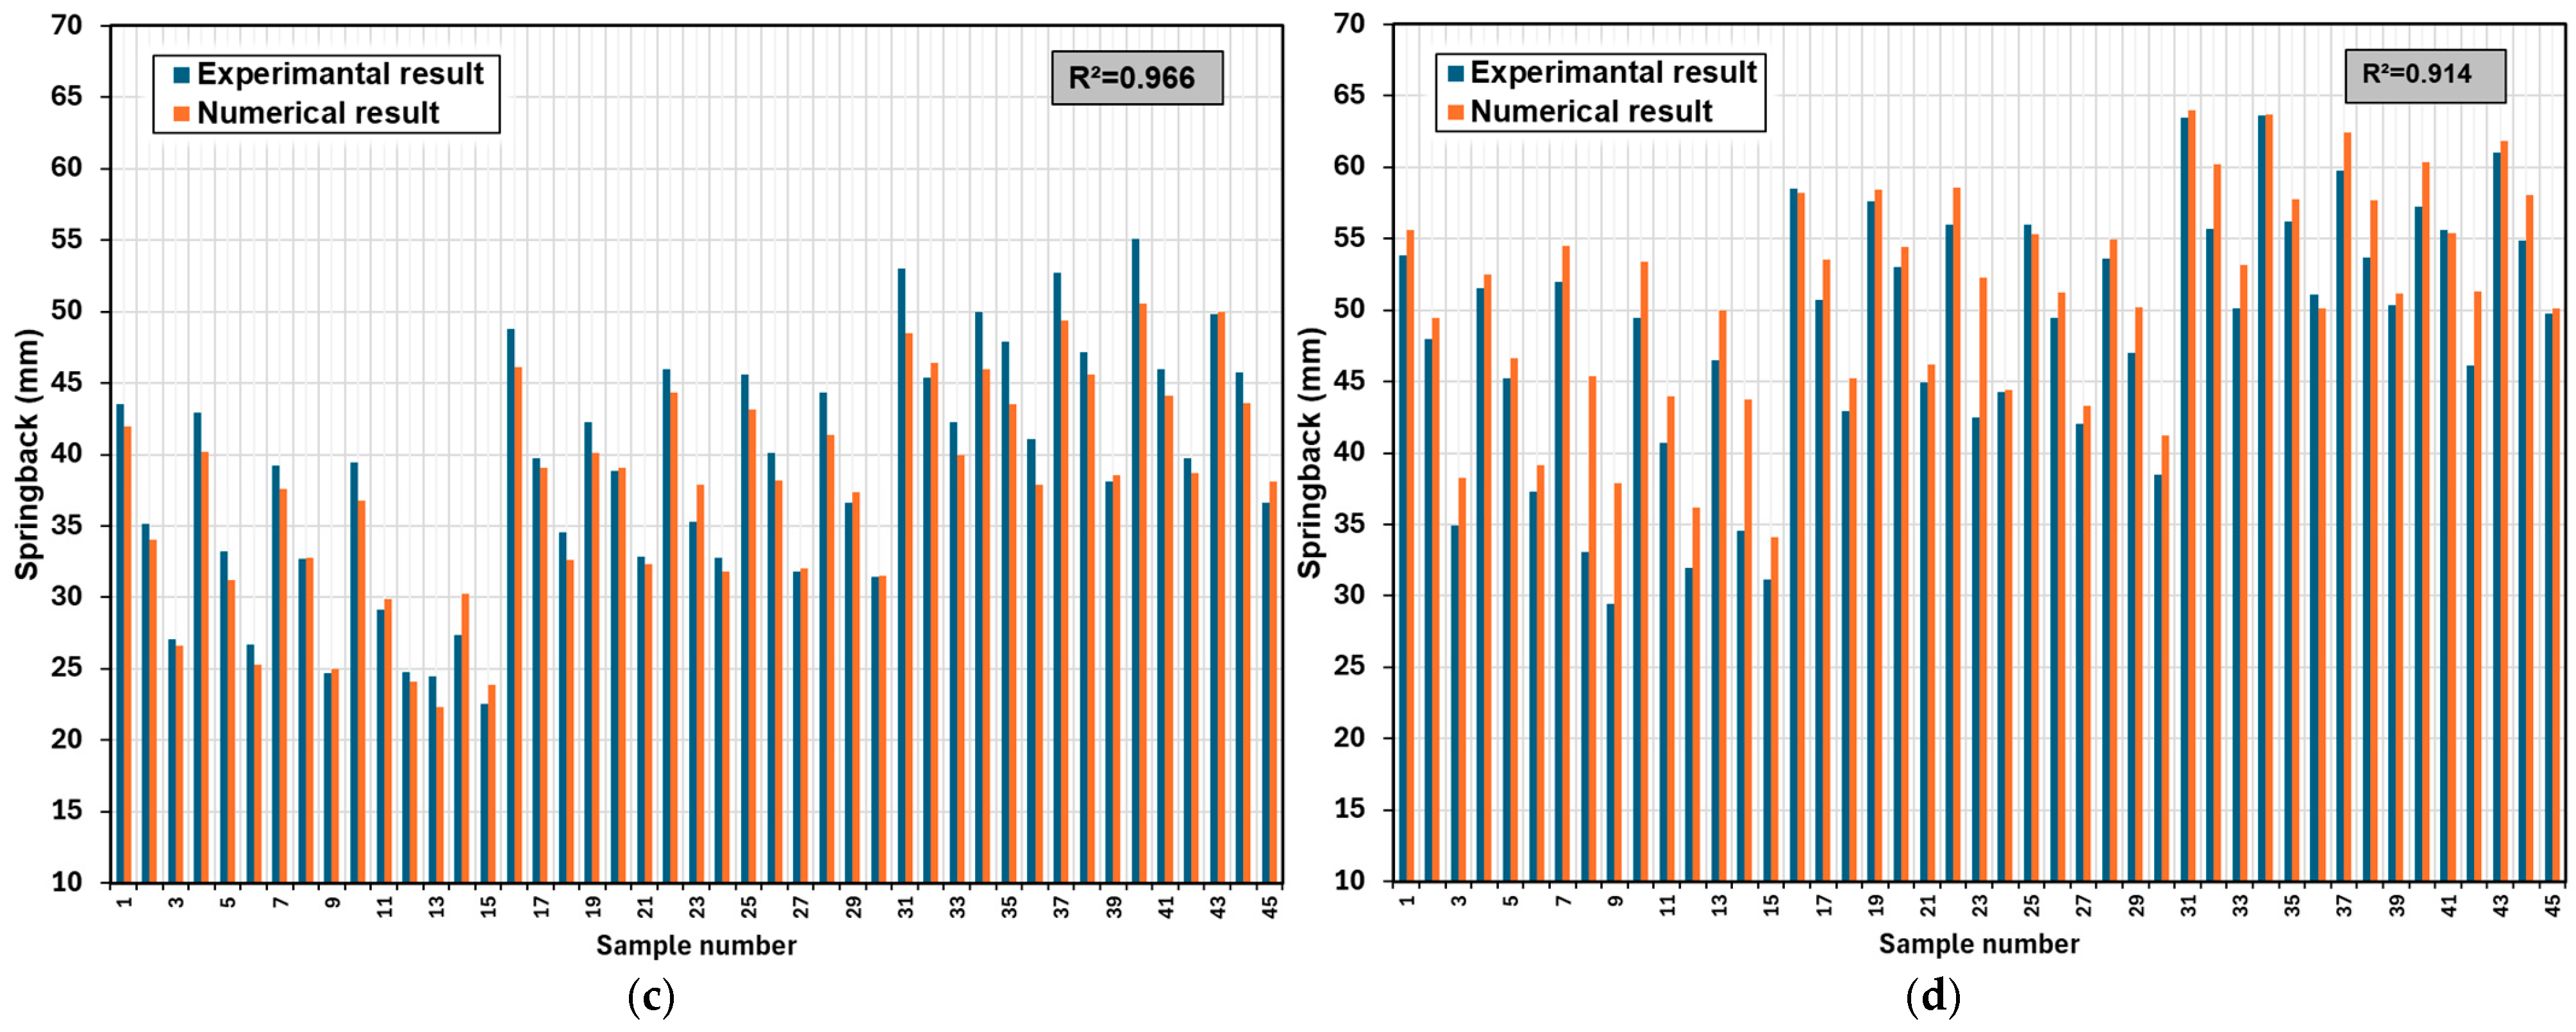
To enhance comprehensibility and address the discrete nature of the experimental matrix, the results are presented as grouped bar charts in Figure 6. This de-consolidated and compact layout facilitates a direct comparison between material grades. The analysis reveals a distinct pattern of numerical accuracy: while the FE model shows exceptional fidelity for DP450 and DP600 (errors < 1.1%), the deviation increases for DP1000 (reaching 3.5%), especially in scenarios with high mold opening (MO) angles. These maximal errors are attributed to the complex nonlinear hardening behavior of ultra-high-strength grades, which exceeds the standard quadratic assumptions of the yield criterion. Conversely, minimal errors were recorded for thicker 2.0 mm sheets across all grades, confirming that increased sectional stiffness enhances the predictive stability of the static-implicit solver.
Figure 6.
Correlation between experimental measurements and numerical (Autoform R8) predictions using grouped bar charts for (a) DP450, (b) DP600, (c) DP800, and (d) DP1000 steel grades. R2 values indicate high predictive accuracy across 45 discrete scenarios for each material.
As illustrated in Figure 6, there is a strong correlation between the simulation and experimental data for each sheet quality. The analyses performed yielded R2 values greater than 0.90 for all sheet types. As illustrated in Figure 6b, the simulation’s estimate of 18.55 millimeters (mm) for DP600 quality sheets exhibited a low error margin of 1.1% compared to the experimental result of 18.76 mm. This observation substantiates the industrial precision of the Hill48 yield criterion and the 1147 mesh element numerical model. While the Hill48 yield criterion remains an industrial benchmark for its computational efficiency, its inherent limitations in capturing the Bauschinger effect and nonlinear elastic recovery must be acknowledged, particularly for ultra-high-strength grades like DP1000 [20]. In the DP1000 group, which exhibits the highest strength (see Figure 6d), the discrepancy between numerical predictions and experimental data reached a maximum error margin of 3.1%, a deviation notably higher than that observed in lower-strength grades. This discrepancy is primarily attributed to the material’s complex microstructure, where the high martensite volume fraction (~50%) leads to significant internal stress gradients that trigger aggressive elastic return during the unloading stage [22]. Standard isotropic hardening models often fail to capture the Bauschinger effect and the phenomenon of chord modulus degradation, both of which are intensified during the unbending phases of U-channel forming [23]. As emphasized in recent studies, incorporating complex phase interactions and nonlinear loading paths (NLLPs) into the model is essential for further enhancing the predictive accuracy of springback in ultra-high-strength AHSS components [22,23]. STL data overlays performed on Atos Viewer (Figure 3b) have confirmed that Autoform is a reliable tool for predicting sidewall curl and springback angle in complex U-shaped parts. This high level of accuracy has the potential to reduce the time and financial resources expended during the trial-and-error process of mold design.
3.3. Statistical Analysis and Evaluation
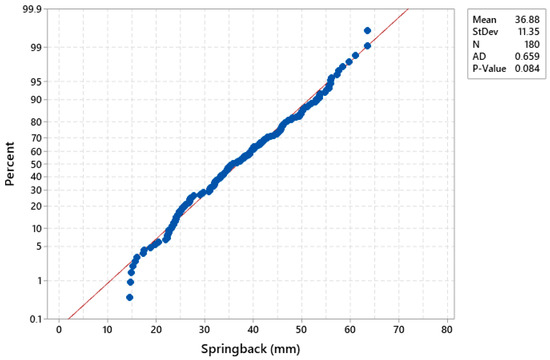
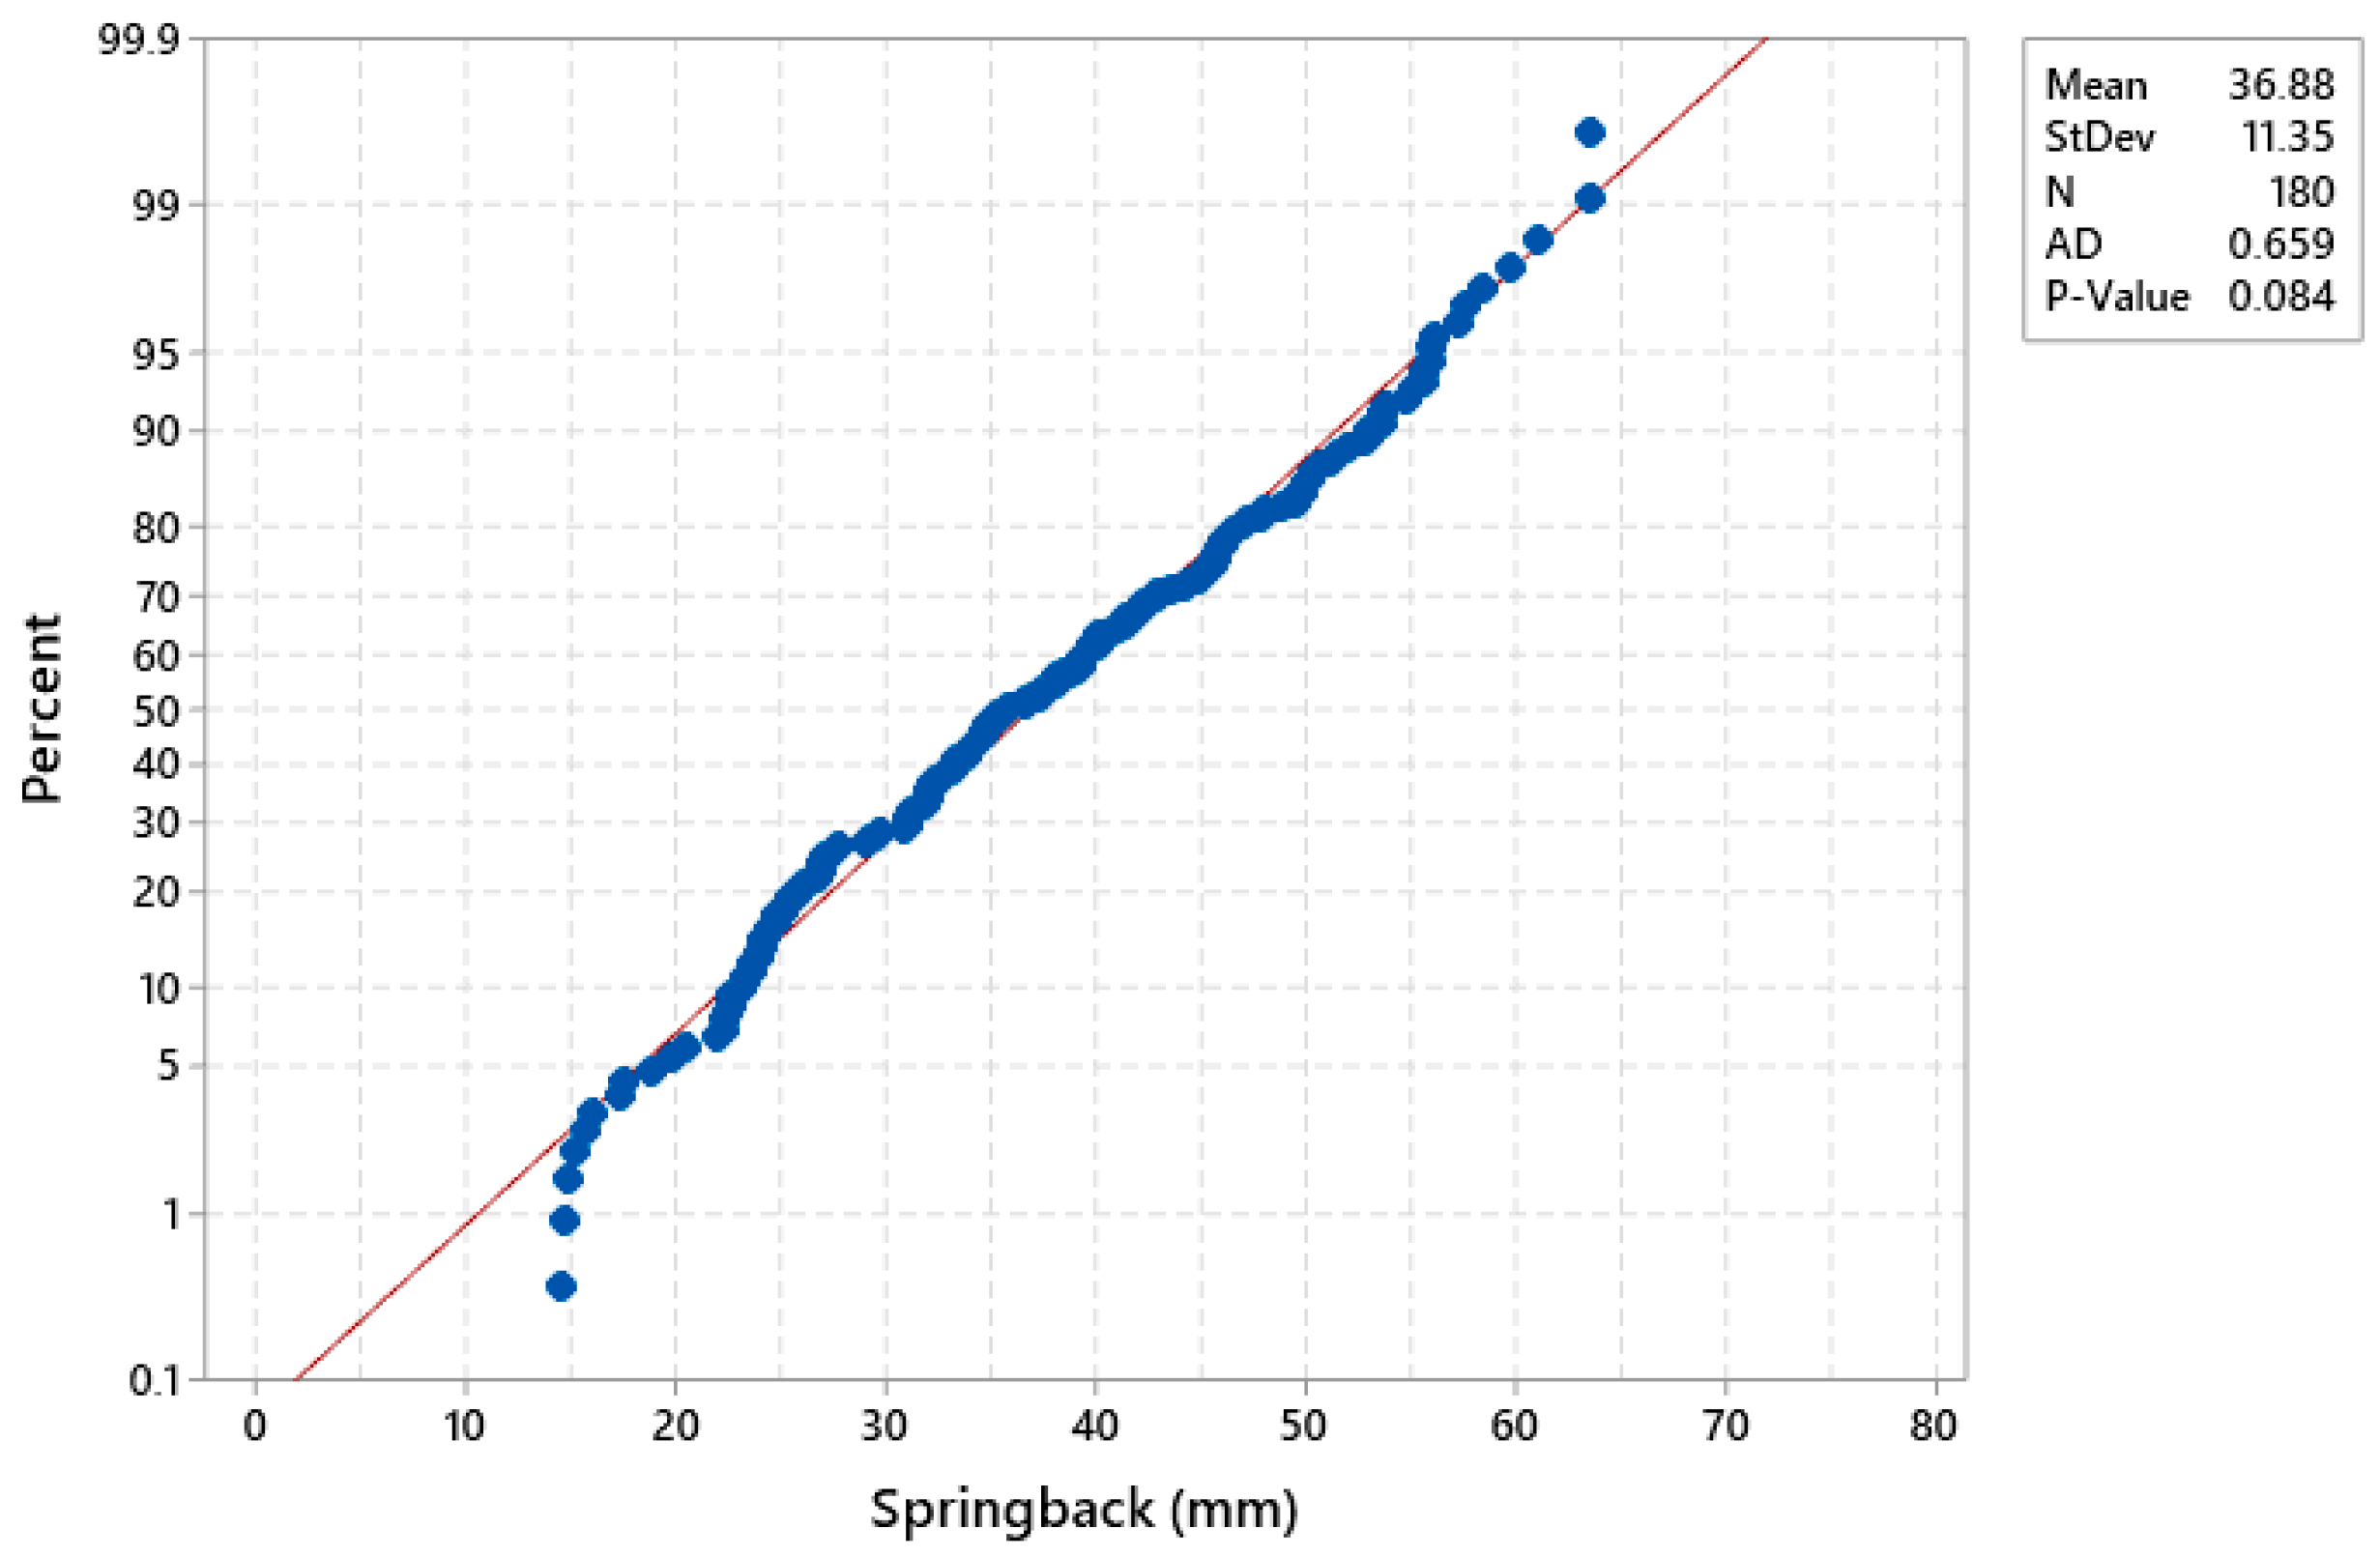
To quantify the statistical significance of the investigated parameters on springback, a formal Analysis of Variance (ANOVA) was performed using Minitab v21.1 software, a methodology consistently employed in springback optimization studies. Prior to the analysis, the normality of the experimental data was verified. As illustrated in Figure 7, the normality test yielded a p-value of 0.084, which confirms that the data set follows a normal distribution, thereby validating the subsequent statistical tests.
Figure 7.
Normal probability plot of springback values.
The ANOVA results, summarized in Table 6, indicate that all investigated parameters are statistically significant (p < 0.001). The F-value indicates the statistical significance of the difference between the variables under examination and serves as an indicator that this difference is not due to chance. As the F-value increases, the p-value decreases. A high F-value indicates that the difference between the groups is substantial and also indicates which group is more effective. Material grade emerged as the most dominant factor with an extreme F-value of 602.86, followed by mold opening angle (F = 552.79). The high significance of the mold opening parameter aligns with the findings of Thipprakmas and Phanitwong, who emphasized that wider die geometries expand the ‘free bending’ zone and trigger higher geometric deviations [51]. Sheet thickness (F = 358.58) and die radius (F = 11.39) also contributed significantly, though the latter had the least relative influence.
Table 6.
ANOVA for springback experimental results.
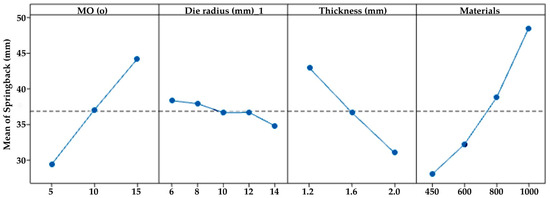
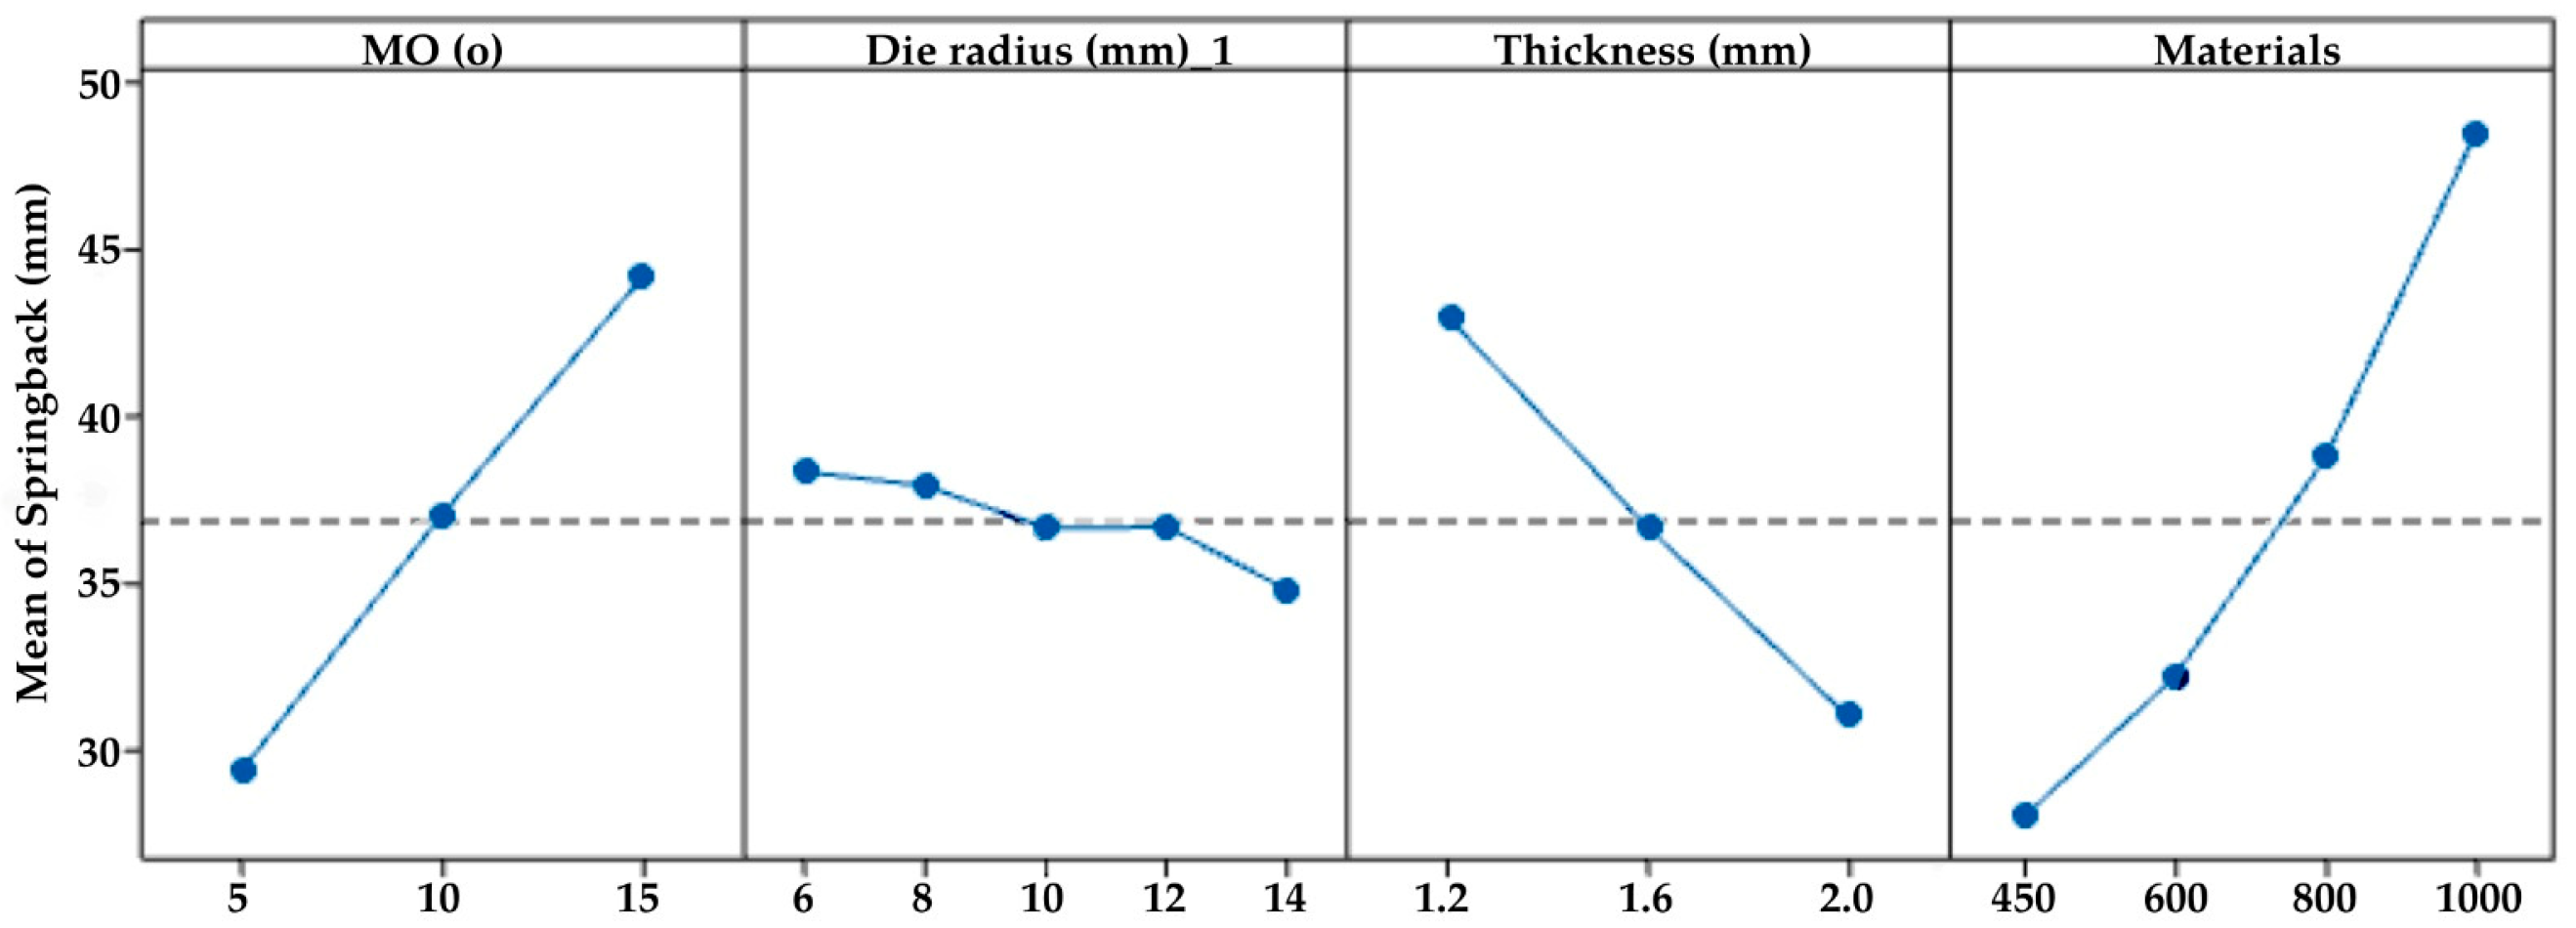
To evaluate the sensitivity of specific parameter levels, Tukey’s HSD tests were conducted (Table 7, Table 8, Table 9 and Table 10). All levels for mold opening angle (5°, 10°, 15°) (Table 7) and sheet thickness (1.2, 1.6, 2.0 mm) (Table 8) were found to be statistically distinct, confirming that reducing the die clearance and increasing thickness are robust strategies for mitigating springback. The Tukey HSD results for material grade (Table 9) further confirm that all four DP steels were statistically distinct, with DP1000 forming a separate group representing the peak springback levels. For die radius (Table 10), the results indicate that while R6 and R8 showed similar behavior (Group A), the R14 level was statistically unique and provided the most favorable condition for minimizing geometric deviations. These findings validate that every selected process parameter, though varying in impact, contributed significantly to the final part quality. The main effects plot in Figure 8 visually confirms these trends, illustrating the sharp increase in springback as a function of rising material strength and die opening.
Table 7.
Tukey test for MO (95% confidence).
Table 8.
Tukey test for sheet thickness (95% confidence).
Table 9.
Tukey test for materials (95% confidence).
Table 10.
Tukey test for die radius (95% confidence).
Figure 8.
Main effect plots for springback values.
4. Conclusions
This exhaustive study, which examined the springback behavior of U-shaped DP sheets utilized in the automotive industry under 180 distinct scenarios, revealed the pivotal correlation between material strength and forming parameters. The following key findings emerged from the analysis:
- An increase in sheet strength (DP450 to DP1000) has been demonstrated to result in a marked increase in the amount of springback. The maximum deviation observed was recorded at 64 mm in sheets with a thickness of 1.2 mm and a DP1000 composition.
- The thickness of the sheet constitutes the most significant physical barrier, thereby reducing springback. The most stable results were obtained in all scenarios with a sheet thickness of 2 mm.
- Research has demonstrated that optimizing the die clearance to a maximum of 10° and the bending radius to a minimum of R12 in DP1000 sheets is imperative for ensuring dimensional stability in precision automotive assemblies.
- The optimal springback parameters for the four material classes used in the experimental study were determined to be mold opening angle (MO): 5°, die radius (R): 14 mm, and sheet thickness (Thickness): 2 mm.
- The findings of the present study indicate that there is a high degree of concordance—specifically, an over 90% agreement—between Autoform R8 simulations and Atos 3D scanning data. This suggests that the method is reliable in terms of reducing costs and accelerating die design processes.
- Furthermore, the experimental reliability of this study is underpinned by the precision of the 3D optical scanning system, which exhibited a certified measurement uncertainty of ±0.02 mm and a repeatability deviation consistently below 0.01 mm. These quantitative metrics ensure that the measured springback deviations are statistically significant and independent of measurement noise.
- The objective of this study is to ascertain the forming limits for various DP grades utilized in the context of automotive BIW components. The findings of this study propose a design protocol that aims to minimize die revision expenses.
The scope of this study is constrained to U-shaped geometries and DP series sheets [40]. While the Hill48 model utilized herein remains a benchmark for industrial stability, its accuracy is limited in capturing nonlinear elastic recovery and Bauschinger effects [20,38]. A critical comparison with the literature suggests that for ultra-high-strength grades like DP1000, deviations may arise from the complex hardening behaviors that macroscopic quadratic models cannot fully represent [23,50]. Future studies will investigate the validity of these findings on more complex part geometries or other AHSS grades, such as TRIP and Martensitic [5,22].
Author Contributions
Conceptualization, B.T. and M.E.; methodology, M.E.; formal analysis, M.E.; investigation, B.T.; writing—original draft preparation, B.T.; writing—review and editing, M.E.; visualization, M.E.; supervision, M.E. All authors have read and agreed to the published version of the manuscript.
Funding
This research received no external funding.
Institutional Review Board Statement
Not applicable.
Informed Consent Statement
Not applicable.
Data Availability Statement
The original contributions presented in the study are included in the article, further inquiries can be directed to the corresponding author.
Acknowledgments
During the preparation of this article, the authors used Deeple (https://www.deepl.com/zh) to check the English translation. The authors have reviewed and edited the resulting text and assume full responsibility for the content of this publication.
Conflicts of Interest
The authors declare no conflicts of interest.
Abbreviations
The following abbreviations are used in this manuscript:
| AHSS | Advanced High Strength Steel |
| BIW | Body in White |
| DP | Dual Phase |
| CAD | Computer Aided Design |
| STL | Stereo Lithography |
| FEA | Finite Element Analysis |
| MO | Molding Opening Angle |
Appendix A
The data obtained from experimental measurements and numerical analysis are presented in Table A1.
Table A1.
Experimental and numerical analysis results.
References
- Cinar, Z.; Asmael, M.; Zeeshan, Q.; Safaei, B. Effect of springback on A6061 sheet metal bending: A review. J. Kejuruter. 2021, 33, 13–26. [Google Scholar] [CrossRef] [Scilit]
- Czerwinski, F. Current trends in automotive lightweighting strategies and materials. Materials 2021, 14, 6631. [Google Scholar] [CrossRef] [Scilit] [PubMed]
- Mayyas, A.; Qattawi, A.; Omar, M.; Shan, D. Design for sustainability in automotive industry: A comprehensive review. Renew. Sustain. Energy Rev. 2012, 16, 1845–1862. [Google Scholar] [CrossRef] [Scilit]
- Quadfasel, A.; Lohmar, J.; Hirt, G. Investigations on springback in high manganese TWIP-steels using U-profile draw bending. Procedia Eng. 2017, 207, 1582–1587. [Google Scholar] [CrossRef] [Scilit]
- Julsri, W.; Suranuntchai, S.; Uthaisangsuk, V. Study of springback effect of AHS steels using a microstructure based modeling. Int. J. Mech. Sci. 2018, 135, 499–516. [Google Scholar] [CrossRef] [Scilit]
- Lu, Z.; Li, D.; Cao, L.; Cui, H.; Xu, J. Springback Control in Complex Sheet-Metal Forming Based on Advanced High-Strength Steel. Coatings 2023, 13, 930. [Google Scholar] [CrossRef] [Scilit]
- Neto, D.M.; Oliveira, M.C.; Santos, A.D.; Alves, J.L.; Menezes, L.F. Influence of boundary conditions on the prediction of springback and wrinkling in sheet metal forming. Int. J. Mech. Sci. 2017, 122, 244–254. [Google Scholar] [CrossRef] [Scilit]
- Phaoniam, R.; Lawanwong, K. Effect of weld-line position on springback behavior in advanced high-strength steel tailor-welded blanks on hat-shaped bending application. J. Adv. Join. Process. 2024, 10, 100241. [Google Scholar] [CrossRef] [Scilit]
- Yetna N’jock, M.; Badreddine, H.; Labergere, C.; Yue, Z.; Saanouni, K.; Dang, V.T. An application of fully coupled ductile damage model considering induced anisotropies on springback prediction of advanced high strength steel materials. Int. J. Mater. Form. 2020, 14, 739–752. [Google Scholar] [CrossRef] [Scilit]
- Knezevic, M. Crystal plasticity-based finite element simulations of load reversals and hat-shaped draw-bending for predicting the springback behavior of dual-phase steel sheets. Int. J. Solids Struct. 2024, 300, 112924. [Google Scholar] [CrossRef] [Scilit]
- Yoon, S.-Y.; Barlat, F.; Lee, S.-Y.; Kim, J.-H.; Wi, M.-S.; Kim, D.-J. Finite element implementation of hydrostatic pressure-sensitive plasticity and its application to distortional hardening model and sheet metal forming simulations. J. Mater. Process. Technol. 2022, 302, 117494. [Google Scholar] [CrossRef] [Scilit]
- Bingqian, Y.; Zeng, Y.; Yang, H.; Oscoz, M.P.; Ortiz, M.; Coenen, F.; Nguyen, A. Springback prediction using point series and deep learning. Int. J. Adv. Manuf. Technol. 2024, 132, 4723–4735. [Google Scholar] [CrossRef] [Scilit]
- Jamli, M.R.; Farid, N.M. The sustainability of neural network applications within finite element analysis in sheet metal forming: A review. Measurement 2019, 138, 446–460. [Google Scholar] [CrossRef] [Scilit]
- Ma’mun, S.; Darmawan, A.S.; Anggono, A.D.; Hamid, A.; Tamura, H.; Purnomo, M.R.A. Die design optimization on sheet metal forming with considering the phenomenon of springback to improve product quality. MATEC Web Conf. 2018, 154, 01105. [Google Scholar] [CrossRef] [Scilit]
- Yang, X.; Choi, C.; Sever, N.K.; Altan, T. Prediction of springback in air-bending of Advanced High Strength steel (DP780) considering Young׳s modulus variation and with a piecewise hardening function. Int. J. Mech. Sci. 2016, 105, 266–272. [Google Scholar] [CrossRef] [Scilit]
- Chen, C.; Liang, J.; Li, Y.; Liang, C.; Jin, W. Springback Analysis of Flexible Stretch Bending of Multi-Point Roller Dies Process for Y-Profile under Different Process Parameters. Metals 2021, 11, 646. [Google Scholar] [CrossRef] [Scilit]
- Gok, K.; Erdem, M.; Alkan, M.A.; Gok, A. The effects onto springback of waiting time in sheet metal forming. J. Eng. Fundam. 2015, 2, 69–73. [Google Scholar] [CrossRef] [Scilit]
- Hou, Y.; Min, J.; Lin, J.; Liu, Z.; Carsley, J.E.; Stoughton, T.B. Springback prediction of sheet metals using improved material models. Procedia Eng. 2017, 207, 173–178. [Google Scholar] [CrossRef] [Scilit]
- Meng, Q.; Zhai, R.; Fu, P.; Zhang, Y.; Zhao, J. Springback analysis of rotary bending considering strain paths. J. Mater. Process. Technol. 2023, 315, 117930. [Google Scholar] [CrossRef] [Scilit]
- Yoshida, F. Description of elastic–plastic stress–strain transition in cyclic plasticity and its effect on springback prediction. Int. J. Mater. Form. 2022, 15, 12. [Google Scholar] [CrossRef] [Scilit]
- Zhu, Y.X.; Chen, W.; Li, H.P.; Liu, Y.L.; Chen, L. Springback study of RDB of rectangular H96 tube. Int. J. Mech. Sci. 2018, 138–139, 282–294. [Google Scholar] [CrossRef] [Scilit]
- Lee, S.-Y.; Yoon, S.-Y.; Kim, J.-H.; Barlat, F.; Oh, K.-S. Evaluation of loading-path-dependent constitutive models for springback prediction in martensitic steel forming. Int. J. Mech. Sci. 2023, 251, 108317. [Google Scholar] [CrossRef] [Scilit]
- Liu, Z.; Hou, Y.; He, R.; Ye, Y.; Niu, C.; Min, J. Machine learning for extending capability of mechanical characterization to improve springback prediction of a quenching and partitioning steel. J. Mater. Process. Technol. 2022, 308, 117737. [Google Scholar] [CrossRef] [Scilit]
- Zhang, C.; Lou, Y. Influences of the evolving plastic behavior of sheet metal on V-bending and springback analysis considering different stress states. Int. J. Plast. 2024, 173, 103889. [Google Scholar] [CrossRef] [Scilit]
- Hajiahmadi, S.; Moslemi Naeini, H.; Talebi-Ghadikolaee, H.; Safdarian, R.; Zeinolabedin-Beygi, A. Insights into spring-back prediction: A comparative analysis of constitutive models for perforated U-shaped roll-formed steel profiles. Int. J. Adv. Manuf. Technol. 2024, 134, 1915–1933. [Google Scholar] [CrossRef] [Scilit]
- El Mrabti, I.; Touache, A.; El Hakimi, A.; Chamat, A. Springback optimization of deep drawing process based on FEM-ANN-PSO strategy. Struct. Multidiscip. Optim. 2021, 64, 321–333. [Google Scholar] [CrossRef] [Scilit]
- Nur, R.; Suyuti, M.A.; Iswar, M.; Muttaqin, A.N. Springback Analysis in the Bending Process of V-shaped Stainless Steel AISI 304 Using Central Composite Design (CCD) Approach. E3S Web Conf. 2024, 517, 12001. [Google Scholar] [CrossRef] [Scilit]
- Mithu, M.A.H.; Karim, M.A.; Taj, F.A.; Rahman, A. Predicting springback in V-bending: Effects of load, load holding time, and heat treatment on common sheet-metal forming operations. Mater. Today Commun. 2025, 43, 111668. [Google Scholar] [CrossRef] [Scilit]
- Wasif, M.; Rababah, M.; Fatima, A.; Baig, S.U.R. Prediction of Springback using the Machine Learning Technique in high-tensile strength sheet metal during the V-Bending Process. Jordan J. Mech. Ind. Eng. 2023, 17, 481–488. [Google Scholar]
- Sathish, T. GAC-ANN Technique for Prediction of Spring Back Effect in Wipe Bending Process of Sheet Metal. Mater. Today Proc. 2018, 5, 14448–14457. [Google Scholar] [CrossRef] [Scilit]
- Srinivasan, R.; Vasudevan, D.; Padmanabhan, P. Application of response surface methodology for predicting springback in air bending of electro galvanised steel sheets. Int. J. Mater. Eng. Innov. 2013, 4, 35–56. [Google Scholar] [CrossRef] [Scilit]
- Karabulut, S.; Esen, İ. Finite element analysis of springback of high-strength metal SCGA1180DUB while U-channeling, according to wall angle and die radius. Res. Rev. J. Mater. Sci. 2021, 10, 1–25. [Google Scholar]
- Pritima, D.; Veerappan, G.; Patel, V.D.; Parthasarathy, N.R. Analysis of spring back behaviour during bending of AISI 1045 sheet metal. Mater. Today Proc. 2022, 59, 1575–1580. [Google Scholar] [CrossRef] [Scilit]
- Esener, E.; Firat, M.; Yenice, M. Sac Metal Şekillendirme Proseslerinde Geri Esneme Telafisi. In Proceedings of the 7. Otomotiv Teknolojileri Kongresi, Bursa, Turkey, 26–27 May 2014; pp. 1–5. [Google Scholar]
- Wasif, M.; Fatima, A.; Ahmed, A.; Iqbal, S.A. Investigation and optimization of parameters for the reduced springback in JSC-590 sheet metals occurred during the V-bending process. Trans. Indian Inst. Met. 2021, 74, 2751–2760. [Google Scholar] [CrossRef] [Scilit]
- Rahdiana, N.; Sukarman; Khoirudin; Abdulah, A.; Shieddieque, A.D. Spring-Back Analysis of the Vee Bending Process for High-Strength Stainless Steel. J. Teknol. 2023, 85, 135–144. [Google Scholar] [CrossRef] [Scilit]
- Folle, L.F.; Lima, T.N.; Santos, M.P.S.; Callegari, B.; Silva, B.C.d.S.; Zamorano, L.G.S.; Coelho, R.S. A Review on Sheet Metal Forming Behavior in High-Strength Steels and the Use of Numerical Simulations. Metals 2024, 14, 1428. [Google Scholar] [CrossRef] [Scilit]
- Wagoner, R.H.; Lim, H.; Lee, M.-G. Advanced Issues in springback. Int. J. Plast. 2013, 45, 3–20. [Google Scholar] [CrossRef] [Scilit]
- Tasan, C.C.; Diehl, M.; Yan, D.; Bechtold, M.; Roters, F.; Schemmann, L.; Zheng, C.; Peranio, N.; Ponge, D.; Koyama, M.; et al. An Overview of Dual-Phase Steels: Advances in Microstructure-Oriented Processing and Micromechanically Guided Design. Annu. Rev. Mater. Res. 2015, 45, 391–431. [Google Scholar] [CrossRef] [Scilit]
- Tunalı, B. Otomotiv Endüstrisinde Kullanılan U Formlu DP Sacların Geri Esneme Davranışının İncelenmesi. Master’s Thesis, Kütahya Dumlupınar Üniversitesi, Kütahya, Turkey, 2019. [Google Scholar]
- ASTM E8/E8M-11; Standard Test Methods for Tension Testing of Metallic Materials. ASTM International: West Conshohocken, PA, USA, 2011.
- Bârsan, A.; Racz, S.-G.; Breaz, R.; Crenganiş, M. Evaluation of the dimensional accuracy through 3d optical scanning in incremental sheet forming. Mater. Today Proc. 2023, 93, 594–598. [Google Scholar] [CrossRef] [Scilit]
- Boesemann, W.; Godding, R.; Huette, H. Photogrammetric measurement techniques for quality control in sheet metal forming. Int. Arch. Photogramm. Remote Sens. 2000, 33, 291–298. [Google Scholar]
- Maaß, P.; Piotrowska-Kurczewski, I.; Agour, M.; von Freyberg, A.; Staar, B.; Falldorf, C.; Fischer, A.; Lütjen, M.; Freitag, M.; Goch, G. Quality control and characterization. In Cold Micro Metal Forming: Research Report of the Collaborative Research Center “Micro Cold Forming” (SFB 747), Bremen, Germany; Springer: Berlin/Heidelberg, Germany, 2019; pp. 253–310. [Google Scholar]
- Hill, R. A theory of the yielding and plastic flow of anisotropic metals. Proc. R. Soc. London. Ser. A Math. Phys. Sci. 1948, 193, 281–297. [Google Scholar] [CrossRef] [Scilit]
- Xue, X.; Liao, J.; Vincze, G.; Pereira, A.B.; Barlat, F. Experimental assessment of nonlinear elastic behaviour of dual-phase steels and application to springback prediction. Int. J. Mech. Sci. 2016, 117, 1–15. [Google Scholar] [CrossRef] [Scilit]
- Vladimirov, I.; Pietryga, M.; Reese, S. Prediction of springback in sheet forming by a new finite strain model with nonlinear kinematic and isotropic hardening. J. Mater. Process. Technol. 2009, 209, 4062–4075. [Google Scholar] [CrossRef] [Scilit]
- Cadet, G.; Paredes, M. Convergence analysis and mesh optimization of finite element analysis related to helical springs. Mech. Ind. 2024, 25, 22. [Google Scholar] [CrossRef] [Scilit]
- Trzepiecinski, T.; Lemu, H.G. Effect of computational parameters on springback prediction by numerical simulation. Metals 2017, 7, 380. [Google Scholar] [CrossRef] [Scilit]
- Chongthairungruang, B.; Uthaisangsuk, V.; Suranuntchai, S.; Jirathearanat, S. Springback prediction in sheet metal forming of high strength steels. Mater. Des. 2013, 50, 253–266. [Google Scholar] [CrossRef] [Scilit]
- Thipprakmas, S.; Phanitwong, W. Process parameter design of spring-back and spring-go in V-bending process using Taguchi technique. Mater. Des. 2011, 32, 4430–4436. [Google Scholar] [CrossRef] [Scilit]

Disclaimer/Publisher’s Note: The statements, opinions and data contained in all publications are solely those of the individual author(s) and contributor(s) and not of MDPI and/or the editor(s). MDPI and/or the editor(s) disclaim responsibility for any injury to people or property resulting from any ideas, methods, instructions or products referred to in the content. |
© 2026 by the authors. Licensee MDPI, Basel, Switzerland. This article is an open access article distributed under the terms and conditions of the Creative Commons Attribution (CC BY) license.