


Abstract
Understanding the drivers of understory vegetation diversity in plantation forests is critical for ecosystem management, yet traditional analytical methods are often constrained by assumptions of normality, linearity, and independence among variables. This study used the geographical detector (GeoDetector) method to quantify the independent and interactive effects of environmental factors on understory plant diversity in Pinus tabuliformis plantations. We established 36 standard plots at the Shihe Forest Farm in the Zhongtiao Mountains of Shanxi Province, China. A total of 25 environmental factors, encompassing stand structure, topography, soil physical properties, and soil chemical properties, were examined as potential drivers of shrub-layer and herb-layer diversity. The results identified distinct key drivers for different vegetation layers. Shrub-layer diversity was primarily influenced by regeneration potential, aspect, soil non-capillary porosity, and total soil nitrogen. In contrast, herb-layer diversity was mainly driven by forest type, slope, soil non-capillary porosity, and the soil nitrogen-to-phosphorus ratio. Factor interactions were widespread, with nonlinear enhancement and bivariate enhancement being the dominant types. The combined effect of interacting factors was consistently stronger than that of any single factor alone. Compared to conventional statistical methods, GeoDetector does not rely on linear assumptions and is unaffected by multicollinearity. This allows for more effective identification of drivers that have low independent explanatory power yet high ecological importance, as well as their interactive effects. This study demonstrates that vegetation diversity in P. tabuliformis plantations results from the synergistic effects of multiple factors. The findings provide a theoretical basis for managing and enhancing understory biodiversity in plantation ecosystems. Furthermore, they offer a novel and effective analytical framework for investigating the environmental driving mechanisms of understory vegetation diversity.
1. Introduction
Understory plant diversity is crucial for maintaining overall forest biodiversity and ecosystem stability [1]. Although understory vegetation contributes relatively little to total forest biomass, its species richness often surpasses that of the canopy layer, particularly in plantation forests [2]. These understory plants reflect the composition, structure, and developmental stage of plantation ecosystems [3] and play a key role in supporting nutrient cycling and energy flow [4,5]. Furthermore, existing studies have shown that greater understory diversity helps enhance the stability of plantation ecosystems [6].
Pinus tabuliformis is a major afforestation species in northern China and is widely distributed in the country’s temperate coniferous forests [7]. Currently, most P. tabuliformis plantations exist as even-aged monocultures. This simplified stand structure has resulted in problems such as monotonous understory vegetation, declining soil fertility, and imbalances in ecosystem nutrient cycling [8,9], which significantly weaken the resistance and resilience of these forest ecosystems. Therefore, a thorough understanding of the key factors influencing understory vegetation diversity in P. tabuliformis plantations is crucial for enhancing ecosystem stability and promoting the long-term sustainability of soil fertility.
Previous research has examined how abiotic and biotic factors influence understory vegetation biodiversity from multiple angles—including climate [10], topography [11,12], stand structure [13], soil properties [14,15], and management practices [16]. Nonetheless, limitations related to research methodology, scale, sample representativeness, and interactions among factors have left the conclusions uncertain. Most studies addressing biodiversity–environment relationships employ multivariate statistical techniques such as correlation analysis (CA) [17,18], principal component analysis (PCA) [19], redundancy analysis (RDA) [20], and variance partitioning analysis (VPA) [21]. However, the reliability of these methods is often limited by issues such as sample representativeness, underlying statistical assumptions, and correlations among environmental variables—all of which can obstruct the formulation of clear mechanistic models [22,23].
To address these limitations, Wang et al. [24,25] introduced the geographical detector (GeoDetector), a method that does not assume linear relationships and is unaffected by multicollinearity among variables. It is capable of quantifying the contribution of individual factors and detecting interactions between them. GeoDetector has been widely used to assess drivers in various fields, such as soil pollution [26], water contamination [27], land surface temperature [28], and large-scale vegetation dynamics [29]. However, its application in plot-level forestry research remains relatively limited.
The Zhongtiao Mountains in Shanxi represent a key area for biodiversity research in China, where P. tabuliformis plantations support relatively rich understory vegetation. To objectively analyze the factors influencing understory diversity in these plantations—an essential step toward optimizing their ecological stability—this study employs GeoDetector to evaluate both the individual and interactive effects of environmental factors on understory plant diversity. Based on ecological niche theory and the methodological characteristics of GeoDetector, we propose the following hypotheses: (1) the key environmental factors driving understory diversity differ between the shrub and herb layers. (2) environmental factors do not operate independently and the combined effect of interacting factors on understory diversity exceeds the sum of their individual effects. (3) by relaxing linear assumptions and remaining robust to multicollinearity, GeoDetector can more effectively identify the effects of factors and their interactions on understory diversity than conventional methods.
The specific objectives of the study are to: (1) quantify the contribution of environmental factors—including stand structure, topography, and soil properties—to understory species diversity and compare differences between the shrub and herb layers; (2) analyze interaction effects among factors on species diversity; and (3) evaluate the strengths and limitations of traditional statistical methods relative to GeoDetector. The findings are expected to provide a methodological framework for habitat management aimed at enhancing understory plant diversity in plantation ecosystems.
2. Study Area and Data Sources
2.1. Study Area
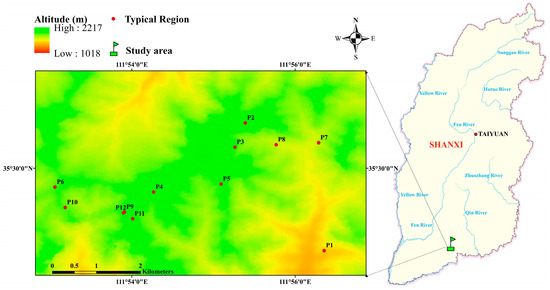
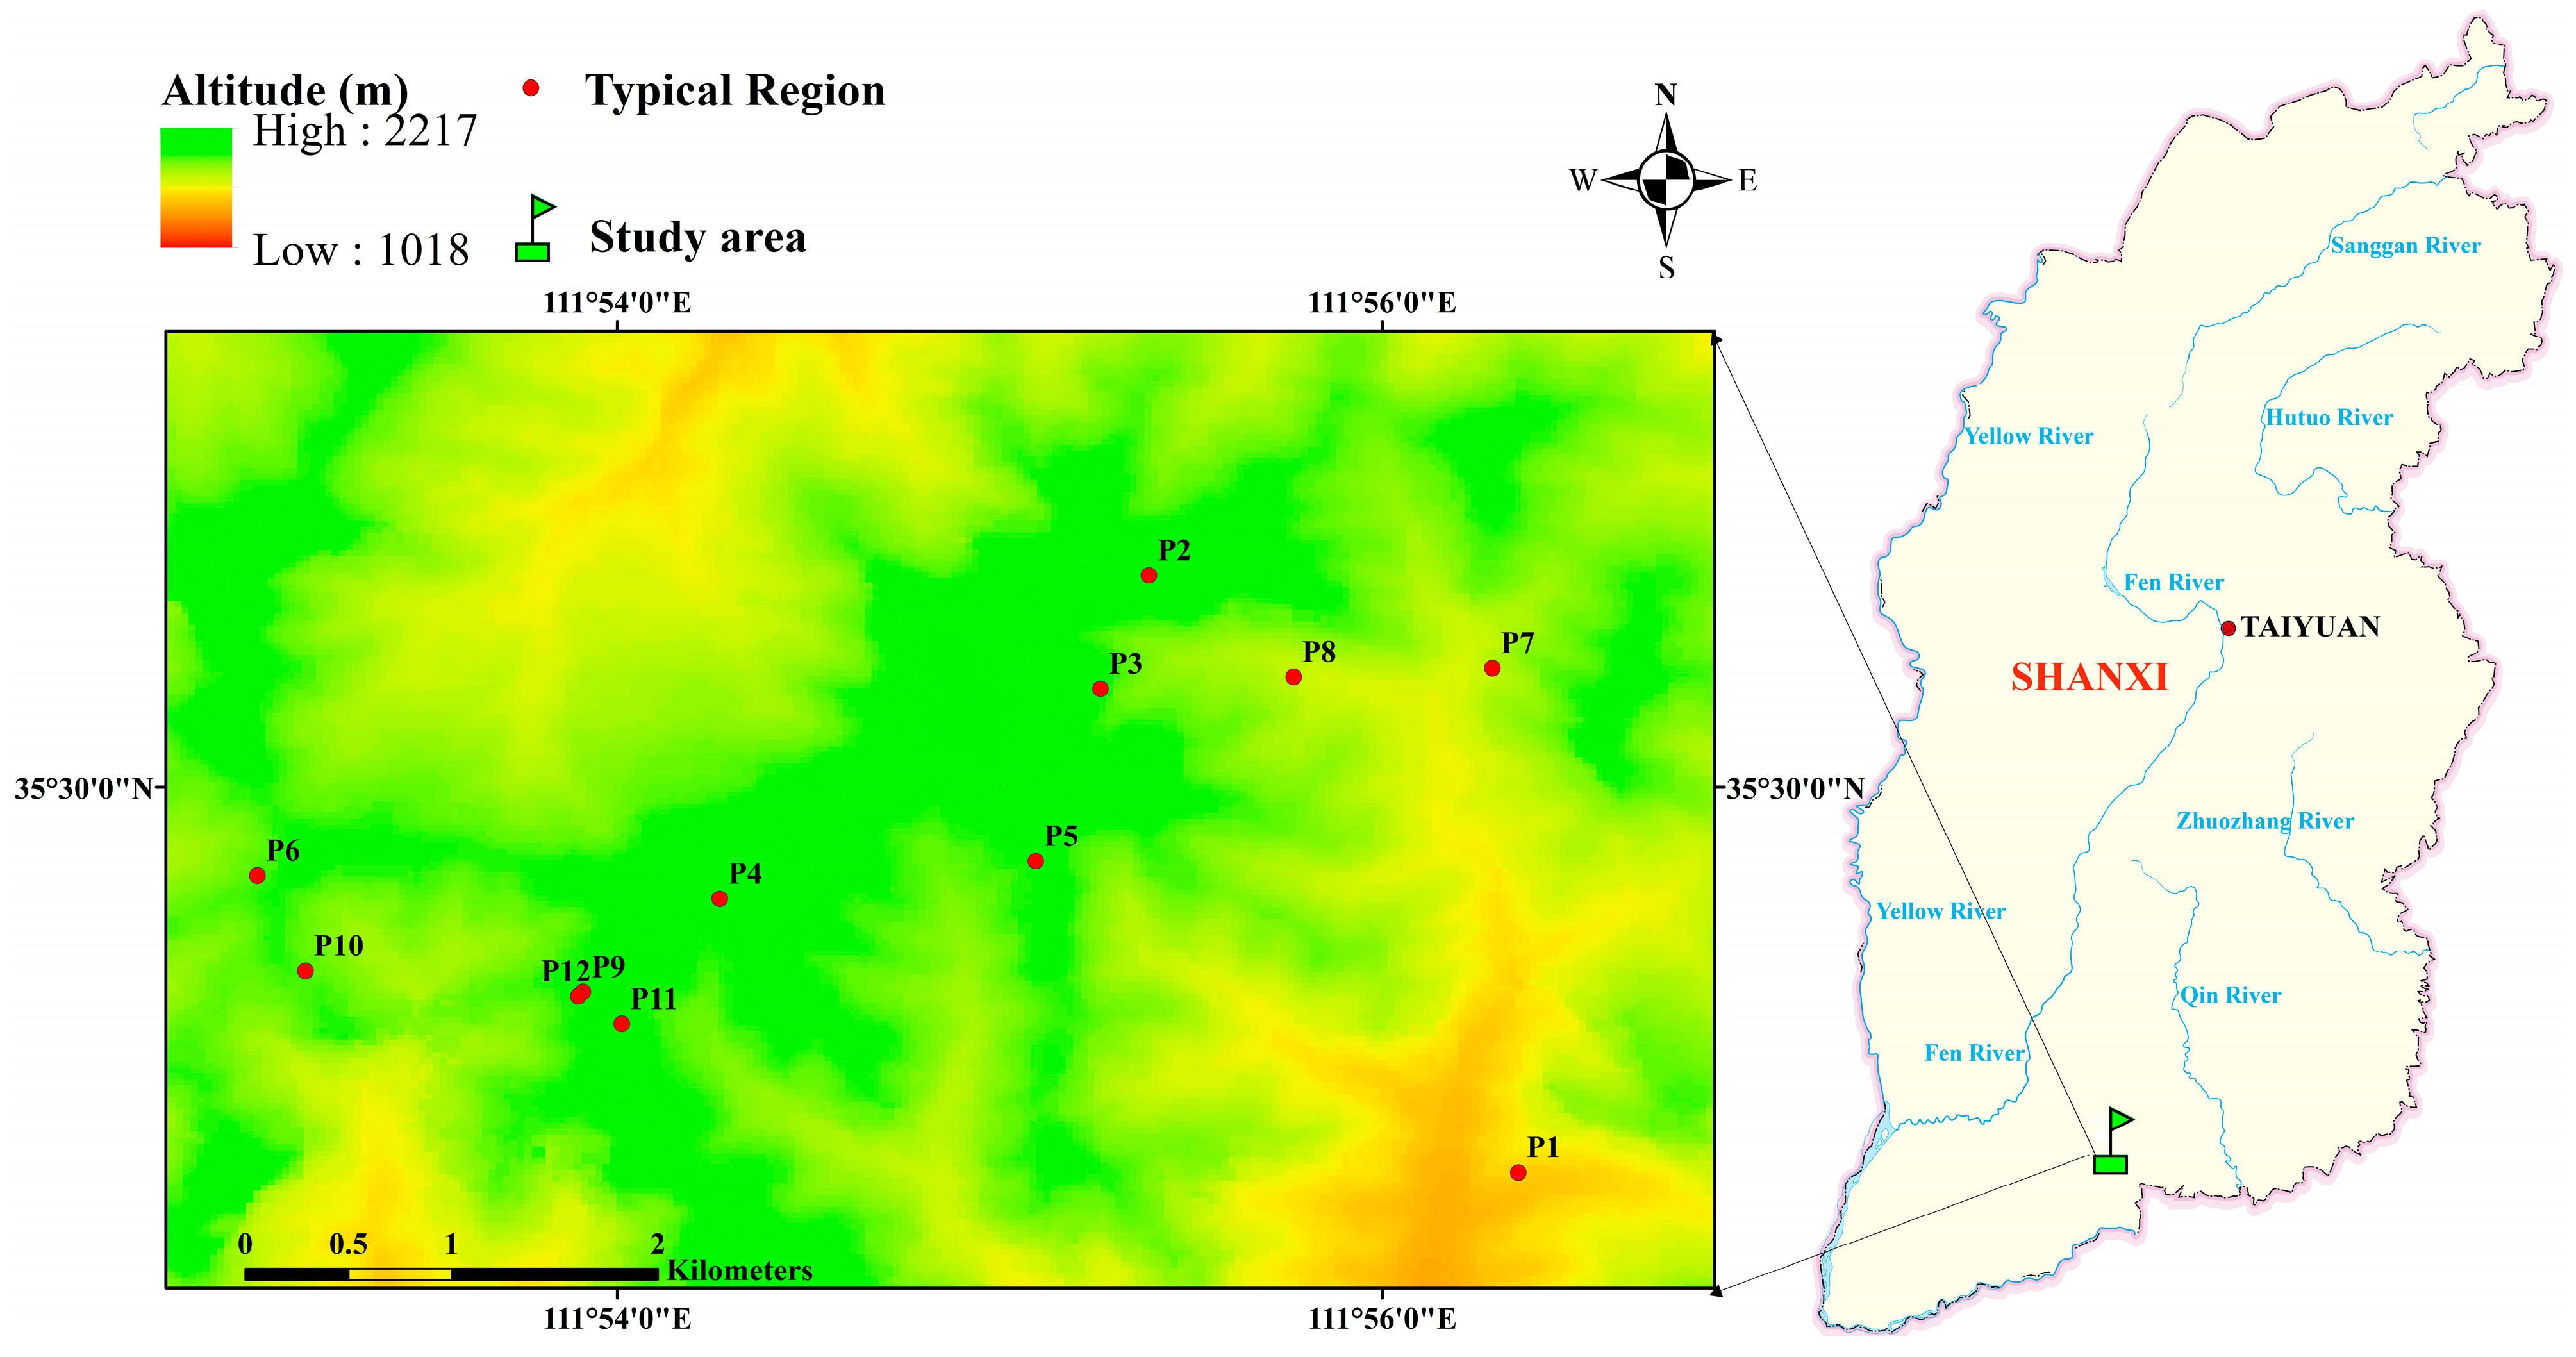
The study area is located at the Shihe Forest Farm within the Zhongtiao Mountain Forestry Area, Shanxi Province, China (111°50′–112°00′ E, 35°31′–35°51′ N) in Figure 1. This region experiences a warm-temperate continental monsoon climate, with an elevation ranging from 1500 m to 2016 m. The mean annual temperature is 11.8 °C, and the mean annual precipitation is 623 mm. Geomorphologically, the area lies in a mid-elevation mountainous zone situated between the Taihang Mountains and the Qinling Mountains, and brown soil is the predominant soil type. The vegetation within the area is rich in species diversity. Based on our field surveys, the vegetation within the area is rich in species diversity. The tree layer is dominated by P. tabuliformis, accompanied by species such as P. armandii and Quercus mongolica. The shrub layer is primarily composed of Spiraea trilobata, Forsythia suspensa, Ziziphus jujuba var. spinosa, Cotinus coggygria, and Vitex negundo var. heterophylla. The herbaceous layer is chiefly represented by Artemisia spp., Bothriochloa ischaemum, and Carex spp.
Figure 1.
Study area and typical regions.
2.2. Plots Layout and Field Investigation
The fieldwork was carried out in June 2018. To ensure a representative sampling of understory plants, we selected 12 typical regions, with three 20 m × 20 m plots established in each region, for a total of 36 plots. The spatial distribution of the plots is presented in Figure 1, and detailed plot characteristics are provided in Table 1. For each plot, we recorded the geographic coordinates, forest age (FA), forest type (FT), crown closure (CC), altitude (AL), aspect (AS), and slope (SP). We measured the height and diameter at breast height (DBH) of all trees with DBH > 5 cm, and recorded the number of seedlings (all species) as well as young P. tabuliformis saplings within each plot.
Table 1.
Summary of the P. tabuliformis plots information.
To assess stand density and regeneration capacity, we applied the Reineke stand density index (SDI) [30] (Equation (2)) and the regeneration potential (RP) of P. tabuliformis (Equation (1)).
where SYN represents the number of P. tabuliformis seedlings and young trees, TN denotes the total number of trees in the plot, S is the plot area (ha), is the mean square diameter (or quadratic mean diameter), is the reference diameter (), and is the natural thinning coefficient of the stand ().
A nested sampling design was implemented within each P. tabuliformis plot. Specifically, 16 shrub quadrats (5 m × 5 m) were systematically established using an adjacent grid layout, and an herb quadrat (1 m × 1 m) was nested at the center of each shrub quadrat. This configuration resulted in tatal of 576 quadrats for each layer. Within each quadrat, the species name and abundance of both shrub and herb layers were recorded. From these data, we calculated four species diversity indices for both the shrub and herb layers: the Gleason richness index, Shannon–Wiener diversity index, Simpson index, and Pielou evenness index (see Section 2.4 for details). The plot surveys recorded 76 shrub species and 113 herb species.
In each plot, soil samples for physical property measurements were collected from the 0–20 cm depth at five points arranged along the diagonal using a cutting ring with an inner diameter of 3.5 cm. Additionally, soil samples were collected using Ziplock bags, air-dried, passed through a 2 mm sieve, and subsequently used for the determination of soil chemical properties.
The descriptive statistics of environmental factors across the 36 sample plots in Table 2. Among stand structure factors, regeneration potential (RP) showed the highest variability (CV = 144.42%), indicating substantial heterogeneity in seedling regeneration across plots, while harvest year (HY) exhibited the lowest variation (CV = 0.13%). For topographic factors, slope (SP) demonstrated moderate variability (CV = 40.05%), whereas altitude (AL) was relatively stable across plots (CV = 7.49%). Normality tests (Kolmogorov–Smirnov) indicated that only SP followed a normal distribution (p > 0.05).
Table 2.
The descriptive statistics of the P. tabuliformis plots information.
2.3. Laboratory Analysis
Soil physical properties were measured using soil cores collected with a cutting ring. Physical properties—including soil moisture content (SMC), maximum water-holding capacity (MWHC), capillary water-holding capacity (CWHC), field capacity (FC), non-capillary porosity (NCP), capillary porosity (CP), and total porosity (TP)—were measured following the standard method LY/T 1215-1999 [31].
Air-dried soil samples were used for the determination of soil chemical properties. For chemical analysis, subsamples were air-dried, finely ground, and passed through a 60-mesh sieve. Soil organic carbon (SOC, g·kg−1) was determined by the potassium dichromate external-heating method [32]. Soil total nitrogen (STN, g·kg−1) was measured using the Kjeldahl method [33]. Soil alkali-hydrolyzable nitrogen (SAN, mg·kg−1) was quantified by the alkali-diffusion method [34]. Soil total phosphorus (STP, g·kg−1) was analyzed by concentrated sulfuric-acid–perchloric-acid digestion followed by molybdenum-antimony colorimetry [35]. Soil available phosphorus (SAP, mg·kg−1) was extracted with Olsen reagent and measured colorimetrically [36]. Soil pH was determined potentiometrically [37].
Descriptive statistics for soil physical and chemical properties across the 36 plots are summarized in Table 3. Among soil physical properties, non-capillary porosity (NCP) exhibited the highest variability (CV = 35.46%), while total porosity (TP) showed the lowest (CV = 12.64%). For soil chemical properties, soil organic carbon (SOC) and total nitrogen (STN) displayed relatively high variation (CV ≈ 30%), whereas the carbon-to-nitrogen ratio (C:N) and pH were relatively stable across plots (CV < 10%). Based on the Kolmogorov–Smirnov test, among the soil physical properties, MWFC, CWHC, and NCP met the assumption of normal distribution. Among the soil chemical properties, C:N ratio, C:P ratio, N:P ratio, SAN, and SAP were normally distributed. These baseline characteristics provide context for the environmental conditions under which understory vegetation was sampled.
Table 3.
The descriptive statistics of the soil factors.
2.4. Understory Plant Diversity Index
The biodiversity of the shrub and herb layers was assessed using the Gleason (GL) (Equation (3)), Shannon–Wiener (SW) (Equation (4)), Simpson (SI) (Equation (5)) and Pielou (PI) (Equation (6)) indices.
where N represents the number of species recorded in the plot, A denotes the plot area, and is the proportional abundance of species i in the community.
The normality of biodiversity indices for the shrub and herb layers was evaluated using the Kolmogorov–Smirnov (K-S) test. Based on the distribution characteristics, Pearson’s correlation coefficient was applied to assess relationships among normally distributed variables, while Spearman’s rank correlation coefficient was used for non-normally distributed variables.
The descriptive statistics of understory plant diversity indices are presented in Table 4. For the shrub layer, the Gleason index exhibited the highest variability (CV = 24%), while the Pielou index was the most stable (CV = 16%). In the herb layer, the Gleason index showed the greatest variation (CV = 38%), indicating that species richness fluctuates more widely in the herb layer than in the shrub layer. In the shrub layer, the Shannon–Wiener and Pielou indices met the assumption of normality and were thus analyzed using Pearson correlation. All other pairwise correlations among diversity indices in this layer were assessed using Spearman correlation. In the herb layer, only the Shannon–Wiener index followed a normal distribution; therefore, Spearman correlation was applied to all correlations between indices.
Table 4.
The descriptive statistics of the understory plant diversity indices.
Following the approach of Wu et al. [38], we selected a single representative index for each vegetation layer based on its correlation strength with the other three indices. All analyses were performed in SPSS 18.0 (SPSS Inc., Chicago, IL, USA). Correlation analysis showed that in Table 5. The four diversity indices were generally significantly correlated with each other in both layers (R2 ≥ 0.48, p < 0.01). The strongest correlation was observed between the Shannon and Simpson indices in the herb layer (R2 = 0.92, p < 0.01) and between the Shannon and Pielou indices in the shrub layer (R2 = 0.95, p < 0.01). The Gleason and Pielou indices were the most weakly correlated pair in both layers (Shrub: R2 = 0.48, p < 0.01; Herb: R2 = 0.50, p < 0.01), suggesting that species richness and evenness capture complementary aspects of community structure. So the Shannon index was selected as the representative diversity metric for subsequent analysis due to its strong overall correlation with the other indices.
Table 5.
Relationship between four indices for the shrub and herb layers.
2.5. GeoDetector
The GeoDetector is a spatial analysis model based on analysis of variance (ANOVA) that quantifies spatially stratified heterogeneity [24]. The model comprises four detectors—risk, factor, ecological, and interaction detectors—which evaluate the influence of individual factors and their interactions on a response variable. In this study, the factor detector and interaction detector were employed. The factor detector assessed the individual contribution of each of the 25 explanatory factors to shrub- and herb-layer diversity, while the interaction detector examined how the combined effects of factor pairs influence diversity. The corresponding equations are presented below:
- Data Preprocessing
GeoDetector accommodates both numerical and categorical data. To meet its analytical requirement of maximizing between-stratum heterogeneity while minimizing within-stratum variation, all influencing factors were discretized into strata. Forest type (FT), forest age (FA), and aspect (AS) were classified based on field-survey criteria. Slope (SP), stand density, altitude, and soil physical–chemical properties were stratified using the natural breaks method [24,25]. Each stratum contained at least two sample plots. The resulting factor stratification is presented in Table 6.
Table 6.
The stratification of the factors influencing understory species diversity.
- Factor detector
The factor detector quantifies the influence of environmental factors (X) on shrub and herb layer diversity (Y) using the power of determinant (q statistic; Equation (7)) [24,25].
where L is the total number of strata (or classes) of the independent variable X. N and represent the total sample size and the sample size within stratum , respectively. σ2 and denote the variance of the dependent variable Y (shrub and herb layer diversity) for the entire dataset and for stratum , respectively. The value of q ranges from 0 to 1, indicating the degree to which factor X explains the spatial stratification of Y. Specifically, q = 1 suggests that factor X completely controls the distribution of shrub and herb layer diversity, whereas q = 0 implies no explanatory power.
- Interaction detector
The interaction detector assesses the combined effect of two factors (X1 and X2) by calculating the interactive determinant power (q-value) of their interaction term (X1∩X2). This analysis determines whether the factors operate independently or if their interaction enhances or diminishes the explanatory power on the dependent variable. The results are categorized into five distinct interaction types, as defined in Table 7.
Table 7.
The types of interactions between two factors [39].
This study quantifies factor interactions by computing the q-statistic for the intersection term X1∩X2 (denoted as q_{X1∩X2}) and comparing it to the individual q-values of X1 and X2 (q_{X1} and q_{X2}, respectively). The analysis was conducted using the GeoDetector Software in Excel from http://geodetector.cn/ (accessed on 11 June 2025).
2.6. Conventional Methods
Traditional multivariate statistical methods, including Principal Component Analysis (PCA), Correspondence Analysis (CA), Redundancy Analysis (RDA), and Variation Partitioning Analysis (VPA), were employed to analyze the effects of environmental factors on the biodiversity of understory vegetation in P. tabuliformis plantations. The results were then compared with those obtained from the GeoDetector model. Given that PCA, CA, and RDA necessitate quantitative variables, categorical data were incorporated as dummy variables. Dimensionality reduction was achieved via PCA on the 25 factors, wherein components with eigenvalues exceeding 1.0 were extracted. Subsequent CA and RDA were conducted on these principal components to mitigate multicollinearity issues. For VPA—a method capable of handling only 2 to 4 explanatory matrices—the factors were organized into four groups: topography, forest stand structure, soil physical properties, and soil chemical properties (Table 2). Multicollinearity was assessed using the Variance Inflation Factor (VIF) calculated with the vif() function from the car package, and factors exhibiting VIF > 10 were excluded. VPA was then utilized to quantify the pure and shared effects of these four factor groups on shrub and herb layer biodiversity. All statistical analyses were performed in R 4.5.2 software. Specifically, PCA was conducted using the prcomp() function from the stats package, CA was performed using the cca() function (with no constraints) from the vegan package, and RDA and VPA were implemented using the rda() and varpart() functions, respectively, from the vegan package.
3. Results
3.1. Individual Effects of Environmental Factors Across Vegetation Layers
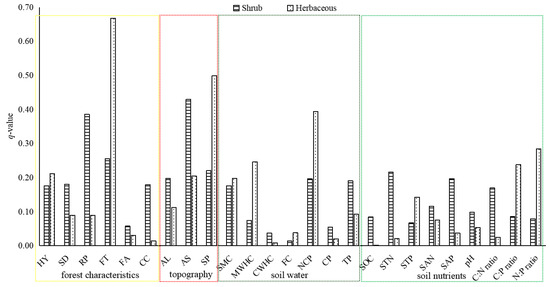
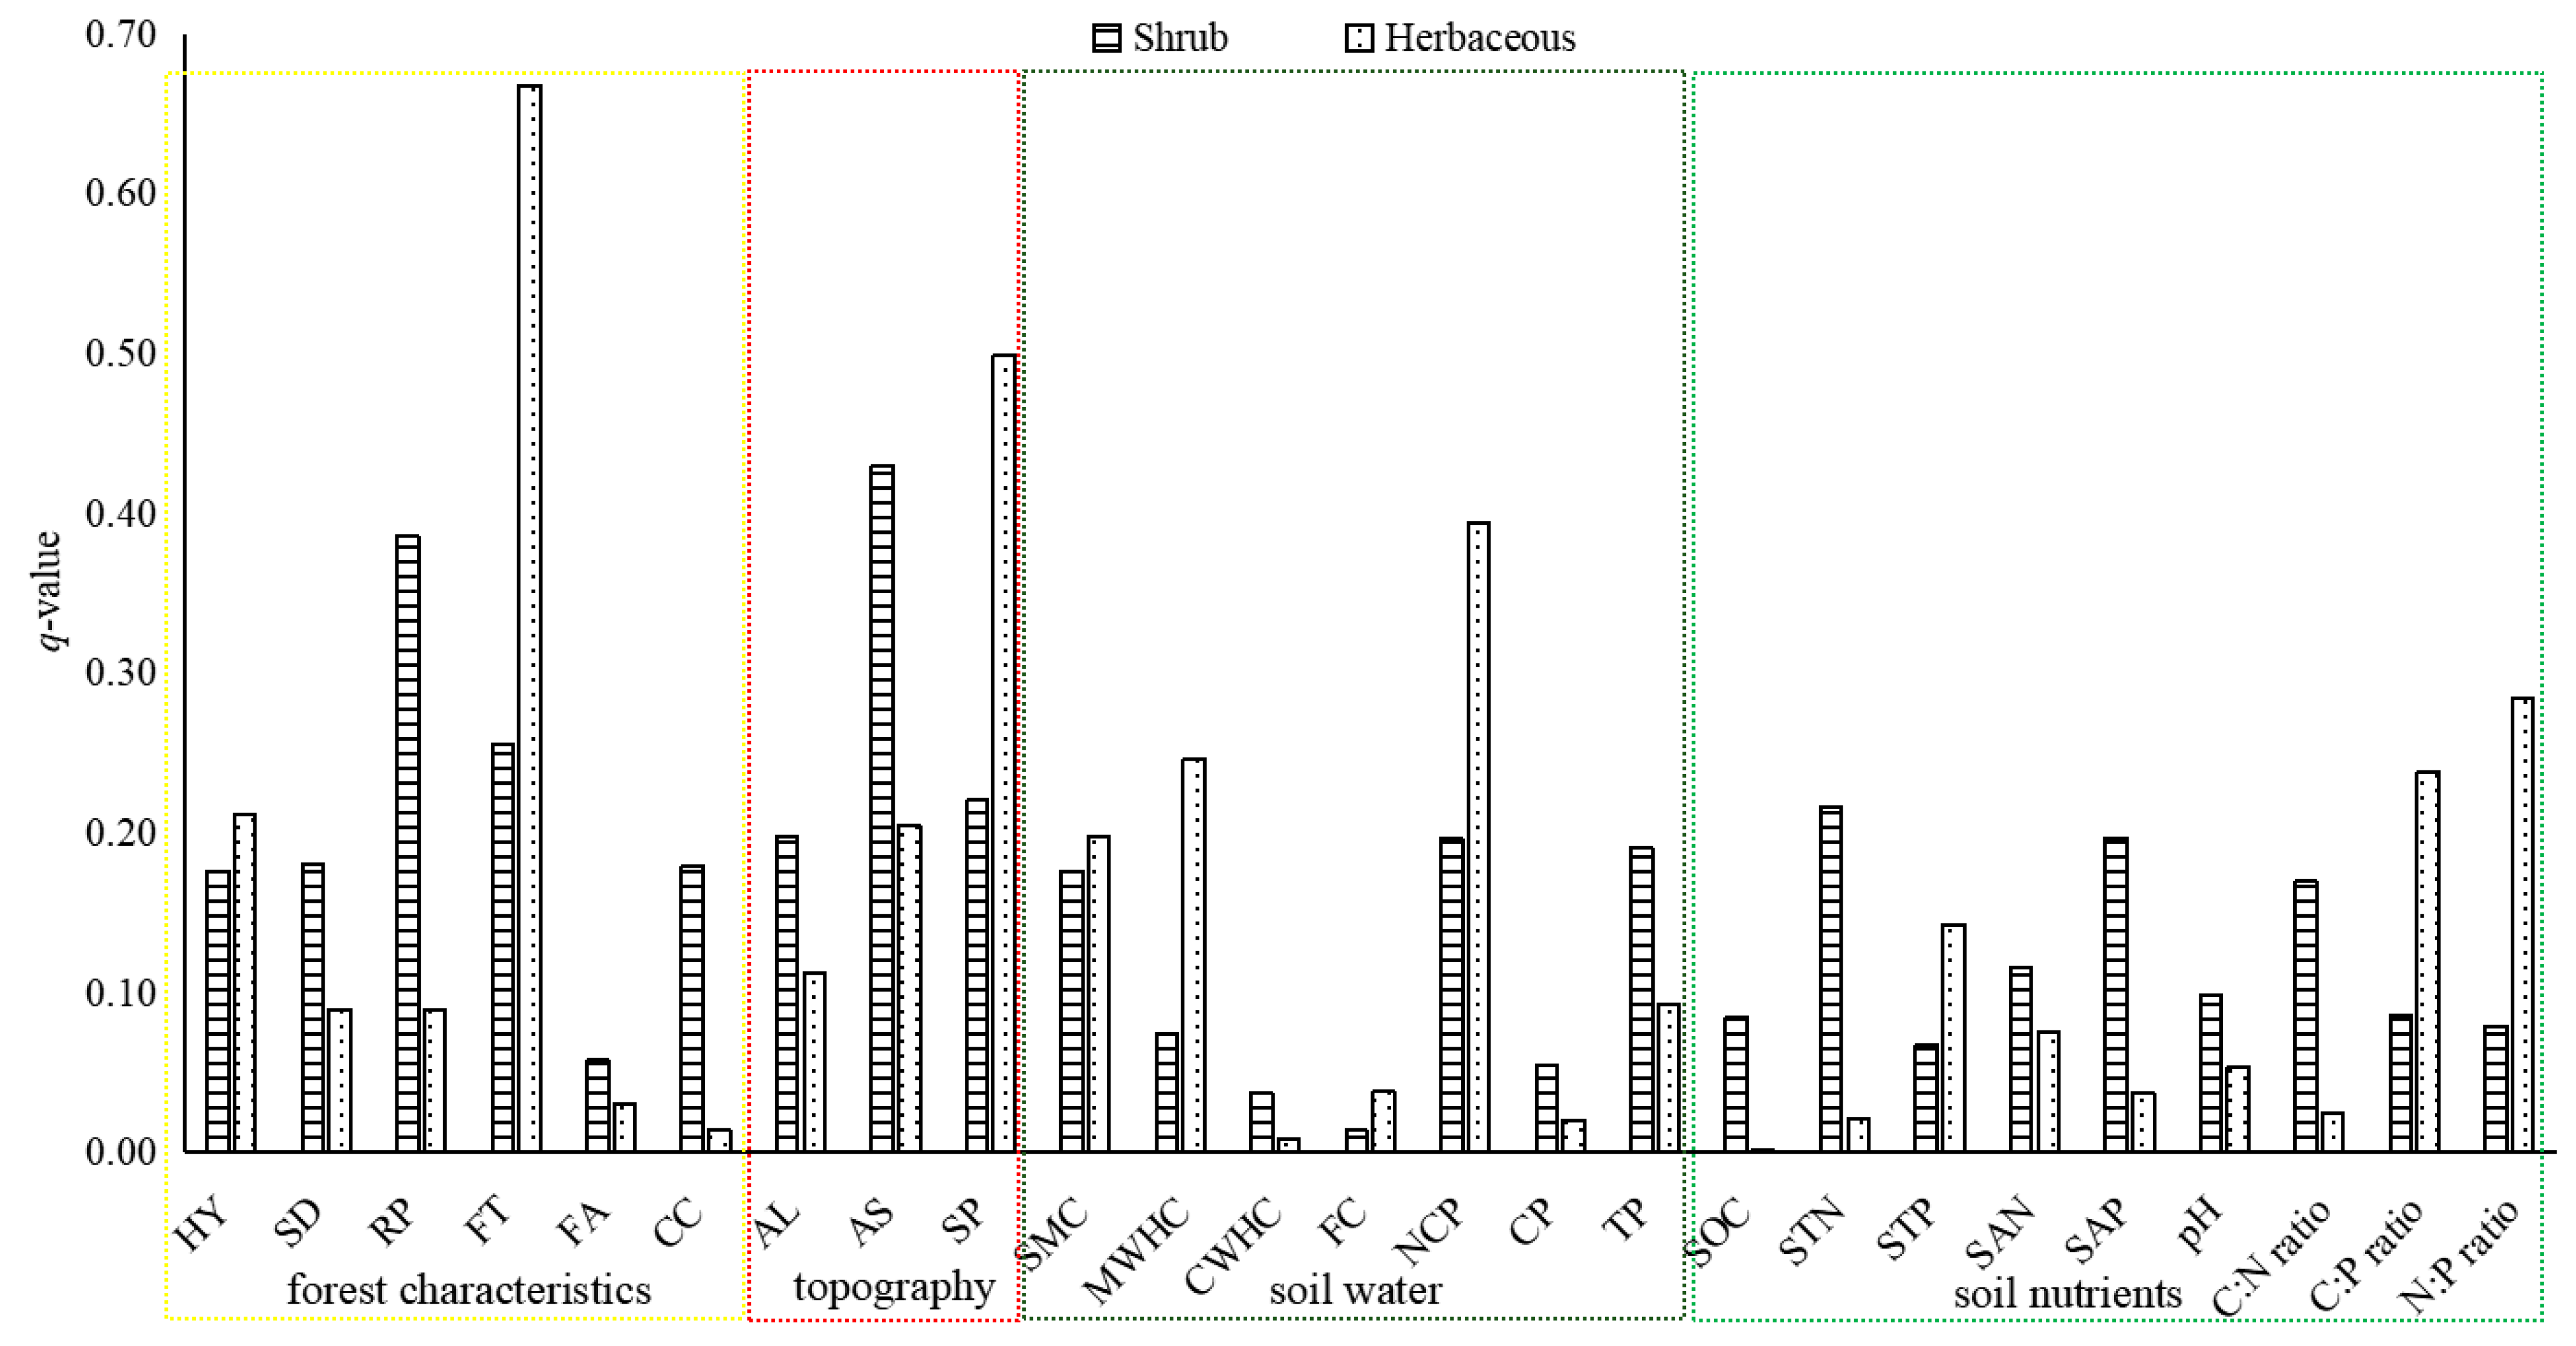
Figure 2 presents the relative influence of topography, forest stand structure, and soil properties (both physical and chemical) on shrub- and herb-layer biodiversity. Overall, topographic factors exhibited the highest mean explanatory power (mean q-value = 0.28), followed by forest stand structure (0.19), while soil properties collectively showed the weakest influence (0.12). Within each category, the factor with the maximum q-value was identified as the dominant individual driver. Secondary factors were defined as those with q > 0.1 but lower than the dominant factor, whereas the remaining factors had q-values below 0.1.
Figure 2.
The relative influence of forest stand structure, topography, and soil properties (physical and chemical) on understory species diversity in pine plantations.
For shrub-layer biodiversity, all topographic factors had q-values above 0.20. Among them, AS (0.43) was the dominant factor, followed by SP (0.22) and AL (0.20). In the herb layer, SP (0.50) was the dominant topographic driver, with AS (0.20) and AL (0.11) as secondary factors.
Regarding forest stand structure, RP (0.39) was the dominant factor for the shrub layer. Secondary influences included FT, HY, SD, and CC, whereas FA (0.06) had the least effect. In contrast, for the herb layer, FT (0.67) emerged as the dominant factor, followed by HY (0.21). The influence of all other stand structure factors was limited (q < 0.1).
Soil factors—including both physical and chemical properties—showed a generally similar overall degree of influence on understory biodiversity in our analysis. For soil physical properties, NCP was the dominant factor for both the shrub layer (0.20) and the herb layer (0.39). SMC and TP acted as secondary physical drivers in both layers. Concerning soil chemical properties, STN (0.22) was dominant in the shrub layer, with SAP (0.20), the carbon-to-nitrogen ratio (C:N ratio, 0.17), and A:N ratio (0.12) as secondary factors. In the herb layer, the nitrogen-to-phosphorus ratio (N:P ratio, 0.28) was the dominant chemical factor, followed by the carbon-to-phosphorus ratio (C:P ratio, 0.24) and A:N ratio (0.14). All other soil factors contributed minimally, with q-values below 0.10 in both vegetation layers.
3.2. Interactive Effects of Environmental Factors Across Vegetation Layers
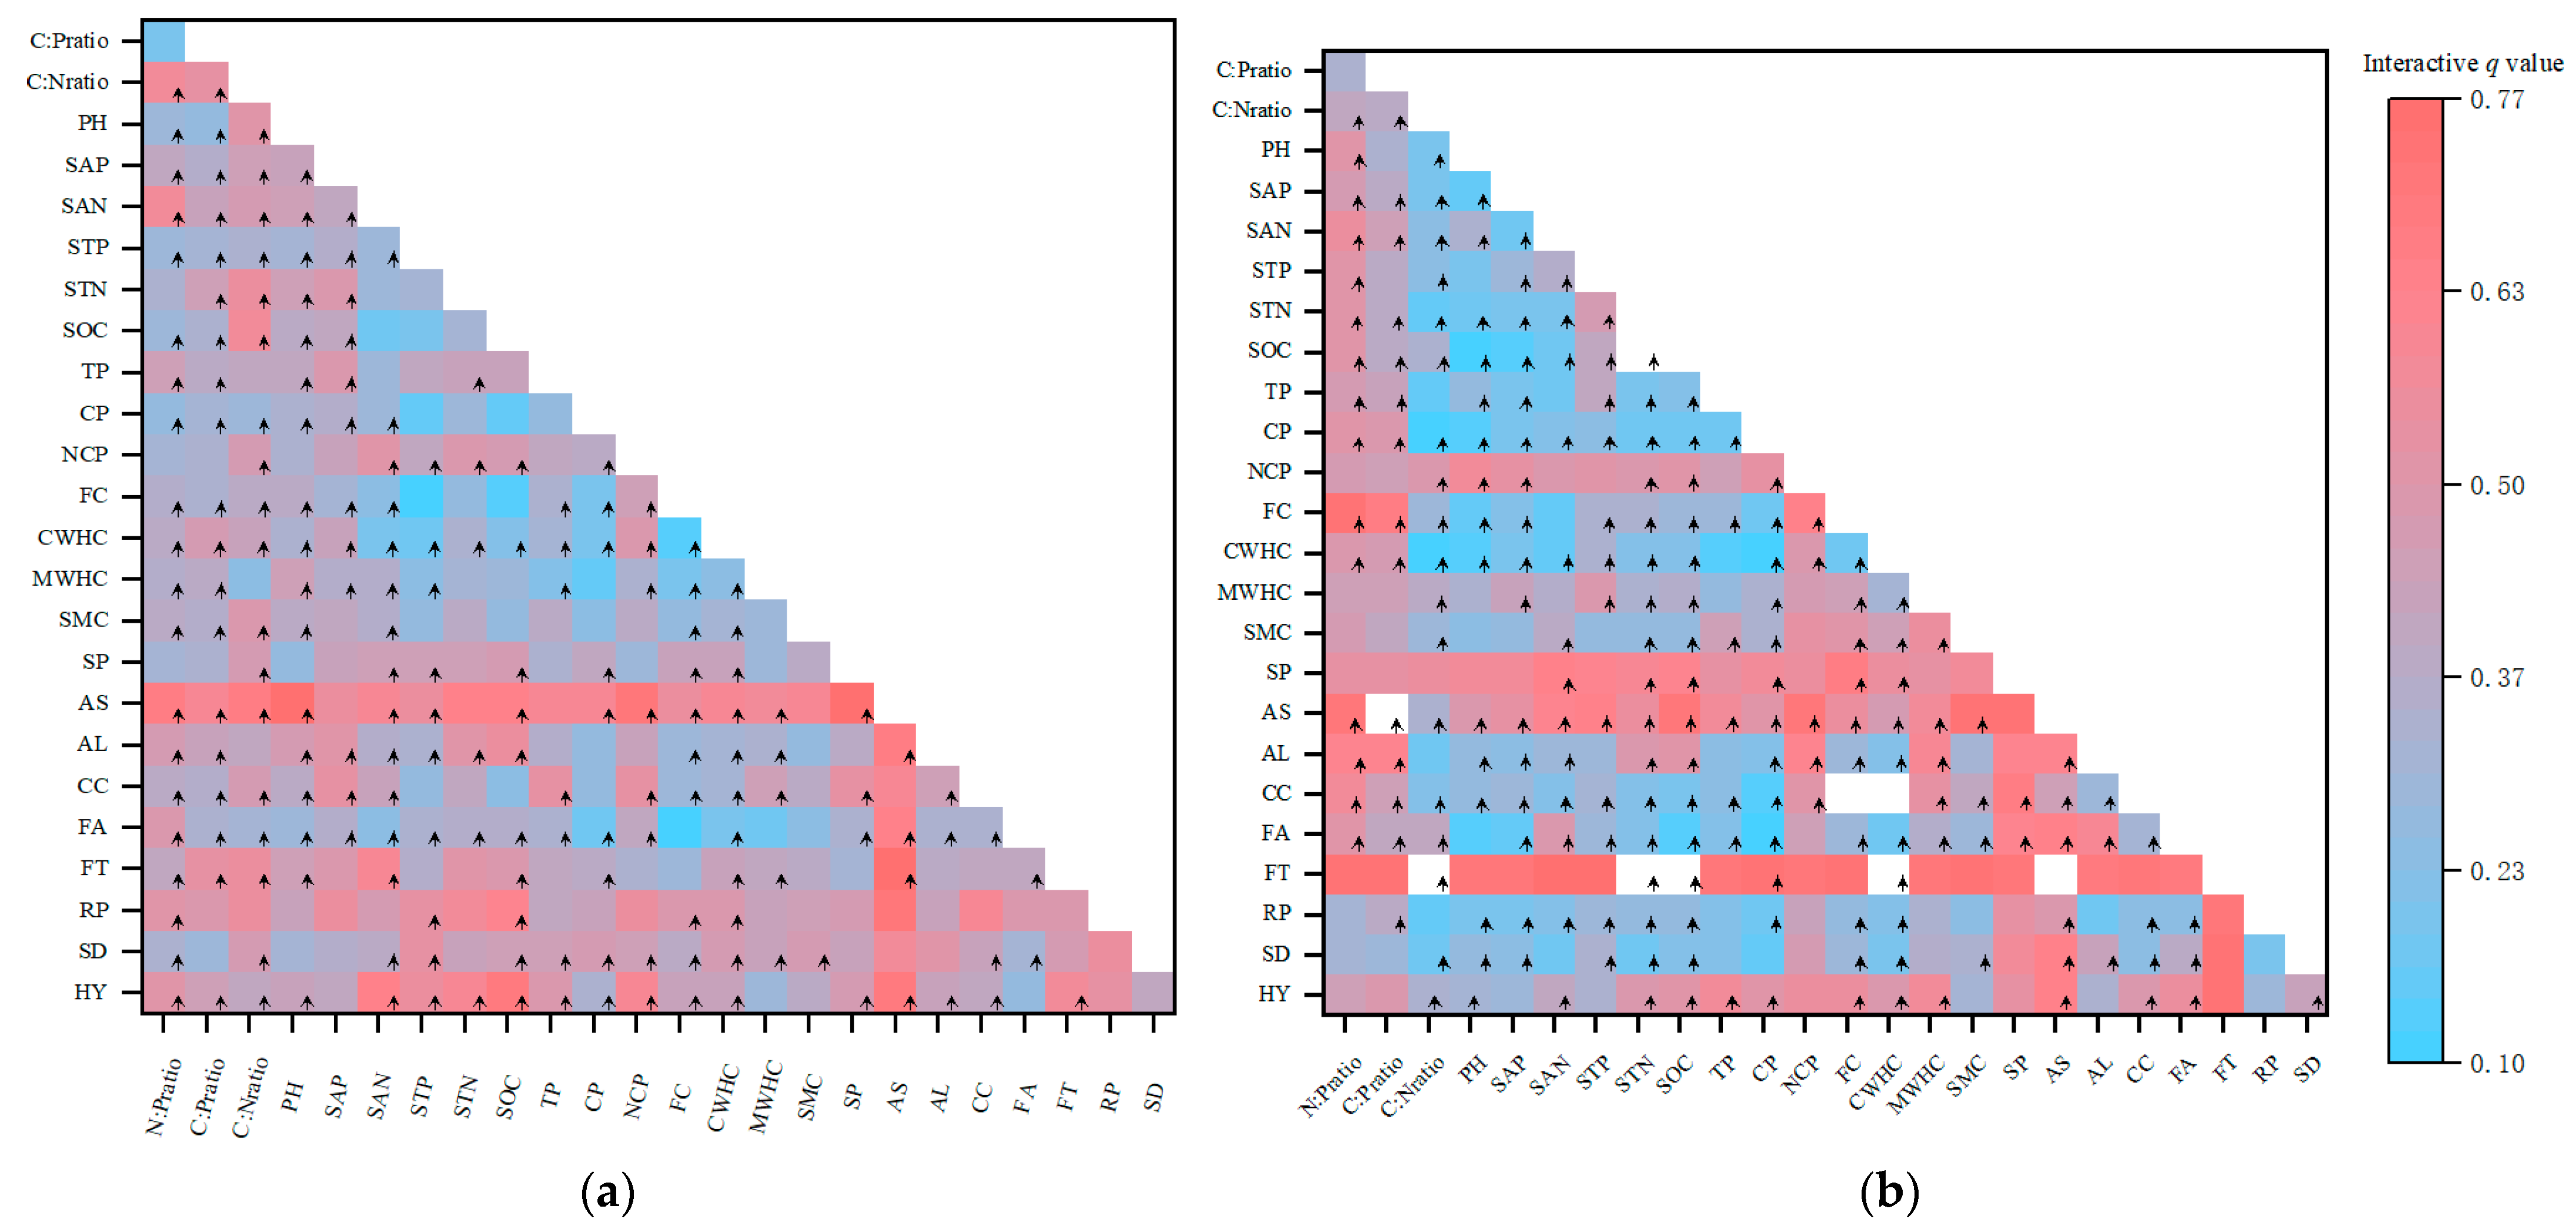
The interaction effects between paired environmental factors in this study are summarized in Figure 3. Both nonlinear enhancement and bivariate enhancement were observed across factor pairs. Among the 225 factor pairs examined, nonlinear enhancement was identified in 144 pairs for the shrub layer and 153 pairs for the herb layer. In contrast, bivariate enhancement was less common, occurring in 81 pairs in the shrub layer and 72 pairs in the herb layer. Bivariate enhancement was most pronounced between RP and other factors in the shrub layer, between FT and other factors in the herb layer, and between CS and other factors in both layers. Nonlinear enhancement, on the other hand, was predominantly observed between soil physical/chemical properties and other factors.
Figure 3.
Interaction effects between paired environmental factors on shrub and herb layer biodiversity. (a) Shrub layer. (b) Herb layer. Color indicates the strength of interaction (interactive q-value) for each factor pair, with darker hues representing stronger effects on biodiversity. The symbol ‘↑’ denotes nonlinear enhancement; pairs without this symbol exhibit bivariate enhancement.
3.3. Comparison of GeoDetector and Conventional Methods
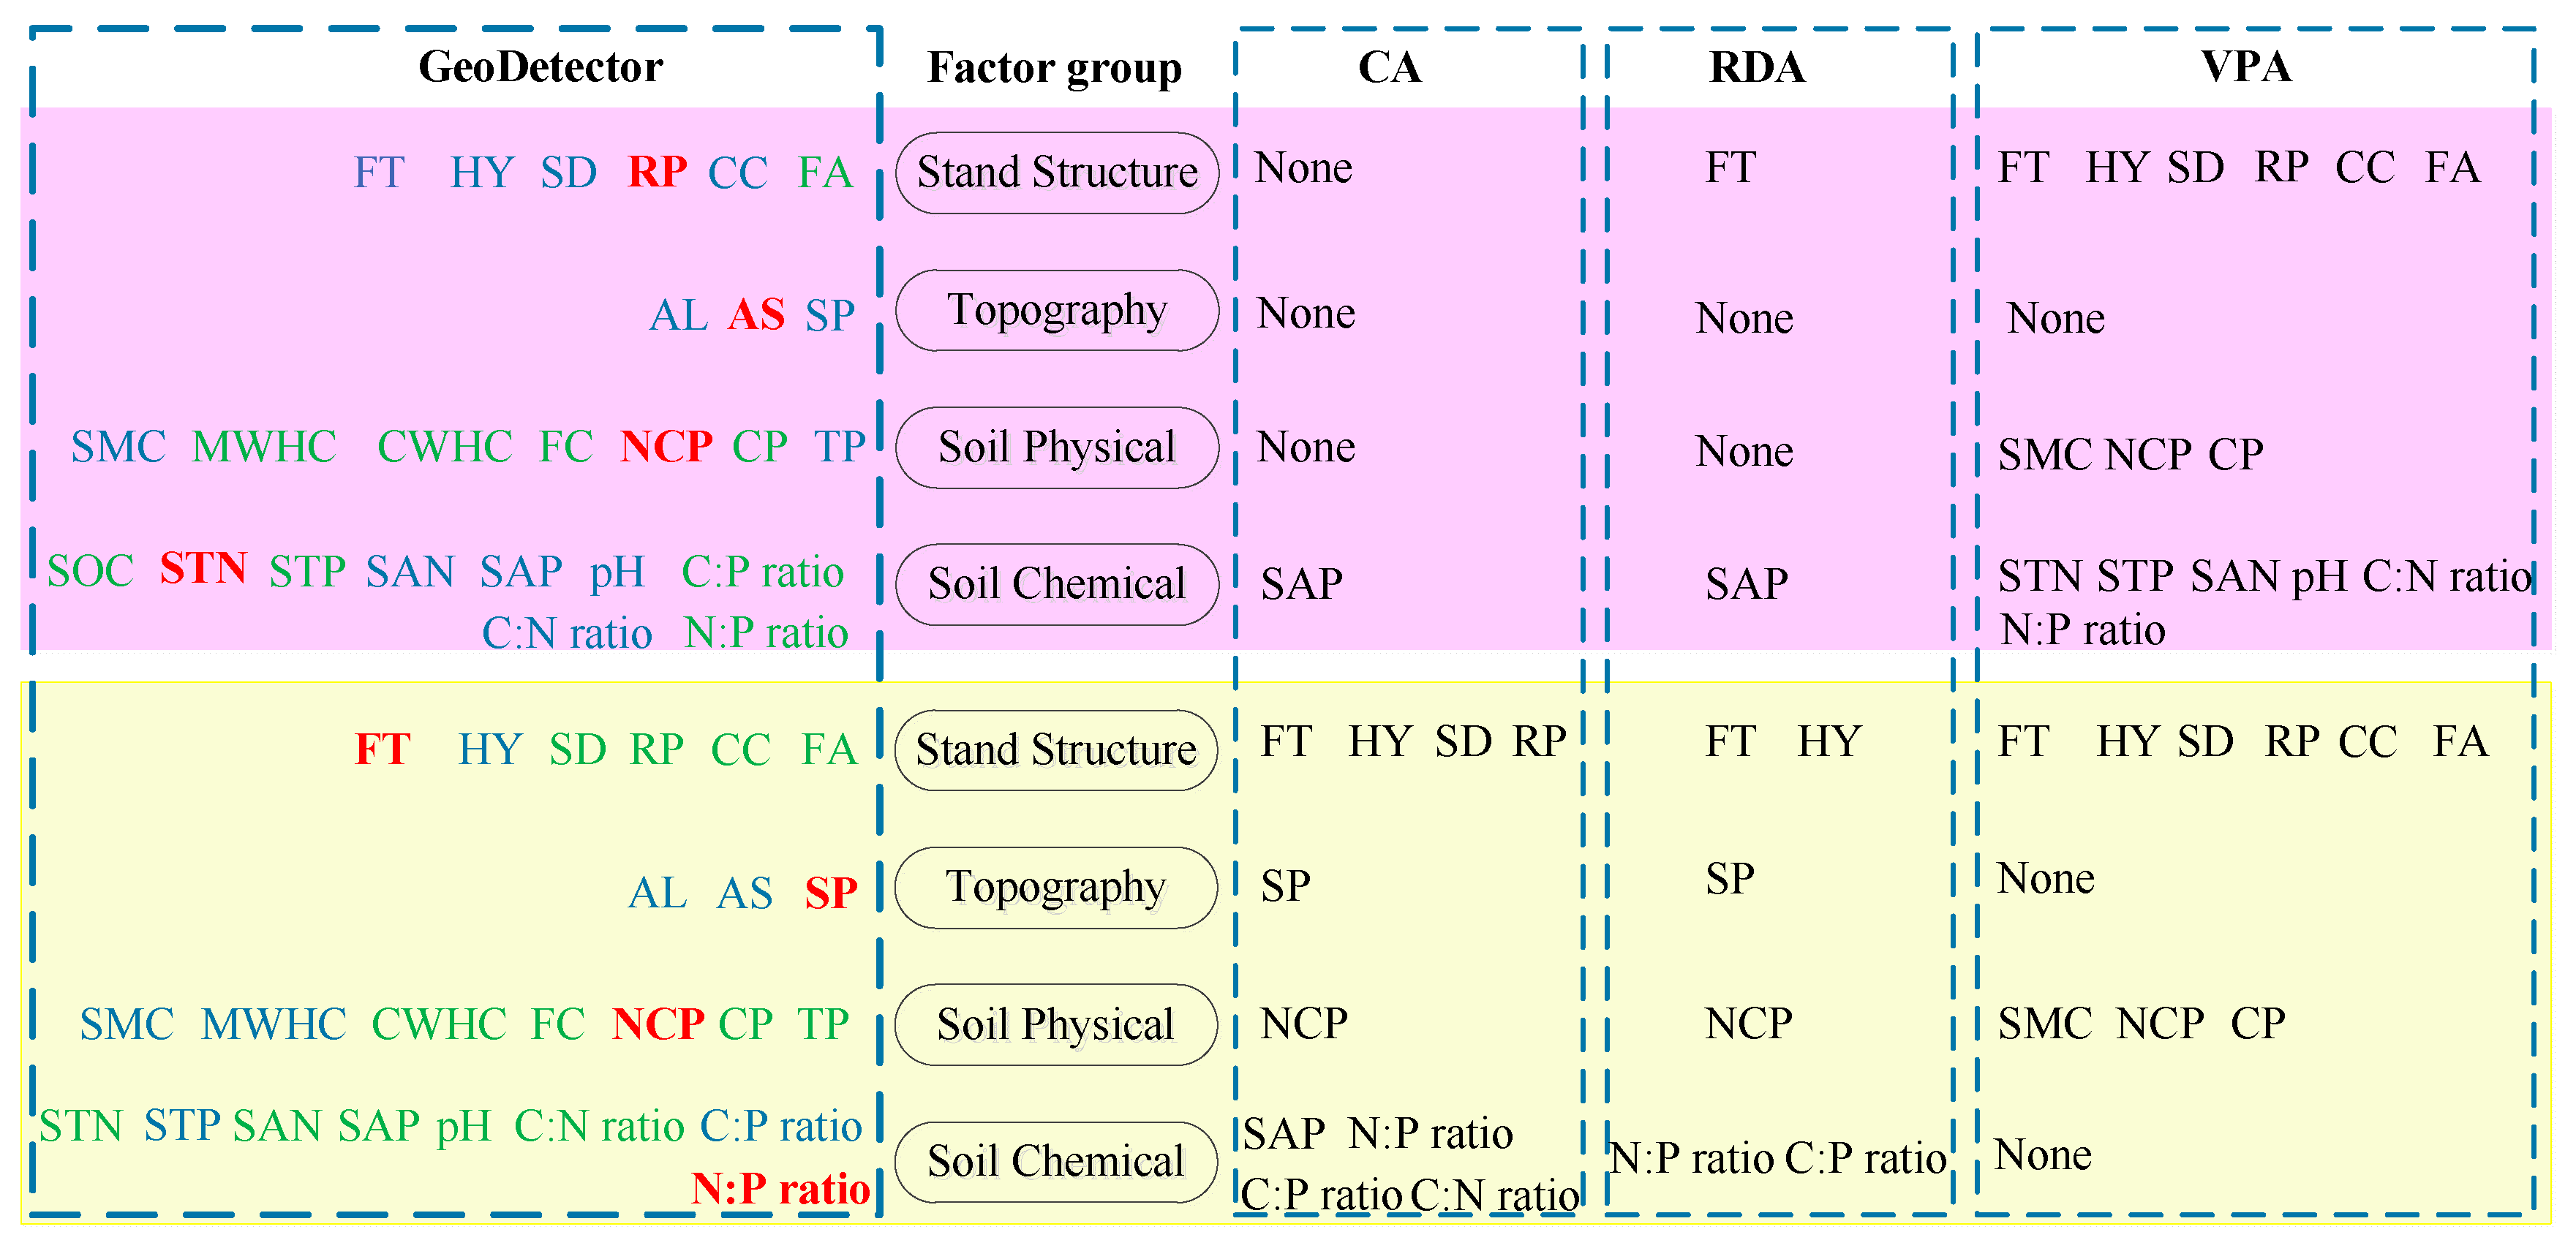
To evaluate how methodological choices can shape ecological understanding, we compared the inferences derived from GeoDetector with those from conventional approaches (CA, RDA, and VPA) (Figure 4). GeoDetector identified a nuanced, layer-specific set of drivers (Section 3.1). However, the ability of conventional methods to identify driving factors is relatively limited.
Figure 4.
Comparison of influencing factors identified by GeoDetector and conventional methods. In the GeoDetector section, colors indicate factor importance: red for dominant factors, blue for secondary influencing factors, and green for other factors.
For the shrub layer, conventional methods (CA, RDA, VPA) failed to detect any significant influence of topography or soil physical properties. If we had relied solely on these traditional approaches, we would have concluded that shrub-layer diversity is primarily driven by stand structure alone. However, GeoDetector revealed a more complex reality: aspect (AS) was the dominant topographic driver (q = 0.43), and soil non-capillary porosity (NCP) exerted a secondary but significant influence (q = 0.20). This discrepancy has important ecological implications. The failure of conventional methods to detect AS suggests they are insensitive to the fine-scale resource gradients (e.g., solar radiation, soil moisture) that topography mediates—gradients that are critical for shrub establishment and competition. Forest management strategies aimed at enhancing understory vegetation diversity should take into account the environmental heterogeneity induced by topography.
For the herb layer, the contrast was equally striking. Conventional methods (CA, RDA) successfully identified forest type (FT) as a dominant driver, aligning with GeoDetector’s finding. However, they failed to consistently detect the strong influence of slope (SP) (q = 0.50 in GeoDetector) and the role of soil phosphorus stoichiometry (N:P ratio, q = 0.28; C:P ratio, q = 0.24). A traditional analysis might therefore lead to the inference that herb-layer diversity is controlled mainly by canopy-induced light conditions (via FT). GeoDetector, in contrast, reveals an equally important edaphic pathway: slope steepness modulates soil erosion and water availability, which in turn interacts with phosphorus limitation to filter herbaceous species. This finding suggests that managing for herb-layer diversity requires not only regulating canopy structure but also mitigating soil disturbance on steep slopes.
Furthermore, GeoDetector’s ability to quantify interactive effects (Section 3.2) provides ecological insights that conventional methods cannot offer. For instance, while the individual effect of soil capillary water-holding capacity (CWHC) was weak (q < 0.10), its nonlinear enhancement with the N:P ratio produced a strong interactive effect (q > 0.40) on herb-layer diversity. This suggests that water and nutrient availability operate synergistically—a mechanism that would remain hidden in traditional main-effect models.
In summary, the comparison demonstrates that conventional methods, while useful for detecting dominant gradients, are prone to “ecological blindness” toward factors with moderate but ecologically critical effects, particularly when those factors are categorical (e.g., aspect) or interact nonlinearly. GeoDetector, by relaxing linearity and independence assumptions, provides a more comprehensive and mechanistically nuanced understanding of understory biodiversity drivers.
4. Discussion
This study applied GeoDetector to investigate the drivers of understory plant diversity in Pinus tabuliformis plantations, with the aim of quantifying both individual and interactive effects of environmental factors across vegetation layers. The results revealed three key insights: (1) diversity drivers were layer-specific, with shrub-layer diversity shaped by aspect and regeneration potential, and herb-layer diversity constrained by forest type, slope, and soil N:P ratio; (2) nonlinear enhancement was the predominant interaction type, with combined effects exceeding individual contributions; and (3) GeoDetector outperformed conventional methods in detecting factors with low individual explanatory power but high ecological relevance. These findings are discussed below in terms of their ecological mechanisms, implications for forest management, and methodological significance.
4.1. Differential Effects of Stand Structure on Shrub and Herb Layer Biodiversity in P. tabuliformis Plantations
Our study demonstrates that the stand structure of P. tabuliformis plantations differentially influences shrub- and herb-layer biodiversity. Regeneration potential (RP) emerged as the dominant stand-structure factor affecting shrub-layer biodiversity. This is likely because shrubs occupy an ecological niche similar to that of P. tabuliformis seedlings, leading to direct resource competition; higher RP was associated with reduced shrub biodiversity (Table 8). Forest type (FT) also significantly influenced understory biodiversity. Tree species richness is known to shape understory plant diversity—for instance, deciduous broad-leaved forests generally support higher understory diversity than evergreen coniferous forests [40], and mixed-species plantations typically exceed monocultures in this regard [41]. Our findings for the shrub layer align with these established patterns.
Table 8.
Diversity of understory vegetation in mixed P. tabuliformis plantations.
In the herb layer, however, biodiversity was highest in pure P. tabuliformis forest (PF), followed by P. tabuliformis—P. armandii forest (PP) and P. tabuliformis—Q. mongolica forest (PQ)—a trend opposite to that observed in the shrub layer (Table 8). Previous research indicates that light availability strongly influences herb-layer diversity [42]. In our study, although the pure P. tabuliformis forest (PF) had the lowest canopy closure (0.65 ± 0.13) compared to the mixed forests (PP: 0.74 ± 0.13; PQ: 0.80 ± 0.05), its herb-layer diversity was the highest (Shannon index: 2.47 ± 0.23 in PF vs. 2.08 ± 0.32 in PP and 1.71 ± 0.71 in PQ). We attribute this counterintuitive result to the mediating role of shrub-layer diversity. Specifically, the higher regeneration potential (RP) in PF likely intensified competition within the shrub layer, reducing shrub diversity and coverage. The resultant sparser shrub layer allowed more light to reach the forest floor, creating favorable conditions for herbaceous plants and ultimately leading to the highest herb-layer biodiversity in PF.
4.2. Topographic Factors Differentially Drive Shrub and Herb Layer Biodiversity
The examined topographic factors—altitude (AL), slope (SP), and aspect (AS)—influence understory plant communities mainly by regulating solar radiation and precipitation, which subsequently affect soil thickness, moisture, and nutrient availability [43,44]. In our study area, topography was the dominant driver of understory plant biodiversity, with all three factors demonstrating substantial explanatory power (q > 0.10) across both vegetation layers.
However, their relative importance differed between layers: AL and AS had a stronger influence on shrub-layer biodiversity, whereas SP was the primary topographic driver for the herb layer. This divergence likely arises from distinct ecological constraints. As the lowest stratum in the forest ecosystem, the herb layer is less directly affected by solar radiation gradients associated with AL and AS. In contrast, SP strongly influences herb-layer diversity by altering soil physical and chemical properties [45]. Steeper slopes generally experience greater soil erosion and runoff, along with lower water retention—conditions that limit plant establishment and growth [46]. The shallow root systems of herbaceous plants make them especially vulnerable to such soil-limited environments, restricting their access to water and nutrients [47,48].
4.3. Soil Factors Exert Layer-Specific Influences on Understory Biodiversity
Studies on the role of soil properties in understory diversity have yielded inconsistent conclusions across regions. Some reports suggest that soil factors have negligible effects due to complex tree-understory interactions [42], whereas others highlight their substantial influence [49]. Moreover, soil physical and chemical properties may affect shrub- and herb-layer diversity differently [50]. In our study, the mean explanatory power (q-value) of soil properties was lower than that of topographic and stand-structure factors in both layers. Nevertheless, individual soil factors exhibited distinct layer-specific effects.
Soil physical properties affect plant growth, and vegetation in turn modifies these properties through feedback mechanisms [51]. Their relationship with understory diversity varies with vegetation type, reflecting differences in plant height, root depth, and regional conditions [52]. In our site, soil physical properties had slightly greater influence on the herb layer than on the shrub layer. Because herb plants generally have shallower roots, their diversity was more sensitive to variations in soil moisture and texture—a pattern consistent with earlier findings [53].
Among soil physical factors, soil non-capillary porosity (NCP) was dominant in both layers. NCP regulates soil aeration and water movement; higher porosity promotes microbial activity and nutrient turnover, reduces runoff, and enhances soil moisture content (SMC). Thus, NCP serves as a key indicator of forest-soil water-holding capacity, which is critical for maintaining plant diversity [54].
Our findings highlight the contrasting roles of nitrogen and phosphorus in shaping understory diversity. The observed influence of soil nitrogen on the shrub layer may be linked to nitrogen saturation in these forests. The mean STN level in our study area considerably exceeds the threshold for “extremely high” fertility according to China’s Second Soil Census standards, a condition known to inhibit rhizosphere microbial activity [55]. Such inhibition can alter nutrient cycling and plant-microbe interactions, potentially filtering species and leading to the observed shrub-layer composition [56]. In contrast, phosphorus emerged as a stronger limiting factor for the herb layer. This aligns with the prevalent phosphorus deficiency in the study system, where STP levels are markedly below global averages. Phosphorus limitation likely intensifies competition among herbaceous species, favoring those with efficient phosphorus acquisition or conservation strategies, thereby exerting a selective pressure that shapes community diversity [57].
In the herb layer, soil organic matter and nitrogen showed low direct effects (q < 0.10). Instead, nutrient stoichiometry—particularly the C:P ratio and N:P ratio—better explained herb-layer diversity. Lower ratios reflect higher phosphorus availability and more efficient microbial decomposition [16], intensifying competition between plants and microbes for available phosphorus and thereby reinforcing phosphorus limitation.
4.4. Interaction Effects of Environmental Factors on Understory Plant Biodiversity
The interaction analysis revealed that nonlinear enhancement was the predominant type of interaction among environmental factors in both vegetation layers (Figure 3), underscoring the complexity of forest ecosystems where the combined effects of multiple drivers cannot be predicted from their individual influences alone. The understory plant diversity in P. tabuliformis plantations does not arise from only a few environmental factors, but rather from the trade-offs and synergies among multiple drivers.
The nonlinear enhancement involving aspect (AS) in the shrub layer (Figure 3a) highlights how topographic gradients mediate resource availability—particularly light and moisture—thereby conditioning the effects of other environmental drivers [58]. Regeneration potential (RP), by contrast, exhibited bivariate enhancement with other factors, suggesting that its role in shaping shrub diversity depends on local stand conditions such as canopy structure or understory competition [59]. In the herb layer, the predominance of bivariate enhancement involving forest type (FT) (Figure 3b) indicates that FT does not act independently but interacts synergistically with other factors—likely through light availability and resource partitioning—to influence herb community assembly [60].
The predominance of nonlinear enhancement in interactions involving soil properties (Figure 3) reflects the complex role of soil as a mediator of plant–environment relationships. Soil physical characteristics, particularly capillary water-holding capacity (CWHC), do not merely exert direct effects but fundamentally modulate how other factors—such as nutrient stoichiometry—influence understory diversity. While individual soil physical factors showed limited independent effects, CWHC consistently enhanced the explanatory power of C:P and N:P ratios through nonlinear interactions, with combined effects exceeding that of the dominant physical factor NCP (non-capillary porosity). This pattern suggests that CWHC functions as a key regulator of soil moisture availability, which in turn governs microbial activity, nutrient mineralization, and ultimately the bioavailability of phosphorus [61]. By influencing these processes, CWHC shapes the ecological context within which nutrient ratios operate, thereby amplifying their effects on plant community assembly.
4.5. Uncertainties of GeoDetector and Conventional Methods
Although GeoDetector produced satisfactory results in this study, its performance could be further refined by optimizing the number of strata—here based on prior knowledge. In future applications, stratum divisions should be determined according to the actual spatial heterogeneity of understory biodiversity [62].
Notable discrepancies were observed between the results from GeoDetector and those obtained using conventional methods (CA, RDA, and VPA). While conventional methods captured factors with strong influences on understory biodiversity, they often failed to consistently identify even relatively important topographic drivers. This limitation stems from the reliance of CA and regression-based approaches on overcoming multicollinearity, which frequently requires excluding correlated variables and can lead to information loss during dimensionality reduction [63].
In contrast, GeoDetector is specifically designed to detect spatially stratified heterogeneity and does not assume variable independence [24]. Although the stratification of data affects the results, it does not mask the actual effect of the factors. Conventional methods such as CA and RDA typically require prior dimension reduction via PCA to produce interpretable outputs, while VPA can only evaluate contributions at the group level rather than for individual factors. Consequently, these conventional approaches are less capable of disentangling the specific contributions of individual drivers to understory plant diversity [60].
Thus, GeoDetector offers a more convenient and reliable method for assessing the impacts of individual factors and their interactions, providing clearer insight into the drivers of understory diversity in complex forest ecosystems.
5. Conclusions
This study applied GeoDetector to investigate the drivers of understory vegetation diversity in Pinus tabuliformis plantations, with the objective of quantifying individual and interactive effects of environmental factors across vegetation layers. The findings support our research hypotheses and offer several key insights.
First, the drivers of understory diversity are layer-specific. Shrub-layer diversity is primarily shaped by direct resource competition (e.g., with tree seedlings) and topographically mediated heterogeneity in light, water, and nutrients. In contrast, herb-layer diversity is more strongly constrained by canopy-controlled light availability and slope-driven soil conditions. This vertical differentiation reflects distinct ecological niches and resource acquisition strategies between vegetation strata.
Second, environmental factors interact synergistically, with combined effects exceeding the sum of their individual contributions. The prevalence of nonlinear interactions—particularly between soil physical structure (e.g., non-capillary porosity) and phosphorus availability (e.g., N:P ratio)—underscores the complexity of forest ecosystems. These interactions modulate the influence of dominant drivers and highlight the need for multifactor approaches in biodiversity research.
Third, GeoDetector offers methodological advantages for analyzing complex ecological relationships. By accommodating both qualitative and quantitative variables without requiring linearity or independence assumptions, it effectively identified factors with low individual explanatory power that conventional methods often overlook. This capability is essential for comprehensively assessing both direct and interactive effects in heterogeneous forest environments.
These findings carry practical implications for forest management. Enhancing understory biodiversity in P. tabuliformis plantations requires layer-specific strategies: regulating canopy structure to improve light conditions may benefit herb-layer communities, while maintaining topographic heterogeneity could support shrub-layer diversity. Moreover, management interventions should account for interactive effects rather than targeting single factors in isolation.
Future research should incorporate functional and phylogenetic diversity metrics to capture broader dimensions of biodiversity, and examine temporal dynamics to understand how driver–diversity relationships evolve with stand development. Integrating biotic interactions such as competition and facilitation would further advance predictive understanding of understory community assembly.
Author Contributions
Conceptualization, H.G. and S.P.; methodology, H.G.; software, S.P.; validation, Y.Z., S.W., Y.W. and D.W.; formal analysis, S.W.; investigation, Y.Z., S.W., Y.W. and D.W.; resources, S.P.; data curation, Y.Z. and H.G.; writing—original draft preparation, H.G.; writing—review and editing, H.G. and S.P.; visualization, Y.Z. and S.W.; supervision, S.P.; project administration, H.G.; funding acquisition, H.G. All authors have read and agreed to the published version of the manuscript.
Funding
This research was funded by the National Key R & D Program of China, Grant Number 2024YFD220020103 and the National Natural Science Foundation of China, grant number 32201442.
Institutional Review Board Statement
Not applicable.
Informed Consent Statement
Not applicable.
Data Availability Statement
Data are contained within the article.
Acknowledgments
The authors sincerely thank the editors and the anonymous reviewers for their constructive feedback.
Conflicts of Interest
The authors declare no conflicts of interest.
Abbreviations
The following abbreviations are used in this manuscript:
| HY | Harvest year |
| SD | Stand density index |
| RP | Regeneration potential |
| FT | Forest type |
| FA | Forest age |
| CC | Crown closure |
| AL | Altitude |
| AS | Aspect |
| SP | Slope |
| SMC | Soil moisture content |
| MWHC | Soil maximal water holding |
| CWHC | Capillary water-holding capacity |
| FC | Field capacity |
| NCP | Non-capillary porosity |
| CP | Capillary porosity |
| TP | Total porosity |
| SOC | Soil organic carbon |
| STN | Soil total nitrogen |
| SAN | Soil alkali-hydrolyzable nitrogen |
| STP | Soil total phosphorus |
| SAP | Soil available phosphorus |
| C:P ratio | Carbon to phosphorus ratio |
| N:P ratio | Nitrogen to phosphorus ratio |
| C:N ratio | Carbon to nitrogen ratio |
| pH | Soil pH |
| PF | Pure P. tabuliformis forest |
| PP | P. tabuliformis—P. armandii forest |
| PQ | P. tabuliformis—Q. mongolica forest |
| PCA | Principal Component Analysis |
| CA | Correspondence Analysis |
| RDA | Redundancy Analysis |
| VPA | Variation Partitioning Analysis |
| VIF | Variance Inflation Factor |
References
- Gamfeldt, L.; Snäll, T.; Bagchi, R.; Jonsson, M.; Gustafsson, L.; Kjellander, P.; Ruiz-Jaen, M.C.; Froberg, M.; Stendahl, J.; Philipson, C.D.; et al. Higher levels of multiple ecosystem services are found in forests with more tree species. Nat. Commun. 2013, 4, 1340. [Google Scholar] [CrossRef] [Scilit] [PubMed]
- Dar, A.A.; Parthasarathy, N. Community associations and ecological drivers of understory vegetation across temperate forests of Kashmir Himalayas, India. Trees For. People 2022, 8, 100217. [Google Scholar] [CrossRef] [Scilit]
- Ares, A.; Neill, A.R.; Puettmann, K.J. Understory abundance, species diversity and functional attribute response to thinning in coniferous stands. For. Ecol. Manag. 2010, 260, 1104–1113. [Google Scholar] [CrossRef] [Scilit]
- Gilliam, F.S. The ecological significance of the herbaceous layer in temperate forest ecosystems. Bioscience 2007, 57, 845–858. [Google Scholar] [CrossRef] [Scilit]
- Hubau, W.; De Mil, T.; Van den Bulcke, J.; Phillips, O.L.; Ilondea, B.A.; Van Acker, J.; Sullivan, M.J.P.; Nsenga, L.; Toirambe, B.; Couralet, C.; et al. The persistence of carbon in the African forest understory. Nat. Plants 2019, 5, 133–140. [Google Scholar] [CrossRef] [Scilit]
- Rota, E.; Caruso, T.; Bargagli, R. Community structure, diversity and spatial organization of enchytraeids in Mediterranean urban holm oak stands. Eur. J. Soil Biol. 2014, 62, 83–91. [Google Scholar] [CrossRef] [Scilit]
- Jia, Q.; Liu, Q.; Li, J. Individual-based fine root biomass and its functional relationship with leaf for Pinus tabuliformis in northern China. Eur. J. For. Res. 2015, 134, 705–714. [Google Scholar] [CrossRef] [Scilit]
- Du, M.Y.; Zhang, L.J.; Pei, S.X.; Fa, L.; Feng, H.Y.; Guo, J.; Wu, D.; Xin, X.B. Soil physical characteristics in different types of Pinus tabulaeformis mixed forest. Chin. J. Ecol. 2020, 39, 3588–3595. [Google Scholar] [CrossRef]
- Li, Z.; Xiao, J.; Lu, G.; Sun, W.; Ma, C.; Jin, Y. Productivity and profitability of Larix principis-rupprechtii and Pinus tabuliformis plantation forests in Northeast China. For. Policy Econ. 2020, 121, 102314. [Google Scholar] [CrossRef] [Scilit]
- Zeller, F.; Beckschäfer, F.; Mund, M. Disentangling the effects of climate, topography, soil and vegetation on stand-scale species richness in temperate forests. For. Ecol. Manag. 2015, 349, 36–44. [Google Scholar] [CrossRef] [Scilit]
- Puhlick, J.J.; Laughlin, D.C.; Moore, M.M. Factors influencing ponderosa pine regeneration in the southwestern USA. For. Ecol. Manag. 2012, 264, 10–19. [Google Scholar] [CrossRef] [Scilit]
- Tinya, F.; Márialigeti, S.; Bidló, A.; Ódor, P. Environmental drivers of the forest regeneration in temperate mixed forests. For. Ecol. Manag. 2019, 433, 720–728. [Google Scholar] [CrossRef] [Scilit]
- Petersson, L.; Holmström, E.; Lindbladh, M.; Felton, A. Tree species impact on understory vegetation: Vascular plant communities of Scots pine and Norway spruce managed stands in northern Europe. For. Ecol. Manag. 2019, 448, 330–345. [Google Scholar] [CrossRef] [Scilit]
- Meng, X.; Fan, S.; Dong, L.; Li, K.; Li, X. Response of Understory Plant Diversity to Soil Physical and Chemical Properties in Urban Forests in Beijing, China. Forests 2023, 14, 571. [Google Scholar] [CrossRef] [Scilit]
- Zhang, H.; Jiao, X.; Zha, T.; Lv, X.; Ni, Y.; Zhang, Q.; Wang, J.; Ma, L. Developmental Dynamics and Driving Factors of Understory Vegetation: A Case Study of Three Typical Plantations in the Loess Plateau of China. Forests 2023, 14, 2353. [Google Scholar] [CrossRef] [Scilit]
- Zhang, Y.; Liu, T.; Guo, J.; Tan, Z.; Dong, W.; Wang, H. Changes in the understory diversity of secondary Pinus tabulaeformis forests are the result of stand density and soil properties. Glob. Ecol. Conserv. 2021, 28, e01628. [Google Scholar] [CrossRef] [Scilit]
- Wang, J.T.; Zheng, Y.M.; Hu, H.W.; Li, J.; Zhang, L.M.; Chen, B.D.; Chen, W.P.; He, J.Z. Coupling of soil prokaryotic diversity and plant diversity across latitudinal forest ecosystems. Sci. Rep. 2016, 5, 19561. [Google Scholar] [CrossRef] [Scilit]
- Zhang, H.X.; Zhang, B.P.; Yao, Y.H.; Liu, J.J.; Wang, J.; Yu, F.Q.; Li, J.Y. Variation model of north-south plant species diversity in the Qinling-Daba Mountains in China. Glob. Ecol. Conserv. 2022, 38, e02190. [Google Scholar] [CrossRef] [Scilit]
- Yuan, Y.; Tang, X.; Jia, Z.; Li, C.; Ma, J.; Zhang, J. The effects of ecological factors on the main medicinal components of Dendrobium officinale under different cultivation modes. Forests 2020, 11, 94. [Google Scholar] [CrossRef] [Scilit]
- Ouellet Dallaire, C.; Lehner, B.; Peres-Neto, P. River reach types as large-scale biodiversity proxies for management: The case of the Greater Mekong Region. Ecol. Indic. 2023, 146, 109907. [Google Scholar] [CrossRef] [Scilit]
- Ma, C.; Cui, R.; Duan, Y.X.; Zhang, N.N.; Liu, Y.; Sui, F.Y.; Fan, Y.W.; Lu, X.X. Differences in biodiversity and assembly mechanisms between planktonic and benthic diatom communities in riverine ecosystems: A case study in the Ashi River. Ecol. Indic. 2023, 157, 111258. [Google Scholar] [CrossRef] [Scilit]
- Urban, D.L.; Goslee, S.; Pierce, K.; Lookingbill, T. Extending community ecology to landscapes. Écoscience 2002, 9, 200–212. [Google Scholar] [CrossRef] [Scilit]
- Dormann, C.F.; Schweiger, O.; Arens, P.; Augenstein, I.; Aviron, S.T.; Bailey, D.; Baudry, J.; Billeter, R.; Bugter, R.; Bukáček, R.; et al. Prediction uncertainty of environmental change effects on temperate European biodiversity. Ecol. Lett. 2008, 11, 235–244. [Google Scholar] [CrossRef] [Scilit]
- Wang, J.F.; Li, X.H.; Christakos, G.; Liao, Y.L.; Zhang, T.; Gu, X.; Zheng, X.Y. Geographical detectors-based health risk assessment and its application in the neural tube defects study of the Heshun Region, China. Int. J. Geogr. Inf. Sci. 2010, 24, 107–127. [Google Scholar] [CrossRef] [Scilit]
- Wang, J.F.; Zhang, T.L.; Fu, B.J. A measure of spatial stratified heterogeneity. Ecol. Indic. 2016, 67, 250–256. [Google Scholar] [CrossRef] [Scilit]
- Gao, J.B.; Wang, H. Temporal analysis on quantitative attribution of karst soil erosion: A case study of a peak-cluster depression basin in Southwest China. Catena 2019, 172, 369–377. [Google Scholar] [CrossRef] [Scilit]
- Zhu, Z.; Wang, J.; Hu, M.; Jia, L. Geographical detection of groundwater pollution vulnerability and hazard in karst areas of Guangxi Province, China. Environ. Pollut. 2019, 245, 627–633. [Google Scholar] [CrossRef] [Scilit]
- Ren, Y.; Deng, L.Y.; Zuo, S.D.; Song, X.D.; Liao, Y.L.; Xu, C.D.; Chen, Q.; Hua, L.Z.; Li, Z.W. Quantifying the influences of various ecological factors on land surface temperature of urban forests. Environ. Pollut. 2016, 216, 519–529. [Google Scholar] [CrossRef] [Scilit]
- Huo, H.; Sun, C.P. Spatiotemporal variation and influencing factors of vegetation dynamics based on Geodetector: A case study of the northwestern Yunnan Plateau, China. Ecol. Indic. 2021, 130, 108005. [Google Scholar] [CrossRef] [Scilit]
- Burkhart, H.E. Comparison of maximum size–density relationships based on alternate stand attributes for predicting tree numbers and stand growth. For. Ecol. Manag. 2013, 289, 404–408. [Google Scholar] [CrossRef] [Scilit]
- LY/T 1215-1999; Determination of Forest Soil Water-Physical Properties. China Standards Press: Beijing, China, 1999.
- LY/T 1237-1999; Determination of Organic Matter in Forest Soil and Calculation of Carbon-Nitrogen Ratio. China Standards Press: Beijing, China, 1999.
- LY/T 1228-1999; Determination of Total Nitrogen in Forest Soil. China Standards Press: Beijing, China, 1999.
- LY/T 1229-1999; Determination of Hydrolyzable Nitrogen in Forest Soil. China Standards Press: Beijing, China, 1999.
- LY/T 1232-1999; Determination of Total Phosphorus in Forest Soil. China Standards Press: Beijing, China, 1999.
- LY/T 1233-1999; Determination of Available Phosphorus in Forest Soil. China Standards Press: Beijing, China, 1999.
- LY/T 1239-1999; Determination of pH in Forest Soil. China Standards Press: Beijing, China, 1999.
- Wu, B.C.; Zhou, L.J.; Qi, S.; Jin, M.L.; Hu, J.; Lu, J.S. Effect of habitat factors on the understory plant diversity of Platycladus orientalis plantations in Beijing mountainous areas based on MaxEnt model. Ecol. Indic. 2021, 129, 107917. [Google Scholar] [CrossRef] [Scilit]
- Xi, M.; Zhang, W.; Li, W.; Liu, H.; Zheng, H. Distinguishing dominant drivers on LST dynamics in the Qinling-Daba Mountains in Central China from 2000 to 2020. Remote Sens. 2023, 15, 878. [Google Scholar] [CrossRef] [Scilit]
- Qian, H.; Klinka, K.; Okland, R.H.; Krestov, P.; Kayahara, G.J. Understorey vegetation in boreal Picea mariana and Populus tremuloides stands in British Columbia. J. Veg. Sci. 2003, 14, 173–184. [Google Scholar] [CrossRef] [Scilit]
- Gong, C.; Tan, Q.Y.; Liu, G.B.; Xu, M.X. Impacts of tree mixtures on understory plant diversity in China. For. Ecol. Manag. 2021, 498, 119545. [Google Scholar] [CrossRef] [Scilit]
- Márialigeti, S.; Tinya, F.; Bidló, A.; Ódor, P. Environmental drivers of the composition and diversity of the herb layer in mixed temperate forests in Hungary. Plant Ecol. 2016, 217, 549–563. [Google Scholar] [CrossRef] [Scilit]
- Cantón, Y.; Del Barrio, G.; Solé-Benet, A.; Lázaro, R. Topographic controls on the spatial distribution of ground cover in the Tabernas badlands of SE Spain. Catena 2004, 55, 341–365. [Google Scholar] [CrossRef] [Scilit]
- Wang, C.T.; Long, R.J.; Wang, Q.J.; Ding, L.M.; Wang, M.P. Effects of altitude on plant-species diversity and productivity in an alpine meadow, Qinghai-Tibetan plateau. Aust. J. Bot. 2007, 55, 110–117. [Google Scholar] [CrossRef] [Scilit]
- Tateno, R.; Takeda, H. Forest structure and tree species distribution in relation to topography-mediated heterogeneity of soil nitrogen and light at the forest floor. Ecol. Res. 2003, 18, 559–571. [Google Scholar] [CrossRef] [Scilit]
- Chen, Y.; Qi, Y.; Wei, Y.; Ning, W.; He, B. Root traits and soil detachment in response to variable slope gradients in a representative purple-soil sloping grassland. CATENA 2024, 239, 107936. [Google Scholar] [CrossRef] [Scilit]
- Lv, J.; Wang, W.; Dai, T.; Liu, B.; Liu, G. Experimental Study on the Effect of Soil Reinforcement and Slip Resistance on Shallow Slopes by Herbaceous Plant Root System. Sustainability 2024, 16, 3475. [Google Scholar] [CrossRef] [Scilit]
- Xing, Y.; Chen, M.; Dao, J.; Lin, L.; Chen, C.; Chen, Y.; Wang, Z. Fine-root morphology of woody and herbaceous plants responds differently to altered precipitation: A meta-analysis. For. Ecol. Manag. 2024, 552, 121570. [Google Scholar] [CrossRef] [Scilit]
- Kepfer-Rojas, S.; Verheyen, K.; De Schrijver, A.; Morsing, J.; Schmidt, I.K. Persistent land-use legacies increase small-scale diversity and strengthen vegetation–soil relationships on an unmanaged heathland. Basic Appl. Ecol. 2019, 34, 15–24. [Google Scholar] [CrossRef] [Scilit]
- Su, X.P.; Zheng, G.C.; Chen, H.Y.H. Understory diversity are driven by resource availability rather than resource heterogeneity in subtropical forests. For. Ecol. Manag. 2022, 503, 119781. [Google Scholar] [CrossRef] [Scilit]
- Li, J.; Zhao, C.Y.; Song, Y.J.; Sheng, Y.; Zhu, H. Spatial patterns of desert annuals in relation to shrub effects on soil moisture. J. Veg. Sci. 2010, 21, 221–232. [Google Scholar] [CrossRef] [Scilit]
- Sardans, J.; Bartrons, M.; Margalef, O.; Gargallo-Garriga, A.; Janssens, I.A.; Ciais, P.; Obersteiner, M.; Sigurdsson, B.D.; Chen, H.Y.H.; Peñuelas, J. Plant invasion is associated with higher plant-soil nutrient concentrations in nutrient-poor environments. Glob. Change Biol. 2017, 23, 1282–1291. [Google Scholar] [CrossRef] [Scilit]
- Liang, H.B.; Xue, Y.Y.; Li, Z.S.; Wang, S.; Wu, X.; Gao, G.Y.; Liu, G.H.; Fu, B.J. Soil moisture decline following the plantation of Robinia pseudoacacia forests: Evidence from the Loess Plateau. For. Ecol. Manag. 2018, 412, 62–69. [Google Scholar] [CrossRef] [Scilit]
- Cui, W.; Zheng, X.X. Spatial Heterogeneity in Tree Diversity and Forest Structure of Evergreen Broadleaf Forests in Southern China along an Altitudinal Gradient. Forests 2016, 7, 216. [Google Scholar] [CrossRef] [Scilit]
- Payne, R.J.; Dise, N.B.; Field, C.D.; Dore, A.J.; Caporn, S.J.; Stevens, C.J. Nitrogen deposition and plant biodiversity: Past, present, and future. Front. Ecol. Environ. 2017, 15, 431–436. [Google Scholar] [CrossRef] [Scilit]
- Li, Z.; Tian, Y.; Song, M.; Yu, M.; Li, X.; Zhang, Y.; Huang, J.; Su, Z.; Sun, S.; Dai, H. Competition between shrubs and grasses in a shrub–encroached temperate grassland: Implications from nitrogen acquisition. Biol. Fertil. Soils 2025, 61, 1129–1144. [Google Scholar] [CrossRef] [Scilit]
- Chen, L.; Gonzalez, E.; Guo, Y.; Yang, X. Phosphorus effects on global grassland productivity and plant diversity: A meta-analysis. Glob. Ecol. Conserv. 2025, 63, e03871. [Google Scholar] [CrossRef] [Scilit]
- Fartyal, A.; Bargali, S.S.; Bargali, K. The effect of different slope aspects on plant diversity and soil characteristics in a temperate grassland of Kumaun Himalaya. Vegetos 2024, 37, 286–295. [Google Scholar] [CrossRef] [Scilit]
- Zhou, X.; Wang, Z.; Liu, W.; Fu, Q.; Shao, Y.; Liu, F.; Ye, Y.; Chen, Y.; Yuan, Z. Distribution Pattern of Woody Plants in a Mountain Forest Ecosystem Influenced by Topography and Monsoons. Forests 2022, 13, 957. [Google Scholar] [CrossRef] [Scilit]
- Wang, B.; Bu, Y.; Li, Y.; Li, W.; Zhao, P.; Yang, Y.; Qi, N.; Gou, R. Quantifying the Relationship among Impact Factors of Shrub Layer Diversity in Chinese Pine Plantation Forest Ecosystems. Forests 2019, 10, 781. [Google Scholar] [CrossRef] [Scilit]
- Loreau, M.; Naeem, S.; Inchausti, P.; Bengtsson, J.; Grime, J.P.; Hector, A.; Hooper, D.U.; Huston, M.A.; Raffaelli, D.; Schmid, B.; et al. Biodiversity and ecosystem functioning: Current knowledge and future challenges. Science 2001, 294, 804–808. [Google Scholar] [CrossRef] [Scilit] [PubMed]
- Song, Y.; Wang, J.; Ge, Y.; Xu, C. An optimal parameters-based geographical detector model enhances geographic characteristics of explanatory variables for spatial heterogeneity analysis: Cases with different types of spatial data. GISci. Remote Sens. 2020, 57, 593–610. [Google Scholar] [CrossRef] [Scilit]
- Legendre, P.; Legendre, L. Numerical Ecology, 2nd ed.; Elsevier: Amsterdam, The Netherlands, 1998; ISBN 978-0-444-89249-2. [Google Scholar]

Disclaimer/Publisher’s Note: The statements, opinions and data contained in all publications are solely those of the individual author(s) and contributor(s) and not of MDPI and/or the editor(s). MDPI and/or the editor(s) disclaim responsibility for any injury to people or property resulting from any ideas, methods, instructions or products referred to in the content. |
© 2026 by the authors. Licensee MDPI, Basel, Switzerland. This article is an open access article distributed under the terms and conditions of the Creative Commons Attribution (CC BY) license.