


Featured Application
This study highlights the need to consider real household consumption conditions when evaluating EVOO quality and health claims, providing a methodological framework for future studies aimed at assessing the stability of phenolic compounds during actual use.
Abstract
This study investigated the sensory and chemical properties of extra virgin olive oil (EVOO) under simulated domestic consumption conditions. EVOO with different polyphenol contents was analyzed and stored in the dark and at room temperature (20 °C) to simulate typical household storage and consumption. The volume of the bottles at the beginning was 1 L, from which 20 mL was taken daily from the same bottle for a period of one month. Chemical and sensory analyses were performed at the beginning and at the end of the experiment, whereas total polyphenol content and volatile organic compounds (VOCs) were analyzed at 7-day intervals. The results revealed a progressive reduction in total phenolic compounds, with a more pronounced decline in the sample initially characterized by a lower phenolic content. GC/MS analysis showed an increase in aldehydes such as trans, trans-2,4-octadienal, hexanal and nonanal, as well as in acetic acid and 1-octen-3-ol during a one-month period. These chemical changes were accompanied by a slight attenuation in the herbaceous sensory descriptors of EVOOs by the end of the simulated household consumption period. This suggests that choosing EVOOs with a higher phenolic content, in addition to their recognized nutritional benefits, can offer greater protection by slowing oxidative reactions and better preserving the quality of the oil during domestic use.
1. Introduction
In recent years, there has been a growing interest in foods that not only provide essential nutrients but also contribute to overall health while offering appealing sensory characteristics. Extra virgin olive oil (EVOO), obtained from the mechanical extraction of olive fruits, meets these criteria and is a key component of the Mediterranean diet [1,2]. Its health benefits are mainly linked to a high content of monounsaturated fatty acids, predominantly oleic acid, and bioactive compounds such as polyphenols and tocopherols [3,4]. Due to these properties, EVOO has been associated with several health benefits and protective effects, including a reduced risk of cardiovascular diseases, hypertension, and Alzheimer’s disease, as well as an increase in plasma antioxidant capacity and antioxidant enzyme activity [5,6,7].
Additionally, the European Food Safety Authority (EFSA) recognizes the role of olive oil polyphenols in protecting blood lipids from oxidative stress, supporting the health claim regulated by the European Commission [8].
Polyphenols are also important from a sensory point of view; indeed, the presence of these components imparts the typical bitter–pungent character to the product [2].
Despite its recognized health benefits and oxidative stability, EVOO undergoes chemical degradation over time due to hydrolytic reactions and lipid oxidation. Previous research has extensively investigated the impact of storage conditions, including the effect of light exposure, temperature, oxygen availability, and packaging material, on EVOO stability [9,10,11].
These studies have focused on the long-term storage of sealed bottles, such as estimating shelf life, while little attention has been given to the chemical and sensory changes that occur after bottle opening and during daily use in households and gastronomy. Other studies have explored the impact of bottle opening and short-term oxygen exposure on the chemical and sensory properties of extra virgin olive oil. In particular, the evolution of reconstructed oils enriched with selected volatile and phenolic compounds over a 7-day simulated consumption period demonstrated that phenolic compounds, in addition to being responsible for the bitterness and pungency of EVOO, also modulate the release and perception of volatile molecules. A rapid decline in these compounds during storage or consumption may alter the equilibrium of the aromatic profile, potentially reducing the intensity of desirable green notes and even allowing latent sensory defects, previously masked, to become perceptible [12,13].
The initial phenolic composition of extra virgin olive oil is widely recognized as a key factor influencing both oxidative stability and sensory evolution during storage and use. Oils richer in phenolic compounds generally exhibit greater resistance to oxidation, due to their ability to scavenge free radicals and inhibit lipid peroxidation, while simultaneously contributing to bitterness, pungency, and aroma modulation [14,15,16]. Several studies have also highlighted that the balance between phenolic compounds and volatile constituents plays a crucial role in preserving the characteristic green and fruity notes of EVOO over time. Despite the extensive literature, most previous research has focused on the long-term storage of sealed bottles under controlled conditions, or on short-term oxidation experiments often involving reconstructed oils or limited simulation periods. Consequently, the chemical and sensory evolution of commercial EVOOs with different initial phenolic contents under realistic household consumption conditions, characterized by repeated bottle opening, progressive headspace expansion, and daily oil withdrawal, remains insufficiently explored. Although the phenolic content of monocultivar and experimental EVOOs can range from less than 50 mg kg−1 to over 4000 mg kg−1, as reported in large-scale surveys and targeted studies [17,18,19], the phenolic levels of commercially available oils intended for everyday consumption are generally more limited. In this context, the classification of oils as low, medium, and high phenolic content in the present study reflects a relative categorization within a realistic commercial range, rather than an absolute definition of phenolic richness.
To address this gap, the present study investigates the quality evolution of commercial EVOOs differing in initial polyphenol content under simulated domestic consumption over one month. A daily withdrawal of 20 mL, reflecting the recommended intake, was applied to reproduce real-life handling and oxygen exposure, allowing a more accurate assessment of changes in phenolic content, volatile composition, and sensory attributes during domestic use.
2. Materials and Methods
2.1. Oil Samples
The EVO oils were produced in October/November 2022, with the oil extraction from the olives carried out using a continuous system (Pieralisi), employing a next-generation two-phase decanter (Scorpion 5.7). In this study, three commercial extra virgin olive oils (EVOOs) obtained from a blend of Frantoio (40%), Carpellese (30%), and Rotondella (30%) were selected based on their initial total phenolic content, determined at the beginning of the study, and classified as low (L), medium (M), and high (H) phenolic oils. The initial total phenolic concentrations were 335.54 ± 20.08 mg kg−1 for L, 482.51 ± 18.55 mg kg−1 for M, and 613.07 ± 14.40 mg kg−1 for H. The total tocopherol content of the individual cultivars was reported to be 250–300 ppm for Frantoio, 130 ppm for Carpellese, and 350 ppm for Rotondella, resulting in an average tocopherol content of approximately 300 ppm for the blend, as declared by the olive mill.
For the experiments, nine 1 L dark glass bottles were stored in a dark environment at room temperature (20 °C). To simulate domestic consumption, 20 mL of oil was withdrawn daily from the same bottle. For each sample, the bottle was opened once daily, and 20 mL of oil was poured out, with gentle agitation during pouring to mimic typical household usage. This process progressively increased the headspace within the bottles and the sample’s exposure to oxygen. To perform the analyses, 250 mL of oil was allocated for sensory evaluation, while 100 mL of oil was used for chemical analyses at the beginning and at the end (after 28 days from opening) and for the determination of total polyphenols and volatile organic compounds at 7-day intervals.
Chemical analyses, including free acidity (expressed as oleic acid equivalents g/100 g), peroxide value (expressed in meq O2 kg−1 of oil), and spectrophotometric indices (K232, K270), were performed at 7-day intervals throughout the one-month simulated domestic consumption period, allowing for monitoring of both primary and secondary oxidation changes over time. The oils remained within the legal limits set by the European Union for extra virgin olive oil. Free acidity was determined according to the COI/T.20/Doc. No. 34/Rev. 1 (2017) method, peroxide value was measured following COI/T.20/Doc. No. 35/Rev. 1 (2017), and spectrophotometric indices were analyzed based on COI/T.20/Doc. No. 19/Rev. 5 (2019).
2.2. Sensory Evaluation
The sensory evaluation was performed according to COI/T.20/Doc. No. 22 (2005).
A panel of trained assessors, recognized by MASAF (Ministry of Agriculture, Food Sovereignty, and Forestry) for the sensory analysis of virgin olive oil, evaluated the olive oil samples at the Laboratorio Chimico Merceologico of CCIAA (Camera di Commercio Industria Artigianato e Agricoltura) of Naples (Italy).
A sensory profile sheet was developed starting from the basic positive attributes defined by the official panel test method (olive fruity, bitter, and pungent) and was further expanded with additional descriptive terms commonly associated with Italian extra virgin olive oils. These descriptors were not arbitrarily selected but were defined by an official, trained sensory panel accredited by the Chamber of Commerce of Naples, composed of assessors holding the certificate of physiological suitability and specific training in the recognition of olive oil defects and positive attributes, in accordance with current EU and IOC regulations. The sensory vocabulary was established during preliminary consensus sessions, in which panelists evaluated the samples and agreed on the most representative descriptors based on their previous training, routine sensory evaluation activity, and the reference literature on EVOO sensory characterization [20]. The final set of descriptors included leaf, grass, apple, almond, artichoke, tomato, chicory, flowers, ripe fruits, and sweet.
The panel evaluated the intensity of perception of each descriptor on an unstructured scale (from 0 to 10) and the median value was calculated. Descriptors with median > 0 and robust % CV (percentage robust coefficient of variation) <20% were used for describing the sensory profile.
2.3. Analysis of Total Phenolic Compounds
The phenolic compounds were extracted from the oil samples following the method described by Sacchi et al. [21], with minor adaptations. In brief, 5 g of oil (analyzed in duplicate) was mixed with 5 mL of hexane in a 50 mL centrifugal tube. Subsequently, 7 mL of a methanol:water (60:40, v/v) solution was added, and the mixture was vortexed for 1 min. The sample was then centrifuged at 3500 rpm for 10 min (ALC 4218 centrifuge) to separate the hydroalcoholic and organic phases. The hydroalcoholic phase was collected, and the extraction was repeated twice.
The total phenolic content of the hydroalcoholic extracts was determined spectrophotometrically using the Folin–Ciocalteu method [22]. A 100 μL aliquot of the hydroalcoholic extract was evaporated to dryness under a nitrogen stream and reconstituted with 100 μL of distilled water. Then, 800 μL of sodium carbonate solution (50 g/L) and 100 μL of 0.2 N Folin–Ciocalteu reagent were added. The mixture was incubated in the dark for 30 min, and absorbance was measured at 750 nm using a Shimadzu UV-1601 spectrophotometer (Shimadzu, Kyoto, Japan). The total phenolic content was expressed as milligrams of gallic acid equivalents per kilogram of oil (mg GAE kg−1).
2.4. Analysis of Volatile Organic Compounds
Solid phase microextraction and gas chromatography/mass spectrometry analysis (SPME–GC/MS) was used for the analysis of volatile organic compounds (VOCs). The extraction of VOCs was carried out according to Genovese et al. [16]. Three grams of EVOO sample was added to a 15 mL dark vial with 10 μL of isobutyl acetate as the internal standard (765.8 mg kg−1 in hexane). The vial was then closed with a polytetrafluoroethylene (PTFE) septum. The fibre was exposed for 30 min at 40 °C after 10 min at 40 °C for equilibration. The SPME device (Supelco Co., Bellefonte, PA, USA) was equipped with a 50/30 μm thick divinylbenzene/carboxen/polydimethylsiloxane (DVB/CAR/PDMS) fibre coated with a 2 cm length stationary phase.
The VOCs were desorbed directly in the injector port of the GC, kept at a temperature of 250 °C in split mode with a 4:1 split ratio, for 10 min. VOC analyses were performed on an Agilent 7890A GC System gas chromatograph coupled to an Agilent 5975C VL MSD with Triple-Axis-Detector mass spectrometer (Agilent Technologies, Inc., Palo Alto, CA, USA). The GC was equipped with a Zebron ZB-WAX capillary column (60 m × 0.25 mm i.d. × 0.25 μm film thickness 100% polyethylene glycol; Phenomenex, Torrance, CA, USA). The temperature was set at 40 °C for 4 min, followed by an increase of 3.5 °C min−1 up to 240 °C, and held for 3 min at maximum temperature [12]. Helium was used as a carrier gas (1.4 mL min−1). Mass spectra were recorded at 70 eV. The source temperature was 230 °C, the quadrupole temperature was 150 °C, and the interface temperature was 250 °C. The identification of VOCs was performed by comparing retention times and mass spectra obtained by analyzing pure reference compounds under the same conditions. Moreover, the identification was confirmed by comparing mass spectra with those of the NIST database. All chemical standards were supplied by Sigma-Aldrich (St. Louis, MO, USA). The fibre was conditioned at 270 °C for 1 h before the analysis. A blank test was performed before each analysis. The quantitative data of volatile compounds was obtained by normalizing the peak areas of each compound with respect to the area of the internal standard peak. Peak area data were processed by MSD ChemStation 5975 TAD Data Analysis software v.E.02.00.493 (Agilent Technologies, Palo Alto, CA, USA). All the analyses were performed in triplicate.
Moreover, the hexanal/trans-2-hexenal ratio was calculated as an oxidation index, following methodologies reported by Sacchi, Caporaso, Paduano and Genovese [21].
2.5. Statistical Analysis
Results were expressed as the mean ± standard deviation. Statistical analysis and visualization were carried out in the XLStat environment (Version 2019 v.2.2), an add-in software package for Microsoft Excel (Addinsoft Corp., Paris, France). Differences were assessed by analysis of variance (ANOVA) with Tukey’s HSD test, for a significance level set at p ≤ 0.05. Principal component analysis (PCA) was performed to reduce the dimensionality and better understand the evolution of chemical variables for the oil samples during simulated consumption.
3. Results and Discussion
3.1. Chemical and Sensory Properties
The quality indices of extra virgin olive oil were used to assess its quality level during storage. Analysis of the data reported in Table 1 shows that all three types of oil maintain their extra virgin olive oil status. These results are in agreement with the study conducted by Klisovic et al. [9], in which, after one month of simulated domestic storage, the oils remained extra virgin.
Table 1.
Variation in chemical indices and total phenolic compounds in EVOO samples L, M, and H over 28 days of storage under simulated household consumption conditions.
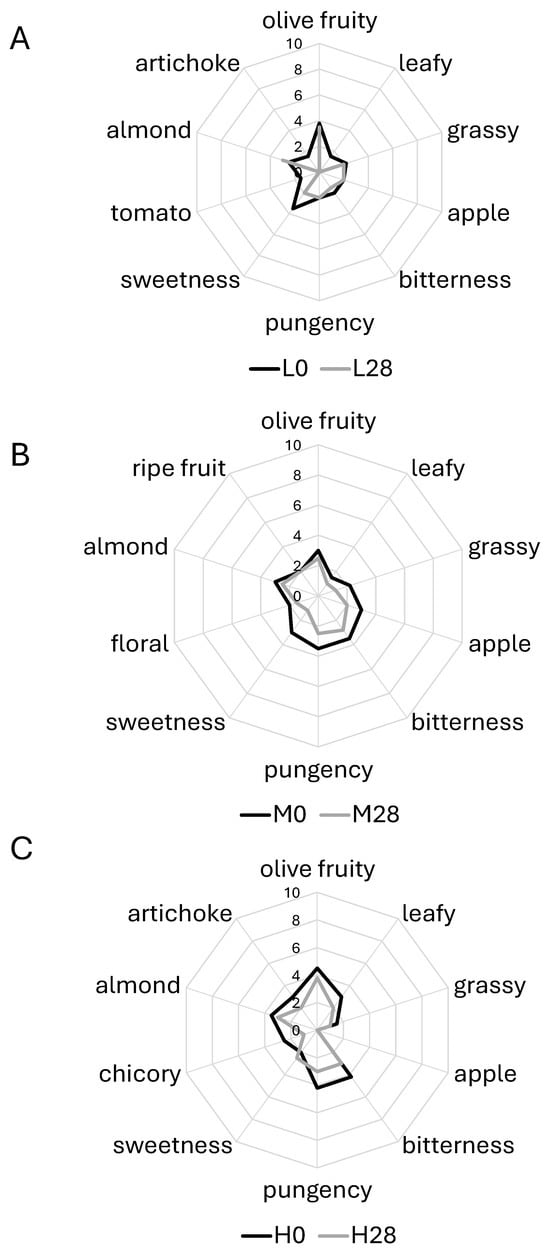
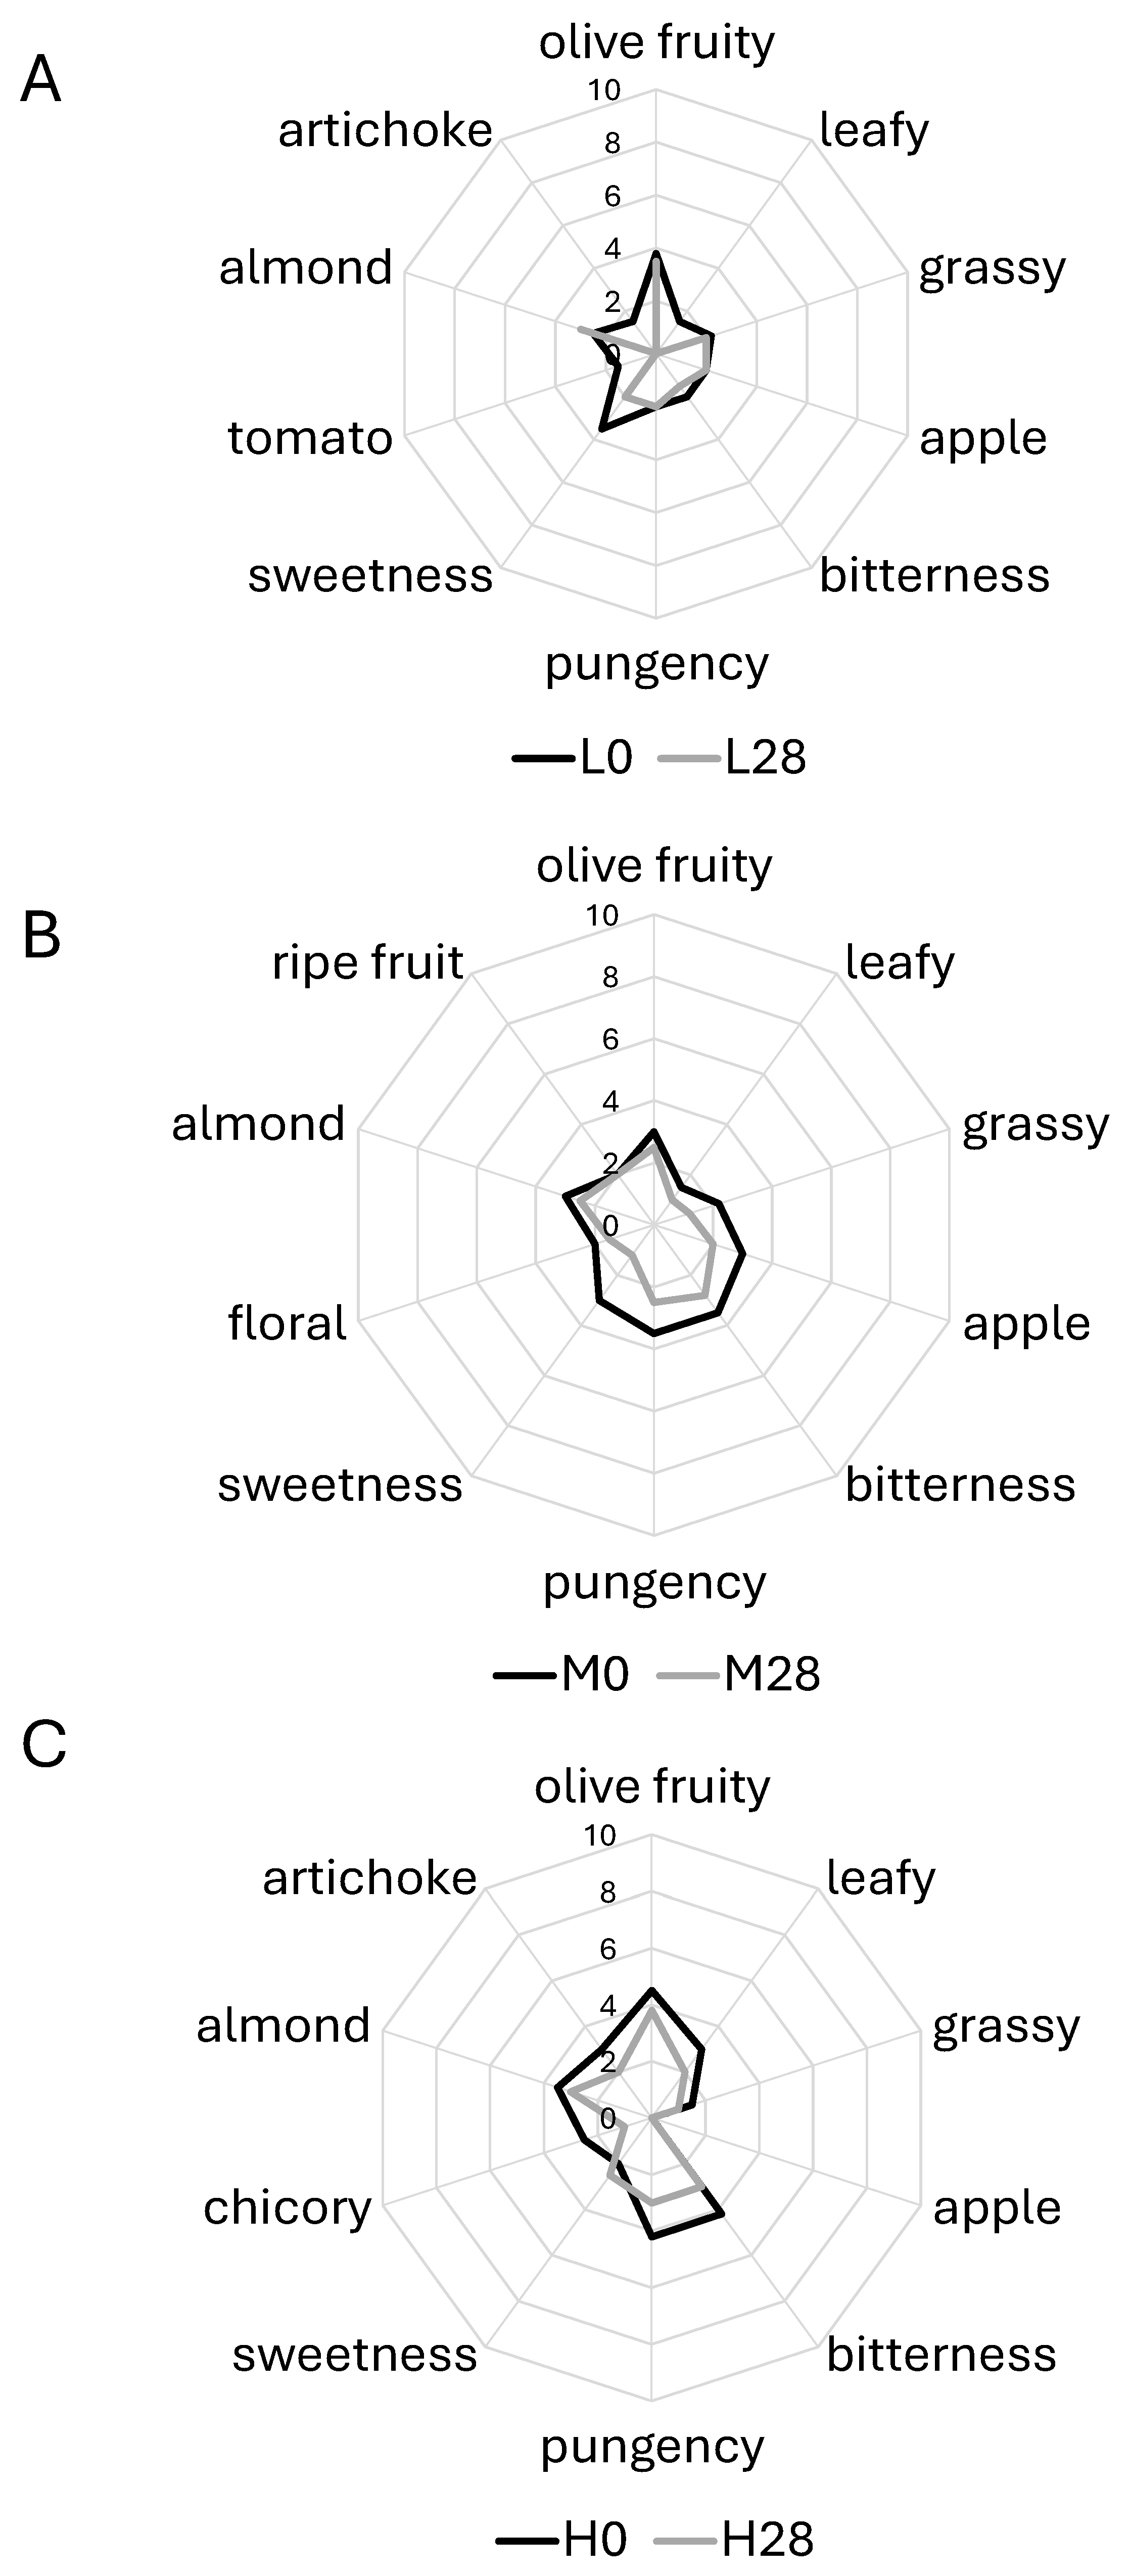
At the beginning of the study, sample H was classified as a medium-fruity extra virgin olive oil, showing moderate bitterness and pungency and characterized by distinct vegetal notes, such as artichoke and chicory (Figure 1C). Sample M (Figure 1B) also exhibited medium fruitiness with comparable bitterness and pungency intensities, but was distinguished by sweeter aromatic descriptors, including apple and floral notes. In contrast, sample L (Figure 1A) was described as lightly fruity, with low intensities of bitterness and pungency.
Figure 1.
Sensory profiles of EVOO samples with low (L), medium (M), and high (H) total phenolic content at 0 and 28 days of simulated domestic consumption. (A) EVOO sample L at 0 and 28 days. (B) EVOO sample M at 0 and 28 days. (C) EVOO sample H at 0 and 28 days. Robust (median > 6.0), medium (median 3.0–6.0), and delicate (median < 3.0).
Following the 28-day simulated domestic consumption period, a general attenuation of aromatic intensity was observed across all samples. However, the extent of sensory changes differed according to the initial phenolic content. In particular, sample H, characterized by the highest phenolic concentration, maintained a relatively stable sensory profile, exhibiting only a slight reduction in the intensity of its characteristic descriptors. Conversely, in sample L, which had the lowest phenolic content, several key positive descriptors, including leaf, tomato, and artichoke, were no longer perceived at the end of the study. This observation is consistent with previous findings reporting a higher susceptibility of low-phenolic EVOOs to sensory deterioration during oxidative stress conditions [17].
These findings suggest that oxidative processes induced by repeated oxygen exposure—resulting from daily bottle opening and progressive headspace expansion—contribute to modifications of the EVOO aromatic profile during simulated household use. Such variations appear to be associated with changes in both volatile organic compounds and phenolic compounds. Nevertheless, despite the attenuation of certain positive sensory attributes, no sensory defects were detected in any of the samples at the end of the experiment, indicating that overall sensory quality was preserved.
3.2. Phenolic and Volatile Compound Evolution
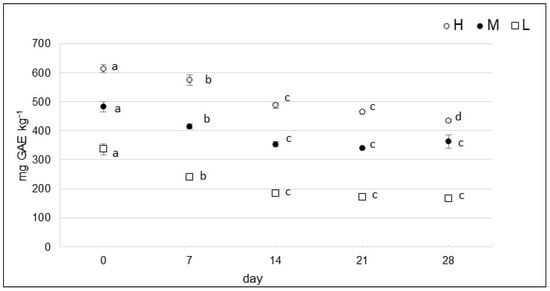
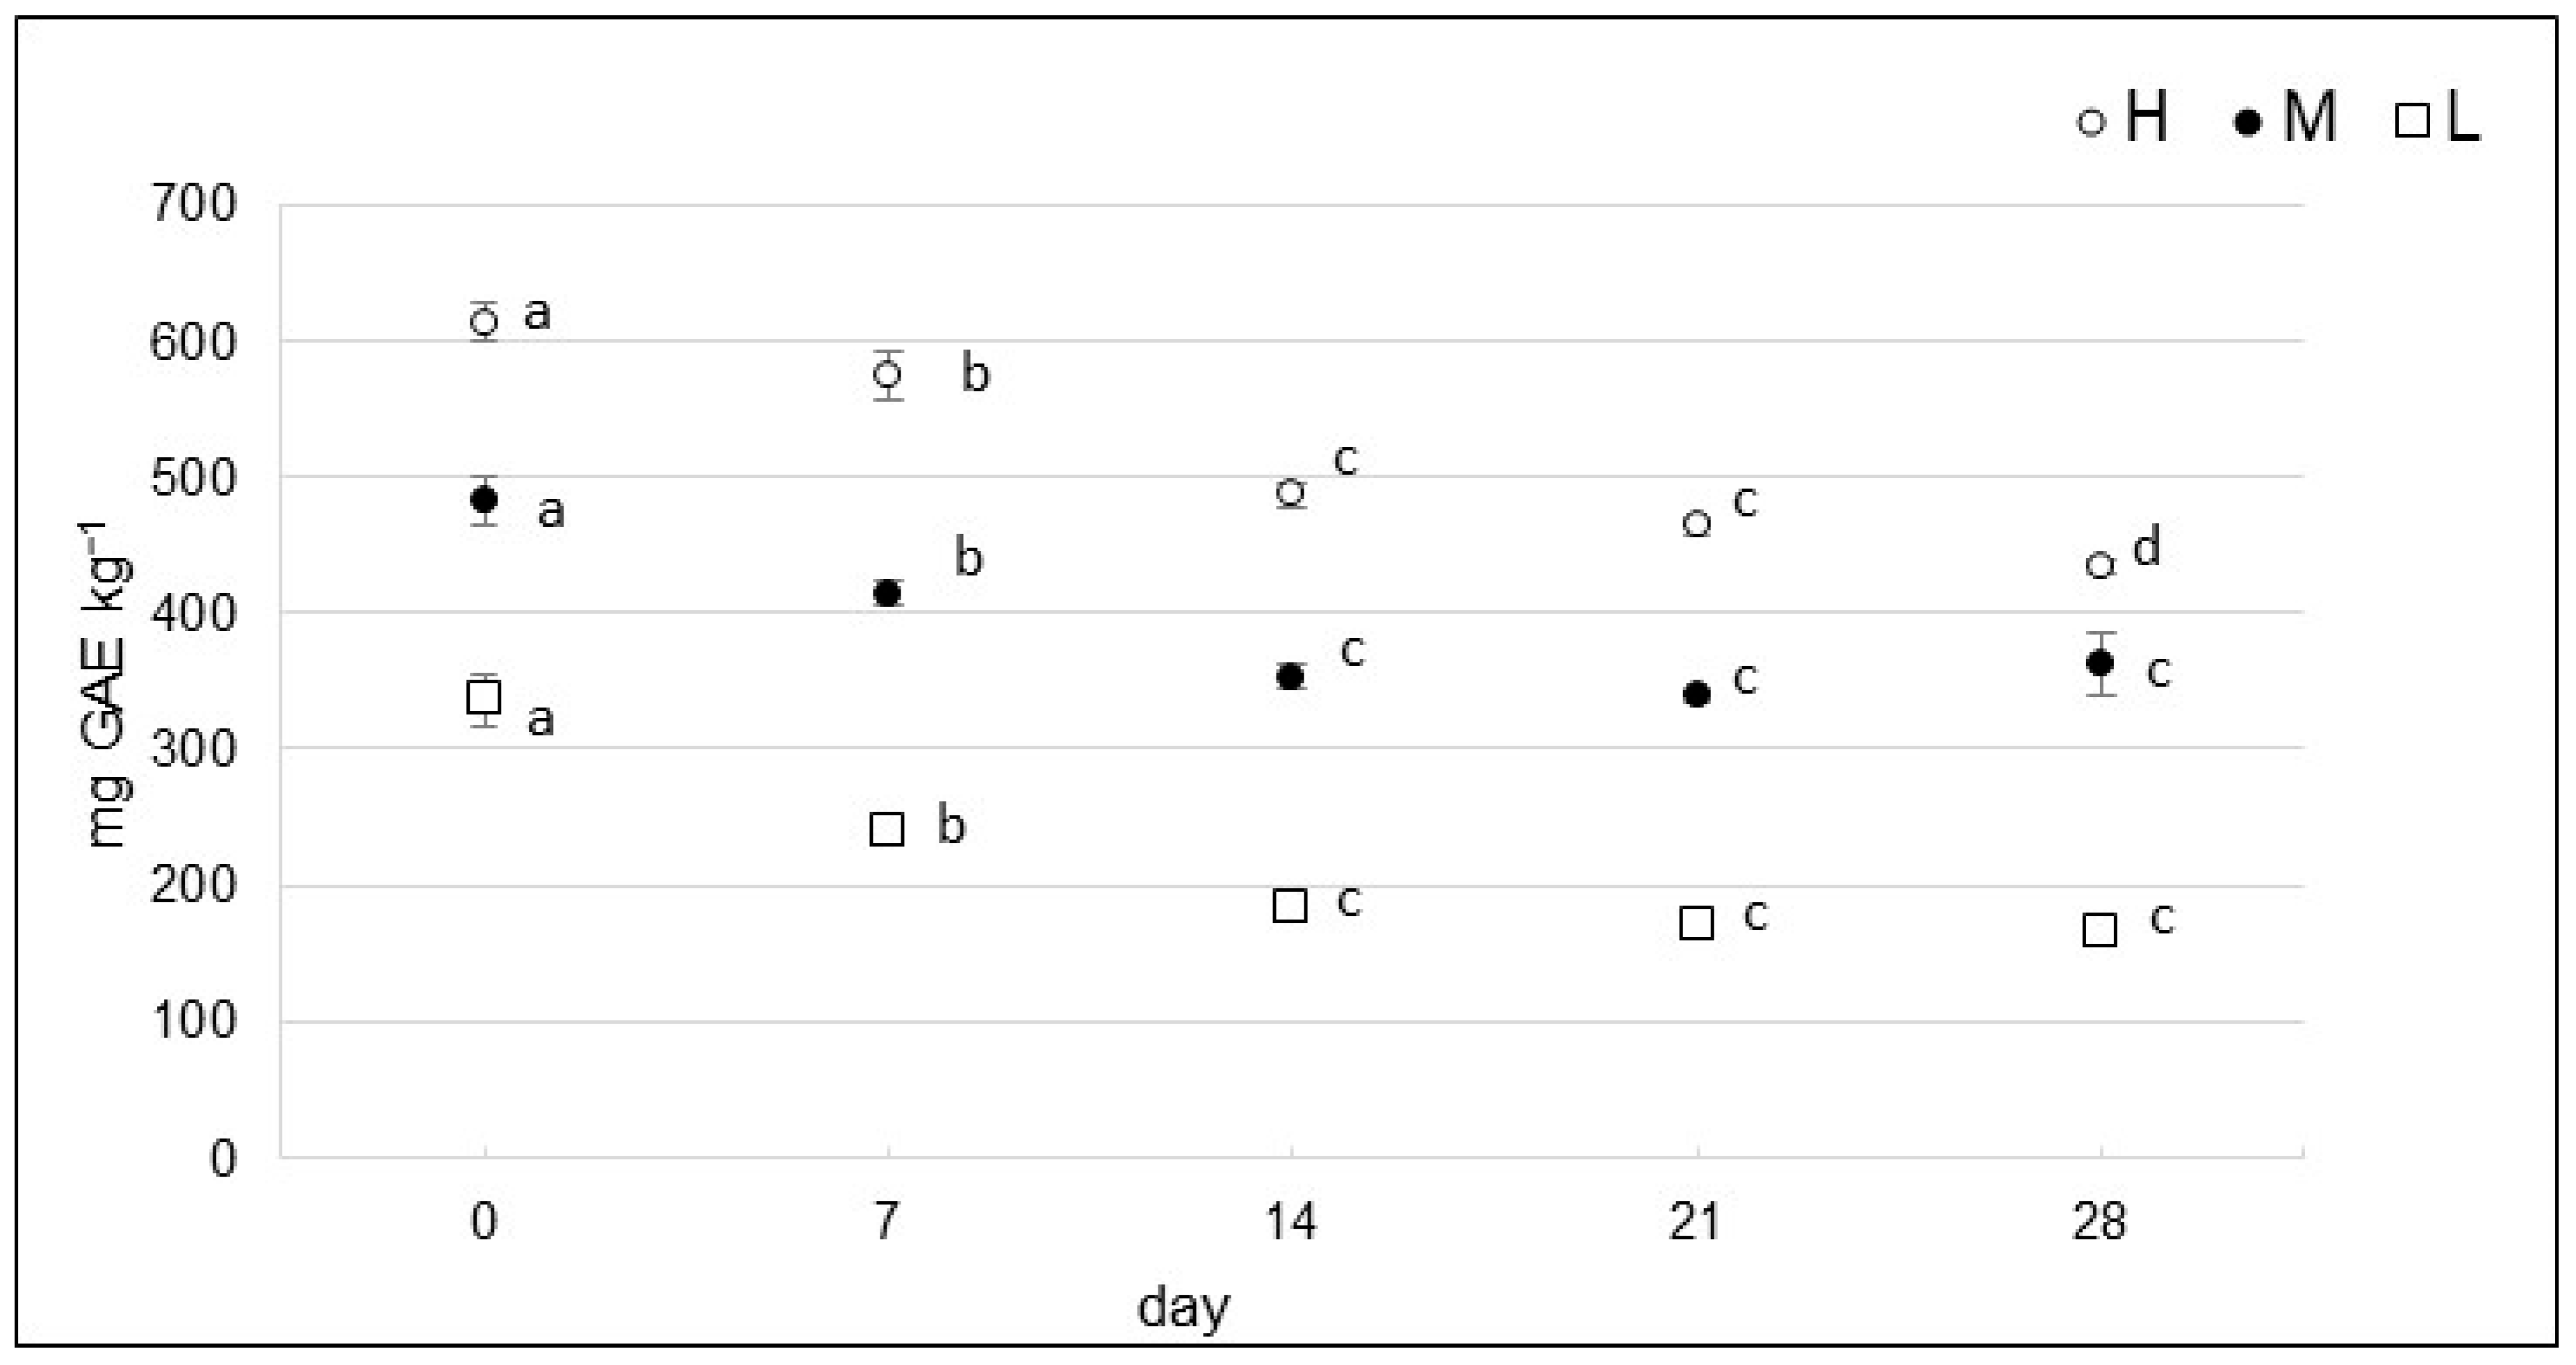
Regarding the evolution of total phenolic content, all samples exhibited a significant decrease over the storage period (Figure 2).
Figure 2.
Evolution of total phenolic content in the three EVOO samples (H, M, and L) during the 28-day simulated domestic consumption period. Values are expressed in mg kg−1 of gallic acid equivalents (ppm). L, M, and H correspond to EVOO samples with low, medium, and high levels of total phenolic compounds, respectively. Different letters (a–d) indicate statistically significant differences (p < 0.05) within the same sample over the 28-day period of simulated domestic consumption.
This decline is primarily attributed to progressive oxygen exposure due to daily bottle opening, which increases the headspace and facilitates oxidative reactions. Phenolic compounds are known to play a crucial role in maintaining the oxidative stability of EVOO, owing to the antioxidant properties that enable them to scavenge free radicals generated during lipid oxidation [1]. These findings are consistent with those reported by Klisović, Novoselić, Lukić and Bubola [9], who also observed a marked reduction in total phenolics under conditions promoting oxygen exposure. Notably, although sample H exhibited the highest absolute reduction in total phenolic content (180 ppm), this corresponded to a moderate relative decrease of approximately 29%.
In contrast, samples M and L showed lower absolute phenolic losses (121 and 169 ppm, respectively), which corresponded to markedly different relative reductions (≈25% for M and ≈ 50% for L). In particular, the pronounced relative depletion observed in sample L highlights that the extent of phenolic loss is more appropriately described in relative terms rather than by absolute values alone.
Previous studies have also shown that a greater reduction in phenolic compound concentrations is associated with initially higher contents and with the predominance of certain phenolic compounds. In particular, Castillo-Luna et al. [23] showed that high concentrations of oleocanthal and oleacein, two highly reactive secoiridoid phenols, can accelerate the depletion of total phenols during storage when their combined content exceeds 200 mg kg−1.
However, this apparent accelerated phenolic loss does not necessarily imply reduced oxidative stability. Rather, it reflects the active antioxidant role of these compounds, which are preferentially consumed while inhibiting lipid oxidation and preserving volatile and sensory quality. This interpretation is consistent with the present results, where sample H, despite exhibiting the highest absolute phenolic reduction, retained the most stable volatile profile and sensory attributes throughout the simulated consumption period. These findings support the concept that phenolic retention and antioxidant effectiveness, rather than absolute phenolic loss, are key determinants of EVOO stability during domestic use.
The evolution of volatile compounds in the headspace of the three EVOO samples was monitored throughout the simulated domestic use period using SPME-GC/MS. A total of 25 volatile molecules were identified and quantified over the 28-day period (Table 2). The results reveal significant variations in the concentration of specific volatiles, which appear to be influenced by the initial phenolic content of the oils.
Table 2.
Concentration of volatile organic compounds in EVOO samples L, M, and H during the 28-day simulated domestic consumption period.
Trans-2-hexenal, the most abundant volatile compound in EVOO and a key contributor to its green and fruity aroma [1,2], exhibited a marked decline over time. Although the initial concentrations varied among the samples, a higher reduction rate was observed in sample L (low phenolic content), with a decrease of approximately 67% over the 28-day period. In contrast, samples M and H (medium and high phenolic content, respectively) showed smaller reductions of 51% and 49%, respectively. The degradation rate of this compound in oil L was notably faster, suggesting a lower resistance to oxidative processes likely due to its reduced phenolic content and antioxidant protection. In fact, even from the sensory evaluation, the L28 oil was found to have the greatest reduction in the intensity of the leafy attribute (Figure 1A).
Hexanal levels showed a slight increase in sample L at day 7, indicating the onset of early-stage lipid oxidation. By the end of the experimental period, hexanal concentrations stabilized below 0.5 ppm in all samples, suggesting that oxidative degradation remained limited and did not significantly compromise overall sensory quality. In contrast, a more pronounced increase in nonanal concentration was observed in sample L, which was characterized by the lowest initial phenolic content. Both hexanal and nonanal are well-known secondary oxidation products arising from the oxidative degradation of linoleic and oleic acid hydroperoxides and are commonly associated with the development of oxidized sensory notes in olive oil [17,21]. These findings support previous observations that EVOOs with lower phenolic content are more susceptible to oxidation-driven changes during storage and use. Moreover, Genovese, Caporaso and Sacchi [14] reported that oils with higher polyphenol content are better able to preserve their aromatic profiles and limit the formation of oxidation-derived aldehydes under conditions simulating short-term domestic use.
In addition, the content of the main aldehydes related to fatty acid oxidation was also considered, such as trans-2-butenal, trans, trans-2,4-octadienal, and cis-2-heptanal. Among these, the one that shows the greatest increase in the three oils is cis-2-octenal, although it remains at low concentrations. It can be observed that it initially increases significantly, then decreases over time. This behaviour indicates an early phase of rapid formation of volatile aldehydes, followed by their subsequent degradation or conversion into other compounds. The different phenolic retention appears to be closely linked to the evolution of the volatile fraction, as discussed in the following section, where oils with lower relative phenolic retention exhibited more pronounced oxidative-related changes.
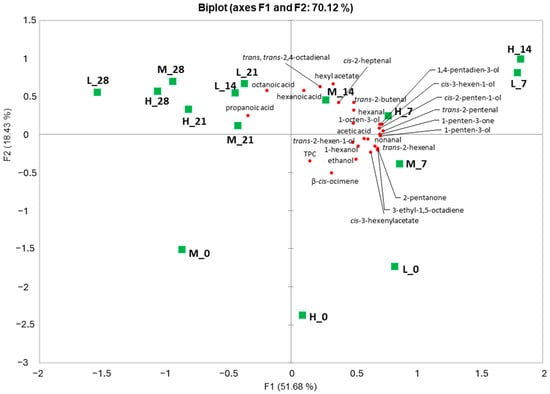
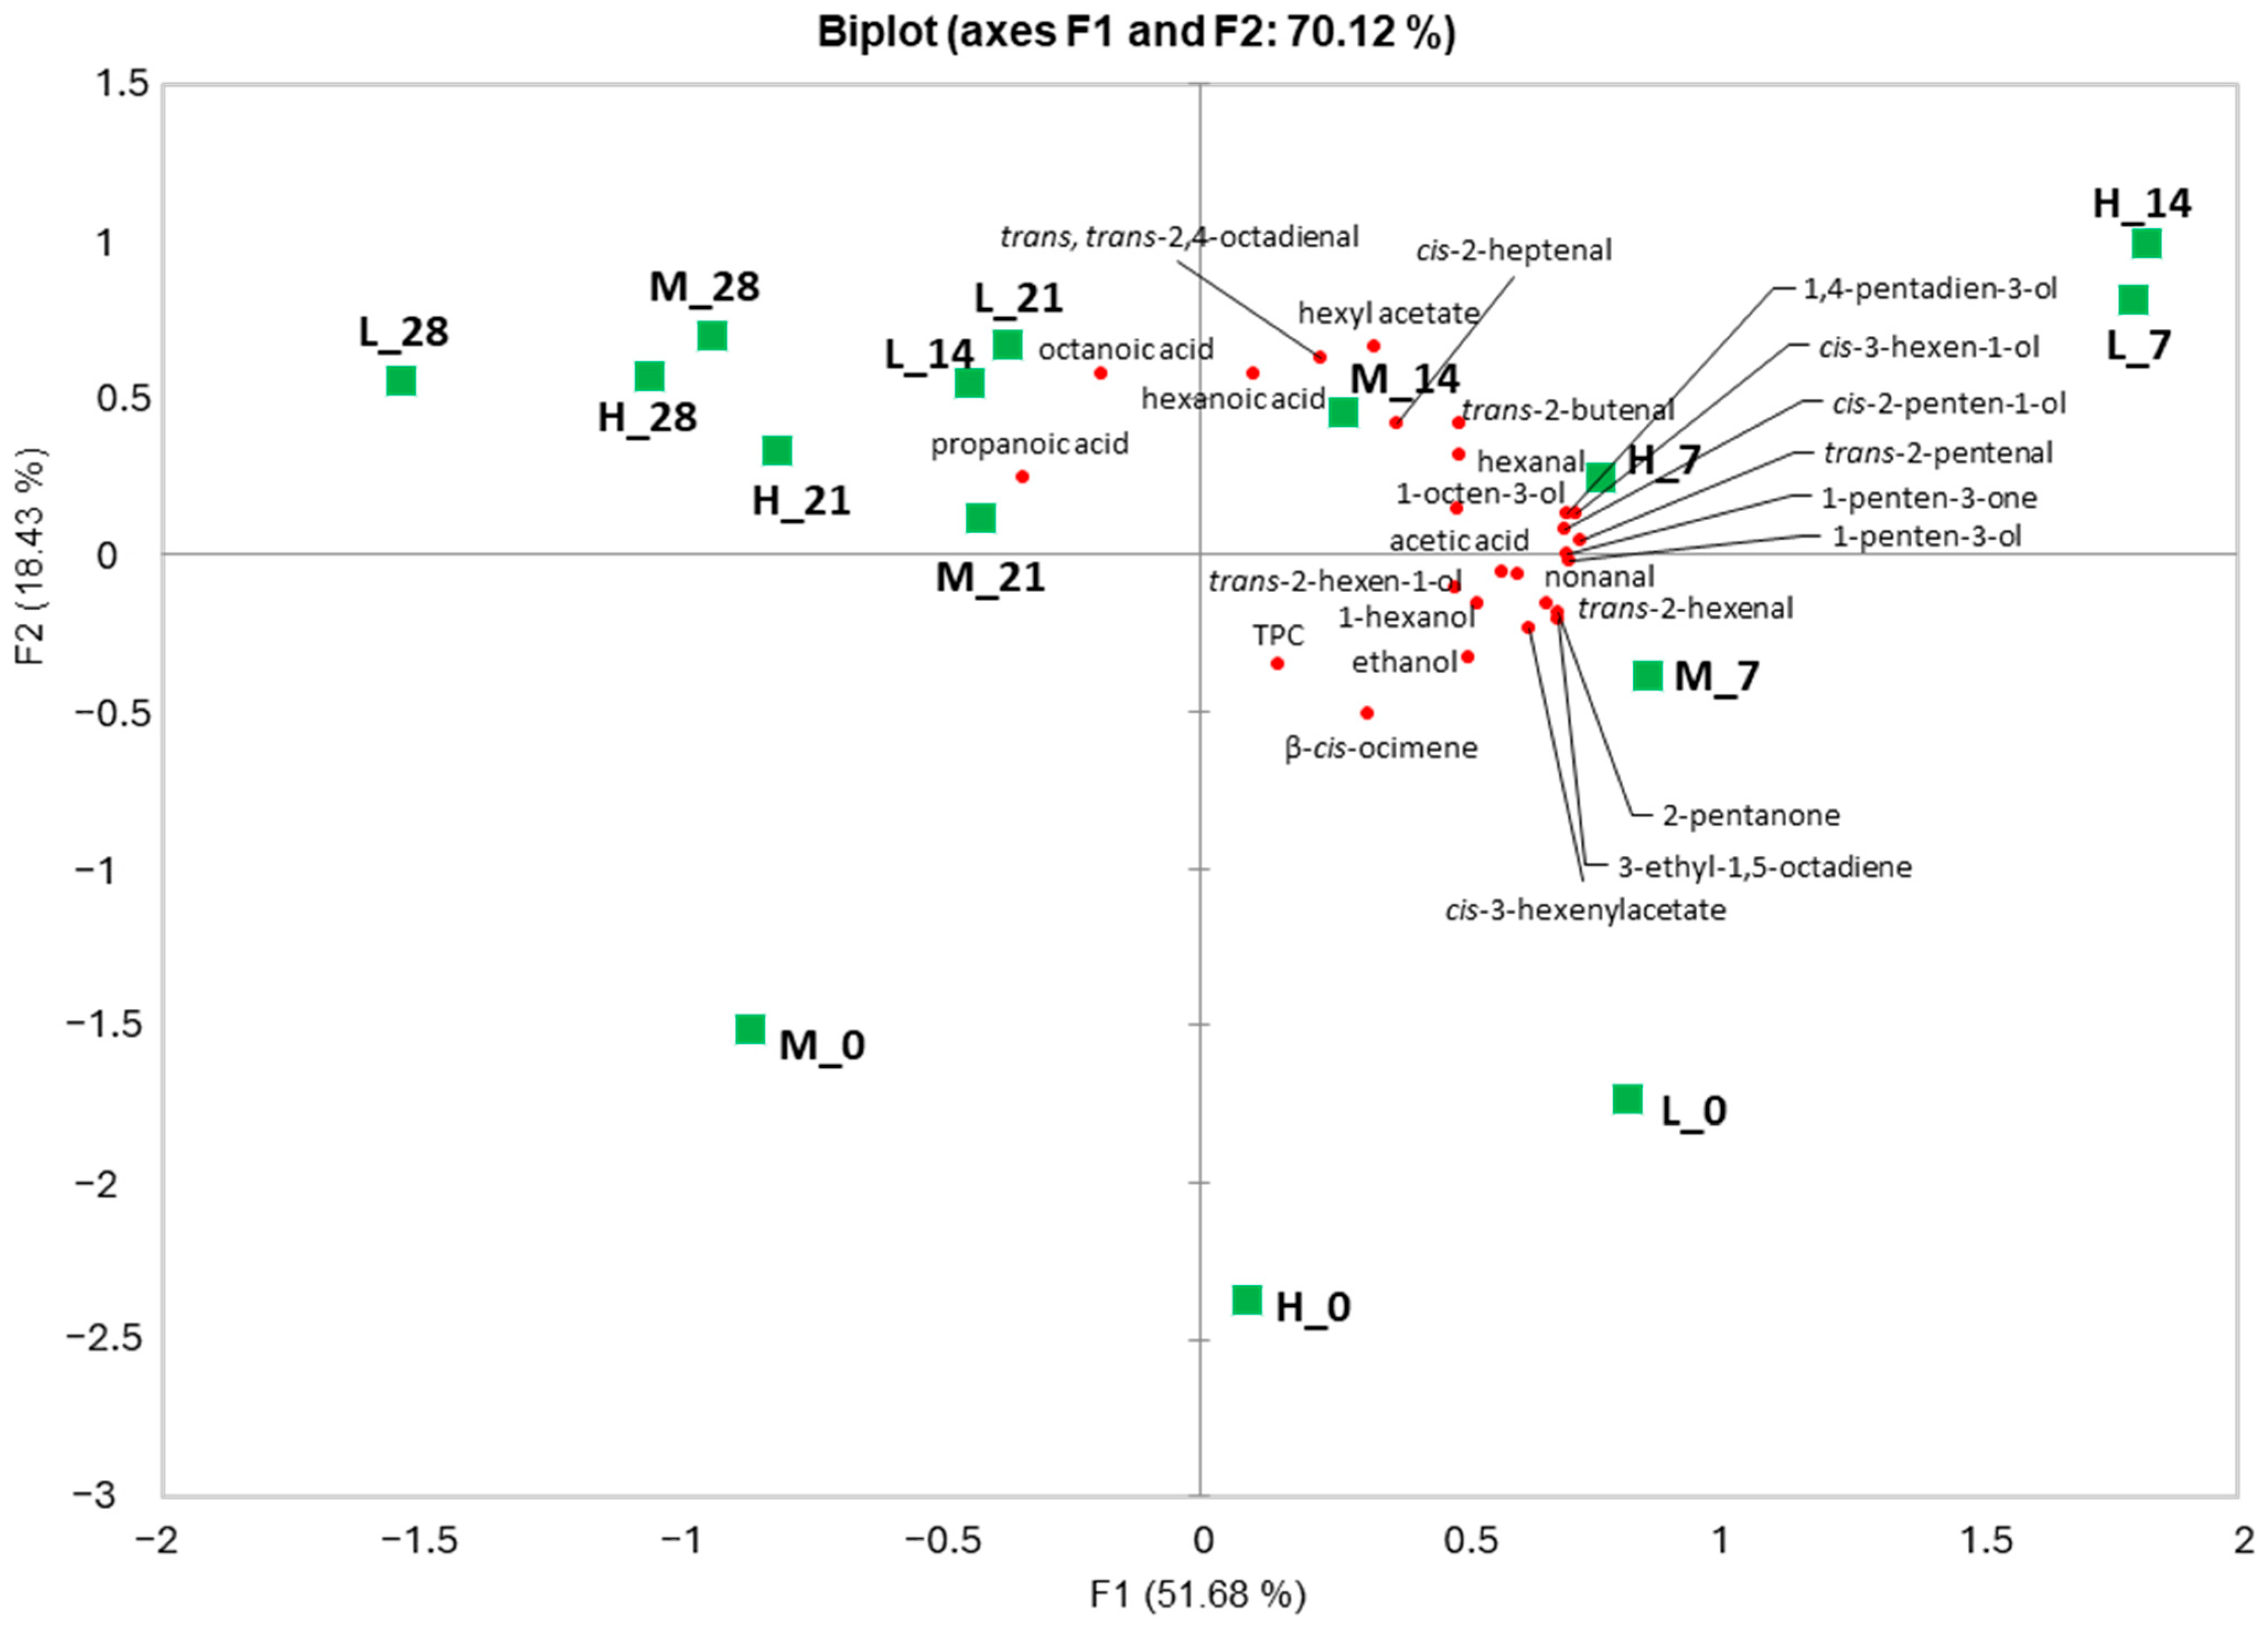
The PCA biplot (Figure 3) explains 70.12% of the total variance with the first two principal components (PC1: 51.68%; PC2: 18.44%). Sample scores cluster according to polyphenol content (H, high; M, medium; L, low), indicating that phenolic concentration strongly shapes the volatile profile.
Figure 3.
Principal component analysis (PCA) based on volatile organic compounds (VOCs) and total phenolic content of the three extra virgin olive oils during the one-month simulated household consumption period. The green squares represent the samples, while the red circles represent the variables.
A clear time-dependent trajectory under simulated domestic use (daily bottle opening and removal of 20 mL, up to 28 days) emerges along PC1 scores. Samples collected at later time points (e.g., days 21–28) display higher PC1 scores and align with positive PC1 loadings of oxidation-related VOCs (e.g., octanoic acid, propanoic acid, and trans, trans-2,4-octadienal), markers typically associated with rancid/oxidized notes. Conversely, earlier time points (e.g., days 7–14) show lower PC1 scores and align with negative PC1 loadings of fresh/green VOCs such as hexyl acetate, trans-2-hexenal, and 1-penten-3-one, which contribute to green and fruity sensory attributes. Along PC2, additional separation reflects secondary differences among phenolic classes and specific VOC families.
The L group exhibits a larger shift toward higher PC1 scores over time, indicating a greater accumulation of oxidation markers, while H samples retain lower PC1 scores and remain associated with green-related VOCs for longer, consistent with the protective effect of phenolics. The progressive decline of key C6 LOX-derived compounds, particularly trans-2-hexenal and cis-3-hexenyl acetate, was most pronounced in L, mirroring the attenuation of leafy/green sensory notes observed in sensory analysis (Figure 1).
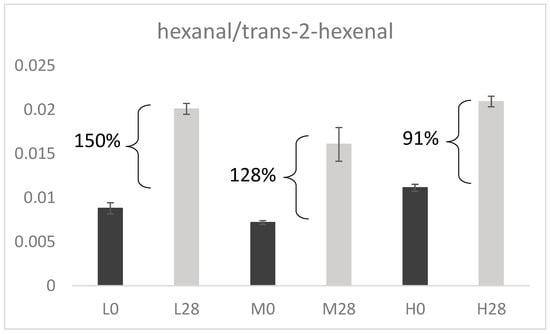
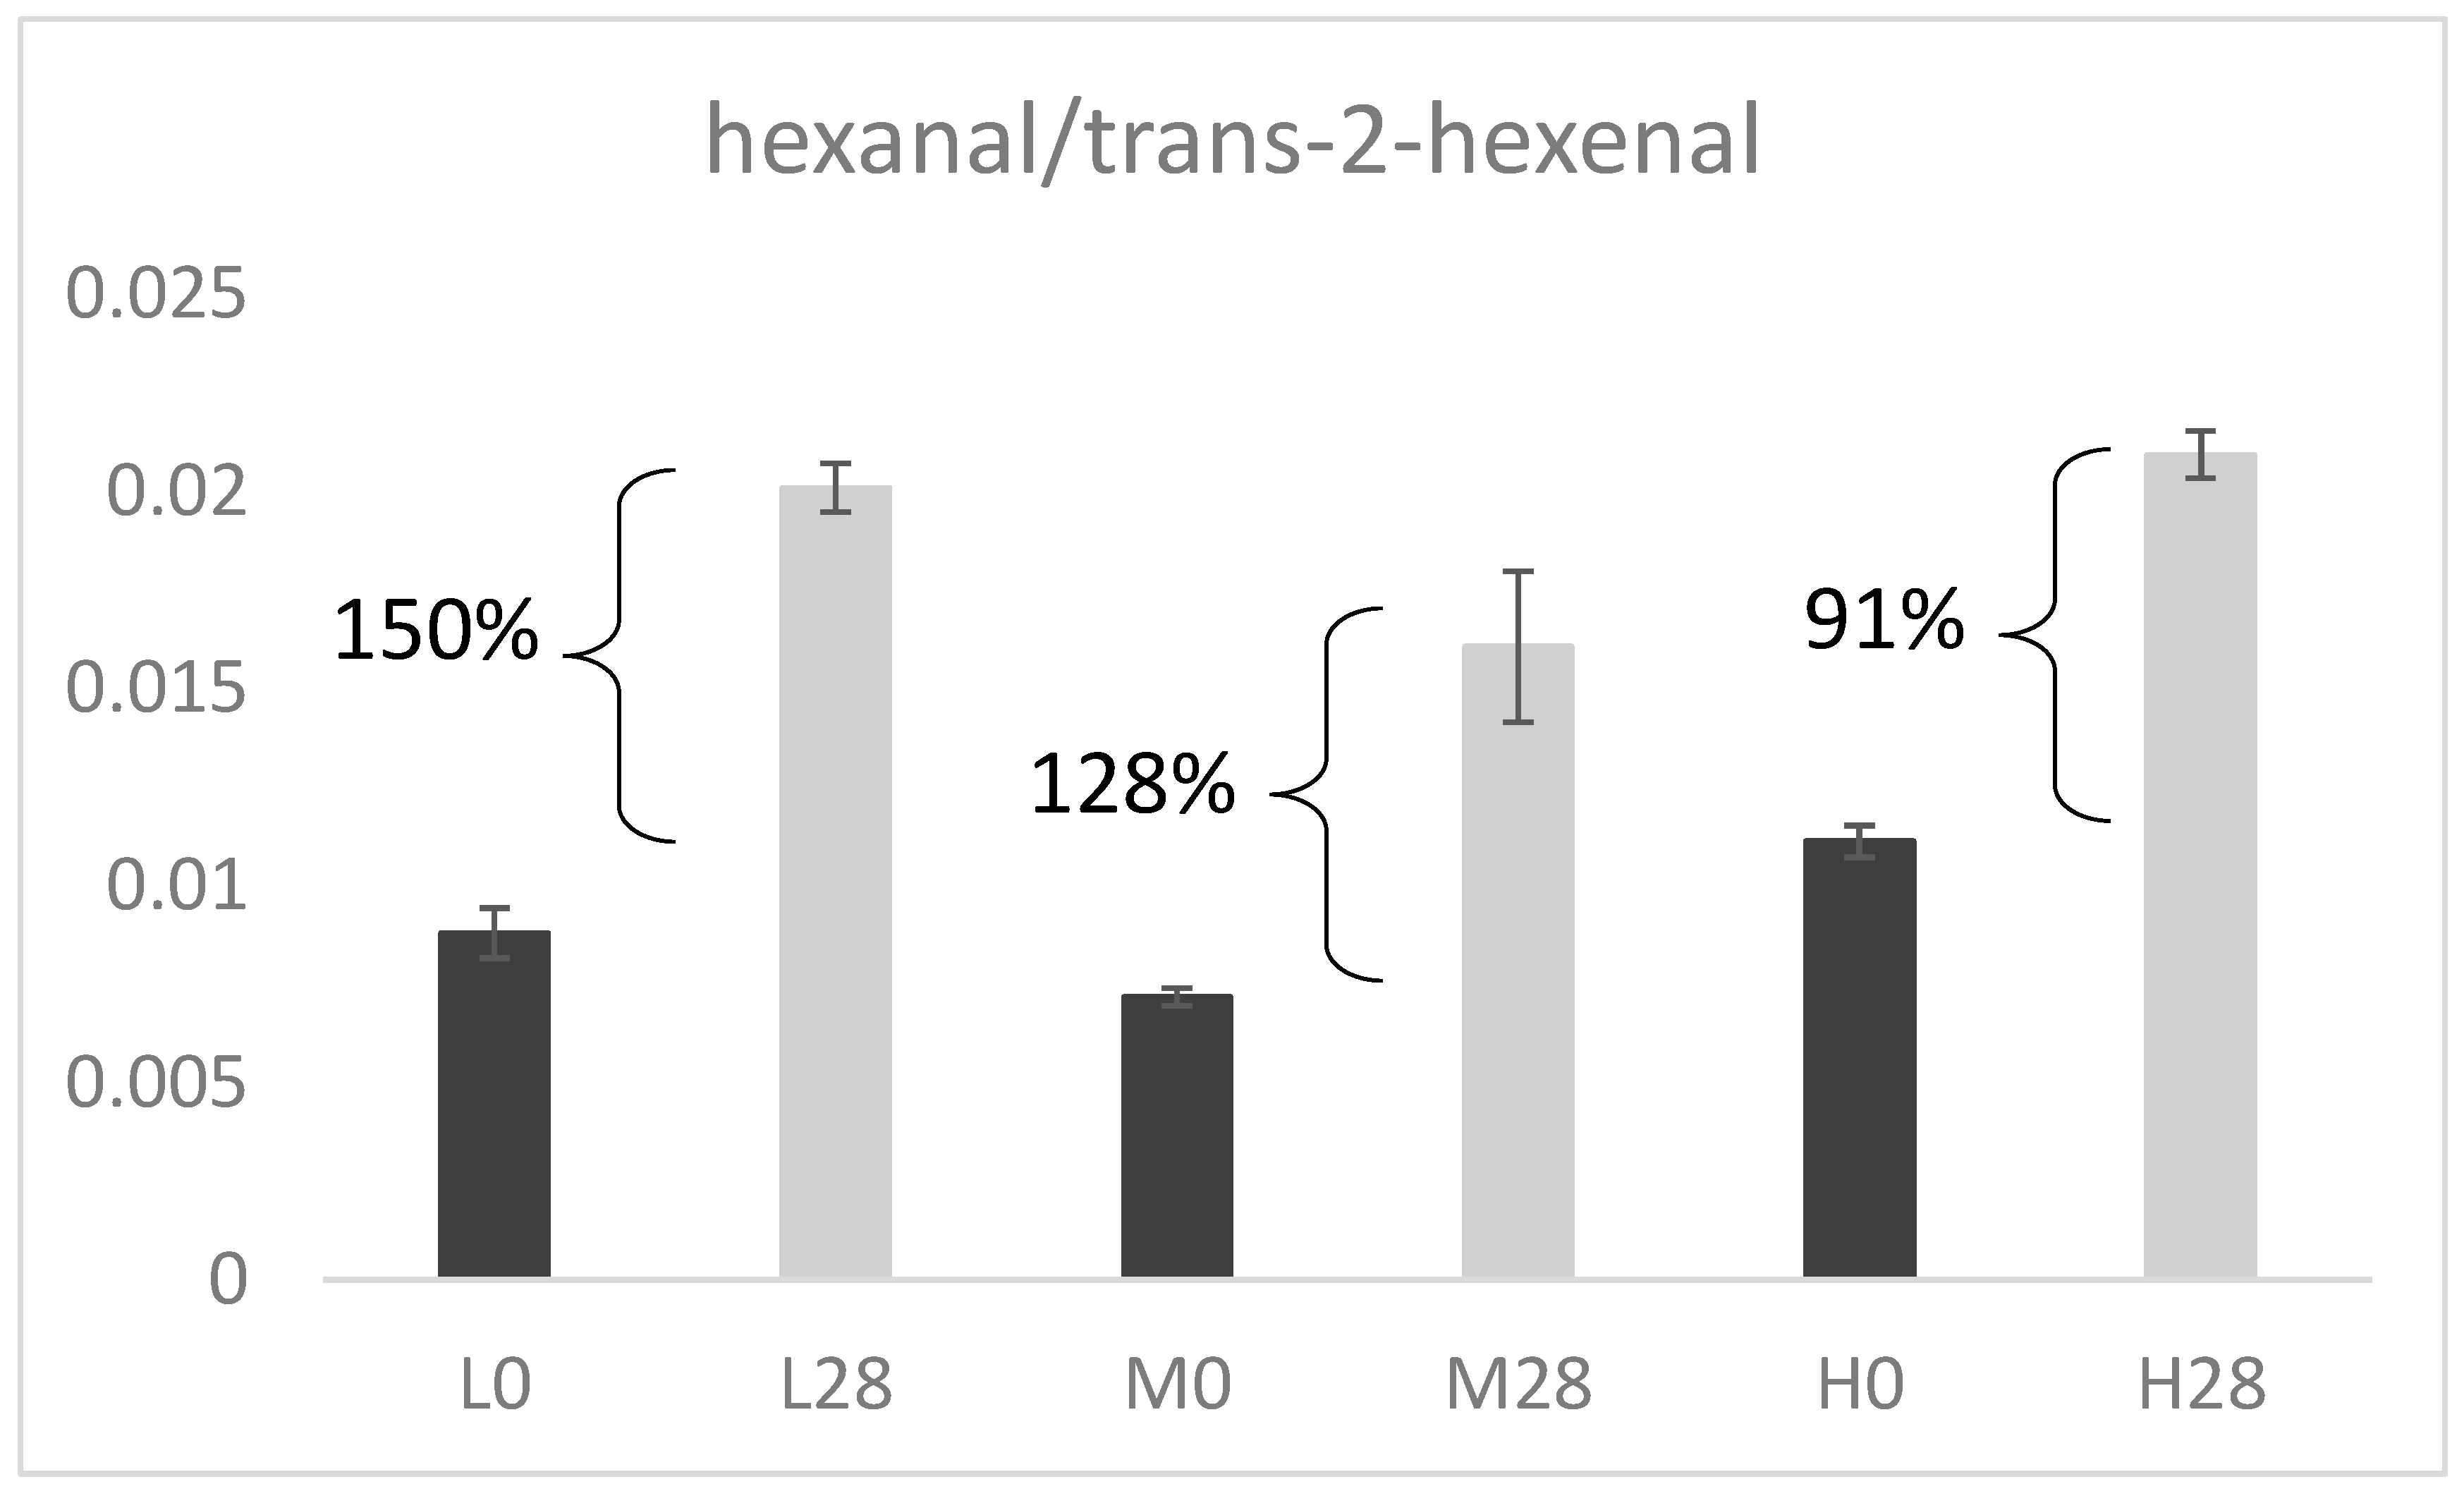
To further assess oxidative progression, the hexanal/trans-2-hexenal ratio was calculated as an oxidation index, following methodologies reported by Sacchi, Caporaso, Paduano and Genovese [21]. As shown in Figure 4, this ratio increased with decreasing phenolic content. Specifically, sample L exhibited the highest increase (+150%), followed by sample M (+128%) and sample H (+91%).
Figure 4.
Oxidation index expressed as the hexanal/trans-2-hexenal ratio in the three EVOO samples (H, M, and L) after 28 days of simulated domestic consumption. L, M, and H correspond to EVOO samples with low, medium, and high levels of total phenolic compounds, respectively.
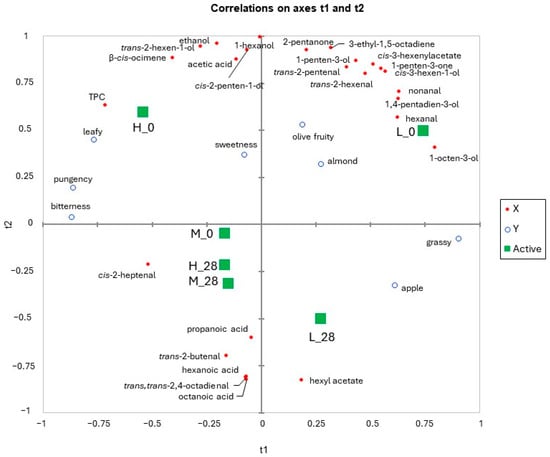
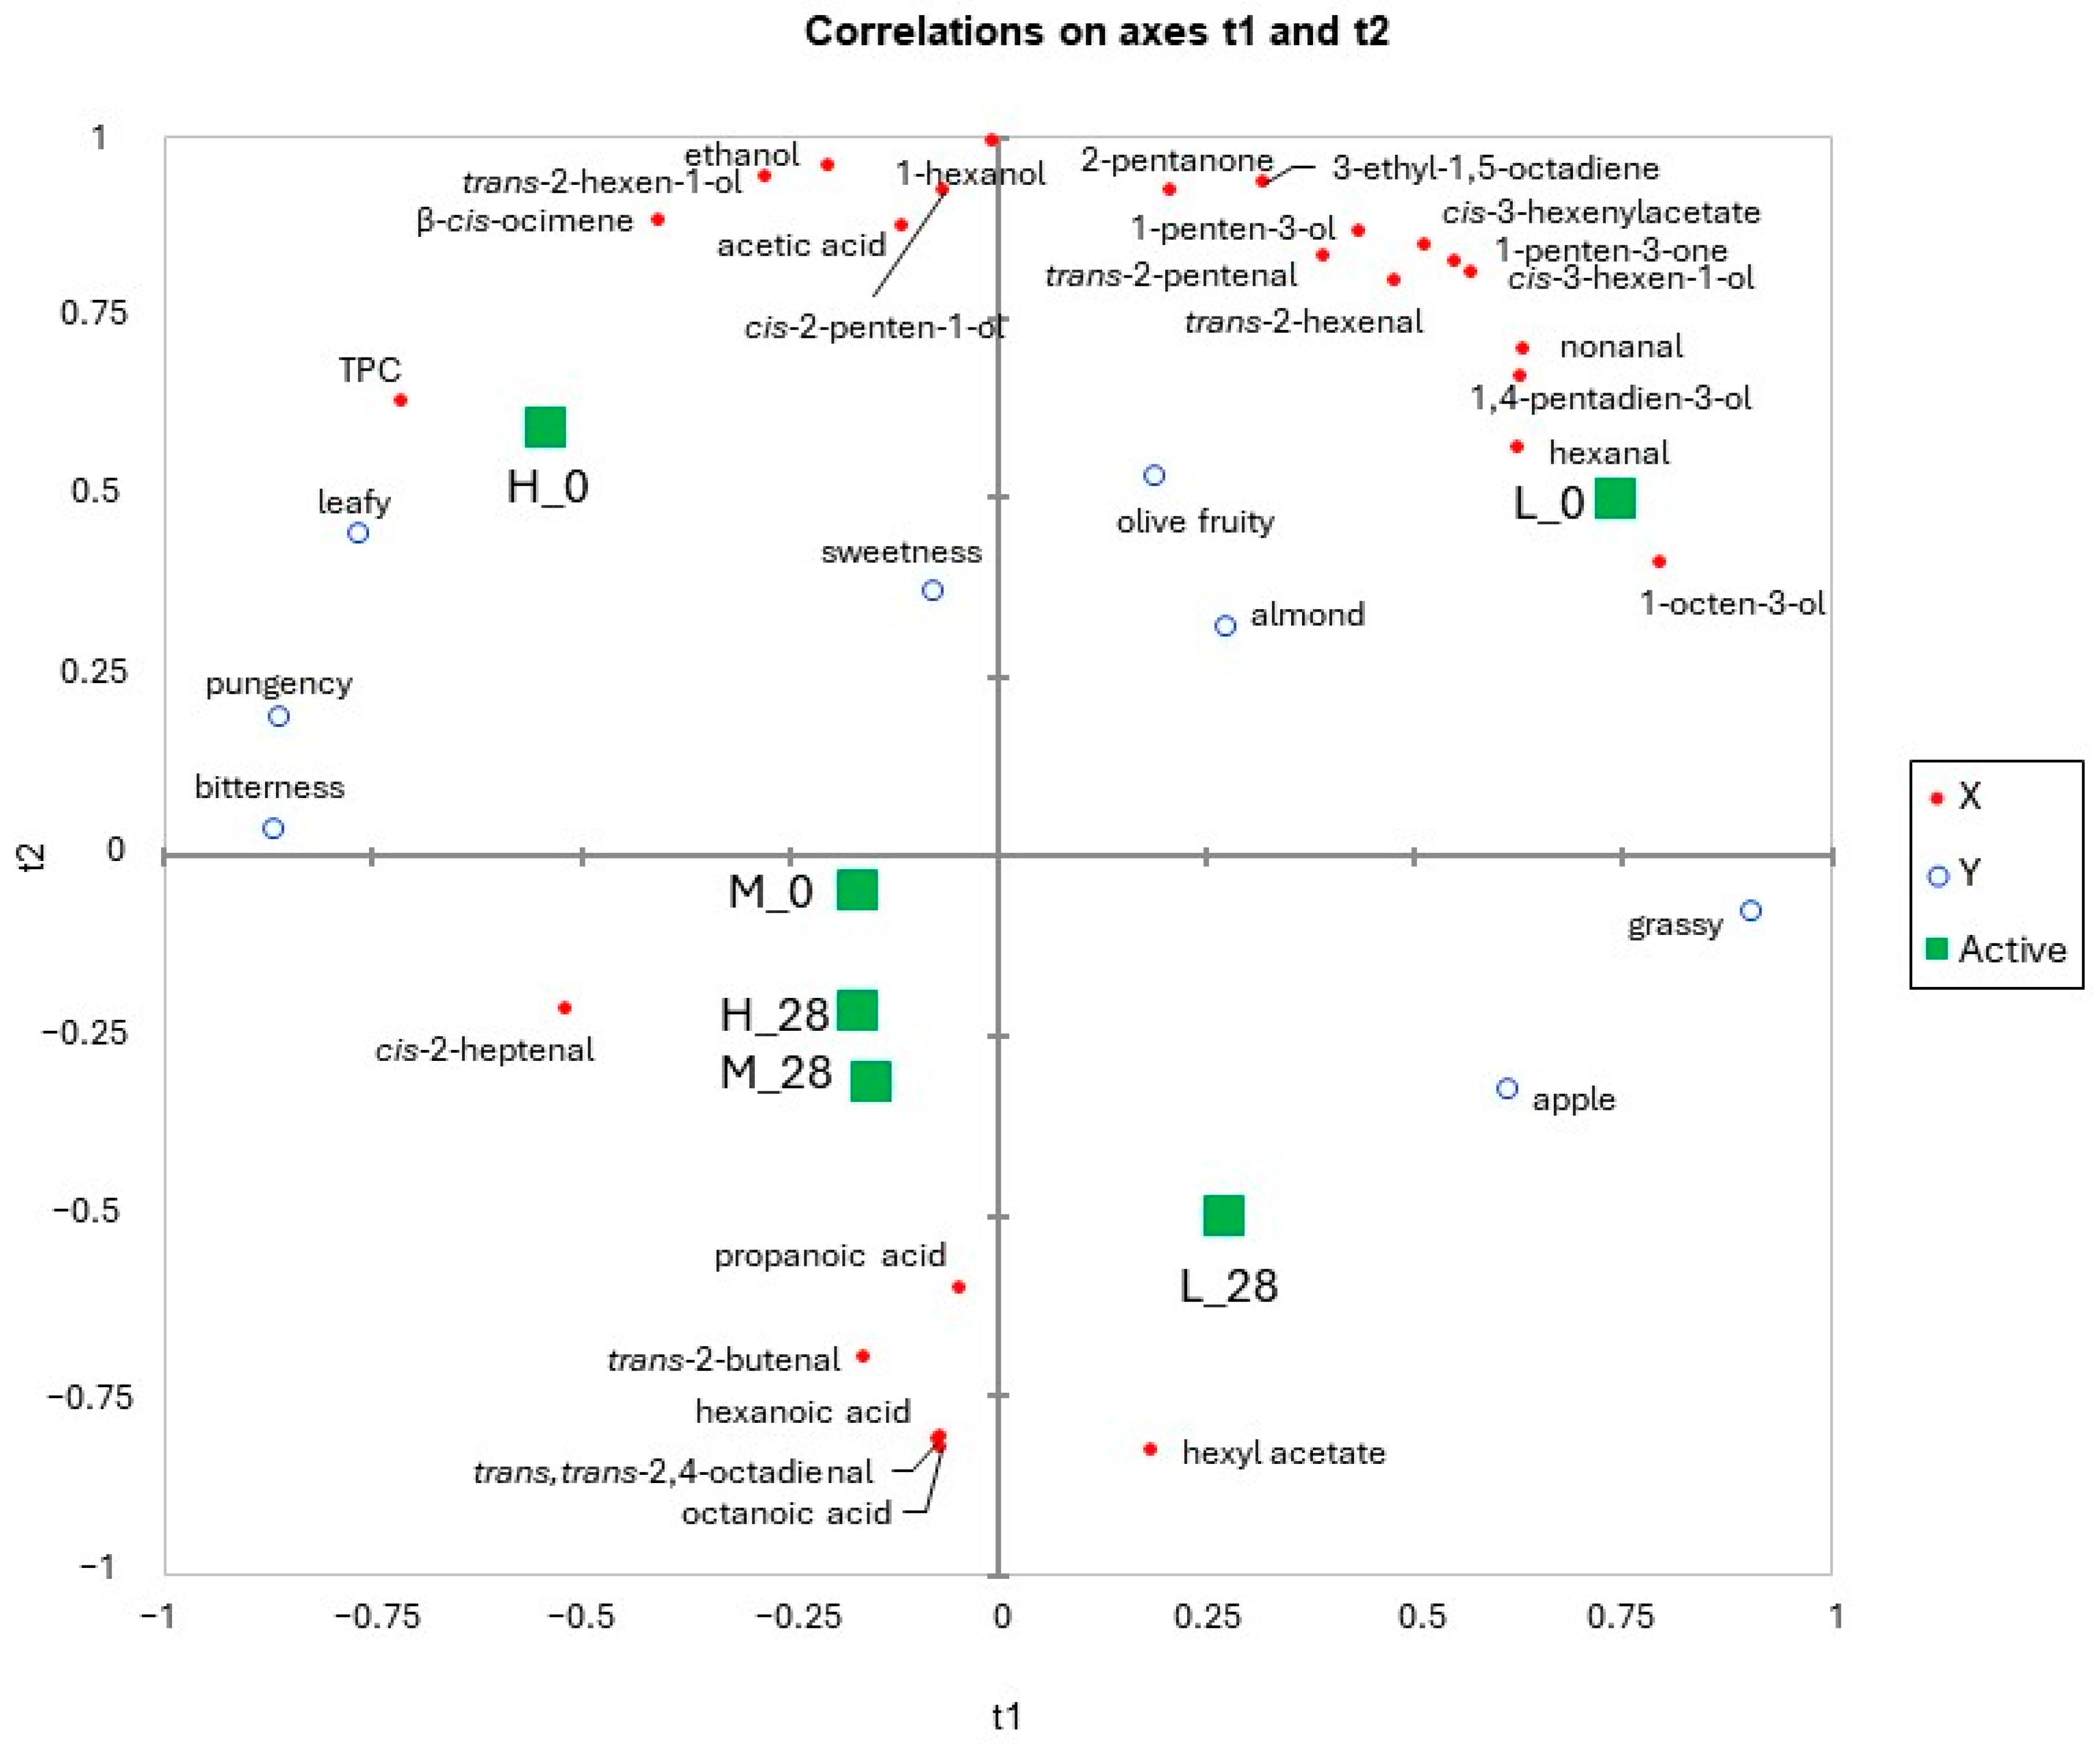
To investigate the relationships between volatile and phenolic compounds and sensory properties, a Partial Least Squares Regression (PLS-R) analysis was performed using the volatile compounds as X-variables and the sensory descriptors as Y-variables (Figure 5).
Figure 5.
PLSR correlation loading plot (t1 vs. t2) relating volatile and phenolic compounds (red) and sensory attributes (blue) for the EVOO samples (green) during the simulated domestic use.
Latent variable t1 mainly describes differences related to phenolic content and freshness versus oxidation. Samples with high total phenolic content (TPC), such as H_0, are located on the negative side of t1 and are closely associated with leafy, pungency, and bitterness sensory attributes, as well as with typical green LOX-derived volatiles (e.g., trans-2-hexen-1-ol, cis-3-hexen-1-ol, and trans-2-hexenal). This clustering confirms the strong link between phenolic compounds and both fresh green aroma and positive sensory attributes in olive oil. Conversely, samples characterized by longer storage times, particularly those belonging to the L group (e.g., L_28), shift toward the positive side of t1 and negative values of t2, where they correlate with oxidation-related VOCs such as octanoic acid, hexanoic acid, propanoic acid, and trans, trans-2,4-octadienal. These compounds are well-known markers of lipid oxidation and rancidity, indicating a progressive deterioration of aroma quality during storage. Latent variable t2 further describes the temporal evolution of sensory perception during domestic use. At the beginning, samples are associated with positive sensory descriptors such as olive fruity and almond, and with aldehydes like trans-2-hexenal. In contrast, samples collected after prolonged domestic use show a downward shift along t2, corresponding to an increased contribution of fermentation- and oxidation-related compounds and a reduced association with fresh sensory notes.
Notably, high-phenolic oils (H) exhibit a limited temporal displacement during the simulated domestic use period, maintaining associations with green, pungent, and bitter attributes even after 28 days. Conversely, low-phenolic oils (L) display a more pronounced evolution toward oxidation markers and negative sensory descriptors, while medium-phenolic oils (M) show an intermediate behaviour. These results highlight the protective role of phenolic compounds under realistic household use conditions, rather than under static storage.
The present results provide experimental evidence, under realistic household consumption conditions, that repeated bottle opening and progressive oxygen exposure accelerate the loss of phenolic compounds and the attenuation of positive sensory attributes, particularly in oils with lower initial phenolic content. These findings offer a mechanistic and quantitative support to the recommendations reported in the Linee Guida per la Qualità dell’Olio Vergine di Oliva developed within the Regional Programs for the Improvement of Olive Oil Quality coordinated by the Department of Agriculture of the Campania Region [24]. In particular, the observed quality deterioration during simulated domestic use reinforces the recommendation to limit bottle size (250–500 mL) for high-quality EVOOs intended for daily consumption and to adopt packaging solutions with high barriers to light and oxygen (e.g., dark glass and airtight closures), as well as optimized filtration and bottling conditions (e.g., inert atmosphere).
4. Conclusions
Simulated domestic consumption of extra virgin olive oil resulted in significant changes in both its phenolic content and volatile compound profiles.
A progressive reduction in total phenolic content was observed in all samples over the 28-day simulated domestic consumption period. When expressed as a relative percentage loss, sample H (high phenolic content) exhibited a 29% decrease, sample M (medium phenolic content) a 25% decrease, and sample L (low phenolic content) a 50% decrease. These results highlight that oils with higher initial phenolic levels retain a larger proportion of their antioxidant compounds during daily use, demonstrating greater resistance to oxidative degradation.
Correspondingly, volatile compound analysis revealed a decrease in key aroma-related aldehydes such as trans-2-hexenal, particularly in the low-phenol sample (L), alongside an increase in oxidation markers like hexanal and nonanal. Despite these changes, no sensory defects were detected at the end of the study, although a general attenuation of positive aromatic descriptors was noted, especially in the L sample.
These findings indicate that even EVOOs initially meeting the EU health claim requirements for polyphenol content may undergo a progressive loss of these compounds during typical household use. This highlights that the phenolic content declared at bottling may not fully reflect the levels maintained under real-life consumption conditions. Further studies are needed to quantify the persistence of the health claim over time and to develop strategies to preserve phenolic content during domestic storage and use.
Author Contributions
Conceptualization, R.S. and M.L.A.; methodology, R.S., M.L.A. and A.G.; formal analysis, A.B. and R.D.; investigation, A.B., R.D., L.D.L. and M.L.A.; resources, R.S. and A.G.; data curation, A.B. and R.D.; writing—original draft preparation, R.D. and A.B.; writing—review and editing, A.G., R.S., M.L.A. and L.D.L.; visualization, A.B., R.D. and M.L.A.; supervision, R.S. and A.G.; project administration, R.S. All authors have read and agreed to the published version of the manuscript.
Funding
This work was supported by Campania Region, Italy (Project Code: PSR Campania 2014/2020, Misura 16.1.1. “Sviluppo della competitività degli oli extra -vergini di oliva di alta qualità mediante BOX multiprodotto ed etichetta NARRANTE”— CUP B68H19005400008).
Data Availability Statement
Data supporting the conclusions of this article not already presented in the tables and figures will be available from the corresponding author (A.G.) upon reasonable request.
Conflicts of Interest
The authors declare no conflicts of interest. The funders had no role in the design of the study; in the collection, analyses or interpretation of data; in the writing of the manuscript, or in the decision to publish the results.
References
- Genovese, A.; Caporaso, N.; Sacchi, R. Flavor Chemistry of Virgin Olive Oil: An Overview. Appl. Sci. 2021, 11, 1639. [Google Scholar] [CrossRef] [Scilit]
- Angerosa, F.; Servili, M.; Selvaggini, R.; Taticchi, A.; Esposto, S.; Montedoro, G. Volatile compounds in virgin olive oil: Occurrence and their relationship with the quality. J. Chromatogr. A 2004, 1054, 17–31. [Google Scholar] [CrossRef]
- Jimenez-Lopez, C.; Carpena, M.; Lourenço-Lopes, C.; Gallardo-Gomez, M.; Lorenzo, J.M.; Barba, F.J.; Prieto, M.A.; Simal-Gandara, J. Bioactive compounds and quality of extra virgin olive oil. Foods 2020, 9, 1014. [Google Scholar] [CrossRef] [Scilit]
- Lercker, G.; Caramia, G.M. Composizione ed aspetti salutistici dell’olio d’oliva. Riv. Ital. Sostanze Grasse 2010, 87, 147–169. [Google Scholar]
- Román, G.C.; Jackson, R.E.; Reis, J.; Román, A.N.; Toledo, J.B.; Toledo, E. Extra-virgin olive oil for potential prevention of Alzheimer disease. Rev. Neurol. 2019, 175, 705–723. [Google Scholar] [CrossRef] [Scilit] [PubMed]
- Massaro, M.; Scoditti, E.; Carluccio, M.A.; Calabriso, N.; Santarpino, G.; Verri, T.; De Caterina, R. Effects of Olive Oil on Blood Pressure: Epidemiological, Clinical, and Mechanistic Evidence. Nutrients 2020, 12, 1548. [Google Scholar] [CrossRef] [Scilit]
- Oliveras-López, M.-J.; Berná, G.; Jurado-Ruiz, E.; de la Serrana, H.L.-G.; Martín, F. Consumption of extra-virgin olive oil rich in phenolic compounds has beneficial antioxidant effects in healthy human adults. J. Funct. Foods 2014, 10, 475–484. [Google Scholar] [CrossRef] [Scilit]
- EFSA Panel on Dietetic Products, Nutrition and Allergies (NDA). Scientific opinion on the substantiation of health claims related to polyphenols in olive and protection of LDL particles from oxidative damage (ID 1333, 1638, 1639, 1696, 2865), maintenance of normal blood HDL cholesterol concentrations (ID 1639), maintenance of normal blood pressure (ID 3781),“anti-inflammatory properties”(ID 1882),“contributes to the upper respiratory tract health”(ID 3468),“can help to maintain a normal function of gastrointestinal tract”(3779), and “contributes to body defences against external agents”(ID 3467) pursuant to Article 13 (1) of Regulation (EC) No 1924/2006. EFSA J. 2011, 9, 2033. [Google Scholar] [CrossRef] [Scilit]
- Klisović, D.; Novoselić, A.; Lukić, I.; Bubola, K.B. Extra virgin olive oil under simulated consumption conditions: Evaluation of quality, health, and flavour properties. J. Food Compos. Anal. 2022, 110, 104570. [Google Scholar] [CrossRef] [Scilit]
- Caipo, L.; Sandoval, A.; Sepúlveda, B.; Fuentes, E.; Valenzuela, R.; Metherel, A.H.; Romero, N. Effect of storage conditions on the quality of arbequina extra virgin olive oil and the impact on the composition of flavor-related compounds (phenols and volatiles). Foods 2021, 10, 2161. [Google Scholar] [CrossRef] [Scilit]
- Lobo-Prieto, A.; Tena, N.; Aparicio-Ruiz, R.; García-González, D.L.; Sikorska, E. Monitoring virgin olive oil shelf-life by fluorescence spectroscopy and sensory characteristics: A multidimensional study carried out under simulated market conditions. Foods 2020, 9, 1846. [Google Scholar] [CrossRef] [Scilit] [PubMed]
- Genovese, A.; Caporaso, N.; Villani, V.; Paduano, A.; Sacchi, R. Olive oil phenolic compounds affect the release of aroma compounds. Food Chem. 2015, 181, 284–294. [Google Scholar] [CrossRef] [Scilit]
- Genovese, A.; Yang, N.; Linforth, R.; Sacchi, R.; Fisk, I. The role of phenolic compounds on olive oil aroma release. Food Res. Int. 2018, 112, 319–327. [Google Scholar] [CrossRef] [Scilit]
- Genovese, A.; Caporaso, N.; Sacchi, R. Temporal changes of virgin olive oil volatile compounds in a model system simulating domestic consumption: The role of biophenols. Food Res. Int. 2015, 77, 670–674. [Google Scholar] [CrossRef] [Scilit]
- Frankel, E.N. Chemistry of extra virgin olive oil: Adulteration, oxidative stability, and antioxidants. J. Agric. Food Chem. 2010, 58, 5991–6006. [Google Scholar] [CrossRef] [Scilit]
- Genovese, A.; Caporaso, N.; Leone, T.; Paduano, A.; Mena, C.; Perez-Jimenez, M.A.; Sacchi, R. Use of odorant series for extra virgin olive oil aroma characterisation. J. Sci. Food Agric. 2019, 99, 1215–1224. [Google Scholar] [CrossRef] [Scilit]
- Xu, L.; Yu, X.; Li, M.; Chen, J.; Wang, X. Monitoring oxidative stability and changes in key volatile compounds in edible oils during ambient storage through HS-SPME/GC–MS. Int. J. Food Prop. 2017, 20, S2926–S2938. [Google Scholar] [CrossRef] [Scilit]
- Kalua, C.M.; Allen, M.S.; Bedgood, D.R., Jr.; Bishop, A.G.; Prenzler, P.D.; Robards, K. Olive oil volatile compounds, flavour development and quality: A critical review. Food Chem. 2007, 100, 273–286. [Google Scholar] [CrossRef] [Scilit]
- Diamantakos, P.; Ioannidis, K.; Papanikolaou, C.; Tsolakou, A.; Rigakou, A.; Melliou, E.; Magiatis, P. A New Definition of the Term “High—Phenolic Olive Oil” Based on Large Scale Statistical Data of Greek Olive Oils Analyzed by QNMR. Molecules 2021, 26, 1115. [Google Scholar] [CrossRef] [Scilit] [PubMed]
- Cecchi, L.; Migliorini, M.; Mulinacci, N. Virgin olive oil volatile compounds: Composition, sensory characteristics, analytical approaches, quality control, and authentication. J. Agric. Food Chem. 2021, 69, 2013–2040. [Google Scholar] [CrossRef] [Scilit] [PubMed]
- Sacchi, R.; Caporaso, N.; Paduano, A.; Genovese, A. Industrial-scale filtration affects volatile compounds in extra virgin olive oil cv. Ravece. Eur. J. Lipid Sci. Technol. 2015, 117, 2007–2014. [Google Scholar] [CrossRef] [Scilit]
- Singleton, V.L.; Rossi, J.A. Colorimetry of total phenolics with phosphomolybdic-phosphotungstic acid reagents. Am. J. Enol. Vitic. 1965, 16, 144–158. [Google Scholar] [CrossRef] [Scilit]
- Castillo-Luna, A.; Criado-Navarro, I.; Ledesma-Escobar, C.; López-Bascón, M.; Priego-Capote, F. The decrease in the health benefits of extra virgin olive oil during storage is conditioned by the initial phenolic profile. Food Chem. 2021, 336, 127730. [Google Scholar] [CrossRef] [Scilit]
- Sacchi, R.; Della Medaglia, D.; Ambrosino, M.L.; Paduano, A.; Tartaglione, L.; Spagna Musso, S. Linee Guida per la Qualità Dell'olio Vergine di Oliva; IV edizione finanziata dalla Unione Europea, Reg. CE 2407/01; CRAA: Naples, Italy, 2003. [Google Scholar]

Disclaimer/Publisher’s Note: The statements, opinions and data contained in all publications are solely those of the individual author(s) and contributor(s) and not of MDPI and/or the editor(s). MDPI and/or the editor(s) disclaim responsibility for any injury to people or property resulting from any ideas, methods, instructions or products referred to in the content. |
© 2026 by the authors. Licensee MDPI, Basel, Switzerland. This article is an open access article distributed under the terms and conditions of the Creative Commons Attribution (CC BY) license.