


Abstract
The fracture behavior of Beishan granite is a critical scientific basis for evaluating and ensuring the long-term safety of geological repositories for high-level radioactive waste under extreme thermal–mechanical conditions. With increasing emphasis on climate-resilient infrastructure, understanding the mechanical response of deep geological materials under cyclic loading and simulating long-term environmental conditions are essential for sustainable engineering management. Previous studies have predominantly concentrated on the fracture characteristics under static loading tests, with limited research conducted on the characteristic parameters of acoustic emission (AE) during cyclic loading and the morphology of fractures post-failure. Contributing to the field of resilient infrastructure, this paper presents static and cyclic loading tests using MTS815 equipment on Beishan deep granite (CCNBD type). To determine the rock fracture toughness of mode I and fracture roughness, static loading and cyclic loading tests were conducted using MTS815 equipment with Beishan deep granite (CCNBD type) as the subject of study. AE and 3D laser scanning were employed to acquire the characteristic parameters of acoustic emission (AE) during loading and the morphology of fracture surfaces after failure in the specimens. The results revealed that CCNBD specimens demonstrated pronounced brittle tensile failure under static and cyclic loading conditions. The rock fracture toughness obtained in static tests was 1.180 MPa·m1/2, whereas under cyclic loading, it was 1.153 MPa·m1/2. In comparison to static loading, cyclic loading led to a greater accumulation of microcracks inside the specimens, resulting in a 9.8% increase in the length of the fracture process zone. A 57.5% increase in section roughness (fractal dimension) was observed after the failure of the specimen in comparison to static loading.
1. Introduction
Investigation into the cracking behavior of Beishan granite and the evolution of its micro-fractures to macro-failure provides a critical scientific basis for predicting and ensuring the long-term stability and safety thresholds of major projects like geological repositories for high-level radioactive waste (HLW) under extreme conditions [1,2]. With increasing emphasis on climate-resilient infrastructure, understanding the mechanical response of deep geological materials under cyclic loading and simulating long-term environmental conditions are essential for sustainable infrastructure management [3]. The rock encompassing deep geological disposal repositories, serving as a natural barrier system, experiences deterioration in its mechanical properties due to the enlargement of inherent cracks within the rock under cyclic loading. The expansion of cracks creates a pathway for the migration of radioactive nuclides, posing a substantial threat to secure high-level waste disposal. Consequently, the examination of mechanical properties and damage evolution in Beishan granite, containing preexisting cracks, holds immense significance for predicting rock strength and assessing the stability of the surrounding rock in geological disposal repositories.
Griffith believed that the prerequisite for material crack formation was the existence of initial cracks and defects inside the material and that the expansion of initial cracks required accumulated strain energy to exceed the surface energy of the material [4]. Ashby introduced the development law of brittle materials under tensile cracking. When the stress intensity factor exceeds the fracture toughness value, cracks inside the material undergo extension, and connections between cracks accelerate growth in the stress intensity factor and the internal crack expansion within the material [5]. The ISRM has proposed three testing ways for fracture toughness: chevron-notched Brazilian disk (CCNBD), three-point bending circular bar (CB), and chevron-notched short rod (SR) tests [6,7]. Iqbal found a 20–30% error in the rock fracture toughness using CB and SR methods on the same rocks [8]. Dwivedi measured rock fracture toughness using the CCNBD method, and their values were 30–50% lower than those in CB or SR tests. Therefore, many scholars have recalibrated nondimensional stress intensity factors for CCNBD testing [9]. Wang referred to the size recommendation of ISRM on CCNBD specimens to recalibrate stress intensity factors (SIFs) within this size range using the finite element method [10]. Shetty calculated fracture toughness values for composite loading conditions based on the assumption that crack extension in CCNBD specimens penetrates straight-through cracks [11]. Erarslan conducted a series of studies on CCNBD samples and found that cyclic loading significantly reduced their fracture toughness, and the rock exhibited noticeable tensile softening phenomena [12,13]. This phenomenon is believed to be related to the fracture process zone (FPZ) of preexisting cracks. Ghamgosar analyzed the FPZ of static and cyclically loaded CCNBD samples using CT scanning technology and discovered that under static loading, secondary cracks did not form in the samples [14,15]. However, as the amplitude of the cyclic loading increased, more microcracks appeared in the FPZ. Kaklis determined the crack initiation stress for CCNBD samples under static loading by analyzing their acoustic emission (AE) characteristics, and they described the failure process using an AE event location map [16]. Kaklis determined the crack initiation stress for CCNBD samples under static loading by analyzing their acoustic emission (AE) characteristics, and they described the failure process using an AE event location map [16]. In recent years, increasing attention has been paid to the fracture behavior and damage evolution of granite under cyclic loading conditions. Lin et al. investigated the fracture behaviors and crack propagation characteristics of granite under cyclic loading–unloading conditions and revealed the progressive accumulation of internal damage during repeated loading cycles [17]. Lv et al. reported that cyclic loading significantly affects the mode I fracture toughness of granite, especially under high-temperature environments [18]. Ma et al. further demonstrated that cyclic loading can induce pronounced damage accumulation and energy dissipation in deeply buried granite under triaxial stress conditions [19]. In addition, Xue et al. showed that different cyclic loading paths strongly influence crack propagation behavior and fracture characteristics of granite [20]. Moreover, environmental conditions such as thermal treatment and cooling methods can further modify the microstructural damage and mechanical properties of granite [21].
In a study of the fracture mechanics properties of Beishan granite, Deng conducted CB tests on Beishan granite using four different particle sizes and found that the fracture toughness decreases with the increased particle size of the granite specimen [22]. The larger the particle size, the greater the AE events that occurred during the rock loading process. They also used cumulative AE events to describe crack propagation inside the rock during testing. Li conducted CB tests on Beishan granite in different particle sizes under dry and saturated conditions and found that saturation treatment significantly reduced the tensile strength and splitting toughness of rocks and accelerated crack propagation speed [23]. Song conducted a split Hopkinson bar test on cracked circular notched semi-circular bending (CCNSCB) and notched semi-circular bending (NSCB) specimens. The dynamic fracture toughness of NSCB and CCNSCB specimens exhibited an obvious rate dependence that increased with the increase in dynamic loading rate. Moreover, the dynamic fracture toughness values for CCNSCB specimens were higher than those for NSCB specimens [24]. Zuo and Miao conducted CB tests on thermally treated granites, where brittle failure was dominant in Beishan granite [25,26]. With gradually increasing temperatures, the rock fracture toughness showed a slight increase followed by a rapid decrease before it slightly increased again. Huang studied the temperature influence on the creep fracture characteristics of granite using an improved CB test. They found that the granite fracture toughness will reach its maximum value at 75 °C and then decrease with increasing temperature [27].
Numerous scholars have conducted CB testing on Beishan deep granite containing preexisting cracks, obtained the fracture toughness of mode I, and studied the rock fracture mechanical properties under different experimental conditions. However, there are only a few reports on the fracture mechanical properties of Beishan deep granite obtained from CCNBD tests. Therefore, static loading and cyclic loading tests were carried out on Beishan deep CCNBD granite specimens from the Beishan area to investigate the bearing capacity and fracture properties of the rock, as well as to explore AE evolution characteristics during the rock damage process.
Based on the above research background, this study aims to investigate the influence of cyclic loading on the damage and fracture behavior of Beishan deep granite through comparative static and cyclic loading tests from a multiscale perspective. The specific objectives are as follows: (1) to quantify the effect of cyclic loading on the mode I fracture toughness of the rock; (2) to characterize the evolution of the fracture process zone (FPZ) using acoustic emission techniques; and (3) to quantify the differences in post-failure fracture surface morphology using three-dimensional laser scanning. In addition, a working hypothesis is explicitly proposed: cyclic loading promotes the accumulation of microcracks, which leads to a reduction in rock fracture toughness, an expansion of the fracture process zone, and an increase in fracture surface roughness, thereby intensifying material damage.
2. Test Preparation
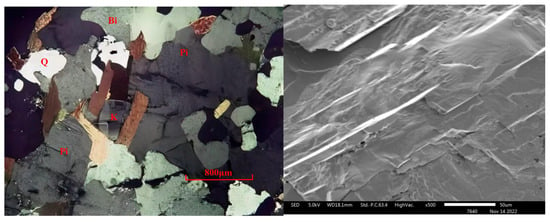
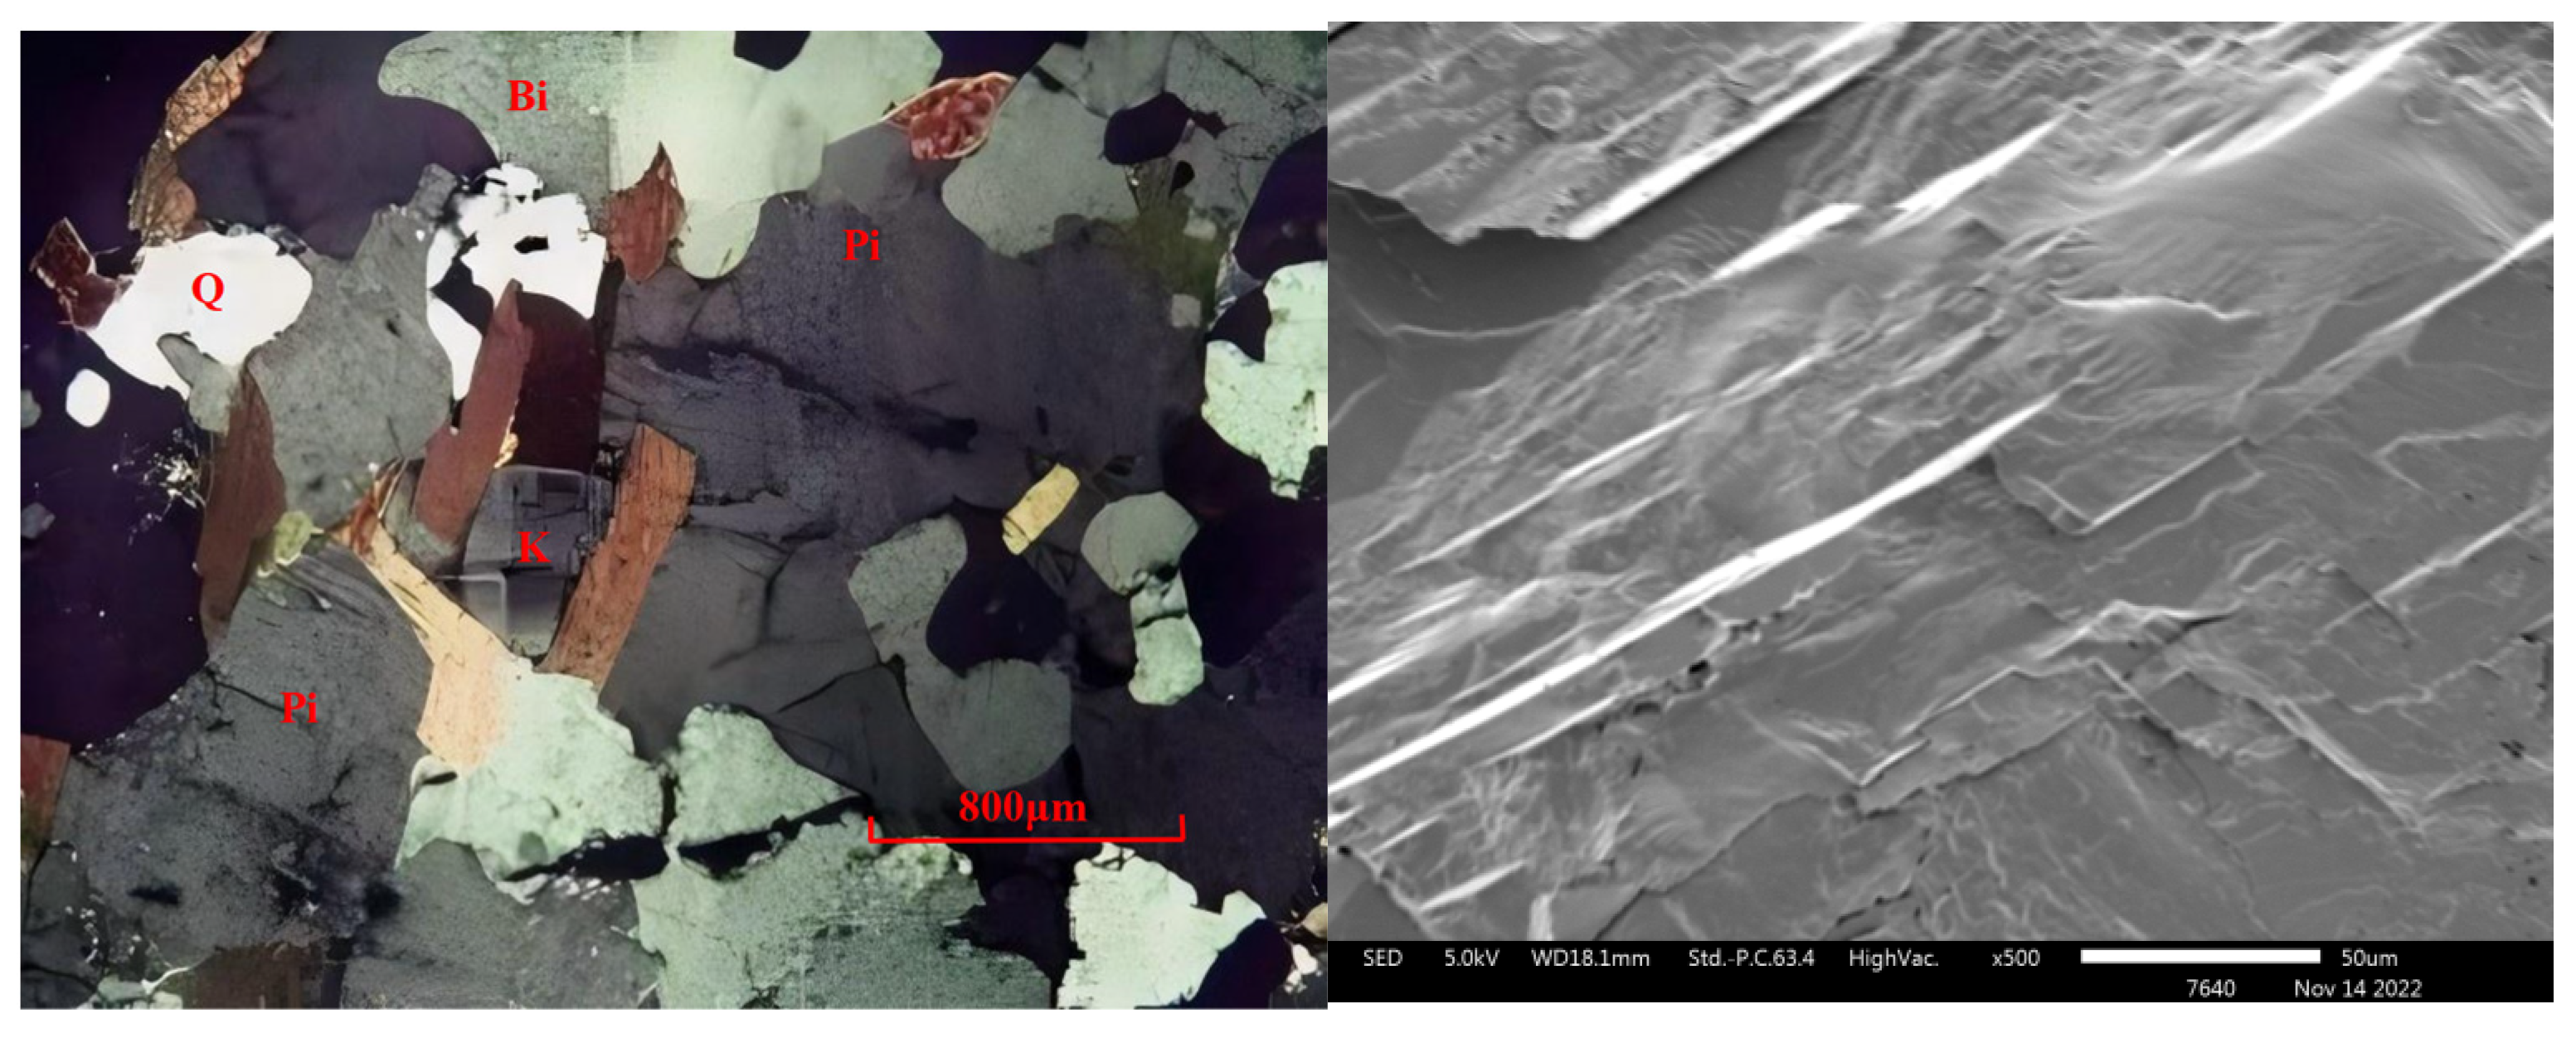
2.1. Specimen Description
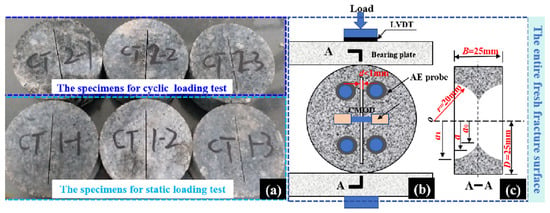
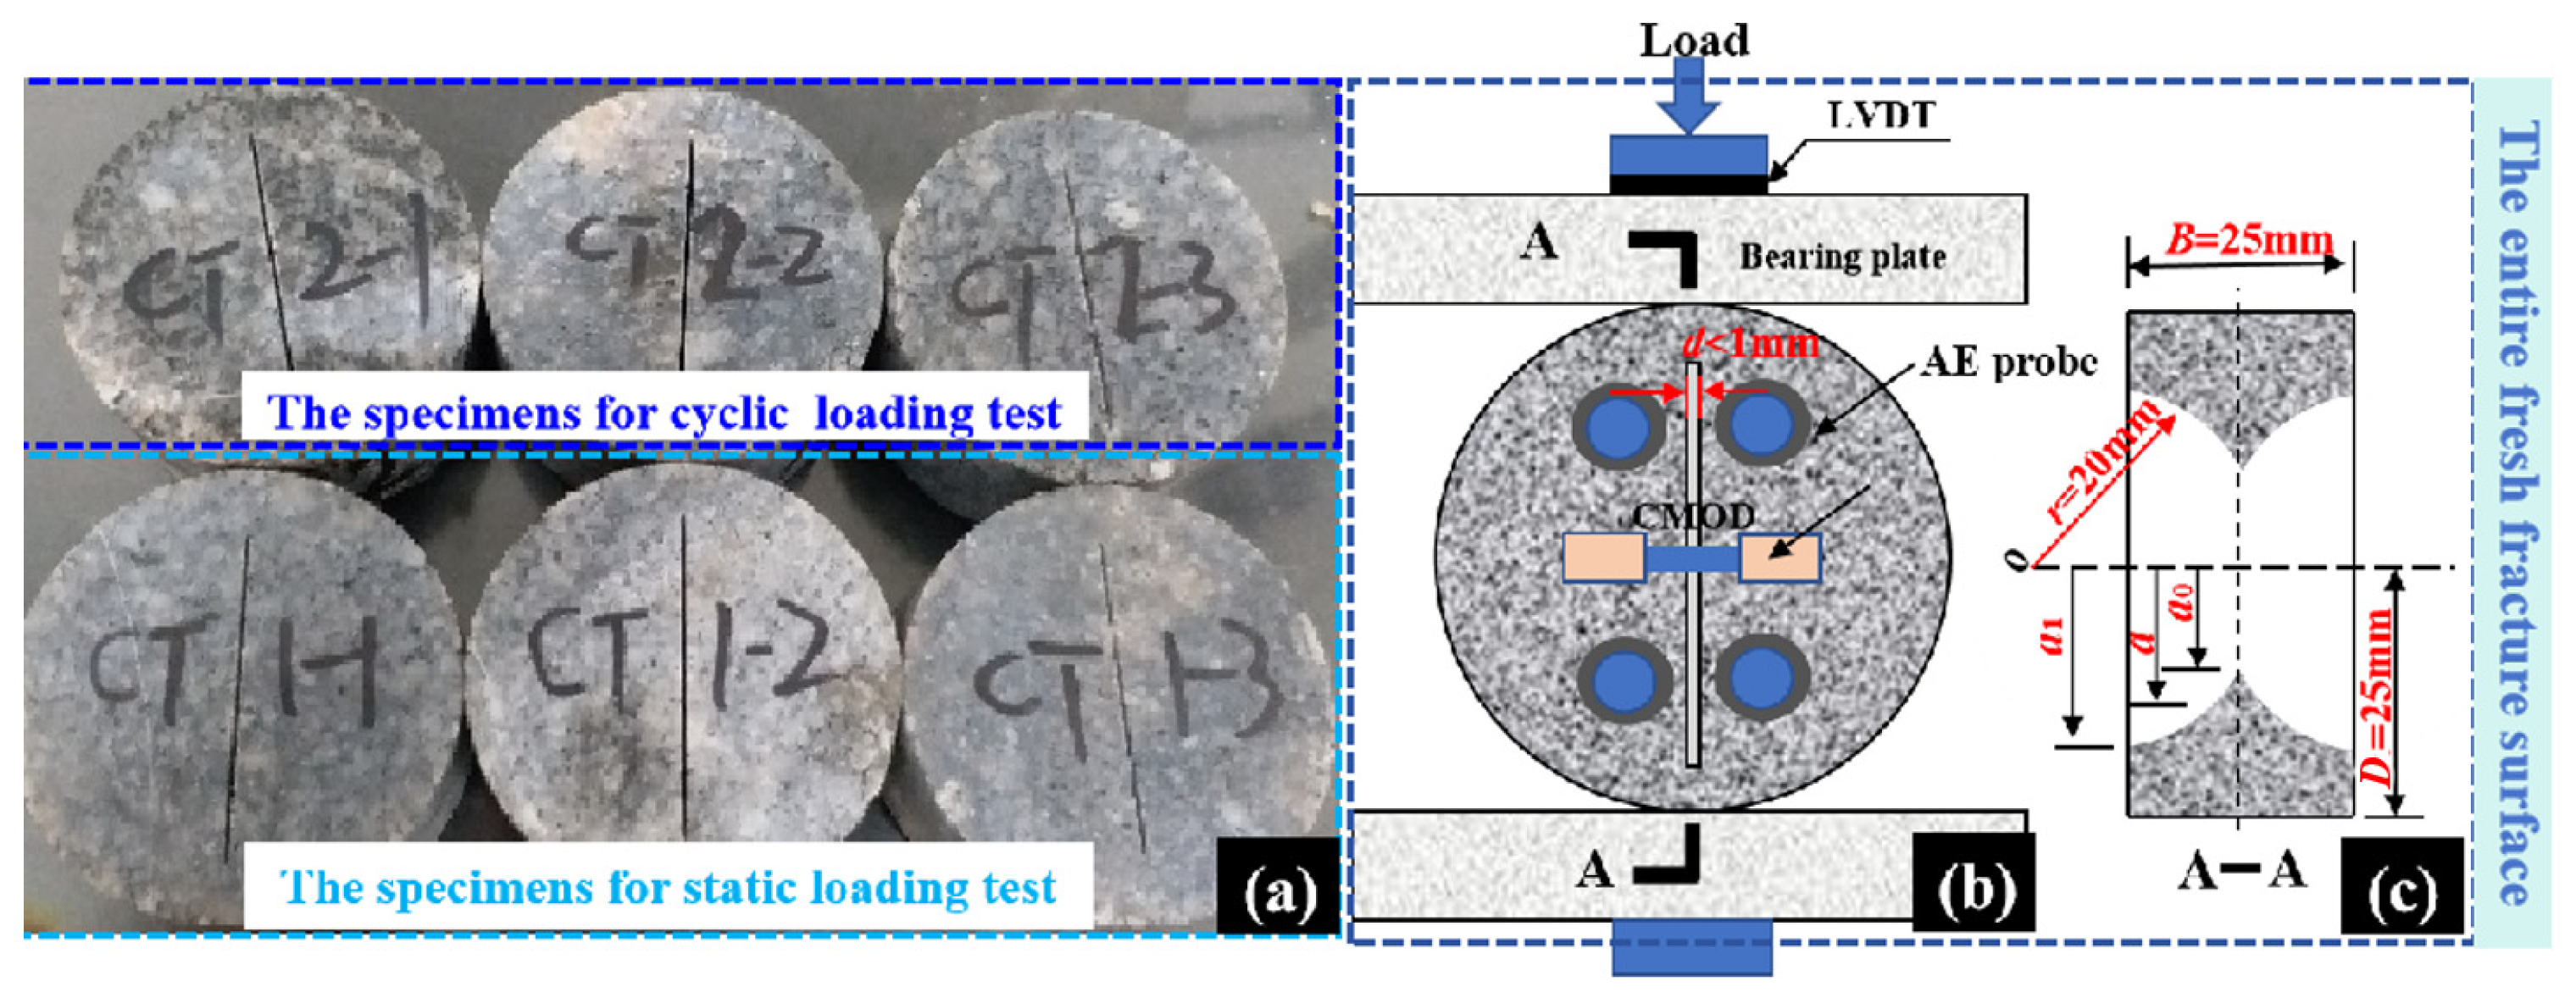
The Beishan deep granite in the test was taken from the BS33 borehole located in the Beishan area for the deep geological disposal repository in PR. China. Granite cores were selected from a range of depths from 553 to 565 m. The granite in this study is a medium- to fine-grained granodiorite with a silver-white color and black spots. The electron microscope scanning results show the surface of the specimen to be relatively intact, but there are some cracks (Figure 1). The uniaxial compressive and uniaxial tensile strength of the rock obtained from the BS33 borehole at the same depth as the CCNBD specimens are 195.767 MPa and 12.875 MPa, respectively. According to the ISRM recommendation, which determined the rock fracture toughness of mode I [28], six specimens with a 25 mm radius (R) and a 25 mm thickness (B) were prepared from Beishan deep granite cores, as shown in Figure 2a. In the CCNBD specimens, a cracked chevron notch was cut using a blade with a diameter of 40 mm. The notch width on the surface of the CCNBD specimens was less than 1 mm, and the notch was positioned at the center of the specimen disk. a, a0, and a1, which are important dimensional parameters for CCNBD samples, represent the critical, initial, and final notched crack lengths, respectively, as shown in Figure 2c. The samples used in this study were collected from borehole BS33 in the Beishan area, a key candidate site for a geological repository for high-level radioactive waste (HLW) in China. The borehole penetrates the Early–Middle Mesozoic granite bedrock of the Beishan rock mass, and the target interval (553–565 m depth) consists of intact medium- to fine-grained granite. This lithology represents one of the principal candidate host rocks for the repository and is characterized by low permeability, high strength, and good integrity. The rock quality designation (RQD) of the sampled core section exceeds 90%, indicating excellent rock mass quality.
Figure 1.
Mineralogical observation and electron microscope scanning of Beishan granite.
Figure 2.
Beishan deep granite CCNBD specimens: (a) specimens, (b) loading diagram, (c) specimen dimension.
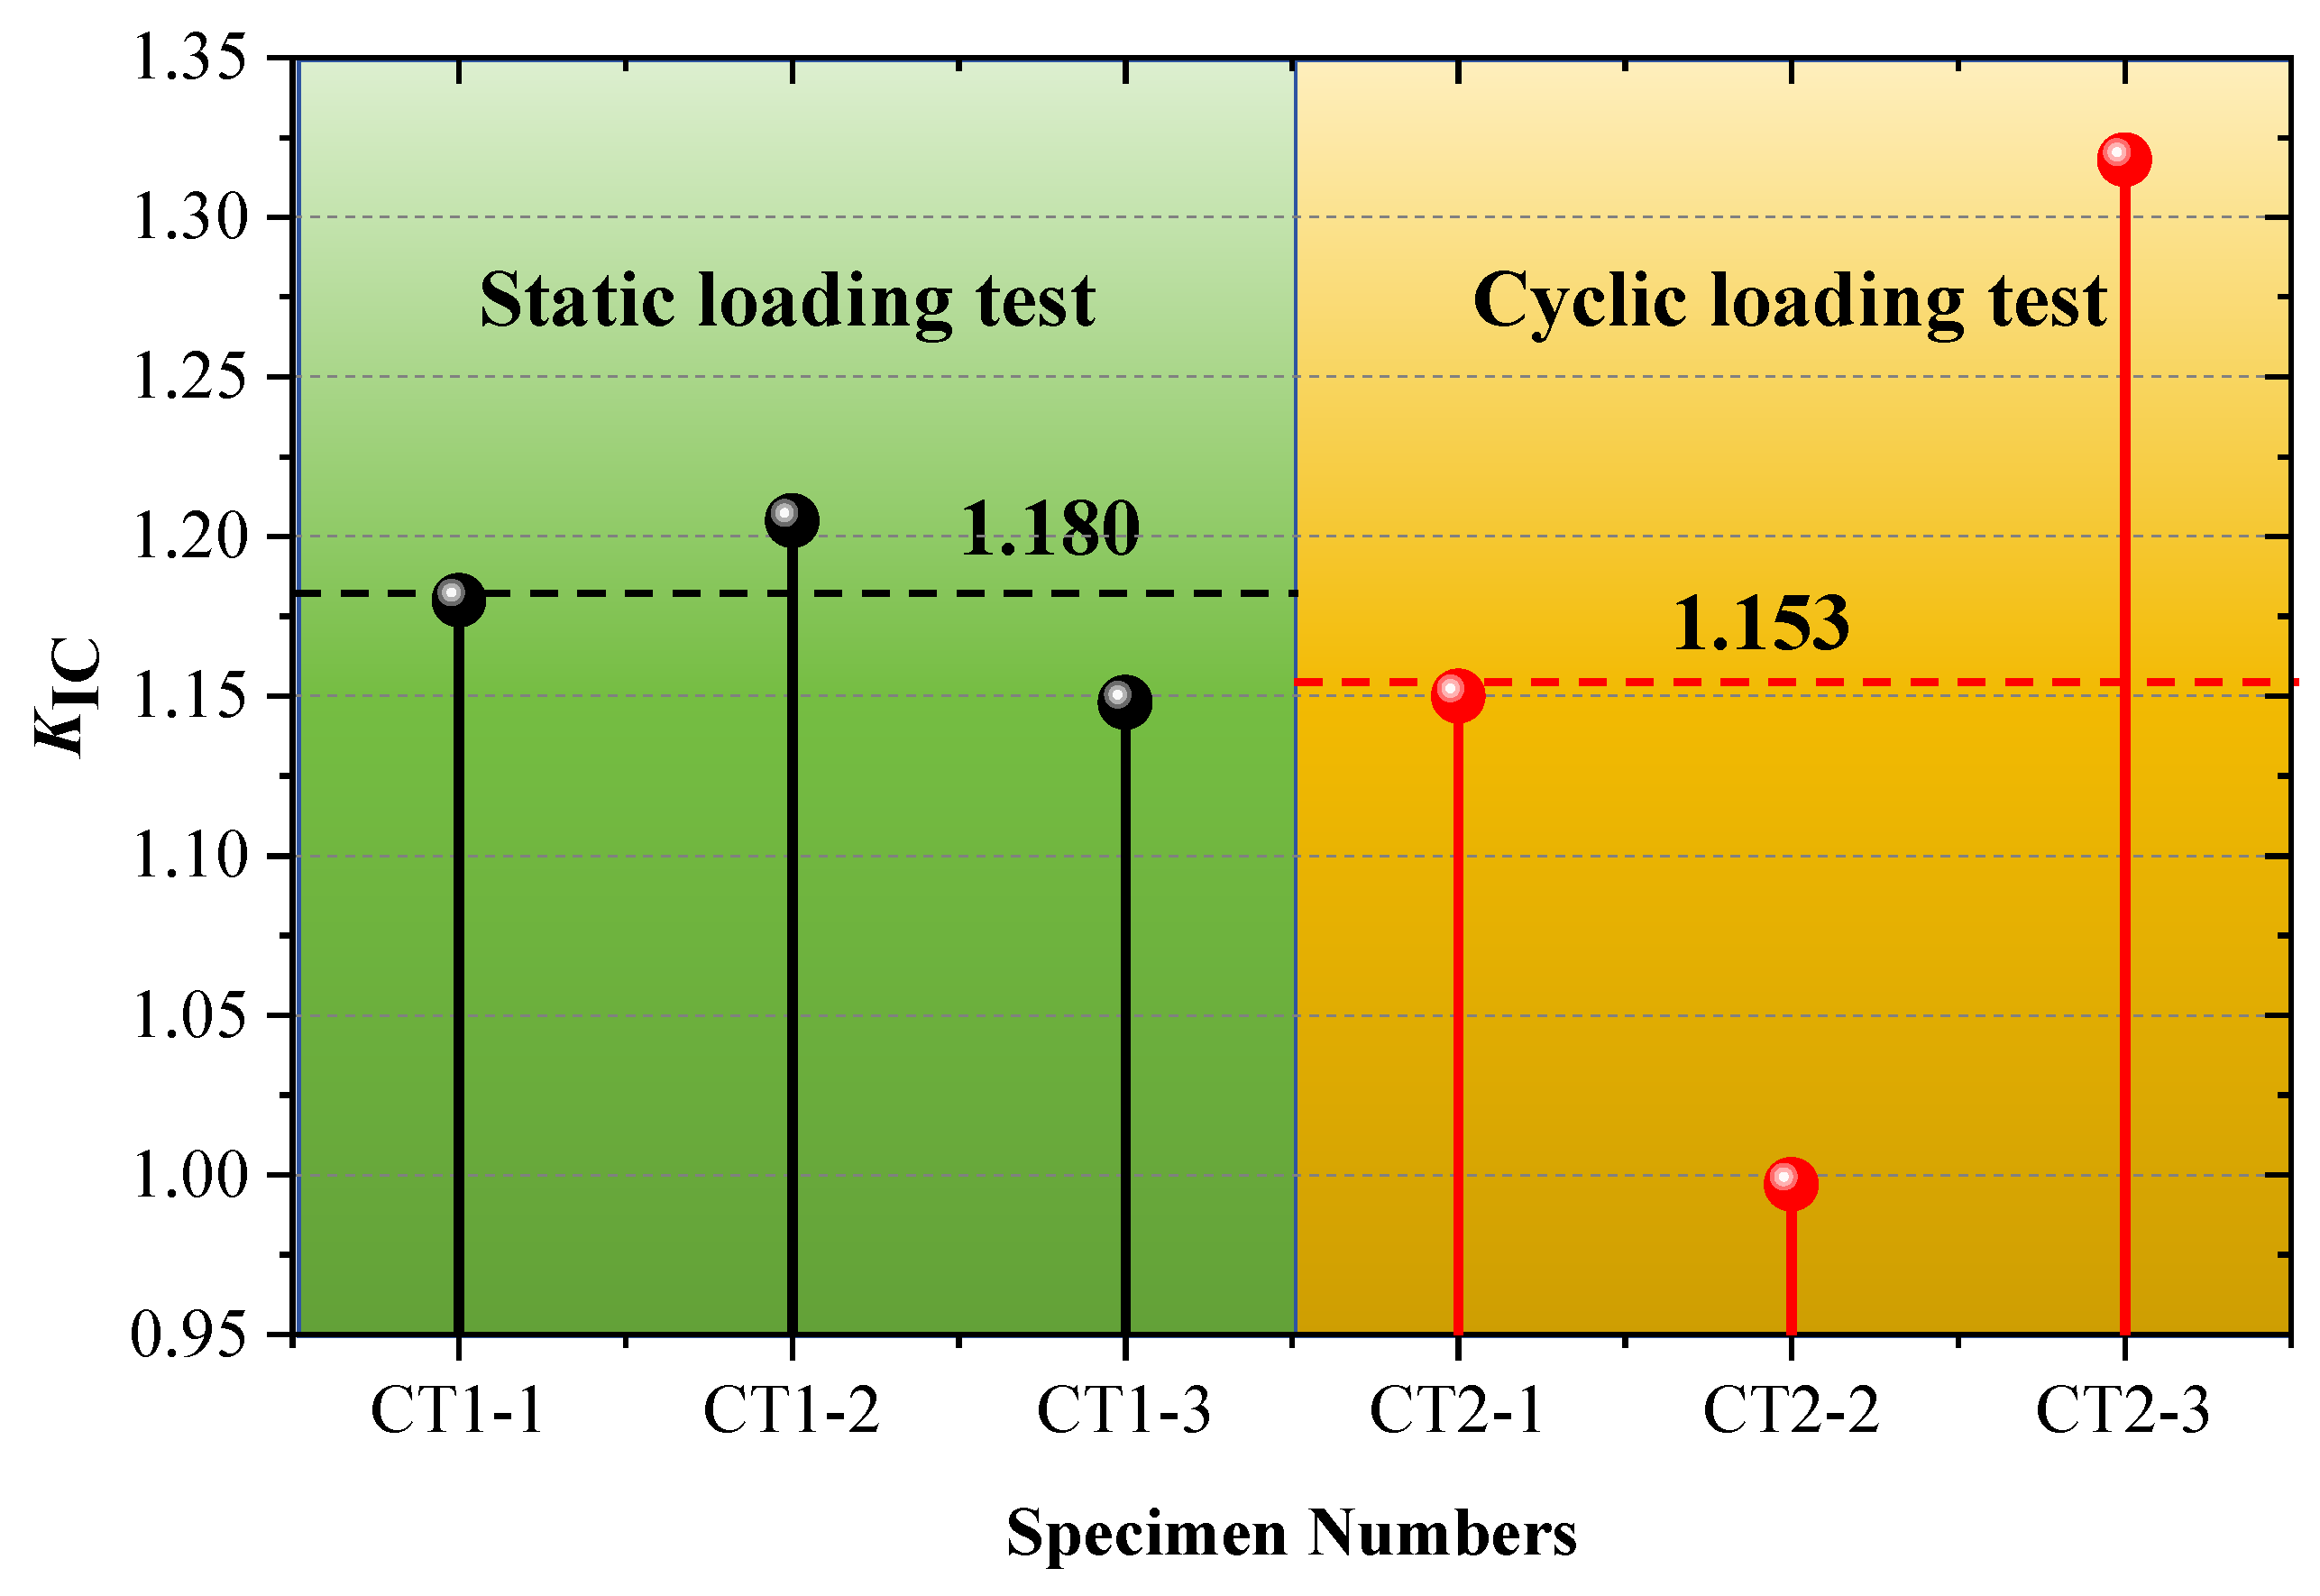
To accurately quantify the mineral composition of the rock, X-ray diffraction (XRD) analysis was performed on homogeneous block samples using a Bruker D8 Advance (Bruker Corporation, Ettlingen, Germany) diffractometer with Cu–Kα radiation. Quantitative full-pattern XRD analysis (Rietveld refinement) indicates that the Beishan granite is primarily composed of quartz (~32%), K-feldspar (~28%), plagioclase (~33%), and a small amount of biotite (~7%). Scanning electron microscopy (SEM) observations (Figure 1(left)) show that microcracks preferentially develop along feldspar grain boundaries, quartz–feldspar interfaces, and biotite cleavage planes, which is fully consistent with the mineral composition identified by XRD and the differences in their mechanical properties. A representative XRD pattern is shown in Figure 1(right) to provide direct data support for the mineralogical interpretation. The dimensionless parameters of the CCNBD specimens are listed in Table 1. Table 1 lists the geometric parameters and fracture toughness values of all specimens. The mean fracture toughness of the static loading group (CT1-1 to CT1-3) is 1.180 MPa·m1/2, with a coefficient of variation of 0.02. In contrast, the cyclic loading group (CT2-1 to CT2-3) shows a mean value of 1.153 MPa·m1/2 and a coefficient of variation of 0.16, indicating that cyclic loading introduces greater variability in mechanical performance.
Table 1.
Geometric parameters and fracture toughness of CCNBD samples.
2.2. Test Device and the Test Procedure
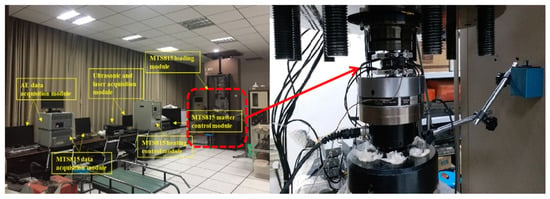
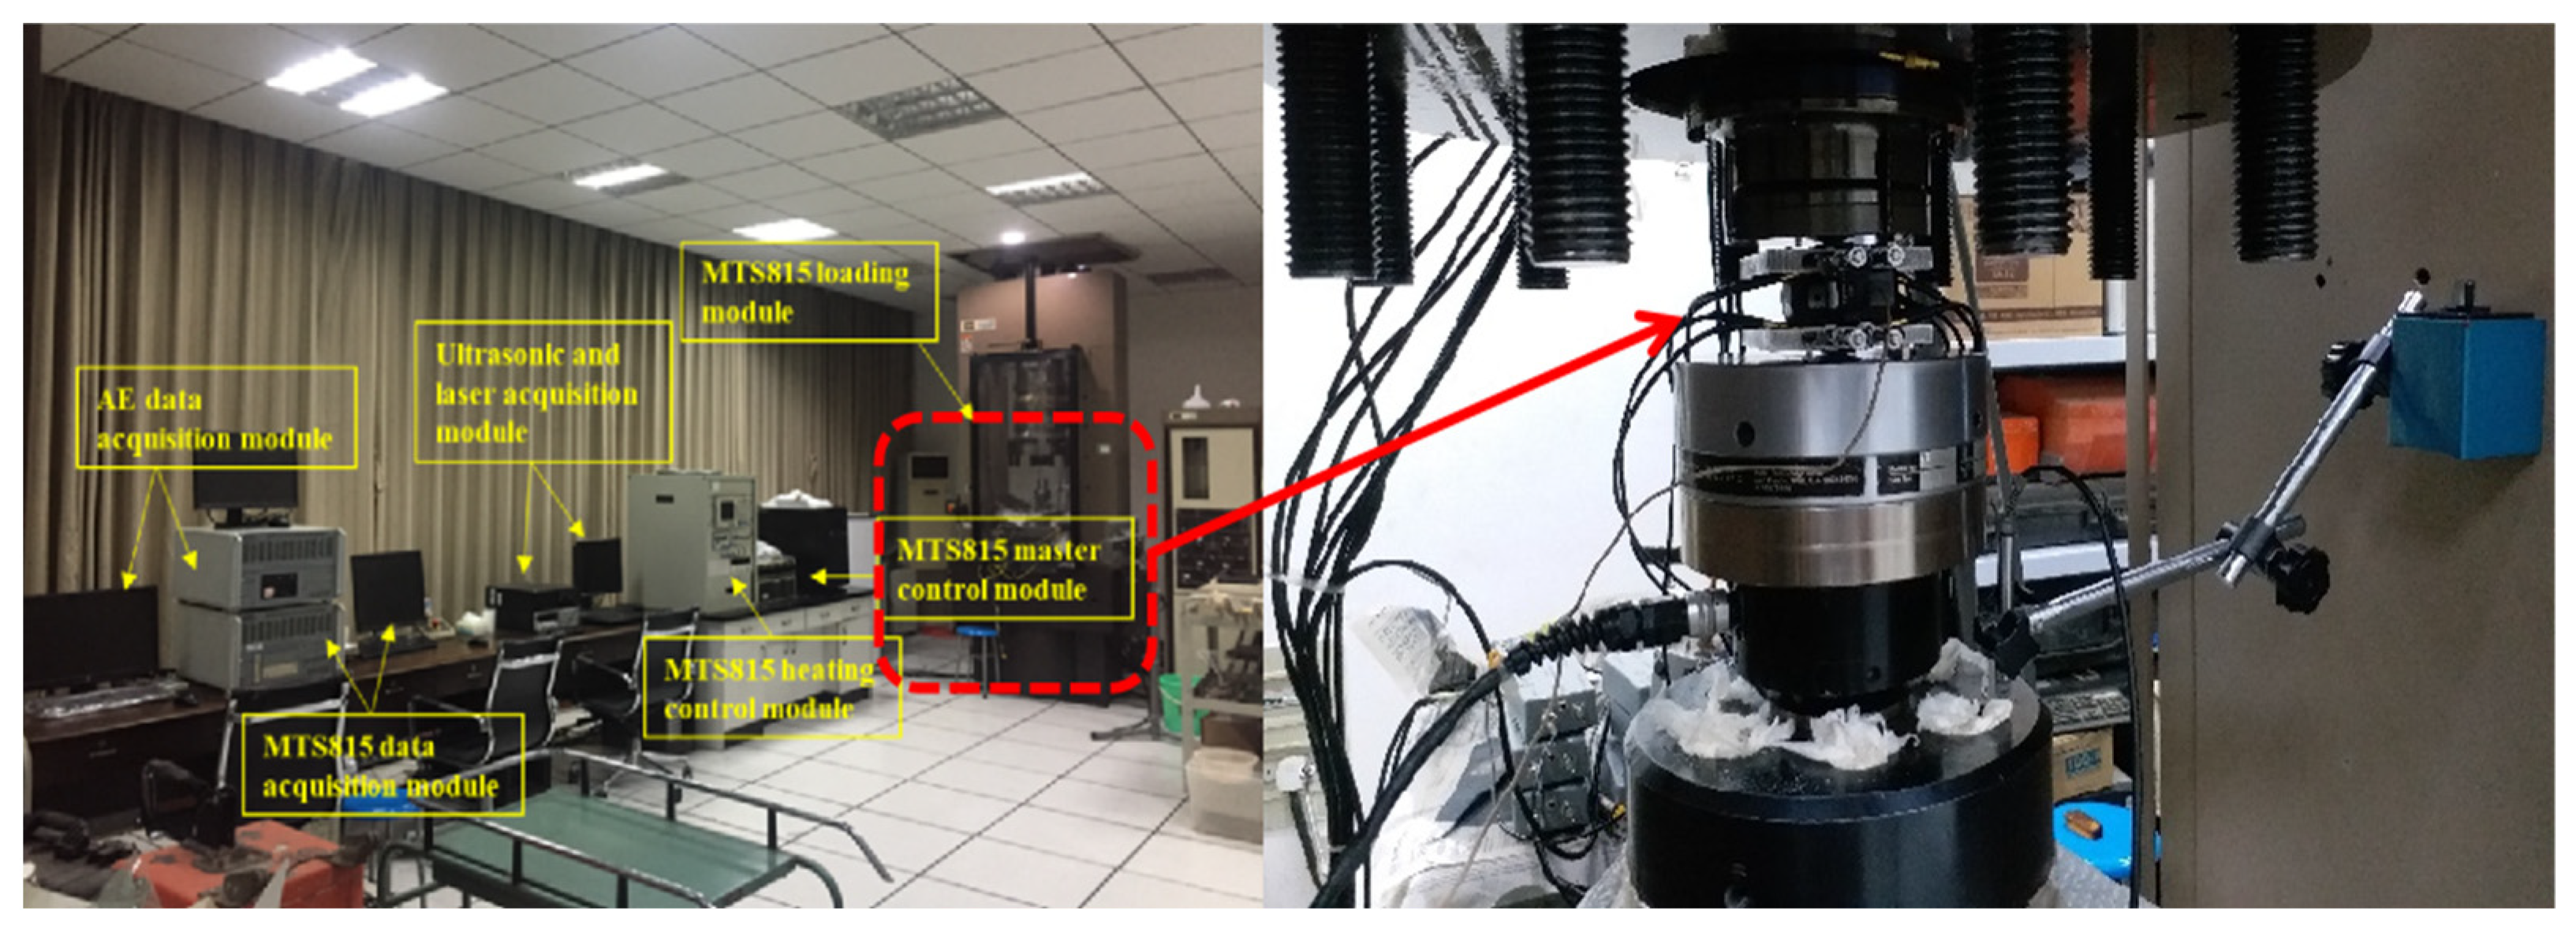
The experimental equipment employed in this Beishan deep granite CCNBD test consists of an MTS815 mechanics testing system (MTS Systems Corporation, Eden Prairie, MN, USA) and a PCI-2 AE 3D monitoring system (Physical Acoustics Corporation, Princeton Junction, NJ, USA). The MTS815 mechanics testing system mainly comprises a loading module, a master control module, and a data acquisition module. The detailed components of the MTS815 testing system are illustrated in Figure 3. The data acquisition module can record real-time testing data, such as axial loading level and rock deformation, during CCNBD testing. The PCI-II AE positioning and monitoring system used in this CCNBD test captures AE spatial distribution, AE hit count, and AE energy count to explore rock fracture evolution under loading. Eight AE probes were symmetrically positioned on both surfaces of the CCNBD specimen, and the arrangement of the AE probes for each surface of the disk specimens is shown in Figure 2b. In the test, the AE probe frequency was set to 200 kHz, and the preamplifier gain and trigger threshold value were set to 40 dB. The crack mouth opening displacement (CMOD) was measured by the clamping piece displacement fixed on both sides of the cracked chevron notches. A linear variable differential transformer sensor was used to monitor vertical displacement (LPD) at the axial loading position.
Figure 3.
MTS815 mechanics testing system and CCNBD specimen loading.
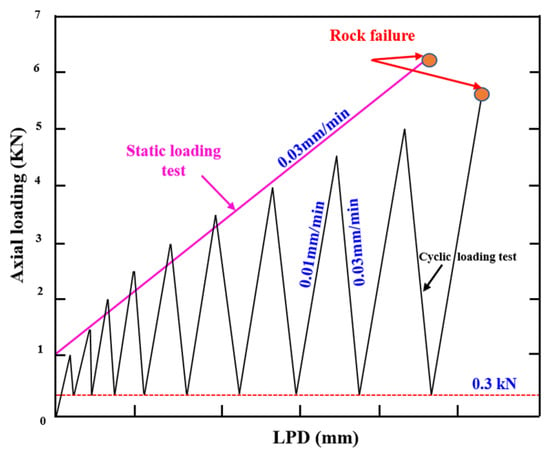
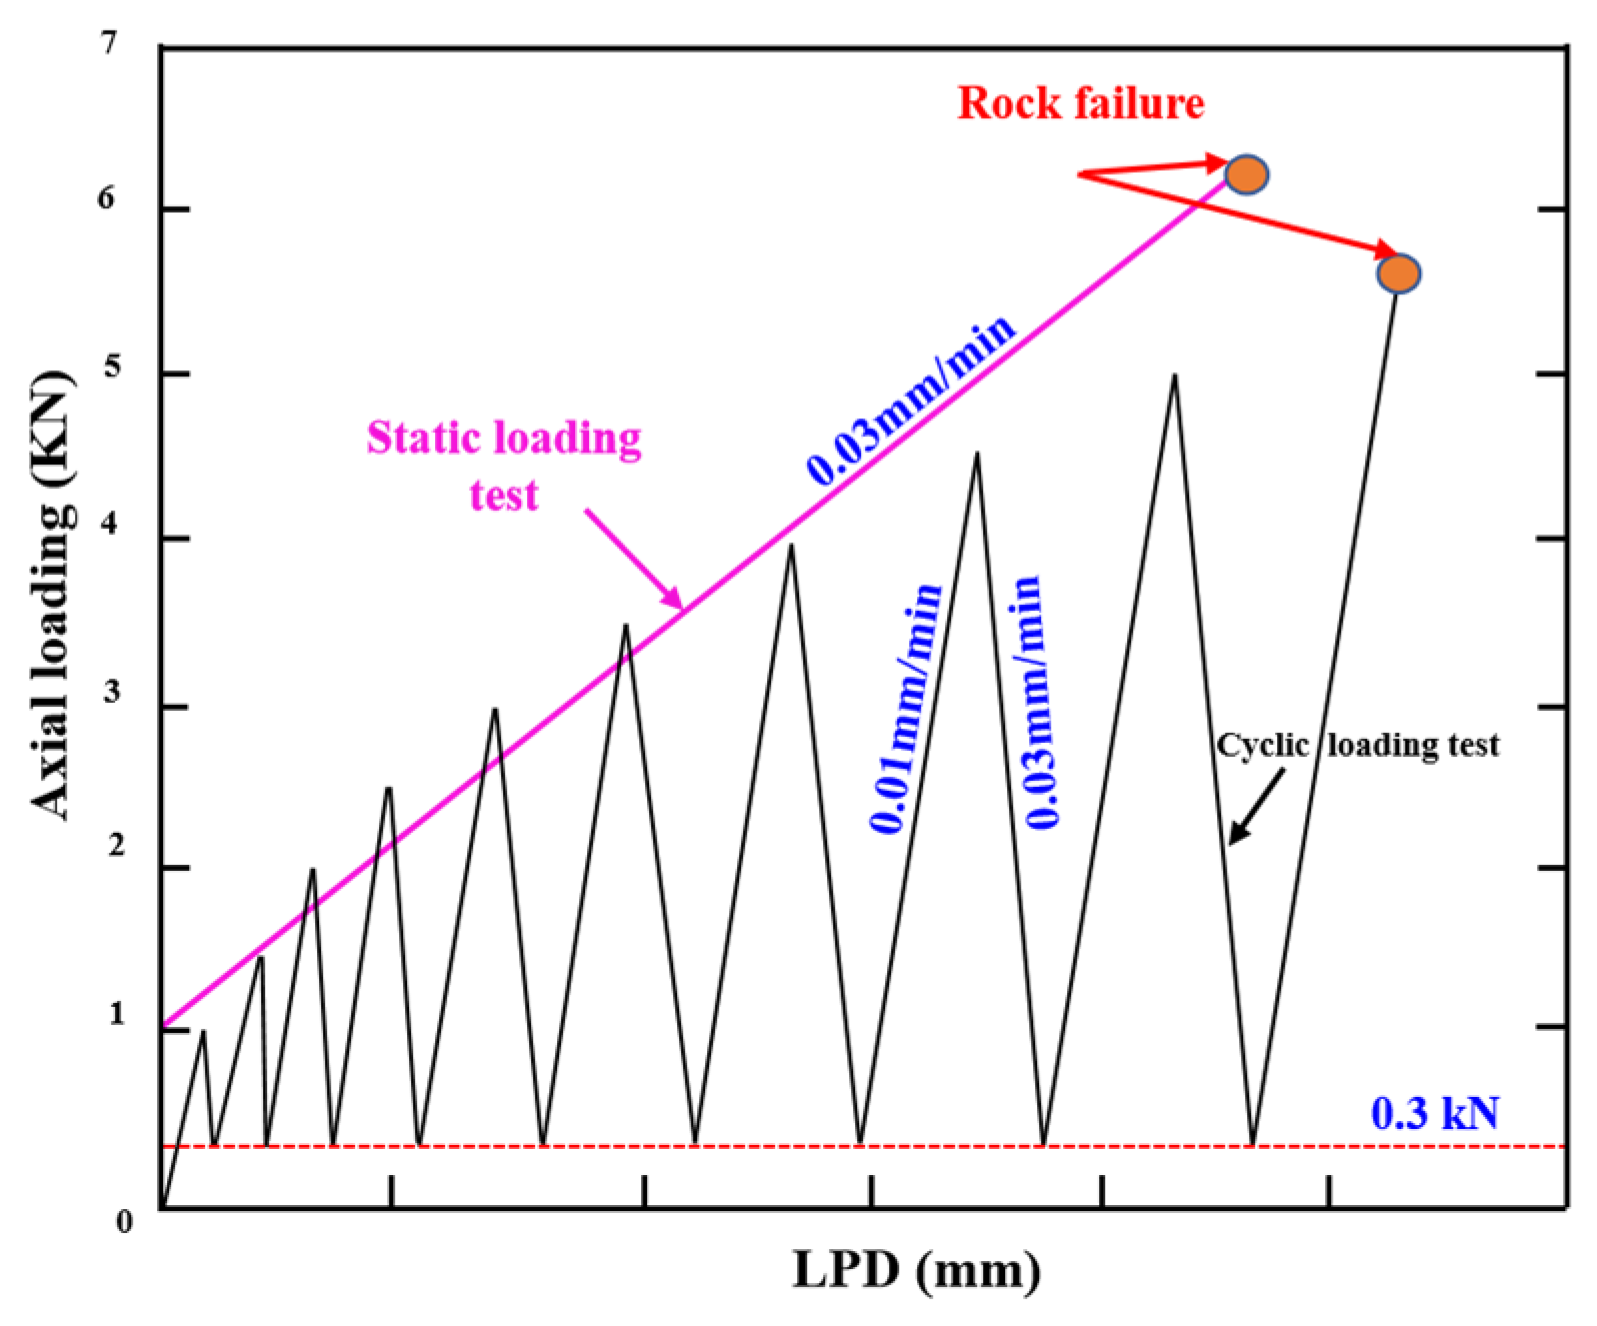
Six CCNBD specimens obtained from the deep layers of the Beishan underground were subjected to static and cyclic loading tests. Three repeatability tests were performed for each testing condition. The specimens named CT1-1, CT1-2, and CT1-3 were used in the static loading test, and the CT2-1, CT2-2, and CT2-3 specimens were used in the cyclic loading test. In the two CCNBD testing conditions, the LPD at the axial loading point was used as the control standard for the axial loading and unloading rates. The axial loading rate for the CCNBD specimens in the static loading was set to 0.03 mm/min. The axial loading and unloading rates of the rock were set to 0.01 mm/min and 0.03 mm/min, respectively, for the cyclic loading test. The two loading paths for the Beishan deep granite CCNBD samples employed in this investigation are presented in Figure 4. When the axial loading level reaches 1.0 KN in the static loading test, the formal loading test for the rock begins, and the testing data are recorded synchronously. The initial axial loading level was also 1.0 kN under the cyclic loading test; the increment loading in the axial direction was 0.5 kN per cycle, and the lower limiting level of axial unloading was 0.3 kN.
Figure 4.
Two loading paths for CCNBD specimens under different testing conditions.
To ensure the initial quality and uniformity of the specimens, the following quality control procedures were implemented: (1) Macroscopic screening: After specimen preparation, all CCNBD specimens were visually inspected and examined using a flashlight for light transmission. Specimens exhibiting visible preexisting cracks, pores, or mineral inclusions were excluded. (2) Ultrasonic preliminary screening: Ultrasonic pulse velocity testing was conducted for initial screening. The longitudinal wave velocity of each specimen was measured, and specimens with velocities significantly lower than the average value of the same batch were discarded to eliminate samples containing major internal defects. (3) Surface integrity verification: Prior to installation on the testing machine, the specimen surfaces were carefully re-examined, with particular attention given to the chevron notch region, to ensure that no new microcracks had been introduced during handling or storage.
2.3. Fracture Toughness Calculation Principle
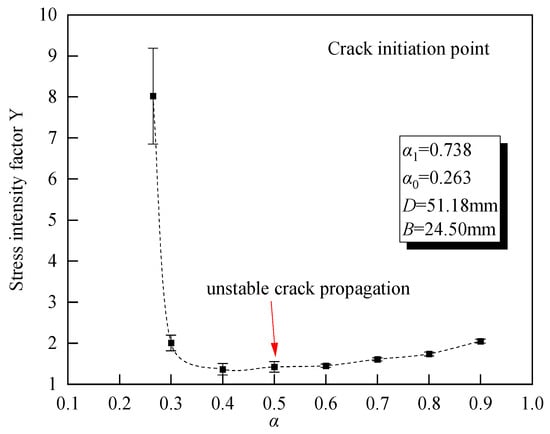
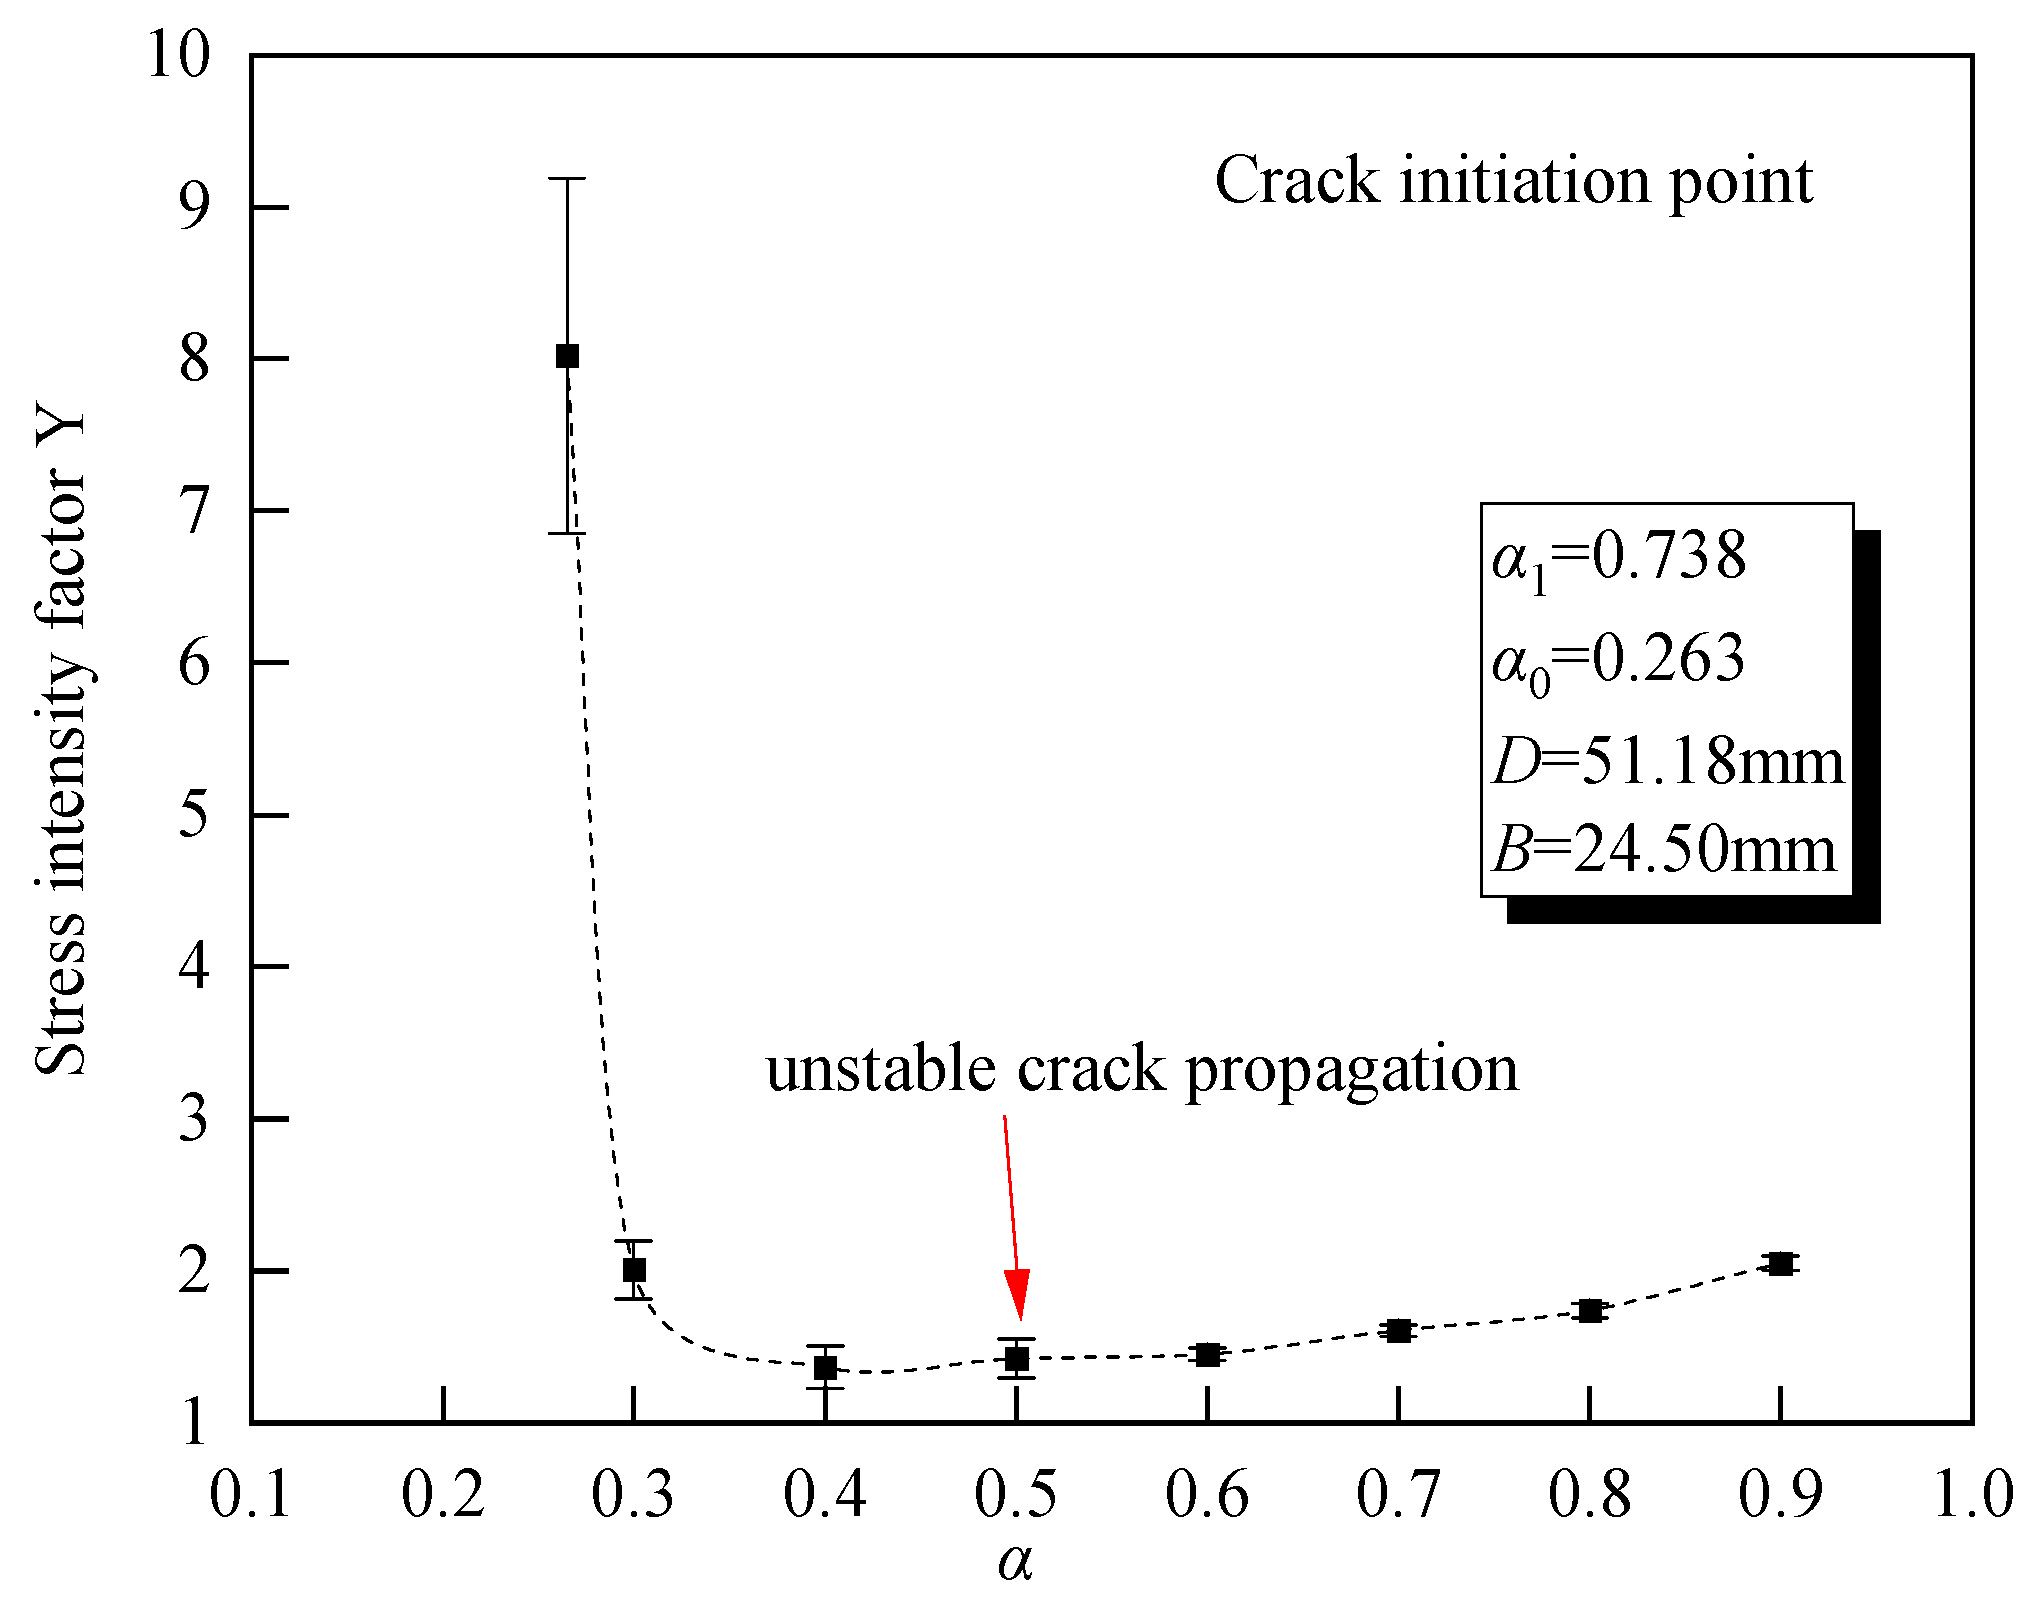
The linear elastic fracture mechanism indicates that when KI < KIC, the prefab crack does not propagate. When KI = KIC, the crack propagates steadily along the prefabricated crack. According to the calculation formulas for the stress intensity factor and the fracture toughness given by Sheity [29], the curve for the change in stress intensity factor Y of the CCNBD sample according to the normalized crack length α was obtained, as shown in Figure 5. Under the constant load, the type I stress intensity factor (Y) of the CCNBD sample first decreases with the expansion of the crack; at this time, KI = KIC needs to be increased by increasing the load so that the crack appearing at the tip of the notch can grow steadily [30]. After a period of development, Y becomes stable and the sample enters a critical state. Y*min is the stress intensity factor value of the rock crack tip according to the calculation formula for the fracture toughness value at this point. The critical state of the CCNBD samples occurs between the initial crack length and the maximum slot length.
Figure 5.
Y-α diagram of CCNBD sample under constant load.
Rock fracture toughness as an important fracture mechanics parameter represents the resistance of rock crack propagation under load and predicts the stability of rock mass in underground engineering. The fracture toughness KIC of rock can be calculated using the ISRM-proposed formula [31]:
where Pmax is the peak strength. The coefficients u and v are the fitting parameters. In this study, Y*min is calculated based on the dimensionless parameters α0, α1, and αB of the CCNBD specimens and the coefficients u and v proposed by Wang [10].
In that study, Wang and co-authors calibrated the coefficients u and v in the equation Y*min = uev through extensive finite element analyses conducted within the standard geometric range of CCNBD specimens. These coefficients are constants independent of specimen geometry. Their values were obtained by fitting a large number of Y* data points derived from finite element simulations to the geometric parameters (α0, α1, and αB). In the present study, the calibrated values of u and v reported by Wang et al. [10] were directly adopted to calculate the fracture toughness KIC.
2.4. Principles of AE and Fracture Roughness
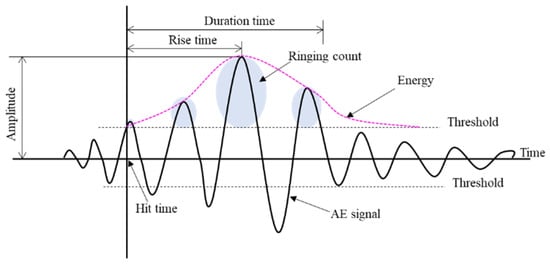
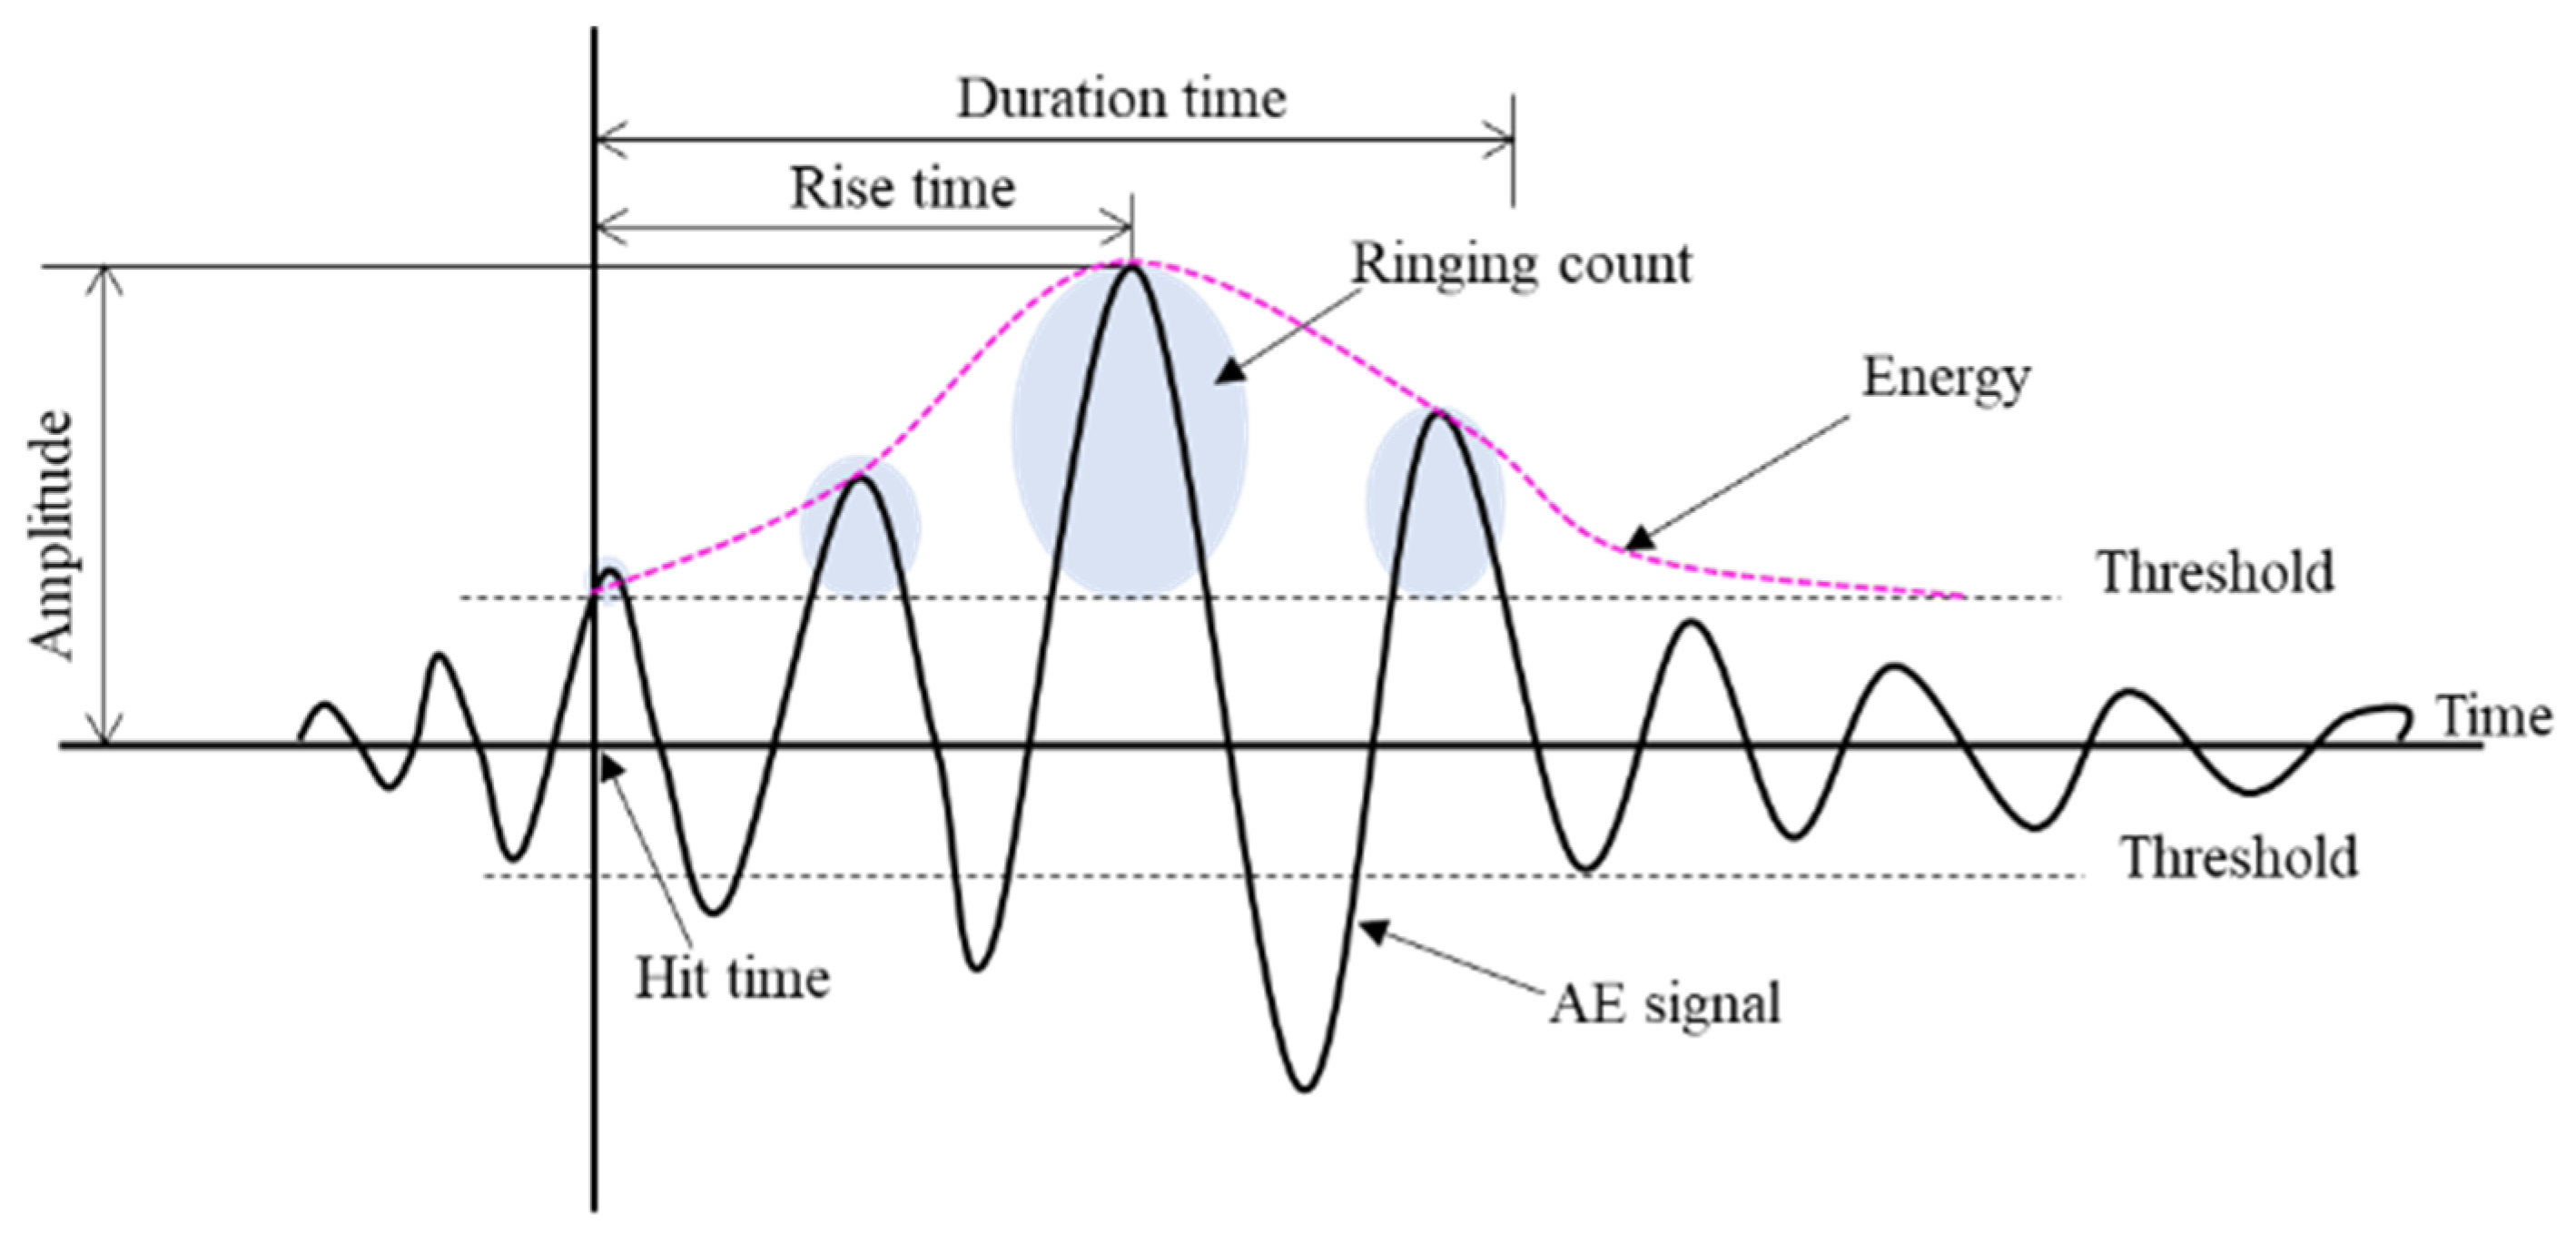
The AE source represents the location of microcracks [32,33], and it is determined by the P-wave arrival time. As shown in Figure 6, an AE waveform includes multiple parameters such as amplitude, duration, and hit count. The AE waveform is correlated with information such as rock stress evolution state, internal structure, and material composition. For example, the area of the waveform signal envelope and threshold voltage enclosed by the graph is defined as the AE energy, which reflects the intensity of the fracture. At present, AE parameter analysis is mainly based on two basic data: AE hits and AE events. When the AE waveform signal strength exceeds the threshold value and is successfully recorded by one of the acquisition channels of the monitoring equipment, the waveform signal is considered to be an AE hit. The appearance of the AE element generates elastic waves that propagate in a spherical shape in the rock medium, which results in an AE signal that is monitored and recorded by one or more acquisition channels in the form of an impact. When the same AE signal is detected by at least four channels and the AE source location can be located, the AE signal is considered to be an event, so the AE time shows the space-time evolution of internal damage.
Figure 6.
Waveform parameters of an AE signal.
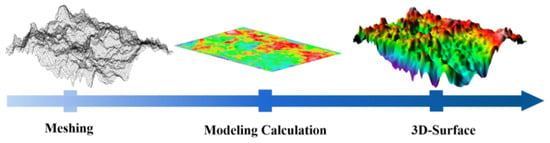
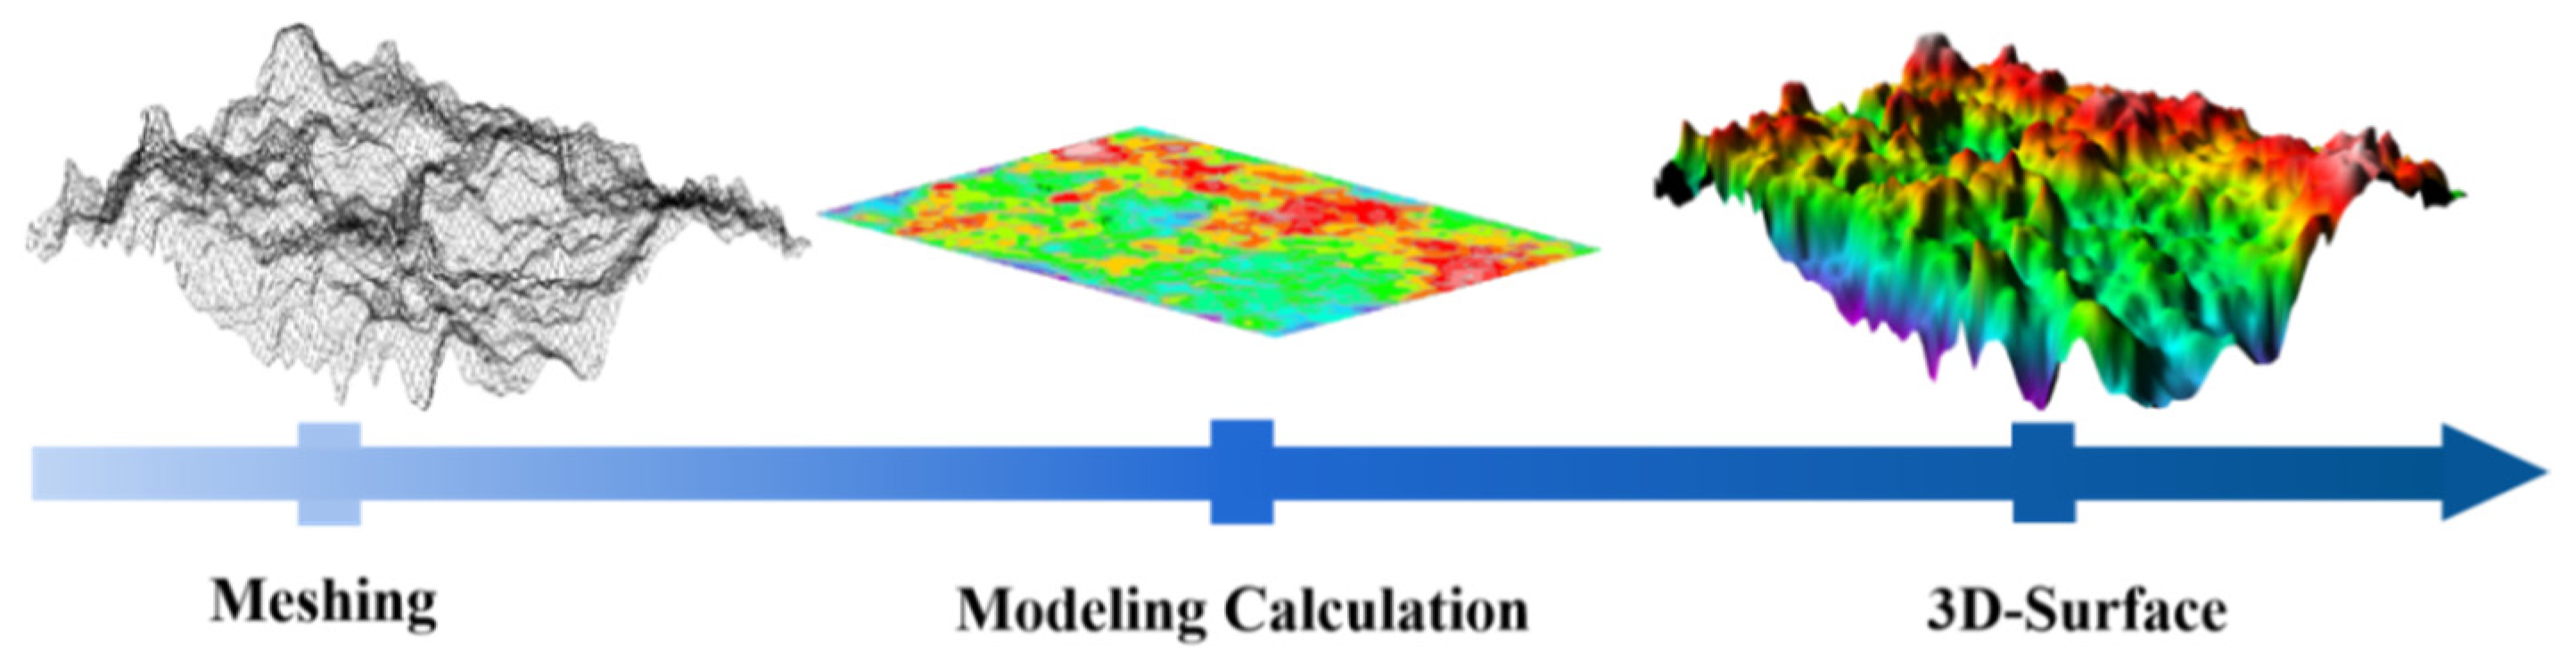
The fracture topography information of rock was recorded by 3D laser scanning [34] (Figure 7): (1) First, the point cloud data obtained by the scanner were imported into the software application to correct the section topography position. (2) Point cloud data were screened and digitally processed (converted to ASCI data), and the data were input into Surfer software(version 23.1.162; Golden Software, LLC, Golden, CO, USA). (3) The spatial auto variance interpolation and the triangle algorithm were used in meshing, processing and fitting the point cloud data group.
Figure 7.
Fracture morphology calculation procedure.
In this study, the 3D laser scanning target was the entire fresh fracture surface generated after the fracture test. This fracture surface corresponds to the surface formed as the crack initiated from the chevron notch and propagated through the specimen until complete failure occurred, which is consistent with the potential fracture path shown in Figure 2. During scanning, the two matching fracture halves of the broken specimen were placed on the scanning platform, and high-density point cloud data were collected over the full field of each fracture surface. This procedure ensured that the complete three-dimensional morphology of the fracture surfaces was captured for subsequent roughness analysis.
3. Test Results
3.1. Static Loading of the Specimen
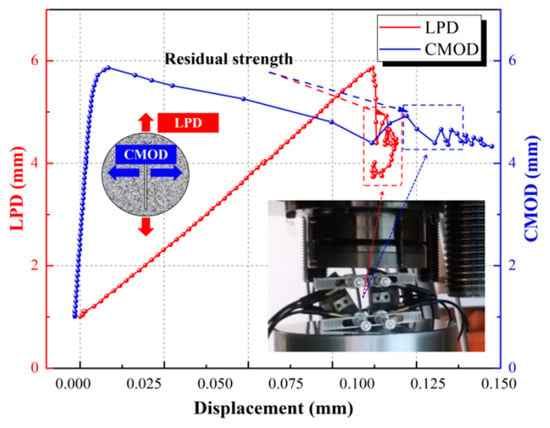
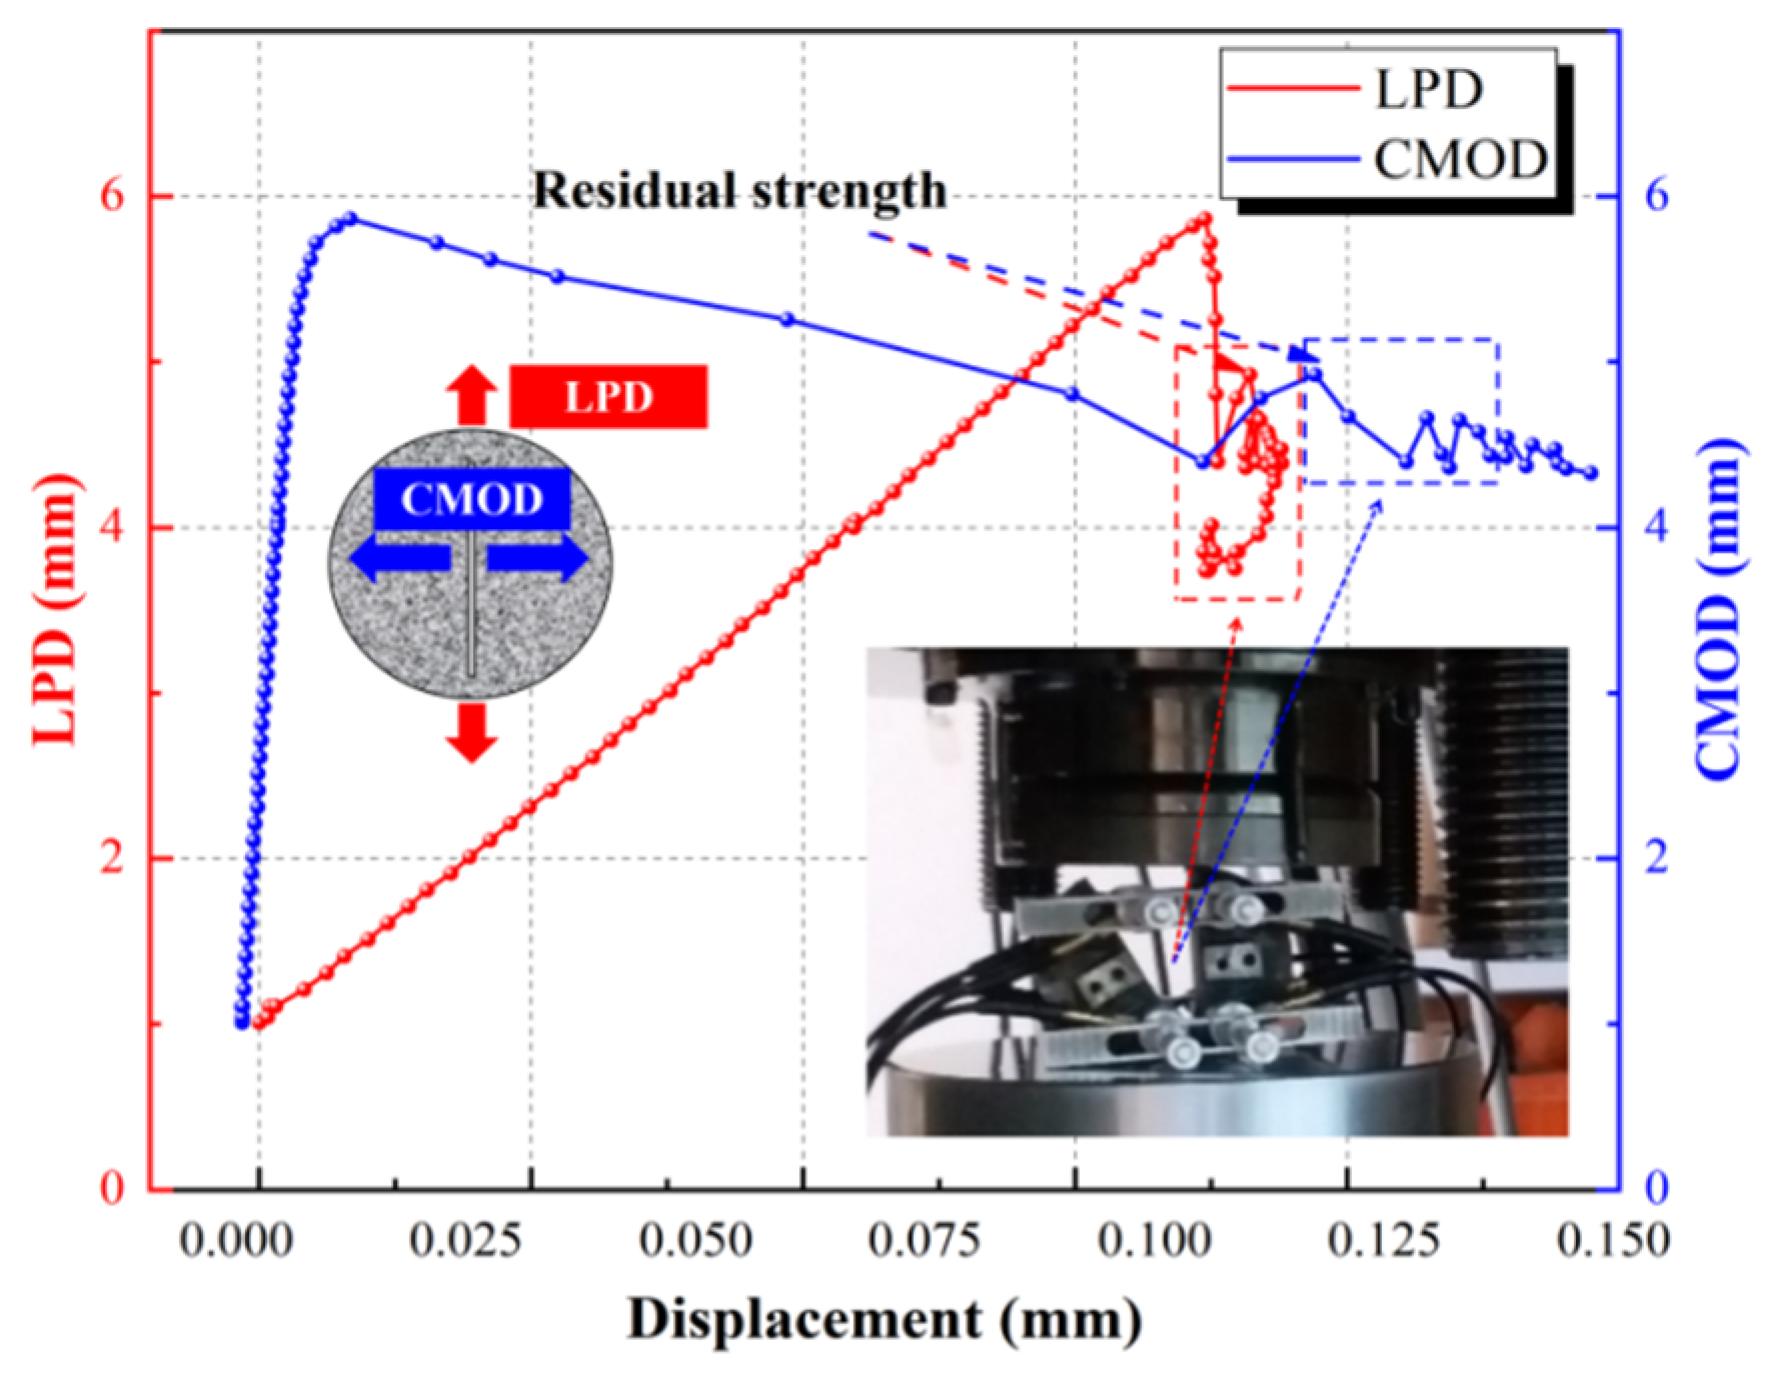
The load–LPD–CMOD curve of the CCNBD specimen (CT1-1) used in the static loading test is presented in Figure 8. LPD exhibits a linear increase as the axial loading increases before the rock peak strength because the CCNBD specimens extracted from the deep underground layer have minimal initial cracks and defects. When the axial loading exceeds its peak point, the axial loading level rapidly drops, but the LPD changes little at this stage. This observation suggests that the Beishan deep granite obtained from a depth range of 553 m to 565 m demonstrates a strong brittle failure feature under the CCNBD static loading condition. Note that in the load–LPD post-peak curve, the CCNBD specimen has residual strength. The residual strength of the CT1-1 specimen is 4.926 kN. The residual strength of the rock is afforded by the half-disk remnants of the destroyed CCNBD specimen stuck between the bearing plates of MTS815, as shown in Figure 8. The general change law of the load–CMOD curve for the CT1-1 specimen in the pre-peak initial stage is similar to that of the loading–LPD curve, and it exhibits a linear growth pattern. However, the load–CMOD curve of the rock demonstrates a nonlinear development pattern in the pre-peak later stages, with an increasing CMOD growth rate as the load increases. This suggests that new cracks rapidly generate, propagate, and penetrate during this pre-peak later loading stage. Compared with the rock deformation located at the peak strength point and the rock complete failure point, the LPD of the CT1-1 specimen increased from 0.198 mm to 0.215 mm, which indicates an increment of 0.017 mm, and the CMOD changed from 0.012 mm to 0.230 mm with an increment of 0.218 mm. This result implies that the degree of horizontal expansion of the CCNBD specimens used in the static loading test is more severe than the axial loading compression degree during rock damage progression.
Figure 8.
Load–LPD–CMOD curve of CT1-1CCNBD specimen.
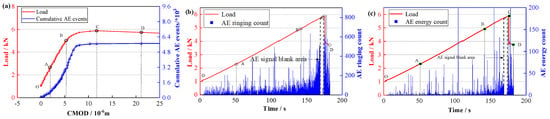
The AE spatial distribution, cumulative AE event, AE energy count, and AE hit count of the CT1-1 specimen under different loading times are depicted in Figure 9. Based on the laws of variation for these AE characteristic parameters as the axial load increases, the damage evolution of the CCNBD specimen in the static loading test is divided into four distinct stages:
Figure 9.
AE parameter curves for CT1-1 specimen: (a) cumulative AE events and AE spatial distribution, (b) AE hit count, (c) AE energy count.
- (1)
- Initial crack compaction stage (OA): AE events begin to occur inside the CCNBD specimen during the earlier rock loading period. AE event distribution is uniform in the disk, with a few AE events concentrated in the upper part. This phenomenon can be attributed to the initial microcrack compaction and the frictional impact between the bearing plate and the disk specimen. Although AE ringing counts inside the rock are a strong indicator at this stage, their corresponding AE energy counts are minimal, as shown in Figure 9c. This indicates that the acoustic emission during this stage mainly originates from the closure of preexisting microcracks and friction between the specimen and the loading platens, resulting in a low energy release rate.
- (2)
- Stable crack growth stage (AB): The load–CMOD curve of the rock exhibits a nearly linear trend during this stage. The cumulative AE events in this stage show a significant increase compared with those in the OA stage. Several AE events are concentrated near the cracked chevron notches region of the disk. Cumulative AE events and cumulative AE energy counts generated at this stage account for 42.6% and 39.3% of their overall cumulative totals, respectively.
- (3)
- Unstable crack growth stage (BC): AE hit count and energy count rapidly increase with the loading at this stage, and AE events inside the rock quickly generate and propagate from the cracked chevron notch toward both the upper and bottom ends of the specimen. Numerous microcracks form on the rock surface and extend to create a macrocrack along the cracked chevron notch of the disk at this stage. The CMOD of the rock demonstrates exponential growth with load increases at this stage, as shown in Figure 9a. Interestingly, near the peak load of the rock, there is an AE signal blank area where both the AE hit count and energy count approach zero. Our core hypothesis is that this signal gap may be associated with the critical transition of the crack from stable propagation to unstable propagation. Immediately before the peak load, the energy density at the crack tip reaches a critical state, leading to rapid and dominant unstable propagation of the main crack. This process occurs within an extremely short time interval, and the mode of energy release may shift from the accumulation of numerous micro-fracturing events to a concentrated release through a small number of macroscopic fracture events. Consequently, within the temporal resolution of AE monitoring, a relatively sparse signal interval may appear. Subsequently, in the post-peak stage, as the specimen splits completely into two halves, further breakage and friction of the remaining fragments generate a large number of AE events again.
- (4)
- Post-peak stage (CD): Due to the compression effect of the axial loading on the rock, the elastic strain energy that accumulates is swiftly released by elastic waves within a short time. This causes the load level of the rock to rapidly decrease at this stage, while higher AE events continue to occur inside the rock, as depicted in Figure 9a. A macrocrack has completely propagated across the disk specimen and resulted in the complete splitting and destruction of the rock at this stage.
Based on the load–CMOD curve and the variation laws for the AE characteristic parameters of the Beishan deep granite CCNBD specimens, the rock damage process in the static loading condition enters the AB and BC stages at almost 39% and 84% of peak strength, respectively. AE spatial distribution indicates that the outline of the macrocrack face is initially formed in the AB stage, and it is accompanied by significant microcrack generation. Although the BC stage has a relatively short duration, it exhibits the most prominent AE events compared to the other damage stages. In addition, CMOD increases during the BC stage and highlights its significance as a crucial stage for rock failure and crack development. Notably, under static loading conditions, the peak strength of the CCNBD specimens used in the static loading test was approximately 6 kN. The tensile failure occurred in the Beishan deep granite CCNBD specimens under static loading conditions.
3.2. Cyclic Loading of CCNBD Specimen
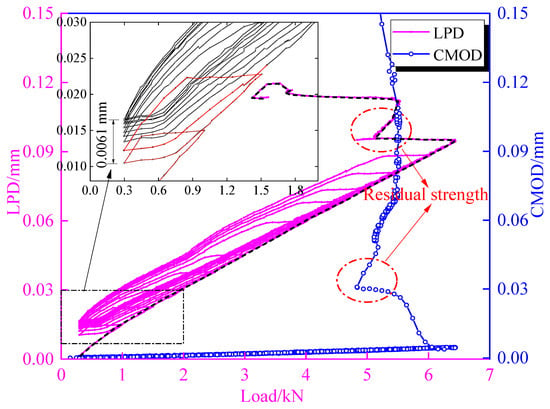
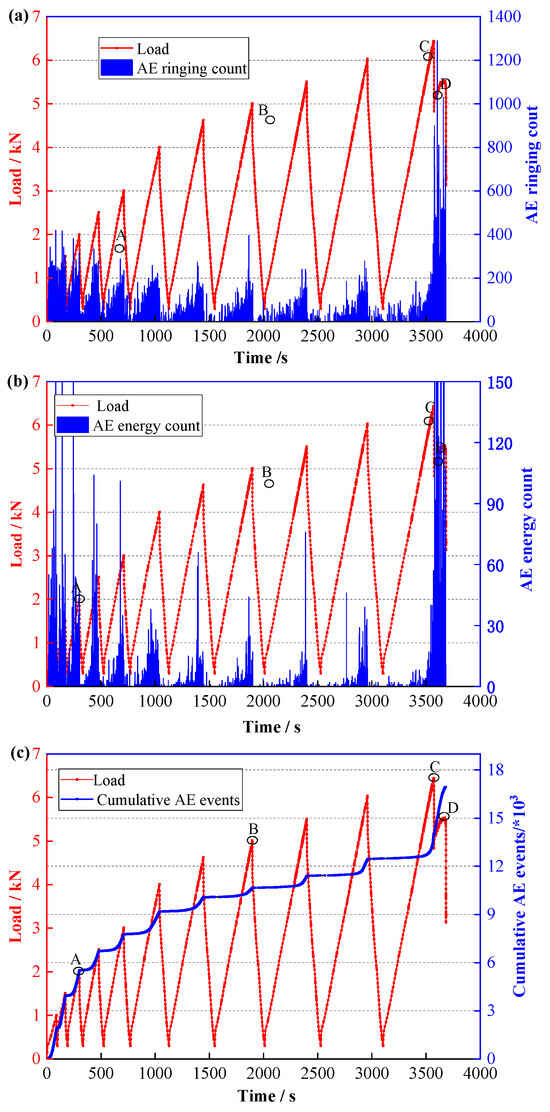
The load–LPD–CMOD curve for the CT2-3 specimen is shown in Figure 10. The overall change trend of the LPD for the Beishan deep granite CCNBD sample under cyclic loading conditions is similar to that observed under static loading. The load–LPD curve for the rock in the cyclic loading condition also exhibits a linear increase with the increase in axial load before reaching peak strength. However, after the peak strength is exceeded, the load level rapidly drops with minimal change to the LPD value. This indicates that the Beishan deep granite CCNBD specimen demonstrates significant brittle failure under cyclic loading. In the load–LPD curve, the specimen used during the cyclic loading also has a residual strength, as shown in Figure 10. The load–LPD curve develops horizontally during the early unloading period, i.e., the axial load decreases, whereas the LPD value remains relatively unchanged. Subsequently, as the axial unloading continues, the load–LPD curve begins to decline, and the rate of decline in the curve is equivalent to the rate of its rise during the rock loading stage of the same cycle. The LPD value of the rock corresponding to the lower limit of axial unloading gradually increases with the number of cyclic loads. The reloading curve is across from the previous unloading point, which indicates that the CCNBD specimen under cyclic loading tests exhibits an obvious path memory feature. The rock specimen undergoes irreversible plastic deformation during each cyclic loading process. The total amount of plastic deformation is determined by the difference between the LPD value corresponding to the lower limiting level of axial unloading at the last and first cycles. Consequently, the total plastic deformation of the CT2-3 CCNBD specimen is 0.0061 mm, which accounts for only 5.1% of the overall deformation during the entire testing. The CMOD value of the CT2-3 specimen before peak strength is small, and it remains unchanged with a cycle increase. This indicates that cyclic loading has a negligible impact on the CMOD value. However, during the pre-peak later stage, the CMOD value displays a trend of nonlinear increase that is consistent with the change feature observed for the rock under the static loading condition.
Figure 10.
Load–LPD–CMOD curve of CT2-3 CCNBD specimen.
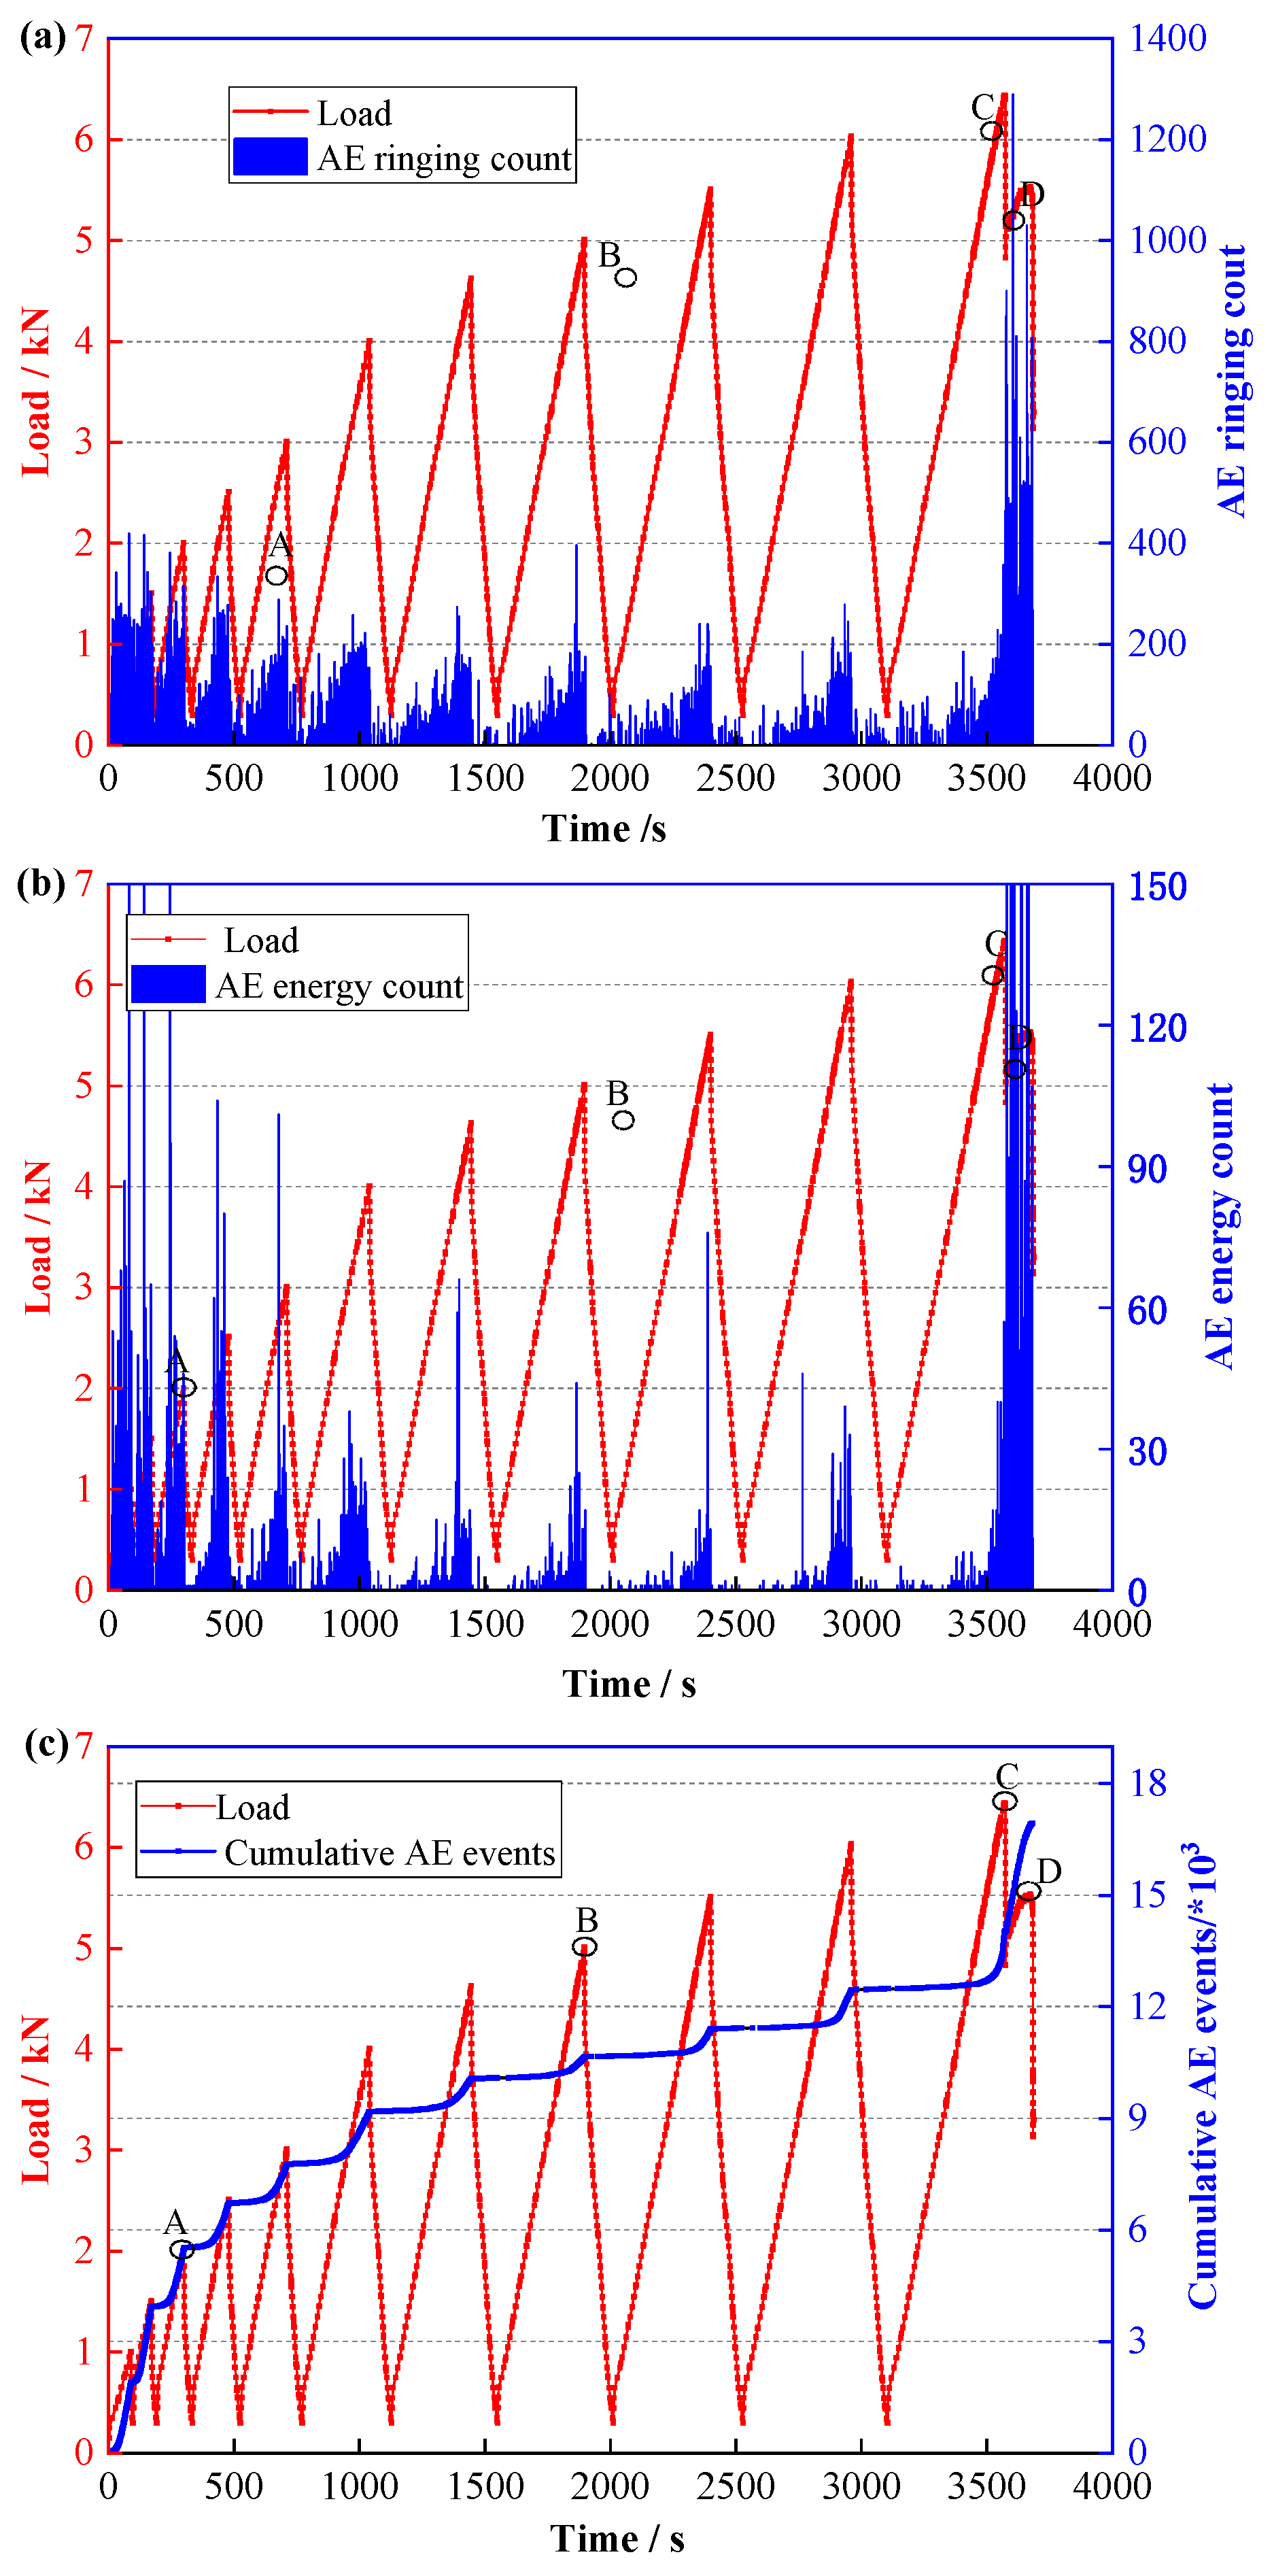
The curves between the loading path and AE characteristic parameters of the CCNBD specimen (CT2-3) used in the cyclic loading are presented in Figure 11. It was observed that the AE hit count of the disk was significant during the first two and three cycles. Obvious AE events occurred before the maximum load level of the previous cycle was reached, which indicates that a prominent Felicity effect was generated in this CCNBD cyclic loading test. In each loading cycle, AE ringing counts and AE energy counts gradually increase as the reloading level increases, but they do not appear during the unloading period. This is because the unloading impact on the rock does not induce any damage inside the rock. During the entire loading process, the overall change trend in the AE hit count and energy count is an initial decrease followed by an increase over time. AE energy counts in the initial two and three loading cycles are significant, which indicates that numerous microcracks inside the rock begin to form under low stress and simultaneously release higher strain energy. This is significantly different from the variable trend of the AE energy count for the rock under the static loading test. When the axial loading reaches peak strength, the AE hit count and energy count rise suddenly. At this time, macrocracks inside the rock rapidly propagate within an extremely short time and result in rock failure and an abundant release of energy. After the peak strength is reached, numerous AE events with higher energy occur because the half-disk remnants of the destroyed CCNBD specimens continue to bear the axial loading, causing the cracks to persistently develop and propagate after rock failure. In Figure 11c, the cumulative AE event curve rapidly increases during the rock reloading period but remains constant at the unloading stage, and the growth rate of the cumulative AE event curve gradually decreases with increasing cyclic times.
Figure 11.
Relationship curves between loading path and AE characteristic parameters of CT2-3 specimen: (a) AE hit count, (b) AE energy count, (c) cumulative AE events.
3.3. Size Evolution of FPZ
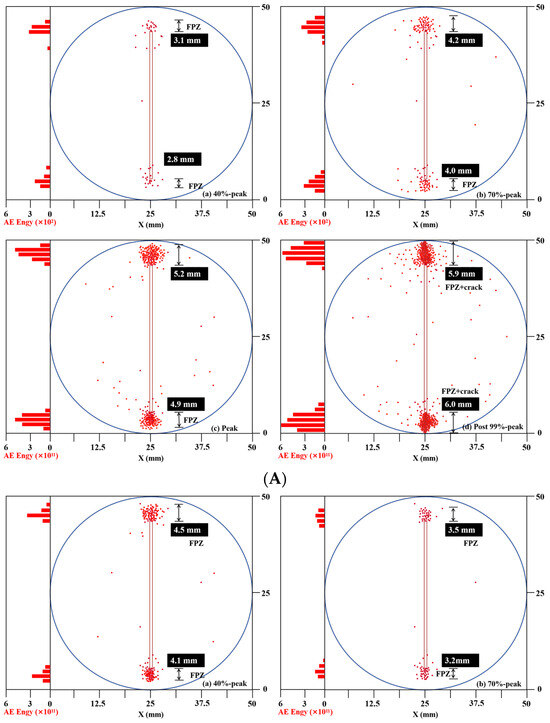
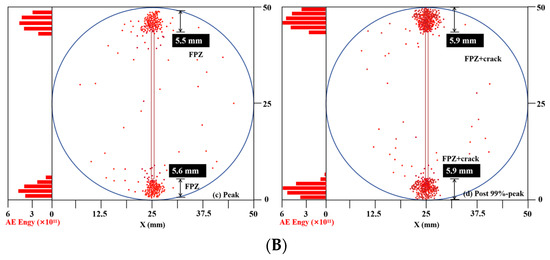
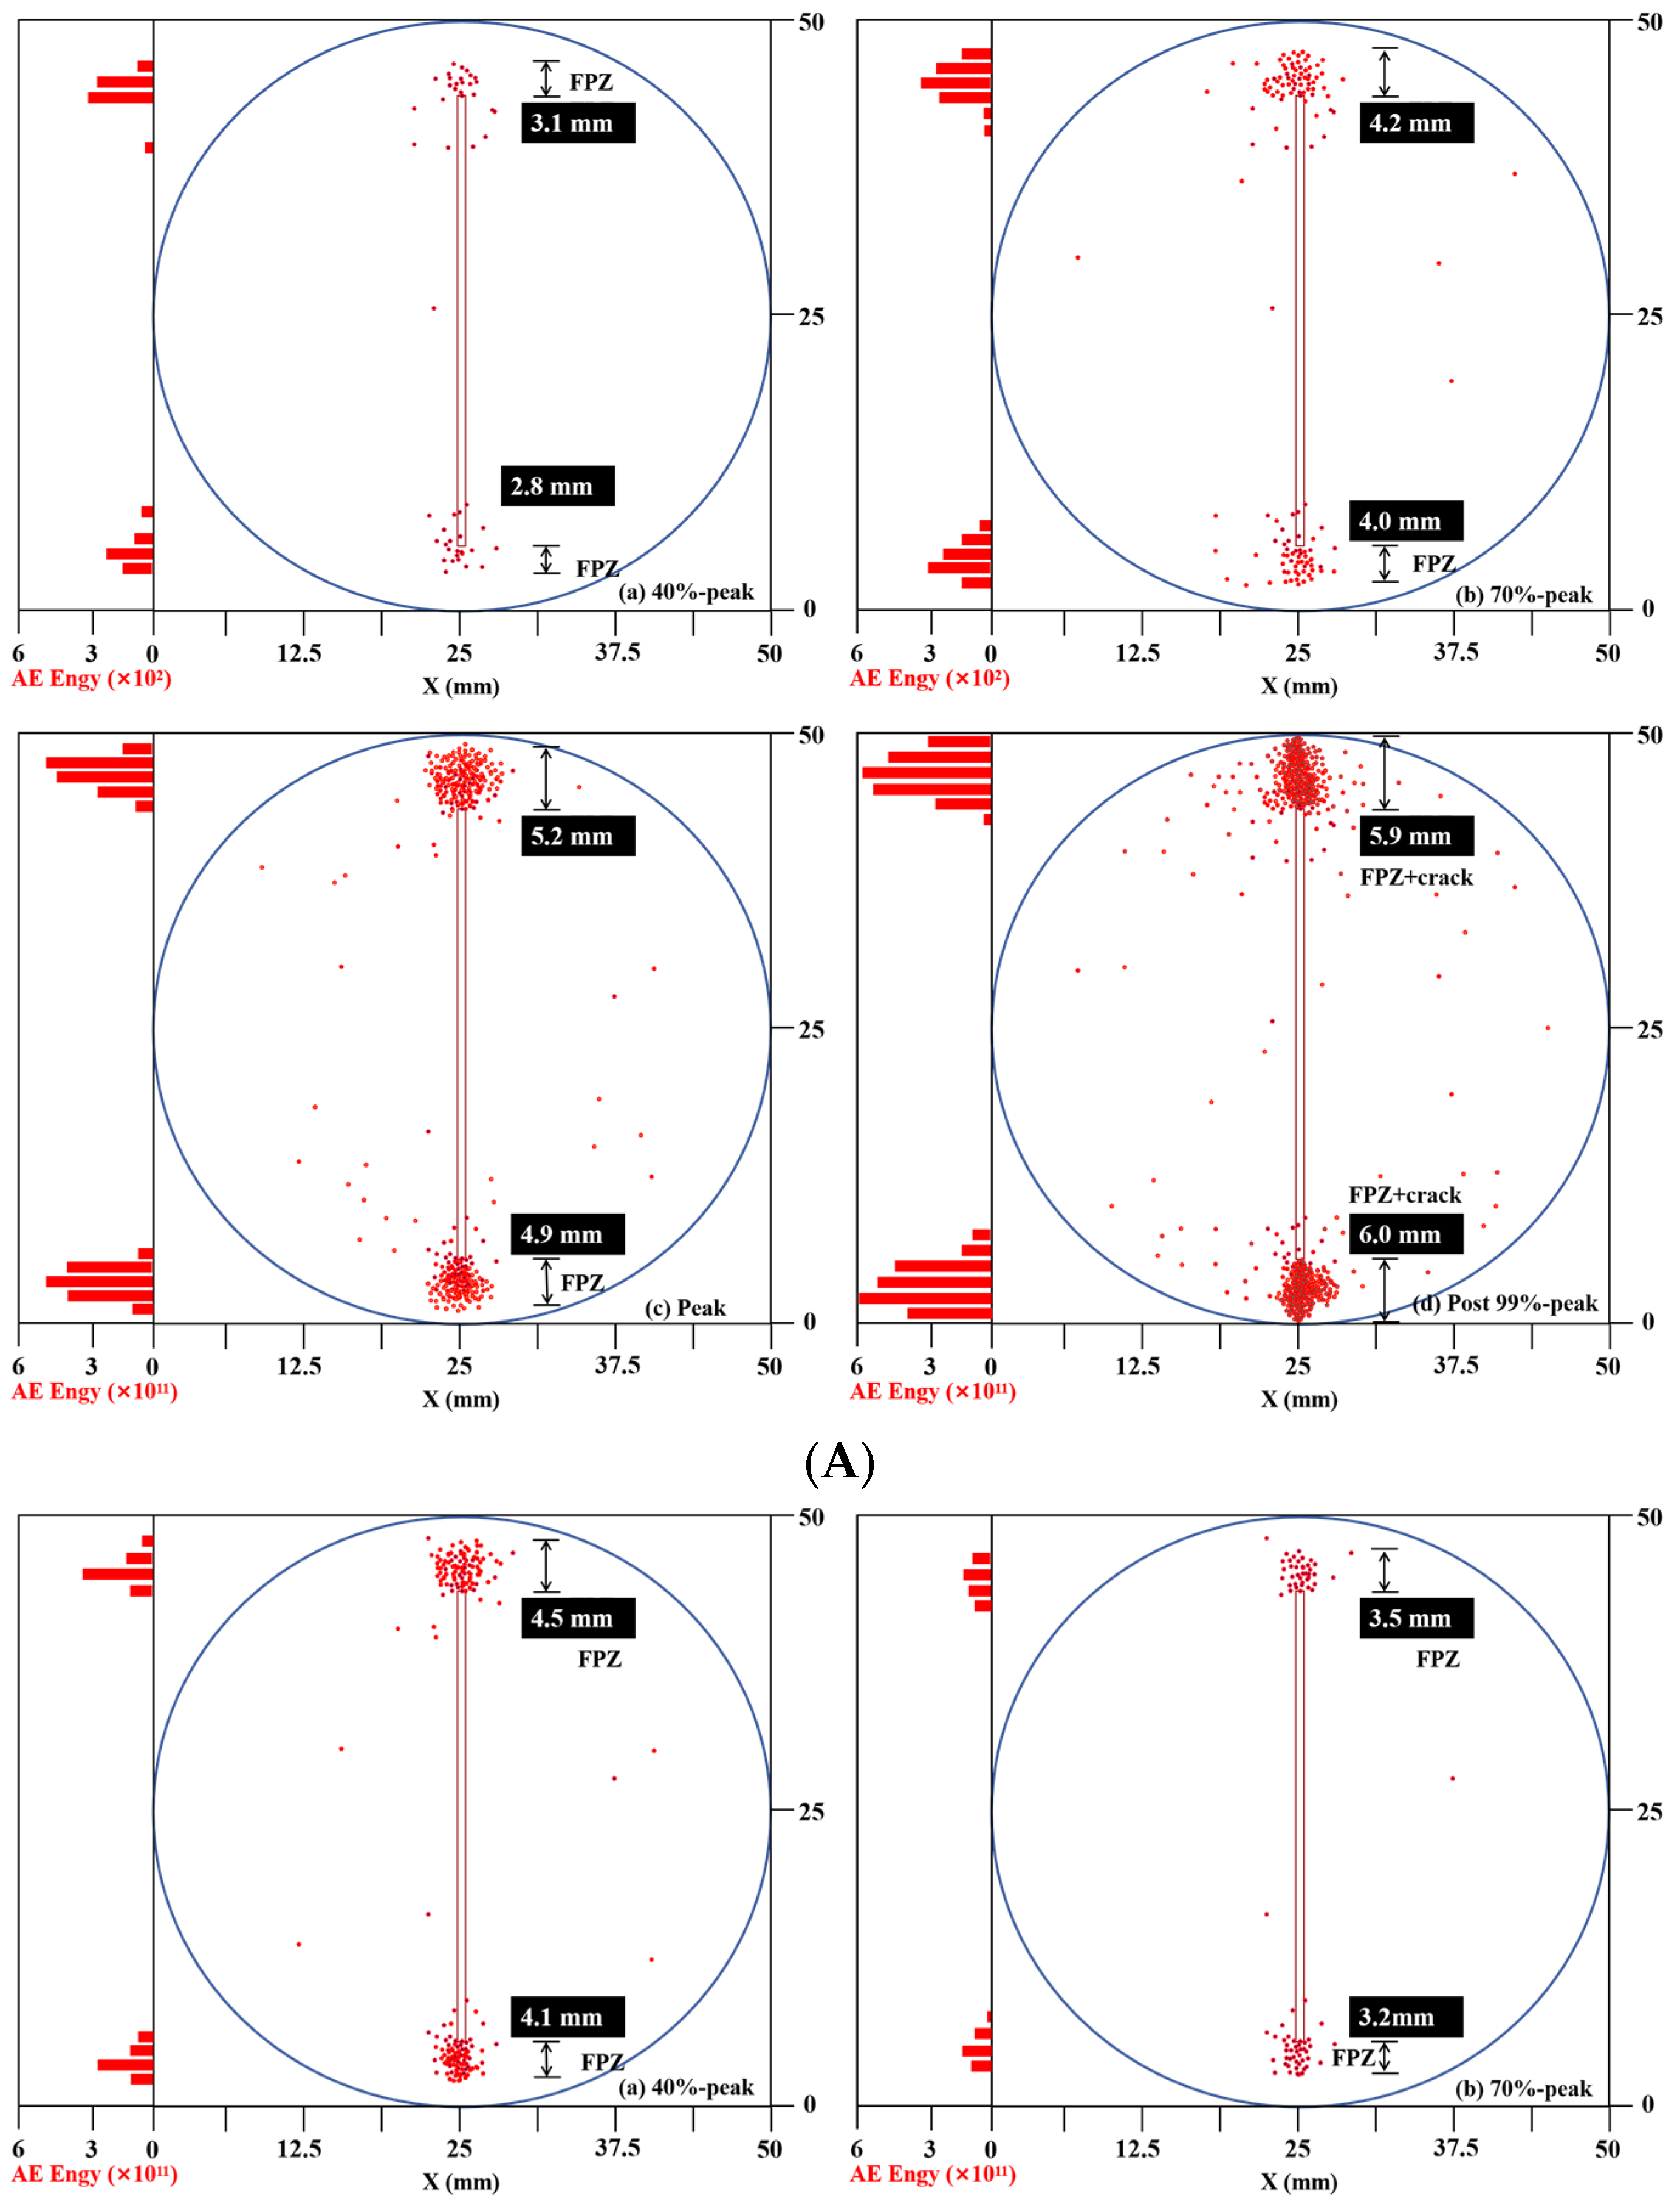
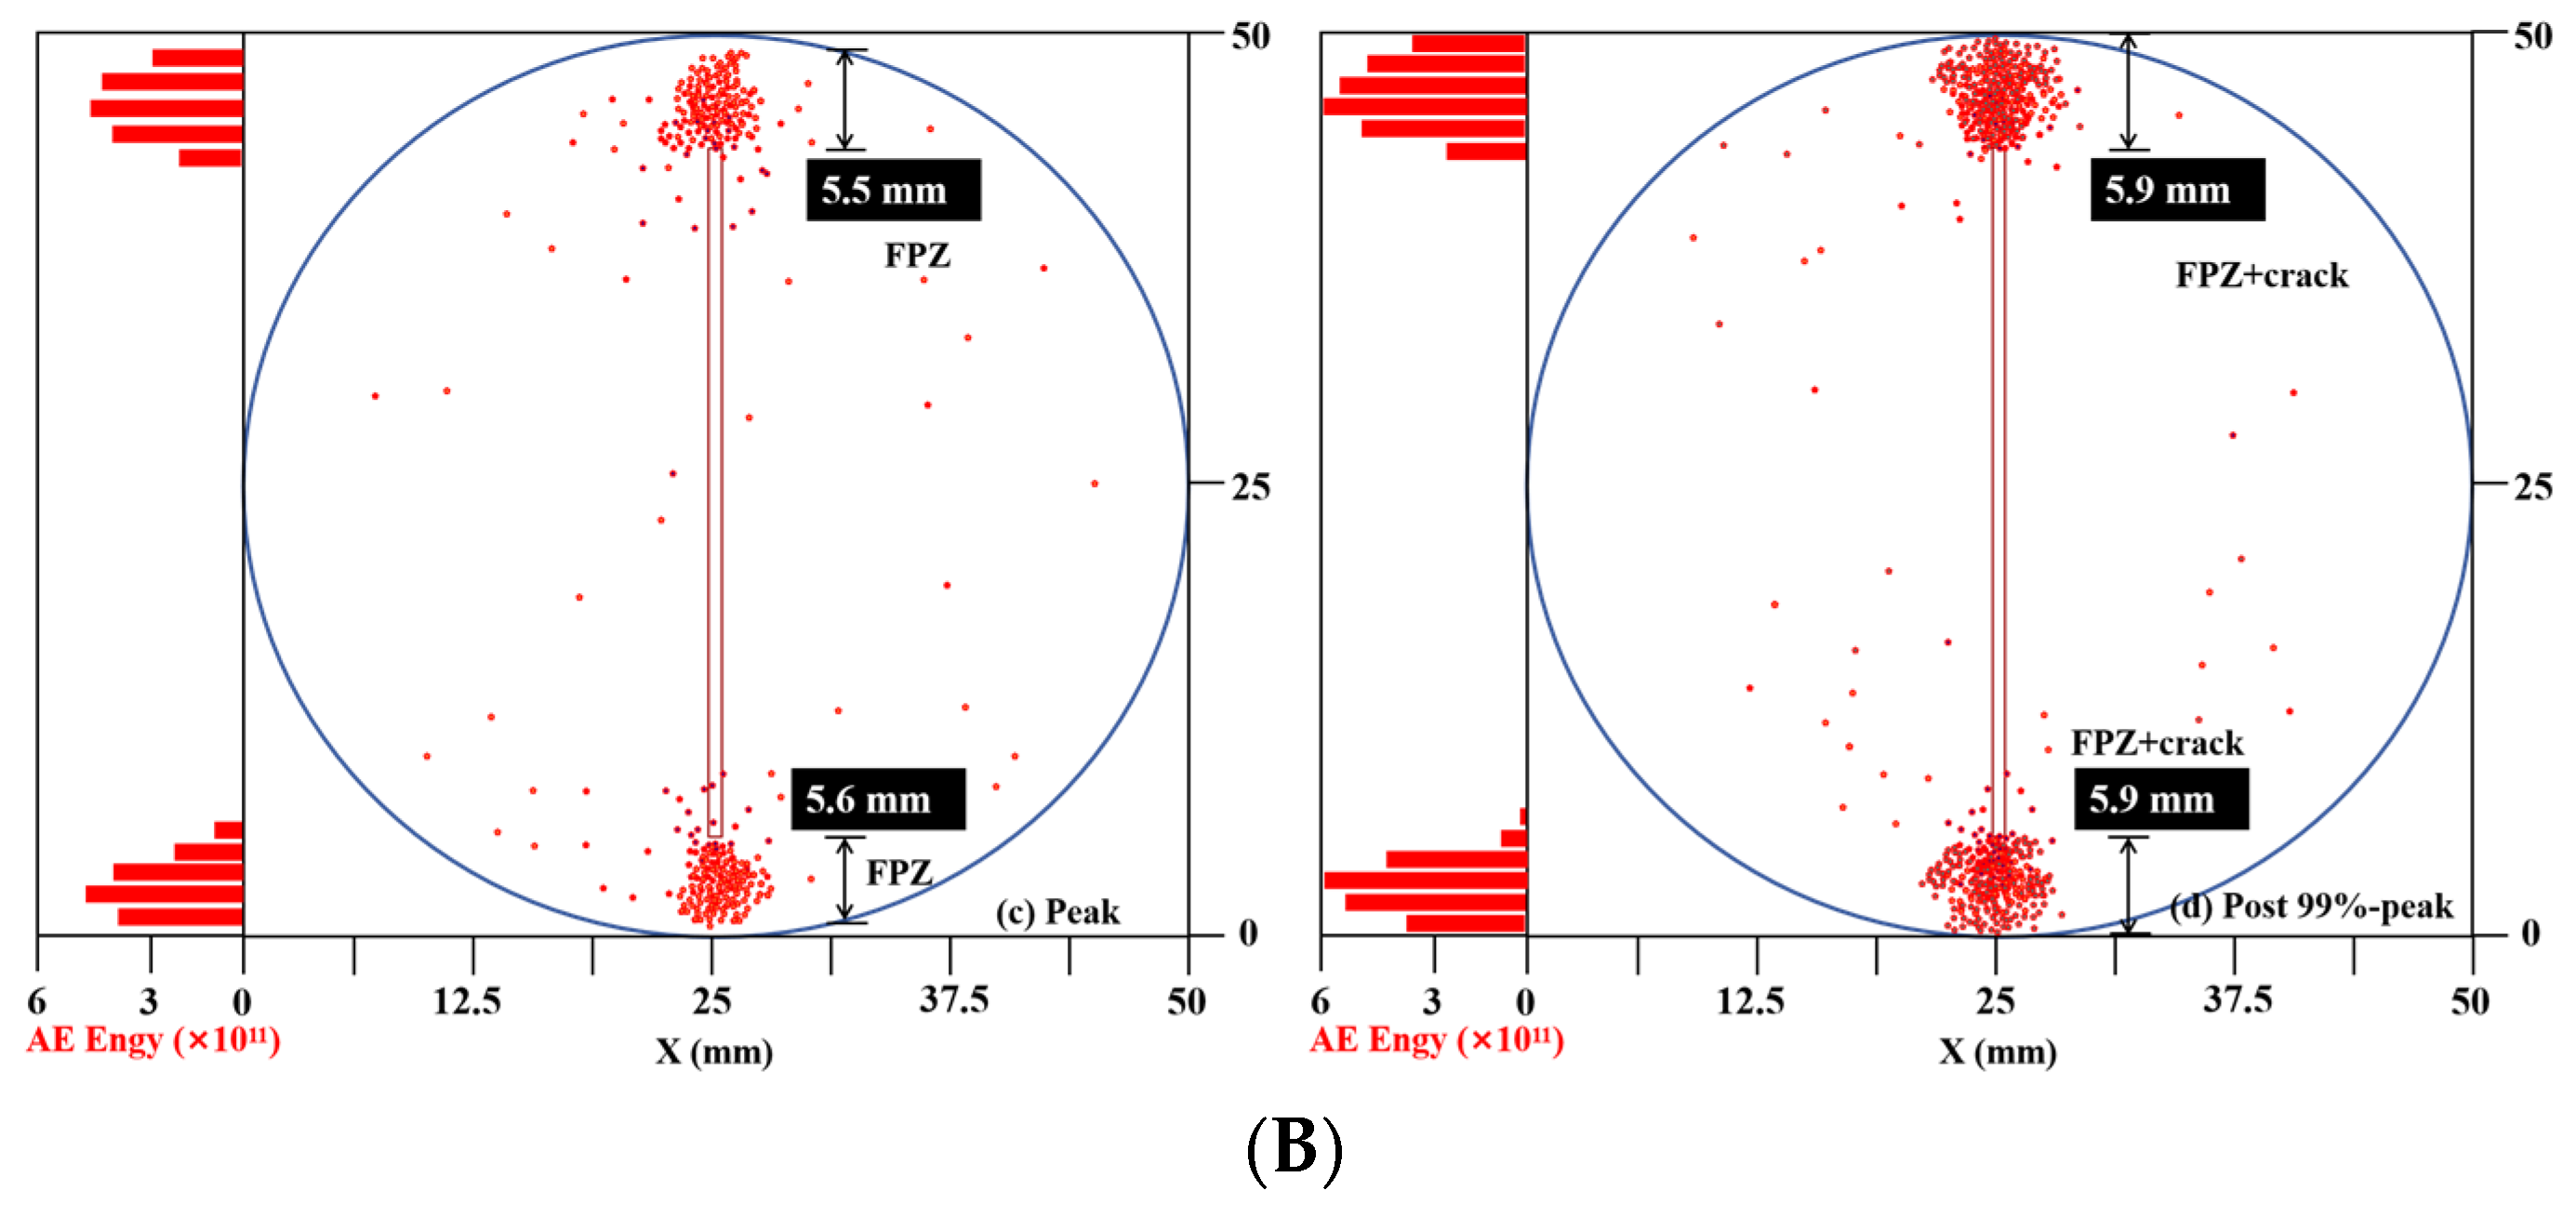
Under the action of external loads, a nonlinear FPZ forms at the crack tip, which is characterized by microcrack aggregation and leads to a rock fracture beyond the description of the linear elastic model. AE energy provides information containing the mechanical characteristics of the crack tip [35]. First, the AE energy with a continuous distribution is related to the discrete location of the AE event. AE energy is generated by rock damage in the FPZ, so AE energy constitutes some of the dissipated energy in the FPZ. A correlation between AE energy and energy dissipated in FPZ can be established [36]. Recently, Lin used AE equipment to explore the microcrack initiation and propagation during rock fracture [37]. FPZ length at the crack tip was quantified, and good agreement was obtained by comparison with digital image correlation techniques based on the cohesive crack model and AE energy distribution. This method is used in this paper to quantify the FPZ length corresponding to the load process under two loading conditions (i.e., 40% peak stage, 70% peak stage, peak stage, and post 99% peak stage, corresponding to A, B, C, and D in Figure 9 and Figure 11, respectively). It should be noted that this method is only a range quantization method. There is still some error when the FPZ length is calculated using the digital image correlation (DIC) displacement wave method.
Figure 12 shows the AE events on the specimen surface under the two loading conditions. Under static loading conditions, AE events occurred significantly at the prefabricated crack tip under an increase in load, which indicated that microcracks were first initiated at this position, and then AE events gradually increased with increasing load until the specimen failed. For cyclic loading, in the 70% peak axial reloading point phase, the total number of AE events was slightly less than in the earlier phase (40% peak). Specifically, we clarified the logical relationship between this observation—namely that the number of AE events at the 70% peak load stage is slightly lower than that at the 40% peak load stage—and the core mechanism of the Kaiser effect. According to this mechanism, AE activity remains relatively quiet when the load is reapplied up to a previously reached stress level, whereas new AE signals are generated once the load exceeds that historical maximum. Furthermore, this observation is interpreted in connection with the Felicity effect discussed earlier, in which AE activity occurs even at stress levels lower than the previously reached maximum load. This explanation suggests that the significant damage induced during the initial loading cycles due to the Felicity effect may be one of the reasons for the relative variation in the cumulative number of AE events observed in the subsequent stages.
Figure 12.
Surface AE events and FPZ estimated lengths: (A) static loading, (B) cyclic loading.
The length of the FPZ at both ends of the prefabricated crack was estimated using the AE event distribution characteristics. FPZ length at both ends was not uniform, which might have been because the size of the aggregate inside the specimen was not uniform, resulting in different stresses at both ends of the prefabricated crack. The average FPZ length under static loading conditions increased from 3.0 mm at a 40% peak to 5.1 mm in the peak stage, which is an increase of 70%. Under cyclic loading conditions, the value decreases from 4.3 mm at 40% peak to 3.4 mm at 70% peak and then increases to 5.6 mm at the peak stage. Cyclic loading under peak load conditions increased by 9.8% compared with static loading. It is worth noting that under the two loading conditions in the post-peak stage, the AE dense region of the prefabricated crack tip reached 6 mm and included both the FPZ and crack regions.
3.4. Fracture Roughness of the CCNBD Specimens
Fracture morphology pertains to the structural characteristics of a newly formed fracture surface subsequent to the rupture of a material. It serves as a depiction of the irreversible deformation endured by the material, along with the initiation and propagation of cracks leading up to fracture [34].
To quantitatively describe the complexity and irregularity of the fracture morphology, this study introduces the fractal dimensional-box-counting method. The box-counting method is based on the MATLAB mathematical platform (version 9.13.0 (R2022b)), and it uses N (δ) cubic boxes with a side length of 8 to cover the section through infinite segmentation. The fractal dimension is calculated as follows [35]:
where 8 represents the size of the cubic box, and the rough surface F is encompassed by altering the box size; N (δ) denotes the number of boxes necessary to cover the fracture surface. Logarithmic adjustments to this formula yield the calculation formula for fractal dimension:
The geometric interpretation conveyed by (DB) is the rate of increase in section irregularity as the cube size approaches zero. In this investigation, for the linear fitting of the fractal dimension (D), the ordinate (Y) represents the number of boxes (Nδ (F)), the horizontal coordinate (X) corresponds to the box size (ln δ), and the slope of the primary function is the fractal dimension (DB) of the fracture surface.
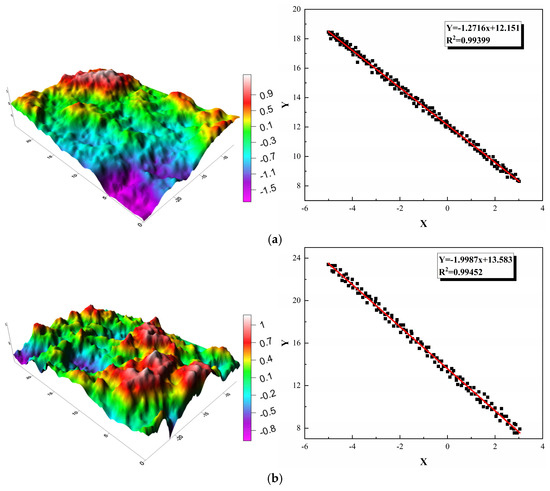
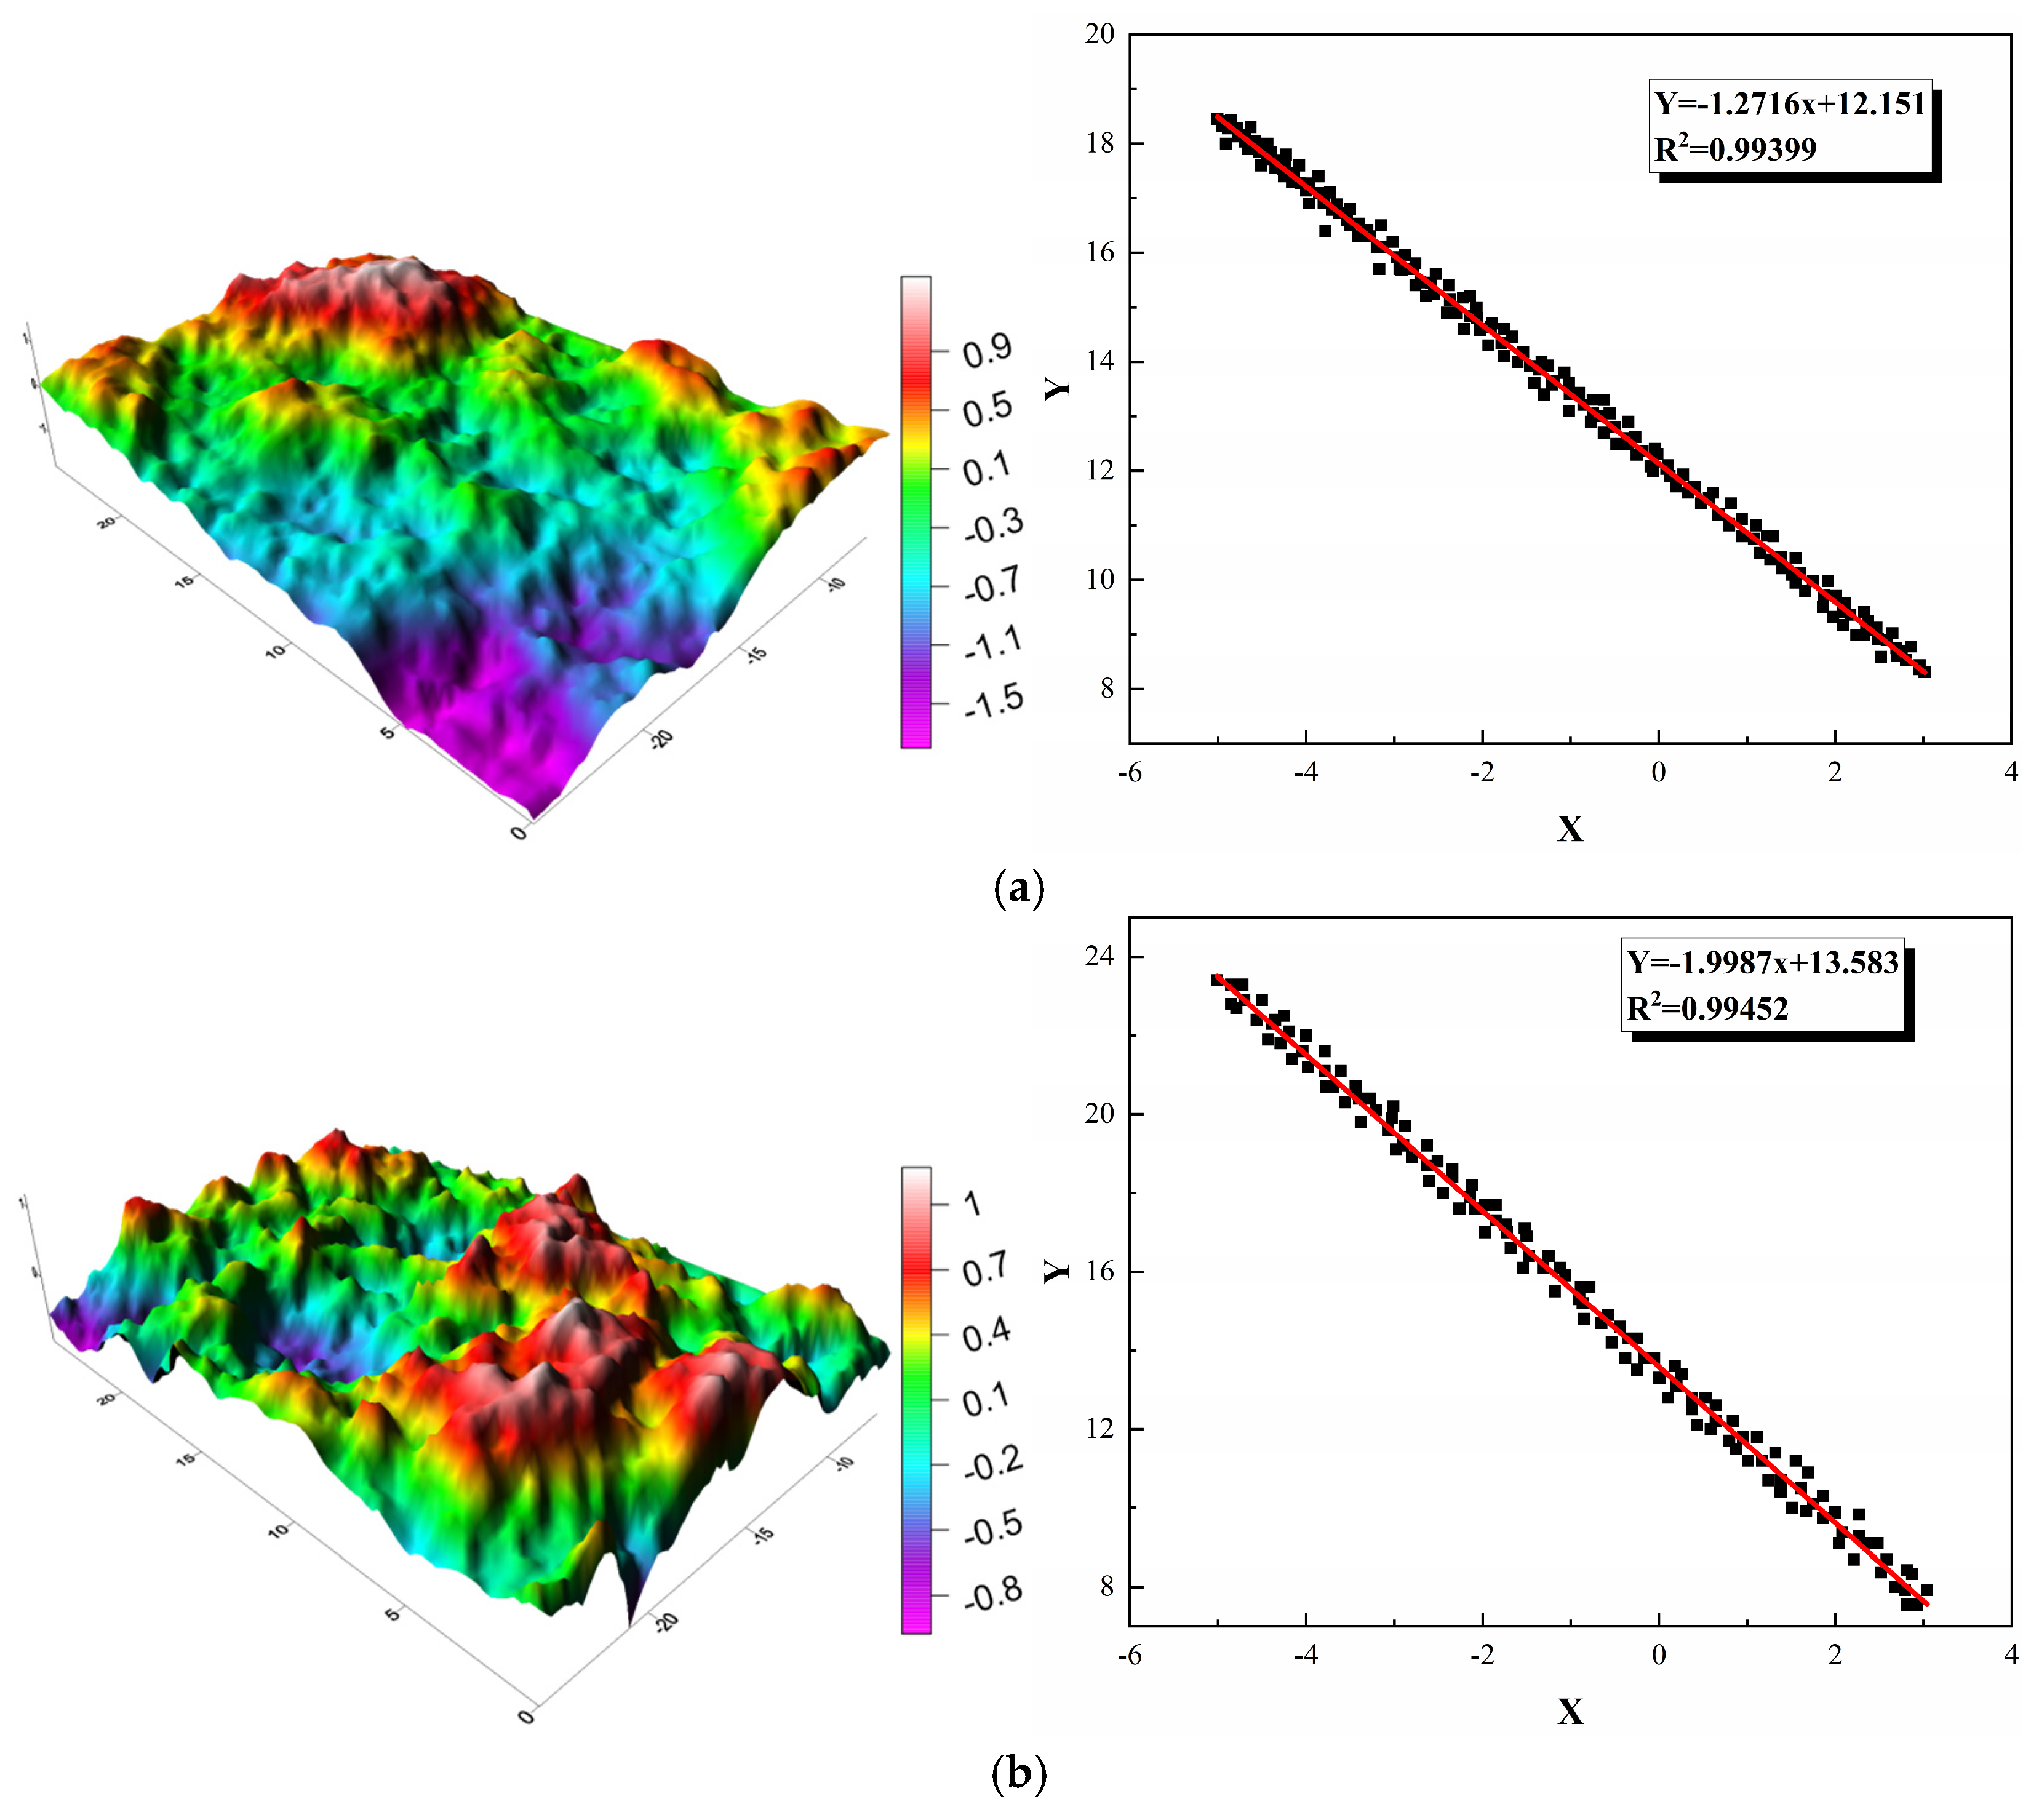
Figure 13 shows the section morphology and fractal dimensions of the specimen for the two loading ways. After the static loading failure, the section roughness of the specimen is small, and the fractal dimension is 1.27. However, after cyclic loading failure, the degree of convexity or concavity of the fracture surface increases, and the fractal dimension increases to 2.00. This indicates that under cyclic loading failure, the section roughness of the specimen is greater than that under static loading, mainly because the number of microcracks inside the specimen is greater than that under static loading. With an increasing number of cycles, many microcracks accumulate inside the specimen. When the crack tip reaches its fracture toughness, microcracks tend to propagate along the boundary of the mineral crystal with lower strength, which results in lower roughness of the fracture surface.
Figure 13.
Fracture surface morphology and fractal dimension of specimens after loading failure using two methods: (a) section morphology and fractal dimension of specimens after static loading failure (DB = 1.27, R2 = 99.4%); (b) section morphology and fractal dimensions of specimens after cyclic loading failure (DB = 2.00, R2 = 99.5%).
4. Discussion
4.1. Fracture Toughness of CCNBD Specimens
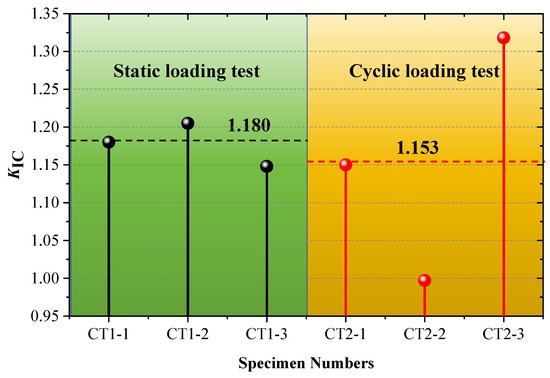
Peak strength and fracture toughness KIC of the specimens in static loading and cyclic load–unloading conditions are listed in Table 1. The average fracture toughness for Beishan deep granite CCNBD specimens under the static loading test is 1.180 MPa·m1/2 with a variation coefficient of 0.02, whereas under the cyclic loading tests, the average fracture toughness of the rock is 1.153 MPa·m1/2 with a variation coefficient of 0.16. The fracture toughness of the specimen used in cyclic loading conditions is less than approximately 2.3% of that used in the static loading conditions, which indicates that the cyclic loading effect improves the degree of damage inside the rock during the lower loading level. Figure 14 shows that the rock fracture toughness values under static loading are more concentrated, whereas those obtained under cyclic loading exhibit a larger variance. The classic linear elastic fracture mechanics (LEFM) [36] states that when stress intensity KI is less than KIC, the cracks inside the rock will not extend or propagate at the cracked chevron notch tip. However, the fracture toughness of the samples decreases under cyclic loading. This leads to rock cracks and failure under cyclic loading at loads lower than the expected ultimate load, which is inconsistent with LEFM principles. The phenomenon of rock crack propagation and failure that occurs at loads below the expected peak load is referred to as subcritical crack growth. This cyclic loading test for the Beishan deep granite CCNBD specimens demonstrates the existence of subcritical crack propagation.
Figure 14.
Fracture toughness distribution.
Classical linear elastic fracture mechanics (LEFM) assumes that when the stress intensity factor KI is lower than the fracture toughness KIC, crack propagation will not occur. However, the present study shows that cyclic loading leads to a 2.3% reduction in fracture toughness, indicating that even at stress levels below the static fracture toughness, the accumulation of fatigue damage can still drive stable subcritical crack propagation. This phenomenon goes beyond a straightforward application of the fundamental assumptions of LEFM and supplements its limited theoretical description under cyclic or fatigue loading conditions, highlighting the importance of considering fatigue accumulation effects in long-term safety assessments.
To preliminarily verify the reliability of the experimental results, the static fracture toughness of Beishan granite measured in this study (1.180 MPa·m1/2) was compared with values reported in the literature obtained using different testing methods, such as CB specimens [22,25]. The results show consistent orders of magnitude, thereby providing cross-validation of the key parameter across different experimental approaches.
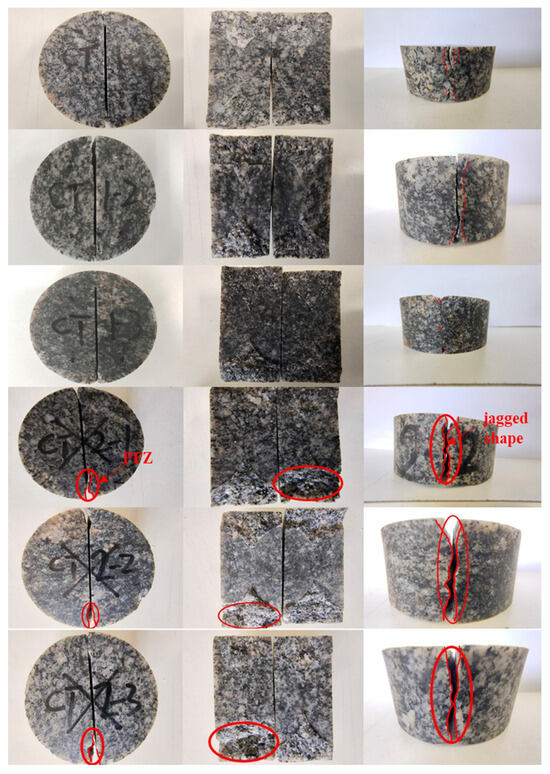
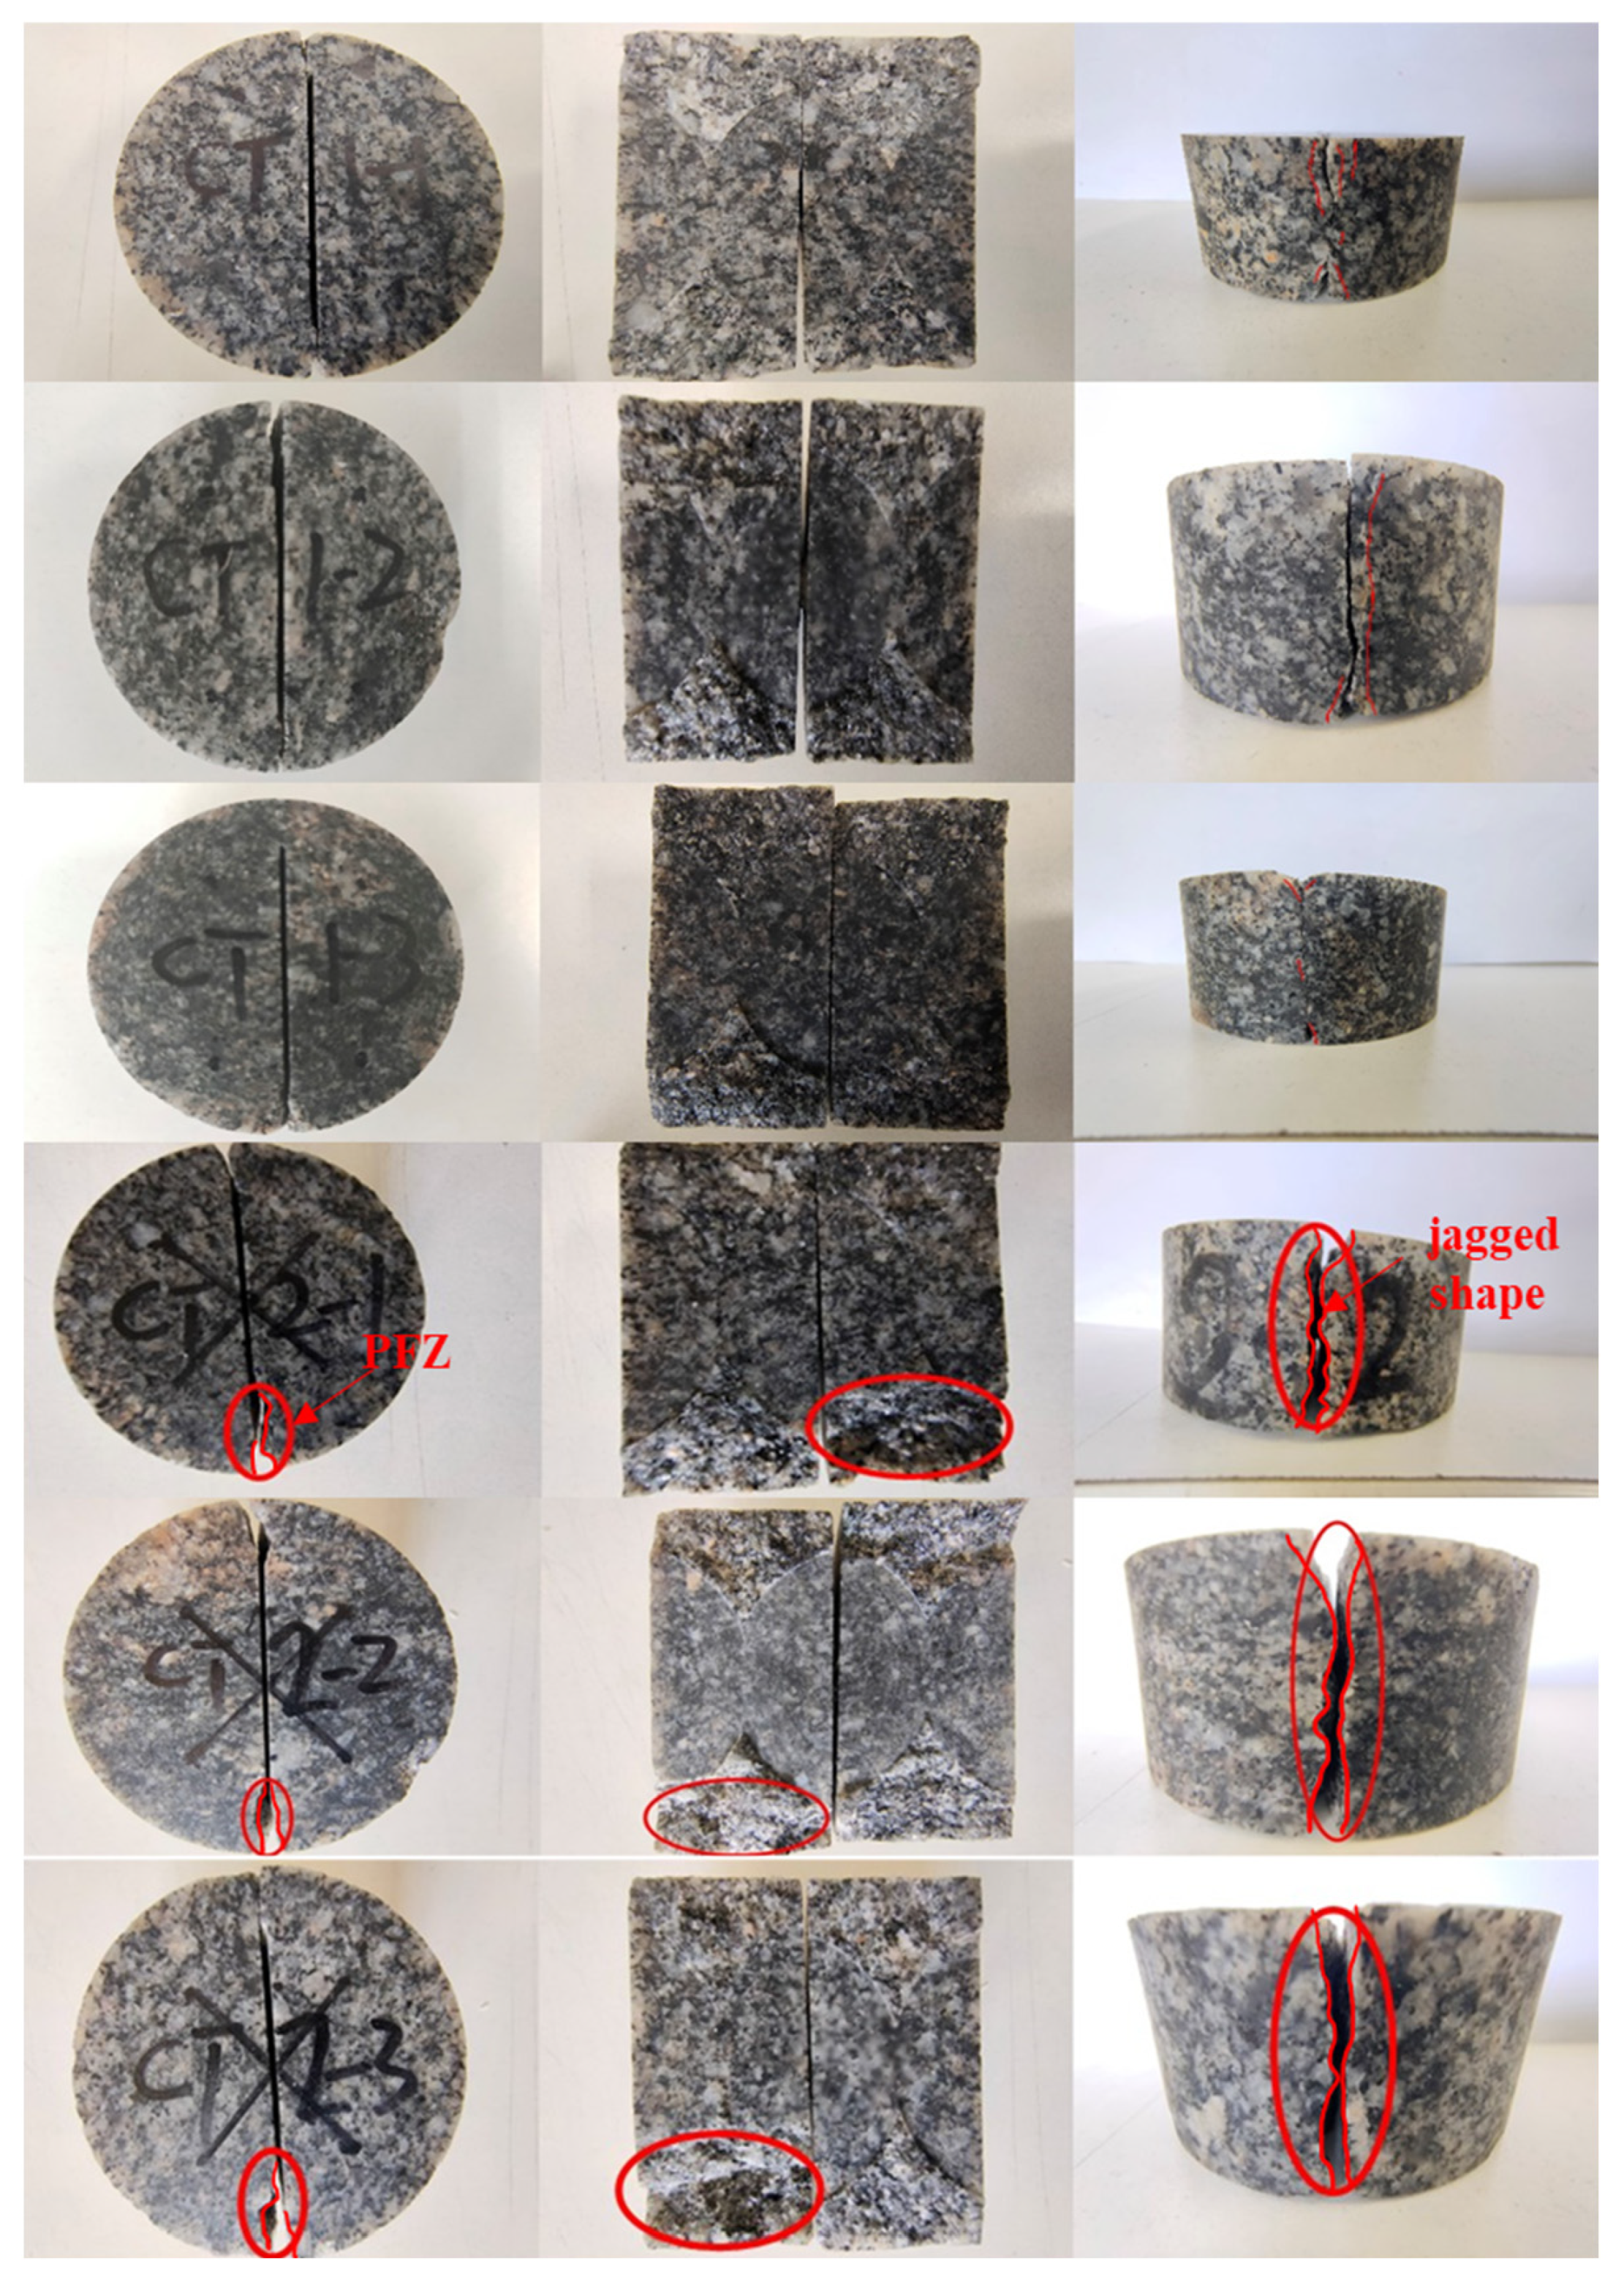
The rock fracture morphology under the static and cyclic loading tests is shown in Figure 15. The rock fracture surface used in the static loading test aligns closely with the cracked chevron notch of the CCNBD specimen. The fracture surface under these testing conditions is relatively smooth and without small rock blocks. However, during the cyclic loading test, an FPZ with an approximately triangular shape appeared at the bottom of the CCNBD specimens. Under these experimental conditions, the lateral fracture surface of the rock had a distinct jagged shape. The CCNBD specimen in the cyclic loading underwent damage deformation during reloading, which led to numerous microcracks around the specimen’s bottom. Under the cyclic loading, these microcracks inside the rock did not necessarily propagate along the cracked chevron notch and eventually formed macroscopic cracks that deviated from the notch.
Figure 15.
Fracture morphology of specimens.
4.2. Damage Evolution of the CCNBD Specimens
The AE hit count of the specimen during the loading process is directly related to the energy released by the rock grain misalignment and fracture and the crack propagation inside the rock. In Figure 9b and Figure 11a, AE hit count development effectively reflects the degree of damage to the CCNBD specimens. Therefore, based on the AE ringing count as a characteristic parameter of rock damage, the damage evolution of the CCNBD specimens under static and cyclic loading was analyzed in this study. Kachanov (1958) [37] defined the damaged variable D as follows:
where Ad represents the damaged area of the rock, and A denotes the sectional area of the rock.
The cumulative AE hit count per unit area, Cw, was obtained by introducing the cumulative AE hit count of rock failure, C0, into Equation (5) as follows:
When the damaged area reaches Ad, the cumulative AE ringing count Cd is
Thus, the damaged variable D of the rock was obtained from the normalized cumulative AE hit count:
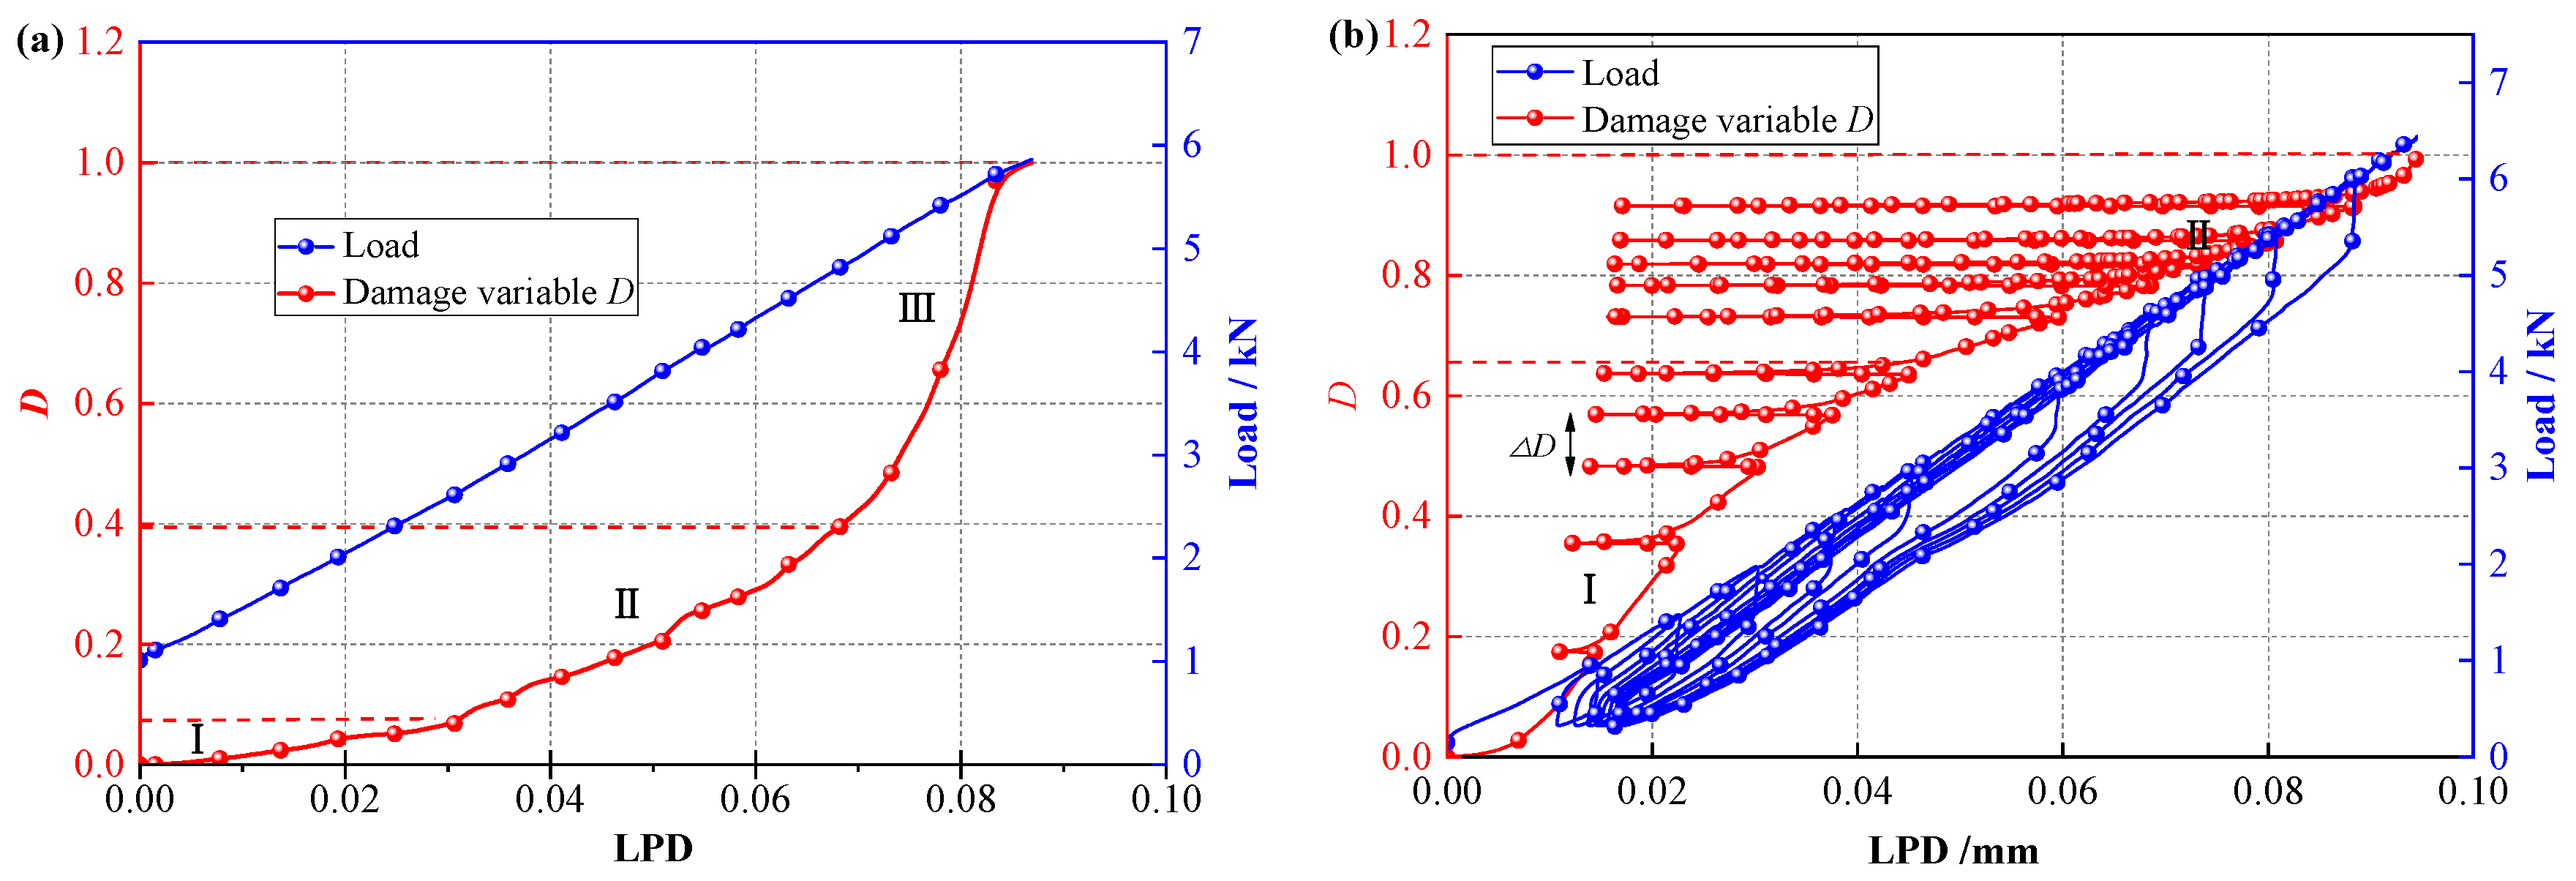
Before the rock peak strength is reached, the load–LPD–damaged variable D curve of the static loading test was obtained, and it is shown in Figure 16a. The rock damage evolution before peak strength under the static loading condition consists of three stages. In the initial damage stage (I), LPD and damaged variable D are small, and the LPD–damaged variable curve increases slowly. The original cracks and defects are compacted under the load, and a few new microcracks may be subsequently generated in this stage. In the stable damage development stage (II), the damaged variable D of the specimen begins to increase rapidly with LPD growth, new cracks inside the rock are gradually generated, and macroscopic cracks begin to appear and expand stably. In the rapid damage development stage (III), the damage variable of the specimen increases sharply until it reaches a critical value (D = 1). Rock damage development occurs extremely quickly at this stage. New cracks continue to form in the rock, and existing cracks rapidly expand and connect, which leads to the ultimate instability and rapid destruction of the rock.
Figure 16.
Load–LPD–damage variable curves of specimens before peak strength: (a) static loading, (b) cyclic loading.
The load–LPD–damaged variable D of the specimen under the cyclic loading tests before peak strength is shown in Figure 16b. The damage evolution of the CCNBD samples under cyclic loading conditions is generally divided into two stages when the unloading points of the specimen during each cycle are connected. In the slow development stage of damage (I), the LPD–damage variable curve shows a convex development pattern, where the rate of crack formation and propagation declines slowly. Meanwhile, as the axial load increases, the damage difference △D between adjacent cycles gradually decreases. During the rapid development stage of damage (II), the LPD–damage variable curve shows an upward trend, and the damage difference △D gradually increases with loading, which reveals a nonlinear intensification process of the internal rock damage level as cracks begin to rapidly connect and expand and lead to rock instability.
The damage development of the CCNBD specimens exhibits significantly different processes under the static and cyclic loading tests. Under static loading, the damage velocity of the CCNBD specimen shows an accelerating trend of increase with loading, whereas under cyclic loading, the damage rate exhibits a decelerating increase followed by acceleration, and the influence of subsequent loading on crack activity gradually weakens. This is also different from the damage evolution characteristics of cylindrical rock samples under triaxial cyclic loading, where primary existing cracks exhibit an accelerating increase in AE signals before failure, which indicates that preexisting cracks have a significant impact on rock damage development.
Classical Kachanov continuous damage theory generally assumes that damage increases monotonically with loading. However, as shown in Figure 16b, the evolution of the damage variable based on acoustic emission counts under cyclic loading exhibits a nonlinear pattern characterized by “initial deceleration followed by acceleration.” This behavior differs significantly from the monotonically accelerating damage observed under static loading (Figure 16a). It enriches and refines the understanding of the complex process of rock damage evolution under cyclic loading, indicating that damage is not simply accumulated but instead involves complex stage transitions, including microcrack compaction, interaction, and eventual coalescence.
4.3. Novelty and Scientific Contributions of This Study
The novelty of this study is mainly reflected in the following aspects: (1) Method integration: For the first time, CCNBD specimens, full-cycle acoustic emission spatial monitoring, and three-dimensional laser scanning of fracture surfaces are systematically integrated and applied to investigate the fracture behavior of Beishan granite under cyclic loading. (2) Mechanism elucidation: From microscopic damage accumulation and macroscopic expansion of the fracture process zone (FPZ) to the final fracture morphology, the unique mechanisms of subcritical crack propagation and nonlinear damage evolution of rock under cyclic loading are revealed across multiple scales. (3) Engineering significance: The results provide key experimental evidence for evaluating the long-term performance degradation and safety thresholds of surrounding rock in geological repositories for high-level radioactive waste subjected to cyclic loading conditions.
5. Conclusions
This study investigated the fracture characteristics and damage evolution of Beishan deep granite through static and cyclic loading tests using CCNBD specimens, providing critical insights into the long-term safety of geological repositories for high-level radioactive waste under extreme thermo-mechanical conditions. The integration of acoustic emission (AE) monitoring and 3D laser scanning enabled a detailed analysis of microcrack propagation, fracture process zone (FPZ) development, and post-failure morphology. The following conclusions were drawn:
- (1)
- Cyclic loading promotes the fatigue accumulation of microcracks, resulting in an average reduction of approximately 2.3% in the mode I fracture toughness of the rock and increasing the dispersion of the measured data. This confirms that cyclic loading can induce subcritical crack propagation, leading to progressive failure of rock under stress levels lower than its static strength. This finding suggests that traditional engineering safety assessment methods based solely on static parameters may require revision.
- (2)
- Acoustic emission monitoring indicates that the evolution of the fracture process zone (FPZ) under cyclic loading exhibits a complex pattern characterized by a slight initial decrease followed by a rapid increase, with the final FPZ length increasing by 9.8% compared with the static condition. Three-dimensional scanning further reveals that the fractal dimension of the fracture surface after cyclic loading failure (2.00) is significantly higher than that obtained under static loading (1.27). These results jointly demonstrate, from both the fracture process and the final fracture morphology, that cyclic loading produces a more tortuous and energy-dissipative failure path.
- (3)
- Damage analysis based on acoustic emission reveals that damage evolution under cyclic loading follows a distinctive nonlinear pattern characterized by initial deceleration followed by acceleration, which differs fundamentally from the monotonically accelerating damage pattern observed under static loading. This behavior reflects the staged transition of internal damage mechanisms in rock subjected to cyclic loading.
- (4)
- The analytical framework established in this study provides a multiscale approach for evaluating the long-term performance of deep rock masses under cyclic loading. Future studies should verify the general applicability of these findings under a broader range of comparative scenarios and develop fracture models that incorporate fatigue damage coupling, thereby further improving the robustness of long-term behavior predictions for engineering rock masses.
Author Contributions
Conceptualization, G.L. and C.W.; Methodology, G.L. and C.W.; Validation, G.L.; Formal analysis, C.W.; Investigation, G.L.; Resources, C.W.; Writing—original draft, G.L. and S.D.; Writing—review and editing, Y.M. and S.D.; Supervision, Y.M. and Z.S.; Project administration, Z.S. All authors have read and agreed to the published version of the manuscript.
Funding
This research is supported by the National Key Research and Development Program of China (No. 2022YFC3005604) and Key Technologies and Integrated Applications of Intelligent Enhancement of Highway Tunnel Construction Equipment and Robot Equipment (SDGS-YJYKJ-2021-18) and the Open Fund of the State Key Laboratory (No. KFKT2023001).
Institutional Review Board Statement
Not applicable.
Informed Consent Statement
Not applicable.
Data Availability Statement
The original contributions presented in this study are included in the article. Further inquiries can be directed to the corresponding author.
Acknowledgments
The authors extend their sincere gratitude to the editors and the anonymous reviewers for their insightful comments and constructive feedback, which greatly contributed to improving the quality of this work.
Conflicts of Interest
The authors declare that they have no known competing financial interests or personal relationships that could have appeared to influence the work reported in this paper.
Abbreviations
| AE | Acoustic Emission |
| CCNBD | Cracked Chevron-Notched Brazilian Disk |
| CB | (Three-point) Bending Circular Bar |
| CMOD | Crack Mouth Opening Displacement |
| DIC | Digital Image Correlation |
| FPZ | Fracture Process Zone |
| HLW | High-Level Radioactive Waste |
| ISRM | International Society for Rock Mechanics |
| LEFM | Linear Elastic Fracture Mechanics |
| LPD | Vertical Displacement at the Axial Loading Point |
| NSCB | Notched Semi-Circular Bending |
| SR | Chevron-Notched Short Rod |
| SIF | Stress Intensity Factor |
References
- Irankunda, G.; Zhang, W.; Fernand, M.; Zhang, J. Assessing the Resilience of Critical Infrastructure Facilities toward a Holistic and Theoretical Approach: A Multi-Scenario Evidence and Case Study. Sustainability 2024, 16, 8735. [Google Scholar] [CrossRef] [Scilit]
- Moisseron-Baudé, M.; Bernaud, J.-L.; Sovet, L. Relationships between Sense of Community, Authenticity, and Meaning in Life in Four Social Communities in France. Sustainability 2022, 14, 1018. [Google Scholar] [CrossRef] [Scilit]
- Feng, G.L.; Liu, G.F. Geotechnical Disaster Risk Mitigation and Sustainable Development in Complex Geo-Environments: An Editorial Note. Sustainability 2024, 16, 1893. [Google Scholar] [CrossRef] [Scilit]
- Griffith, A.A. The phenomena of rupture and flow in solids. Philos. Trans. R. Soc. Lond. 1921, 221, 163–198. [Google Scholar] [CrossRef] [Scilit]
- Ashby, M.F.; Hallam, S.D. The failure of brittle solids containing small cracks under compressive stress states. Acta Metallurgica 1986, 34, 497–510. [Google Scholar] [CrossRef] [Scilit]
- Fowell, R.J. ISRM Testing Commission Suggested method for determining mode I fracture toughness using cracked chevron notched Brazilian disc (CCNBD) specimens. Int. J. Rock Mech. Min. Sci. 1995, 32, 57–64. [Google Scholar] [CrossRef] [Scilit]
- Franklin, J.A.; Sun, Z.; Atkinson, B.K.; Meredith, P.C.; Rummel, F.; Mueller, W.; Nishimatsu, Y.; Takahahsi, H.; Costin, L.S.; Ingraffea, A.R.; et al. Suggested Methods for Determining the Fracture-Toughness of Rock. Int. J. Rock Mech. Min. Sci. 1988, 25, 71–96. [Google Scholar]
- Iqbal, M.J.; Mohanty, B. Experimental Calibration of ISRM Suggested Fracture Toughness Measurement Techniques in Selected Brittle Rocks. Rock Mech. Rock Eng. 2007, 40, 453–475. [Google Scholar] [CrossRef] [Scilit]
- Dwivedi, R.D.; Soni, A.K.; Goel, R.K.; Dube, A.K. Fracture Toughness of Rocks under Sub-Zero Temperature Conditions. Int. J. Rock Mech. Min. Sci. 2000, 37, 1267–1275. [Google Scholar] [CrossRef] [Scilit]
- Wang, Q.Z.; Fan, H.; Gou, X.P.; Zhang, S. Recalibration and Clarification of the Formula Applied to the ISRM-Suggested CCNBD Specimens for Testing Rock Fracture Toughness. Rock Mech. Rock Eng. 2013, 46, 303–313. [Google Scholar] [CrossRef] [Scilit]
- Shetty, D.; Rosenfield, A.; Duckworth, W. Fracture-Toughness of Ceramics Measured by a Chevron-Notch Diametral-Compression Test. J. Am. Ceram. Soc. 1985, 68, C325–C327. [Google Scholar] [CrossRef] [Scilit]
- Erarslan, N.; Alehossein, H.; Williams, D.J. Tensile Fracture Strength of Brisbane Tuff by Static and Cyclic Loading Tests. Rock Mech. Rock Eng. 2014, 47, 1135–1151. [Google Scholar] [CrossRef] [Scilit]
- Erarslan, N. Microstructural Investigation of Subcritical Crack Propagation and Fracture Process Zone (FPZ) by the Reduction of Rock Fracture Toughness under Cyclic Loading. Eng. Geol. 2016, 208, 181–190. [Google Scholar] [CrossRef] [Scilit]
- Ghamgosar, M.; Erarslan, N. Experimental and Numerical Studies on Development of Fracture Process Zone (FPZ) in Rocks under Cyclic and Static Loadings. Rock Mech. Rock Eng. 2016, 49, 893–908. [Google Scholar] [CrossRef] [Scilit]
- Ghamgosar, M.; Erarslan, N.; Williams, D.J. Experimental Investigation of Fracture Process Zone in Rocks Damaged Under Cyclic Loadings. Exp. Mech. 2017, 57, 97–113. [Google Scholar] [CrossRef] [Scilit]
- Kaklis, K.; Mavrigiannakis, S.; Saltas, V.; Vallianatos, F.; Agioutantis, Z. Using Acoustic Emissions to Enhance Fracture Toughness Calculations for CCNBD Marble Specimens. Frat. Integrità Strutt. 2017, 11, 1–17. [Google Scholar] [CrossRef] [Scilit]
- Lin, Z.; Xue, F.; Wu, X.; Zhou, X. Experimental Investigation on Fracture Behaviors and Crack Propagation Characteristics of Granite Under Cyclic Loading and Unloading. Rock Mech. Rock Eng. 2025, 58, 13221–13242. [Google Scholar] [CrossRef] [Scilit]
- Lv, F.; Zhang, F.; Zhang, S.; Li, K.; Ma, S. Effect of Cyclic Loading on Mode I Fracture Toughness of Granite under Real-Time High-Temperature Conditions. Appl. Sci. 2024, 14, 755. [Google Scholar] [CrossRef] [Scilit]
- Ma, Y.; Yu, C.; Li, H.; Ma, X.; Li, S. Comparison Study on Damage Characteristics of Deeply Buried Granite Under Triaxial Cyclic Loading and Unloading. Rock Mech. Rock Eng. 2025, 58, 1591–1616. [Google Scholar] [CrossRef] [Scilit]
- Xue, F.; Lin, Z.; Wang, T. Experimental study on effects of cyclic loading paths on cracking behavior and fracture characteristics of granite. Eng. Fract. Mech. 2024, 295, 109761. [Google Scholar] [CrossRef] [Scilit]
- Xiong, W.; Jiangbo, X.; Xinyu, C.; Zixuan, Z.; Xia, Z.; Shaowei, W.; Peng, S.; Kun, L.; Qiang, S.; Fanghui, C.; et al. Effect of cooling methods on the mechanical properties and microstructural damage of high-temperature granite. Theor. Appl. Fract. Mech. 2026, 141, 105328. [Google Scholar] [CrossRef] [Scilit]
- Deng, C.F.; Liu, J.F.; Chen, L.; Li, Y.; Xiang, G. Fracture mechanical behaviors and acoustic emission characteristics of Beishan granites with different particle sizes. Rock Soil Mech. 2017, 39, 1538–1544. [Google Scholar]
- Li, Y.; Chen, L.; Liu, J.F.; Liu, J.; Wang, C.P.; Wang, J. Experimental study on influence of saturation process and grain size on the fracture toughness of the Beishan granite. Chin. J. Rock Mech. Eng. 2016, 37, 3169–3177. [Google Scholar]
- Song, Y.; Yue, Z. Experimental Study on Dynamic Fracture Behaviors of Beishan NSCB and CCNSCB Granite Specimens under Different Loading Rates. Soil Dyn. Earthq. Eng. 2021, 141, 106512. [Google Scholar] [CrossRef] [Scilit]
- Zuo, J.P.; Wang, J.T.; Sun, Y.J.; Chen, Y.; Jiang, G.H.; Li, Y.H. Effects of Thermal Treatment on Fracture Characteristics of Granite from Beishan, a Possible High-Level Radioactive Waste Disposal Site in China. Eng. Fract. Mech. 2017, 182, 425–437. [Google Scholar] [CrossRef] [Scilit]
- Miao, S.; Pan, P.-Z.; Yu, P.; Zhao, S.; Shao, C. Fracture Analysis of Beishan Granite after High-Temperature Treatment Using Digital Image Correlation. Eng. Fract. Mech. 2020, 225, 106847. [Google Scholar] [CrossRef] [Scilit]
- Huang, B.X. Research on character of creep and rupture for Beishan granite under temperature effect. Rock Soil Mech. 2003, 24, 203–206. [Google Scholar]
- Dai, F. Effects of finite notch width on stress intensity factor for CCNBD specimen. Rock Soil Mech. 2004, 25, 427–431. [Google Scholar]
- Miao, S.; Pan, P.-Z.; Konicek, P.; Yu, P.; Liu, K. Rock Damage and Fracturing Induced by High Static Stress and Slightly Dynamic Disturbance with Acoustic Emission and Digital Image Correlation Techniques. J. Rock Mech. Geotech. Eng. 2021, 13, 1002–1019. [Google Scholar] [CrossRef] [Scilit]
- Wang, X.; Asem, P.; Hu, C.; Labuz, J.F. Microcracking in Tensile Fracture of a Brittle Rock. Eng. Fract. Mech. 2021, 251, 107789. [Google Scholar] [CrossRef] [Scilit]
- Zhang, D.; Meng, T.; Taherdangkoo, R.; Feng, G.; Wen, L.; Butscher, C. Evolution Trend and Weakening Mechanism of Mode-I Fracture Characteristics of Granite under Coupled Thermo-Hydro-Mechanical and Thermal Treatments. Eng. Fract. Mech. 2022, 275, 108794. [Google Scholar] [CrossRef] [Scilit]
- Lin, Q.; Mao, D.; Wang, S.; Li, S. The Influences of Mode II Loading on Fracture Process in Rock Using Acoustic Emission Energy. Eng. Fract. Mech. 2018, 194, 136–144. [Google Scholar] [CrossRef] [Scilit]
- Lin, Q.; Wan, B.; Wang, Y.; Lu, Y.; Labuz, J.F. Unifying Acoustic Emission and Digital Imaging Observations of Quasi-Brittle Fracture. Theor. Appl. Fract. Mech. 2019, 103, 102301. [Google Scholar] [CrossRef] [Scilit]
- Bisoi, A.K.; Mishra, J. On Calculation of Fractal Dimension of Images. Pattern Recognit. Lett. 2001, 22, 631–637. [Google Scholar] [CrossRef] [Scilit]
- Yao, K.; Chen, H.; Peng, W.L.; Wang, Z.; Yao, J.; Wu, Y. A New Method on Box Dimension of Weyl-Marchaud Fractional Derivative of Weierstrass Function. Chaos Solitons Fractals 2021, 142, 110317. [Google Scholar] [CrossRef] [Scilit]
- Whittaker, B.N.; Singh, R.N.; Sun, G. Rock Fracture Mechanics: Principles Design and Applications; Elsevier: Amsterdam, The Netherlands, 1992. [Google Scholar]
- Kachanov, L.M. Time rupture process under creep conditions. Izv. Akad. Nauk. SSSR Otd. Tekhnicheskich Nauk. 1958, 8, 26–31. [Google Scholar]

Disclaimer/Publisher’s Note: The statements, opinions and data contained in all publications are solely those of the individual author(s) and contributor(s) and not of MDPI and/or the editor(s). MDPI and/or the editor(s) disclaim responsibility for any injury to people or property resulting from any ideas, methods, instructions or products referred to in the content. |
© 2026 by the authors. Licensee MDPI, Basel, Switzerland. This article is an open access article distributed under the terms and conditions of the Creative Commons Attribution (CC BY) license.