


Abstract
This study investigates the extreme wave event that caused damage to the main breakwater at Chancay Port, Peru, on 24 August 2025 (the 824 event), through high-resolution nested numerical wave simulations. The research reveals the underlying mechanisms and causation of the damage. Results indicate that the extreme waves originated from a powerful storm in the Southern Pacific’s Roaring Forties around 20 August. The storm generated long-period swell that propagated to Chancay Port, resulting in significant wave heights of 4.2–4.4 m offshore, exceeding the 475-year return period design standard and ranking as the most severe wave event in the past 30 years. Localized modeling further demonstrates that the swells induced nonlinear transformations in front of the breakwater, with wave heights reaching up to 7 m along the structure and generating complex standing waves near the bend. Comprehensive analysis concludes that the damage was caused by the combined effects of this rare extreme remote swell and localized hydrodynamic interactions with the breakwater.
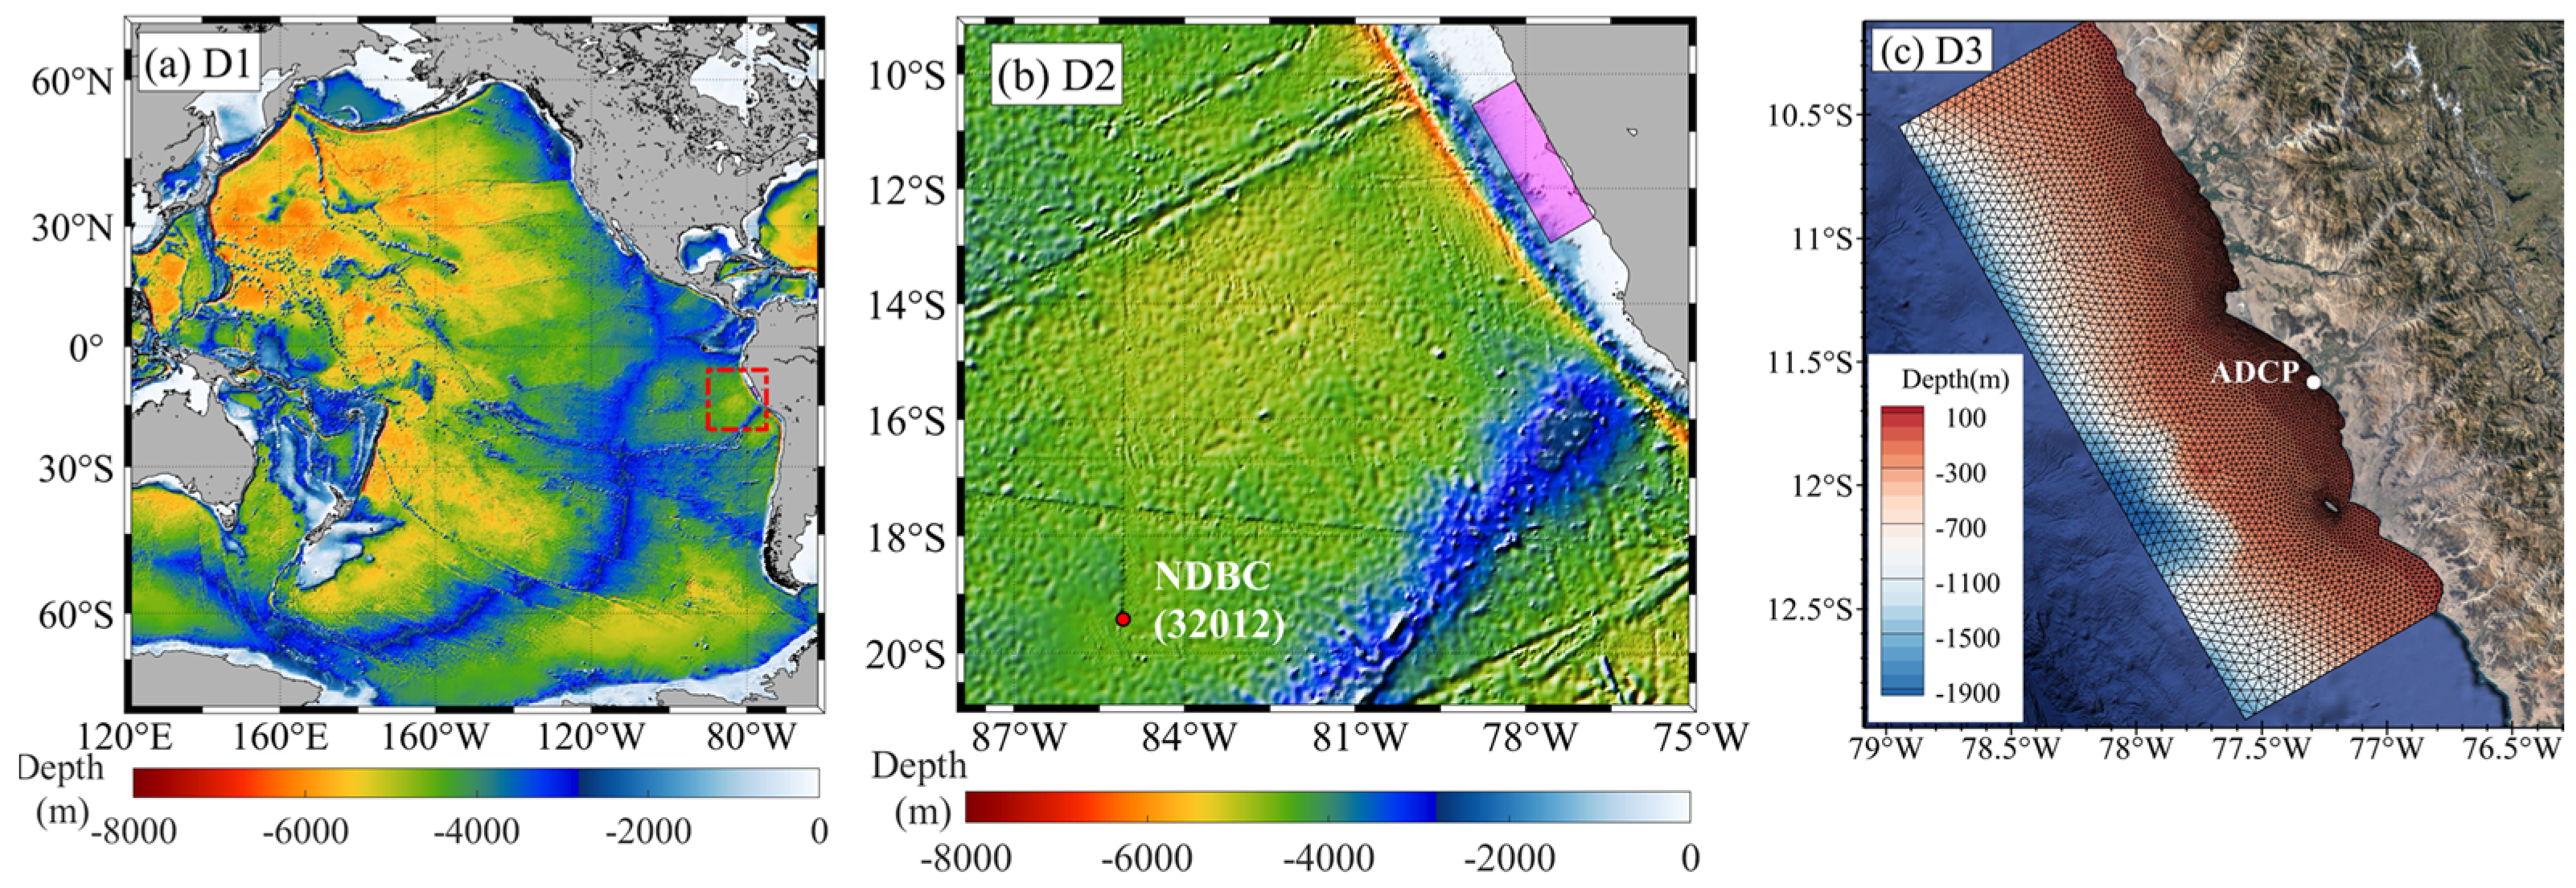
1. Introduction
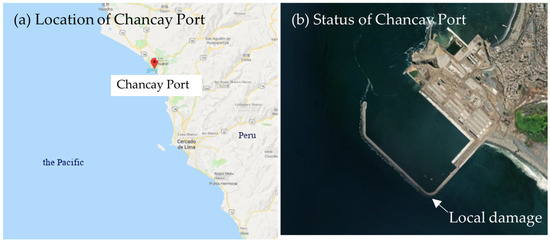
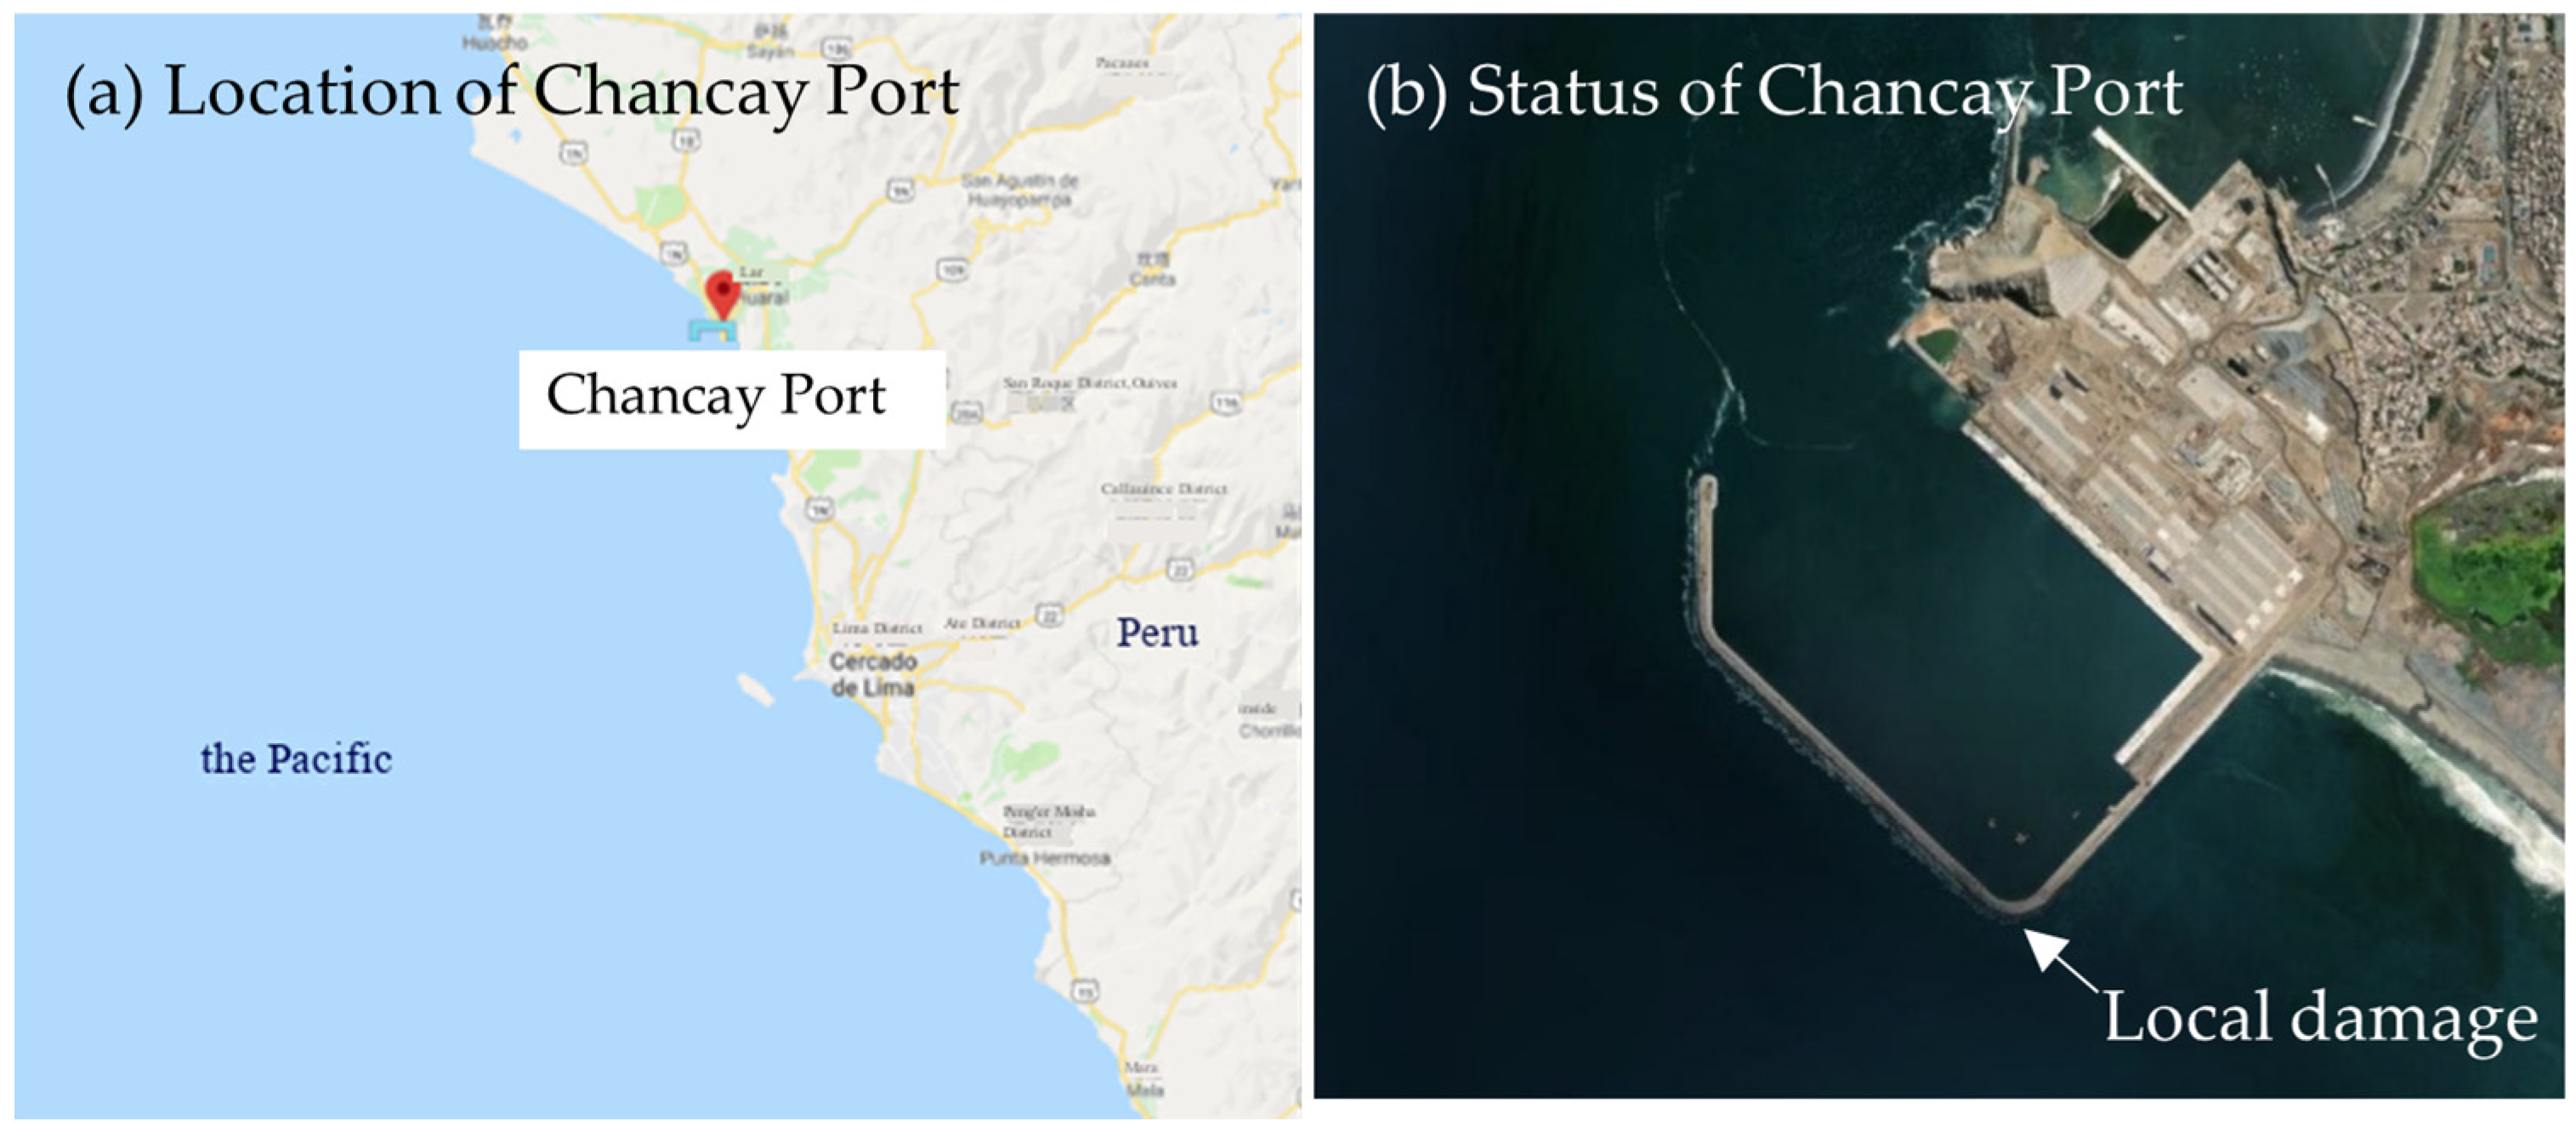
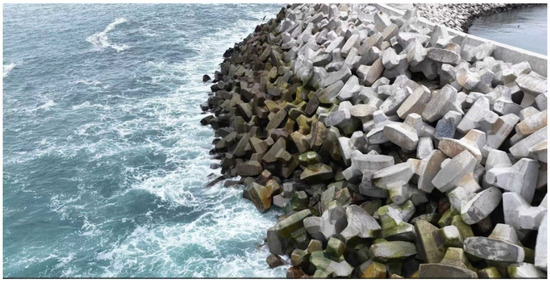
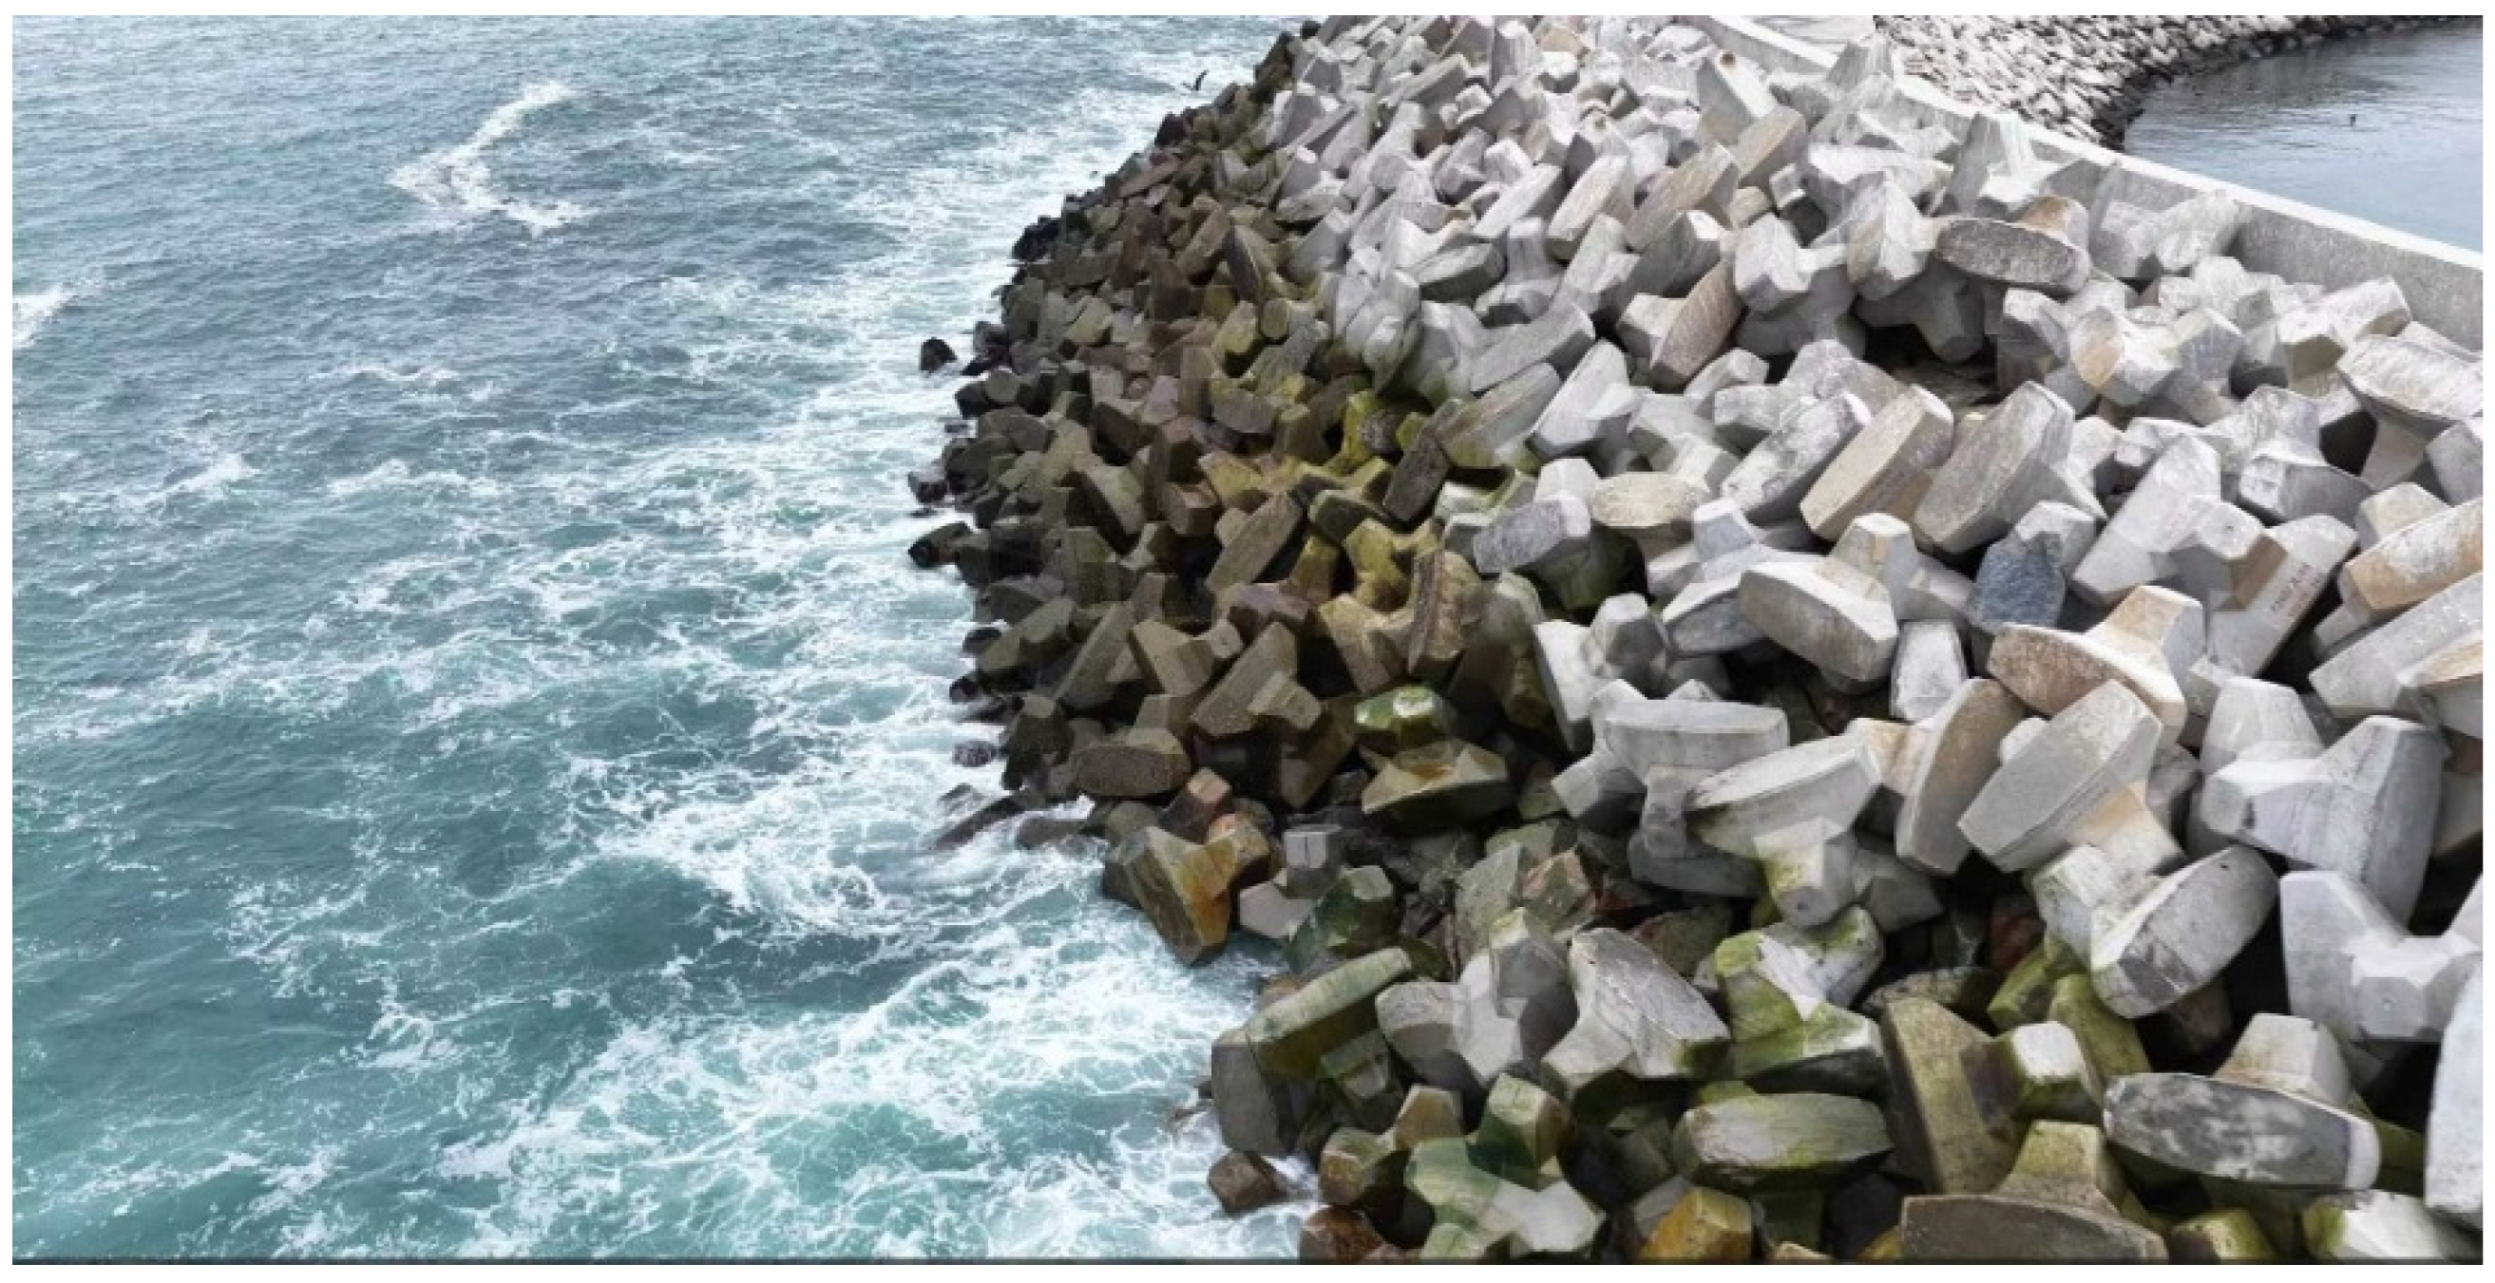
Chancay Port is located in the Lima Region of Peru, within the Chancay Bay along the Pacific coast of South America. As a pivotal hub port in Peru and Latin America as well as a gateway port to the Pacific Ocean, its geographical location and satellite map are shown in Figure 1. The sea area where Chancay Port is situated is frequently subjected to the impact of intense swells generated by the Southern Hemisphere westerlies, and is also affected by northwestward swells during the Northern Hemisphere winter [1,2]. A large-wave event occurred on 24 August 2025 (hereinafter referred to as the 824 Large-Wave Event). Under the influence of this event, the main breakwater of Chancay Port sustained a certain degree of damage, with dolosse in some local areas becoming detached, as illustrated in Figure 2. Understanding and reproducing such damage-inducing events requires linking offshore swell forcing, nearshore (harbor) transformations, and localized wave–structure interactions.
Figure 1.
Geographical Location and Engineering Status of Chancay Port.
Figure 2.
Current Condition of the Main Breakwater at Chancay Port (Photographed on 27 August 2025, depicting the turning point of the main breakwater indicated by the white arrow in Figure 1b).
Extreme and long-period wave processes relevant to port safety are usually studied from three linked perspectives: (i) offshore swell climate and long-distance propagation, (ii) harbor response (including low-frequency motions and resonance), and (iii) near-structure nonlinear transformation and wave–structure loading. This multi-perspective approach is essential for diagnosing the specific mechanisms of swell-driven breakwater damage observed at Chancay Port.
Regarding offshore forcing, swell generation and propagation can be interpreted through synoptic meteorological patterns and remote-source connections. Studies in the Indian Ocean have quantified swell propagation routes and related meteorological drivers for high-swell events, which supports a physics-based understanding of long-travel swell arrival timing and persistence [3]. In operational and hindcast applications, third-generation spectral models (e.g., WAVEWATCH III, WW3) are widely adopted to reproduce regional wave fields, including swell-dominated conditions. Such spectral-model-based reconstructions are commonly used as offshore boundary conditions for nearshore high-resolution models [4,5]. For example, WW3 has also been assessed for coastal infragravity (IG) waves (and their spectra) and for long-term IG energy estimation over broad regions, although limitations remain nearshore or inside harbors where local mechanisms and complex boundaries become important [6,7]. Whereas spectral models (e.g., WW3) provide robust global-to-regional swell reconstruction, they cannot resolve phase-dependent reflection/diffraction and standing-wave patterns near breakwaters. Conversely, phase-resolving nonlinear models can diagnose these local processes but require realistic offshore forcing as input.
In partially enclosed harbors, the hydrodynamic response is governed by eigen characteristics, such as natural periods and modal structures. When incoming long waves excite these resonant modes, the resulting harbor oscillations can produce strong currents and ship motions, even if sea-level oscillations remain modest [8,9]. Recent studies at real ports have demonstrated that low-frequency oscillations within harbors are often dominated by eigen oscillations rather than directly mirroring offshore short-wave frequencies. An extended mild-slope model has been used to identify natural modes and interpret observations [10]. Alongside modal interpretation, hybrid approaches have been proposed to rapidly estimate wave height inside harbors from offshore parameters, including combining fully nonlinear Boussinesq simulations with machine learning (ANN) or interpolation technique to reduce the computational burden for repeated applications [6,11,12]. Nonlinear behavior in harbor resonance has also received attention: numerical studies using fully nonlinear Boussinesq models have revealed case-dependent nonlinear stiffness and hysteresis in harbor oscillations, highlighting that resonance characteristics can shift with response amplitude and history, which is relevant when ports are impacted by energetic swell conditions [13].
Near breakwaters and other complex coastal structures, nonlinear wave transformations, including shoaling, refraction–diffraction, reflection, and standing-wave formation, become critical for diagnosing local extremes that may trigger structural damage. Although many existing studies emphasize harbor resonance properties [10,13,14], fewer works explicitly resolve the cross-scale chain from basin-scale swell reconstruction to high-resolution near-structure free-surface evolution associated with standing waves and local amplification at breakwater turning sections. Meanwhile, the potential structural consequences of extreme wave conditions are well recognized in coastal engineering: large-scale experiments and analyses have documented violent breaking-wave impacts and associated impulsive loads on vertical and sloping walls, with strong variability in peak pressure but more robust scaling for impulse and momentum flux [15], and subsequent works have provided practical formulations for quasi-static and impact loads on breakwaters and their overturning moments [16]. Recent research on armor-layer stability indicates that swell waves can cause delayed yet widespread displacements due to diffraction and complex hydrodynamics, particularly at roundhead sectors [17]. These findings underscore that localized wave-field amplification near complex breakwater geometry can be a key precursor to damage, which motivates resolving standing-wave patterns near the turning section in this study.
While previous studies have examined extreme wave events at various ports, many have focused primarily on either the generation of long-period swells or their effects on nearshore wave heights, often without fully addressing the nonlinear wave transformations occurring near breakwater structures.
The motivation of this work is to provide a reproducible numerical reconstruction and near-breakwater diagnostic basis for interpreting rare remote-swell damage events at Chancay Port and for informing risk assessment in similar swell-exposed ports. Therefore, this study provides a detailed cross-scale analysis of the 824 Large-Wave Event. It should be noted that the work focuses on simulating the extreme wave field and its spatial amplification near the breakwater. Quantitative structural response or armor-unit stability analysis is beyond the scope of this paper. The primary objective is to reconstruct the event’s hydrodynamic conditions and characterize the near-breakwater wave field, with particular emphasis on standing-wave patterns at the breakwater turning section that may help explain the observed spatial concentration of damage. These results provide the engineering-relevant information intended to achieve the above motivation.
The structure of this article is as follows: Section 2 introduces the regional wave reconstruction using WW3. As a third-generation spectral model, WW3 is utilized here to simulate wave generation and propagation by solving the wave energy spectrum balance equation, allowing for an evaluation of the event’s historical rarity. Section 3 establishes global and local port models using MIKE21-BW. Based on the Boussinesq equations, this stage focuses on the nonlinear transformation and distribution of wave parameters (e.g., significant wave height and free surface elevation) near the structure. Finally, Section 4 analyzes the causes of damage to the main breakwater based on the simulation results.
2. Nearshore Wave Simulation
2.1. Spectral Wave Model Setup
The wave energy at Chancay Port originates from the entire Pacific Ocean; therefore, it is difficult to accurately reflect its actual wave characteristics by only modeling the local sea area. To obtain reliable wave process data in the engineering water area, it is necessary to adopt a high-resolution numerical model that can effectively simulate the entire process of wave propagation from the deep sea to the nearshore. Although the ERA5 reanalysis data from the European Centre for Medium-Range Weather Forecasts (ECMWF) [18] can provide global wave parameters, its spatial resolution is 0.25°, which makes it unable to accurately depict key physical processes such as wave shoaling and refraction caused by topography in the nearshore region. Considering that the 824 Large-Wave Event was not caused by storms in the vicinity of Chancay Bay, previous analyses have shown that the waves in the sea area of Chancay Bay, Peru, are mainly swells generated by the westerlies in the high-latitude regions of the South Pacific and propagated over long distances [2,19].
This study adopts the WAVEWATCH III (WW3) wave spectral model developed by the National Oceanic and Atmospheric Administration (NOAA) of the United States [20]. As one of the most widely used third-generation spectral wave models worldwide at present, WW3 is designed for the numerical simulation and forecasting of ocean wave evolution processes. Based on the wave energy spectrum theory, it describes surface waves as a two-dimensional energy spectrum distribution over frequency and direction, enabling it to comprehensively reflect the mechanisms of wave generation, propagation, and dissipation. Developed and maintained by the Environmental Modeling Center (EMC) of NOAA, the model has undergone continuous iterations since the 1990s and now evolved into a flexible and scalable open-source system. The core equation of WW3 is the wave energy spectrum balance equation, which mainly accounts for three categories of physical processes: wind energy input, nonlinear three-wave or four-wave interactions, and dissipation mechanisms such as wave breaking and bottom friction [21,22]. With these physical parameterization schemes, the model can realistically simulate wind waves, swells, and their mutual interactions. In terms of spatial computation, WW3 employs the finite difference method and supports both global and regional grids. It is compatible with regular latitude–longitude grids, as well as curvilinear coordinates or unstructured triangular grids, thus adapting to complex coastlines and shallow-water topographies. WW3 is widely used by NOAA and other international institutions for global and regional ocean wave forecasting, climate research, storm surge and typhoon process analysis, as well as offshore engineering design and safety assurance [23,24].
WW3 is a third-generation spectral wave model that solves the wave action balance equation. In the presence of ambient currents, the action density (rather than energy) is conserved, and WW3 therefore uses the action density spectrum N as the prognostic variable:
The governing equation is written as the conservation of N with parameterized source/sink terms S:
The source term S parameterizes wave growth, nonlinear transfers, and dissipation. In deep water, it is commonly decomposed as
representing wind input (), nonlinear wave–wave interactions (), and dissipation (). In nearshore applications, additional source terms may be included (e.g., bottom friction, depth-induced breaking, triad interactions, and scattering), giving
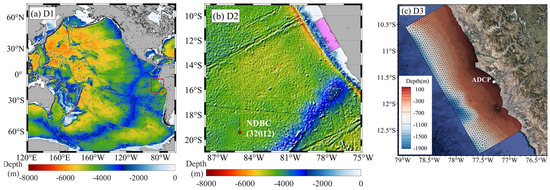
The numerical wave model established for the offshore area of Chancay Port adopts a three-level nested grid system (D1–D3), and the scope of the computational domain is shown in Figure 3. Among them, the D1 model is a Pacific-wide model with a grid resolution of 0.5°. The D2 model is a regional model covering the Peruvian sea area, with the grid resolution increased to 0.1°. Bathymetry data are sourced from the ETOPO1 dataset, developed by the National Oceanic and Atmospheric Administration (NOAA), with a 1 arc-minute resolution. Shoreline data are extracted from the Global Self-consistent, Hierarchical, High-resolution Shoreline (GSHHS) database. Wave propagation in the structured grids is modeled using the third-order Ultimate QUICKEST scheme.
Figure 3.
Computational Domains of the Multi-Nested Model: (a) Pacific Ocean Model, (b) Peruvian Sea Area Model, (c) Chancay Bay Nearshore Model.
The D3 model is a nearshore model for Chancay Bay, constructed using unstructured grids with a resolution of the order of 100 m, so as to accurately simulate the nearshore wave processes. Shoreline data are retrieved from Google Maps (2024) and bathymetry from the ETOPO1 dataset. Wave propagation in the un-structured grids is modeled using the explicit CRD-N scheme.
The model is driven by wind fields from the ERA5 reanalysis [18], on a regular latitude–longitude grid at 0.25° resolution. The wave spectrum is discretized into 32 frequencies, exponentially ranging from 0.0373 Hz to 0.7159 Hz with 1.1 geometric progression. Model D1 uses 24 wave directions, while models D2 and D3 employ 36 directions, respectively. The numerical time step follows the Courant Friedrichs Levy (CFL) stability criterion. The computation is sped up by the parallelization method of OpenMP.
The model implementation used in this study employed explicit parameterizations for the main source and sink processes in the spectral balance. Wind input and white-capping dissipation were treated with a combined wind-input/whitecapping scheme (switch: ST4) [21]. Nonlinear quadruplet interactions were represented using the standard discrete interaction approximation (switch: NL1) [22], while triad (three-wave) interactions appropriate for shallow-water energy transfer were enabled (switch: TR1) [25]. Bottom friction was included via a depth-dependent friction formulation (switch: BT1) [26], and depth-induced breaking was parameterized with a breaking formulation suitable for coastal applications (switch: DB1) [27]. Unless otherwise stated, WAVEWATCH III is run using the standard, recommended default parameter settings, and no tuning or calibration of source-term coefficients (including whitecapping) is performed in this study.
2.2. Spectral Wave Model Validation
To ensure the high-resolution nested model can accurately capture wave transformation in the complex nearshore topography of Chancay Port, a comprehensive validation is performed using both global reanalysis data and in situ observations. Wave parameters from the ERA5 reanalysis archive (provided by ECMWF), with a spatial resolution of 0.25°, are linearly interpolated to the specific coordinates of the study area to serve as a baseline for the validation. This step is essential for evaluating the necessity of nested modeling and for assessing how local parameterization schemes improve upon global datasets.
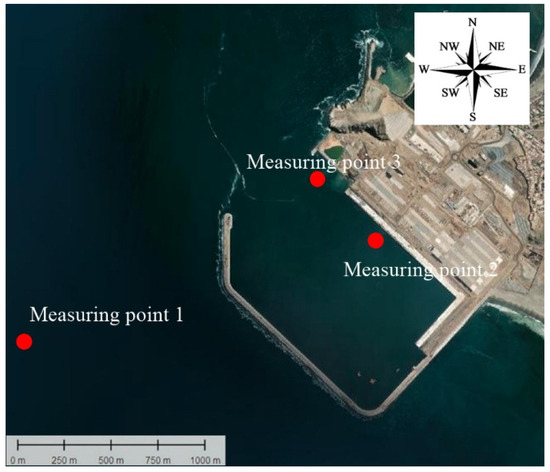
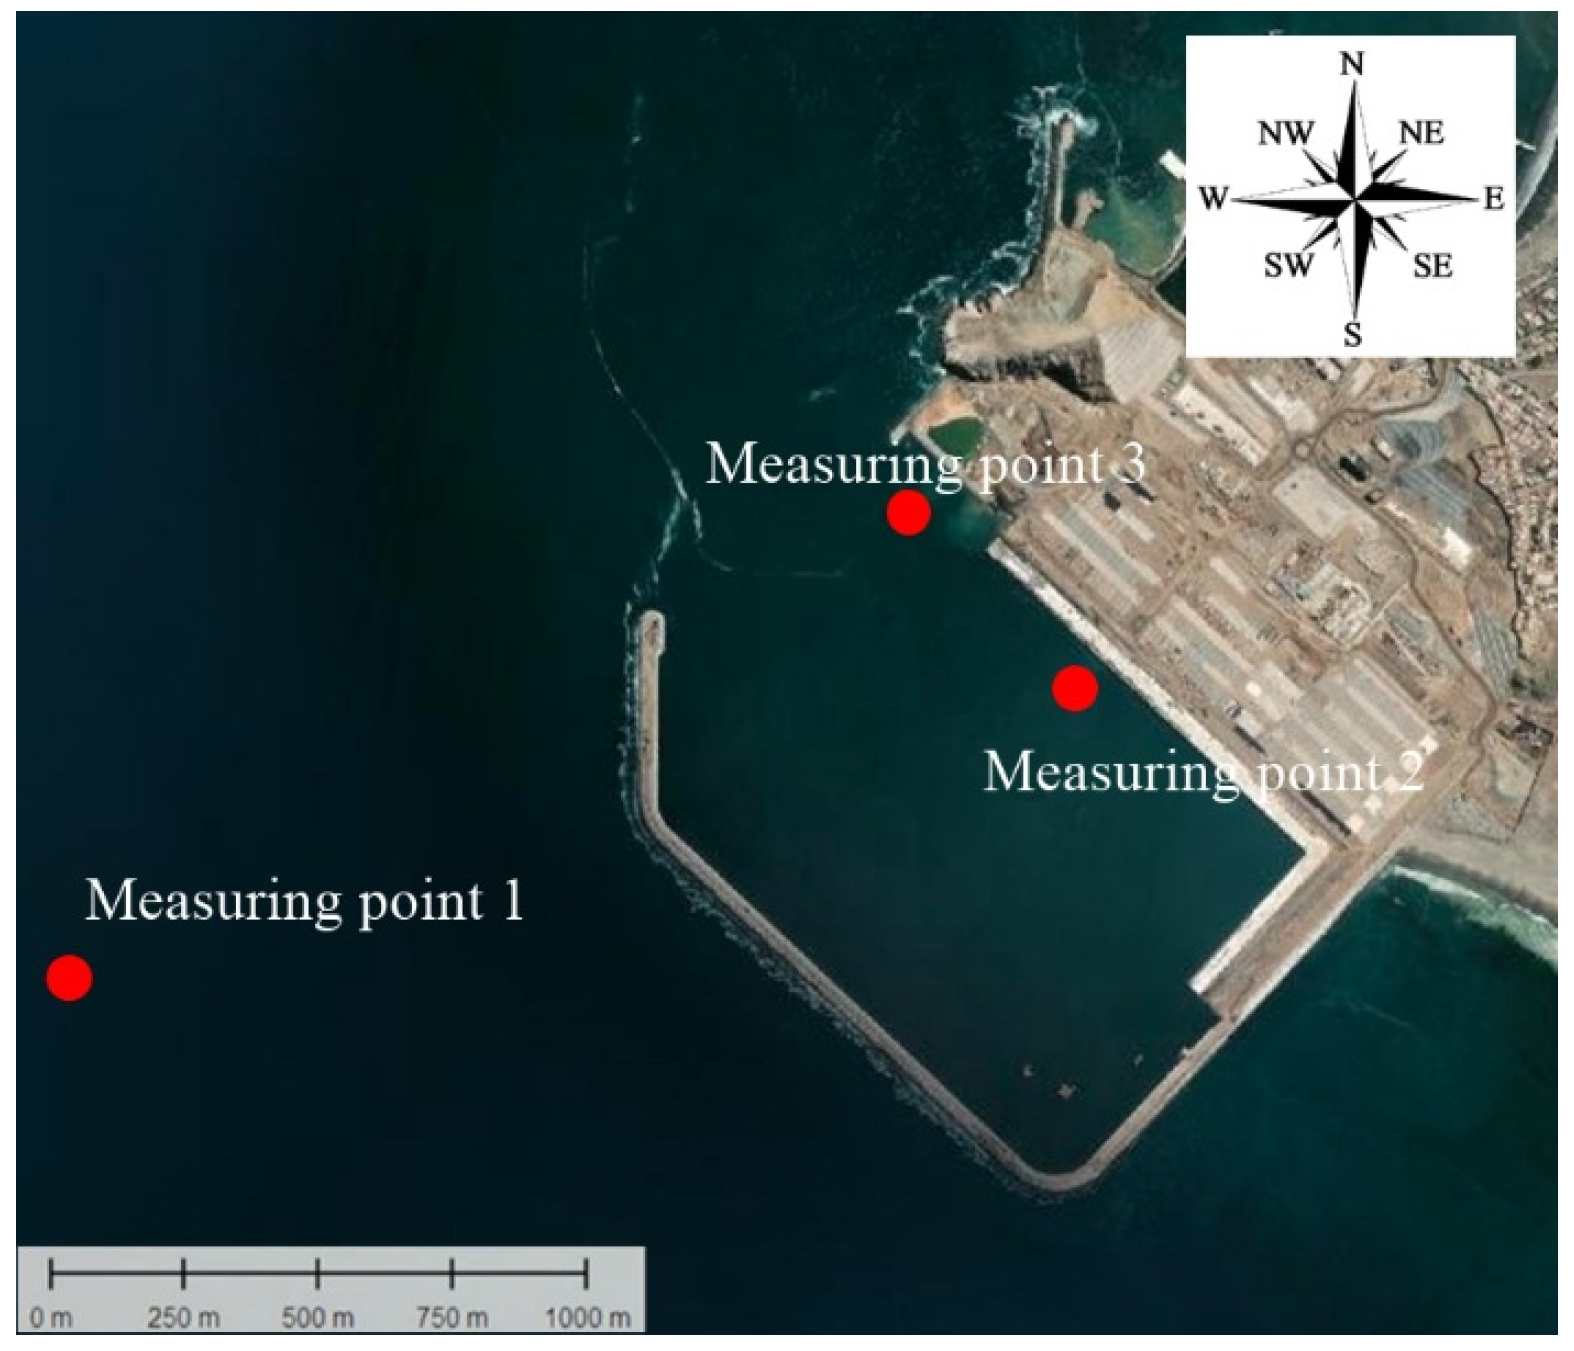
To assess the impact of local wave conditions on the construction and operation of the Chancay Port project, an in situ wave observation campaign was conducted in the port waters from 24 May 2024 to 18 January 2025. The deployment included three observation stations, as illustrated in Figure 4. Station 1 was positioned to collect offshore wave parameters, while Stations 2 and 3 were designated for acquiring data within the port area. These measured datasets provide the ground truth for verifying the model’s applicability in this specific study area.
Figure 4.
Schematic Diagram of Wave Observation Stations Locations Inside and Outside the Port in 2024.
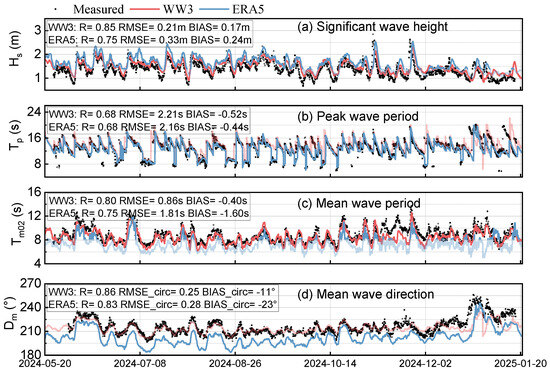
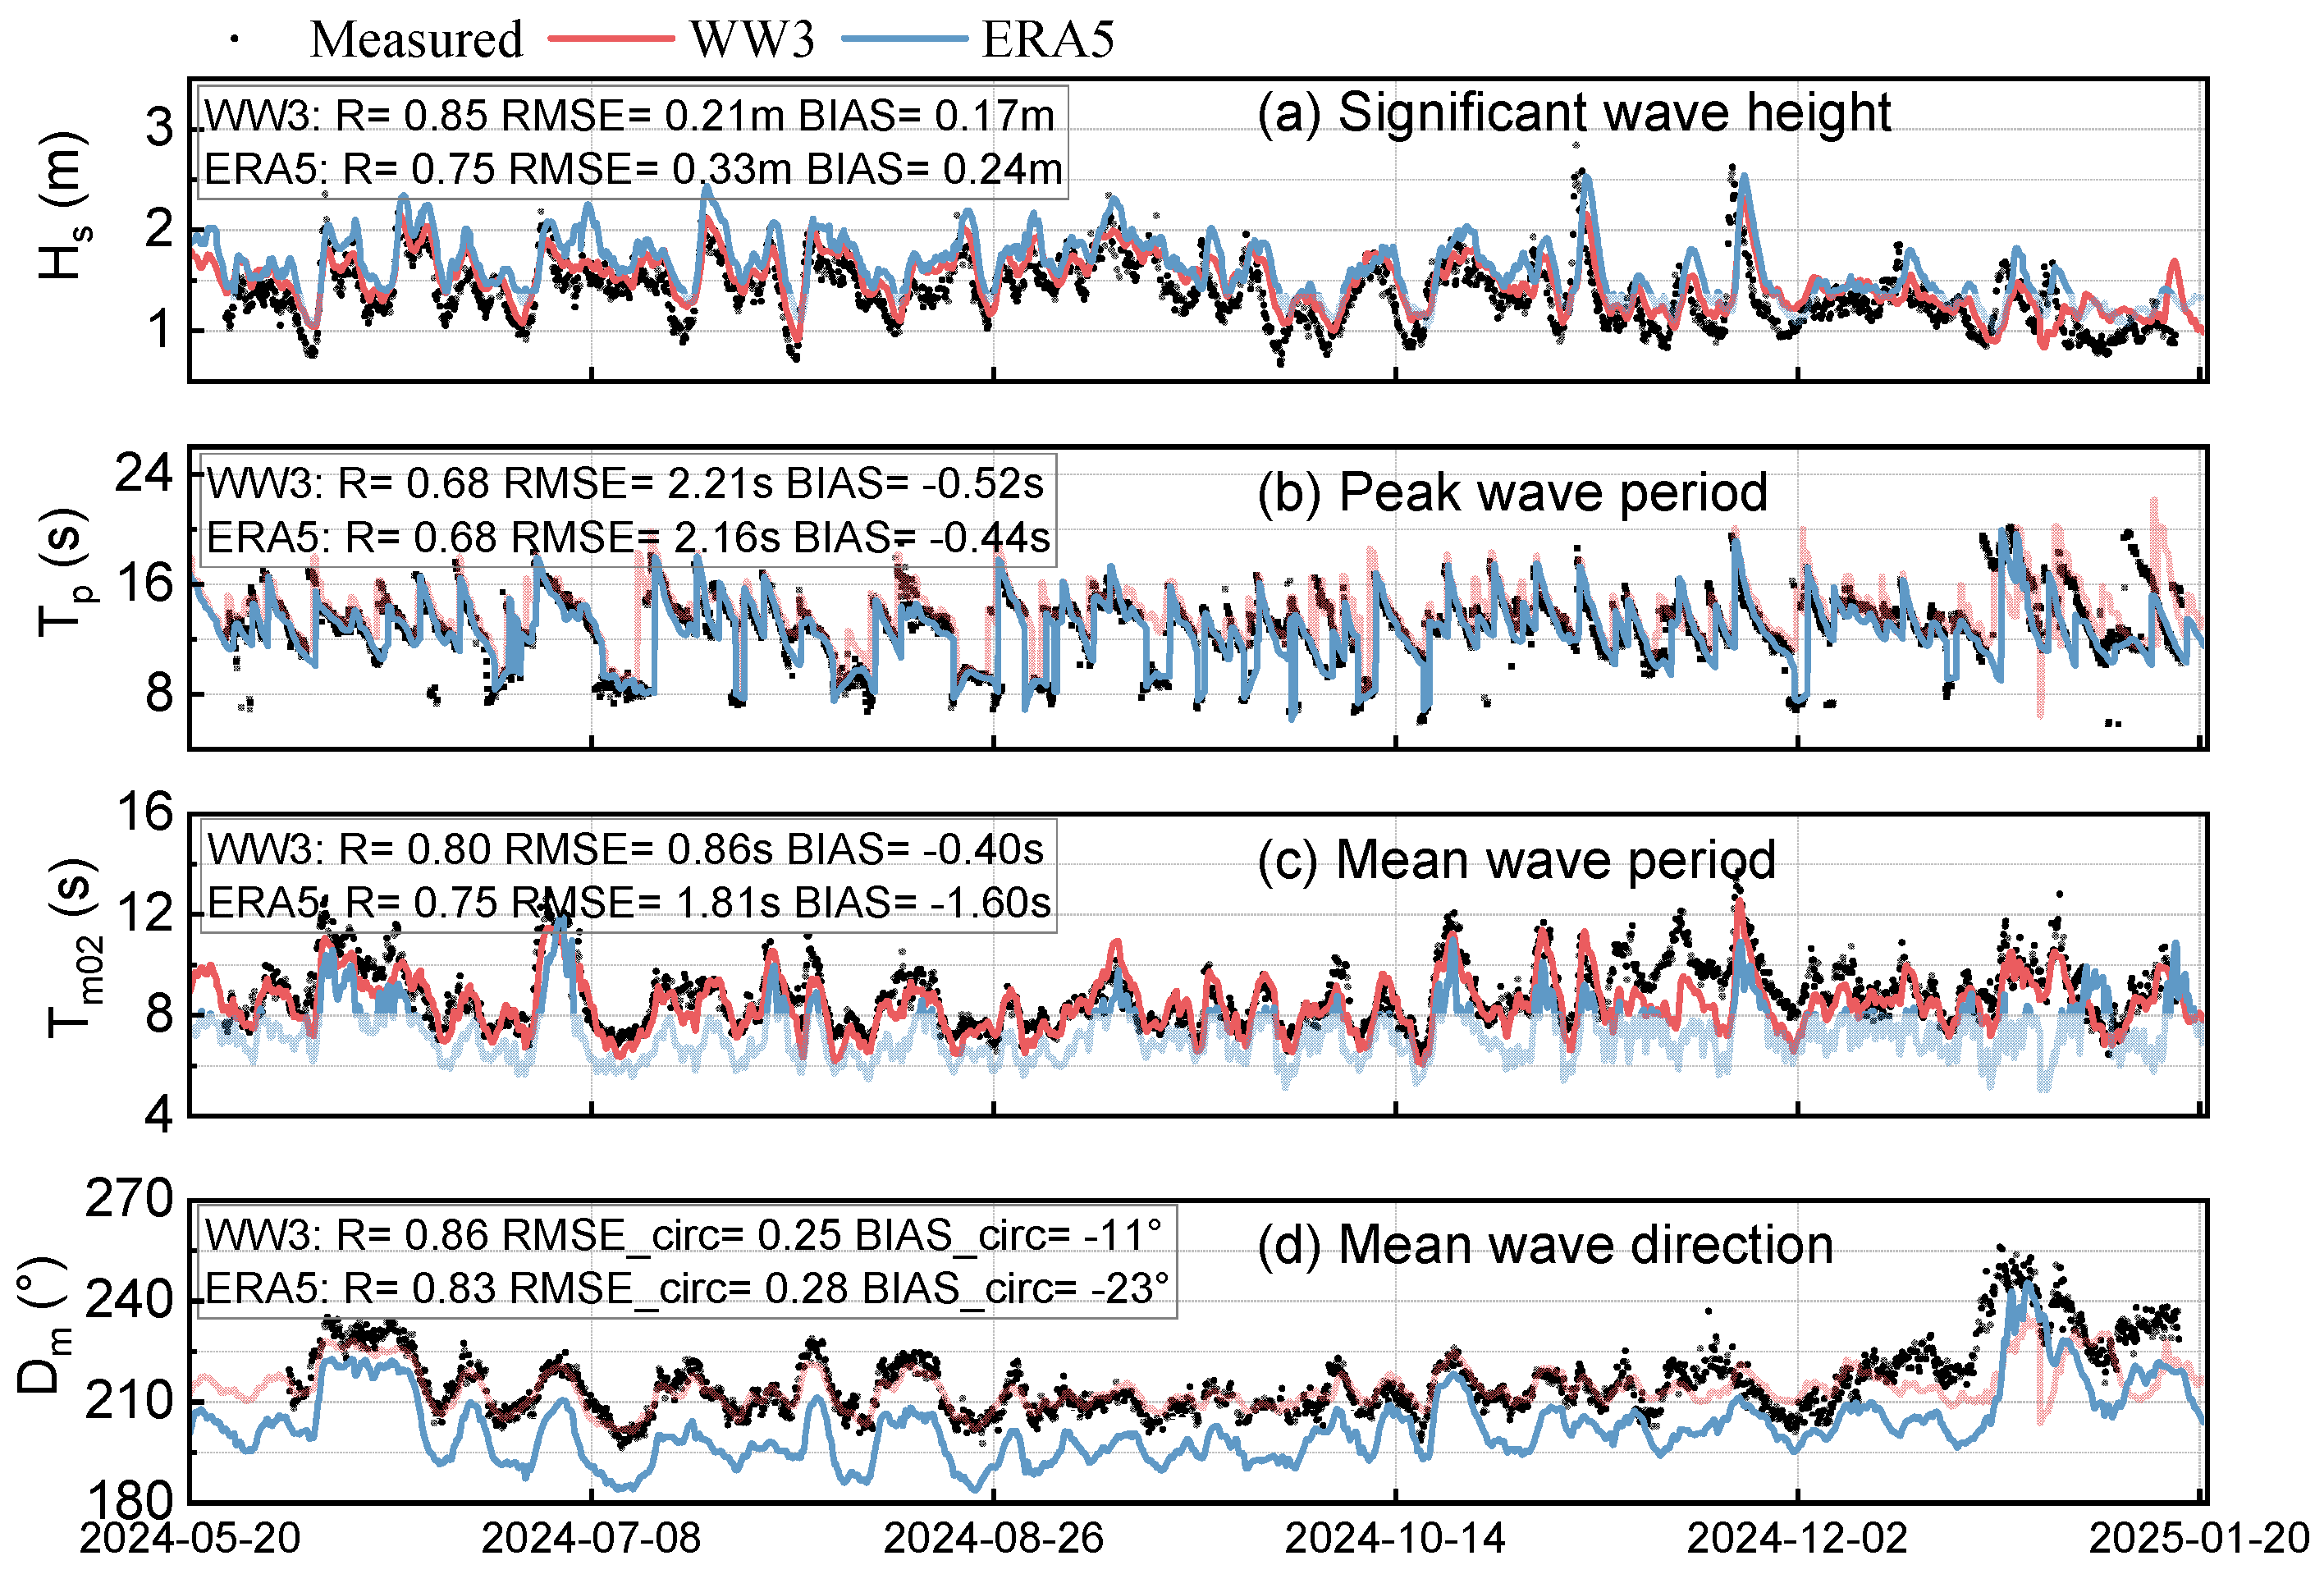
Figure 5 presents the comparison among in situ measurements, ERA5 reanalysis data, and the nested WW3 simulation results at Station 1. While both ERA5 and WW3 capture the overall seasonal trends, the nested WW3 model shows significantly higher fidelity to the measured data. Quantitatively, the WW3 simulation demonstrates superior performance, particularly in correcting the biases found in the ERA5 source regarding wave height and direction. The high consistency between the simulation and observations confirms that the nested grid effectively accounts for local bathymetric effects and shallow-water transformations.
Figure 5.
Comparison of wave parameters among in situ measurements, WW3 simulations, and ERA5 reanalysis at Observation Station 1 (24 May 2024–20 January 2025).
Overall, the validation results demonstrate that the established WW3 model and its parameterization schemes can reliably reproduce the wave climate characteristics adjacent to Chancay Port. This provides a credible foundation for the subsequent analysis of the 824 Large-Wave Event, for which direct in situ measurements were unavailable.
2.3. Simulation Results of Nearshore Waves During the 824 Event
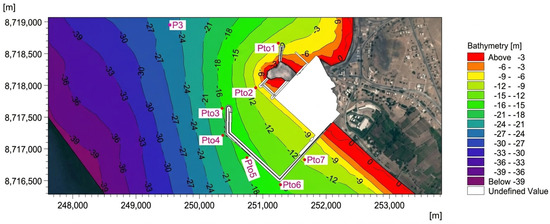
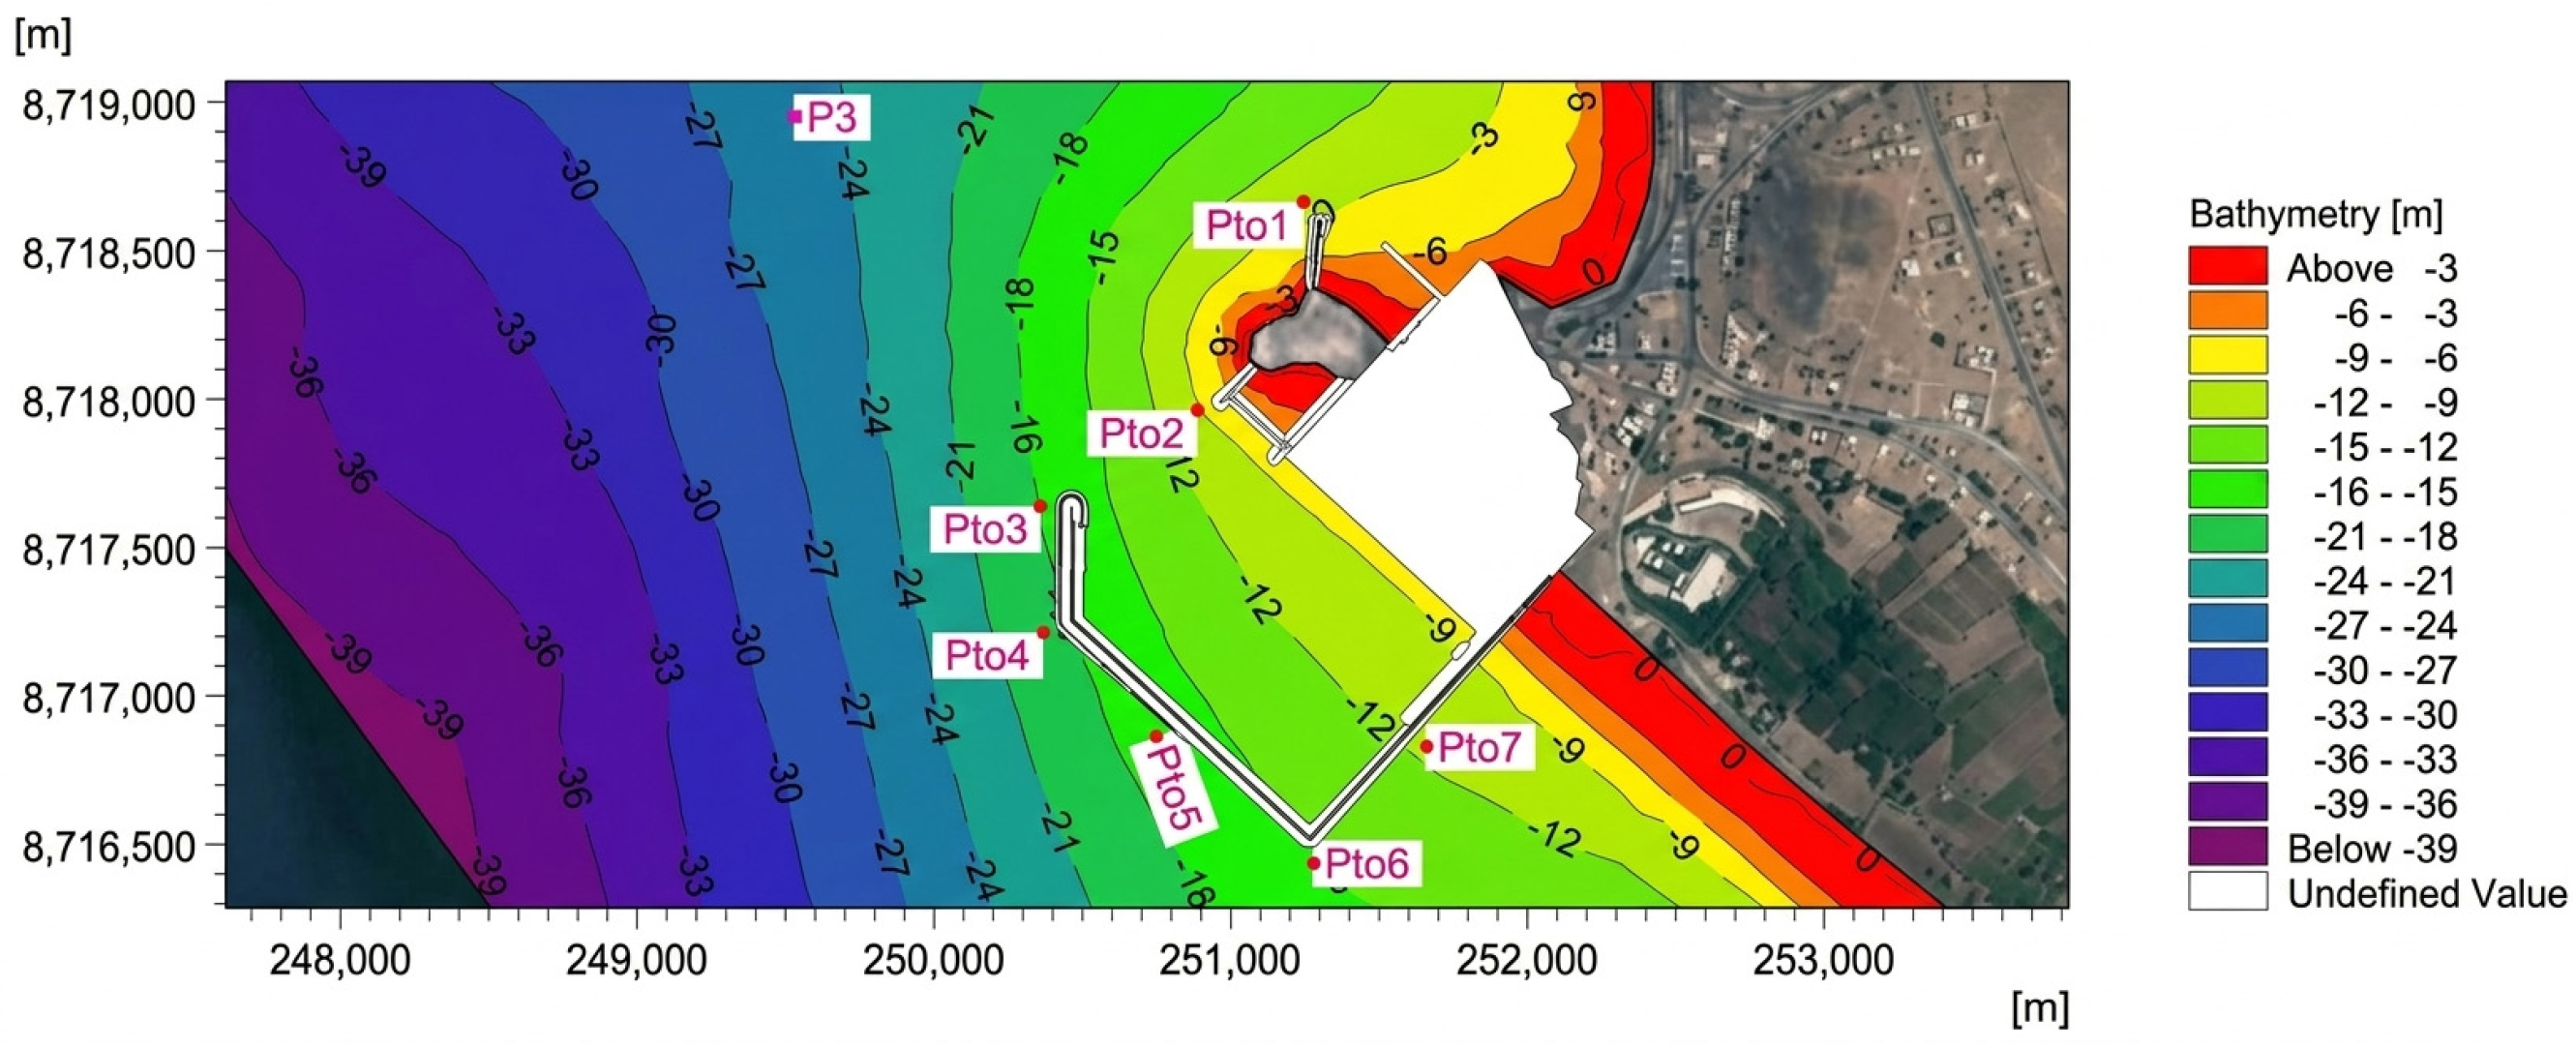
Using the fully validated WW3 wave numerical model, large-scale wave numerical simulations were carried out, yielding the temporal evolution of wave parameters in the sea area of Chancay Port from 20 to 28 August. To ensure the research is aligned with the project’s engineering standards, we selected the same output stations as those defined in the PRDW Wave Report [28], a pre-construction wave climate study commissioned by the port developer and conducted by PRDW (an international engineering consultancy). Figure 6 illustrates the bathymetry of the port area and the layout of the output stations in PRDW Wave Report [28]. It can be observed that stations Pto3 to Pto7 are strategically positioned in the vicinity of the main breakwater. Specifically, Pto3 and Pto4 are located in the relatively deeper waters seaward of the structure. This article focuses on the analysis of Stations Pto3 to Pto7, which are distributed around the main breakwater.
Figure 6.
Schematic Diagram of Offshore Output Point Locations from the PRDW Wave Report. Analysis in This Article Focuses on Measurement Stations Pto3 to Pto7 Surrounding the Main Breakwater.
It should be noted that the wave spectral model (WW3) adopted in this simulation has an extensive computational domain. Even the nearshore model with the highest resolution (D3) cannot reasonably simulate the complex effects of wave reflection, diffraction, and breaking induced by the constructed breakwater. Therefore, the results obtained from the current simulation only represent the pure incident wave conditions. This setup is also intended to maintain a consistent comparison baseline with the results of the PRDW Report, which similarly did not take the breakwater effects into account when calculating the multi-year return period wave heights based on the MIKE21-SW model. The impacts of the breakwater on the wave field will be specifically considered in subsequent numerical simulations based on the Boussinesq model.
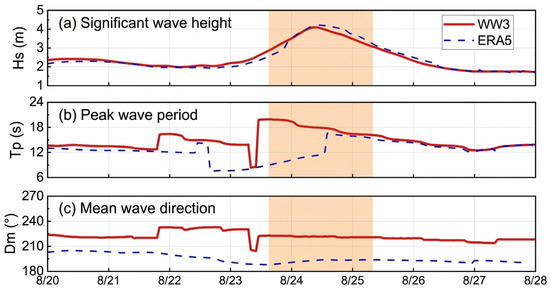
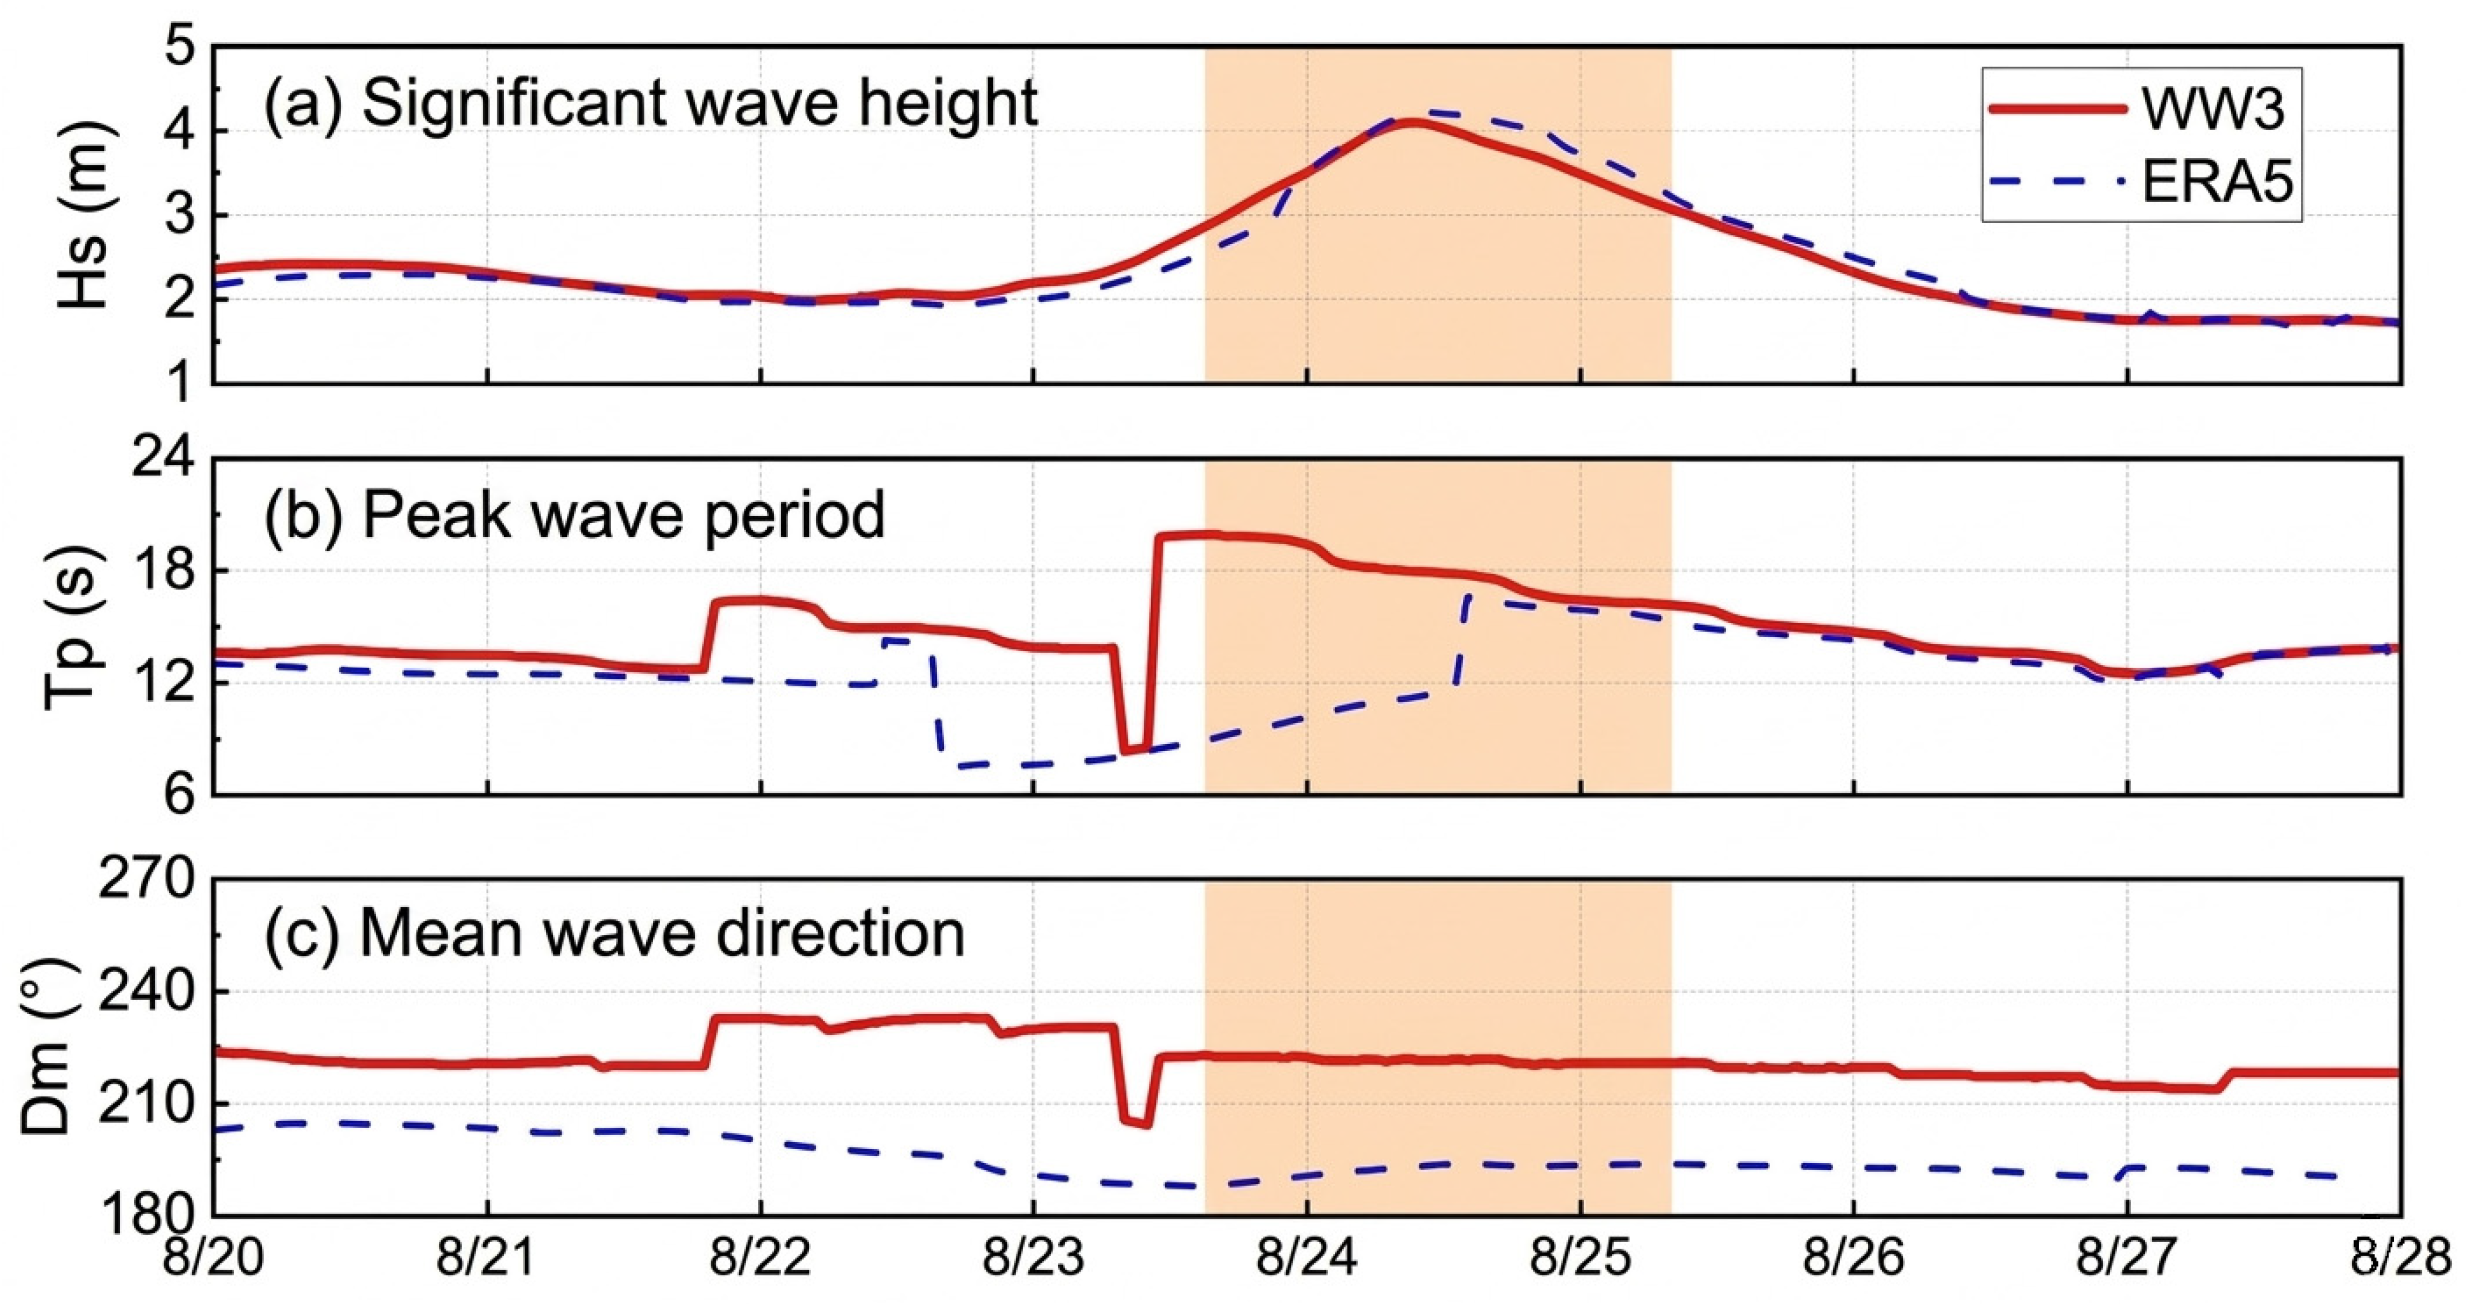
The time history curve of significant wave height at Station Pto4 from 20 to 28 August is illustrated in Figure 7. It can be seen that the wave height remained relatively stable between 2.0 and 2.5 m before 23 August. However, during the period from 23 to 25 August (the highlighted area in the figure), the wave height increased rapidly and reached the peak value at 9:00 a.m. on 24 August. The mean wave direction indicates that this large-wave event was a severe swell propagating from the westerlies in the South Pacific. The wave heights at each station corresponding to the 824 Large-Wave Event and their comparison with the multi-year return period wave heights in the PRDW Report are presented in Table 1. At Stations Pto3 to Pto7, the wave heights of the 824 event all exceeded the standard of the 475-year return period, which demonstrates that this was an extremely rare and unprecedentedly severe catastrophic event.
Figure 7.
Time Series of WW3-Simulated Wave Parameters at Measurement Station Pto4.
Table 1.
Comparison of 824 Wave Heights with PRDW Return Period Wave Heights.
2.4. Source Analysis of the 824 Large-Wave Event
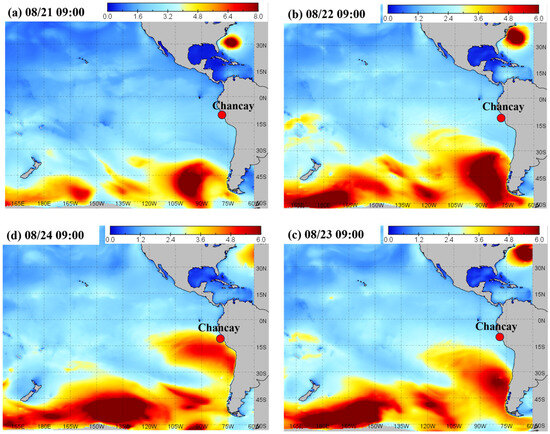
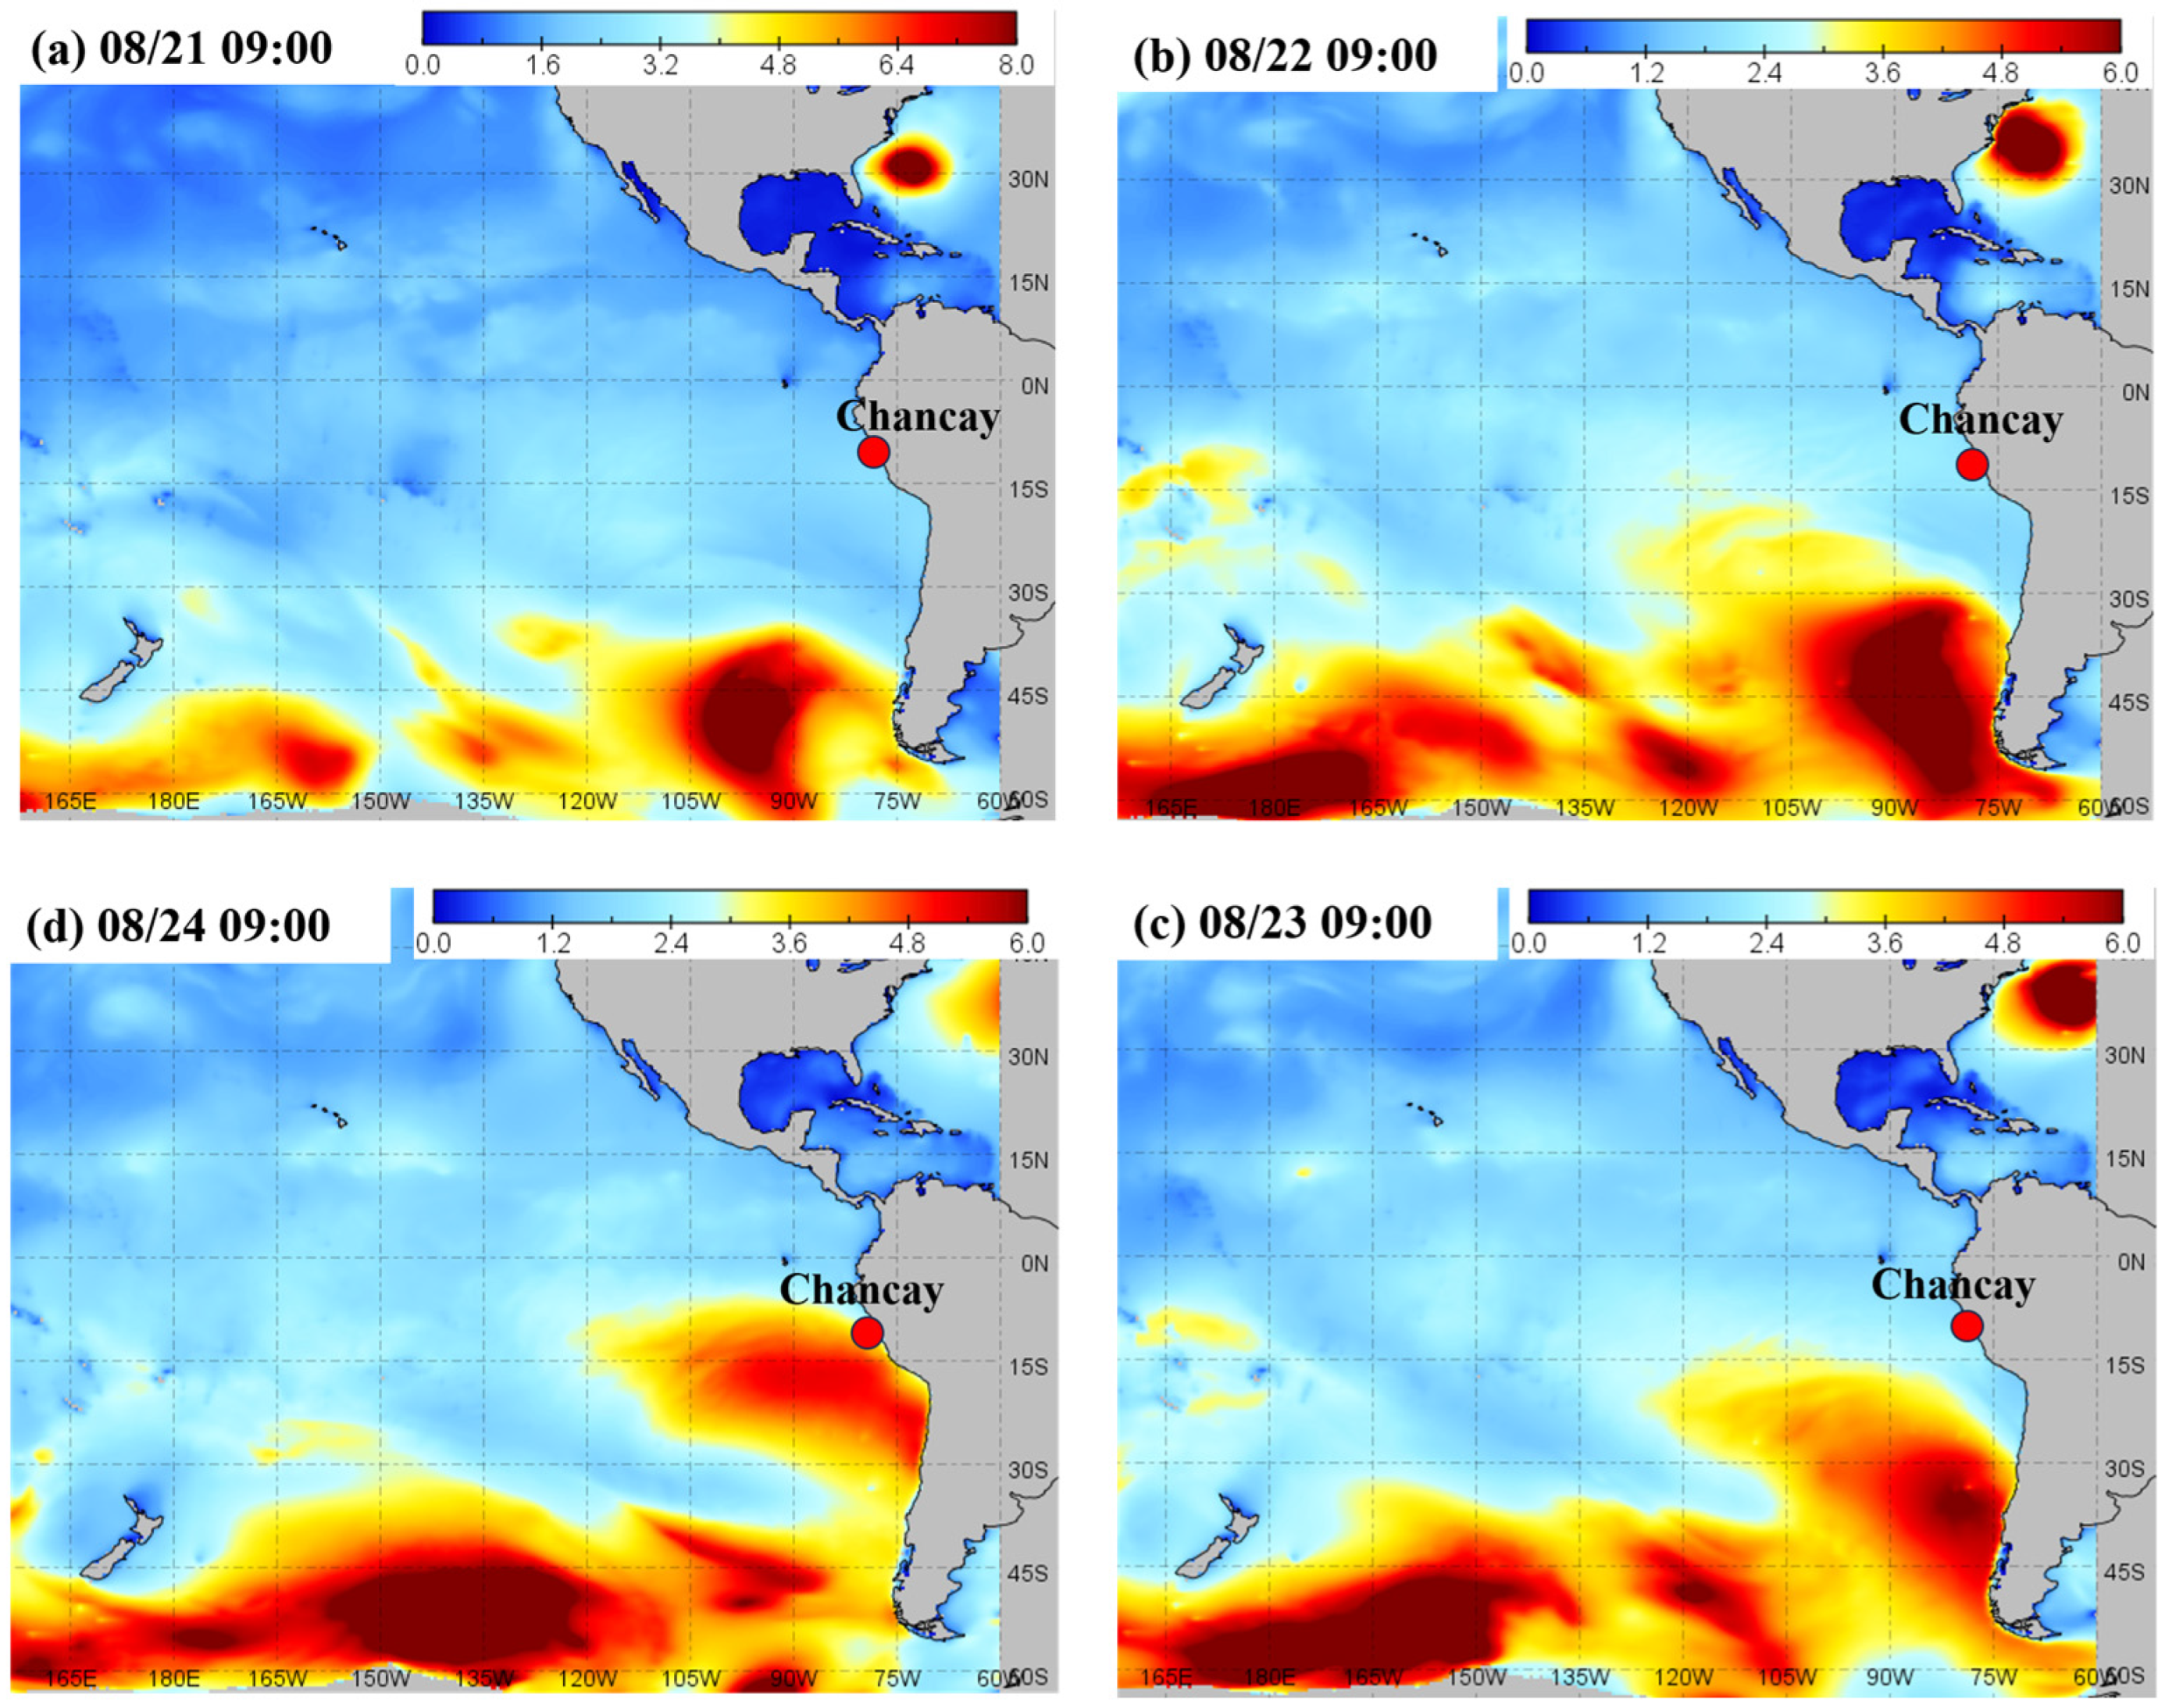
A source-tracking analysis is conducted on the 824 Large-Wave Event to clarify the physical processes of its generation and propagation. This not only helps us understand the patterns of such extreme events, but also provides a scientific basis for ports to respond to similar severe swells propagated over long distances. Figure 8 illustrates the generation and propagation process of the 824 Large-Wave Event to Chancay as simulated by the WW3 model. The event originated from an intense storm that occurred in the roaring forties of the South Pacific around 20 August. The significant wave height in the storm core region exceeded 10 m, and the wind field featured a broad spatial scale and long duration, providing sufficient energy conditions for the generation of long-period waves. As the storm system gradually moved eastward, the high-energy waves generated thereby transformed into swells propagating northward after leaving the wind field, and traveled freely for thousands of kilometers across the South Pacific. The WW3 simulation results show that this energy-concentrated swell continued to spread over the eastern Pacific Ocean south of the equator from 21 to 23 August, and reached the coast of Chancay, Peru on the morning of 24 August, with the significant wave height ranging from 4 to 5 m.
Figure 8.
Schematic Diagram of the Generation and Propagation of the 824 Large Wave to Chancay.
It should be pointed out that intense storm activities occur in the roaring forties almost all year round, but not all storms can generate severe swells capable of reaching Peru. The occurrence of this event relied on the perfect matching of the storm’s location, movement path, wind field persistence and wave propagation route. According to the simulation results, although intense storms still occurred in the westerlies after 24 August, their wave energy failed to effectively form severe swells propagating toward Peru. This indicates that only when the storm center is in an appropriate location and the wind direction is properly oriented can long-distance severe swell events that exert significant impacts on the coast of Peru take shape. This “screening” mechanism means that although such events are triggered by the year-round active westerlies, the extreme swell events that can reach Peru are inherently low-probability and accidental in nature.
2.5. Analysis of Wave Height Trends in Chancay Bay over the Past 30 Years Based on ERA5 Data
In order to reconstruct the decadal wave environment at Chancay, we extracted 30 years of significant wave height data for the Peruvian waters from the ERA5 reanalysis archive. These data were subsequently linearly interpolated to the specific coordinates of the offshore measurement station (Pto4). The interpolated results of ERA5 are compared in Figure 7, and the results show that ERA5 can well reflect the variation trend of significant wave height, but its prediction accuracy for spectral peak period and mean wave direction is significantly lower than that of the WW3 model. Particularly in terms of wave direction, the simulation of ERA5 has a large deviation, characterized by a systematic southward bias (with the maximum difference from WW3 reaching 30°). This error is mainly attributed to the relatively low spatial resolution of ERA5, which makes it difficult to accurately depict the wave refraction process in the nearshore region. Considering that the wave response inside the port is extremely sensitive to wave direction—the more westerly the wave direction, the poorer the sheltering effect of the breakwater—the above-mentioned deviation further highlights the necessity of using the WW3 model to finely simulate the wave climate in the engineering sea area.
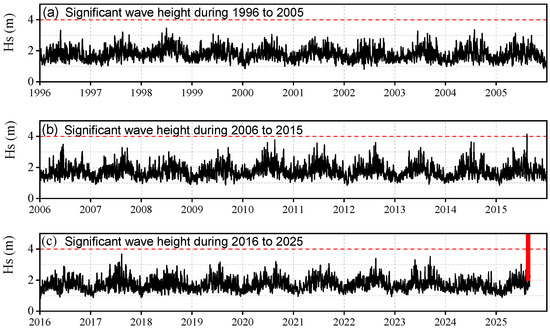
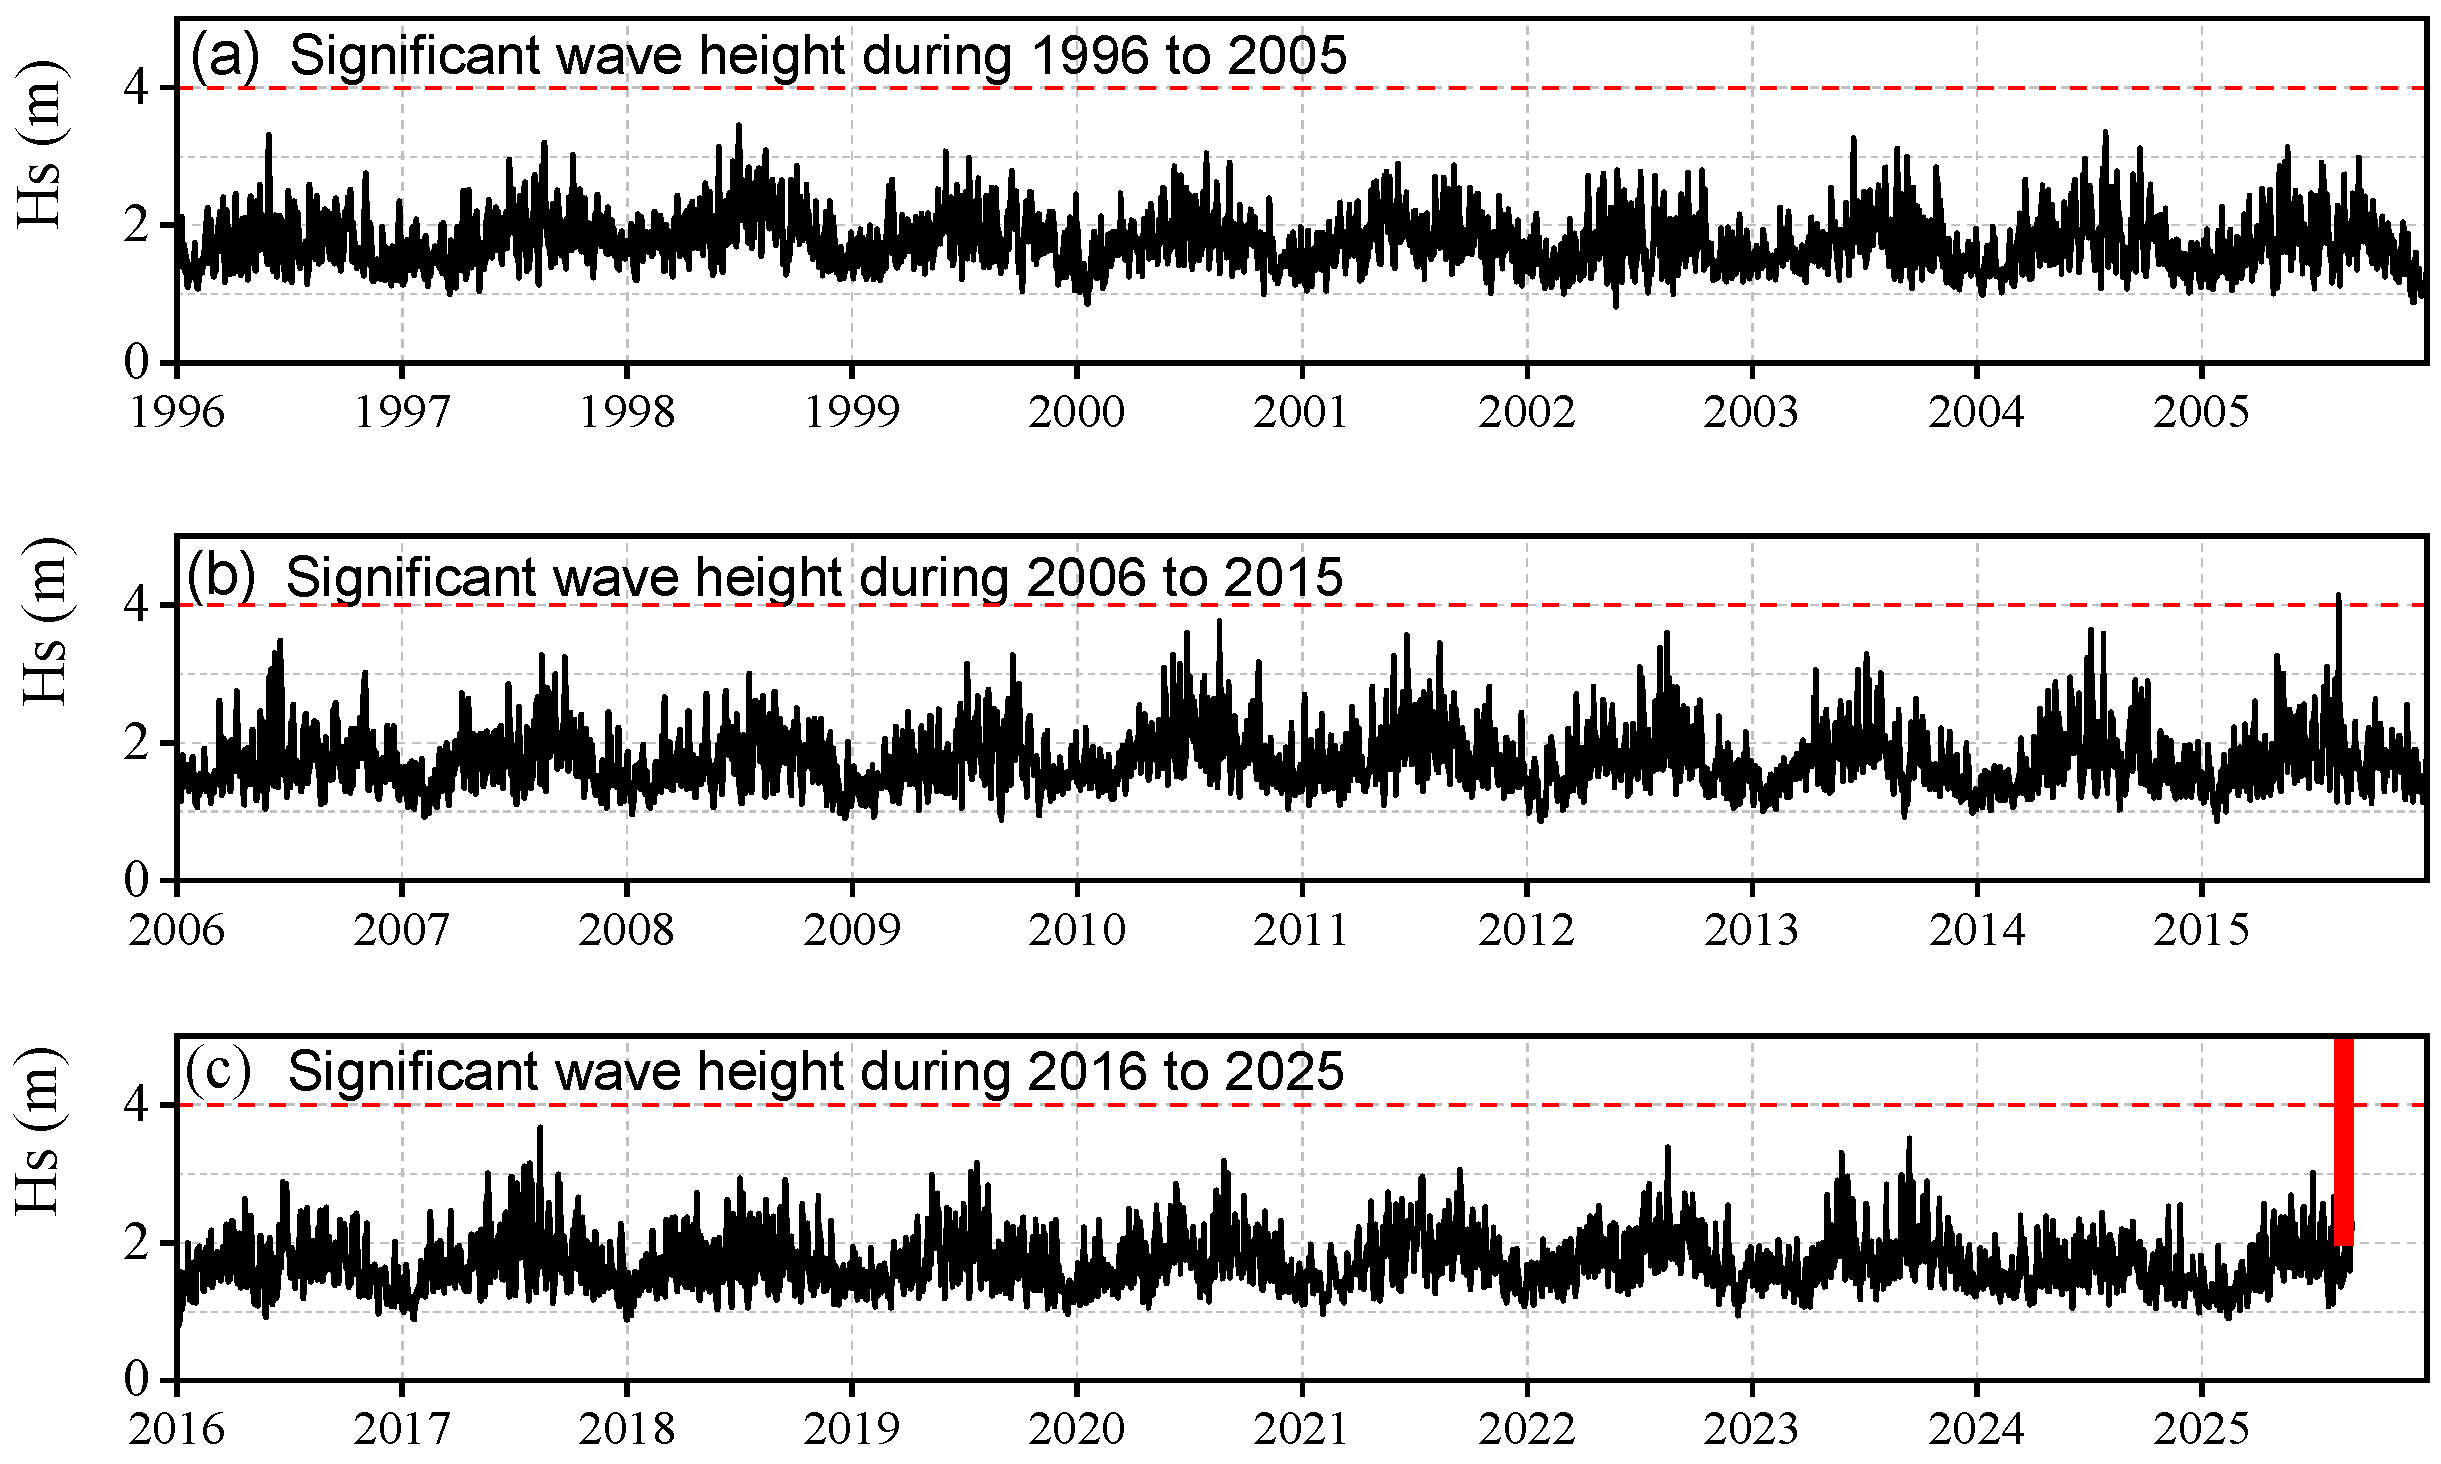
Despite its deficiencies in simulating wave direction and wave period in the sea area of Chancay, ERA5 still maintains high accuracy in significant wave height simulations and can thus be applied to rapid and reliable long-term trend analysis. Figure 9 presents the nearly 30-year time series of significant wave height offshore of Chancay Port derived from ERA5 data, spanning from 1996 to the end of August 2025. It can be seen that the significant wave height of the 824 Large-Wave Event reached the maximum value in the past 30 years, indicating that this large-wave event was an extreme wave event.
Figure 9.
Time Series of Significant Wave Height at Offshore Measurement Station Pto4 of Chancay Port over the Past 30 Years.
3. Wave Simulation in the Breakwater Area
3.1. Port Model Setup
3.1.1. Model Description
The MIKE21-BW model developed by the Danish Hydraulic Institute (DHI) was adopted to simulate wave propagation at the harbor scale. MIKE21-BW is a nearshore wave numerical model based on the Boussinesq equations, which was developed by the Danish Hydraulic Institute (DHI) [29]. It is specifically designed to simulate the nonlinear propagation, transformation, and breaking processes of waves under shallow water and complex topographic conditions.
In the MIKE 21 BW model, two formulations are available: the classical Boussinesq equations and the improved Boussinesq equations. The classical form is applicable when the relative water depth satisfies hmax/L0 < 0.22, where hmax is the maximum water depth and L0 is the deep-water wavelength. The improved Boussinesq formulation incorporates additional deep-water correction terms, extending the applicability to hmax/L0 ≤ 0.5. Owing to the improved dispersion relation, it can also simulate the propagation of irregular waves in relatively deeper water or shorter-period wave conditions. Therefore, the improved Boussinesq equations are adopted in this study.
The continuity equation is
The momentum equation in the x-direction is
The momentum equation in the y-direction is
where is the free surface elevation; P and Q are the depth-integrated velocity components; and are Boussinesq dispersive terms; h is the still-water depth; n is the porosity; C is the Chezy coefficient.
3.1.2. Global Wave Model for Chancay Port
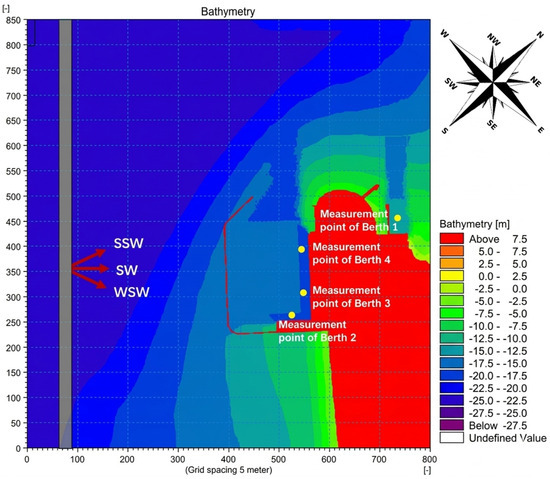
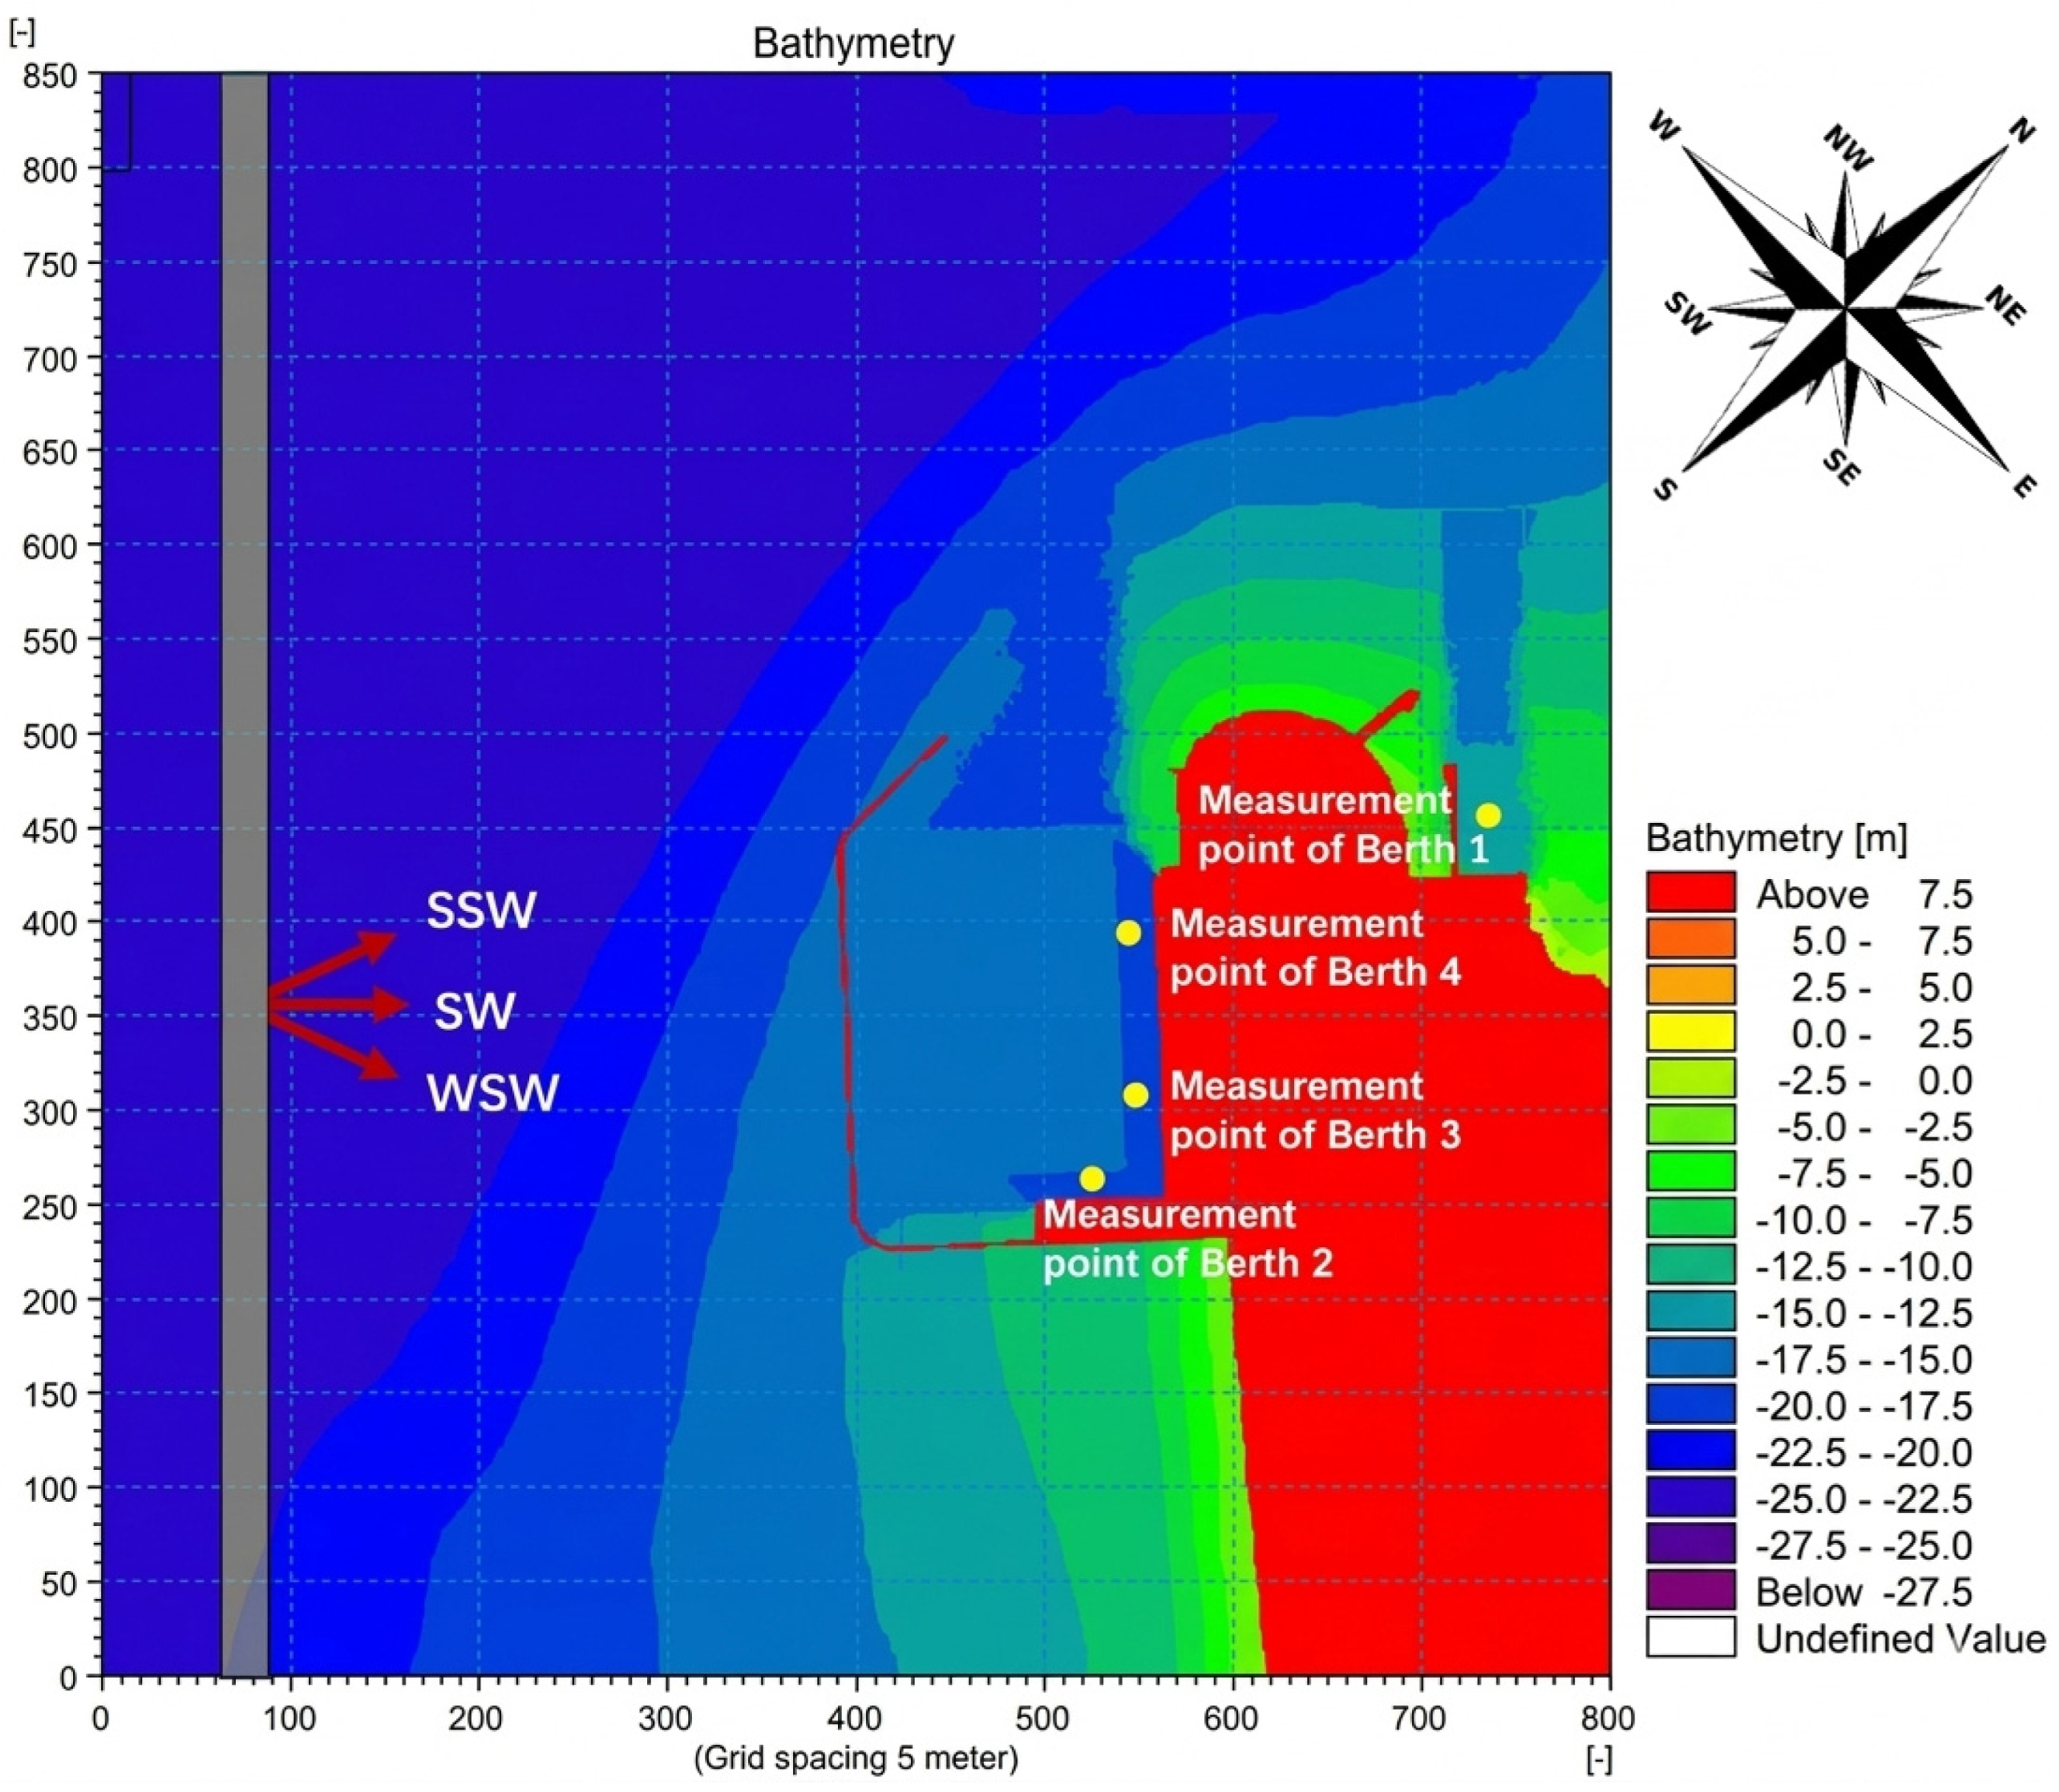
The computational domain of the global wave model for Chancay Port covers the entire breakwater, waterway and basin, so as to fully simulate the propagation of nearshore waves into the port area. In addition, to facilitate the definition of wave directions from different orientations in the model, the coastal topography was rotated clockwise by 45°, meaning that the incident wave direction was set as the direction rotated clockwise from the true north. The water depth distribution, wave generation line and observation station locations of the port layout in the model are shown in Figure 10. The size of the computational domain is 4.0 km × 4.25 km with a grid resolution of 5 m, and the simulation duration is 7200 s. The wave parameters of Station Pto4 given in Table 1 (significant wave height: 4.0 m, spectral peak period: 18 s, wave direction: 223°) were adopted as the input conditions for the global wave model.
Figure 10.
Water Depth Distribution of the MIKE21-BW Model for Chancay Port.
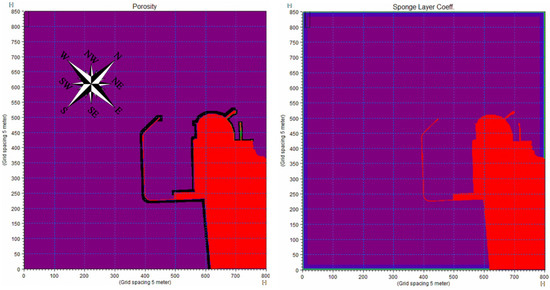
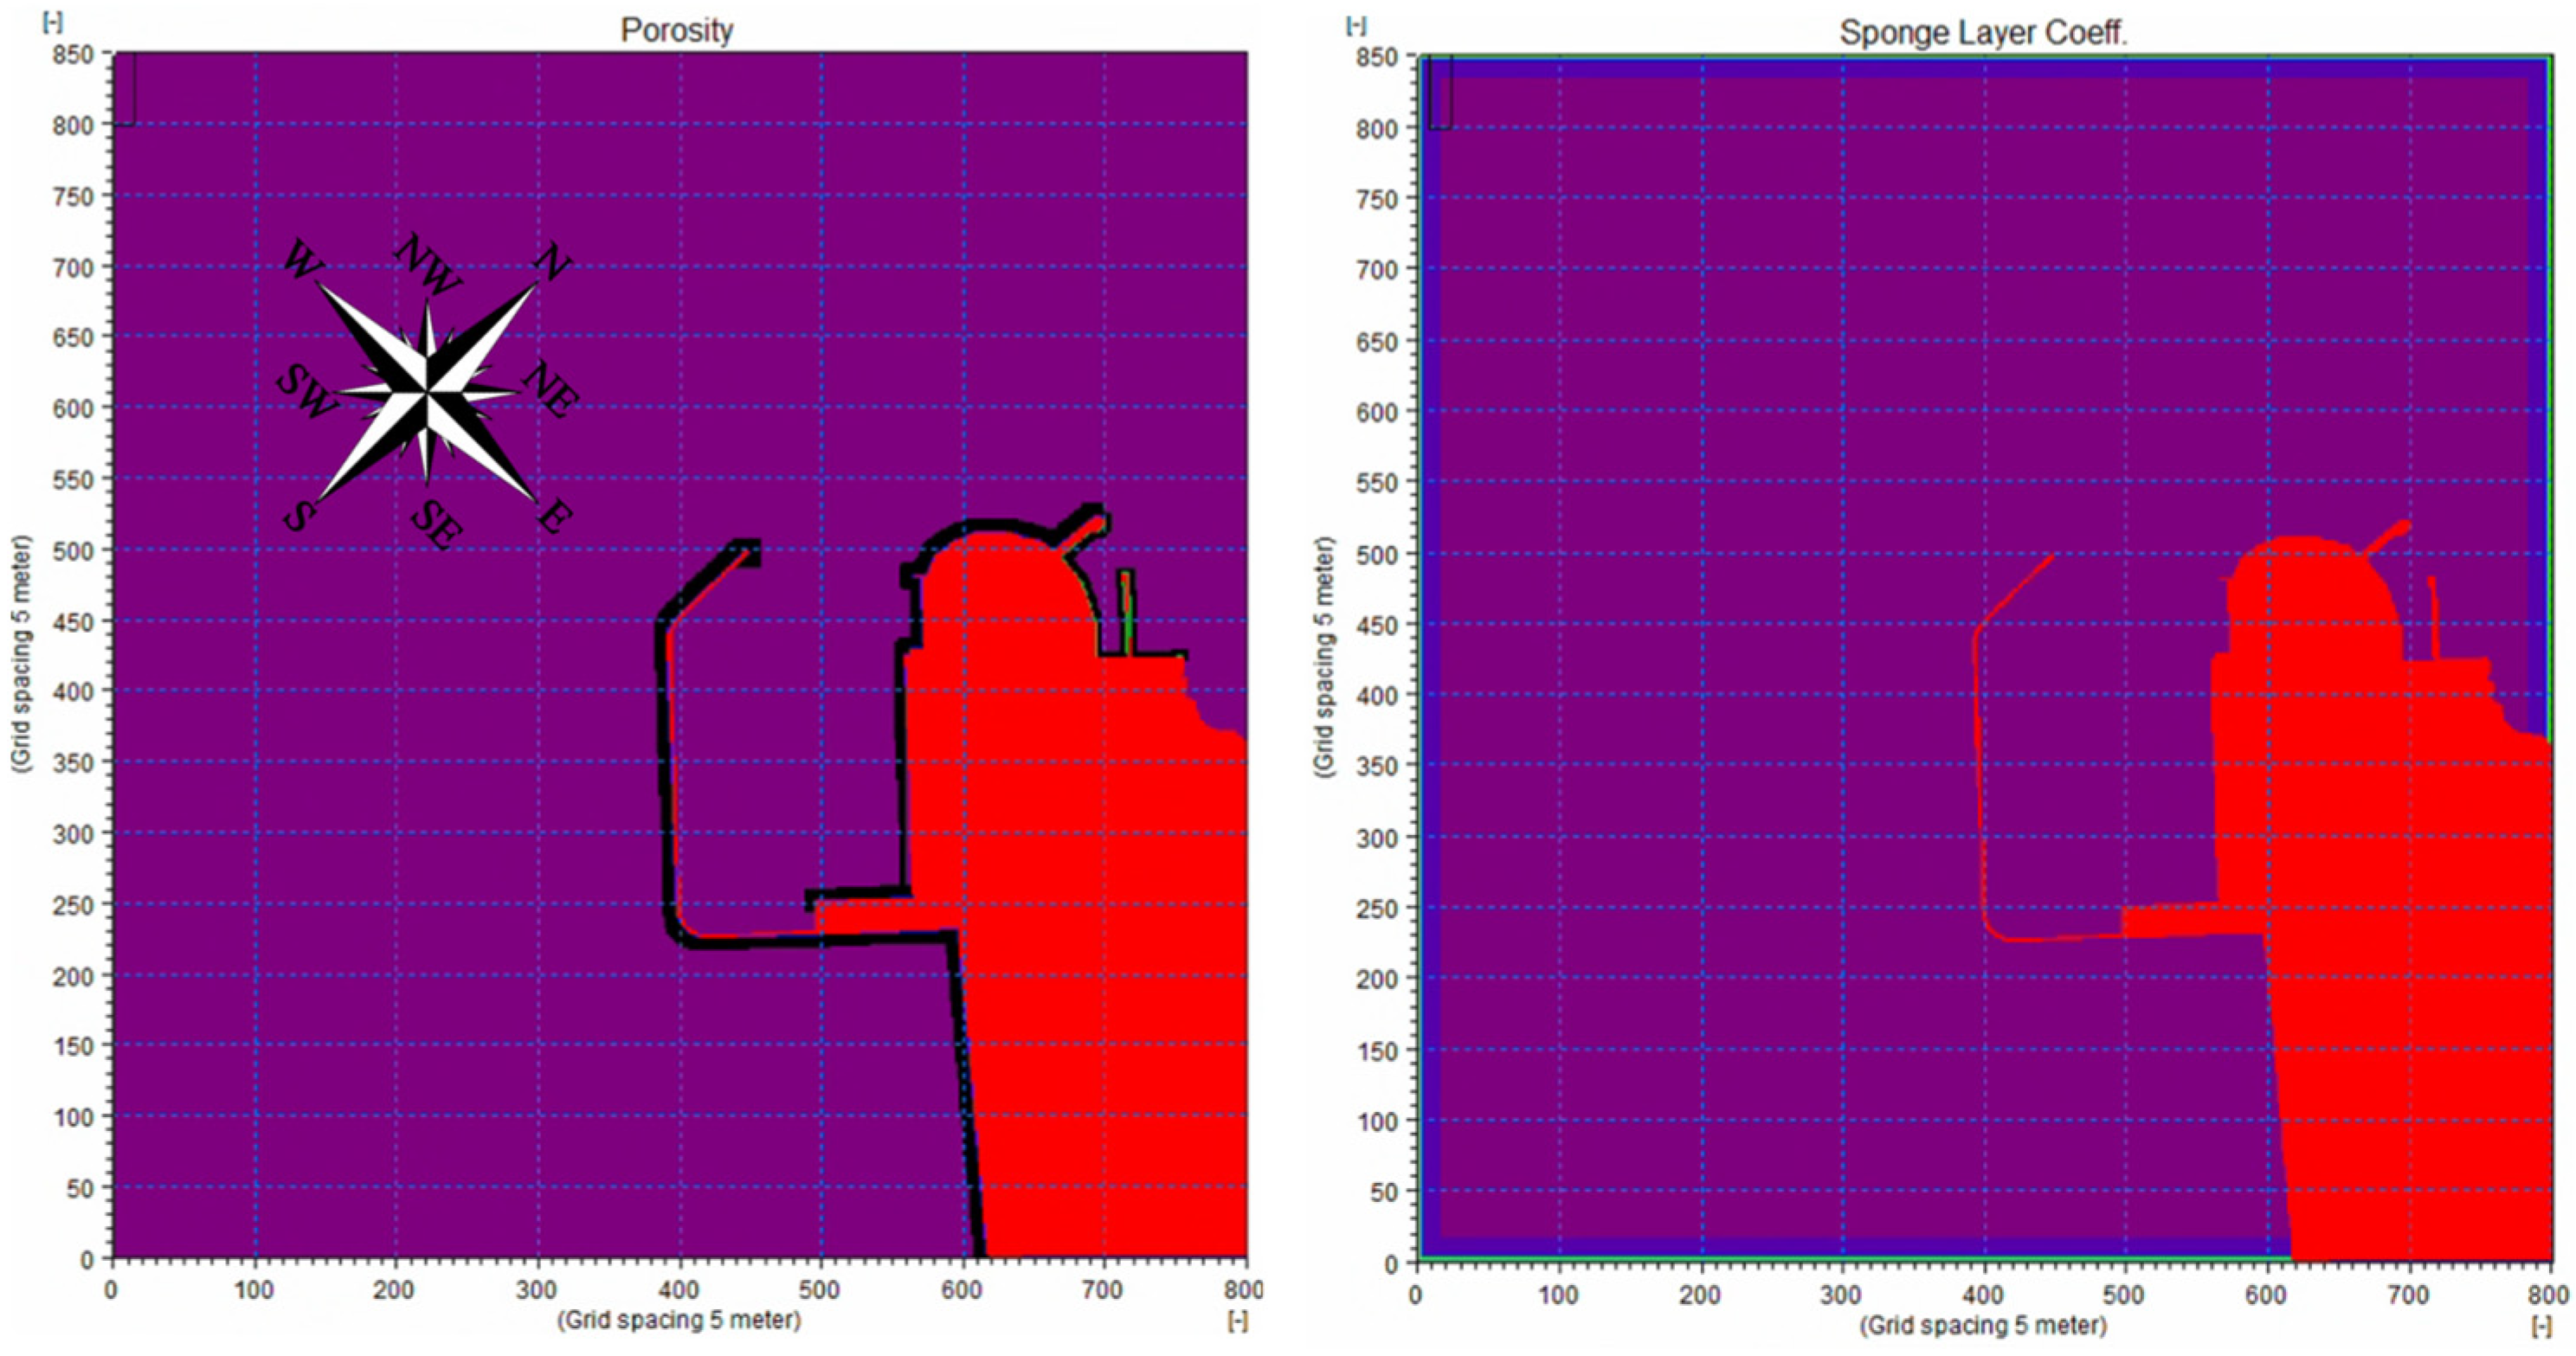
In consideration of computational stability, a 50-layer sponge layer was set up at the offshore boundary and the adjacent coastline of the port (as shown in the right panel of Figure 11) to ensure that the reflected waves propagating offshore and the incident waves propagating toward the adjacent coastline were fully absorbed. The installation of the sponge layer along the coastline can improve the computational stability of the model without interfering with the wave evolution in the vicinity of the main breakwater. In practical scenarios, the boundaries of the breakwater and the elevated pile wharf will cause partial reflection of waves. In the numerical model, an 8-layer porous layer was configured at the boundaries of the breakwater and the wharf (as shown in the left panel of Figure 11) to simulate such partial reflection effects.
Figure 11.
Schematic Diagram of Porous Layer (Left) and Sponge Layer (Right) in the Port-Arranged BW Model.
3.1.3. Local Wave Model for Chancay Port
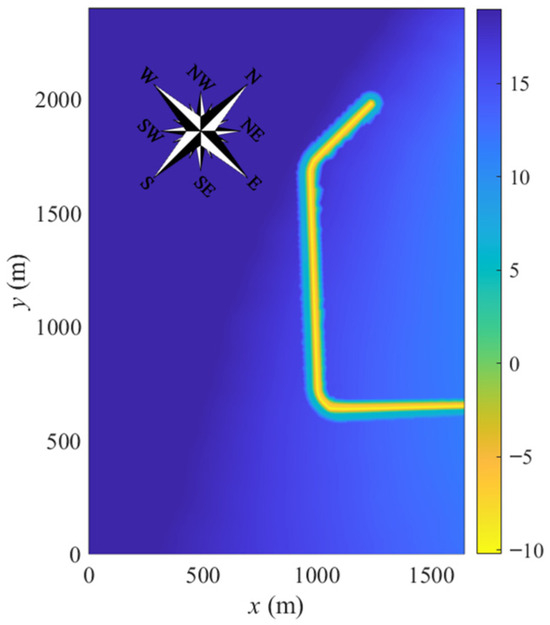
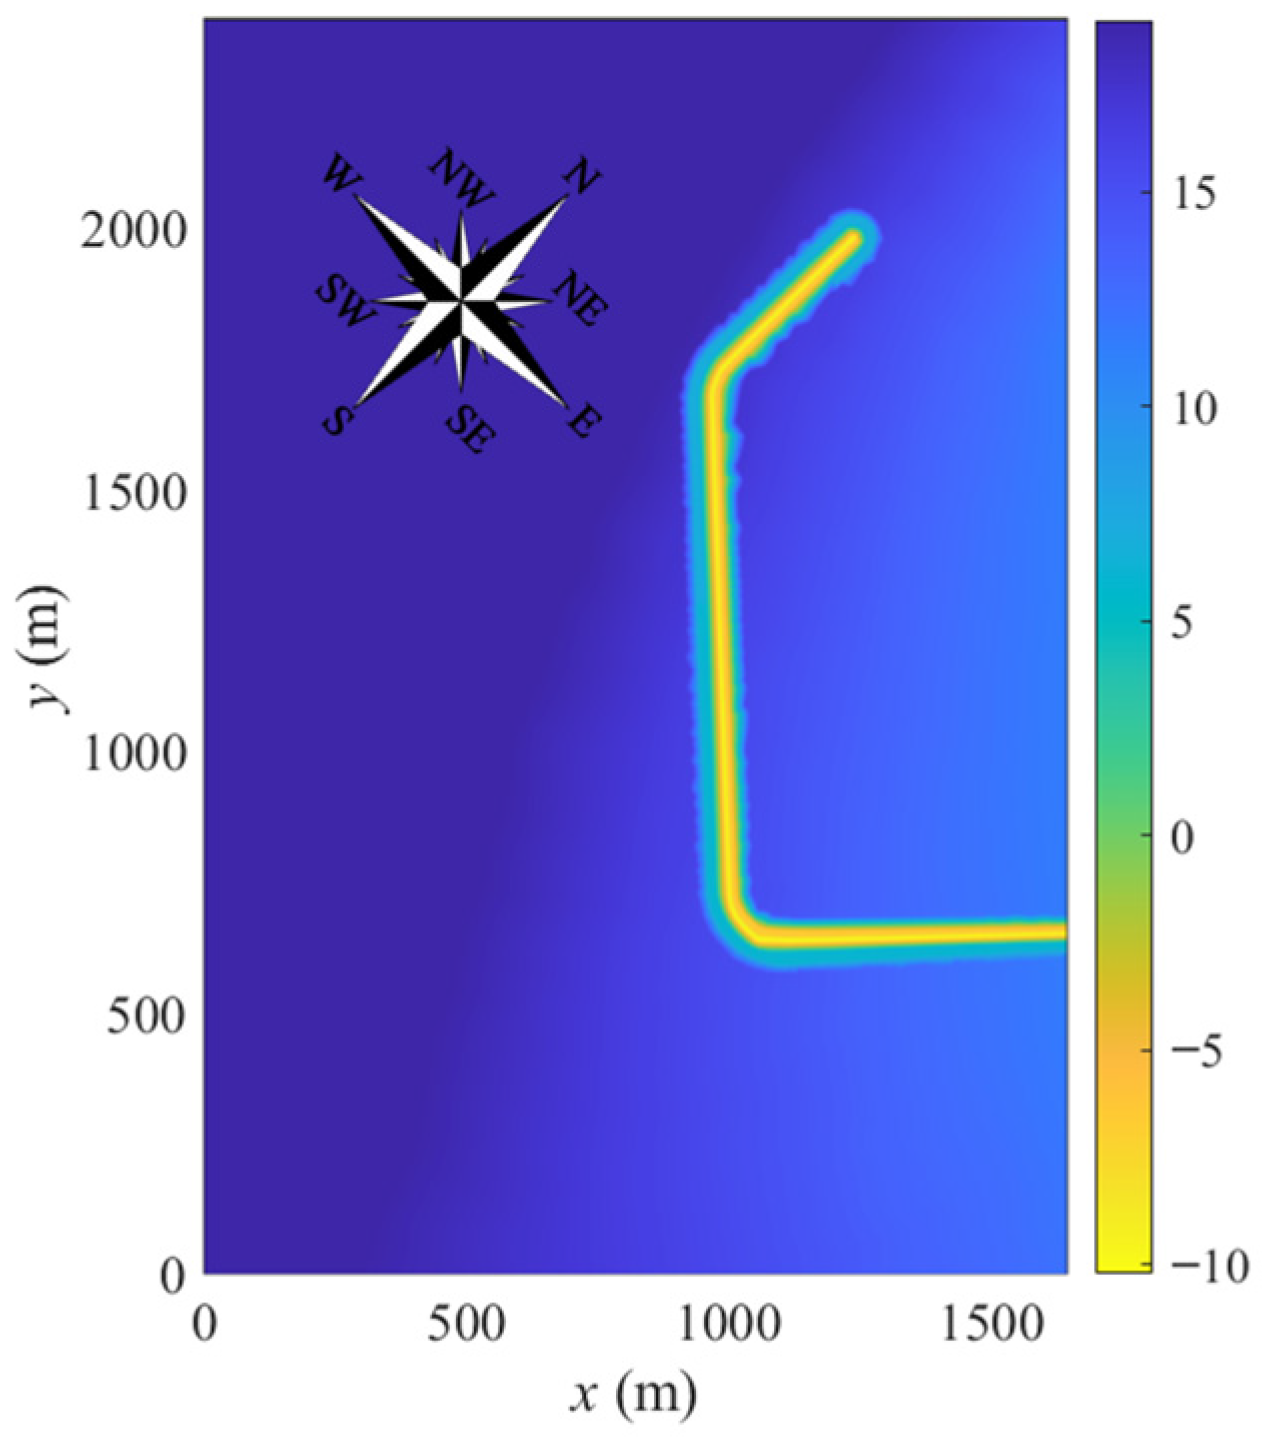
The global wave model of Chancay Port involves a relatively rough representation of the breakwater and fails to capture the detailed cross-section of the breakwater. Although the consideration of partial wave reflection from the breakwater by means of the porous layer allows for a reasonable reproduction of the wave height in front of the breakwater, it cannot reflect the strong nonlinear deformation and wave height distribution along the breakwater body. Therefore, a local wave model was established specifically for the main breakwater area to account for the strong nonlinear wave deformation, wave overtopping and other physical processes occurring both in front of and along the breakwater. The topographic layout is shown in Figure 12, where negative values represent areas exposed above the still water level. The shoreward component of the wave spectrum at the location 300 m in front of the main breakwater derived from the global wave model was used as the input for the local model. The computational domain covers an area of 1.65 km × 2.4 km with a grid resolution of 3 m, and the simulation duration is set at 4000 s.
Figure 12.
Water Depth Distribution of the Local Wave Model for Chancay Port.
The condition of partial wave reflection from the main breakwater can be naturally incorporated by accounting for the wave energy dissipation along the breakwater body, and thus there is no need to configure a porous layer as was done in the global wave model. Sponge layers were installed at the four lateral boundaries of the computational domain to ensure that the reflected waves propagating offshore and the incident waves propagating toward the adjacent coastline were fully absorbed. In addition, bottom friction was specified to account for the wave energy dissipation induced by the armor units of the breakwater. Wave energy dissipation caused by wave breaking was considered via the eddy viscosity term. The shallow water method was adopted to handle the wet–dry (breakwater) moving boundary [30,31].
According to the characteristics of water depth distribution, the main breakwater can be divided into three segments: the shore-normal segment (where the breakwater axis is perpendicular to both the coastline and isobaths), the shore-parallel segment (where the breakwater axis is parallel to the coastline and forms an angle of approximately 15° with the isobaths; the junction between the shore-normal segment and the shore-parallel segment is defined as the turning section), and the head segment (where the breakwater axis forms a certain angle with both the coastline and isobaths).
The BW model is implemented with the default parameter settings recommended in the model documentation, and no parameter calibration is carried out. Model performance is assessed through validation against the available observations (Section 3.2).
3.2. Port Model Validation
To evaluate the accuracy of the harbor-scale model, seven large-wave instances were selected based on the records from observation Station 1 (Figure 4) to conduct wave simulations (Table 2). The numerical results at Station 2 and 3 are compared with the synchronized field observation data (Table 3). The results indicate that the relative error at Station 3 ranged from 0.7% to 14.3%, with five of the seven datasets exhibiting errors below 10%. The higher errors (>10%) in the final two sets were primarily due to a more westerly wave direction, which allowed for greater wave penetration into the harbor. At Station 2, the simulation error varied between 0.4% and 11.5%, with six sets maintaining an error of less than 10%. Overall, the error distribution across both stations shows that 82% of the data points were within a 10% margin, and errors during key periods remained below 5%. The strong agreement between the simulated and observed results demonstrates that the established harbor wave model is highly capable of reproducing actual wave conditions within the port.
Table 2.
Incident wave parameters during high-wave conditions.
Table 3.
Comparison between modeled and measured wave heights in the harbor during high-wave conditions.
3.3. Simulation Results of Wave Conditions in the 824 Breakwater Area
3.3.1. Results of the Global Wave Model for Chancay Port
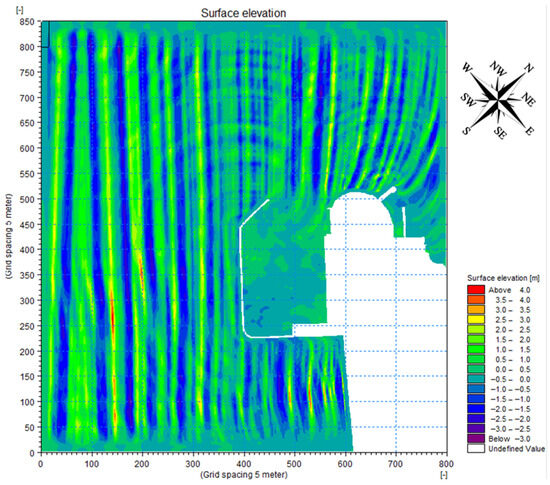
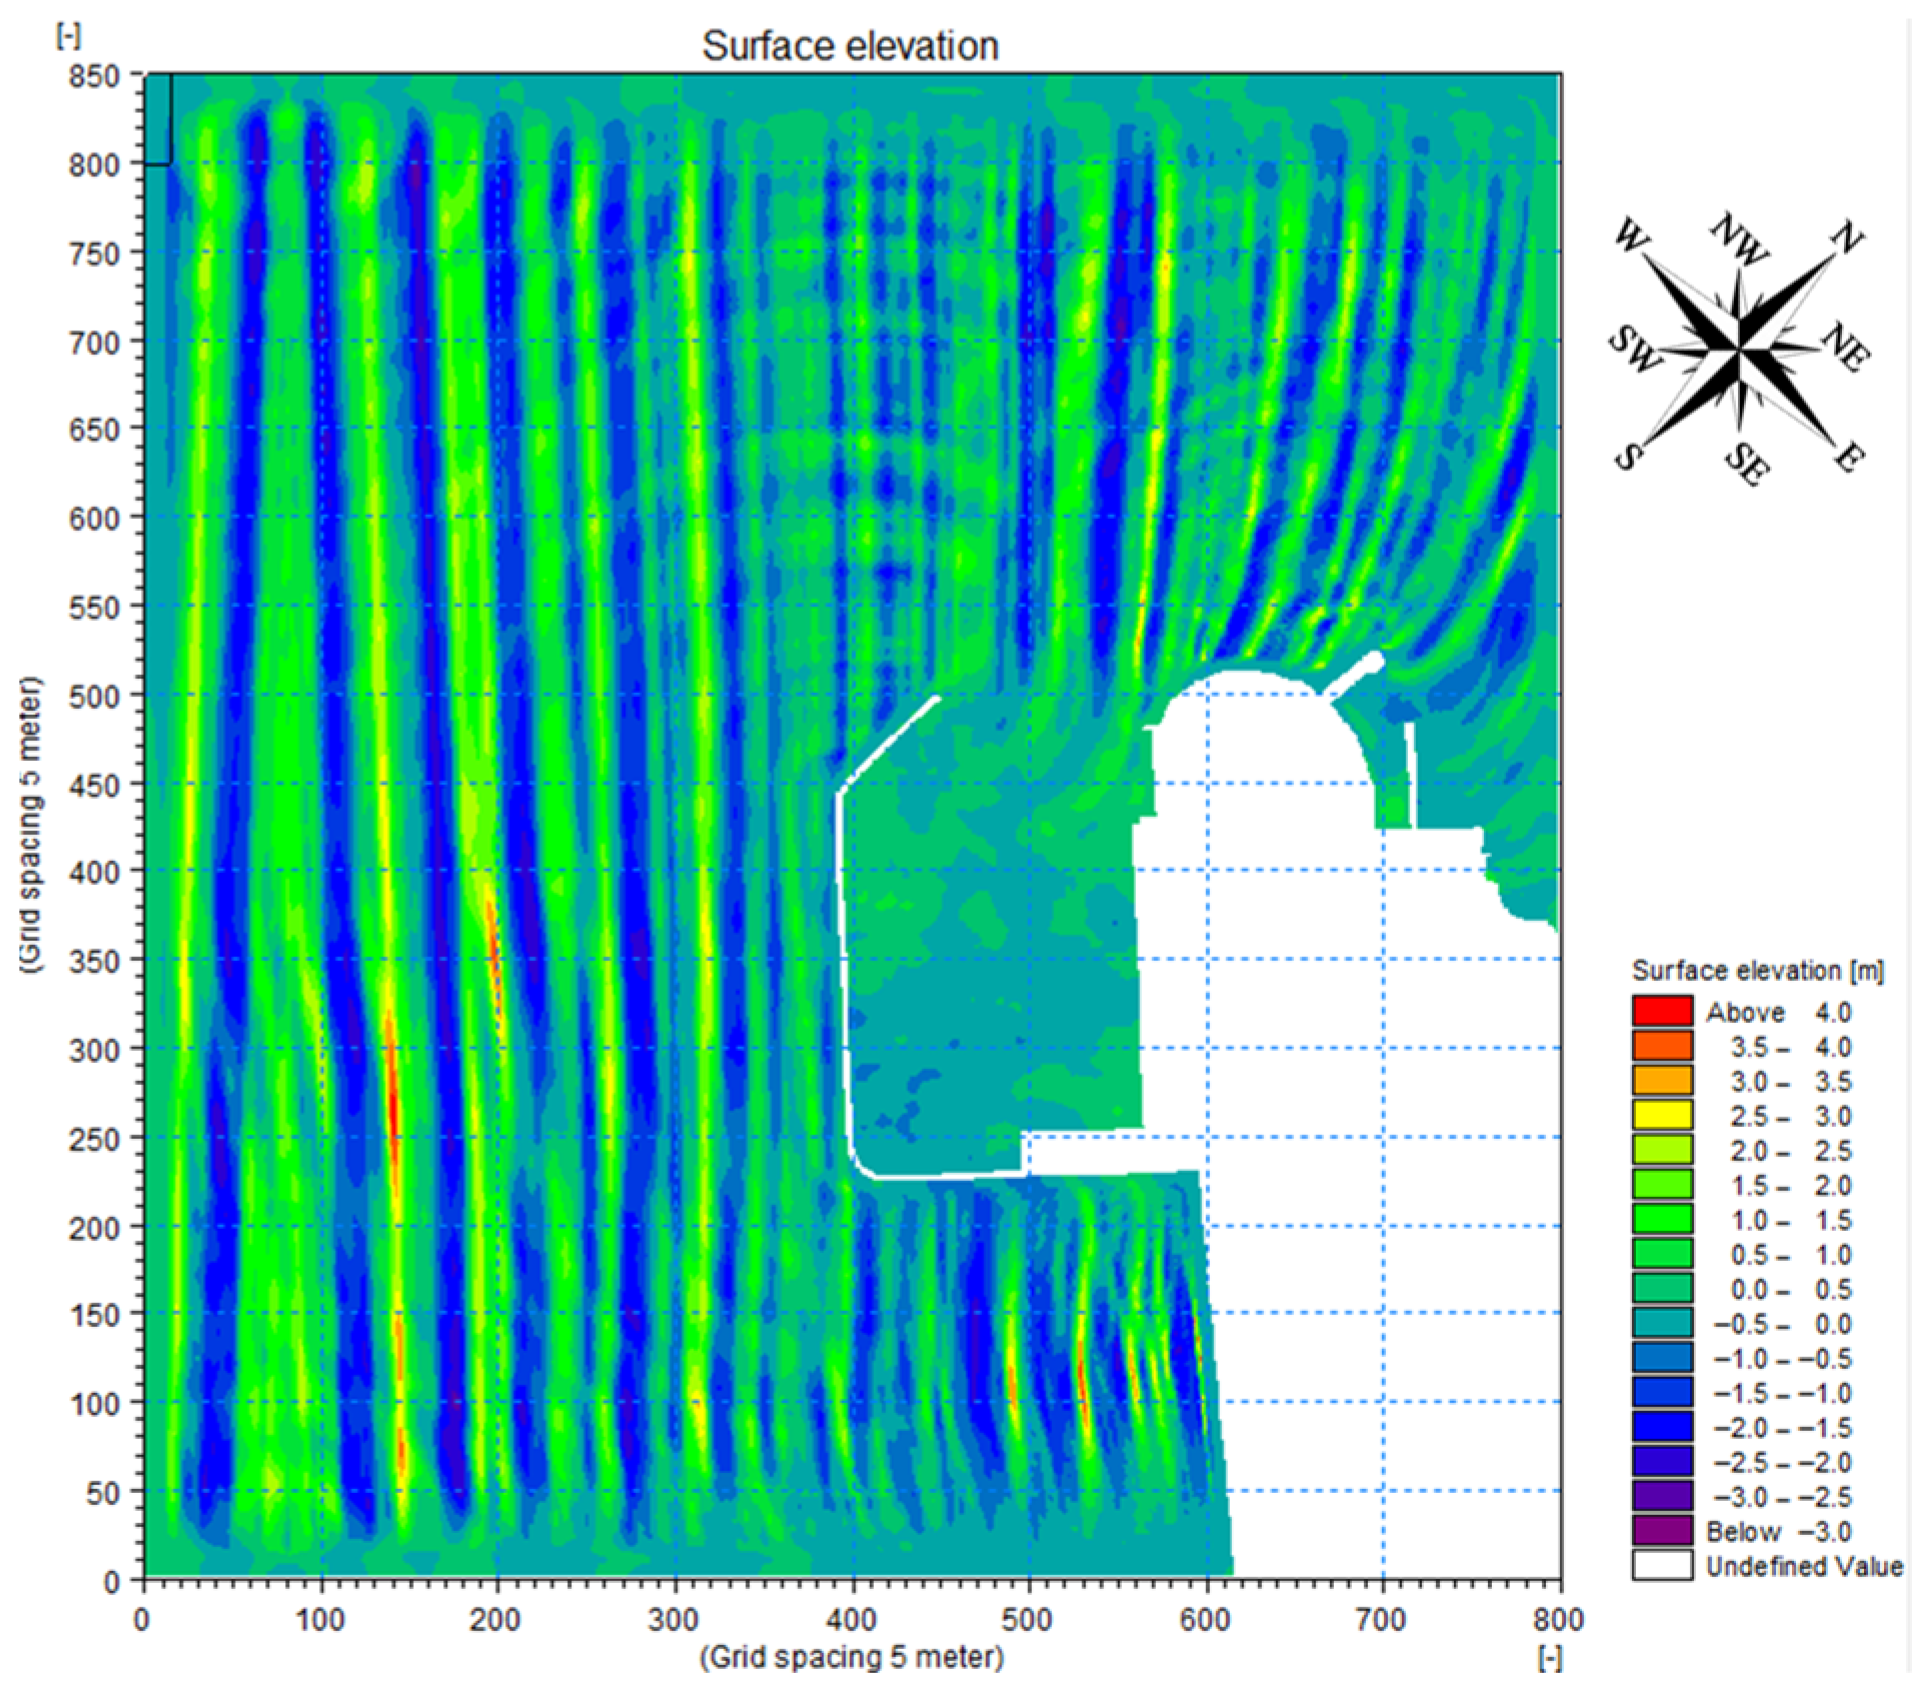
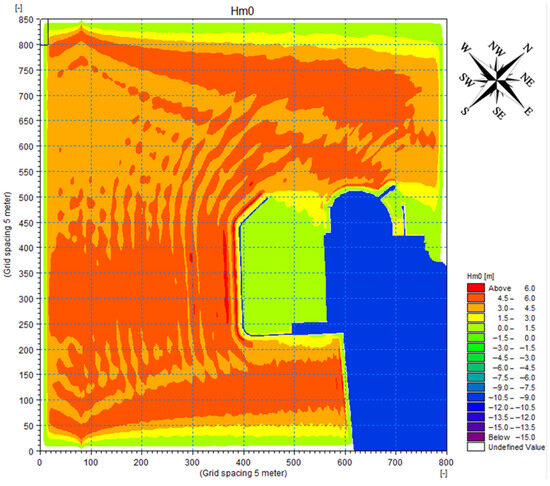
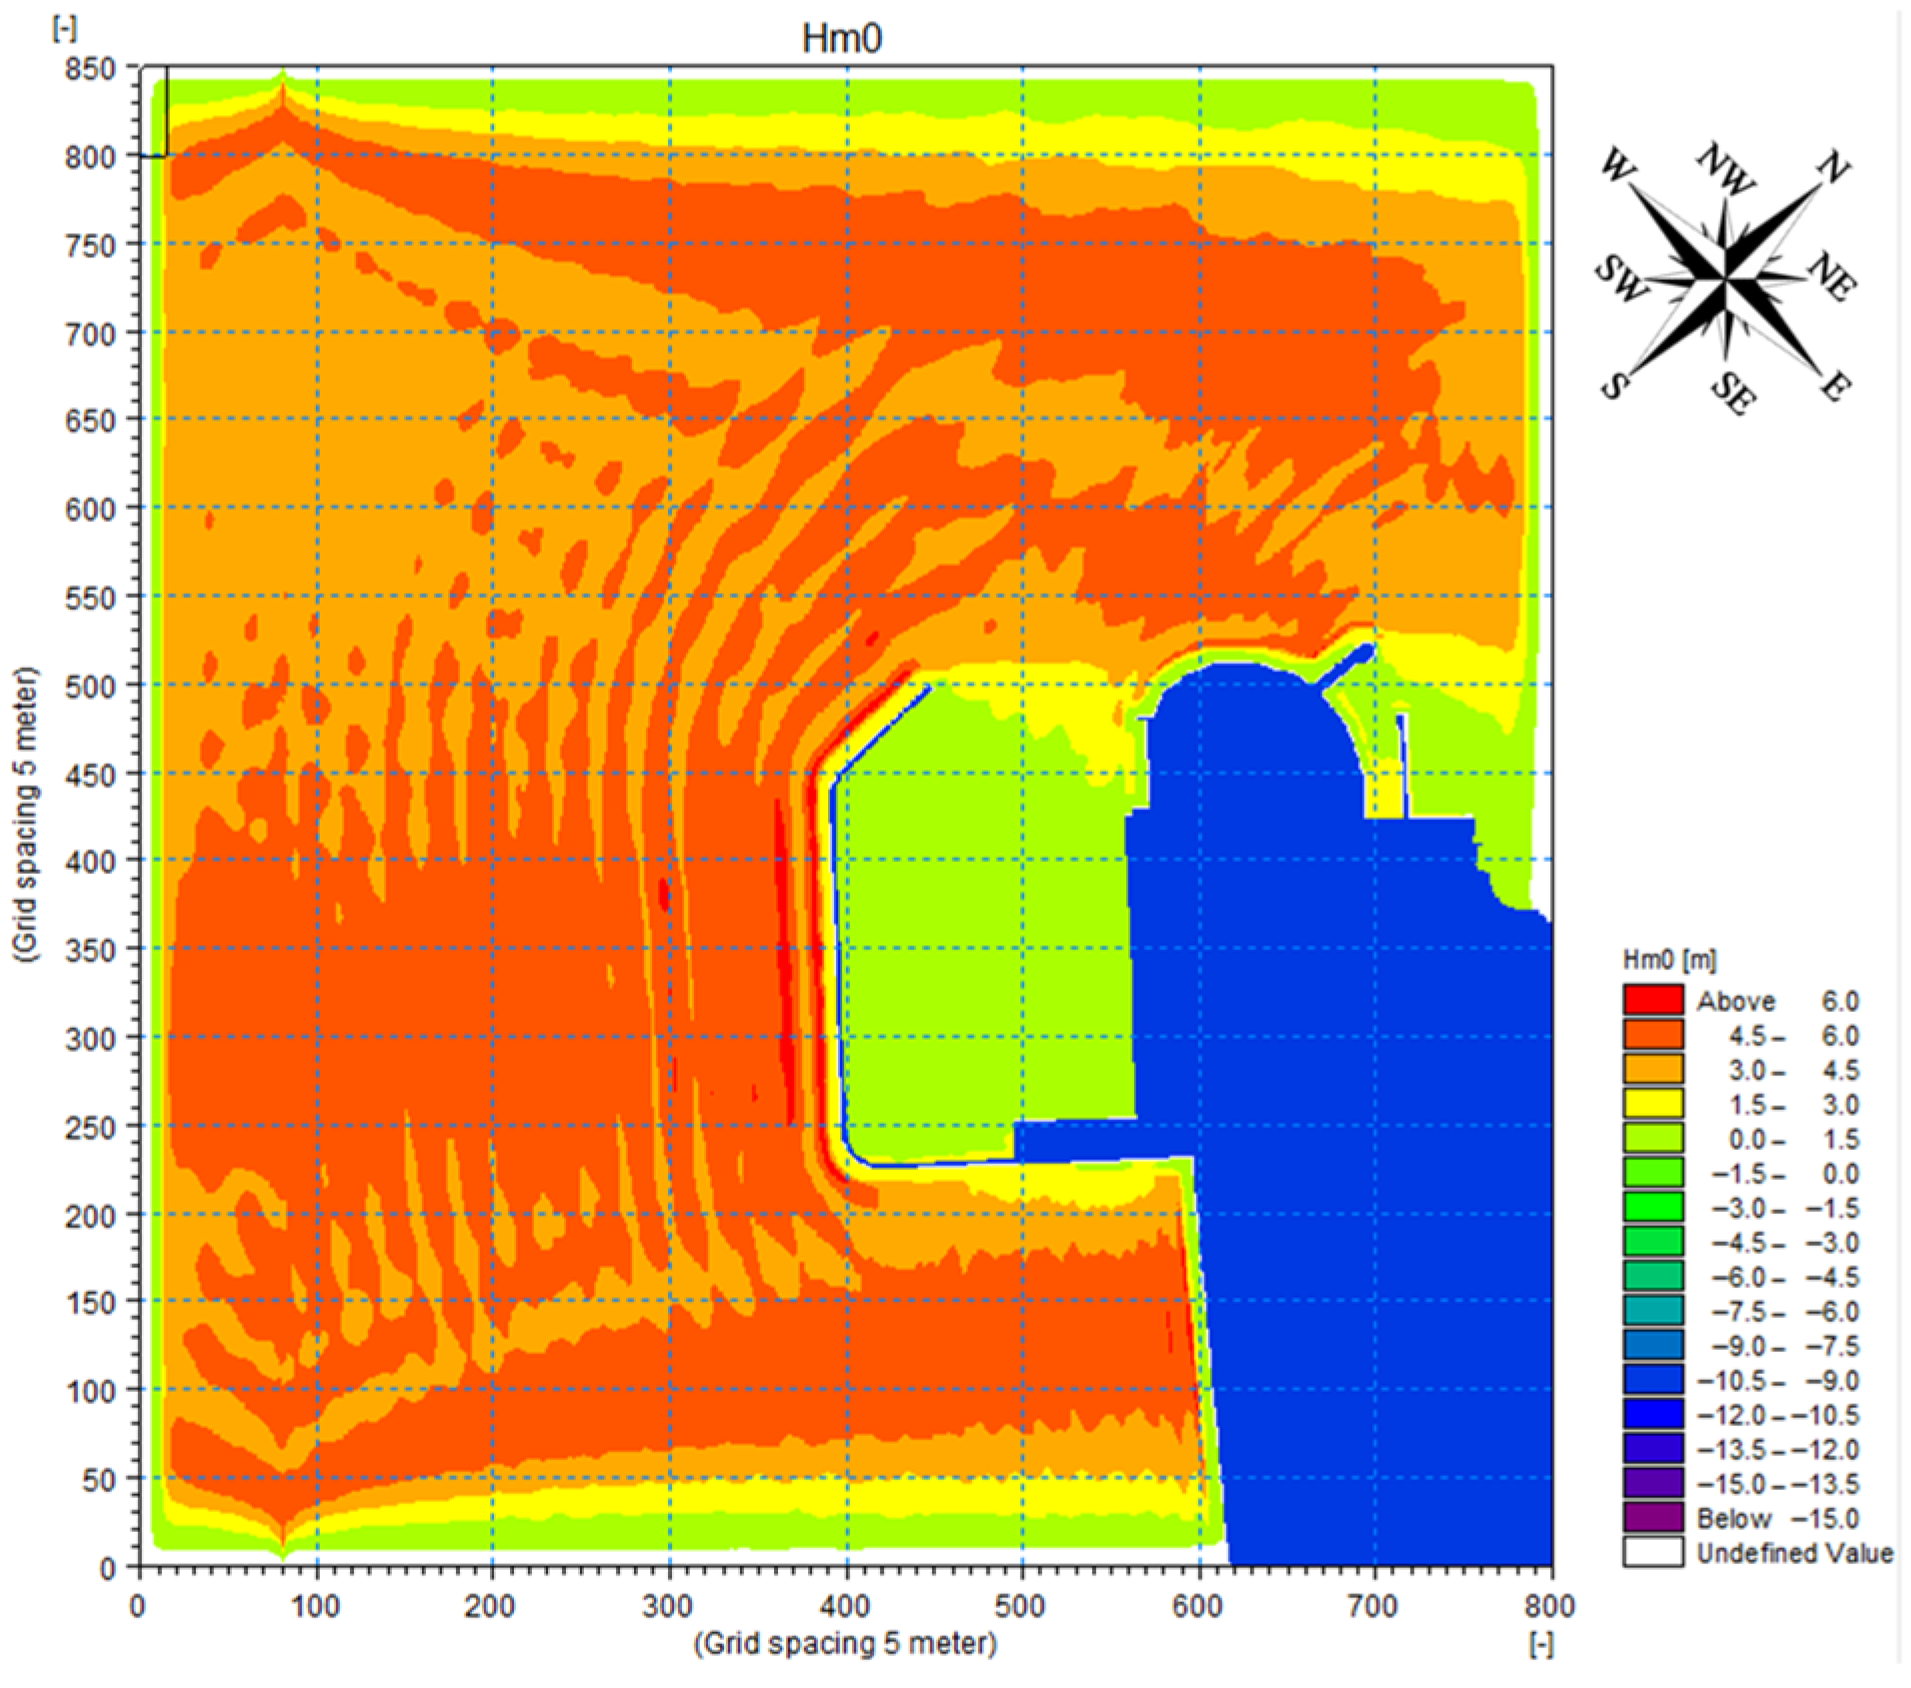
This subsection briefly presents the simulation results of waves in the offshore breakwater area under the 824 event conditions (wave direction Dir = 223°, spectral peak period Tp = 18.0 s, significant wave height Hs = 4.2 m). Figure 13 shows the wave surface elevation distribution at a specific moment, from which the process of wave propagation and diffraction into the port can be observed. Figure 14 presents the significant wave height distribution; owing to the installation of sponge layers around the computational domain, the wave height in these areas is extremely small. The significant wave height offshore is generally greater than 4.5 m, reaching up to 5 m at the location 300 m in front of the main breakwater (measured from the central axis) and 6 m at the location 100 m in front of the breakwater. In the next subsection, the hydrodynamic details in front of and along the breakwater will be further analyzed based on the local refined wave model.
Figure 13.
Instantaneous Free Surface Elevation of the Global Port Model of Chancay Port under the 824 Condition.
Figure 14.
Distribution of Significant Wave Height in the Global Port Model of Chancay Port under the 824 Condition.
3.3.2. Results of the Local Wave Model for Chancay Port
- (1)
- Instantaneous Characteristics
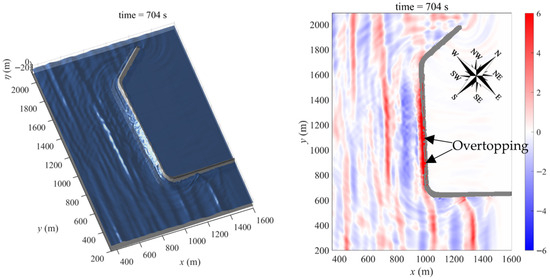
Figure 15 presents the instantaneous wave surface distribution simulated by the local model of Chancay Port under the 824 event conditions, where the left column shows the 3D views and the right column shows the plan views. The selected time corresponds to the moment of relatively large wave heights within the wave train, from which wave overtopping over the main breakwater can be observed. As the wave train propagates over the sloped breakwater, the water depth gradually decreases, leading to a reduction in wave velocity, shortening of wave length, gradual steepening of the wave surface, and significant nonlinear deformation. When the wave steepness reaches the critical value, the wave crest leans forward and breaks, accompanied by the dissipation of partial wave energy. The broken water mass still retains considerable kinetic energy and may rush onto the breakwater crest and overtop the structure under the wave pushing effect, resulting in the occurrence of wave overtopping. The remaining wave energy is either dissipated in the vicinity of the breakwater body or returns to the open sea in the form of reflected waves.
Figure 15.
Instantaneous Free Surface Distribution of the Local Model of Chancay Port under the 824 Condition: Left panel shows a three-dimensional view, right panel shows a plan view (unit: m). The selected time instance corresponds to a moment of relatively high wave height within the wave train, where overtopping at the main breakwater can be observed.
- (2)
- Statistical Characteristics
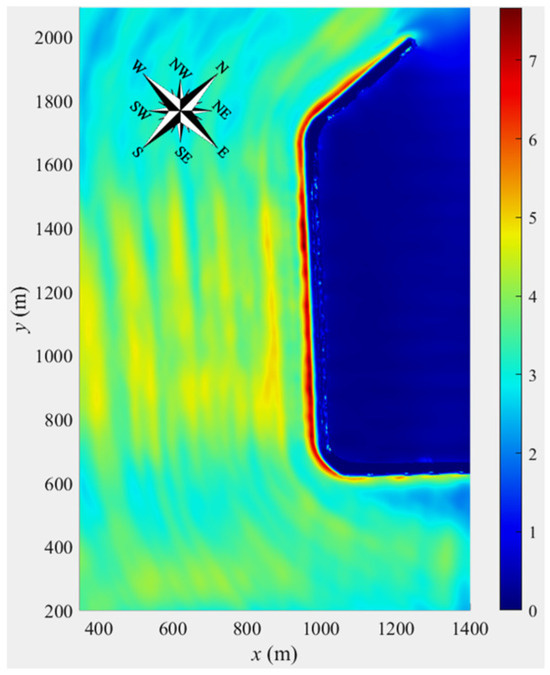
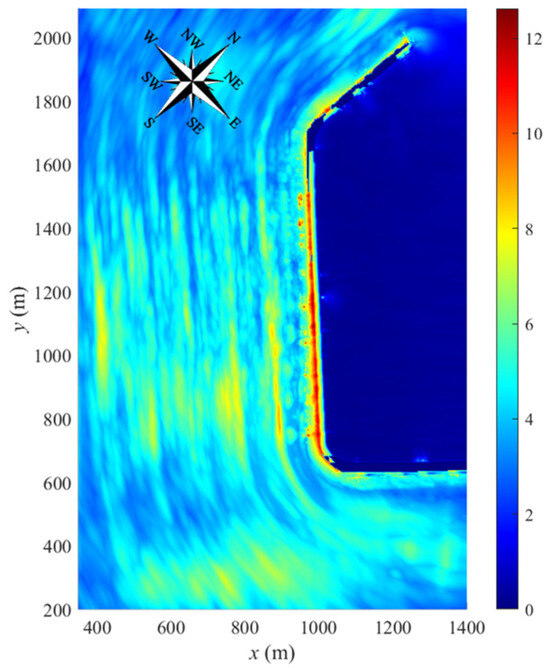
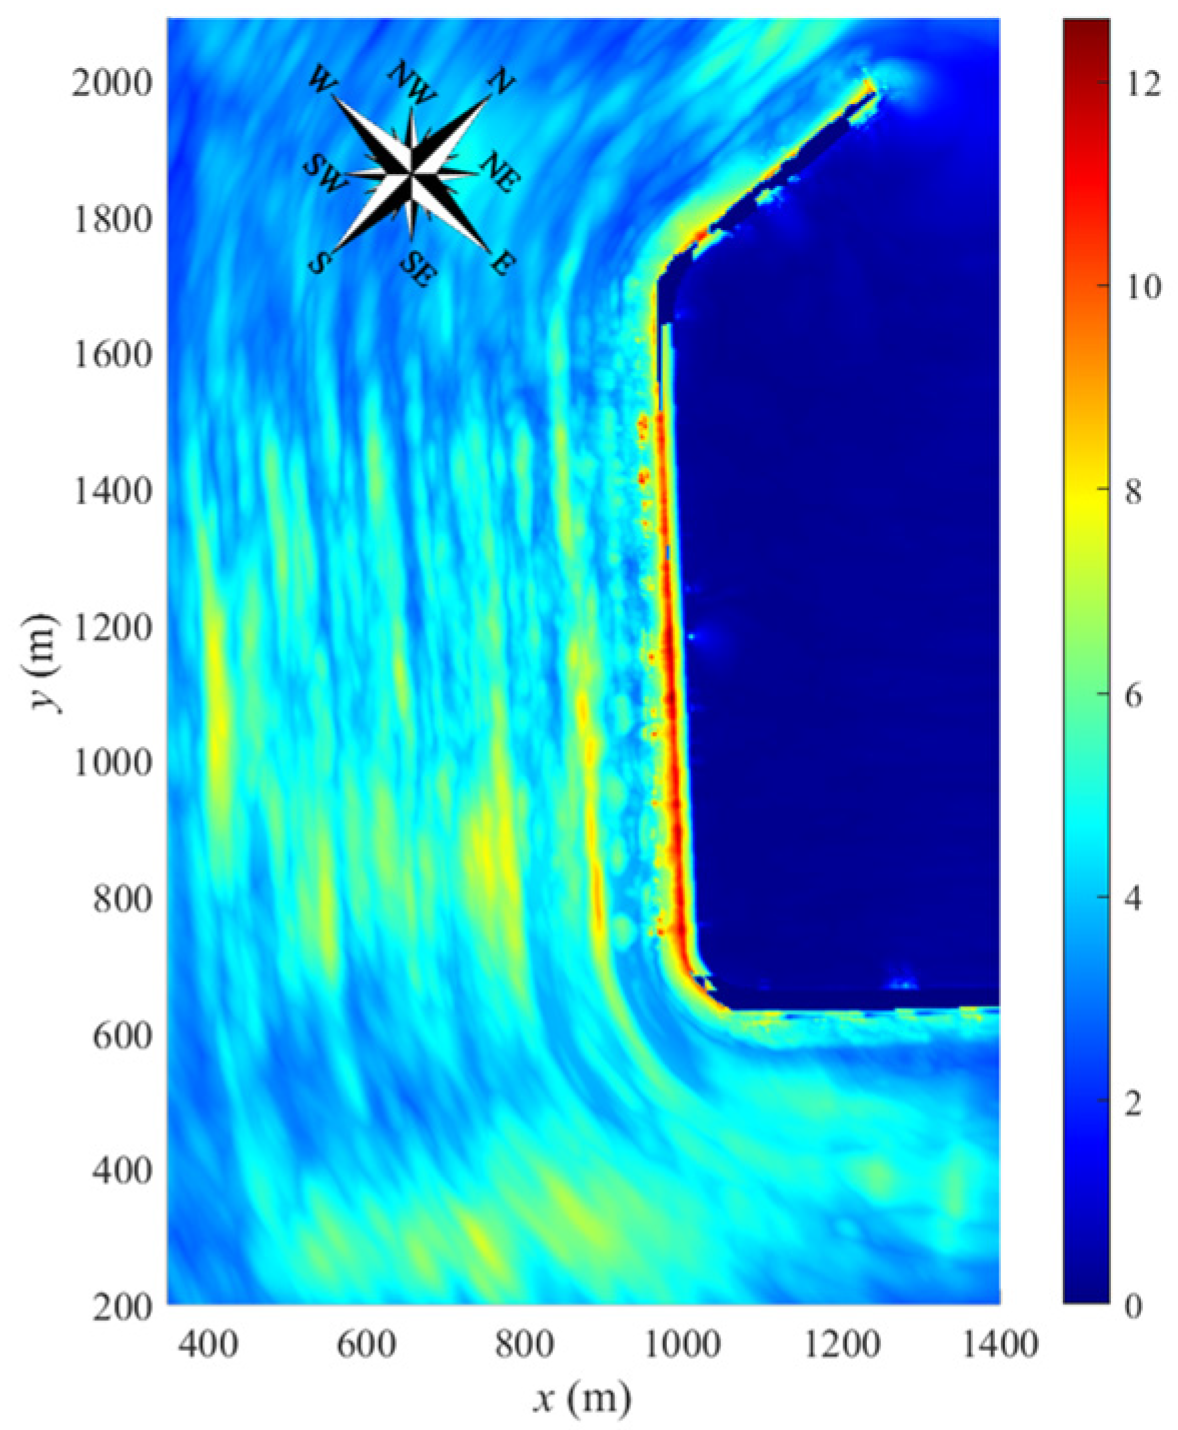
The statistical characteristics of waves were analyzed based on the simulation data spanning from 400 to 4000 s. Figure 16 presents the distribution of significant wave height derived from the local model of Chancay Port. Partial wave reflection occurs at the breakwater, and the superposition of reflected waves and incident waves gave rise to standing waves, resulting in a periodic oscillation trend of wave height along the shoreward direction. The significant wave height could exceed 5 m at the location 300 m in front of the breakwater (measured from the central axis), and surpass 7 m on the breakwater body. The wave height on the breakwater body exhibits a trend of first increasing and then decreasing sharply. The maximum wave height occurs at the moment and location where waves were on the verge of breaking on the slope of the breakwater body, rather than in the deeper water area in front of the breakwater (with a water depth of over ten meters). After wave breaking, the wave height decreased rapidly due to energy dissipation.
Figure 16.
Distribution of Significant Wave Height in the Local Model of Chancay Port under the 824 Condition (Wave height unit: m).
Figure 17 presents the distribution of maximum wave surface elevation derived from the local model of Chancay Port. The wave surface elevation in the shore-parallel segment of the main breakwater was relatively large, exceeding 12 m—that is, approximately 2 m above the breakwater crest. This could potentially impact and damage the equipment and instruments installed on the breakwater crest. In contrast, the wave surface elevation was smaller in the shore-normal segment of the main breakwater, since this segment is parallel to the wave direction.
Figure 17.
Distribution of Maximum Free Surface Elevation in the Local Model of Chancay Port under the 824 Condition (Free surface unit: m).
- (3)
- Analysis of Wave Patterns and Flow Fields at the Turning Section of the Main Breakwater
The wave patterns and flow fields at the turning section of the main breakwater are extremely complex. This region exhibits the characteristics of both the shore-parallel segment and the shore-normal segment. On the one hand, waves undergo multi-directional reflections along the curved axis, forming complex standing waves and thus leading to intense wave run-up. On the other hand, in the area adjacent to the shore-normal segment, water depth-induced wave breaking occurs due to the shallow water depth along the breakwater body, generating extremely strong horizontal flow velocities. These high flow velocities exert continuous lateral forces on the armor units, enhancing the impact loads acting on the structure. In summary, the complexity of wave patterns and flow fields at the turning section gives rise to higher flow velocities and stronger impact forces.
4. Discussion of the Causes of Damage to the Main Breakwater
Similar to observations reported for other swell-impacted ports under extreme conditions along the Pacific coast of South America [1], the present event exhibits a combination of long-period swell forcing and geometry-controlled amplification in the vicinity of the breakwater, particularly near the turning section. Previous studies have shown that long-period forcing can be strongly modulated by basin geometry and boundary reflection, leading to amplified responses under energetic sea states [8,9]. In addition, previous investigations of harbor oscillations demonstrate that certain configurations can produce highly sensitive amplification patterns, which is consistent with the strong spatial non-uniformity found near the turning section in this study [10,14]. Although this paper does not quantify structural response, the simulated concentration of near-breakwater amplification provides a hydrodynamic context that is consistent with the conditions under which violent breaking impacts and localized damage have been reported in large-scale laboratory experiments and related engineering studies [15,16,17].
Against this background, the following discussion summarizes the causes of armor-unit detachment during the 824 Large-Wave Event based on the present simulations, which can be attributed to two main aspects:
- (1)
- Extremely rare external wave conditions
This event was extremely rare and exceptionally severe. Originating from an intense storm in the roaring forties of the Southern Hemisphere, the waves were long-period waves (Tp = 18.0 s) that propagated over long distances in the form of swells and featured highly concentrated energy. A comparison with the best-estimated values shows that the wave heights of the 824 Large-Wave Event exceeded the 475-year return period standard at all comparison stations, confirming its classification as a rare catastrophic event. Even when compared with the 95% upper confidence limits, the wave heights of the 824 event still reached the standard corresponding to a 150–475-year return period, which further reflects its extreme nature. It should be noted that neither the PRDW Wave Report nor the large-scale wave simulations conducted in this study considered the influence of breakwaters on wave conditions.
- (2)
- Near-breakwater wave transformation and wave-field amplification
The refined simulation results of the local model reveal the extremely harsh hydrodynamic environment in the vicinity of the breakwater body, which provides a plausible hydrodynamic mechanism contributing to armor unit detachment. The significant wave height can exceed 5 m at the location 300 m in front of the breakwater (measured from the central axis) and surpass 7 m on the breakwater body. Violent wave breaking occurs on the sloped surface of the breakwater. When the massive broken waves slam into the armor layer, the water flow will rush into the gaps between the armor units at high speed. Given the nearly incompressible nature of water, its kinetic energy is rapidly converted into enormous pressure, generating highly transient impact forces. Such slamming pressure exerts upward lifting and outward pushing effects between the armor units, directly weakening the interlocking force among them, and its destructive capacity is far greater than the drag force induced by steady water flow [15,16].
Particularly at the turning section of the main breakwater, the wave patterns and flow fields are extremely complex. This region exhibits the characteristics of both the shore-parallel segment and the shore-normal segment simultaneously. On the one hand, waves undergo multi-directional reflections along the curved axis, forming complex standing waves and thus resulting in intense wave run-up. On the other hand, in the area adjacent to the shore-normal segment, water depth-induced wave breaking takes place due to the shallow water depth along the breakwater body, generating extremely strong flow velocities. These high flow velocities act continuously on the armor units and their gaps, enhancing the impact forces on the structure, which is the primary factor causing the detachment of armor units at the turning section of the main breakwater.
5. Conclusions
By establishing a high-precision wave model for Chancay Port, this study verifies that the 824 Large-Wave Event was an extreme swell event with a return period exceeding 475 years, and reveals the complex hydrodynamic processes induced by the event in the main breakwater area as well as the intrinsic mechanism that ultimately led to the local damage of armor units. The main conclusions are presented as follows:
- (1)
- The 824 Large-Wave Event was an extremely rare and exceptionally severe long-period swell event. Based on the regional reconstruction, the offshore significant wave heights at the comparison stations exceeded the 475-year return-period standard when using the best-estimated values. Even when considering the 95% upper confidence limits, the event still corresponds to a 150–475-year return-period level, confirming its extreme nature.
- (2)
- Simulations using the Boussinesq equation model reveal a highly energetic and spatially non-uniform near-breakwater wave field during the event. The significant wave height can exceed 5 m at approximately 300 m in front of the breakwater (measured from the central axis) and surpass 7 m on the breakwater body. The turning section shows pronounced wave-field amplification associated with multi-directional reflections and standing-wave patterns, accompanied by intense wave run-up.
- (3)
- The local-scale results indicate that violent breaking in the vicinity of the armor layer may create highly impulsive hydrodynamic conditions. In particular, wave breaking on the sloped surface provide a plausible hydrodynamic explanation for the observed spatial concentration of armor-unit detachment during the event.
- (4)
- These findings highlight that, for swell-exposed ports with similar breakwater geometry, the turning section may represent a critical zone for localized amplification and impact-prone conditions. The present results can support event interpretation and risk-informed assessment, and can serve as a hydrodynamic basis for subsequent, more detailed structural checks and mitigation planning if required.
Author Contributions
Methodology and Formal analysis, X.L.; Investigation and Data curation, H.W. and J.L.; Writing—original draft, X.L.; Writing—review and editing, J.L.; Supervision, N.J. All authors have read and agreed to the published version of the manuscript.
Funding
This research received no external funding.
Institutional Review Board Statement
Not applicable.
Informed Consent Statement
Not applicable.
Data Availability Statement
The original contributions presented in this study are included in the article. Further inquiries can be directed to the corresponding author.
Conflicts of Interest
Author Xuanyuan Liu was employed by the company CCCC Fourth Harbor Engineering Co., Ltd. Author Hao Wu was employed by The Second Engineering Company of CCCC Fourth Harbor Engineering Co., Ltd. Author Jiaqi Lan was employed by CCCC Fourth Harbor Engineering Institute Co., Ltd. The remaining authors declare that the research was conducted in the absence of any commercial or financial relationships that could be construed as a potential conflict of interest.
References
- Winckler, P.; Correa, S.; Garreaud, R.; Carvajal, M. The late December 2024 North Pacific swells on South American coasts. Nat. Hazards 2025, 121, 14487–14511. [Google Scholar] [CrossRef] [Scilit]
- Aguirre, C.; Rutllant, J.A.; Falvey, M. Wind waves climatology of the Southeast Pacific Ocean. Int. J. Climatol. 2017, 37, 4288–4301. [Google Scholar] [CrossRef] [Scilit]
- Remya, P.G.; Vishnu, S.; Praveen Kumar, B.; Balakrishnan Nair, T.M.; Rohith, B. Teleconnection between the North Indian Ocean high swell events and meteorological conditions over the Southern Indian Ocean. J. Geophys. Res. Oceans 2016, 121, 7476–7494. [Google Scholar] [CrossRef] [Scilit]
- Zheng, Z.; Ma, X.; Ma, Y.; Huang, X.; Dong, G. Modeling of coastal infragravity waves using the spectral model WAVEWATCH III. Coast. Eng. 2021, 170, 104016. [Google Scholar] [CrossRef] [Scilit]
- Zheng, Z.; Dong, G.; Ma, X.; Dong, H.; Huang, X.; Tang, M. Investigation of multimodal wave climate using spectral partitioning and wave system tracking algorithms. Ocean Model. 2024, 188, 102327. [Google Scholar] [CrossRef] [Scilit]
- Zheng, Z.; Ma, X.; Huang, X.; Ma, Y.; Dong, G. Wave forecasting within a port using WAVEWATCH III and artificial neural networks. Ocean Eng. 2022, 255, 111475. [Google Scholar] [CrossRef] [Scilit]
- Dong, G.; Guo, L.; Zheng, Z.; Ma, X. Observations of coastal infragravity wave characteristics under swell-dominated conditions. Appl. Ocean Res. 2024, 148, 104032. [Google Scholar] [CrossRef] [Scilit]
- Rabinovich, A.B. Seiches and harbor oscillations. In Handbook of Coastal and Ocean Engineering; Kim, Y.C., Ed.; World Scientific Publishing: Singapore, 2009; pp. 193–236. [Google Scholar]
- Troch, C.; Terblanche, L.; Henning, H. Modelling and measurement of low-frequency surge motion associated with extreme storm conditions in the Port of Cape Town. Appl. Ocean Res. 2021, 106, 102452. [Google Scholar] [CrossRef] [Scilit]
- Zheng, Z.; Dong, G.; Ma, X. Special modes with narrow amplification diagrams in harbor oscillations: Definition and parametric study. Ocean Dyn. 2024, 74, 511–523. [Google Scholar] [CrossRef] [Scilit]
- Zheng, Z.; Ma, X.; Ma, Y.; Dong, G. Wave estimation within a port using a fully nonlinear Boussinesq wave model and artificial neural networks. Ocean Eng. 2020, 216, 108073. [Google Scholar] [CrossRef] [Scilit]
- Choi, Y.K.; Seo, S.N.; Choi, J.Y.; Shi, F.; Park, K.S. Wave prediction in a port using a fully nonlinear Boussinesq wave model. Acta Oceanol. Sin. 2019, 38, 36–47. [Google Scholar] [CrossRef] [Scilit]
- Zheng, Z.; Ma, X.; Dong, Y.; Dong, G. Nonlinear stiffness and hysteresis phenomena of harbor oscillations. Coast. Eng. 2025, 202, 104832. [Google Scholar] [CrossRef] [Scilit]
- Dong, G.; Zheng, Z.; Ma, X.; Huang, X. Characteristics of low-frequency oscillations in the Hambantota Port during the southwest monsoon. Ocean Eng. 2020, 208, 107408. [Google Scholar] [CrossRef] [Scilit]
- Bullock, G.N.; Obhrai, C.; Peregrine, D.H.; Bredmose, H. Violent breaking wave impacts. Part 1: Results from large-scale regular wave tests on vertical and sloping walls. Coast. Eng. 2007, 54, 602–617. [Google Scholar] [CrossRef] [Scilit]
- Cuomo, G.; Allsop, W.; Bruce, T.; Pearson, J. Breaking wave loads at vertical seawalls and breakwaters. Coast. Eng. 2010, 57, 424–439. [Google Scholar] [CrossRef] [Scilit]
- Yuksel, Y.; Cevik, E.; Sahin, C.; Rehber, B.; Polat, B.; Mustafazade, C.; Inal, U.; Ogur, M.U. Stability of single-layer cube armoured roundheads under wind and swell waves. Coast. Eng. 2026, 203, 104873. [Google Scholar] [CrossRef] [Scilit]
- Hersbach, H.; Bell, B.; Berrisford, P.; Hirahara, S.; Horányi, A.; Muñoz-Sabater, J.; Nicolas, J.; Peubey, C.; Radu, R.; Schepers, D.; et al. The ERA5 global reanalysis. Q. J. R. Meteorol. Soc. 2020, 146, 1999–2049. [Google Scholar] [CrossRef] [Scilit]
- Zheng, C.W.; Li, C.Y.; Pan, J. Propagation route and speed of swell in the Indian Ocean. J. Geophys. Res. Oceans 2018, 123, 8–21. [Google Scholar] [CrossRef] [Scilit]
- WW3DG. User Manual and System Documentation of WAVEWATCH III Version 6.07; Tech. Note 316; The WAVEWATCH III Development Group, NOAA/NWS/NCEP/MMAB: College Park, MD, USA, 2019. [Google Scholar]
- Ardhuin, F.; Rogers, E.; Babanin, A.V.; Filipot, J.-F.; Magne, R.; Roland, A.; Van Der Westhuysen, A.; Queffeulou, P.; Lefevre, J.-M.; Aouf, L.; et al. Semiempirical dissipation source functions for ocean waves. Part I: Definition, calibration, and validation. J. Phys. Oceanogr. 2010, 40, 1917–1941. [Google Scholar] [CrossRef] [Scilit]
- Hasselmann, S.; Hasselmann, K. Computations and parameterizations of the nonlinear energy transfer in a gravity-wave spectrum. Part I: A new method for efficient computations of the exact nonlinear transfer integral. J. Phys. Oceanogr. 1985, 15, 1369–1377. [Google Scholar] [CrossRef] [Scilit]
- Jiang, L.F.; Zhang, Z.X.; Qi, Y.Q.; Chen, R. Comparative Analysis of Wave Simulation Results of WAVEWATCH III and SWAN Models in the Northern Part of the South China Sea. J. Trop. Oceanogr. 2011, 30, 27–37. (In Chinese) [Google Scholar]
- Zheng, Z.; Dong, G.; Huang, X.; Ma, X.; Guo, L. Infragravity waves at the Hambantota port located in the North Indian Ocean. Appl. Ocean Res. 2023, 138, 103658. [Google Scholar] [CrossRef] [Scilit]
- Eldeberky, Y. Nonlinear Transformationations of Wave Spectra in the Nearshore Zone. Doctoral Dissertation, Delft University of Technology, Delft, The Netherlands, 1996. [Google Scholar]
- Hasselmann, K.; Barnett, T.P.; Bouws, E.; Carlson, H.; Cartwright, D.E.; Enke, K.; Ewing, J.A.; Gienapp, A.; Hasselmann, D.E.; Kruseman, P.; et al. Measurements of Wind-Wave Growth and Swell Decay During the Joint North Sea Wave Project (JONSWAP); Reiche A(81), No. 12, 01/01; Deutche Hydrological Institute: Hamburg, Germany, 1973. [Google Scholar]
- Battjes, J.A.; Janssen, J.P.F.M. Energy loss and set-up due to breaking of random waves. In Proceedings of the 16th International Conference on Coastal Engineering, Hamburg, Germany, 8 August–3 September 1978; pp. 569–587. [Google Scholar]
- PRDW. Chancay Multipurpose Terminal—New First Stage: Wave Study Technical Report; PRDW Aldunate Vásquez Ingenieros SpA: Cape Town, South Africa, 2019. [Google Scholar]
- Danish Hydraulic Institute. DHI MIKE 21 Boussinesq Wave Module, Scientific Documentation: MIKE by DHI; Danish Hydraulic Institute: Horsholm, Denmark, 2009. [Google Scholar]
- Fang, K.; Sun, J.; Liu, Z.; Yin, J.; Zhang, Z. New Numerical Solution Method for Boussinesq Water Wave Equation. Ocean. Eng. 2014, 32, 97–103. (In Chinese) [Google Scholar]
- Cai, Z.; He, C.; Liu, X.; Ding, J.; Chen, W. Simulation of Fragmented Waves and Water Inflow Based on One-Dimensional Double-Layer Boussinesq Model. Shipbuild. China 2023, 64, 246–256. (In Chinese) [Google Scholar]

Disclaimer/Publisher’s Note: The statements, opinions and data contained in all publications are solely those of the individual author(s) and contributor(s) and not of MDPI and/or the editor(s). MDPI and/or the editor(s) disclaim responsibility for any injury to people or property resulting from any ideas, methods, instructions or products referred to in the content. |
© 2026 by the authors. Licensee MDPI, Basel, Switzerland. This article is an open access article distributed under the terms and conditions of the Creative Commons Attribution (CC BY) license.