


Abstract
Background: Soft tissue sarcomas are rare and highly heterogeneous malignant tumors, often asymptomatic in the early stages. Accurate diagnosis and reliable assessment of the risk of metastasis, classified as low, intermediate, or high, are therefore essential for effective clinical decision-making. However, the application of Artificial Intelligence (AI) approaches to these diseases is often limited by the small size and quality of available datasets, which can compromise model robustness and reliability. Methods: The use of formal methods, based on mathematical modeling and logical verification, can be an alternative to AI techniques. When integrated with radiomics, formal methods provide a structured and interpretable approach to support disease diagnosis. Results: The proposed methodology yielded encouraging results, in line with those reported in the literature. A process was conducted to extract several first- and second-order radiomic classes, which were then selected based on their significance. The resulting models were evaluated using standard performance metrics and obtained 80% accuracy, 83% precision, and 83% recall. Conclusion: The transparency of formal methods improves the interpretability of models and radiomic features, allowing new links with clinical practice to be discovered. The proposed approach is presented as a feasibility and proof-of-concept framework aimed at improving interpretability. Given the very small cohort size, performance metrics should be considered preliminary and descriptive, as they require validation on larger external datasets before any clinical applicability can be claimed.
1. Introduction
Soft-tissue sarcomas (STS) comprise a cohort of rare and heterogeneous mesenchymal tumors, encompassing more than 100 distinct histological and molecular entities. STS can arise anywhere in the body, but most originate in the extremities, followed by the trunk, retroperitoneum, head and neck, and viscera. Although more common in middle-aged and older adults, STS can affect children and young adults. The most common STS subtypes are liposarcomas (LPS) and leiomyosarcomas (LMSs), with an incidence of <1/100,000/year each [1]. Adipocytic tumors account for approximately 20% of all STS [2]; however, their incidence is probably underestimated, as many lesions are benign and asymptomatic [3].
The degree of malignancy refers to the classification of the French Federation of Cancer Centers (FNCLCC), which includes grade 1 tumor: low grade; grade 2 tumor: intermediate grade; and grade 3 tumor: high grade [4]. In 2020, the World Health Organization (WHO) proposed a new STS classification, which distinguished these entities into benign, intermediate (locally aggressive), and malignant.
Malignant and intermediate adipocytic tumors are atypical lipomatous tumor well-differentiated liposarcoma (ALT/WDLPS), dedifferentiated liposarcoma (DDLPS), myxoid liposarcoma (MLPS), pleomorphic liposarcoma (PMLPS), and myxoid pleomorphic liposarcoma (MPMLPS) [5]. All adipocytic tumors, according to the WHO classification 2020, are reported in Table 1. This classification takes into account the FNCLCC classification of grade.
Table 1.
List of all adipocytic tumors according to the WHO classification 2020.
Many works on the analysis of STS with radiomics and Artificial Intelligence (AI) are beginning to appear in the literature [6,7]. The latter techniques are very delicate to deal with as they have specific needs, such as a large amount of data to learn from and to subdivide to perform validation. With so much data, it also becomes difficult to explain to workers the decisions they make based on the images. It can be understood that it is very difficult to apply these techniques to rare disease diagnoses because being rare means they do not constitute a large amount of data like more common diseases (e.g., tumors and lung diseases, etc.).
That is why this paper proposes competing AI techniques such as formal methods [8], i.e., mathematical methodologies that allow the user to understand the entire path of the data flow up to the final decision. In this formal field, even the smallest datasets manage to build a robust classification model. In this formal field, even small datasets may support the development of transparent and testable classification rules, although robust validation and generalizability remain dependent on larger cohorts.
In particular, in this study, the authors will analyze the differences between low-grade and high-grade liposarcomas. The work focuses on T1- and T2-weighted magnetic resonance imaging (MRI) images of liposarcomas, extracting first- and second-order features. The features are evaluated for individual significance in diagnosis; thus, numerical values are identified that effectively contribute to the diagnosis, according to the metrics of accuracy, precision, and recall. This step provides clearer information than AI black-box methods by linking numerical values to radiological evidence.
2. Materials and Methods
2.1. Radiomics
Quantitative biomedical image analysis makes it possible to detect information from images of patients with liposarcoma in the lower limbs. This analysis tool is non-invasive and painless, and does not replace the physician but supports the medical expert in the diagnosis of the lesion and the identification of the most appropriate treatment [9]. The classification of the intensity and severity degree of the lesion is also possible through the analysis of radiomic biomarkers. In the proposed study, the analyzed images were acquired using MRI so that for each patient it is possible to have two types of images: T1-weighted and T2-weighted DICOM images (Digital Imaging and Communication in Medicine) [10]. The analysis included only T1-weighted and T2-weighted images to test the feasibility of the most commonly available sequences within the availability of the public dataset.
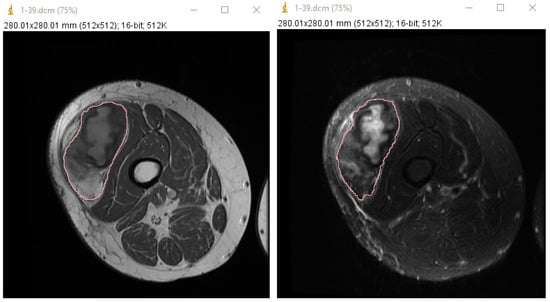
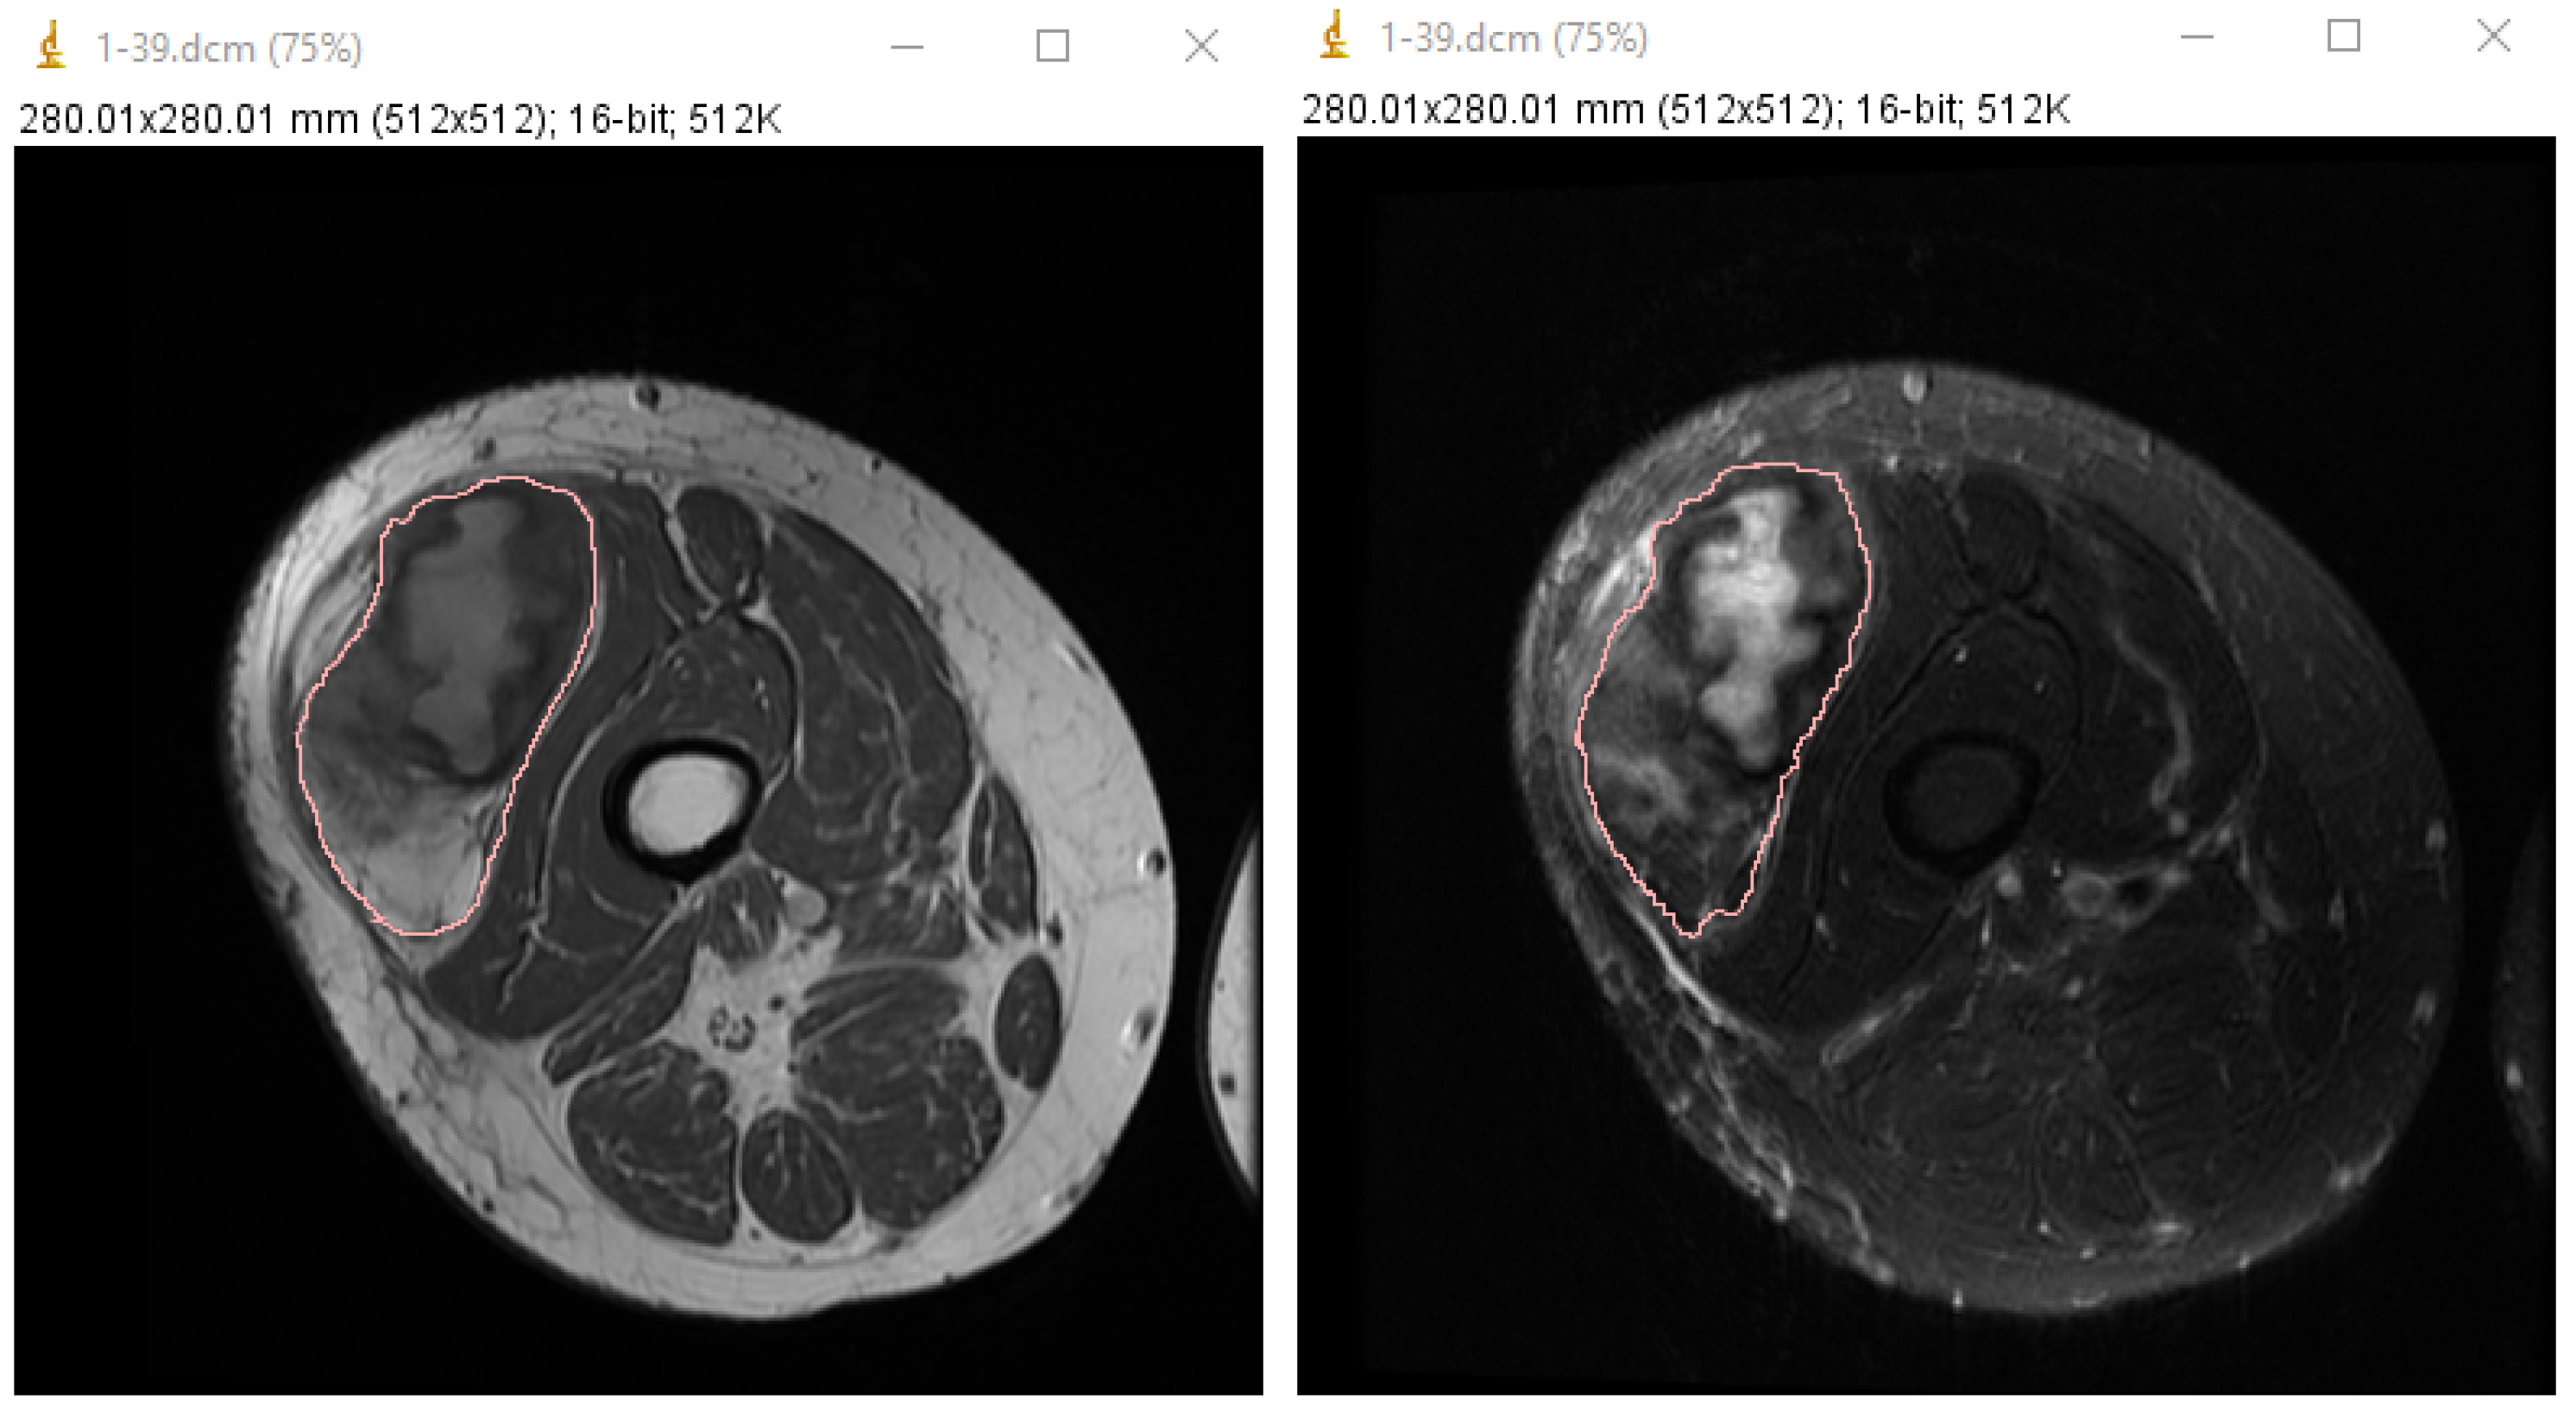
With radiomics, it is possible to extract and analyze all the numerical information present in the images that cannot be perceived by the naked eye [9]. The selected images are analyzed using ImageJ (version 153 Win Java 8), an open-source software [11] created and developed by the US National Institutes of Health, which is based on the Sun-Java programming language. Once a medical image has been taken as input, the ROI is carried out: the software allows automatic or manual segmentation. In this case, we chose to carry out a manual one only of the lesion of interest, i.e., the liposarcoma, as shown in Figure 1.
Figure 1.
On the left, pink is the ROI performed on the T1w image for a patient with low grade liposarcoma in the right quadriceps, while on the right figure, there is the same ROI performed on the T2w to extract the radiomic features and make the analysis possible.
First-order and second-order features are then extracted, in particular, the GLCM class of features. In this way, we search for a distinction between patients with a high-grade tumor and patients with a low- to medium-grade neoplasm. The descriptors translate the information in the MRI scans into numerical values.
A selection of relevant features is made to distinguish between severely ill patients and patients with low- to medium-grade malignancy, i.e., between patients with a higher probability of recurrence and metastatic risk than patients without such a risk. Subsequently, certain properties about value thresholds are established, checking which patients comply with these features established ’by the disease’. Metrics like accuracy, recall (sensitivity), and precision are determined to establish the goodness and Accuracy of the classifier concerning the model created.
2.2. Cohort Group
This work is carried out considering a public dataset described in the article in reference [12], from which were extracted 10 sick patients aged between 29 and 80 years, both female and male. The patients are all affected by liposarcoma located in the thigh. These patients are classified according to the degree of malignancy of the lesion: 6 have high-grade malignancy, 3 low-grade, and 1 intermediate-grade. Each grade is associated with a different histological type of liposarcoma. An example of MRI images is displayed in Figure 1.
For the included cases, histological grade and subtype information (FNCLCC) was available in the public dataset; however, subtype-level stratified analyses were not the primary objective of this feasibility study. A subtype-specific validation with radiologic correlation will be the object of further studies to assess the biological meaning of quantitative descriptors.
The selected images are analyzed using ImageJ, an open-source software [11] created and developed by the US National Institutes of Health, which is based on the Sun-Java programming language. As the study relies on this public multicenter dataset, scanner and protocol variability may be present and can influence some texture features. Therefore, the proposed thresholds should be considered preliminary and potentially dataset-dependent. Larger external validatation is required, and also harmonized acquisition and preprocessing pipelines to assess cross-scanner generalizability.
Once a medical image has been taken as input, the ROI is carried out: the software allows automatic or manual segmentation. In this case, we choose to carry out a manual one only of the lesion of interest, i.e., the liposarcoma, as shown in Figure 1. ROIs are manually contoured in ImageJ with a whole-lesion approach on the most explanatory selected axial slice, following the outer tumor margin to capture intralesional heterogeneity. We acknowledge that liposarcomas may present indistinct margins and heterogeneous internal components and that manual segmentation can be operator dependent. However, formal inter-/intra-observer agreement assessment is beyond the scope of this feasibility study, and it will hopefully be a focus for future work, together with robustness analyses of feature stability and evaluation of semi-automated/automated segmentation strategies.
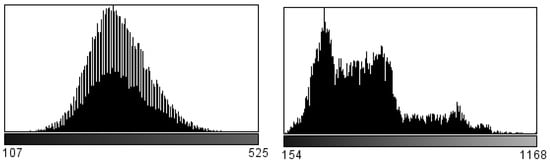
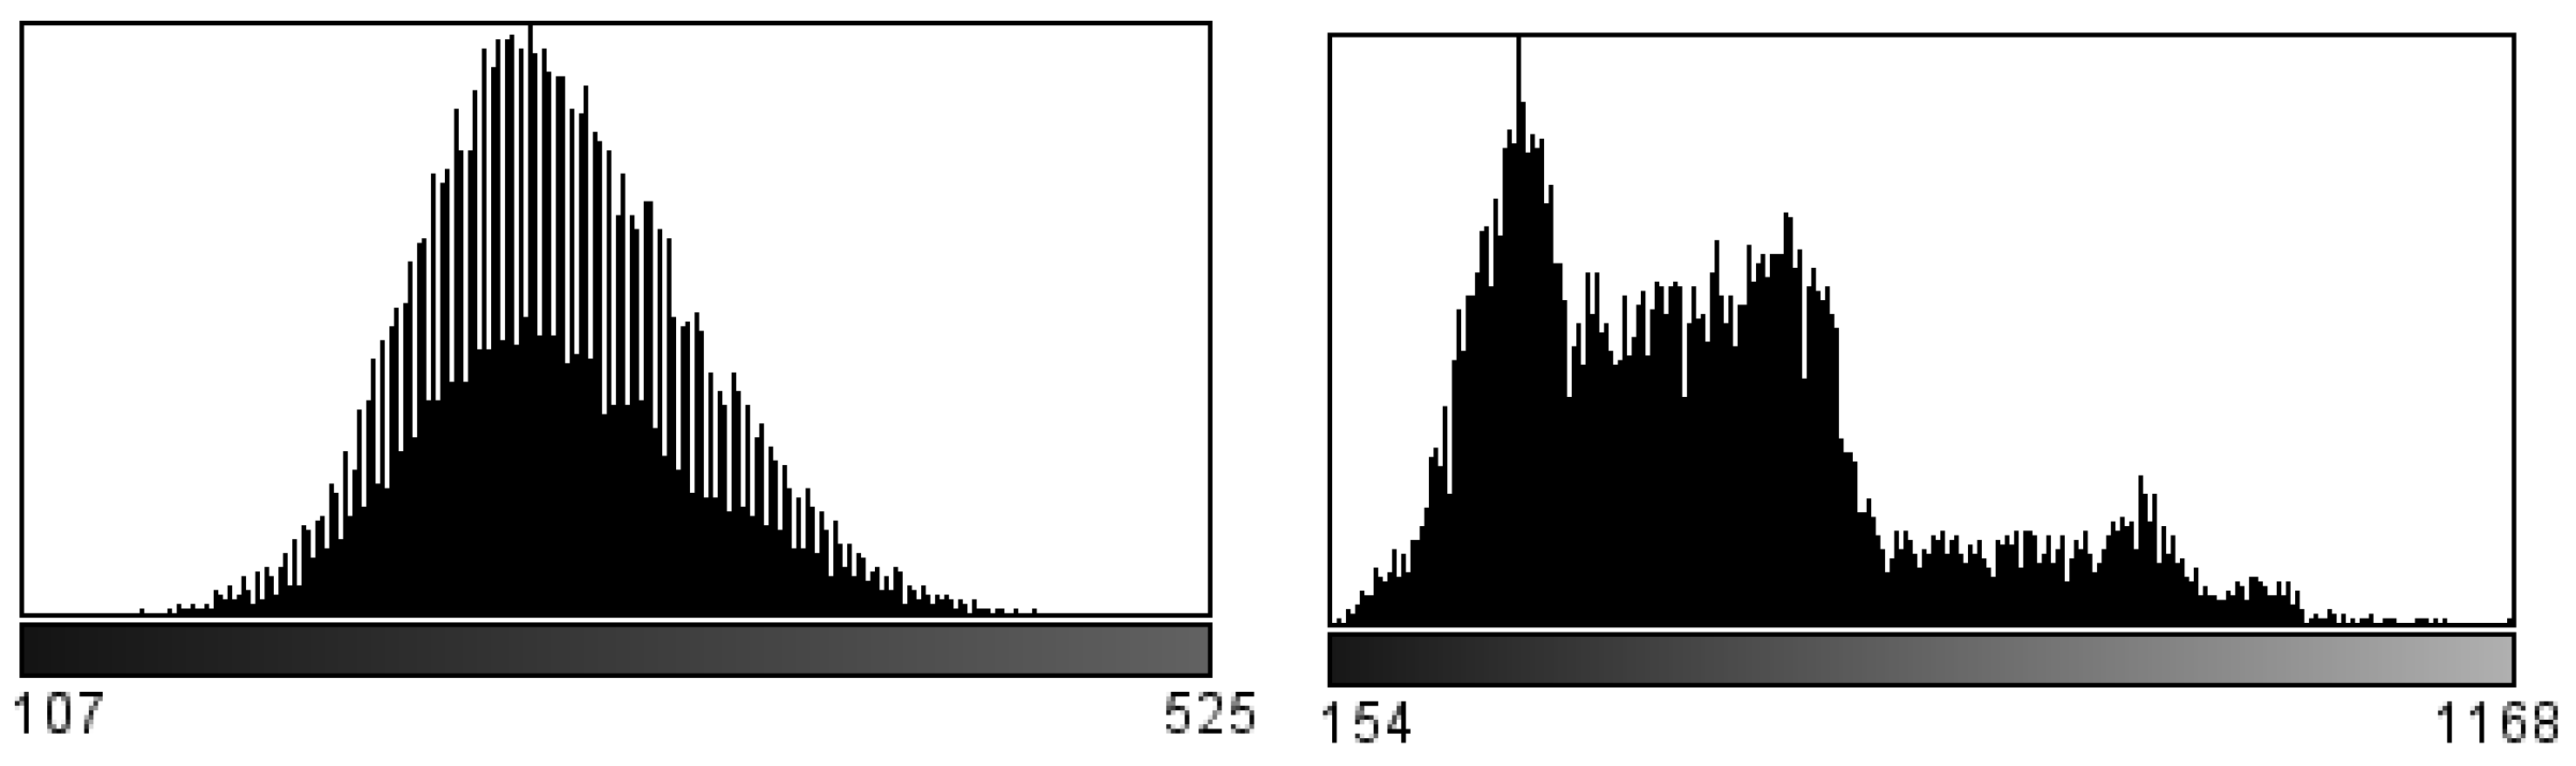
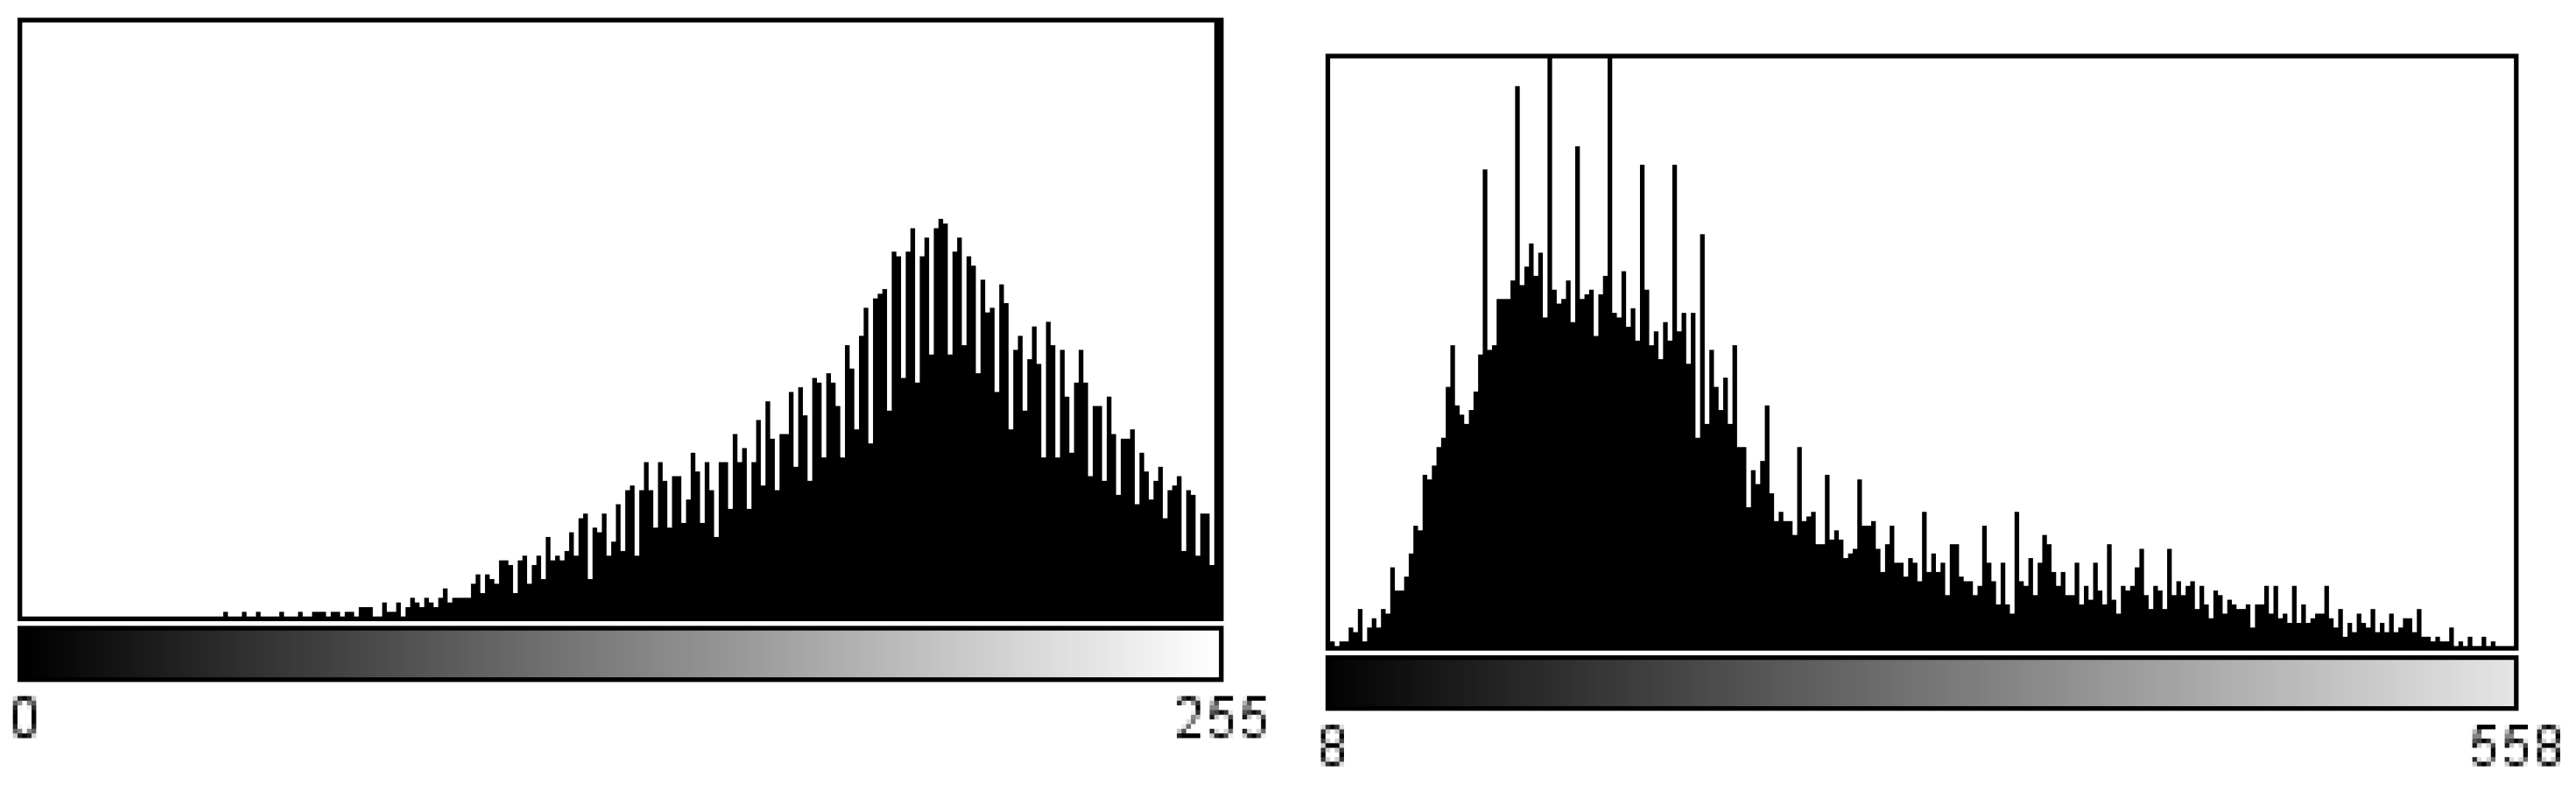
First-order features and second-order features are then extracted, in particular, the GLCM. In this way, a distinction is made between patients with a high-grade tumor and patients with a low- to medium-grade neoplasm. The descriptors translate the information in the scans into numerical values. The first-order features do not consider the spatial relationship of the voxels. In them, the difference regarding T1 and T2 weighting is evident. The histograms of the gray level distribution, presented in Figure 2 and Figure 3, of the respective image series, show that the difference is very obvious.
Figure 2.
On the left is the histogram of a patient with high-grade liposarcoma, while on the right, there is the histogram of a patient with low-grade liposarcoma. Both images are analyzed on a T1w MRI image.
Figure 3.
Replicated analysis on T2w MRI images. On the left is the histogram of a patient with high-grade liposarcoma, while on the right, there is the histogram of a patient with low-grade liposarcoma.
The histograms refer to high-grade and low-grade liposarcoma. In the first T1 Figure 2, the pathology is not particularly distinguishable. In fact, the graph shows how the pixels that make up the ROI oscillate towards darker shades of gray. Not only do the histograms change in the numbers of gray levels and extremity values, but especially in the distribution of values between low- and high-grade sarcoma.
The histogram weighted in T2, in Figure 3, shows how the pixels in the region of interest are distributed: it means how the liposarcoma shifts towards lighter gray values. The information provided from T1w and T2w is not different but complementary. This is crucial in order to assess in the T1 image where the part of fat is less visible in relation to other organs or adjacent tissues. In the diagnostic field, this distinction is very relevant because it increases the performance classification of liposarcomas and their degree.
In order to be able to create a predictive model, FIRST and GLCM classes of features are discretized: it is determined which of those obtained a real contribution to the construction of the model. A feature selection is carried out, made of the relevant features in the distinction between severely ill patients and patients with medium- to low-grade neoplasia, i.e., between patients with a higher probability of recurrence and metastatic risk than patients with no such risk. Subsequently, certain properties are established, it is checked which patients comply with these characteristics established ’by the disease’, and the metrics of accuracy, recall (sensitivity), and precision are determined in order to establish the goodness and accuracy of the classifier in relation to the model created. The proposed methodology is explained conceptually in the image Figure 4.
2.3. Formal Methods
In today’s world, security and reliability are fundamental requirements for the design of complex software systems, since failure may not be acceptable and would cause losses in terms of human resources as well as economics. For current Artificial Intelligence (AI) techniques, verifying the correctness of a system includes data testing from a selected dataset and simulation or validation on a selected dataset. These methods, however, present a major problem: they only verify the correct behavior of the system under consideration on a part of the possible computations.
Formal Methods [13], on the other hand, represent a set of structured techniques that support the development of critical systems to prove the correctness of the system with mathematical rigor, providing effective verification techniques and tools, and reducing the time of the verification process, while simultaneously increasing the degree of coverage.
Formal verification (through the agent called model checking) uses systems modeled according to the Labeled Transition System (LTS) [14,15] that involves the use of a set of nodes and a set of labeled branches to connect the nodes that together form a graph. Each node represents a state of the system, while the labeled branch indicates the transition of the system from one state to the next through a certain action. If we consider an automaton to be a time-invariant dynamical system used to describe a formal language, it is useful to model it through a classical algebraic approach using a series of processes obtained through Milner’s Calculus of Communication Systems (CCS) [16].
The CCS specification language defines operators for the construction of finite processes and the execution steps that can be taken by a process based on primitive constructs that reflect operational ideas. Thus, CCS may be thought of as an automaton transformed into ’text’ containing the processes for all the slices that make up the image and formally defined using a set of conditional rules that describe the automaton’s transition relationship corresponding to the defined behavior expression.
Figure 4.
Radiomics workflow: the formal methods technique collects all the radiomics data and uses it to build a property that will be checked by the model checker.
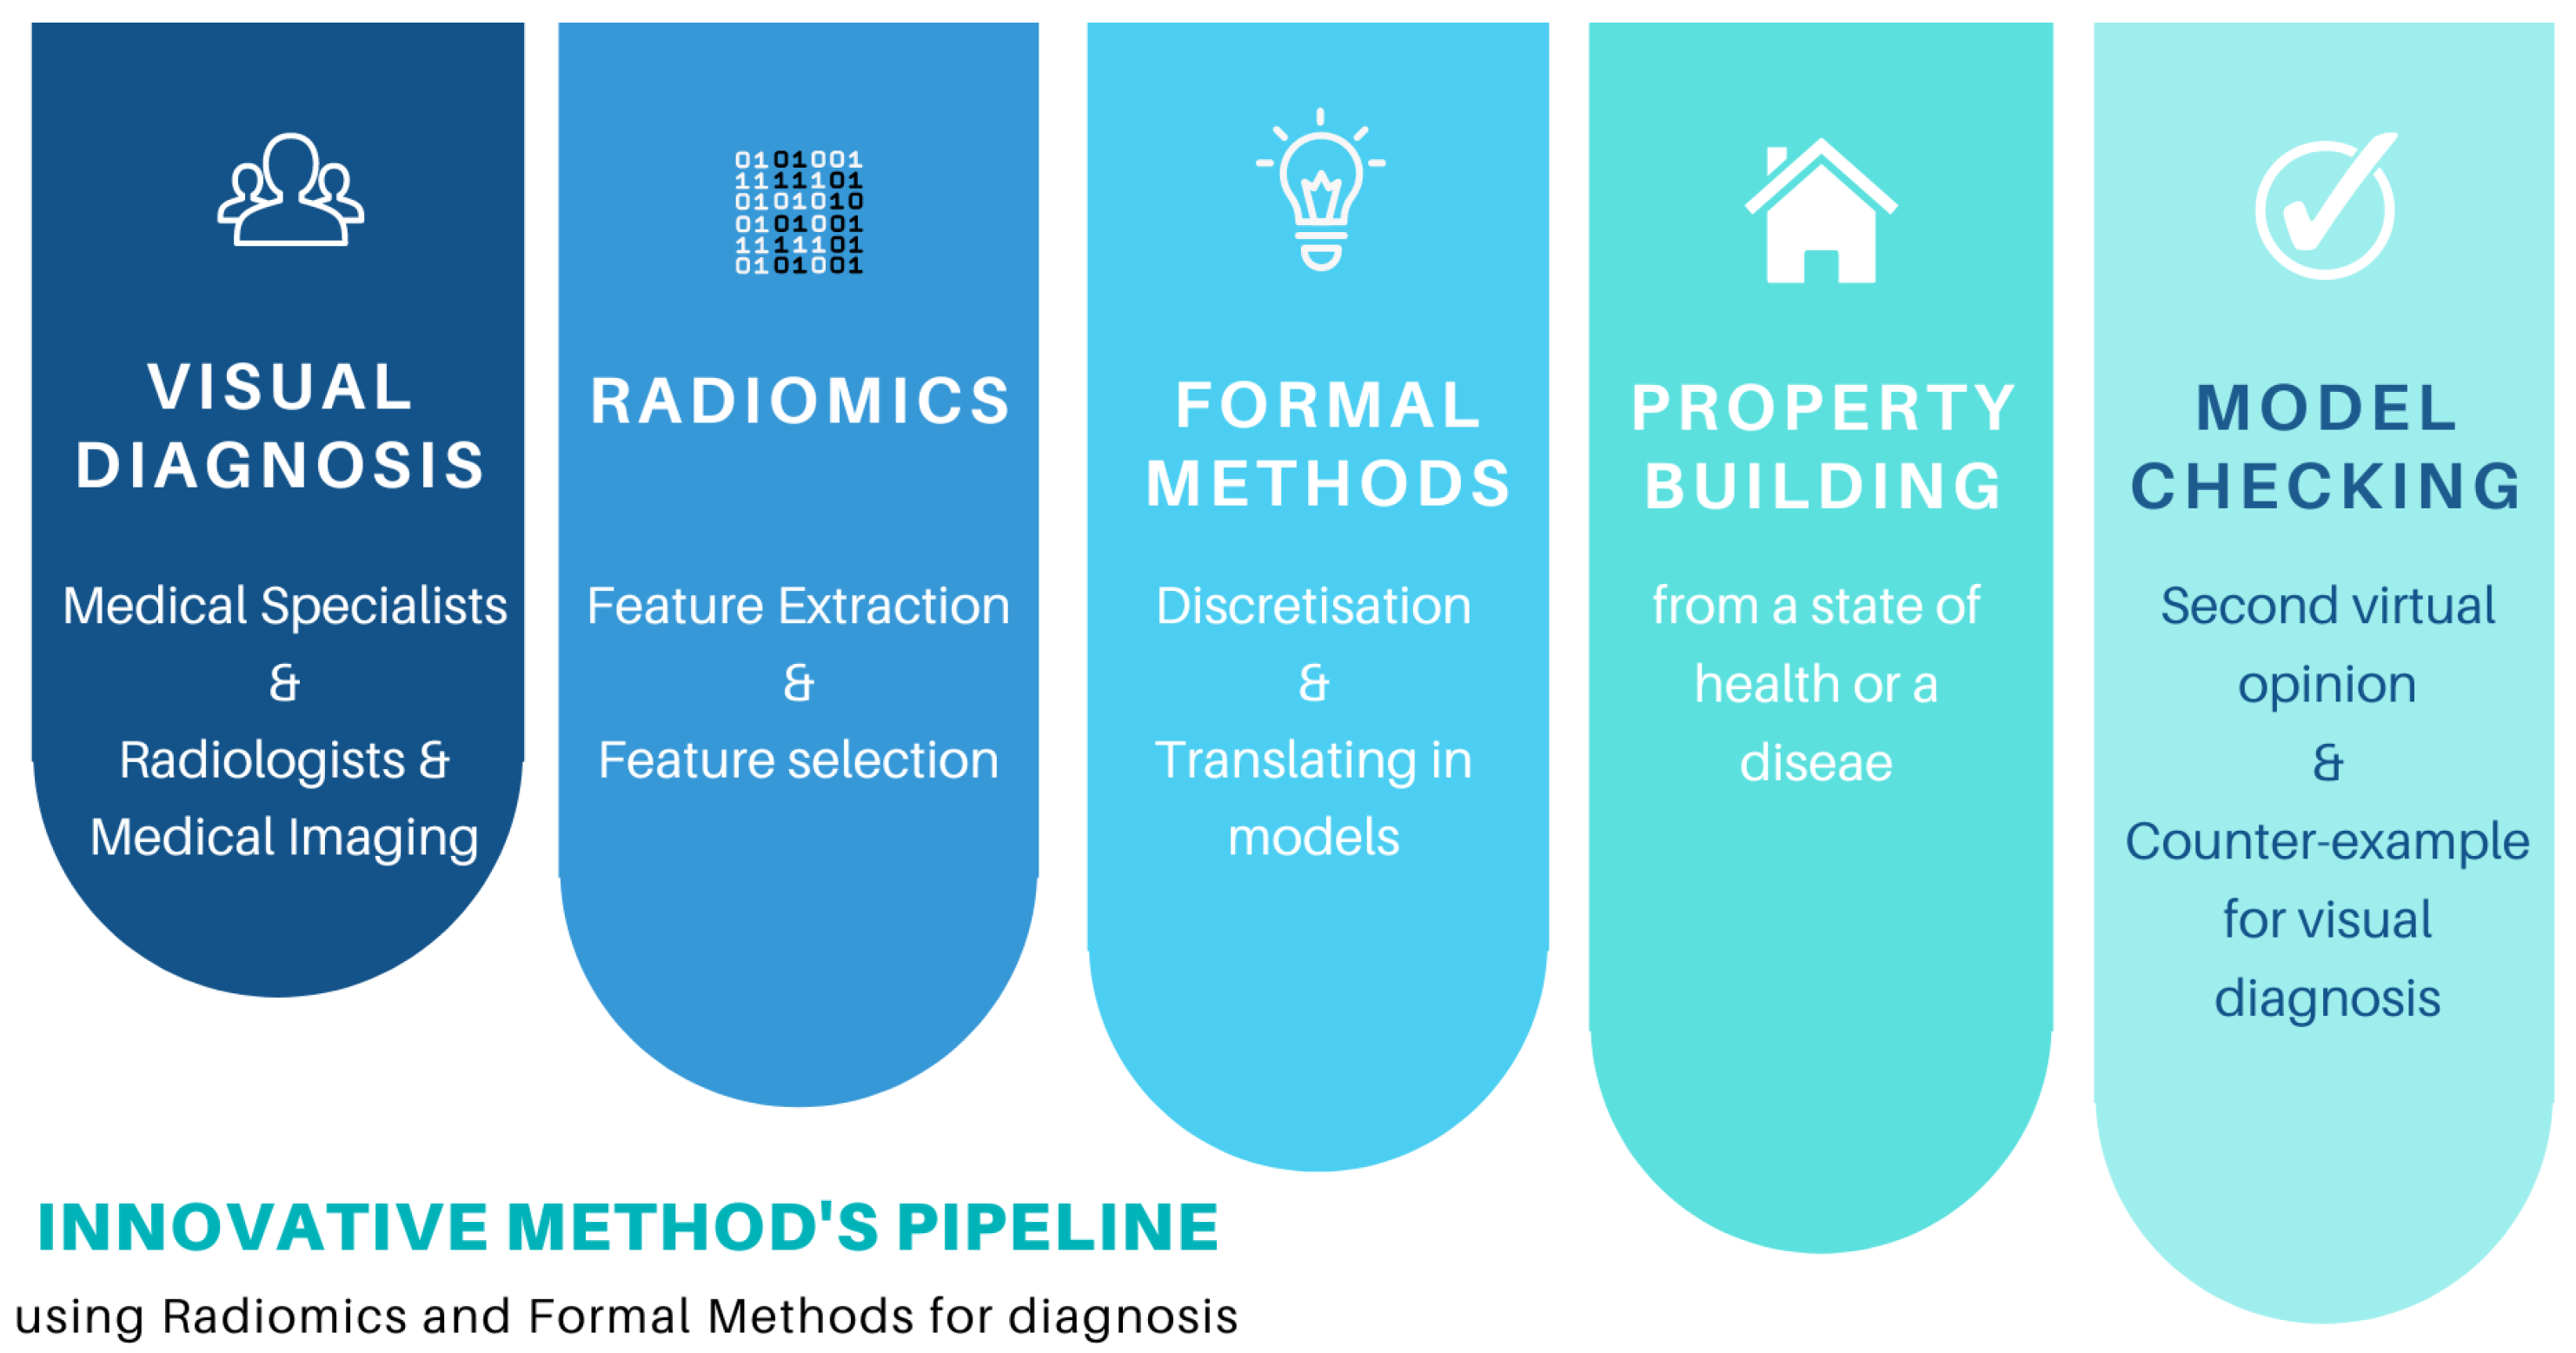
The formulation of the property makes it possible to identify the disease through the powerful syntax of the formal methods. In this way, and thanks to the three-level discretization, it is possible to identify the difference between a healthy and a sick individual.
The properties are developed thanks to the collaboration of physicians and engineers, because when using formal methods, it is necessary to describe the correct functioning of the system under examination, declaring which actions are not allowed and which are allowed. From this point of view, the property represents the state of health of the patient and therefore must be satisfied by the model. Therefore, if the rule is verified, it means that the patient reflects what the property predicts, and consequently, the patient can be either healthy or ill.
The model checking (MC) [17,18] is a powerful reasoning technique used in the world of computing and is becoming an integral part of standards and systems development cycles. In the context of MC, systems are modeled with transitions, and the property is specified through temporal logic, i.e., actions with durations, goal achievements, and temporal aggregations, which cannot be handled in standard point logics. Subsequently, the specification is verified on a model of the system itself, which in our case is a patient, leading the problem back to a search on graphs. The essential elements to be supplied to the model checker for analyzing and checking models are the LTS model obtained by appropriately modeling the system with the MC description language and the formula arrived at by formalizing the property under examination with the MC specification language. After execution, which verifies the model and the property, we move on to analysis and then to the two options:
- Property satisfied (TRUE) by the model, it means the model comprises the property actions;
- Property not satisfied (FALSE) by the model. A counterexample is proposed, which can be studied in such a way that the model and/or the property under examination can be improved in order to repeat the analysis again.
These values can help researchers to move to a final decision, which is the diagnosis. The verification step is fully automatic, and every time a desired property is violated, a counterexample is provided to show which behavior falsifies this property: this is extremely useful for the result validation process because it provides explanations to the radiologist who is using the system. Furthermore, this gives the technique a greater power of explanation that can be exploited by specialist doctors in their daily activities and to enrich scientific research. The whole methodology is detailed in Figure 5.
Figure 5.
Overview of the proposed methodology integrating radiomics and formal modeling for liposarcoma grade classification.
3. Results
Multiple slices per patient were analyzed, as available in the public dataset [12]. A manual ROI segmentation of the lesion was performed using ImageJ [11]. Radiomic features were extracted from each segmented slice and aggregated at the patient level for model construction.
Radiomic features (first-order and GLCM-based second-order descriptors) were automatically computed using ImageJ’s built-in texture analysis functions [11]. The GLCM matrices were calculated according to the default ImageJ implementation, which computes co-occurrence matrices over the ROI using standard pixel adjacency. In this work, the pixel offset was set to 1 with horizontal direction (). Symmetric and normalized co-occurrence matrices were generated, and the features were derived from the normalized GLCM. No additional gray level quantization was applied beyond the intensity scale of the image.
Feature discretization was performed using a three-level equidistant binning strategy. For each continuous radiomic feature, the range between minimum and maximum observed values was partitioned into three equal-width intervals. Each feature value was therefore mapped into one of three discrete levels (low, medium, and high), enabling formal modeling within the formal methods framework. This discretization step is essential for translating quantitative radiomic values into symbolic states suitable for formal verification.
Please note that these levels are different from those of the severity of the disease. For example, the high degree of the disease may have all low-bin features, or vice versa.
Radiomic features, once discretized, were encoded as states in a Labeled Transition System (LTS) using the Calculus of Communicating Systems (CCS). Each patient was modeled as a set of CCS processes whose transitions correspond to the discrete feature levels. An example of the CCS model is detailed below.
The verification phase was conducted using the default version of the Concurrency Workbench (CWB), which allows -calculus property verification. The diagnostic properties were formalized using -calculus formulas. For example, a simplified property structure used for high-grade classification can be expressed as:
This property verifies whether the modeled patient process satisfies the combination of discretized radiomic thresholds corresponding to high-grade malignancy. If the -calculus formula is satisfied by the CCS model, the patient is classified accordingly. If not, the model checker provides a counterexample trace, enabling interpretability and verification.
To clarify the implementation process, we provide an example. Consider a patient with the following features: and . According to creating an equidistant discretization, these values are translated as and . The corresponding CCS model of the first ROI will be encoded as . The model checker evaluates, at least, whether the levels of features in the model of the patient are the same as the property of high-risk classification, giving TRUE or FALSE.
Based on the features considered and the properties observed by the computer scientists and radiologists, the authors calculated the performance of each feature in the diagnosis. For the first order features, three descriptors are considered as discriminant:
- Minimum: indicates the minimum gray intensity value in the region under consideration, where the disease is evident, considering a value greater than 60.0 with respect to patients with low to medium lesions;
- Maximum: indicates the maximum gray level intensity value in the ROI. It is assumed as a second property to consider a maximum value greater than 900.0 with respect to patients with medium- to low-grade lesions;
- Median: is an index of the amount of symmetrical gray level values in a histogram; authors consider a value of less than 500.0 with respect to low-median.
The results show that accuracy respects all three properties with a good value, as shown in Table 2. In particular, recall shows the highest values. For the best property of this radiomic class, we also put the confusion matrices in Table 3, and we calculated percentile-based 95% confidence intervals. In this case, first-order class helps in the classification of low-risk patients.
Table 2.
Classification performances of first-order features.
Table 3.
Confusion matrix for the first-order class.
For the GLCM features, the following descriptors are considered:
- Correlation: indicates the linear dependence of the measurement of the gray level values on the voxels in the GLCM. The following property is established: a value greater than 0.106 is considered with respect to patients with medium- to low-grade liposarcoma.
- Entropy: this characteristic is related to the order of the gray intensity pairs with respect to the matrix voxels. It indicates how the differences in intensity between two neighboring pairs vary. The greater the disorder, the more this index increases. In this case, the peculiarity evaluated is whether we consider which low-medium grade liposarcoma patients have a higher entropy value than 1.23.
- Contrast (or sum of quadratic variances or inertia): is an index of the difference in values between each pair of grays. It indicates the local intensity variation. In this case, a contrast value of 3.395 is considered to be higher than for patients with low to medium lesions.
As displayed in Table 4, second-order features maintain very good accuracy metrics. In this case, recall also retains high values. For the best feature of this radiomic class, we also put the confusion matrices in Table 5, and we calculated percentile-based 95% confidence intervals. In this case, the GLCM class is more useful in the classification of high-risk patients.
Table 4.
Classification performances of the GLCM class.
Table 5.
Confusion matrix for the GLCM class.
From a radiologic perspective, the observed thresholds may reflect underlying tissue composition differences between low- and high-grade liposarcomas, which are typically characterized by increased cellularity, thick septa, and non-adipose nodular components.
The elevated GLCM contrast observed in high-grade tumors may correspond to abrupt signal transitions between adipose and solid components, reflecting intralesional heterogeneity [19]. Similarly, increased entropy may capture architectural disorder within aggressive lesions. The higher correlation values could indicate structured spatial dependencies related to fibrous septa or organized cellular regions [20].
Although no direct radiologic–histopathologic mapping was performed in this feasibility study, these hypotheses suggest that formalized radiomic thresholds may encode imaging patterns that are, at least in part, recognizable on MRI. However, at the present stage, these findings should be regarded as hypothesis-generating and may support future radiologic–pathologic correlation studies rather than being considered directly actionable for intervention or treatment selection.
4. Discussion
The key innovation of this study lies mainly in demonstrating the feasibility of formalizing radiomic descriptors into verifiable logical properties. Unlike conventional machine learning approaches [21], where decision boundaries emerge from data-driven optimization processes, the proposed framework encodes diagnostic knowledge into explicit mathematical rules that can be formally verified and explained [8].
This formalization step transforms quantitative image biomarkers into symbolic states, enabling them to be integrated into a model-checking environment. The resulting system then produces a classification label while providing a logical trace of the decision-making process [22]. In the event of a property violation, counterexamples are generated, providing an additional layer of interpretability that is typically not available in black-box AI models [23].
From an image-omics perspective, this approach represents a shift from feature extraction as a purely statistical process to feature formalization as a knowledge encoding process [24]. In rare diseases such as liposarcoma, data-only models may exhibit instability and overfitting. The formal methods-based framework presented here offers an alternative paradigm in which diagnostic reasoning is structured and testable, rather than statistically inferred. Although the current results are preliminary, this paradigm could open new directions for integrating quantitative imaging with mathematically rigorous verification systems. Furthermore, radiomic descriptors, such as intensity-based metrics and those derived from GLCM (as in other studies [25]), are not only used as numerical predictors, but are translated under structured logical conditions. This conceptual phase links quantitative imaging and formal reasoning, potentially enabling reproducible and transparent decision support systems even in rare disease settings where large datasets are not available. A summary of the state of the art in liposarcomas analysis appears in Table 6.
Table 6.
Summary of existing radiomics-based studies on lipomatous tumors and comparison with the proposed formal-methods-based framework.
Morphological and histological characteristics are partly shared with both forms of benign and malignant lesions, so differential diagnosis is difficult but fundamental for correct management [28]. Often, due to the rarity of liposarcomas and the high frequency of lipomas, patients undergo unsuitable surgery with increased morbidity that could be avoided with a careful clinical and radiological evaluation of the tumor. In the benign group, lipoma is the most common, with a peak of incidence between the ages of 40 and 60 years, and rarely occurs in children [3].
In the intermediate group, there are the local aggressive tumors, atypical lipomatous tumors (ALT), and well-differentiated liposarcoma (WDLPS). ALT is used for superficial lesions of the extremity and trunk instead of WDL for deep lesions (retroperitoneum, mediastinum, and paratesticular). ALTs and WDLPSs occur mostly in middle-aged adults with a peak incidence in the sixth and seventh decades and are also at risk of malignant transformation and local recurrence, mostly the WDLPSs [3]. Lipoma and ALT/WDLPS have different surgical management: in ALT, extracapsular a bloc simple excision is performed, whereas for lipomas, extra- or intracapsular excision can be done [29].
In the malignant group, DDLPS represents 18% of all liposarcomas [3], with a high local recurrence rate, between 40% and 100% if located in the retroperitoneum. DDLPS mostly outgrow ALT/WDLPS [30] with metastasis in 15% to 20% of cases [2,3]. The second most common subtype of liposarcoma is the myxoid liposarcoma (MLPS), a continuum from low-grade myxoid tumors, and represents 20% of liposarcomas, more common in the fourth and fifth decades [31].
Pleomorphic liposarcoma is the least common subtype, with the peak incidence in the seventh decade [3] and an especially high rate of local recurrence and distance mediatization up to 35% [32]. Myxoid pleomorphic liposarcoma (MPMLPS) is a clinically aggressive adipocytic neoplasm occurring in young patients with a high recurrence rate; metastasis to lung, bone, and soft tissue; and a poor survival rate. It presents mixed histological features of MLPS and PMLPS.
4.1. Clinical Management
Because the clinical examination is usually non-helpful, guidelines suggest imaging with MRI for deep masses of any size, surface masses >5 cm, or rapidly growing masses. All of these features should be considered suspicious for sarcoma and treated as such or referred to Centers of High Specialization for biopsy [1,33].
Molecular testing on biopsy samples helps distinguish lipoma from ALT/WDLPS/DDLP S [29]. MDM2 analysis with FISH studies made differential diagnoses between ALT and lipoma, with 92% to 100% specificity and 97% to 100% sensitivity. CDK4 is also amplified in approximately 85% to 90% of ALTs; T(12;16) translocation, which leads to an FUS-DDIT3(CHOP) gene fusion, it is present in 95% of cases of MLPS [3]. The standard surgical procedure is an en bloc excision with R0 margins. But, as an individualized option, R1 excision can be acceptable in selected cases; in particular, marginal excisions along the pseudocapsule are advised for ATLs [1]. Some subtypes, such as WDLPS and DDLPS, are radioinsensitive and chemosensitive, in the opposite of MLPSs, which are typically chemosensitive and radiosensitive. So, it is fundamental to precisely differentiate the subtype and the grade because it may change surgical and therapeutic management.
MRI is recommended by the European Society of Musculoskeletal Radiology (ESSR) [32] and by the European Society for Medical Oncology (ESMO) [1] because it allows assessment of lipomatous tumors relying on qualitative features such as lesion size, depth, signal heterogeneity, thick septa, and non-adipose nodular components (often highlighted by enhancement). More in detail, a quality assessment of the lesion with identification of the signs that can indicate malignancy, as size (>5 cm), deep localization, heterogeneous signal, and the presence of thick septa (>2 mm) with enhancing nodules. Also, MRI allows the study of the anatomical relationships of the tumor with the adjacent structures for optimal surgical planning and guides biopsy [1,29,33]. A CT scan of the thorax is recommended for staging purposes, especially in MLPS [29]. In this feasibility study, intensity descriptors and texture measures serve as quantitative proxies for qualitative impressions by quantifying variations in signal intensity and spatial heterogeneity within the lesion. However, without a dedicated radiologic–histopathologic mapping, these connections remain hypothetical, and future studies should correlate radiomic patterns and histological components (fat, fibrous septa, cellular non-fat areas, and necrosis/hemorrhage) and also with recognized MRI indicators. Furthermore, the absence of contrast-enhanced imaging and additional sequences such as fat-suppressed T2w/STIR, post-contrast T1w, or DWI, may limit discrimination of certain subtypes and limit conclusions about non-adipose elements based solely on grayscale intensities. Future work should extend the framework to encompass multi-parametric MRI, including contrast-enhanced sequences, to enhance clinical applicability.
4.2. Related Work
To the authors’ knowledge, there are no other works that classify LPS with mathematical techniques such as formal methods. In the literature, there are several studies that address the topic with radiomics and Artificial Intelligence techniques or only with statistical techniques.
For example, authors in [21] have demonstrated the possibility to differentiate between lipomas and ALT/WDLPS using a retrospective database with histological information and MDM2 amplification in about 20 ALT/WD patients and 45 lipoma patients using the T1W TSE MRI series.
They used IBEX [34] to manually segment the images and then extract 74 features, building the model using the SVM algorithm with a linear kernel. The dataset ratio was established at 70:30 for verification, and with a 95% confidence interval, they reach average recall and AUC of 0.97 and 0.99 percent with 57 features and 98 ROIs.
Similarities with this work consist of the best performer being the second-order class GLCM, while first-order characteristics are considered to be less significant.
The drawbacks of the work in reference [21] include its monocentricity and lack of an external validation database. As a matter of fact, with formal methods, authors reach a not-so-far performance from the literature with less data and less information (only three features and one ROI for patient), using a public dataset; last but not least, the innovative mathematical techniques constitute a security for the future external validation, which does not need training or testing subsets.
The work by Tang et al. [26], instead, compiles the performances of the categorization of ALT compared to LPS in a retrospective analysis, representing a true study that poses the problem between radiomics and radiology experts. In particular, can radiomics perform better than radiologists?
The study focuses on MRI scans in the axial T1w and FS T2w scenes. Two blinded radiologists performed manual 3D ROIs on a database of 122 patients, 32 of whom had ALT. On the one hand, for each ROI, 2600 features are extracted and are used to create three models: one for T1w features, one for FS T2w features, and one for T1w + T2w features. On the other hand, three MSK radiologists with more than 10 years of experience provide MRI diagnoses based solely on the clinical information about the patient’s age, examining the presence of septa, the presence of nodular enhancement, and the homogeneity or heterogeneity.
As a result, there were no discrepancies in the use of T1w or T2w pictures for the diagnosis, but there were differences between the radiologists’ and radiomics’ models. Radiologists have an average AUC of 0.90, whereas radiomics have a 0.95 AUC. The accuracy for radiologists is 0.91, while for radiomics it is 0.92, and sensitivity is better in radiologists, who have a 0.90 AUC as opposed to a 0.86 AUC.
Compared to the studies mentioned above [6,7,27], the present work explores whether a formal-methods-based framework can be applied in a low-data rare-disease setting, to improve transparency and interpretability. These studies suggest that radiomics may provide useful complementary information in the evaluation of rare tumors; however, the clinical role remains dependent on adequate validation, imaging standardization, and integration with conventional radiologic assessment.
In addition, all the advantages of applying formal methods in conjunction with radiomics have already been expressed in other work, such as that on coronavirus disease [35] or prostate cancer [36], where the performance was very promising and also enriched by the possibility of having models that can be easily explained to the operational team of computer scientists and medical specialists [37].
4.3. Limitations
A limitation of this study is the limited number of patients (n = 10). This is mainly related to the rarity of liposarcomas and the use of a publicly available dataset [12]. The present work should therefore be considered a validation study aimed at assessing the feasibility of integrating radiomics with formal methods in the context of a rare disease. In the future, maybe knowledge distillation and teacher-student learning can be considered to enable the transfer of knowledge from high-capacity teacher models to lightweight student networks [38].
No formal inter-observer agreement analysis was conducted; however, we aimed to evaluate the feasibility of integrating radiomic descriptors with formal methods in a rare-disease setting.
Regarding the classification task, the problem was formulated as a binary classification task, distinguishing between high-grade and low-grade liposarcomas. The only intermediate-grade case included in the dataset was grouped with the low-grade cases, forming a “low to medium grade” category. This choice was made to remain consistent with the distinction between “high-grade” and “low to medium-grade” neoplasms (Section 2.2).
This aggregation was adopted due to the very small number of intermediate cases (n = 1), which would not have allowed for a statistically significant multi-class analysis. However, we agree that such methodological decisions may influence the reported metrics.
Nevertheless, unlike purely data-driven AI approaches that require large training datasets, formal methods rely on rule-based mathematical models, which may offer a useful complementary framework in small datasets related to rare diseases, although robust validation remains necessary. Results should be interpreted as hypothesis-generating; further validation on larger multi-center cohorts is required. In this large framework, the main limitation of our purpose is the very small cohort size and class imbalance, which still preclude a solid clinical-grade diagnostic performance or statistical power. Performance estimates should therefore be interpreted cautiously. Additional limitations include potential operator dependency due to manual ROI delineation and possible multicenter acquisition heterogeneity in the public dataset, which may affect feature stability and cross-scanner generalizability [39]. Validation on larger external cohorts remains necessary.
5. Conclusions and Future Work
Radiomics can provide effective decision support in the diagnosis of complex diseases, where significant heterogeneity exists even among pathologies of the same class. The extraction and analysis of quantitative features from medical images allows the identification of relevant information, often imperceptible to the human eye but crucial for the diagnostic and therapeutic decision-making process. The experimental results obtained for high-, intermediate-, and low-grade liposarcomas are encouraging, demonstrating that the proposed approach could be capable of distinguishing tumor grades. The present approach integrates radiomics with formal verification concepts to express decision logic through verifiable rules. This formulation should enhance transparency and support interpretability, potentially facilitating communication and decision-making through interdisciplinary teams involving both computer scientists and radiologists.
From a clinical standpoint, a comprehensible framework that associates quantitative imaging descriptors with definitive decision rules may facilitate hypothesis formulation and structured reporting in subsequent studies. However, the current findings are preliminary and do not confirm clinical efficacy or outcome advantage. To evaluate generalizability and clinical impact, larger multicenter cohorts with external validation will be necessary.
Author Contributions
Conceptualization, R.N., A.S., L.B., and G.V.; methodology, A.S. and G.V.; software, G.V.; validation, R.N., M.Z. and L.B.; formal analysis, A.S. and G.V.; resources, R.N. and M.Z.; data curation, R.N., M.C.B., and G.V.; writing—original draft preparation, R.N., M.C.B., and G.V.; writing—review and editing, G.V., R.N., and G.P.; supervision, A.S. and L.B. All authors have read and agreed to the published version of the manuscript.
Funding
National Plan for NRRP Complementary Investments D3 4 Health: Digital Driven Diagnostics, prognostics and therapeutics for sustainable Health care.
Institutional Review Board Statement
In retrospective studies, in Italy, the Ethics Committee is not mandatory.
Informed Consent Statement
Patient consent was waived due to the retrospective nature of this study.
Data Availability Statement
The data presented in this article are available in a public archive of the article in reference [12].
Conflicts of Interest
The authors declare no conflicts of interest.
Abbreviations
The following abbreviations are used in this manuscript:
| AI | Artificial Intelligence |
| STS | Soft-Tissue Sarcoma |
| LPS | Liposarcoma |
| DICOM | Digital Imaging and COmmunication in Medicine |
| ROI | Region of interest |
| LTS | Labeled Transition System |
| CCS | Calculus of communicating systems |
| FNCLCC | Fédération Nationale des Centres de Lutte Contre le Cancer |
| LMS | Leiomyosarcomas |
| ALT | Atypical lipomatous tumor |
| WDLPS | Well-differentiated liposarcoma |
| DDLPS | dedifferentiated liposarcoma |
| MLPS | Myxoid liposarcoma |
| PMLPS | Pleomorphic liposarcoma |
| MPMLPS | Myxoid pleomorphic liposarcoma |
| MRI | Magnetic resonance imaging |
| MC | Model Checking |
| ESMO | European Society for Medical Oncology |
References
- Gronchi, A.; Miah, A.; Dei Tos, A.; Abecassis, N.; Bajpai, J.; Bauer, S.; Biagini, R.; Bielack, S.; Blay, J.; Bolle, S. Soft tissue and visceral sarcomas: ESMO-EURACAN-GENTURIS Clinical Practice Guidelines for diagnosis, treatment and follow-up. Ann. Oncol. 2021, 32, 1348–1365. [Google Scholar] [CrossRef] [Scilit] [PubMed]
- Creytens, D. What’s new in adipocytic neoplasia? Virchows Arch. 2020, 476, 29–39. [Google Scholar] [CrossRef] [Scilit] [PubMed]
- Johnson, C.N.; Ha, A.S.; Chen, E.; Davidson, D. Lipomatous soft-tissue tumors. JAAOS-J. Am. Acad. Orthop. Surg. 2018, 26, 779–788. [Google Scholar] [CrossRef] [Scilit] [PubMed]
- Neuzillet, C.; Gaujoux, S.; Williet, N.; Bachet, J.B.; Bauguion, L.; Durand, L.C.; Conroy, T.; Dahan, L.; Gilabert, M.; Huguet, F.; et al. Pancreatic cancer: French clinical practice guidelines for diagnosis, treatment and follow-up (SNFGE, FFCD, GERCOR, UNICANCER, SFCD, SFED, SFRO, ACHBT, AFC). Dig. Liver Dis. 2018, 50, 1257–1271. [Google Scholar] [CrossRef] [Scilit]
- Fletcher, C.; Bridge, J.; Antonescu, C. WHO classification of tumours editorial board. In WHO Classification of Tumors Soft Tissue and Bone Tumours; International Agency for Research on Cancer: Lion, France, 2020; pp. 403–409. [Google Scholar]
- Malinauskaite, I.; Hofmeister, J.; Burgermeister, S.; Neroladaki, A.; Hamard, M.; Montet, X.; Boudabbous, S. Radiomics and machine learning differentiate soft-tissue lipoma and liposarcoma better than musculoskeletal radiologists. Sarcoma 2020, 2020, 7163453. [Google Scholar] [CrossRef] [Scilit]
- Vos, M.; Starmans, M.; Timbergen, M.; van der Voort, S.; Padmos, G.; Kessels, W.; Niessen, W.; Van Leenders, G.; Grünhagen, D.; Sleijfer, S.; et al. Radiomics approach to distinguish between well differentiated liposarcomas and lipomas on MRI. J. Br. Surg. 2019, 106, 1800–1809. [Google Scholar] [CrossRef] [Scilit]
- Wing, J.M. A Specifier’s Introduction to Formal Methods; Carnegie-Mellon University, Department of Computer Science: Pittsburgh, PA, USA, 1990. [Google Scholar]
- Gillies, R.J.; Kinahan, P.E.; Hricak, H. Radiomics: Images are more than pictures, they are data. Radiology 2016, 278, 563–577. [Google Scholar] [CrossRef] [Scilit]
- Mustra, M.; Delac, K.; Grgic, M. Overview of the DICOM standard. In Proceedings of the 2008 50th International Symposium ELMAR; IEEE: Piscataway, NJ, USA, 2008; Volume 1, pp. 39–44. [Google Scholar]
- Schneider, C.A.; Rasband, W.S.; Eliceiri, K.W. NIH Image to ImageJ: 25 years of image analysis. Nat. Methods 2012, 9, 671–675. [Google Scholar] [CrossRef] [Scilit]
- Vallières, M.; Freeman, C.R.; Skamene, S.R.; El Naqa, I. A radiomics model from joint FDG-PET and MRI texture features for the prediction of lung metastases in soft-tissue sarcomas of the extremities. Phys. Med. Biol. 2015, 60, 5471. [Google Scholar]
- Brunese, L.; Brunese, M.C.; Carbone, M.; Ciccone, V.; Mercaldo, F.; Santone, A. Automatic PI-RADS assignment by means of formal methods. La Radiol. Medica 2022, 127, 83–89. [Google Scholar] [CrossRef] [Scilit]
- Clarke, E.M.; Wing, J.M. Formal methods: State of the art and future directions. ACM Comput. Surv. (CSUR) 1996, 28, 626–643. [Google Scholar] [CrossRef] [Scilit]
- Tretmans, J. Model based testing with labelled transition systems. In Formal Methods and Testing; Springer: Berlin/Heidelberg, Germany, 2008; pp. 1–38. [Google Scholar]
- Milner, R. A Calculus of Communicating Systems; Springer: Berlin/Heidelberg, Germany, 1980. [Google Scholar]
- Clarke, E.M.; Henzinger, T.A.; Veith, H.; Bloem, R. Handbook of Model Checking; Springer: Berlin/Heidelberg, Germany, 2018; Volume 10. [Google Scholar]
- Bradfield, J.; Stirling, C. 12 Modal mu-calculi. Stud. Log. Pract. Reason. 2007, 3, 721–756. [Google Scholar]
- Elazab, N.; Gab Allah, W.; Elmogy, M. Computer-aided diagnosis system for grading brain tumor using histopathology images based on color and texture features. BMC Med. Imaging 2024, 24, 177. [Google Scholar] [CrossRef] [Scilit] [PubMed]
- Thornhill, R.E.; Golfam, M.; Sheikh, A.; Cron, G.O.; White, E.A.; Werier, J.; Schweitzer, M.E.; Di Primio, G. Differentiation of lipoma from liposarcoma on MRI using texture and shape analysis. Acad. Radiol. 2014, 21, 1185–1194. [Google Scholar] [CrossRef] [Scilit]
- Cay, N.; Mendi, B.A.R.; Batur, H.; Erdogan, F. Discrimination of lipoma from atypical lipomatous tumor/well-differentiated liposarcoma using magnetic resonance imaging radiomics combined with machine learning. Jpn. J. Radiol. 2022, 40, 951–960. [Google Scholar] [CrossRef] [Scilit]
- Clarke, E.M.; Grumberg, O.; Kroening, D.; Peled, D.; Veith, H. Introduction to model checking. In Handbook of Model Checking; Springer: Berlin/Heidelberg, Germany, 2018; pp. 1–26. [Google Scholar]
- Guidotti, R.; Monreale, A.; Ruggieri, S.; Turini, F.; Giannotti, F.; Pedreschi, D. A Survey of Methods for Explaining Black Box Models. ACM Comput. Surv. (CSUR) 2018, 51, 1–42. [Google Scholar] [CrossRef] [Scilit]
- Hériché, J.K.; Alexander, S.; Ellenberg, J. Integrating imaging and omics: Computational methods and challenges. Annu. Rev. Biomed. Data Sci. 2019, 2, 175–197. [Google Scholar] [CrossRef] [Scilit]
- Haidey, J.; Low, G.; Wilson, M.P. Radiomics-based approaches outperform visual analysis for differentiating lipoma from atypical lipomatous tumors: A review. Skelet. Radiol. 2023, 52, 1089–1100. [Google Scholar] [CrossRef] [Scilit]
- Tang, Y.; Cui, J.; Zhu, J.; Fan, G. Differentiation between lipomas and atypical lipomatous tumors of the extremities using radiomics. J. Magn. Reson. Imaging 2022, 56, 1746–1754. [Google Scholar] [CrossRef] [Scilit]
- Leporq, B.; Bouhamama, A.; Pilleul, F.; Lame, F.; Bihane, C.; Sdika, M.; Blay, J.Y.; Beuf, O. MRI-based radiomics to predict lipomatous soft tissue tumors malignancy: A pilot study. Cancer Imaging 2020, 20, 78. [Google Scholar] [CrossRef] [Scilit]
- Coran, A.; Ortolan, P.; Attar, S.; Alberioli, E.; Perissinotto, E.; Tosi, A.L.; Montesco, M.C.; Rossi, C.R.; Tropea, S.; Rastrelli, M.; et al. Magnetic resonance imaging assessment of lipomatous soft-tissue tumors. In Vivo 2017, 31, 387–395. [Google Scholar] [CrossRef] [Scilit] [PubMed]
- Moulin, B.; Messiou, C.; Crombe, A.; Kind, M.; Hohenberger, P.; Rutkowski, P.; van Houdt, W.J.; Strauss, D.; Gronchi, A.; Bonvalot, S. Diagnosis strategy of adipocytic soft-tissue tumors in adults: A consensus from European experts. Eur. J. Surg. Oncol. 2021, 48, 518–525. [Google Scholar] [CrossRef] [Scilit] [PubMed]
- Lee, A.T.J.; Thway, K.; Huang, P.H.; Jones, R.L. Clinical and molecular spectrum of liposarcoma. J. Clin. Oncol. 2018, 36, 151. [Google Scholar] [CrossRef] [Scilit] [PubMed]
- Saifuddin, A.; Andrei, V.; Rajakulasingam, R.; Oliveira, I.; Seddon, B. Magnetic resonance imaging of trunk and extremity myxoid liposarcoma: Diagnosis, staging, and response to treatment. Skelet. Radiol. 2021, 50, 1963–1980. [Google Scholar] [CrossRef] [Scilit]
- Ballhause, T.M.; Korthaus, A.; Jahnke, M.; Frosch, K.H.; Yamamura, J.; Dust, T.; Schlickewei, C.W.; Priemel, M.H. Lipomatous Tumors: A Comparison of MRI-Reported Diagnosis with Histological Diagnosis. Diagnostics 2022, 12, 1281. [Google Scholar] [CrossRef] [Scilit]
- AIOM. Linee guida SARCOMI DEI TESSUTI MOLLI E GIST. Available online: https://www.aiom.it/wp-content/uploads/2020/10/2020_LG_AIOM_Sarcomi.pdf (accessed on 9 March 2026).
- Bettinelli, A.; Branchini, M.; De Monte, F.; Scaggion, A.; Paiusco, M. An IBEX adaption toward image biomarker standardization. Med Phys. 2020, 47, 1167–1173. [Google Scholar] [CrossRef] [Scilit]
- Santone, A.; Belfiore, M.P.; Mercaldo, F.; Varriano, G.; Brunese, L. On the Adoption of Radiomics and Formal Methods for COVID-19 Coronavirus Diagnosis. Diagnostics 2021, 11, 293. [Google Scholar] [CrossRef] [Scilit]
- Brunese, L.; Mercaldo, F.; Reginelli, A.; Santone, A. Formal methods for prostate cancer Gleason score and treatment prediction using radiomic biomarkers. Magn. Reson. Imaging 2020, 66, 165–175. [Google Scholar] [CrossRef] [Scilit]
- Brunese, L.; Mercaldo, F.; Reginelli, A.; Santone, A. Explainable Deep Learning for Pulmonary Disease and Coronavirus COVID-19 Detection from X-rays. Comput. Methods Programs Biomed. 2020, 196, 105608. [Google Scholar] [CrossRef] [Scilit]
- Li, X.; Li, L.; Li, M.; Yan, P.; Feng, T.; Luo, H.; Zhao, Y.; Yin, S. Knowledge distillation and teacher-student learning in medical imaging: Comprehensive overview, pivotal role, and future directions. Med. Image Anal. 2025, 107, 103819. [Google Scholar] [CrossRef] [Scilit]
- Sun, Y.; Li, X.; Li, L.; Feng, T.; Zhao, Y.; Yin, S. PHH-FL: Perceptual Hashing Hypernetwork Personalized Federated Learning for Heterogeneous Medical Image Analysis Tasks. IEEE Internet Things J. 2025, 13, 8712–8724. [Google Scholar] [CrossRef] [Scilit]



Disclaimer/Publisher’s Note: The statements, opinions and data contained in all publications are solely those of the individual author(s) and contributor(s) and not of MDPI and/or the editor(s). MDPI and/or the editor(s) disclaim responsibility for any injury to people or property resulting from any ideas, methods, instructions or products referred to in the content. |
© 2026 by the authors. Licensee MDPI, Basel, Switzerland. This article is an open access article distributed under the terms and conditions of the Creative Commons Attribution (CC BY) license.