


Abstract
Colonial historic city centers represent a paradigmatic challenge for modern road safety, as they are characterized by narrow streets originally designed for carriage and pedestrian traffic. This research presents ADAS-TSR, a deep learning-based advanced driver assistance system for vertical traffic sign detection with voice alerts, specifically designed for the Historic Center of Ayacucho, Peru, which is located at 2761 m a.s.l. An original dataset comprising 2250 images with 2450 instances corresponding to 14 sign classes according to Peruvian regulations was constructed. The dataset was captured under real operational conditions, including deteriorated, partially occluded, and vehicle impact-deformed signage. A comprehensive multi-model benchmark experiment was conducted, comparing four CNN-based detectors (YOLOv8m, YOLO11n, YOLO26n, YOLO26s) and one transformer-based detector (RT-DETR-l) spanning both classical and state-of-the-art architectures released through January 2026. YOLO26s achieved the best overall performance, with an mAP@0.5 of 0.994 and mAP@0.5:0.95 of 0.989 while using only 9.5 M parameters. YOLO11n matched the performance of YOLOv8m with 10× fewer parameters (2.6 M vs. 25.9 M). Uncertainty analysis revealed that modern architectures exhibit significantly higher prediction confidence (mean > 0.90) compared to YOLOv8m (0.82), and fairness analysis confirmed equitable detection across all 14 classes (Gini < 0.002). A voice alert system with five priority levels and rule-based temporal filtering for detection stabilization was implemented. Validation across five urban circuits spanning 14.11 km demonstrated a detection rate of 94.7% with a 73% reduction in redundant alerts.
1. Introduction
Road safety constitutes one of the primary public health challenges worldwide. According to the World Health Organization’s Global Status Report on Road Safety 2023 [1], traffic accidents cause approximately 1.19 million deaths annually—equivalent to one death every 26 s—in addition to between 20 and 50 million non-fatal injuries with disabling consequences, representing an estimated economic cost of 3% of global GDP. Low- and middle-income countries bear a disproportionate burden, accounting for 90% of all road traffic fatalities despite possessing only 60% of the world’s registered vehicles. The urgency of this crisis was reaffirmed at the Fourth Global Ministerial Conference on Road Safety held in Marrakech in February 2025, where ministers from over 100 countries endorsed the Marrakech Declaration committing to accelerated action [2]. In the Peruvian context, the Observatorio Nacional de Seguridad Vial (ONSV) reported 87,083 traffic accidents during 2023, resulting in 3316 fatalities and approximately 58,000 injuries [3]. Human factors constitute the predominant cause, accounting for 70.2% of all incidents, with driver imprudence (28.2%), speeding (26.6%), and alcohol impairment (7.2%) as the leading contributors. Notably, traffic sign disobedience was officially recorded as the direct cause in 359 cases (0.8%) during the first semester of 2023 [4]; however, this figure likely underestimates the true impact, as many sign-related violations are subsumed under the broader “driver imprudence” category, suggesting that automated traffic sign recognition systems could potentially impact a significant portion of human-caused accidents.
Colonial historic city centers present a paradigmatic challenge for modern traffic management. These cities, characterized by narrow streets originally designed for carriage and pedestrian traffic [5], face an infrastructural incompatibility that generates critical congestion. The city of Ayacucho exemplifies this situation, where vehicular congestion emerges as one of the principal problems confronting public authorities. The historic nature of the urban center, with an original layout that was not conceived for motorized vehicular traffic, significantly exacerbates this situation. Additionally, Ayacucho presents a monocentric structure where the majority of commercial, educational, and labor activities converge toward the city center; the narrow streets prove insufficient for absorbing vehicular demand during peak hours.
Advanced Driver Assistance Systems (ADAS) have emerged as a promising technological solution for mitigating road risks. These systems integrate sensors, cameras, and artificial intelligence algorithms to provide real-time feedback to drivers. Ayachi et al. [6] conducted a comprehensive evaluation of various YOLO models for real-time object detection in urban environments for ADAS systems, finding that YOLOv9 offers an optimal compromise between speed and precision. Among ADAS functionalities, Traffic Sign Recognition (TSR) proves particularly relevant for urban contexts where vertical signage plays a critical role in traffic regulation and accident prevention [7].
Convolutional neural networks have revolutionized computer vision tasks, enabling automatic learning of discriminative features [8]. Arcos-García et al. [9] pioneered the systematic evaluation of deep neural networks for traffic sign detection systems, comparing detectors such as Faster R-CNN [10], R-FCN, SSD [11], and YOLO V2. Chen et al. [7] presented a comprehensive review analyzing progress in traffic sign detection and recognition methods over the past decade, categorizing approaches into three principal techniques: conventional, deep learning-based, and hybrid.
Flores-Calero et al. [12] conducted a systematic review specifically addressing the YOLO algorithm applied to TSR systems, analyzing 61 publications between 2016–2022. The authors identified that YOLO has become the dominant algorithm for TSR due to its real-time detection capability, although significant challenges persist in small object detection, adverse lighting conditions, and generalization to localized datasets. Dewi et al. [13] complemented this analysis through a systematic review of traffic sign recognition techniques using deep learning algorithms.
Precise detection of distant or small-sized traffic signs represents a critical challenge for practical applications. Qiu et al. [14] proposed DP-YOLO, a lightweight algorithm based on YOLOv8s optimized for small object detection, achieving parameter reduction of 77.0% with mAP@0.5 improvements of 5.8% on the TT100K dataset [15]. Niu et al. [16] developed YOLOv8s-DDA, incorporating the C2fW module with efficient EMA attention mechanism and achieving mAP@0.5 of 87.2% on TT100K. Han et al. [17] presented EDN-YOLO with improvements of 3.1% on GTSDB and 9.6% on TT100K through optimized multi-scale fusion. Zhang et al. [18] developed TSD-DETR, a lightweight transformer that achieved mAP of 96.8% on Tsinghua-Tencent 100K.
The emergence of transformer-based architectures has introduced a fundamentally different paradigm for object detection. Zhao et al. [19] introduced Real-Time Detection Transformer (RT-DETR), the first real-time end-to-end object detector based on transformers, which eliminates the need for Non-Maximum Suppression (NMS) through bipartite matching. Unlike CNN-based detectors that rely on local feature extraction, RT-DETR employs self-attention mechanisms to capture global contextual relationships across the entire image, offering potential advantages for detecting objects in complex spatial arrangements. This architectural distinction is particularly relevant for TSR applications, where contextual understanding of sign placement within urban environments may enhance detection accuracy.
The evolution of the YOLO family has continued at an accelerating pace. Following YOLOv8 [20], Ultralytics released YOLO11 in September 2024, introducing architectural refinements including improved C3k2 blocks and enhanced feature pyramid networks while maintaining the anchor-free detection paradigm. Most recently, YOLO26 was released in January 2026 [21], representing a significant architectural advancement with NMS-free inference and improved efficiency by achieving 43% faster CPU inference compared to predecessor models. These rapid developments underscore the importance of benchmarking TSR systems against current state-of-the-art architectures.
Open-vocabulary detectors such as YOLO-World [22] and Grounding DINO [23] represent another emerging paradigm, enabling zero-shot detection of arbitrary object categories through language-vision alignment. However, these models are designed for open-set scenarios where object categories are not predefined, making them architecturally suboptimal for closed-set TSR applications with fixed and well-defined sign classes where specialized fine-tuning yields superior performance.
Detection under adverse conditions represents another critical challenge for practical ADAS implementation. He et al. [24] proposed NTS-YOLO for nocturnal detection based on improved YOLOv5 with illumination enhancement modules. Wang et al. [25] developed YOLO-AEF, integrating adaptive enhancement and feature fusion and demonstrating improvements of 4.8 percentage points on TT100K under challenging conditions. Choudhary and Dey [26] presented FAIERDet, an adaptive framework utilizing a fuzzy inference system for dynamic adjustment of image enhancement parameters. Ji et al. [27] proposed improvements to YOLOv8 for complex environmental conditions. Zhang et al. [28] contributed significantly through the creation of CCTSDB 2021, a more comprehensive benchmark for TSR system evaluation under diverse conditions.
Adaptation to specific geographical contexts has proven critical for real-world TSR system performance. Linardi et al. [29] evaluated YOLO models on Indonesian traffic signs, revealing a critical gap: the model trained with GTSRB achieved 97.07% on validation but only 28.68% on real local images, evidencing the fundamental limitation of international datasets for localized applications. Zakaria et al. [30] expanded the LISA dataset from 47 to 55 classes for rural American areas, achieving mAP of 98.7% using YOLOv8. Yaamini et al. [31] addressed the particular road conditions of India with YOLOv8. Castañita et al. [32] developed a specific methodology for Mexican signs using R-CNN and YOLO v3, obtaining mAP of 95.33%.
Architecture optimization for resource-constrained devices has received considerable attention. Xing et al. [33] proposed a lightweight model based on improved YOLOv8s for edge deployment in autonomous driving systems. Sharma et al. [34] developed improvements to the YOLOv4-Tiny algorithm for traffic sign recognition. Zhou et al. [35] presented a lightweight detection method based on improved YOLOv8n, optimized for campus driving scenarios.
Audio alert integration complements visual detection for effective driver assistance. Bhuvaneshwari et al. [36] developed a system integrating YOLOv4 for detection and CNN for classification with a voice alert module. Asamoah et al. [37] presented SAAM-ReflectNet, a multi-task framework unifying sign detection, classification, and retroreflectivity estimation. Trappey and Shen [38] proposed a universal detection system using YOLOv7 and Siamese neural networks with self-training capability.
In the Peruvian context, Marino Ayuque [39] developed a classification system for Peruvian signs using CNN with 95.29% precision, implemented as a mobile application but without audio alert integration or consideration of Andean historic centers. Our previous work [5] addressed intelligent traffic light optimization through vehicular detection with YOLOv8 in the Historic Center of Ayacucho, demonstrating the viability of deep learning technologies in this unique heritage context.
Despite the documented advances in the literature, there are a number of critical gaps that motivate the present research. First, there is an absence of contextualized datasets for Peruvian signage according to national regulations in high-altitude Andean contexts. Likewise, a lack of comprehensive multi-architecture benchmarks comparing CNN-based and transformer-based detectors on localized TSR datasets is evident. Additionally, there is limited integration of optimized voice alerts with rule-based temporal filtering for detection stabilization and priority management according to the criticality of each sign. Finally, modern evaluation methodologies including uncertainty estimation, cross-class fairness analysis, and computational efficiency profiling remain underexplored in the TSR literature.
Our research addresses these gaps through the development of ADAS-TSR, a comprehensive system specifically adapted to the context of the Historic Center of Ayacucho. The principal contributions are fivefold: first, the creation of the first vertical signage dataset specific to the Peruvian Andean context, comprising 2250 images with 14 sign classes according to MTC regulations; second, a comprehensive multi-model benchmark comparing five detection architectures spanning CNN-based (YOLOv8m, YOLO11n, YOLO26n, YOLO26s) and transformer-based (RT-DETR-l) paradigms; third, detailed uncertainty, fairness, and computational efficiency analyses following modern evaluation standards; fourth, implementation of a rule-based temporal filtering system for detection stabilization with differentiated voice alerts; and fifth, exhaustive system validation through vehicular simulations across diverse urban circuits.
2. Materials and Methods
2.1. Study Area: The Historic Center of Ayacucho
The research was conducted on the main roads of the city of Ayacucho, capital of the homonymous department located in the south-central region of Peru. The city is situated at 2761 m above sea level in the Southern Peruvian Highlands, and presents unique urban characteristics that substantially distinguish it from conventional urban environments studied in the international literature.
The Historic Center of Ayacucho, declared National Cultural Heritage, constitutes a colonial city with an original layout designed for carriage and pedestrian displacement, not motorized vehicular traffic [5]. The streets present variable widths between 4 and 8 m, significantly less than modern urban standards of 12 to 15 m. The monocentric structure generates a high density of vehicular and pedestrian traffic on streets with limited capacity. The irregular topography produces steep slopes reaching up to 12%, and colonial mansions project complex shadows that vary significantly throughout the day. At 2761 m a.s.l., atmospheric conditions include greater solar UV radiation, abrupt climatic changes, and lighting characteristics that are different from coastal cities.
The road safety situation in Ayacucho has deteriorated significantly in recent years. According to the Instituto Nacional de Estadística e Informática (INEI), the department recorded 207 traffic accidents during the third quarter of 2024 alone, representing a 97.1% year-over-year increase, with 29 fatalities and 202 injuries [40]. At the national level, Ayacucho ranks 10th in fatal interprovincial transport accidents, with nine fatal incidents recorded between 2021 and 2023 [41]. The combination of colonial urban morphology—narrow streets with limited visibility at intersections, absence of dedicated pedestrian infrastructure, and irregular signage placement on heritage facades—with rapidly increasing vehicular density creates conditions where traffic sign compliance becomes critical for accident prevention. These factors provide a compelling justification for the development of automated traffic sign detection systems specifically adapted to this urban context.
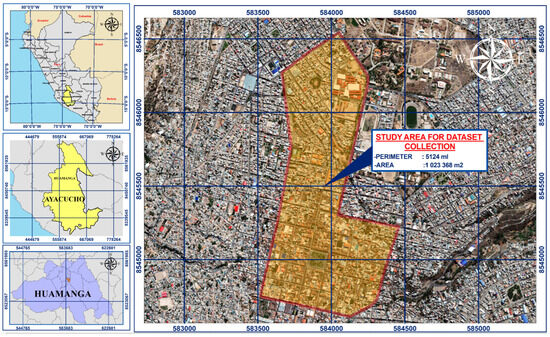
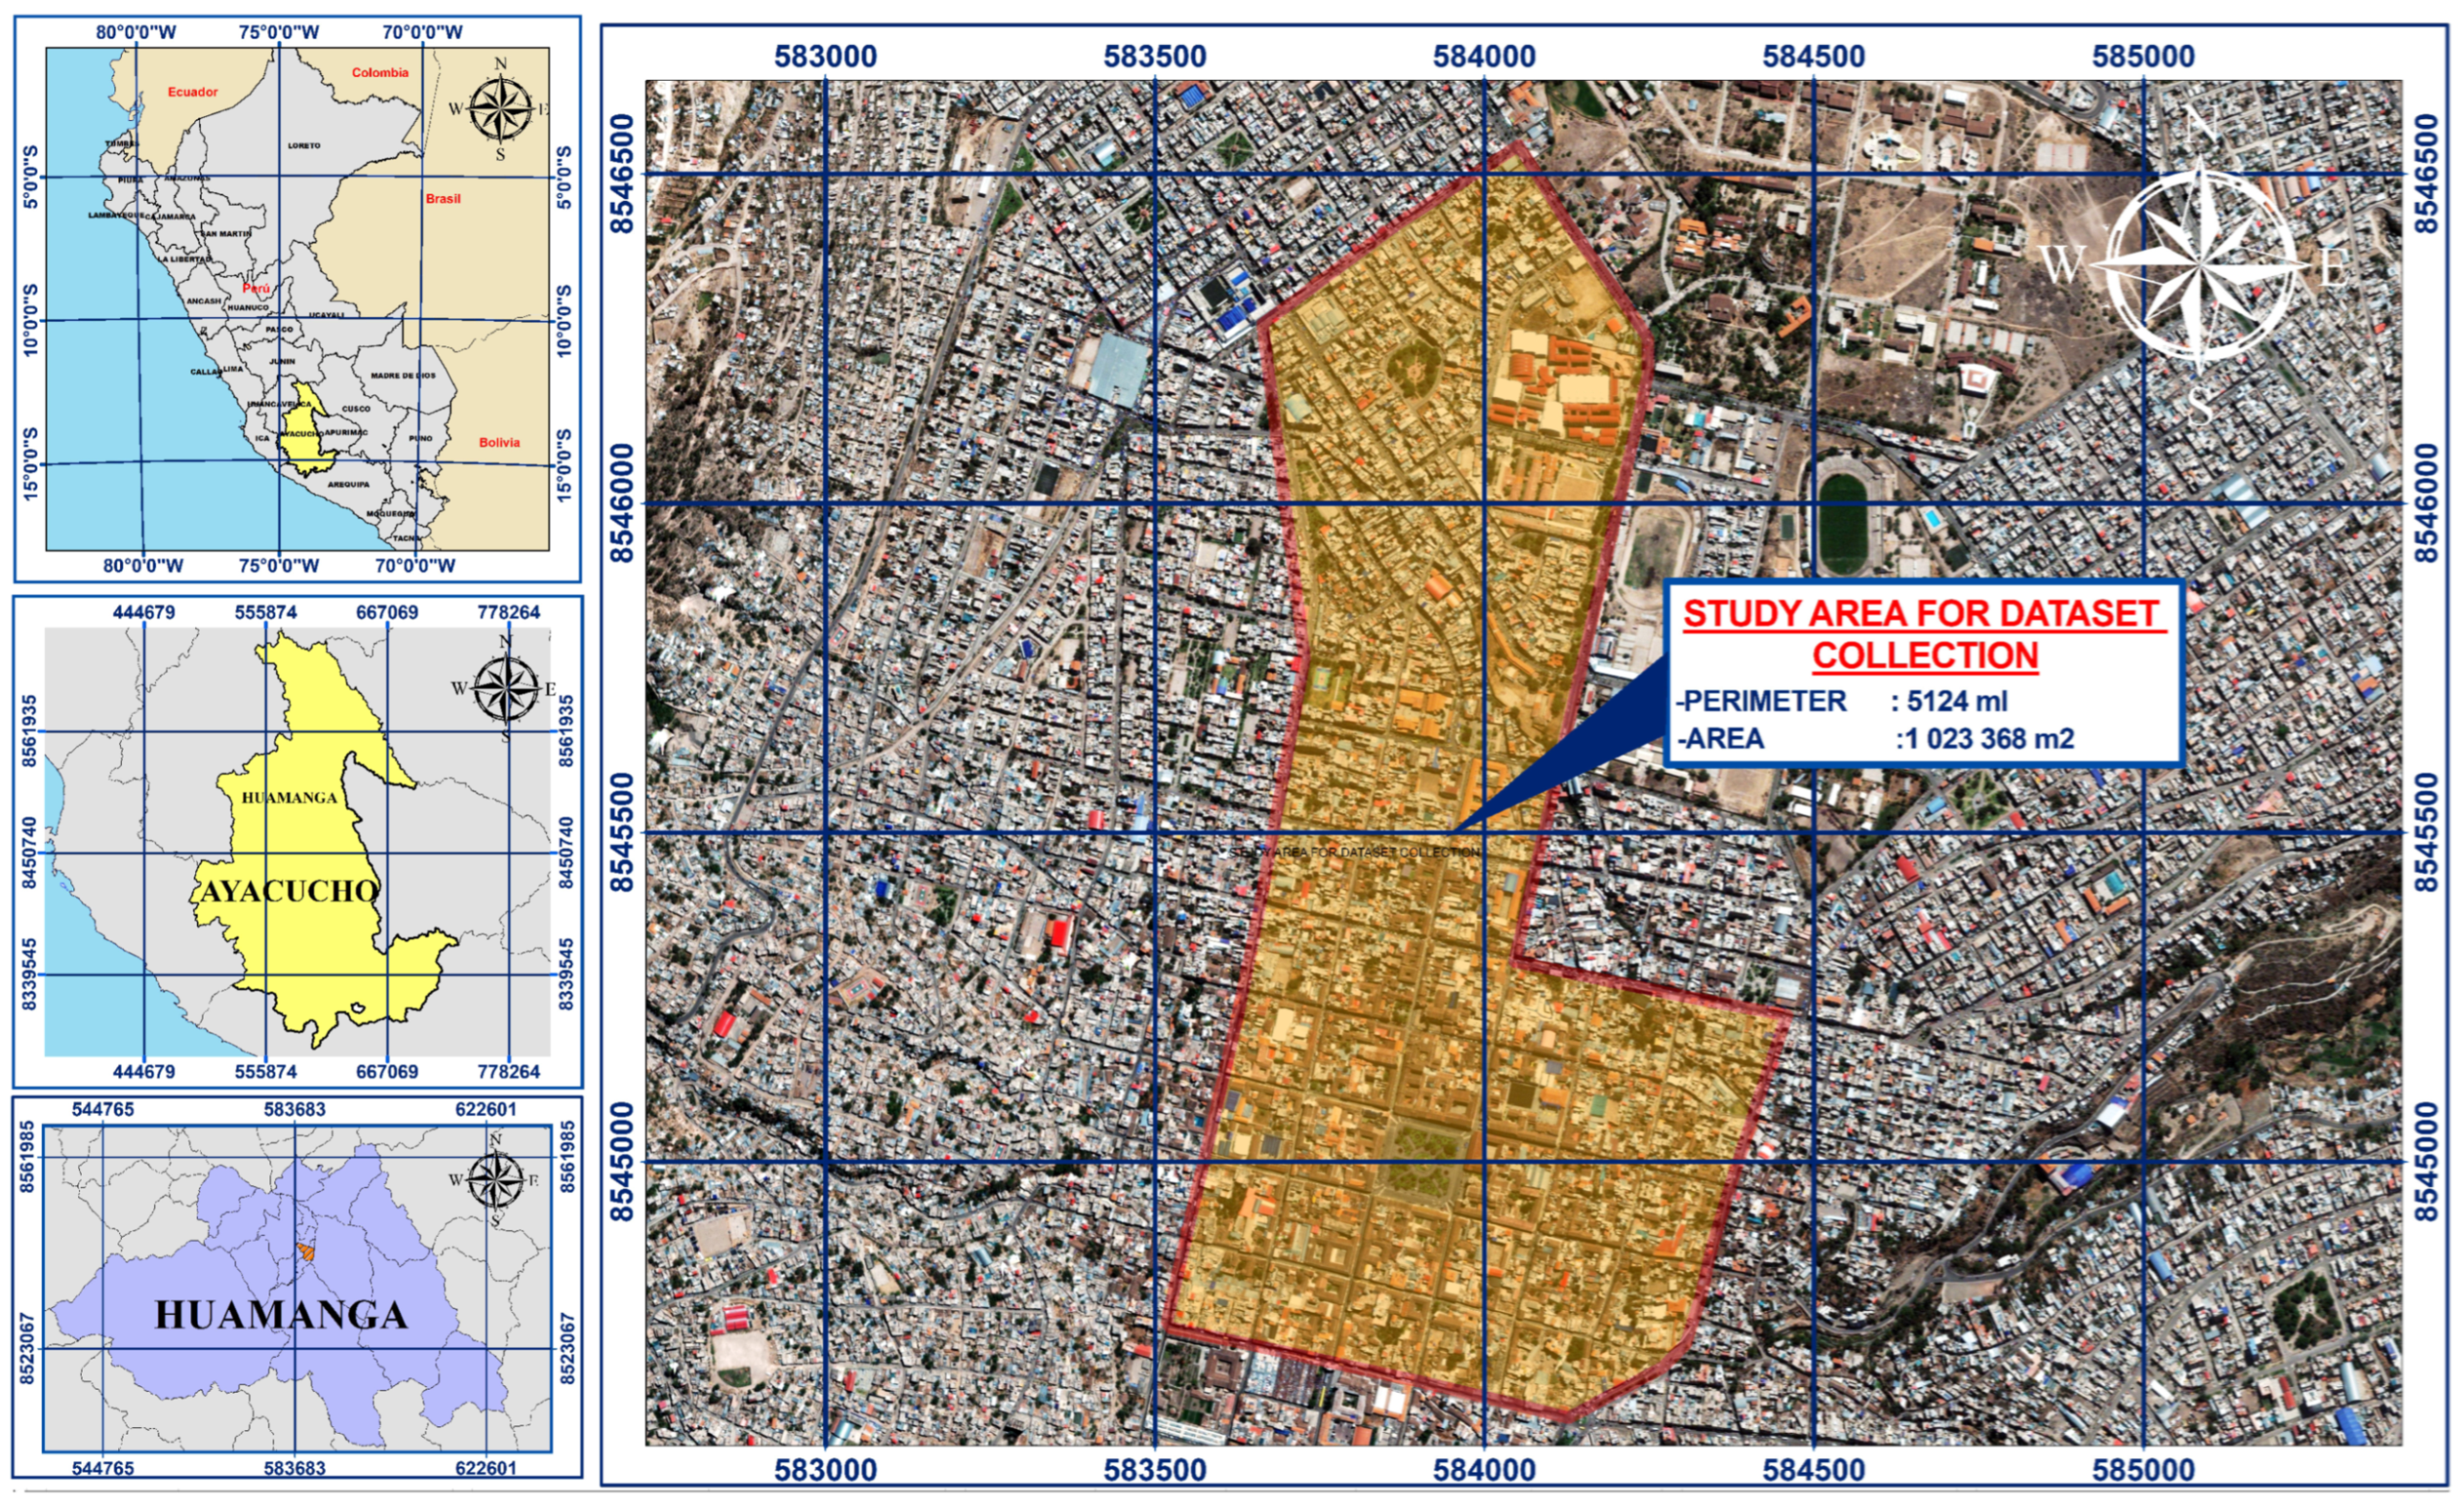
The study roads included 23 urban arteries of the historic center. Figure 1 presents the map of the study area with the delimitation of selected roads.
Figure 1.
Map of the study area in the city of Ayacucho (2761 m a.s.l.) showing the 23 urban roads selected for dataset collection. The Historic Center with colonial morphology that has been declared National Cultural Heritage is indicated by the delimited central sector.
2.2. Original Dataset Construction
Unlike previous research utilizing public international datasets such as GTSDB from Germany [42], TT100K from China [15], LISA from the United States, and CCTSDB [28], for this research we constructed a completely original dataset captured entirely in the Historic Center of Ayacucho. This methodological decision responds to the evidence documented by Linardi et al. [29], who demonstrated that models trained with international datasets experience severe performance degradation when applied to local contexts not represented in training.
A total of 3000 images of vertical signage were collected using a Samsung Galaxy S23 mobile device (Samsung Electronics Co., Ltd., Suwon, Republic of Korea) with a 50 MP main camera and optical stabilization. Images were systematically captured under real operational conditions of the historic center, encompassing diverse lighting conditions, capture distances between 2 and 15 m, and frontal, lateral, and oblique perspectives. From the total population, 2250 images were selected through intentional non-probabilistic sampling, ensuring balanced representativeness of the 14 signage classes defined according to the Traffic Control Device Manual of Peru [43]. The dataset was partitioned using stratified sampling to maintain proportional class representation, with an 80%/20% training/validation split (1801/449 images). Table 1 presents the category definitions and their distribution.
Table 1.
Vertical signage category definitions according to Peruvian MTC regulations and instance distribution in the original dataset.
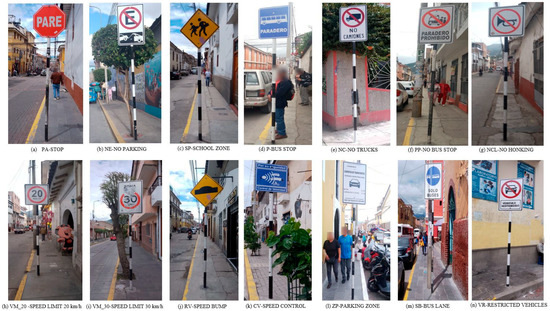
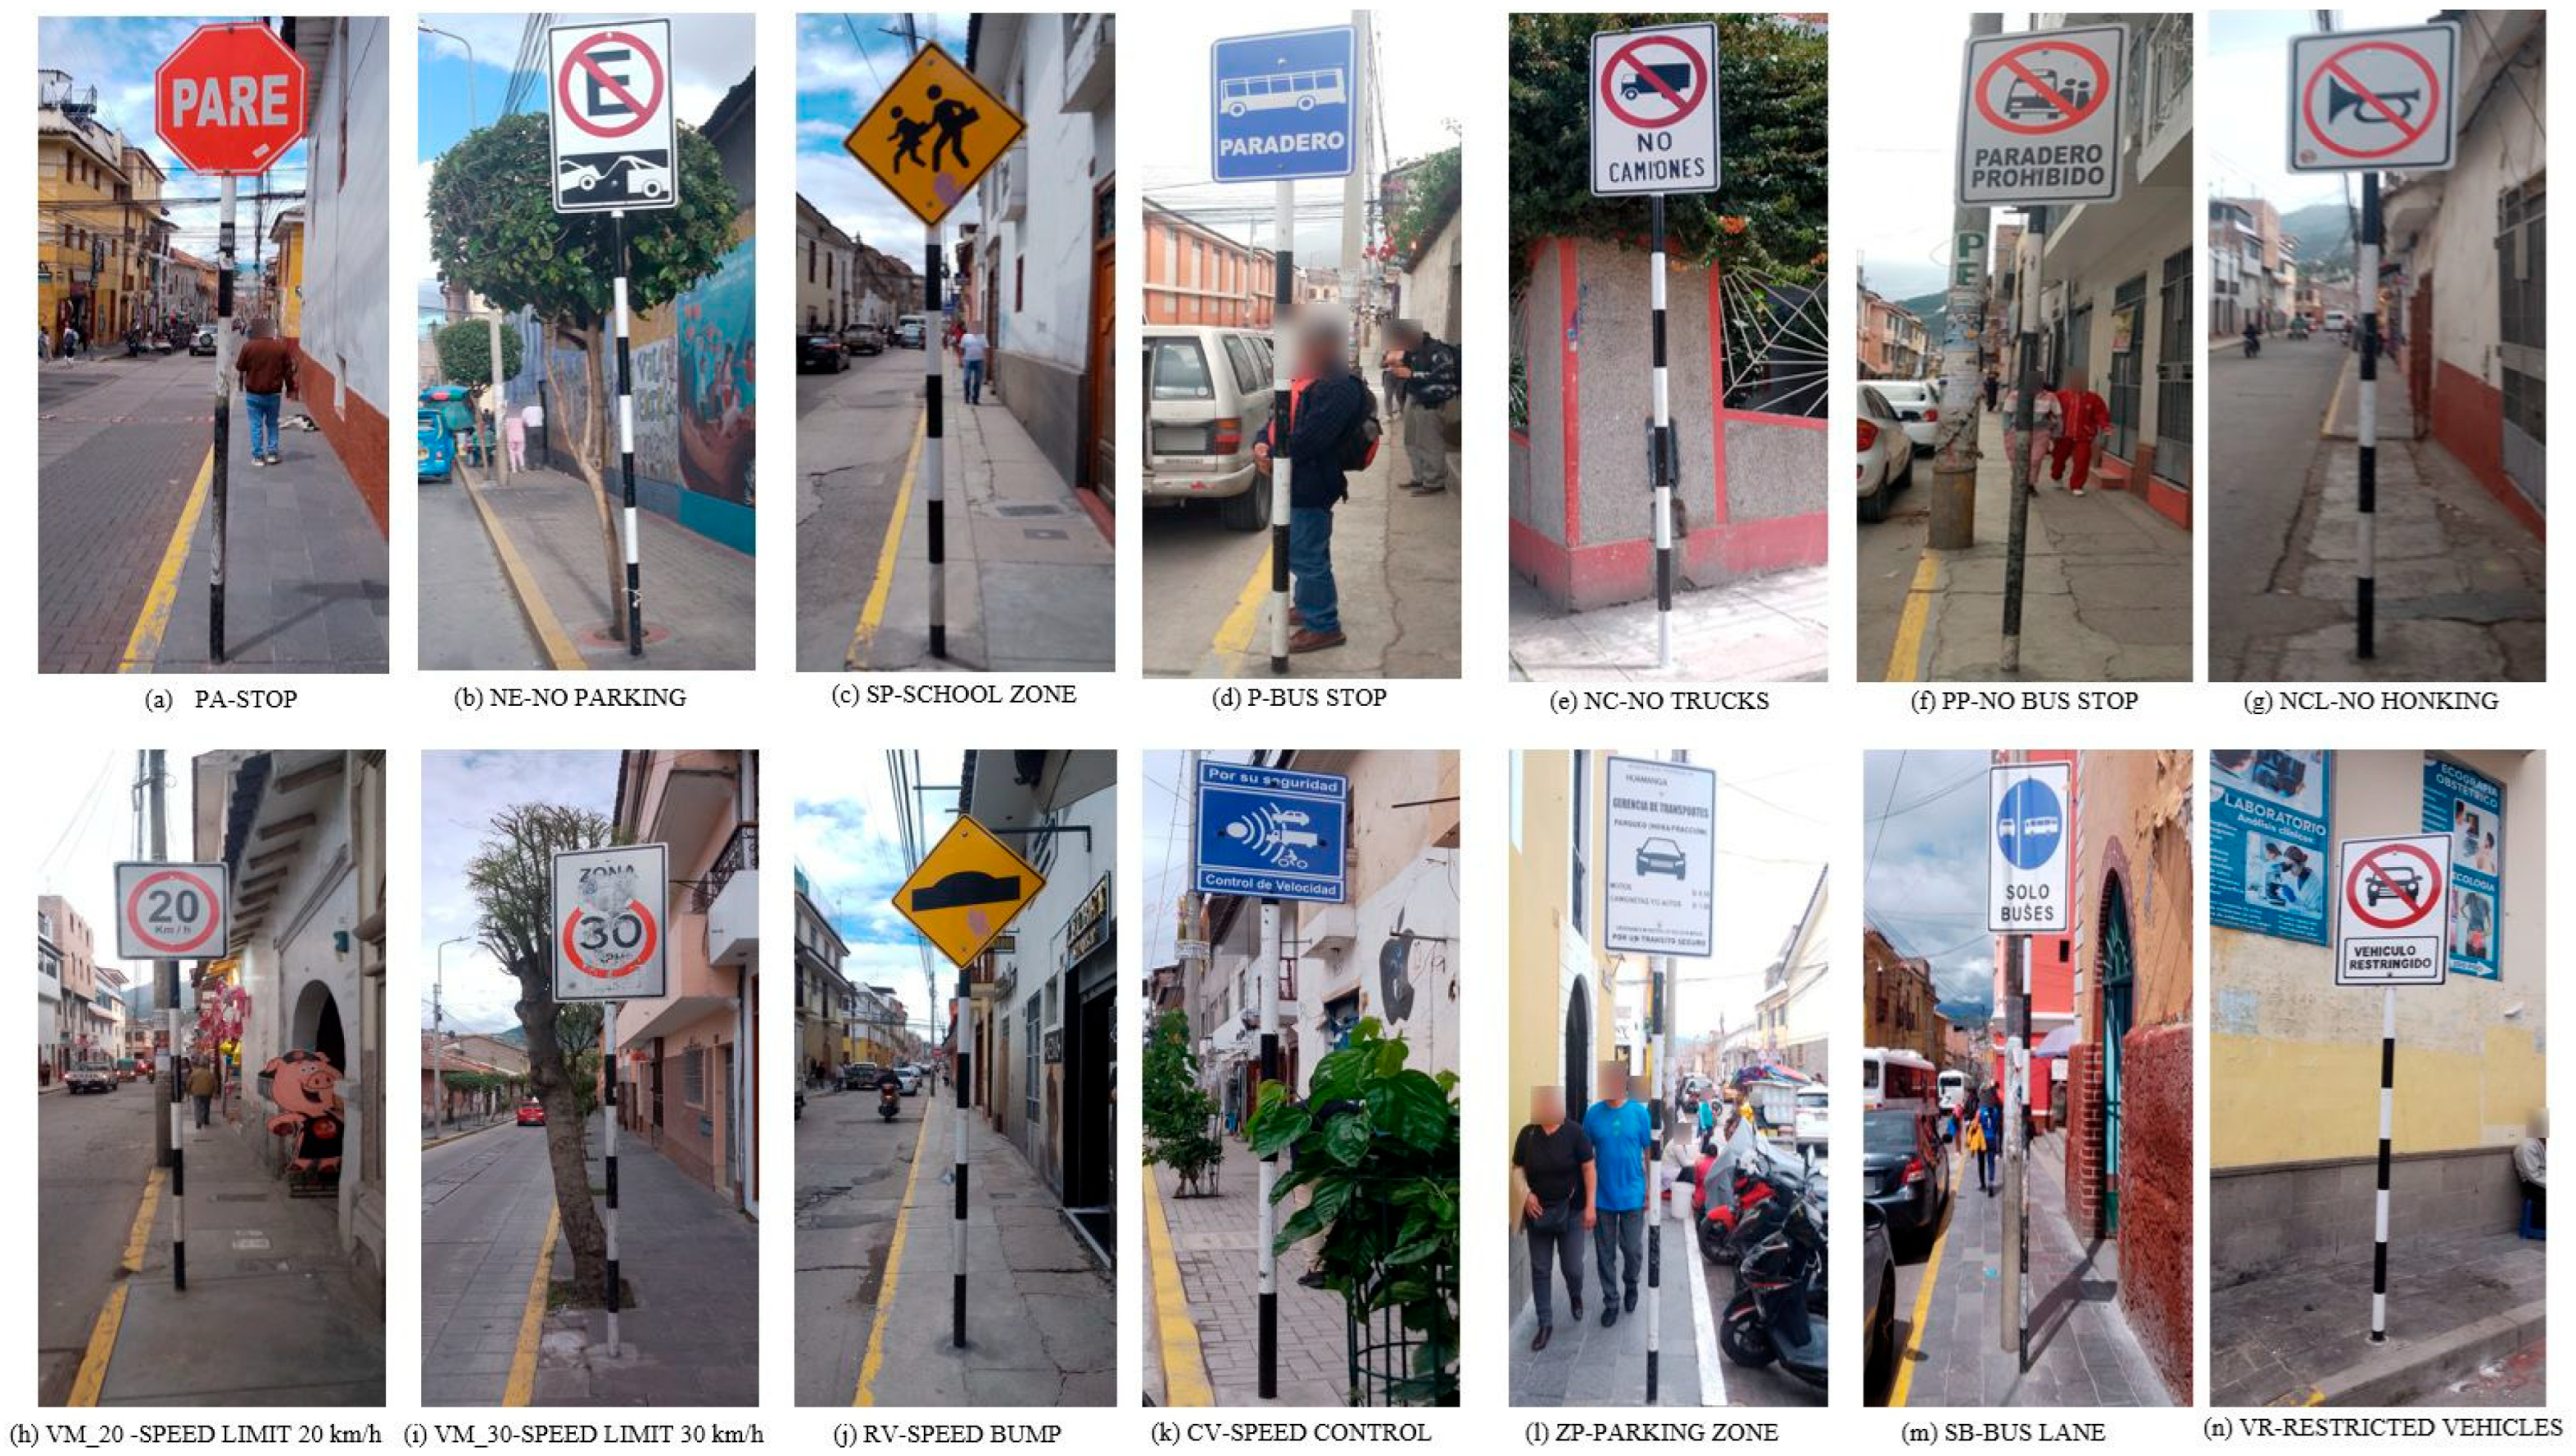
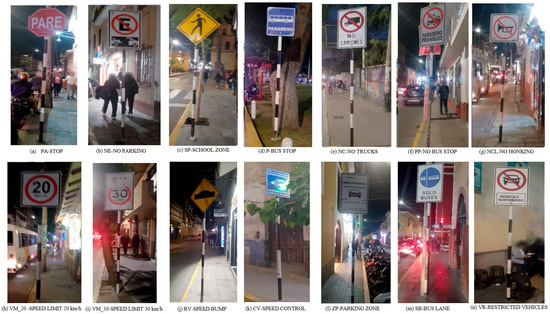
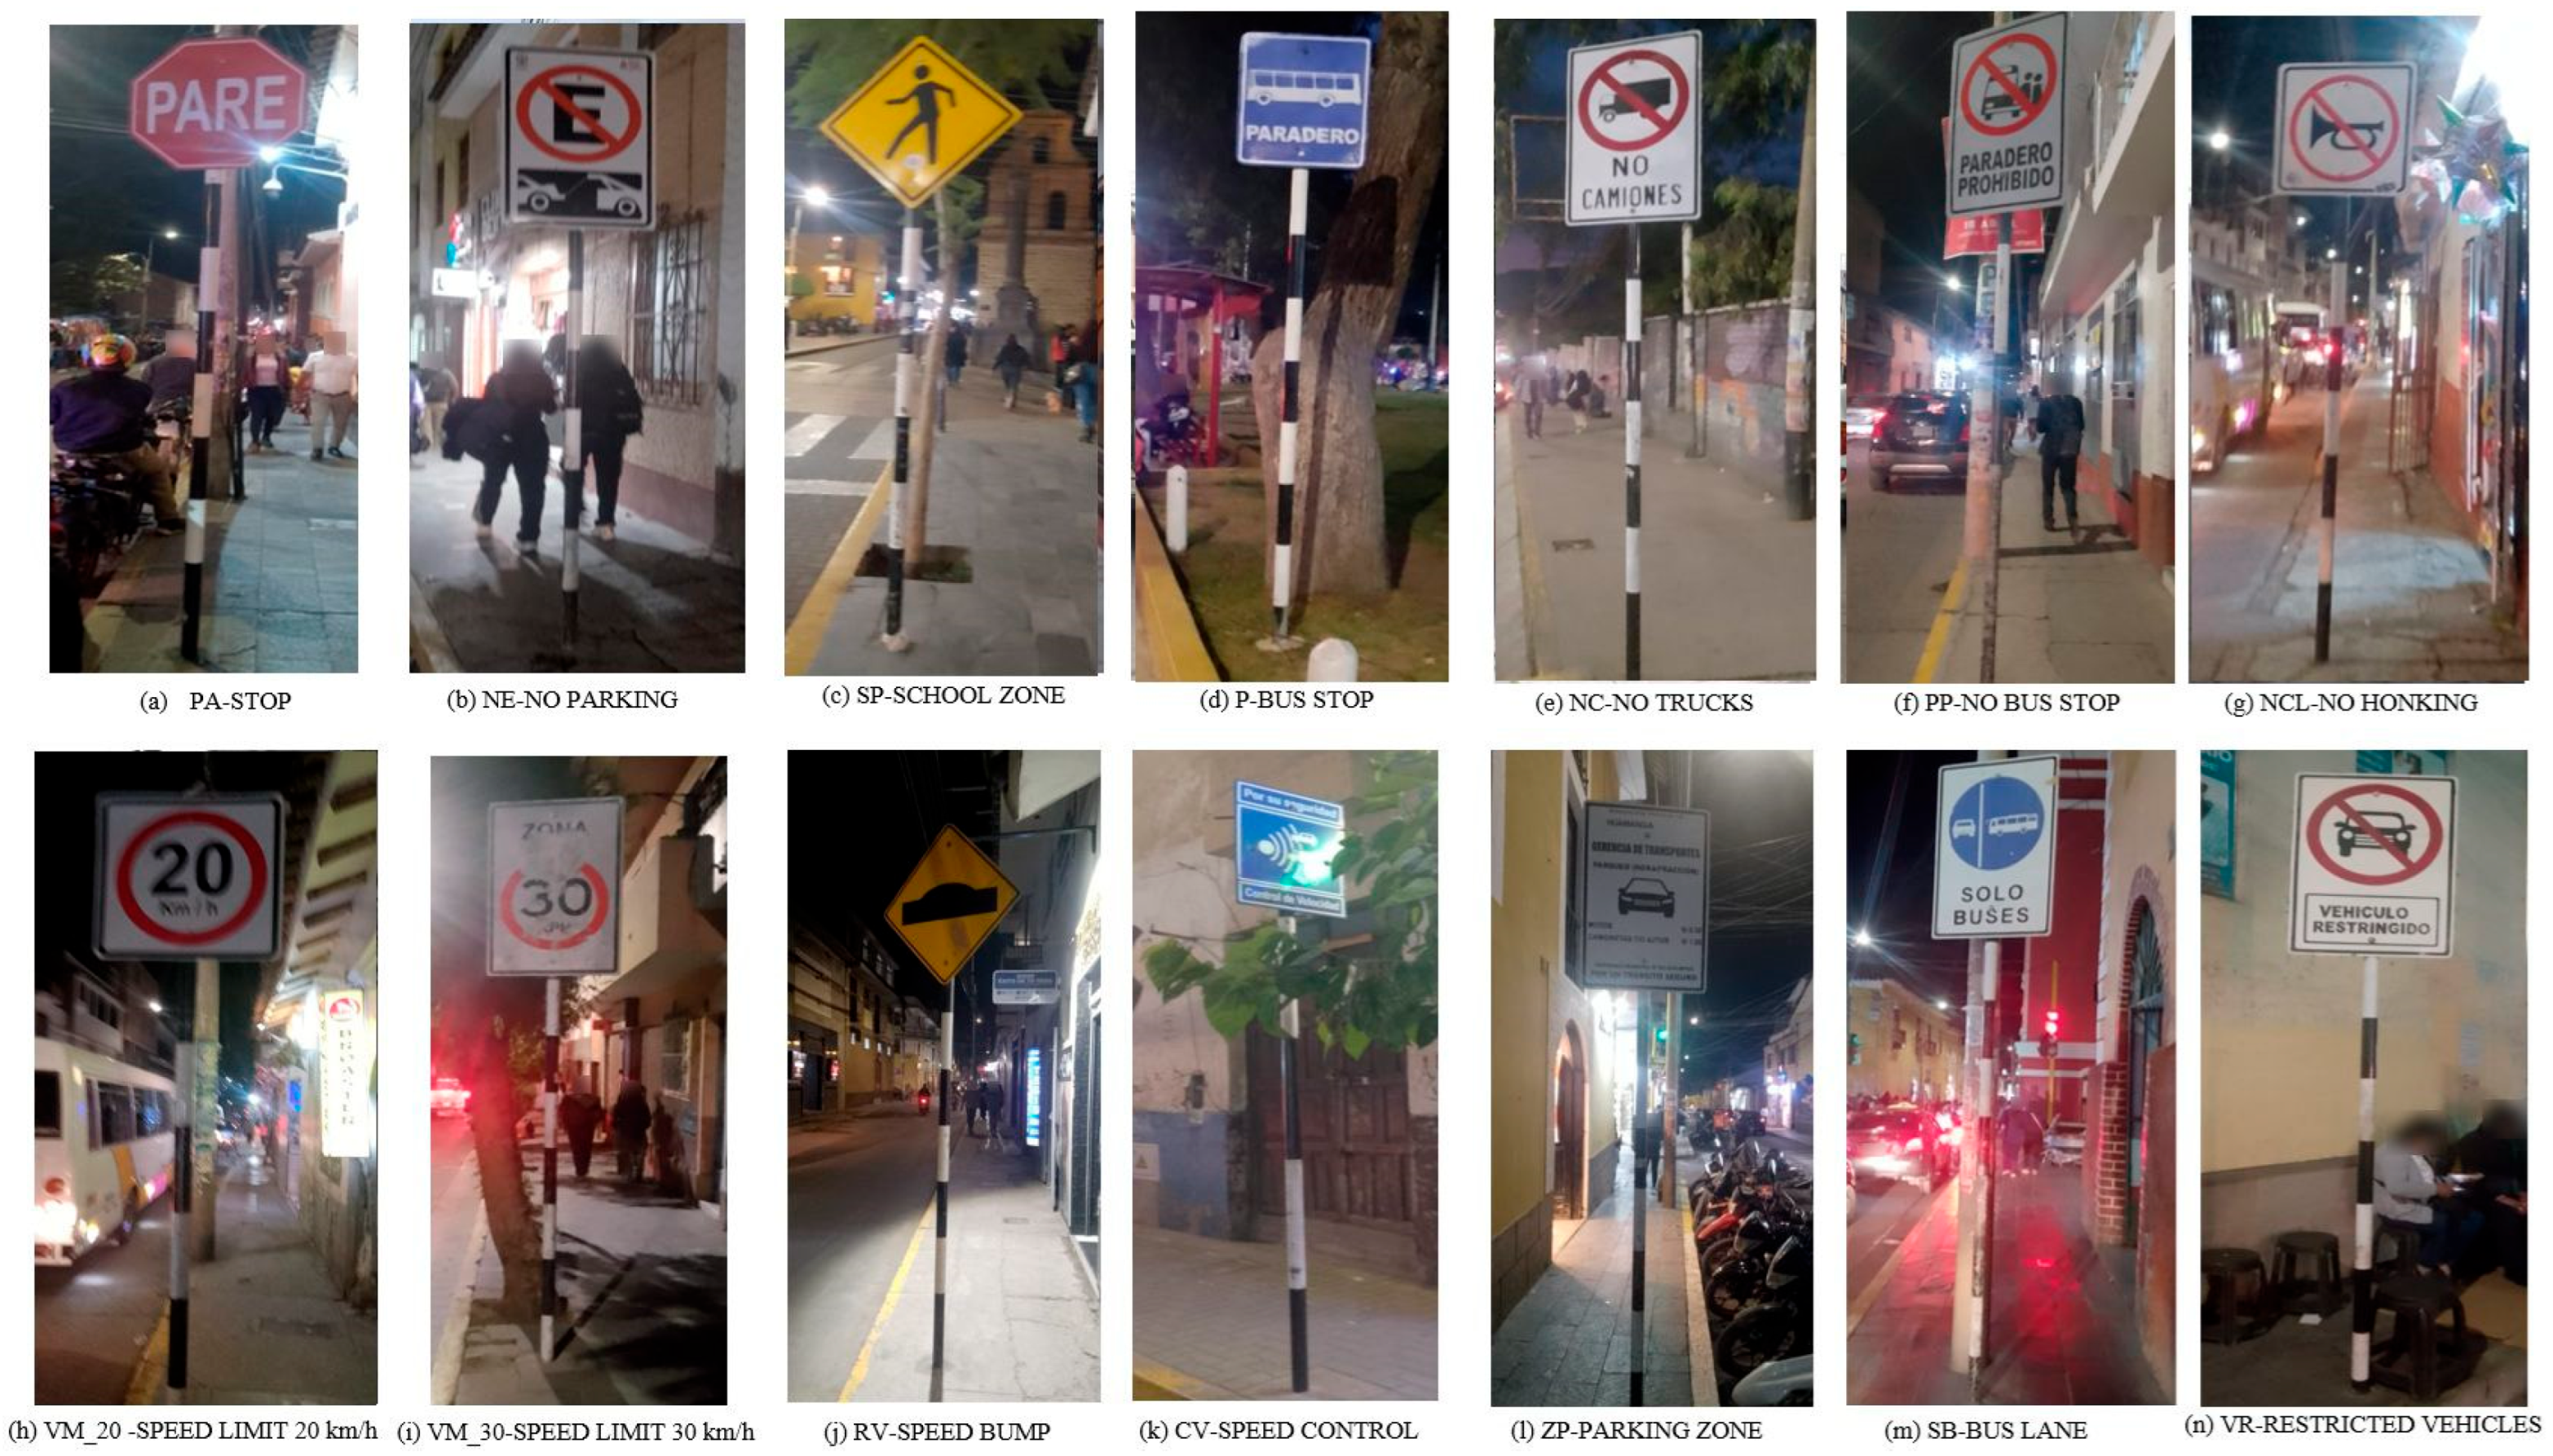
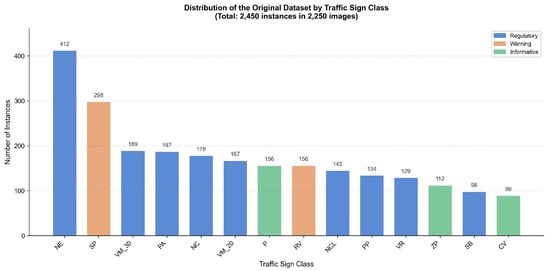
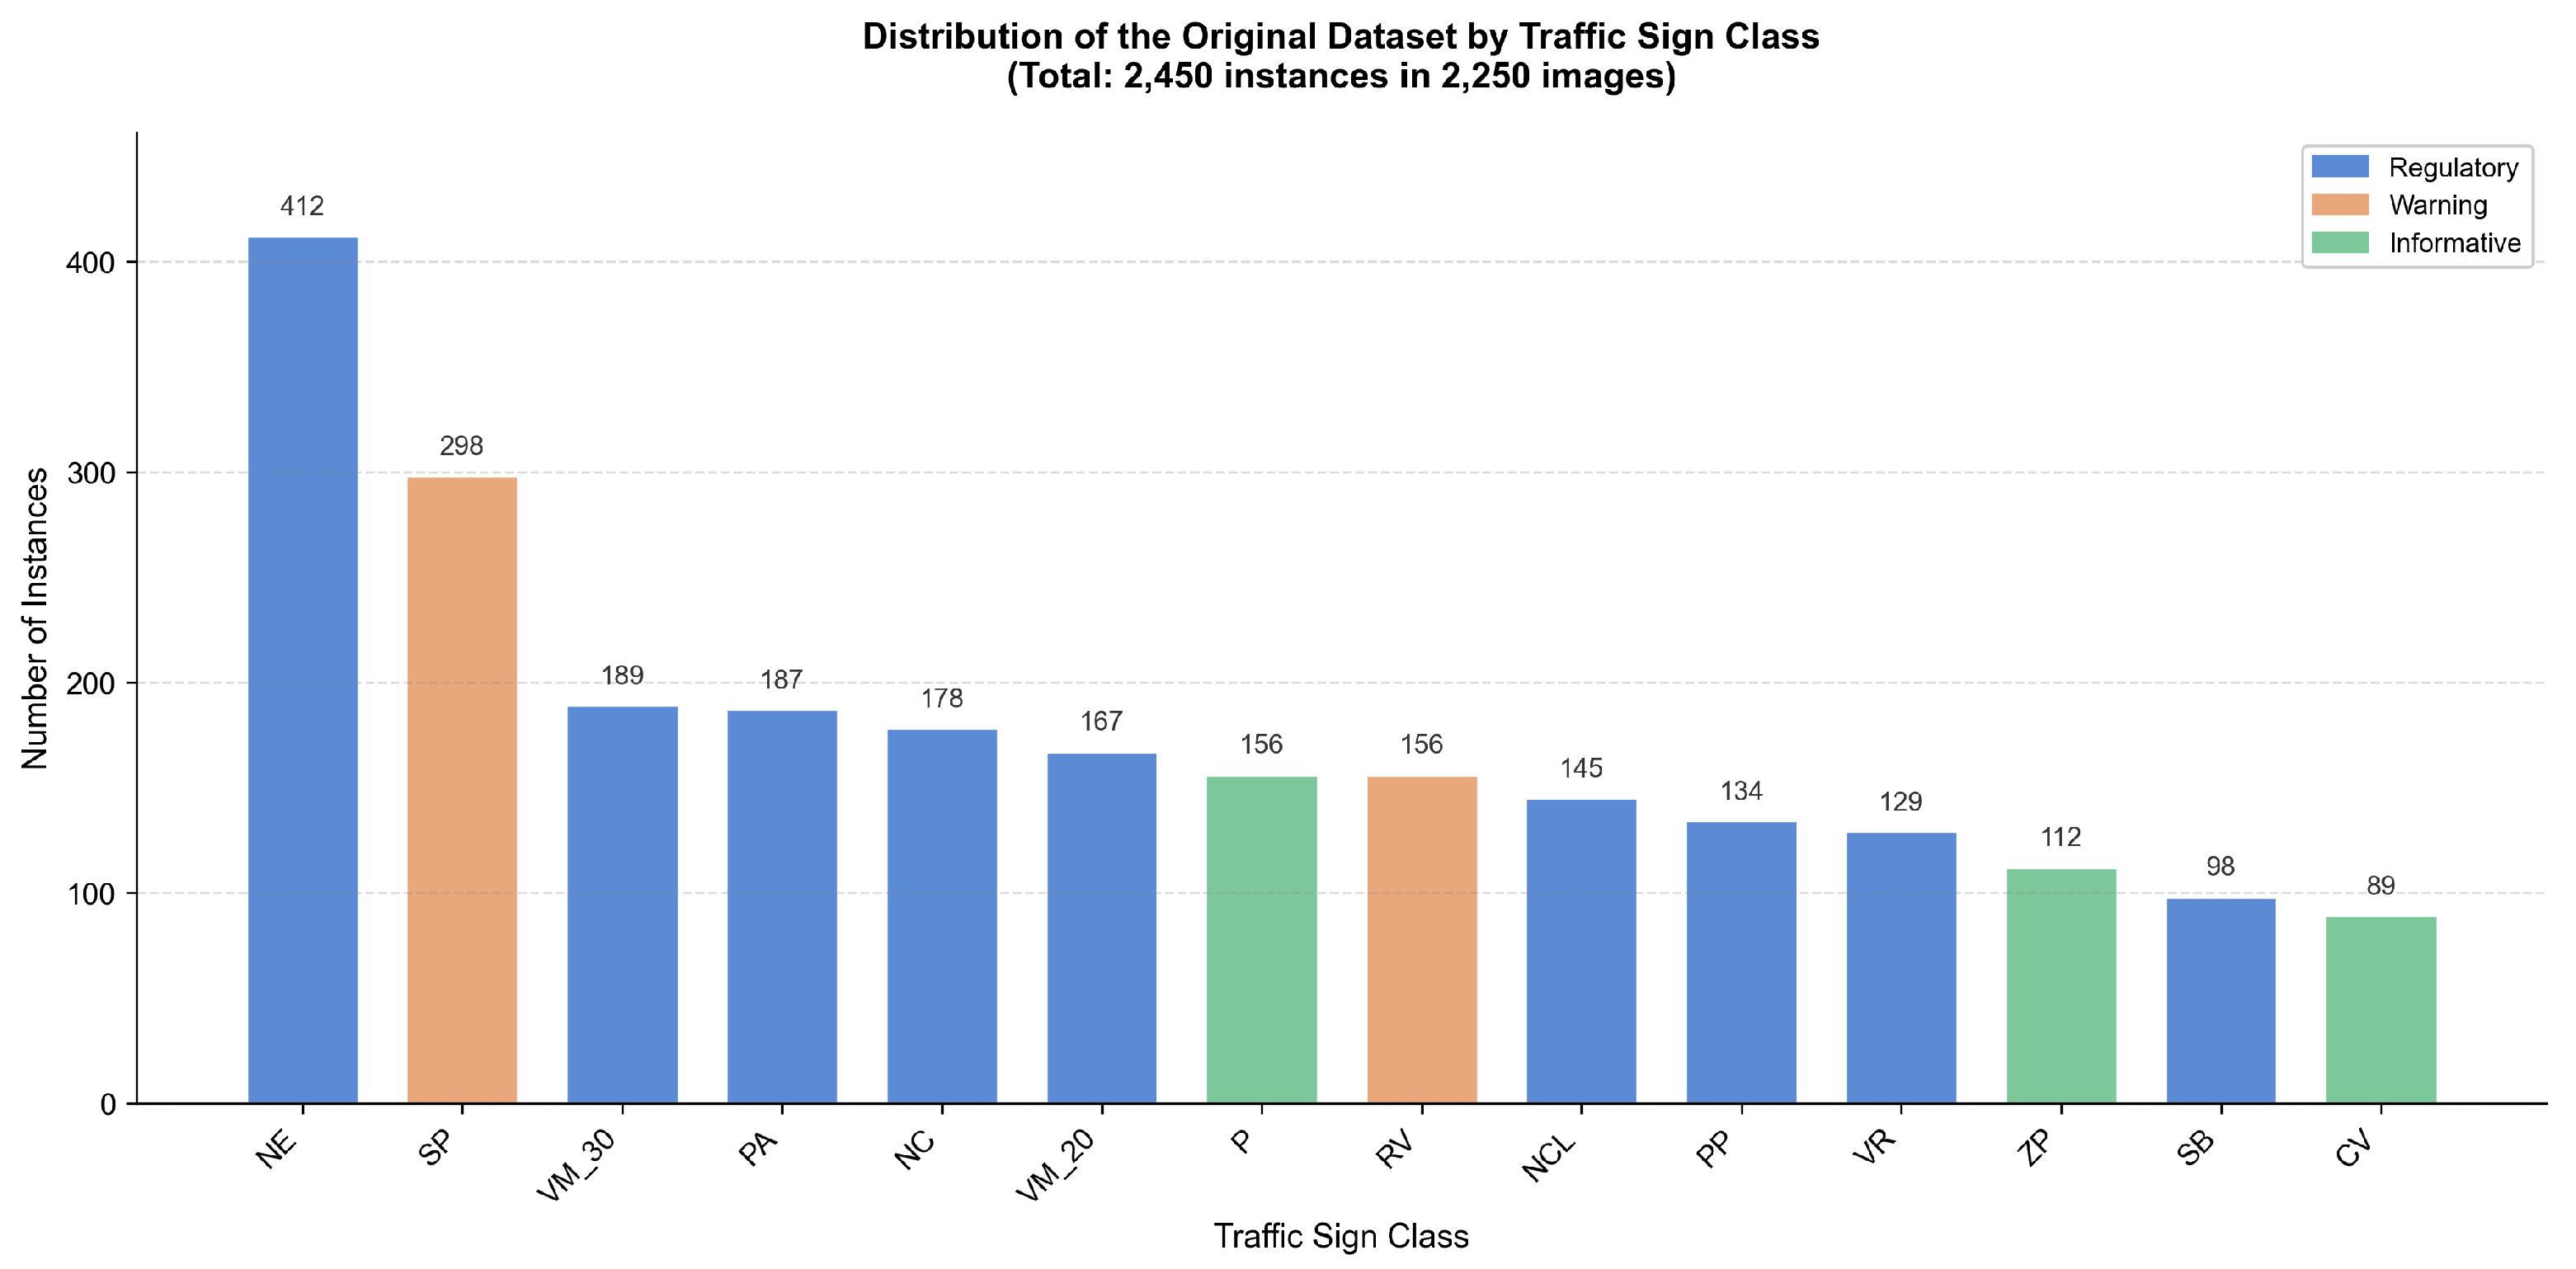
Figure 2 and Figure 3 present representative examples taken under daytime and nighttime conditions. Figure 4 shows the instance distribution by class.
Figure 2.
Representative examples of the 14 vertical signage classes from the original dataset captured under daytime conditions. Sign codes: NE = No Parking; SP = School Zone; P = Public Transport Stop; NC = No Truck Entry; PP = No Stopping; NCL = No Horn Use; VM_20 = Max Speed 20 km/h; PA = Stop; CV = Speed Control; ZP = Parking Zone; VM_30 = Max Speed 30 km/h; RV = Speed Bump; SB = Buses Only; VR = Restricted Vehicle.
Figure 3.
Representative examples of the 14 vertical signage classes captured under nighttime conditions with variable artificial illumination. Sign codes are defined in Figure 2.
Figure 4.
Distribution of the original dataset by vertical signage class.
2.3. Data Labeling with LabelMe
The selection of the annotation tool constitutes a methodological decision that directly impacts dataset quality and annotation efficiency. Several open-source and commercial tools were evaluated for this study, including LabelMe [44], CVAT [45], LabelImg [46], Label Studio [47], and Roboflow. Table 2 summarizes the comparative analysis of the principal annotation tools considered in this study.
Table 2.
(New) Comparative analysis of image annotation tools for traffic sign labeling. Symbols: ✓ = feature available; × = feature not available; N/A = not applicable (cloud-based service).
LabelMe was selected as the annotation tool based on four principal criteria. First, academic provenance: LabelMe originated at MIT’s Computer Science and Artificial Intelligence Laboratory (CSAIL) and is formally documented in a highly cited peer-reviewed publication [44], providing methodological traceability appropriate for scientific research. Second, native polygon annotation: unlike bounding box-only tools such as LabelImg, LabelMe was designed specifically for polygon-based annotation, enabling precise delineation of traffic sign boundaries. This is particularly important for signs with irregular contours due to deterioration, partial occlusion, or deformation from vehicular impact. Third, Segment Anything Model (SAM) integration: LabelMe incorporates built-in support for multiple SAM variants [48], including SAM (speed, balanced, accuracy), EfficientSAM (speed, accuracy), and SAM2 (speed, balanced, accuracy), enabling the annotator to select the optimal tradeoff between segmentation quality and processing speed. For this study, the SAM accuracy model was selected to maximize boundary precision, configured with a score threshold of 0.30 and an IoU threshold of 0.80. Additionally, LabelMe provides manual configuration of these inference parameters, offering fine-grained control over the semi-automatic annotation process that is not available in all competing tools. Fourth, lightweight deployment: LabelMe requires only a simple Python 3.10 installation via pip with minimal dependencies, facilitating reproducibility without the need for Docker containers or server infrastructure required by alternatives such as CVAT or Label Studio.
Image labeling was performed using the polygonal annotation format to precisely delimit each traffic sign, generating JSON files with vertex coordinates and class labels. The SAM-assisted annotation workflow proceeded as follows: the annotator first identified each traffic sign in the image and placed a point prompt within the sign region, then SAM automatically generated a polygon boundary proposal; next, the annotator verified the polygon and refined it if necessary before confirming the class label according to MTC codes. The annotation process followed a rigorous four-stage protocol. First, the principal researcher performed the initial SAM-assisted annotation for all images. Subsequently, label consistency was verified against MTC regulation codes to ensure correct class assignments. Images of insufficient quality were then excluded from the dataset. Finally, a second annotator independently cross-reviewed 20% of the annotations to ensure inter-annotator consistency. Annotations were converted from LabelMe’s native JSON format to YOLO format through a Python script normalizing bounding box coordinates to the [0,1] range relative to image dimensions.
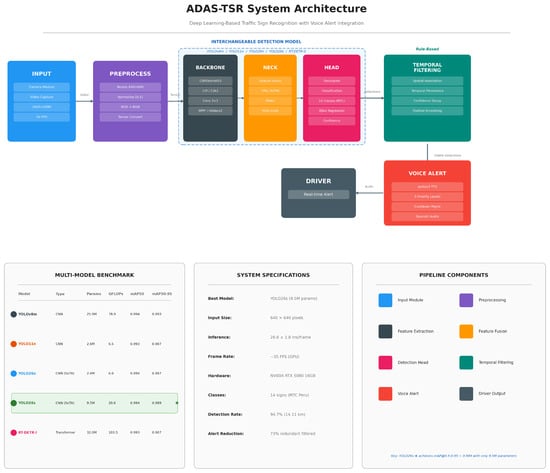
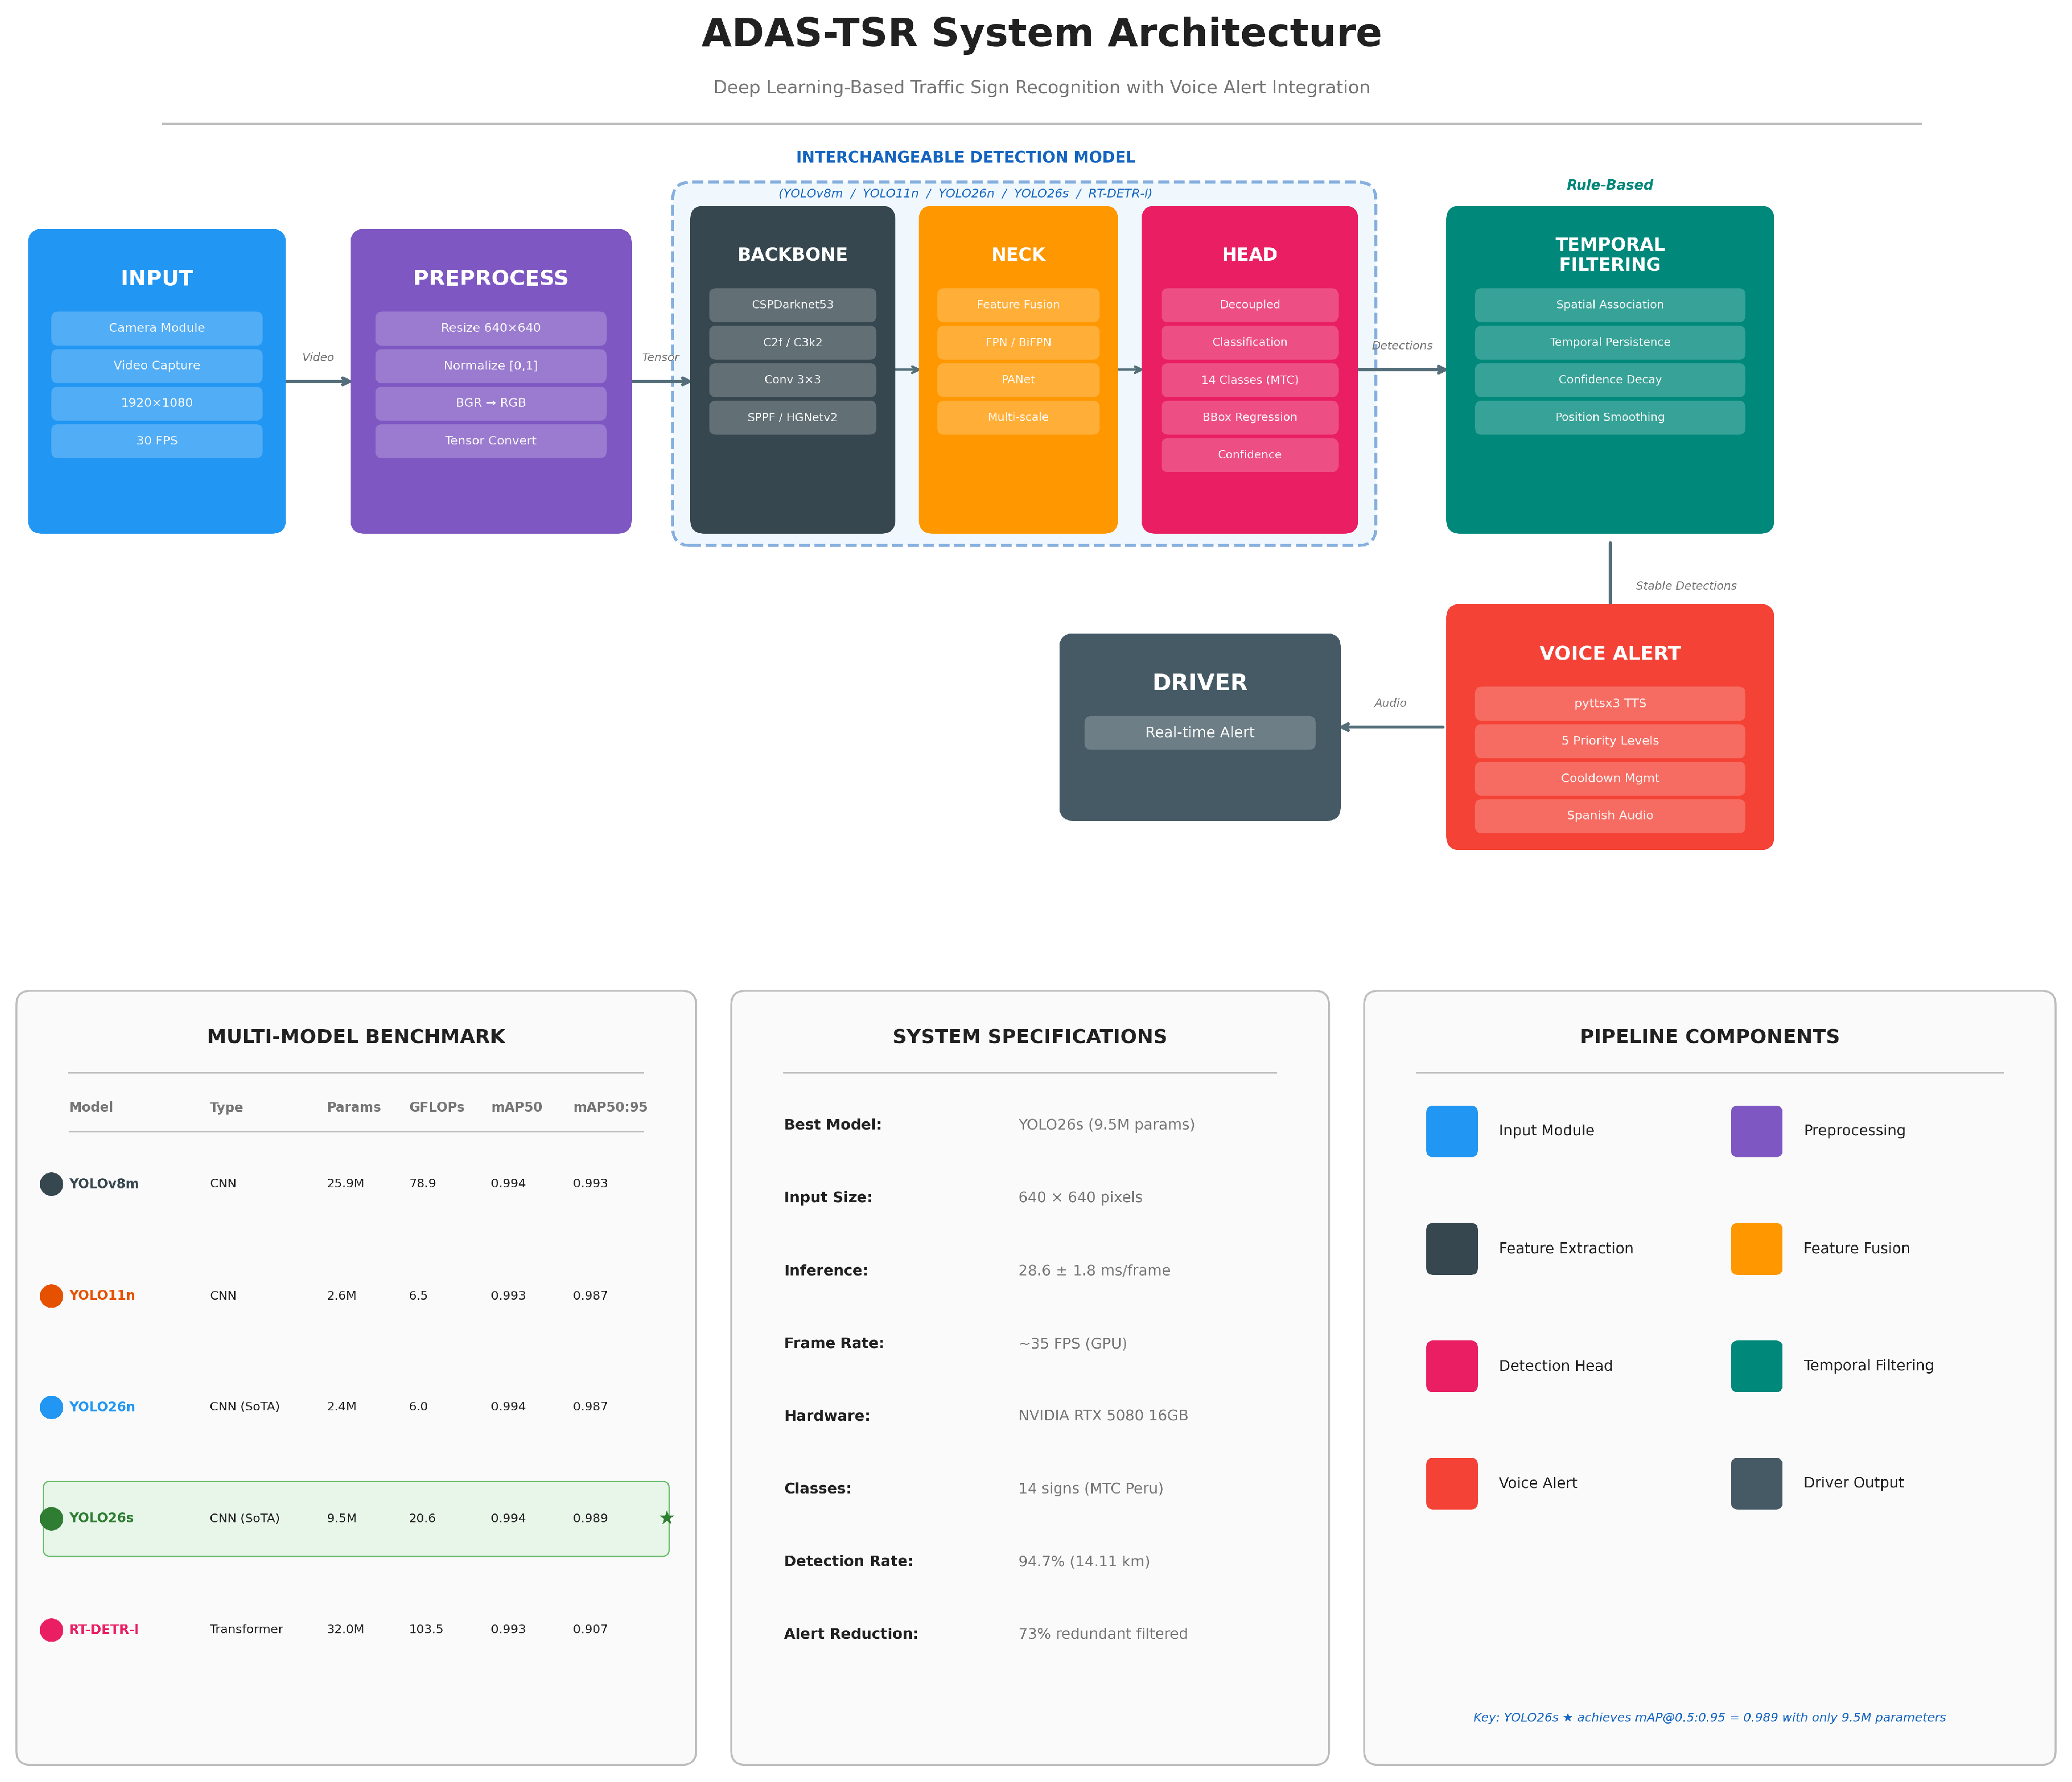
Figure 5 presents the overall system architecture of ADAS-TSR, illustrating the complete processing pipeline from video input through detection, temporal filtering, and voice alert generation.
Figure 5.
(New) ADAS-TSR system architecture showing the complete processing pipeline: Video input, preprocessing (resize, normalization, tensor conversion), interchangeable detection model (backbone–neck–head), rule-based temporal filtering (spatial association, temporal persistence, confidence decay, position smoothing), and voice alert generation with five priority levels. The detection model is modular, supporting all five benchmarked architectures (YOLOv8m, YOLO11n, YOLO26n, YOLO26s, RT-DETR-l). The bottom panels summarize the multi-model benchmark results, system specifications, and pipeline component legend. Asterisks indicate: green = CNN-based models; blue = transformer-based model.
2.4. Detection Model Architectures
To provide a comprehensive evaluation across different architectural paradigms, five object detection models were selected for benchmarking: four CNN-based detectors and one transformer-based detector. This multi-architecture approach addresses the need for rigorous comparative analysis using both established and state-of-the-art detection frameworks.
2.4.1. YOLOv8m (CNN Baseline)
YOLOv8m [20] served as the baseline model from the original study. It employs a CSPDarknet backbone with C2f blocks, Path Aggregation Network neck, and anchor-free detection heads. With 25.9 M parameters and 78.9 GFLOPs, it represents a medium-sized CNN architecture.
2.4.2. YOLO11n (Lightweight CNN)
YOLO11n represents the nano variant of the YOLO11 family released in late 2025. It introduces improved C3k2 blocks and enhanced feature pyramid networks while maintaining the anchor-free paradigm. With only 2.6 M parameters and 6.5 GFLOPs, it offers an order-of-magnitude reduction in model complexity compared to YOLOv8m.
2.4.3. YOLO26n and YOLO26s (State-of-the-Art CNN)
YOLO26 [21], released on 14 January 2026, represents the latest evolution of the YOLO family. Key innovations include NMS-free inference through improved postprocessing, architectural optimizations yielding 43% faster CPU inference, and refined feature extraction modules. The nano (2.4 M parameters, 6.0 GFLOPs) and small (9.5 M parameters, 20.6 GFLOPs) variants were evaluated to assess the performance–efficiency tradeoff.
2.4.4. RT-DETR-l (Transformer-Based Detector)
RT-DETR-l (Real-Time Detection Transformer) [19] was included to represent the transformer-based detection paradigm. Unlike CNN-based YOLO models that process local features through convolutional kernels, RT-DETR employs a hybrid architecture consisting of a CNN backbone (HGNetv2) for initial feature extraction followed by a transformer encoder–decoder that uses self-attention mechanisms to capture global contextual relationships. The decoder uses learned object queries for end-to-end detection without NMS. With 32.0 M parameters and 103.5 GFLOPs, it represents the most computationally intensive model in this benchmark.
Note on open-vocabulary detectors: Models such as YOLO-World [22] and Grounding DINO [23] were considered but excluded from the experimental comparison. These architectures are designed for open-set detection through language-vision alignment; this makes them architecturally sub-optimal for our closed-set TSR application with 14 fixed and well-defined sign classes, where supervised fine-tuning is the appropriate methodology.
2.5. Training Configuration
All models were trained under controlled conditions to ensure a fair comparison. Training was conducted on an NVIDIA GeForce RTX 5080 GPU (16 GB VRAM, NVIDIA Corporation, Santa Clara, CA, USA) with identical dataset partitioning and augmentation strategies. Table 3 details the hyperparameter configuration.
Table 3.
(New) Training configuration for multi-model benchmark.
The optimizer choice reflected established best practices for each architecture family: SGD with momentum for CNN-based YOLO models and AdamW for the transformer-based RT-DETR, which benefits from adaptive learning rates for attention weight optimization. RT-DETR used a smaller batch size (8 vs. 16) due to its higher memory requirements (7.2 GB vs. 2.4–4.9 GB).
2.6. Rule-Based Temporal Filtering System
For real-time road safety applications, a rule-based temporal filtering system was developed to stabilize frame-by-frame detections and suppress redundant voice alerts. It is important to note that this system does not constitute a multi-object tracking algorithm (e.g., SORT [49] or DeepSORT); rather, it implements heuristic-based filtering rules that operate on detection outputs to improve temporal consistency. The system operates through four principal mechanisms: spatial association matches each new detection to existing filtered detections of the same class within a positional tolerance of 70 pixels, compensating for minor spatial variations between consecutive frames; temporal persistence maintains matched detections in an active state during a configurable persistence window of 3.0 s, preventing momentary detection dropouts from triggering false negatives; confidence decay applies a multiplicative decay factor of 0.96 per frame to unmatched detections until they reach a minimum threshold of 0.35, at which point they are removed from the active set; finally, positional smoothing applies a weighted average (factor 0.75) between previous and current positions to reduce spatial jitter in displayed bounding boxes. Detections confirmed across a minimum of three consecutive frames were classified as “stable” and made eligible for voice alert triggering. This approach was chosen for its computational simplicity and real-time applicability, while integration of established tracking algorithms such as DeepSORT or ByteTrack constitutes a planned future improvement.
2.7. Voice Alert System
The voice alert system was implemented using the pyttsx3 library [50] with offline text-to-speech synthesis. A class-specific message system with semantic contextualization was designed for each sign type, with a cooldown mechanism of 6 s for standard alerts and 12 s for critical priority signs (PA and SP).
2.8. Validation Protocol
System validation was conducted through vehicular simulations across five representative urban circuits totaling 14.11 km and 2 h 35 min of recording, strategically designed to represent the complete diversity of historic center conditions including colonial streets, main avenues, school zones, nocturnal routes, and peripheral zones. The detection rate metric is formally defined as follows:
where is the total number of physically present traffic signs inventoried along each circuit through manual ground-truth annotation and is the number of signs that received at least one valid detection (confidence ≥ 0.5) and triggered a corresponding voice alert during system operation. A sign was counted as detected if the system generated a correct classification at any point during the vehicle’s approach, regardless of the number of frames in which it appeared.
3. Results
3.1. Multi-Model Comparative Performance
Table 4 presents the comprehensive performance comparison across all five detection architectures evaluated on the Peruvian MTC traffic sign dataset. All CNN-based models achieved mAP@0.5 above 0.993, demonstrating that the dataset supports robust detection regardless of model complexity. Notably, YOLO26s achieved the highest mAP@0.5:0.95 (0.989) among lightweight models, while YOLO26n and YOLO11n matched or exceeded the performance of YOLOv8m with dramatically fewer parameters.
Table 4.
(New) Comparative performance evaluation of CNN-based and transformer-based detection models on the Peruvian MTC traffic sign dataset.
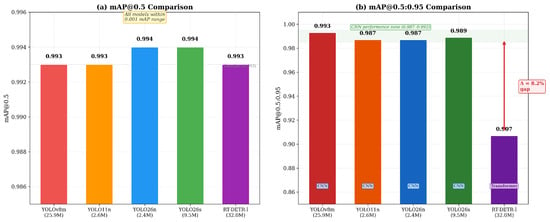
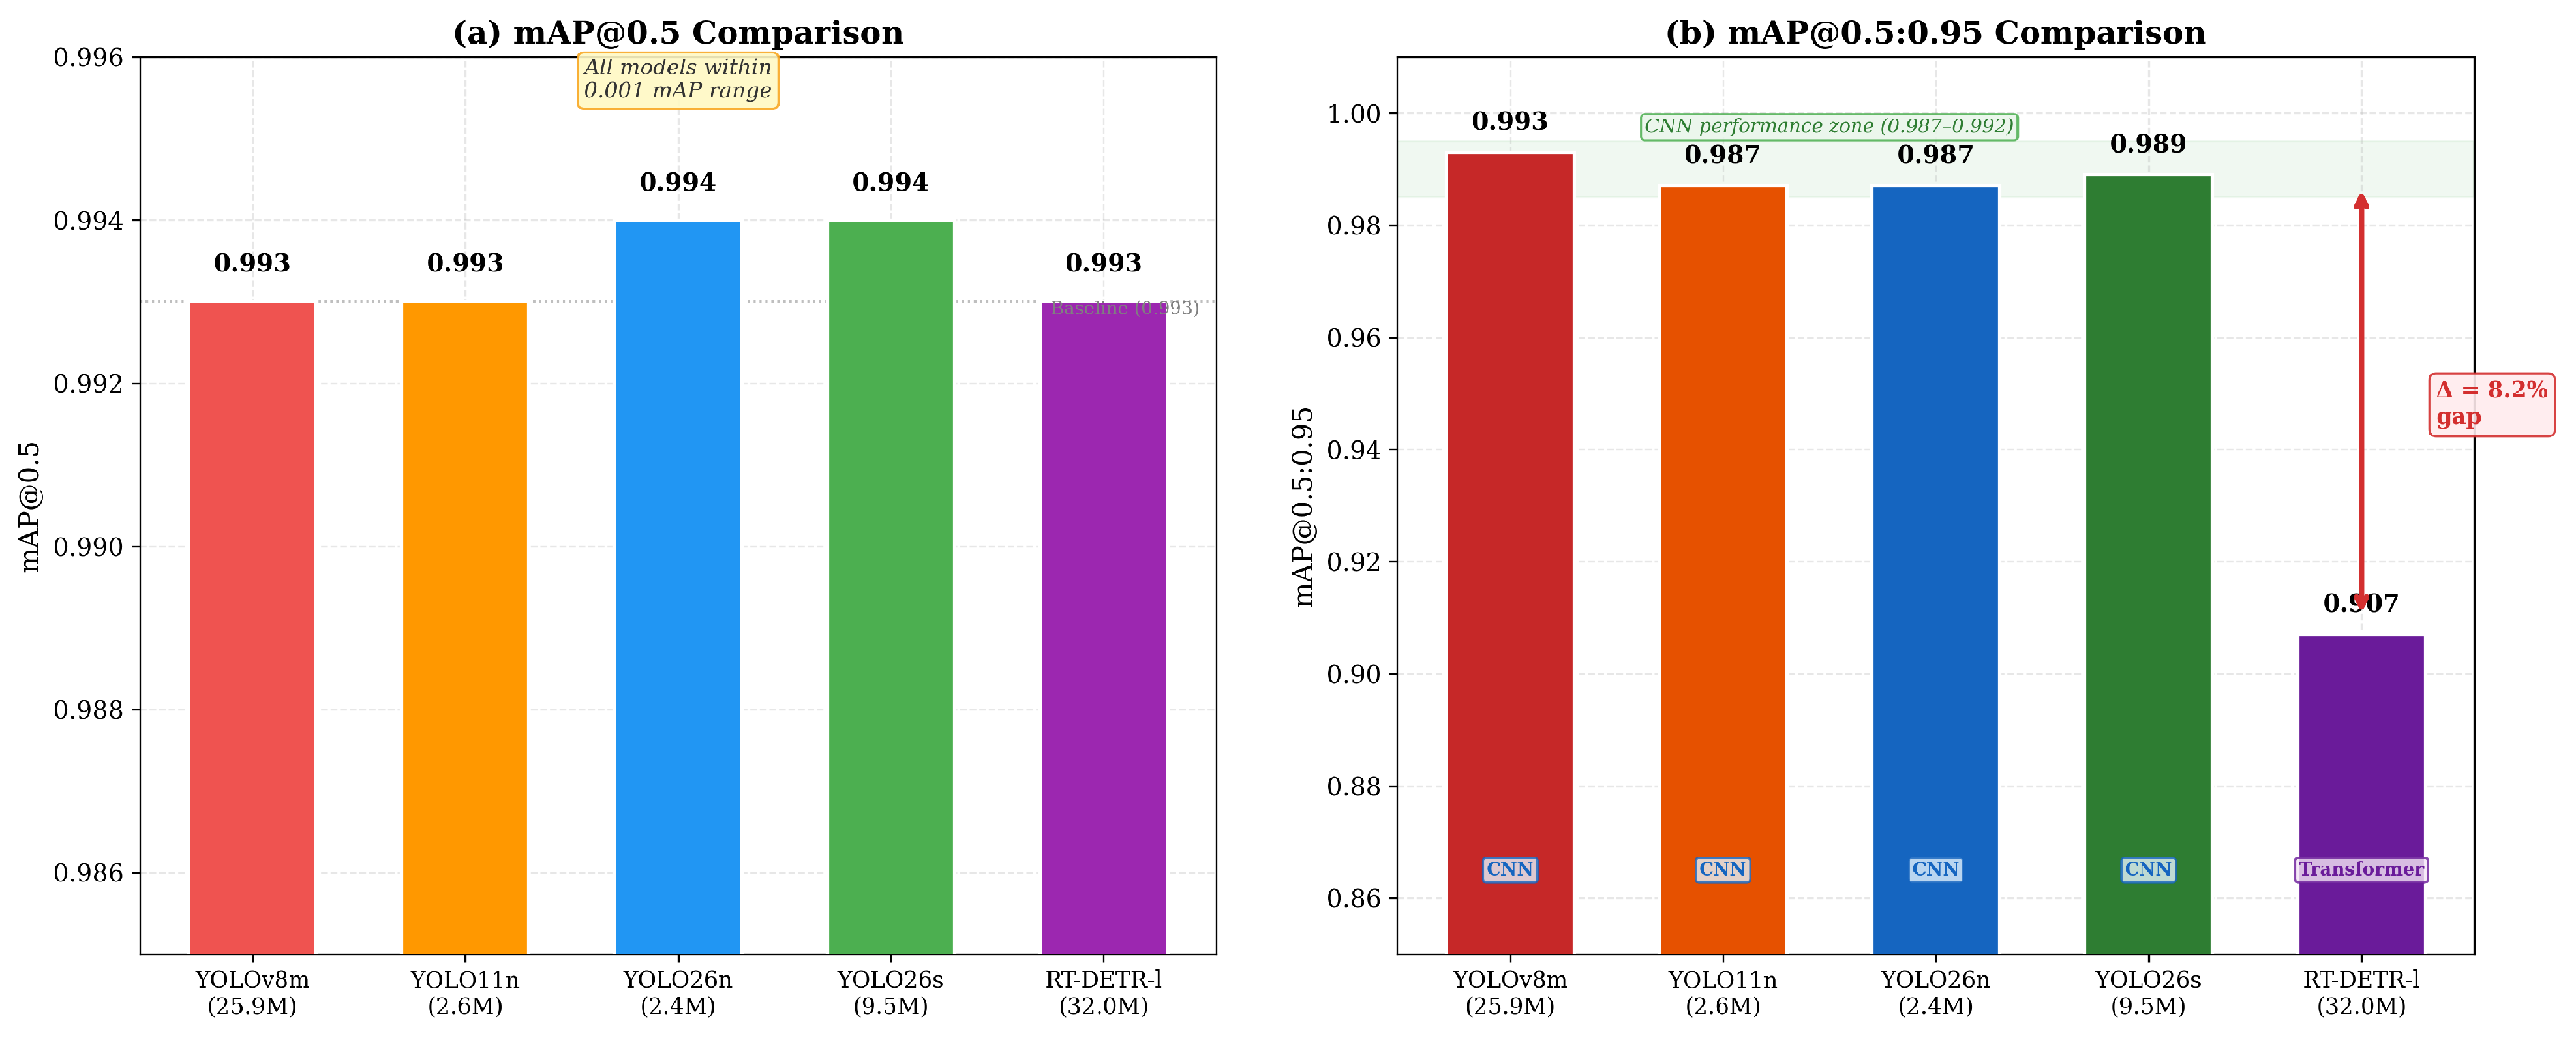
The RT-DETR-l transformer-based model achieved excellent precision (0.997) and recall (0.997), matching YOLOv8m, but exhibited substantially lower mAP@0.5:0.95 (0.907 vs. 0.987–0.993 for CNN models). This gap of 8–9 percentage points indicates that while RT-DETR-l successfully localizes signs, its bounding box regression is less precise at higher IoU thresholds, a relevant consideration for ADAS applications requiring accurate spatial localization. Figure 6 provides a visual comparison of these performance differences across architectures.
Figure 6.
(New) Comparative performance summary: (a) mAP@0.5 shows all five architectures within a narrow 0.001 range (0.993–0.994), demonstrating equivalent detection capability regardless of model complexity, while (b) mAP@0.5:0.95 reveals the 8.2-percentage-point gap between CNN-based models (0.987–0.993) and the transformer-based RT-DETR-l (0.907), indicating less precise bounding box regression at higher IoU thresholds. Labels indicate architecture type (CNN vs. transformer) and parameter count.
3.2. Training Convergence Analysis
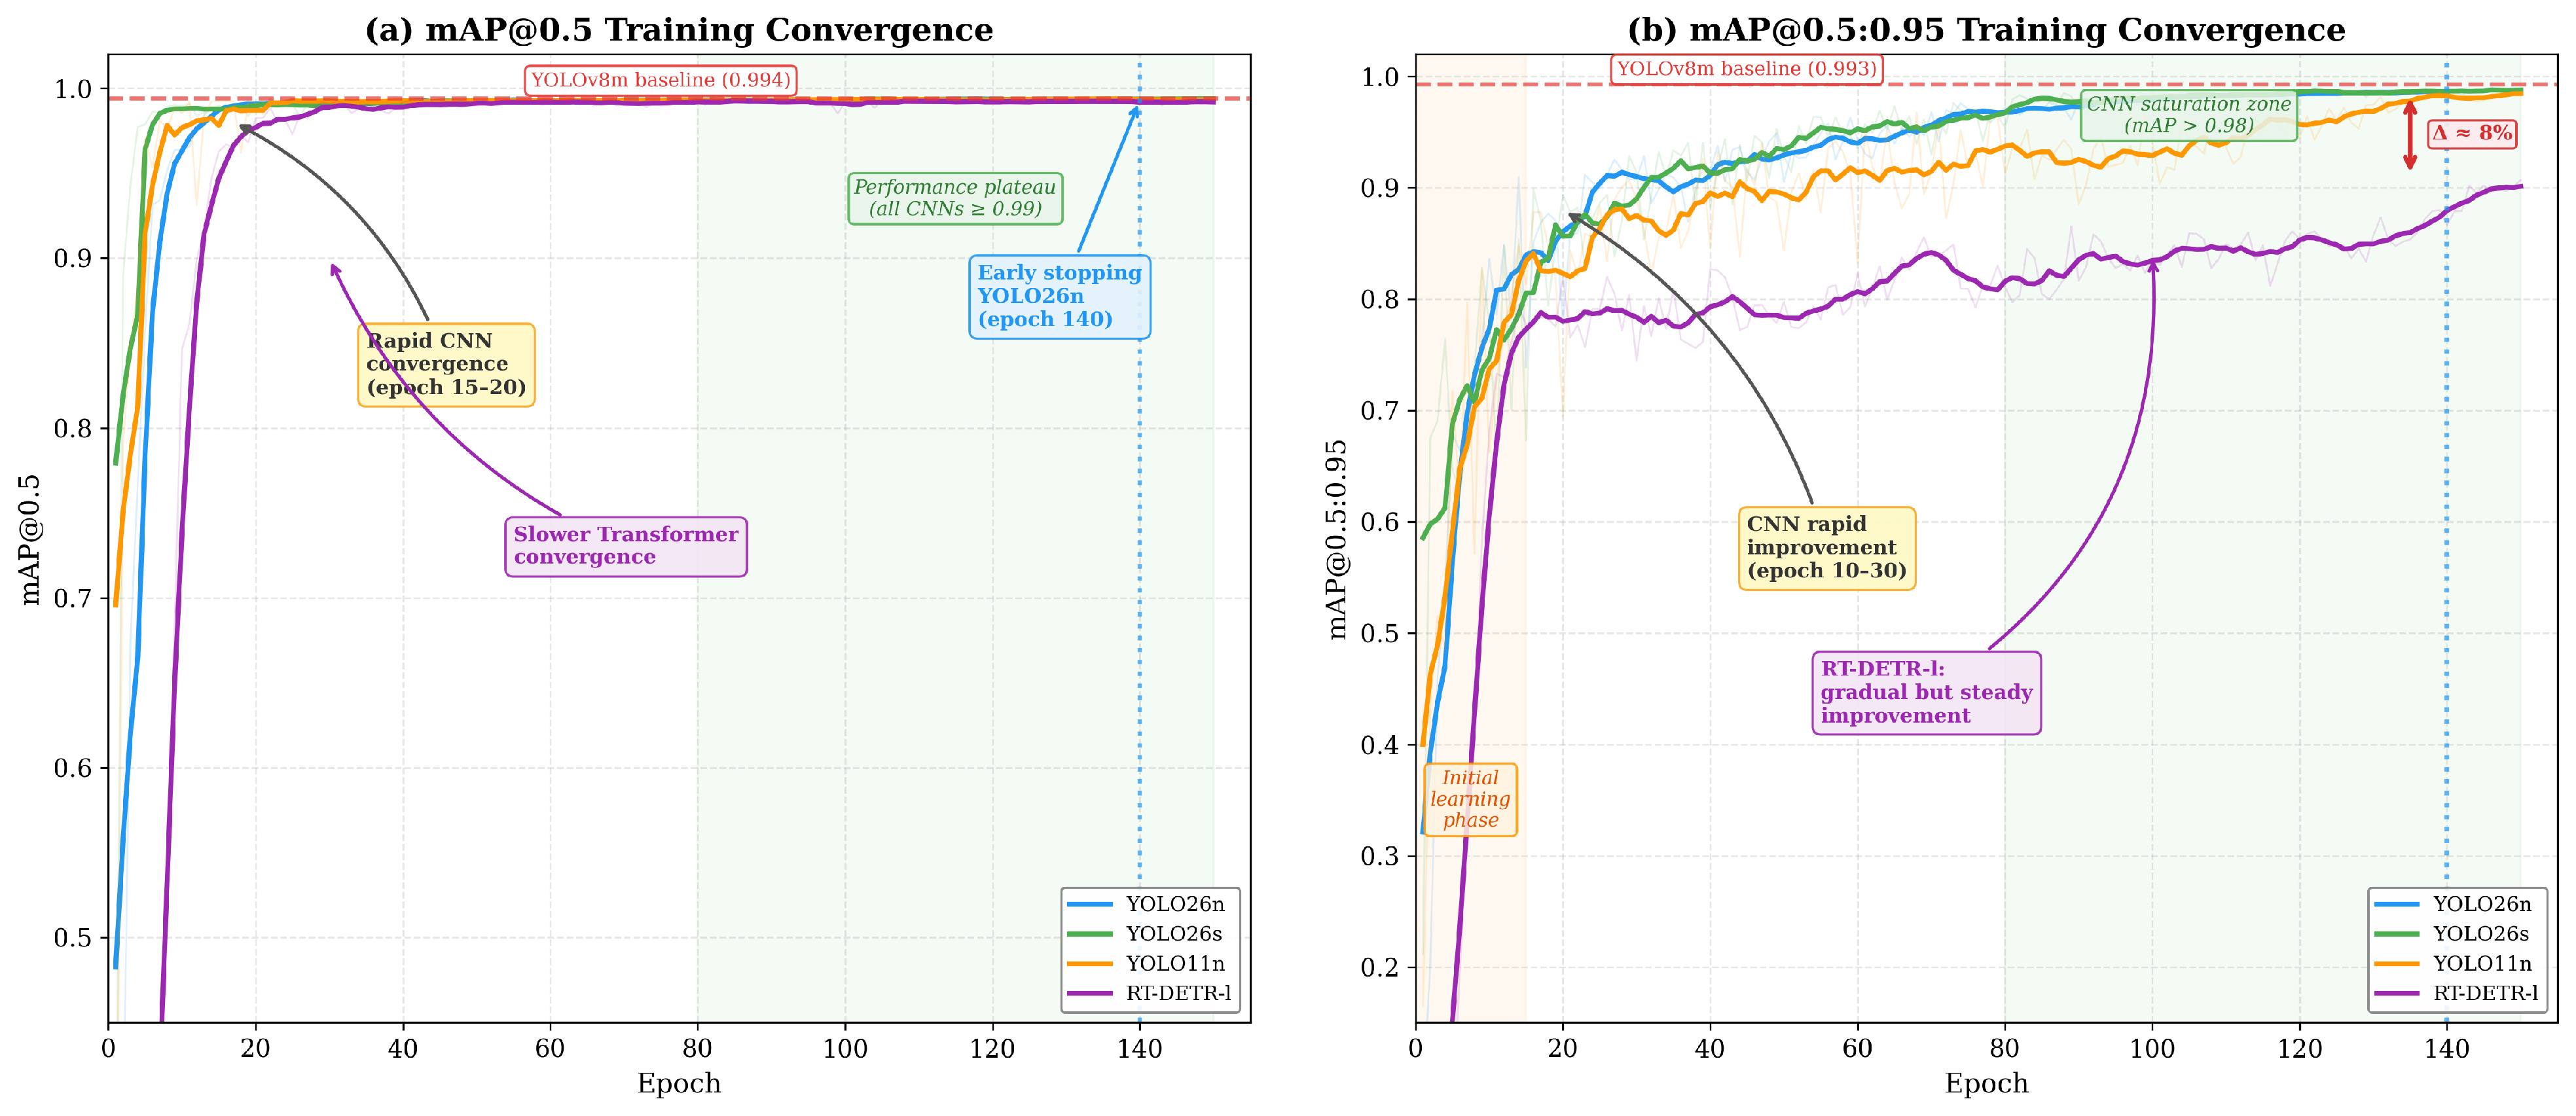
Figure 7 presents the training convergence curves for all four newly trained models, with the annotated inflection points highlighting key convergence behaviors. Three distinct convergence phases are identifiable. During the initial learning phase (epochs 1–15), all models exhibit rapid metric improvement, with CNN-based models reaching 95% of their final mAP@0.5 performance within 4–8 epochs. YOLO26s achieves this milestone by epoch 4, while RT-DETR-l requires 14 epochs, consistent with the slower warmup characteristic of transformer architectures. During the rapid improvement phase (epochs 15–30), the CNN models reach 99% of their final mAP@0.5 by epochs 6–13 and enter a near-plateau state. RT-DETR-l continues its gradual ascent in mAP@0.5:0.95 throughout this phase, reflecting the transformer’s longer optimization trajectory for precise bounding box regression. In the saturation phase (epochs 80–150), all CNN models stabilize above mAP@0.5 ≥ 0.99 with minimal epoch-to-epoch variation. YOLO26n activated early stopping at epoch 140 after 50 epochs without improvement, having reached its peak mAP@0.5:0.95 of 0.988 at epoch 137. Notably, the persistent gap of 8 percentage points between the CNN- and transformer-based models in terms of mAP@0.5:0.95 (0.987–0.989 vs. 0.907) was established by approximately epoch 80 and remained stable thereafter, suggesting a fundamental architectural limitation rather than insufficient training.
Figure 7.
(New) Training convergence for (a) mAP@0.5 and (b) mAP@0.5:0.95 across all detection architectures, with annotated inflection points. Key observations: The CNN models achieve rapid convergence within 15–20 epochs; YOLO26n activates early stopping at epoch 140; RT-DETR-l exhibits slower but steady transformer-characteristic convergence; a gap of 8 percentage points persists between CNN and transformer models in terms of mAP@0.5:0.95 performance from epoch 80 onward. The dashed red line indicates YOLOv8m baseline performance. The shaded green region denotes the CNN performance saturation zone.
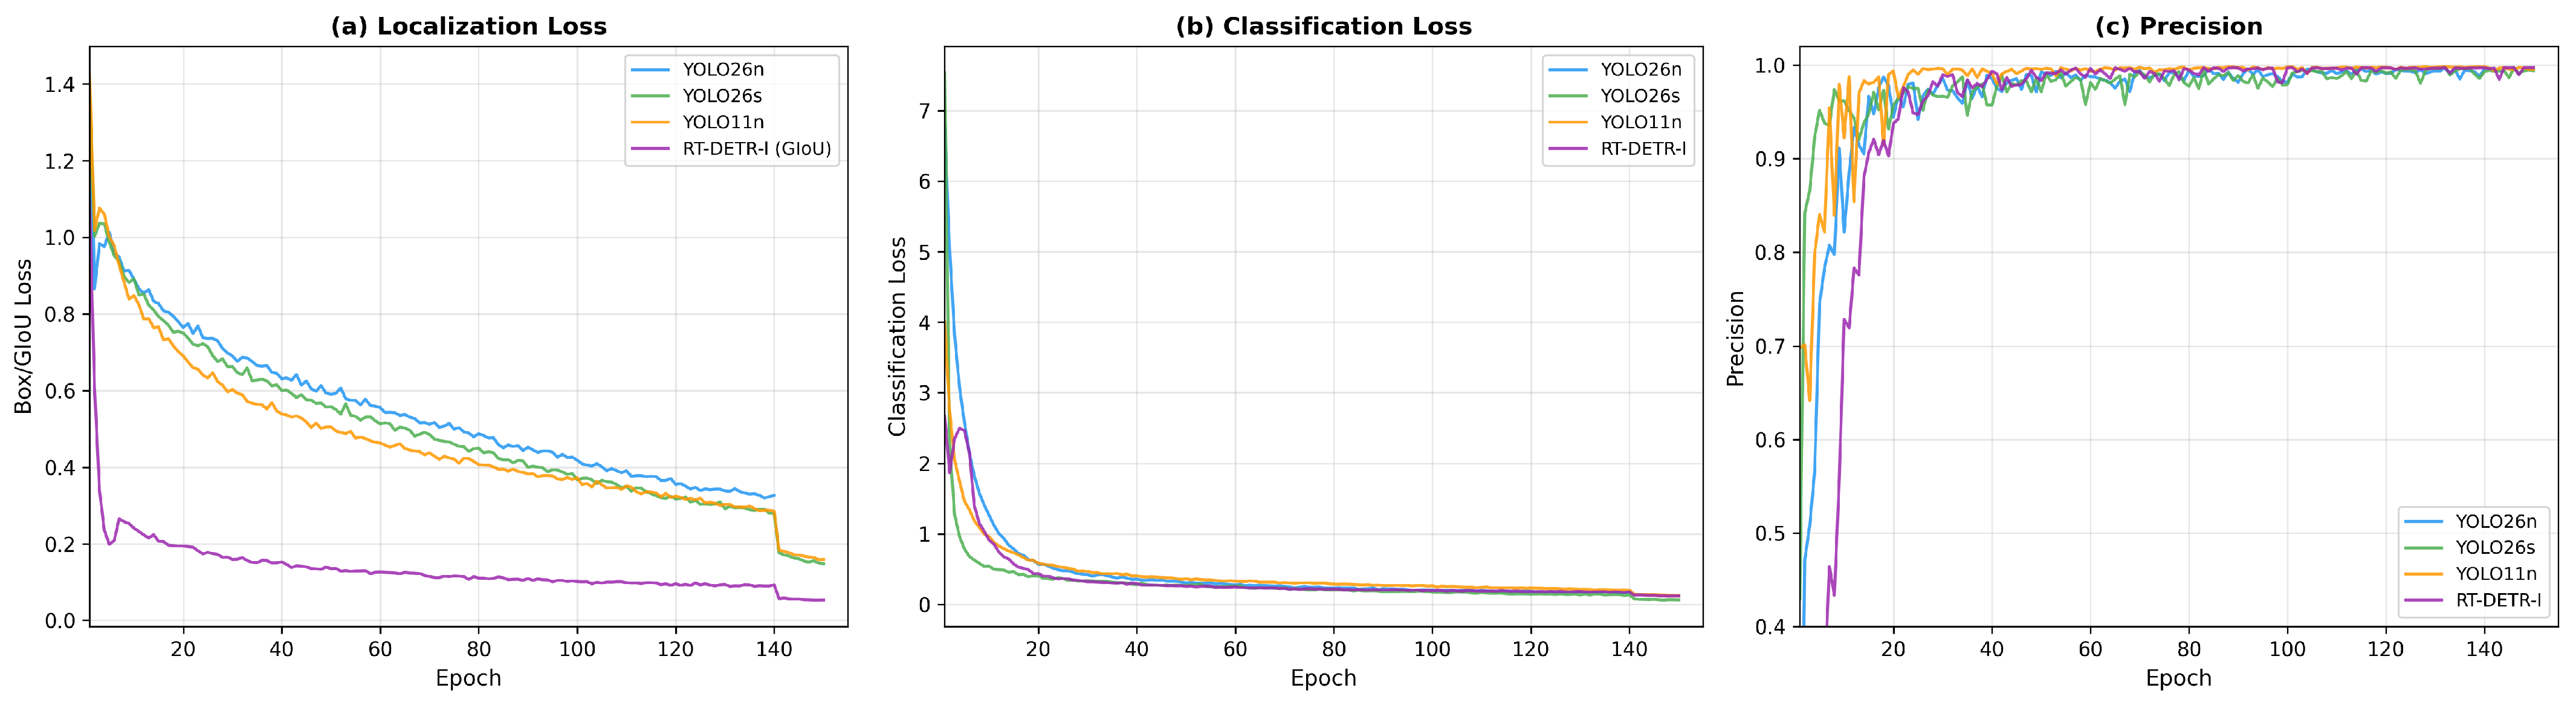
Figure 8 shows the loss function evolution and precision progression during training. All models achieve monotonic loss reduction; YOLO26s exhibits the lowest final classification loss, consistent with its superior per-class detection performance.
Figure 8.
(New) Training dynamics, showing (a) localization loss, (b) classification loss, and (c) precision convergence across architectures.
3.3. Model Efficiency Analysis
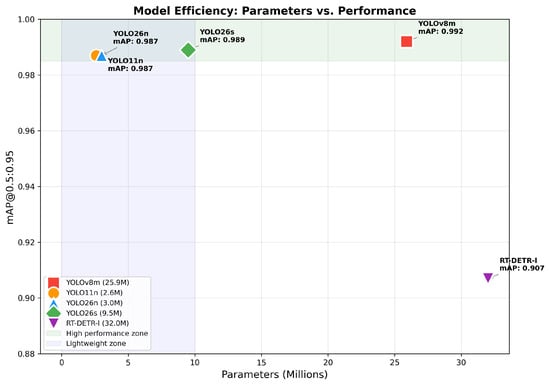
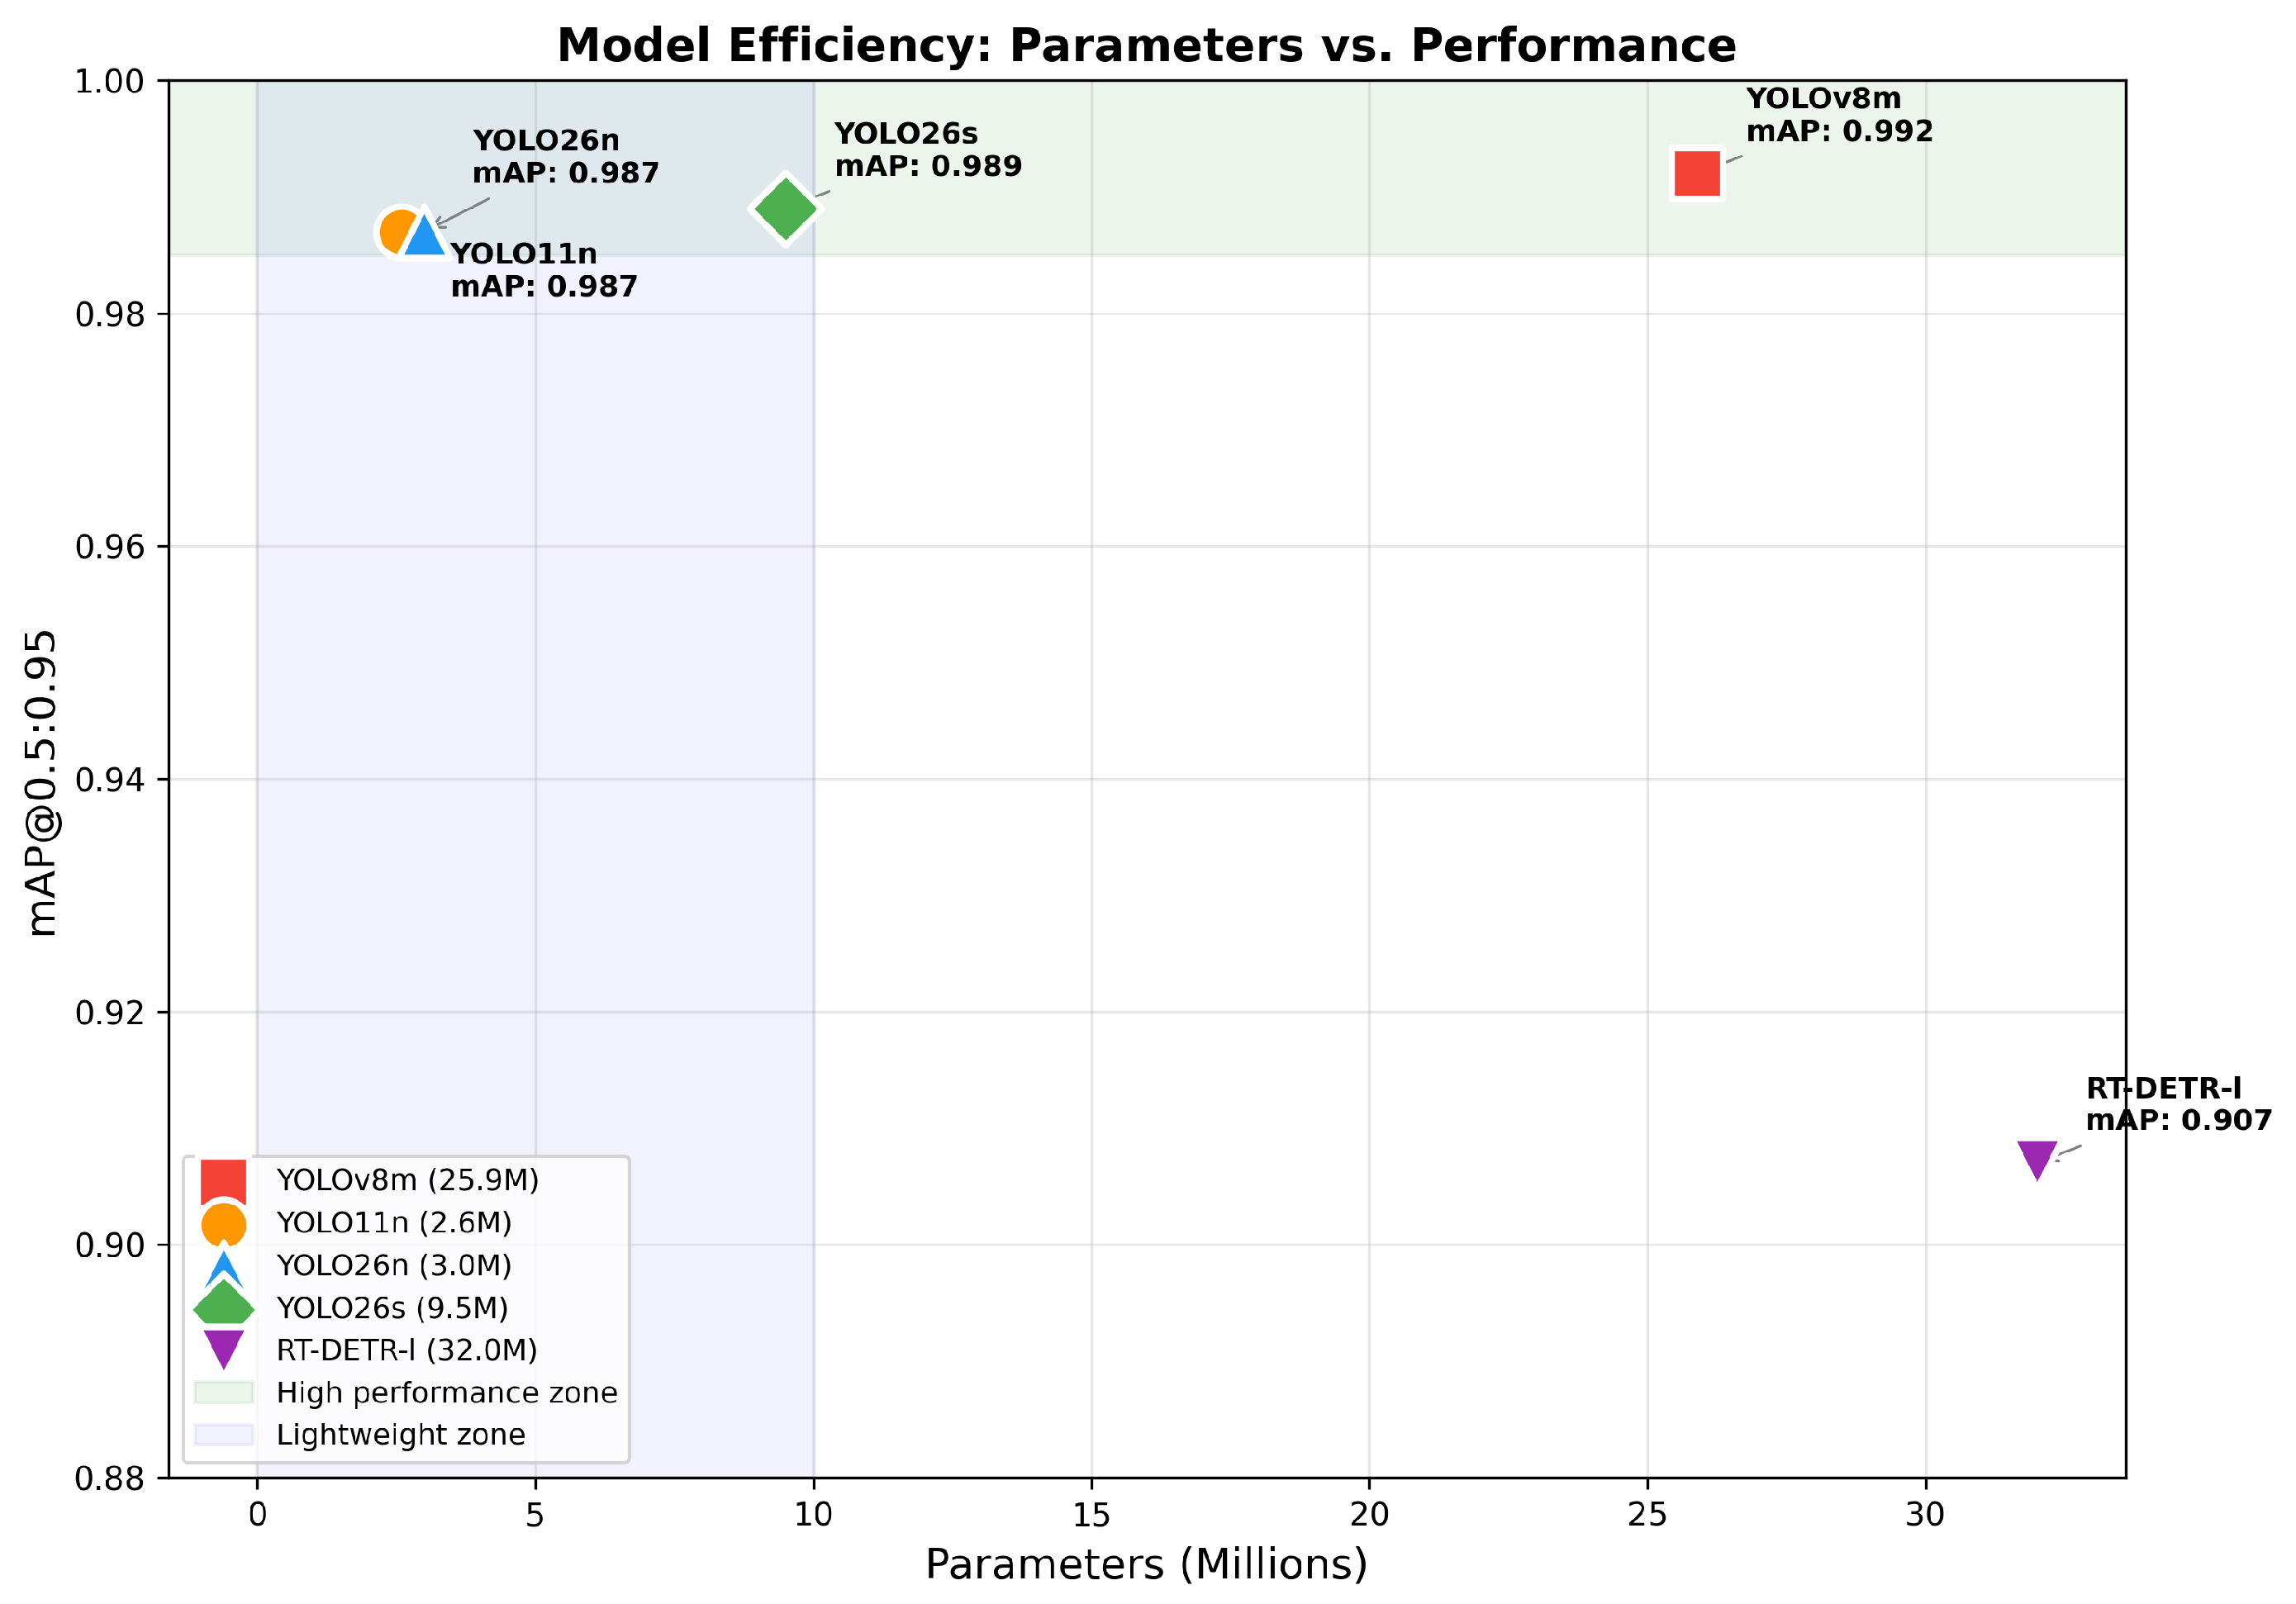
Figure 9 illustrates the fundamental efficiency tradeoff between model complexity and detection performance. The lightweight CNN models (YOLO11n, YOLO26n) occupy the ideal position in the parameter–performance space, achieving near-optimal detection with minimal computational requirements.
Figure 9.
(New) Model efficiency: Parameters vs. mAP@0.5:0.95 performance. The green zone indicates high performance (>0.985) and the blue zone indicates lightweight models (<10 M parameters). YOLO26n and YOLO11n achieve optimal efficiency.
Table 5 presents the computational efficiency analysis. All CNN-based models achieved comparable inference speeds (≈35 FPS) on the RTX 5080, while RT-DETR-l was 33% slower at 23.4 FPS due to the computational overhead of the transformer attention mechanism.
Table 5.
(New) Computational efficiency analysis on NVIDIA RTX 5080 GPU.
3.4. Prediction Uncertainty Analysis
To assess model reliability beyond aggregate metrics, prediction confidence distributions were analyzed across all detections on the validation set (Table 6). This analysis provides insight into model certainty, a critical factor for safety-critical ADAS deployment.
Table 6.
(New) Prediction confidence distribution analysis across detection models.
The modern CNN architectures (YOLO11n, YOLO26s) exhibited significantly higher mean confidence (0.926 and 0.924) compared to YOLOv8m (0.824), with 93–97% of detections above the 0.9 confidence threshold. This improved calibration indicates that newer architectures not only have accurate detection but also greater certainty, thereby reducing the risk of ambiguous detections in safety-critical applications.
RT-DETR-l generated 21,017 raw detections compared to 461–530 for CNN models, reflecting its end-to-end architecture that produces dense predictions without pre-filtering through NMS. After confidence thresholding, RT-DETR-l achieves comparable final detection counts; however, the raw output distribution demonstrates a fundamentally different prediction strategy that is inherent to transformer-based object detection.
3.5. Cross-Class Fairness Analysis
To evaluate detection equity across sign categories, fairness metrics were computed using per-class AP@0.5 distributions (Table 7). Equitable performance across classes is essential for TSR systems, as systematic underperformance on specific sign types could compromise road safety.
Table 7.
(New) Cross-class fairness analysis based on AP@0.5 distribution.
All models achieved Gini coefficients below 0.003, indicating highly equitable detection performance across the 14 sign classes. The coefficient of variation (CV < 0.009) confirms minimal performance disparity. The Restricted Vehicle (VR) class consistently achieved the highest AP@0.5 (0.995) across all models, while the CV (Speed Control) class exhibited the lowest performance, attributable to its smallest representation in the dataset (22 validation instances) and higher visual similarity with other informational signs.
CNN-based models demonstrated more consistent cross-class performance (Gini 0.0011–0.0018) compared to RT-DETR-l (Gini 0.0022), suggesting that CNN architectures may offer slight advantages in maintaining uniform detection quality across classes with varying sample sizes.
3.6. Per-Class Comparative Analysis
Table 8 presents the per-class detection performance for the best-performing model (YOLO26s). All 14 classes achieved mAP@0.5 above 0.976, with 13 out of 14 classes exceeding 0.994.
Table 8.
(New) Per-class detection performance of YOLO26s on the Peruvian MTC dataset.
3.7. Validation in Vehicular Simulations
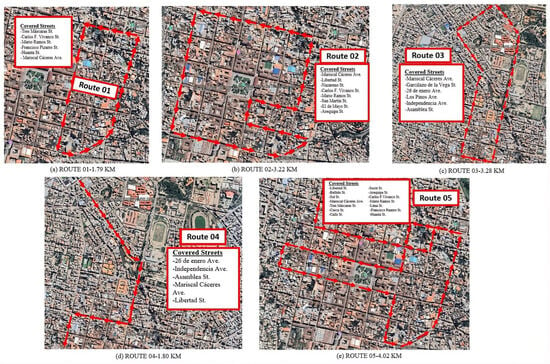
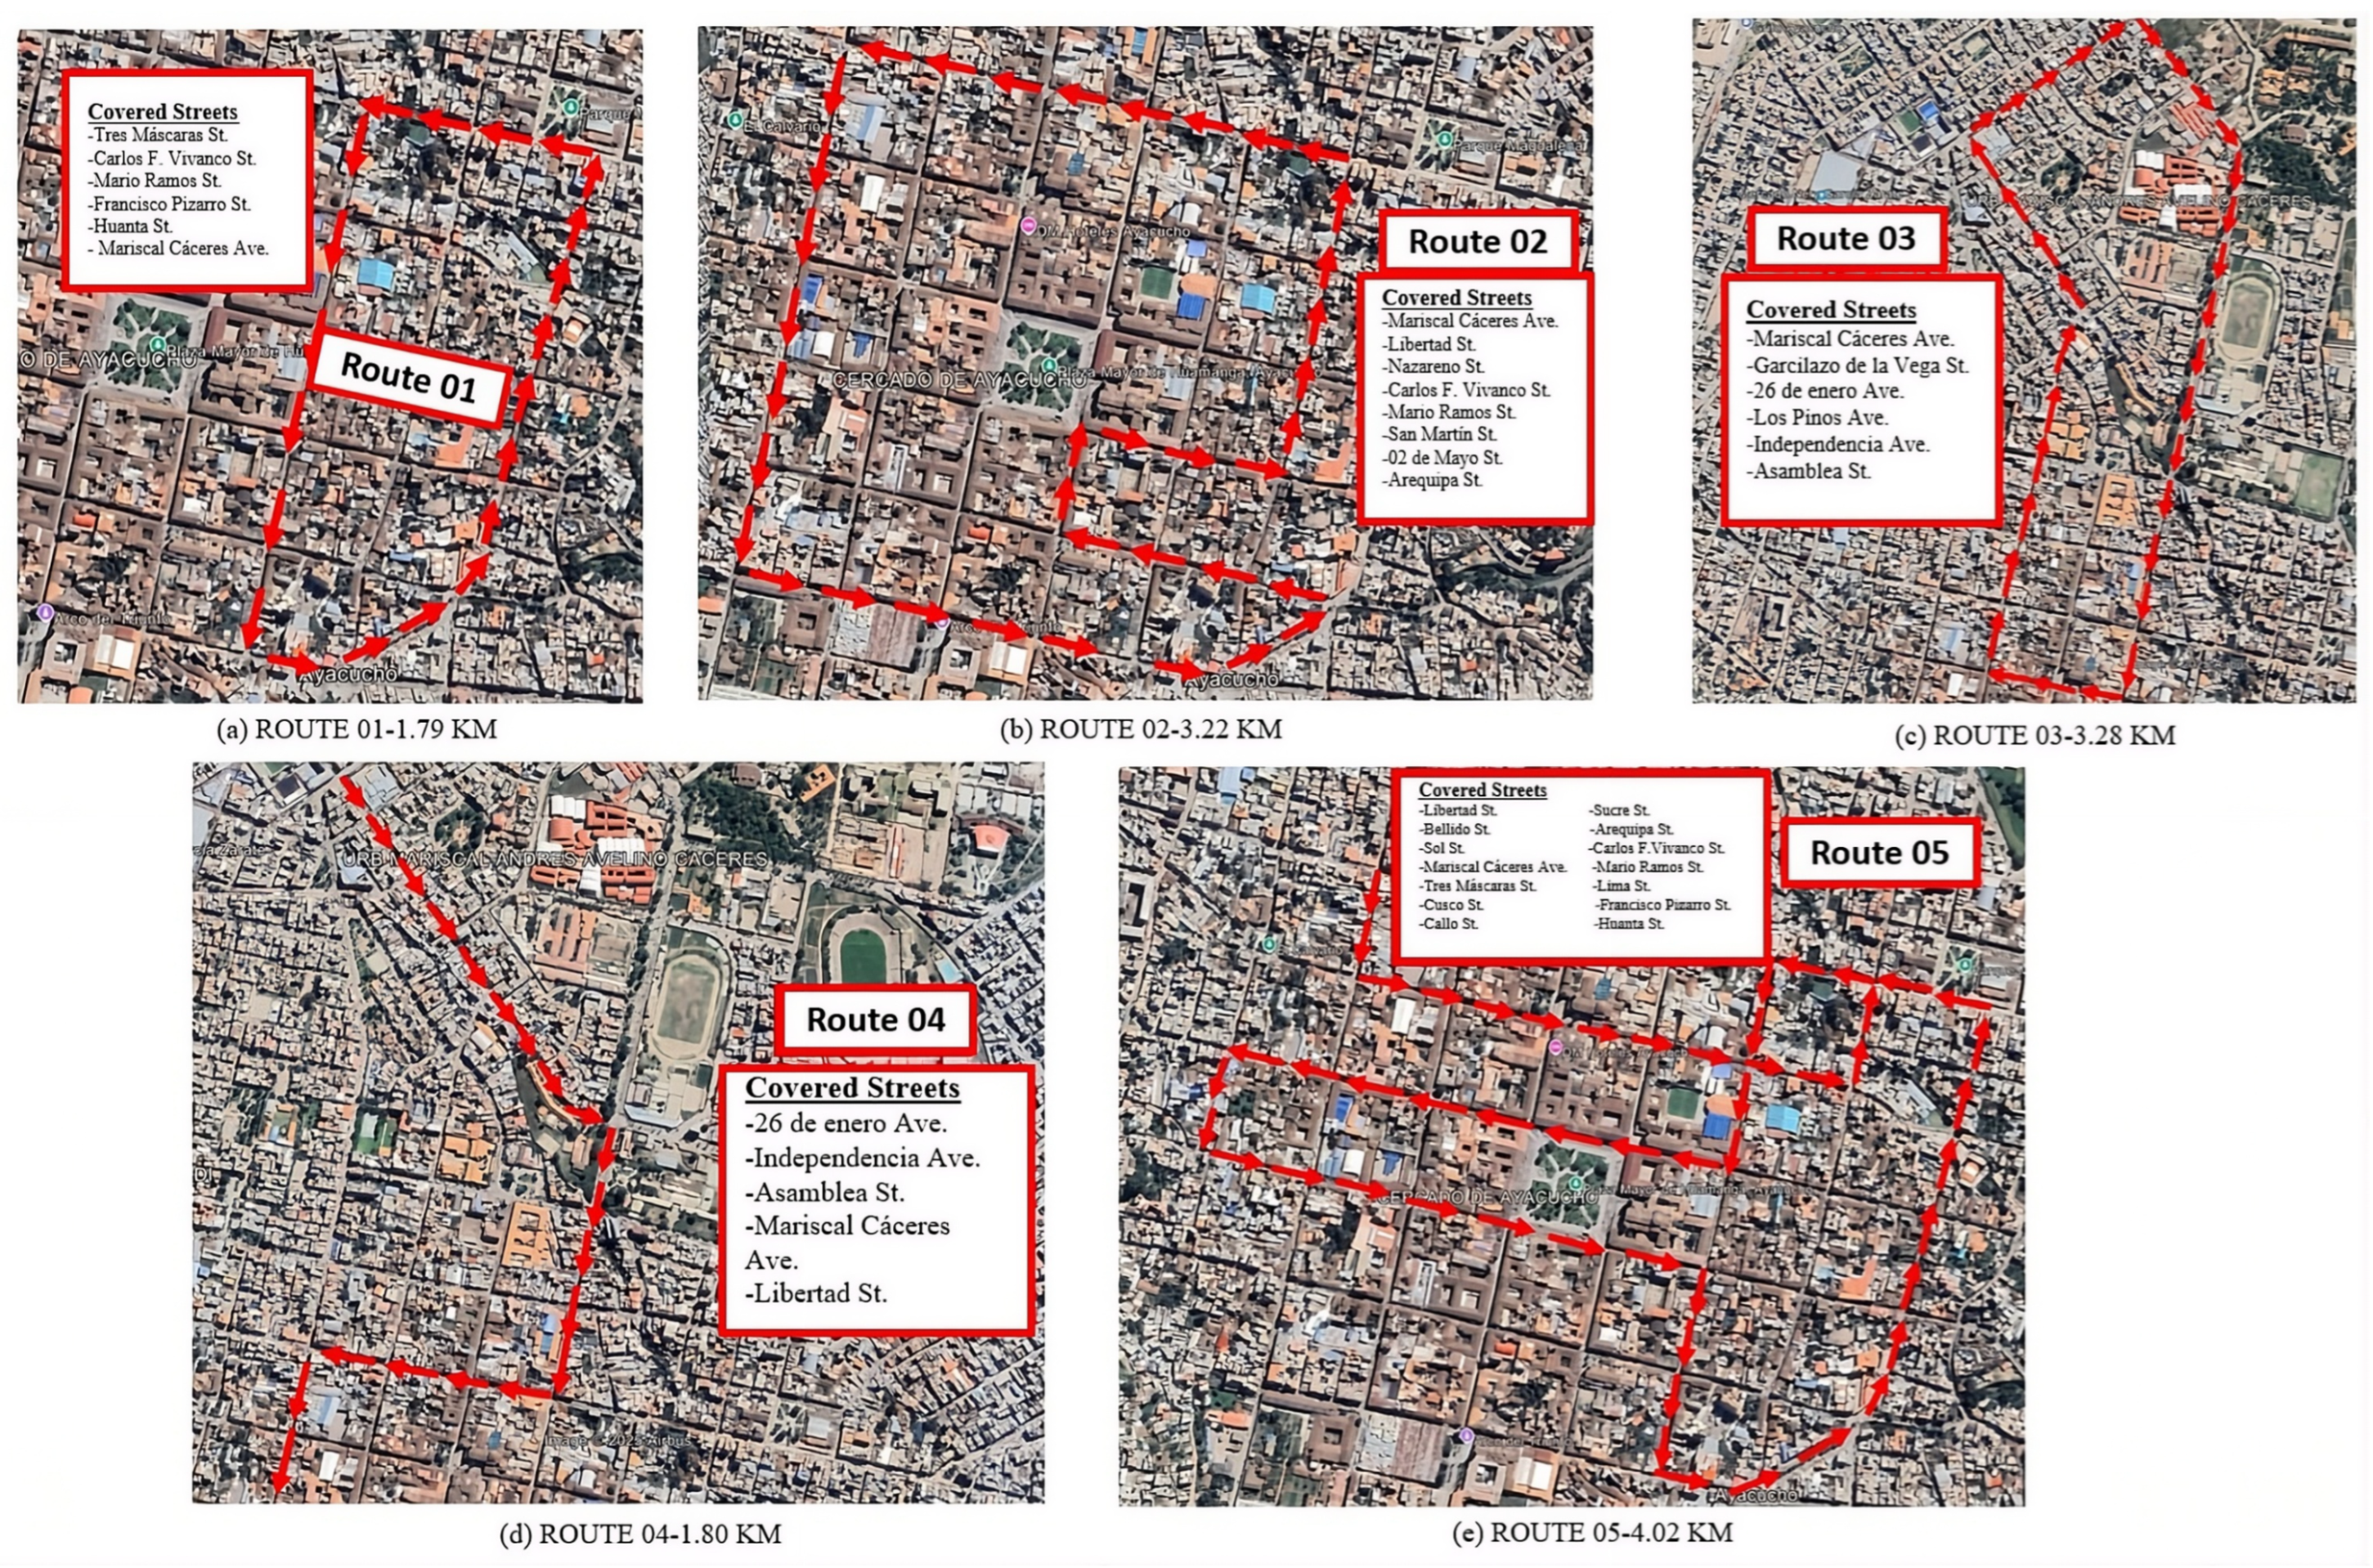
The five validation circuits generated a total of 276,000 processed frames during 2 h 35 min. Figure 10 presents the geographic layout of the five validation circuits across the Historic Center of Ayacucho, with covered streets indicated for each route. Table 9 details the results by circuit.
Figure 10.
(New) Geographic layout of the five vehicular validation circuits in the Historic Center of Ayacucho: (a) Route 01—historic center core (1.79 km); (b) Route 02—main avenues (3.22 km); (c) Route 03—school zones (3.28 km); (d) Route 04—nocturnal route (1.80 km); (e) Route 05—peripheral zones (4.02 km). Red lines indicate the driven path. Street names: Jr. = Jirón (Street); Av. = Avenida (Avenue).
Table 9.
Validation results in vehicular simulations in the Historic Center of Ayacucho.
3.8. ADAS-TSR System Interface
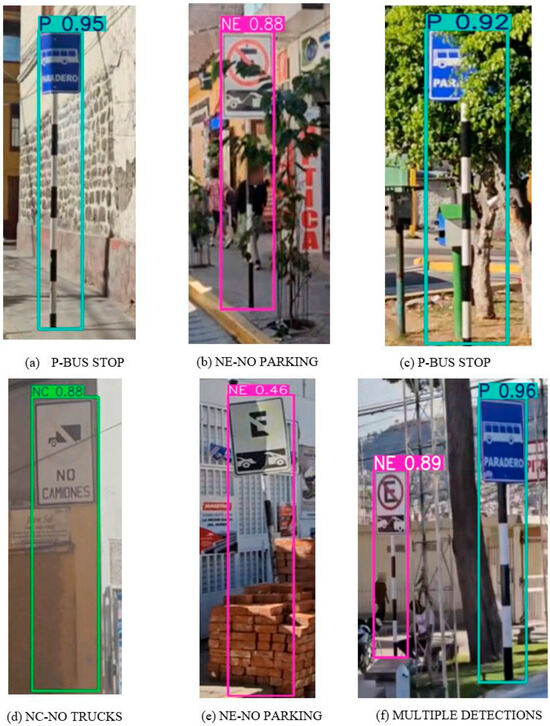
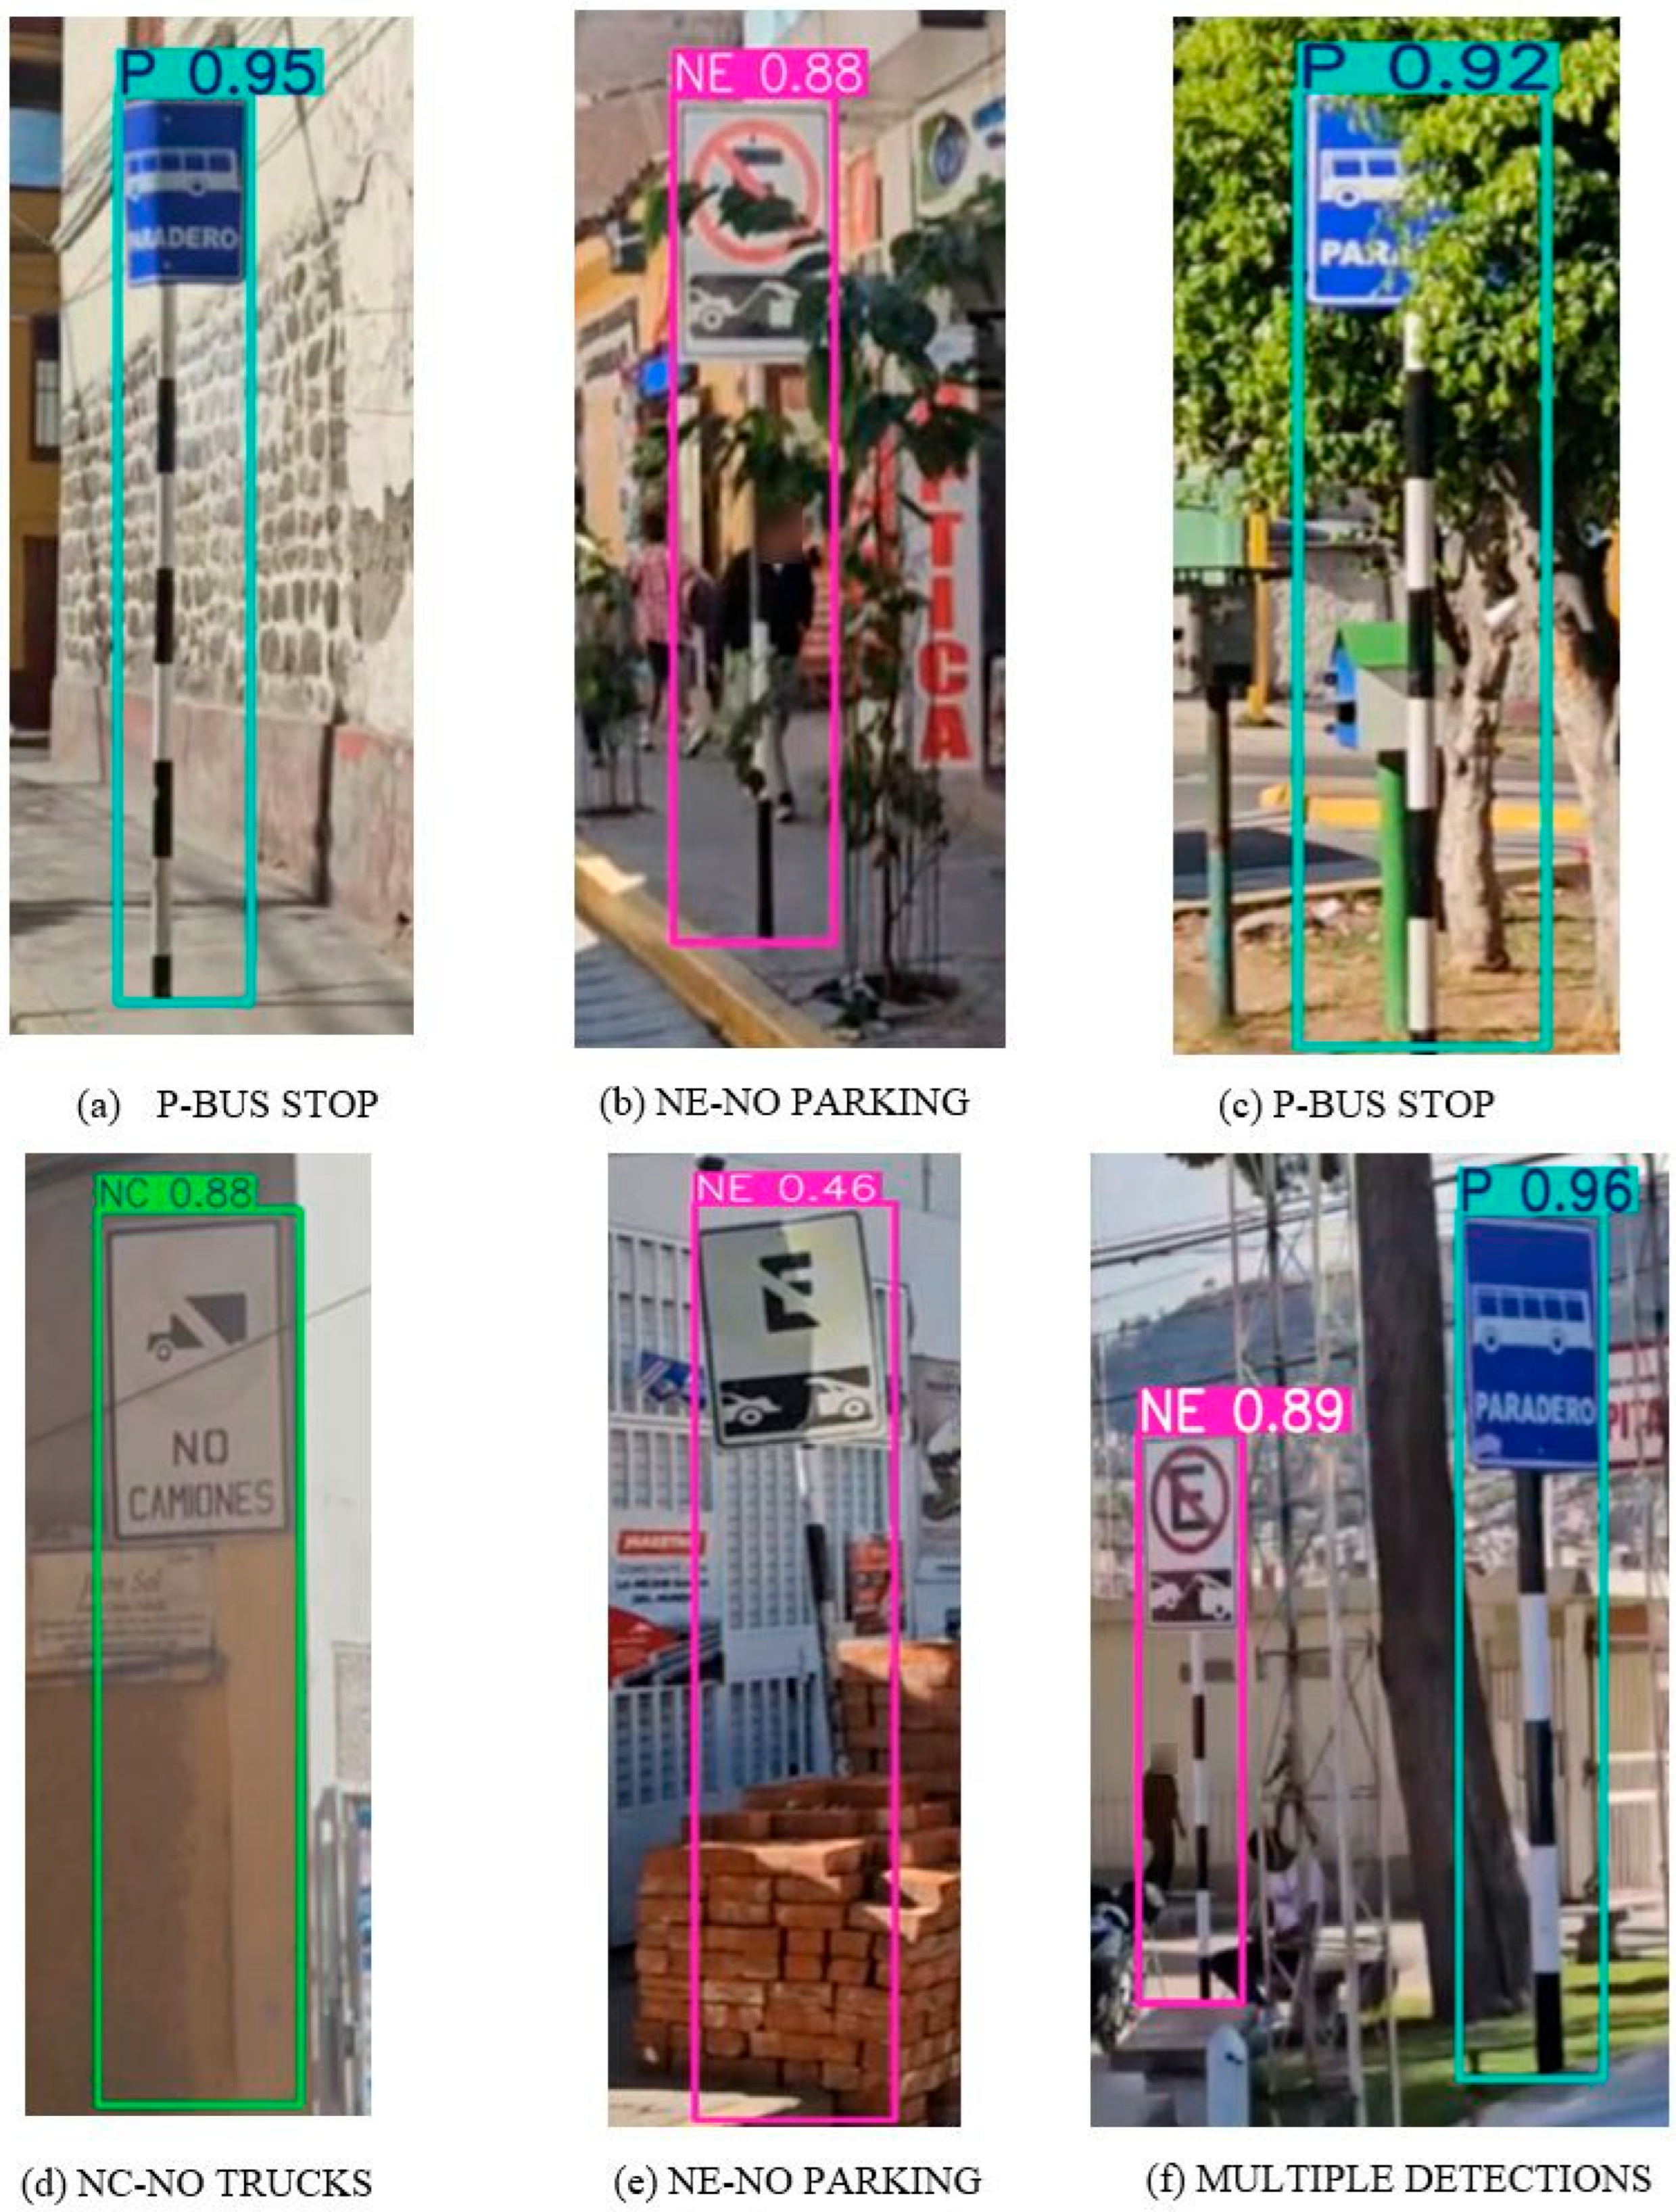
Figure 11 presents representative detection results encountered under challenging real-world conditions during vehicular validation.
Figure 11.
(New) Representative detection results under challenging real-world conditions in the Historic Center of Ayacucho: (a) Bus Stop (P) sign at close range with 0.95 confidence; (b) No Parking (NE) sign partially occluded by vegetation with 0.88 confidence; (c) Bus Stop sign at medium distance with 0.92 confidence; (d) No Truck Entry (NC) sign on deteriorated surface with 0.88 confidence; (e) low-confidence detection of partially occluded No Parking sign (0.46); (f) simultaneous multi-class detection of Bus Stop (0.96) and No Parking (0.89) signs in a single frame.
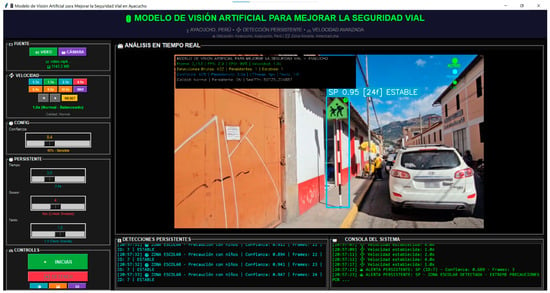
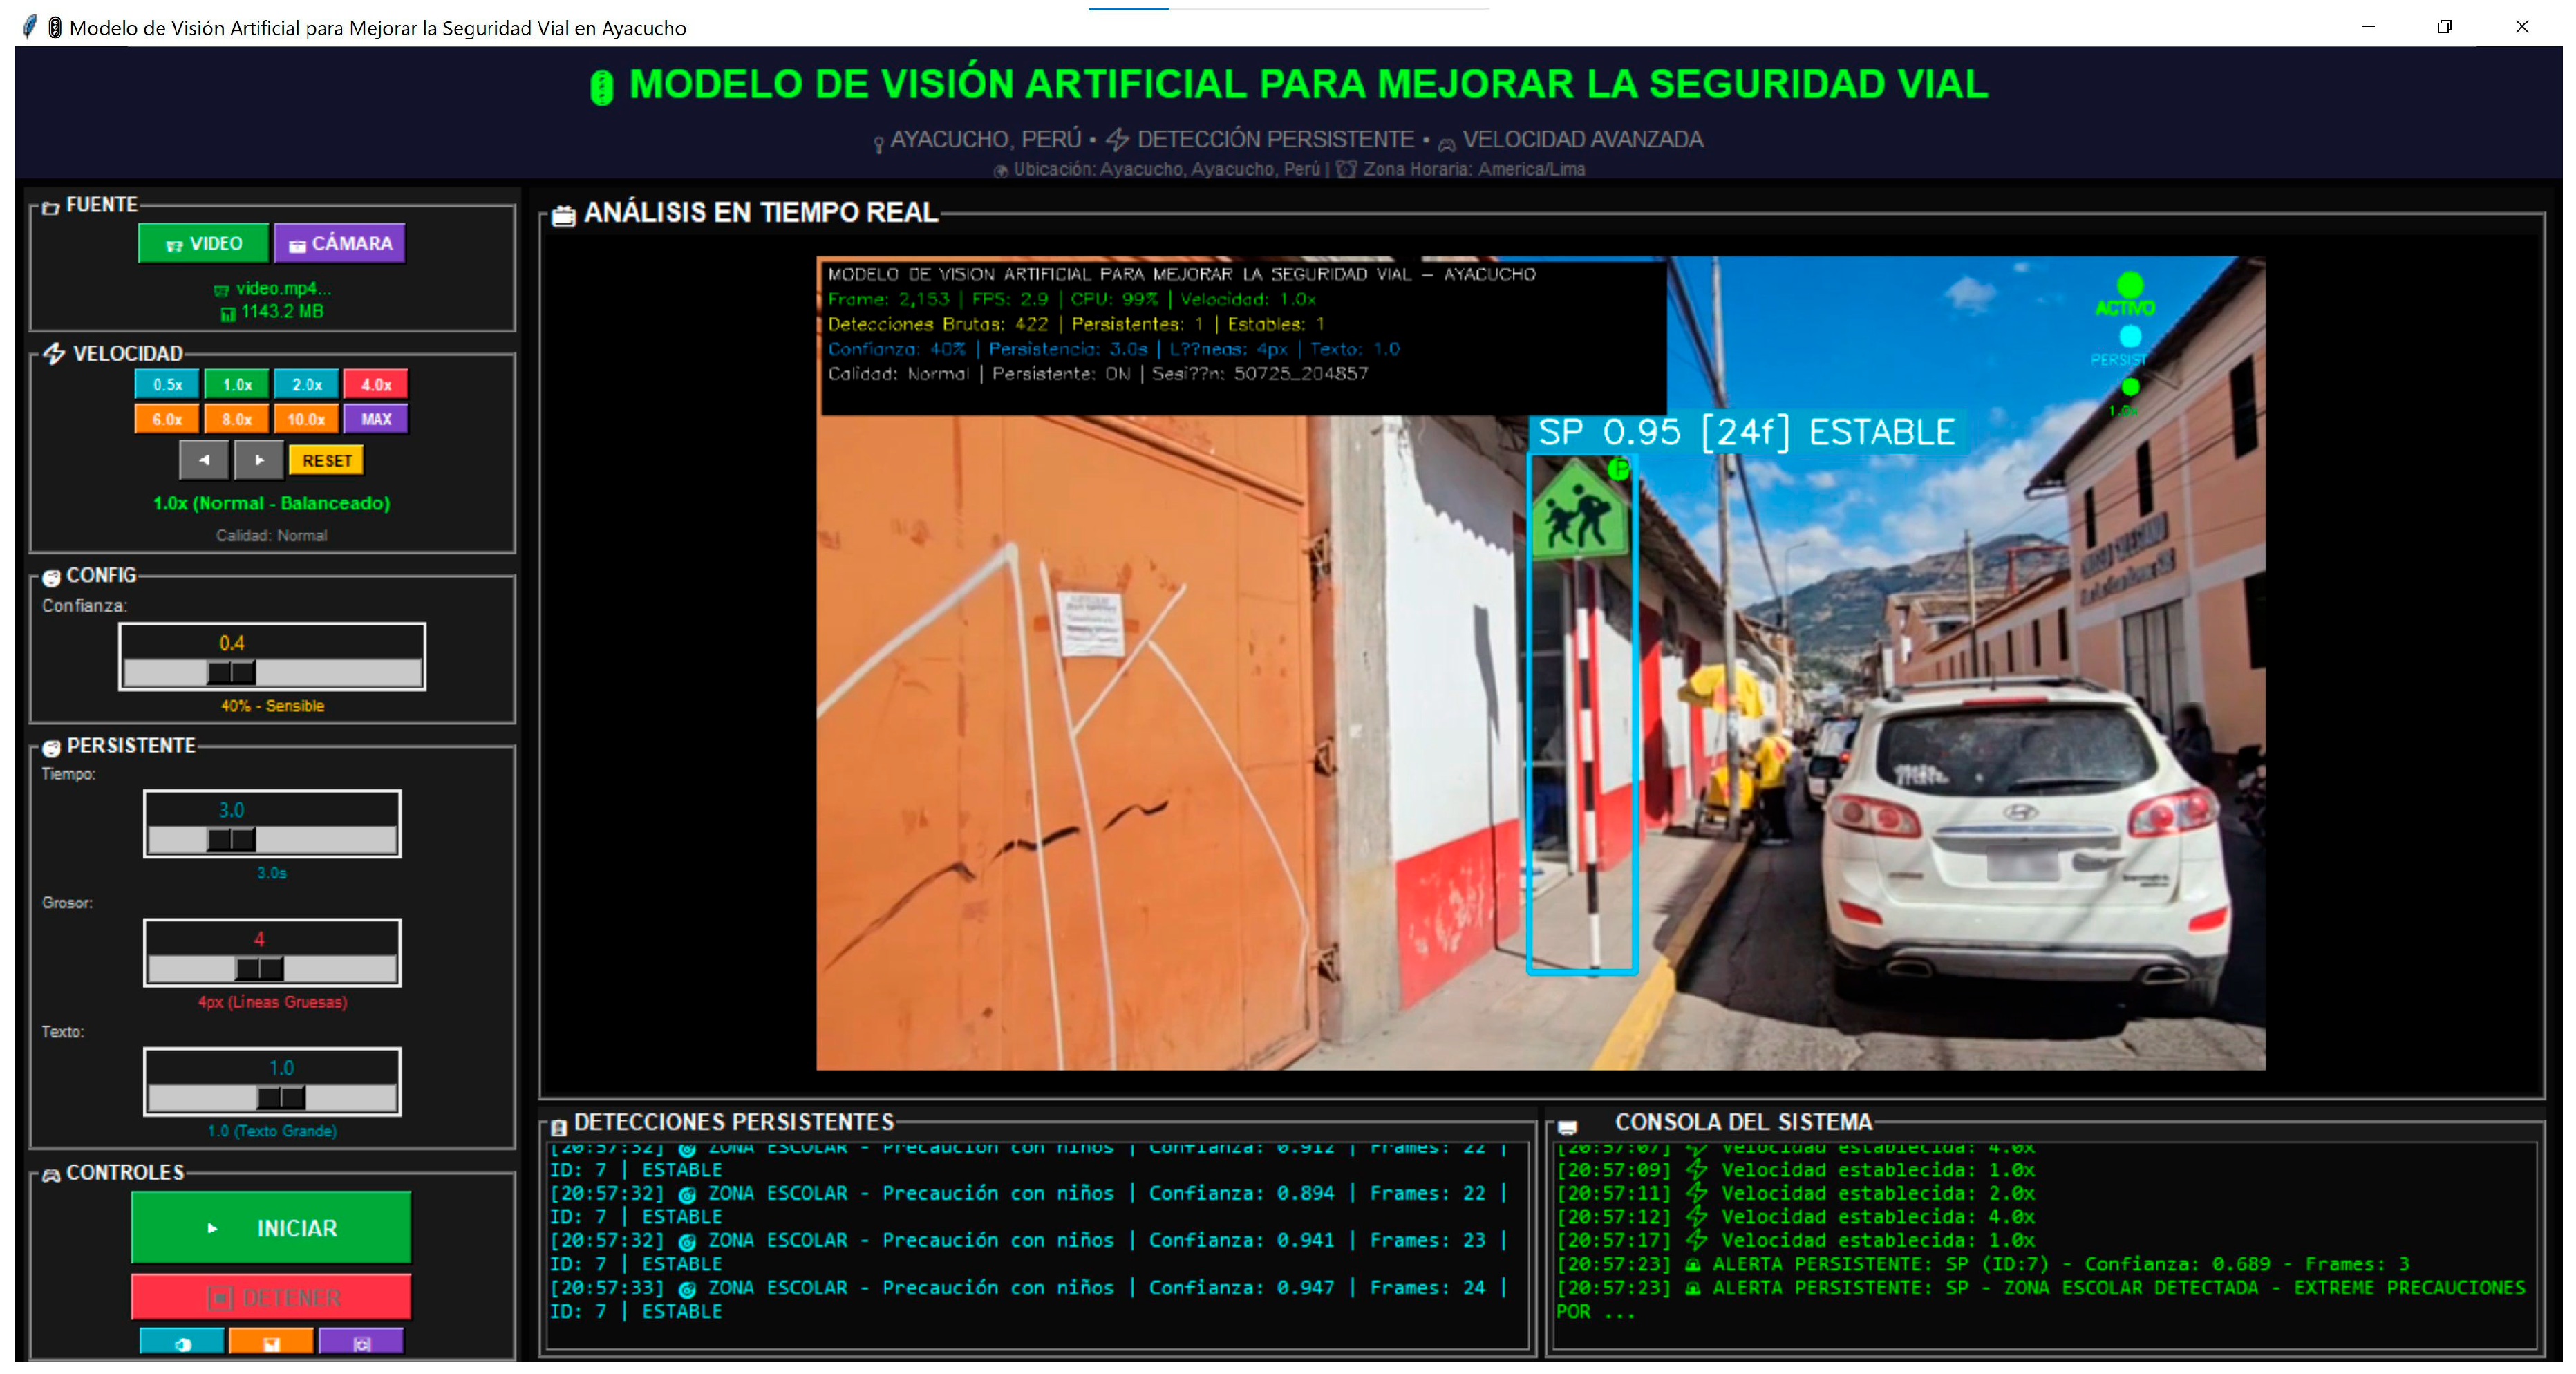
Figure 12 presents the graphical interface of the ADAS-TSR system during vehicular validation.
Figure 12.
ADAS-TSR system interface showing real-time detection with School Zone (SP) sign at 0.95 confidence in STABLE state, with speed controls, temporal filtering parameters, and voice alert console. Interface labels: Velocidad = Speed; Umbral = Threshold; Ventana = Window; Consola de Alertas = Alert Console; Señal detectada = Sign detected; Zona escolar = School zone; Reduza la velocidad = Reduce speed.
4. Discussion
The multi-model benchmark reveals several significant findings with implications for both the TSR research community and practical ADAS deployment.
4.1. Architecture Comparison: CNN vs. Transformer
The comprehensive comparison across five detection architectures demonstrates that CNN-based models consistently outperform RT-DETR-l in mAP@0.5:0.95 (0.987–0.993 vs. 0.907) while achieving comparable mAP@0.5 performance (0.993–0.994 vs. 0.993). This finding suggests that for closed-set TSR tasks with well-defined object categories, the inductive biases of CNNs, specifically translation equivariance and local feature extraction, remain advantageous over the global attention mechanisms of transformers. The transformer model’s lower mAP@0.5:0.95 indicates less precise bounding box regression at higher IoU thresholds, a limitation attributable to the discrete object query mechanism in DETR-style architectures.
Regarding open-vocabulary detectors such as YOLO-World [22] and Grounding DINO [23], these architectures are designed for open-set scenarios where object categories are specified through natural language prompts at inference time. For our closed-set application with 14 fixed sign classes defined by Peruvian MTC regulations, supervised fine-tuning on the target classes is the methodologically appropriate approach, as it enables the model to learn domain-specific features (sign deterioration patterns, Andean lighting conditions, colonial architecture backgrounds) that language-conditioned zero-shot detection cannot capture.
4.2. Efficiency and Deployment Implications
Our results challenge the conventional assumption that larger models yield substantially better detection. YOLO11n achieved mAP@0.5 of 0.993 with merely 2.6 M parameters with no loss in detection quality, representing a 10× reduction from YOLOv8m (25.9 M parameters). YOLO26n achieved the highest mAP@0.5 (0.994) with only 2.4 M parameters. These findings have direct implications for edge deployment in resource-constrained ADAS hardware in developing countries, where model size directly impacts cost, power consumption, and deployment feasibility.
The computational efficiency analysis revealed that all CNN models achieved comparable FPS (≈35) on the RTX 5080, with the parameter count primarily affecting training time rather than inference speed at this hardware level. However, the parameter efficiency ratio (Params/mAP) varied dramatically at 2.4 for YOLO26n versus 35.3 for RT-DETR-l, indicating that YOLO26n achieves equivalent detection quality with 14.7× better parameter utilization.
4.3. Prediction Reliability and Uncertainty
The confidence distribution analysis revealed a notable evolution in prediction reliability across model generations. The modern architectures (YOLO11n, YOLO26s) exhibited mean confidence of 0.924–0.926 with 93–97% of detections above the 0.9 threshold, compared to YOLOv8m’s 0.824 mean confidence with only 85% above 0.9. This improvement in calibration quality is particularly important for safety-critical ADAS applications, where low-confidence detections could trigger false alerts or suppress valid warnings.
4.4. Detection Equity Across Sign Classes
The fairness analysis confirmed that all models maintained highly equitable detection across the 14 sign classes, with all Gini coefficients below 0.003. The consistently lower performance on the Speed Control (CV) category across all architectures is attributed to its having the smallest dataset representation (89 training instances) rather than to architectural limitations, as evidenced by the class achieving mAP@0.5 > 0.961 even in the worst-performing model (RT-DETR-l). This finding validates the dataset quality and suggests that targeted data augmentation for underrepresented classes could further improve equity.
4.5. Contextual Contributions
Comparatively, the obtained metrics surpass several previous works utilizing standardized international datasets. Qiu et al. [14] reported mAP@0.5 improvements starting from baselines below 85%, while Han et al. [17] achieved improvements on GTSDB and TT100K. Zhang et al. [18] achieved mAP of 96.8% with transformer architectures, inferior to the 99.4% obtained in this research. These results confirm that constructing an original dataset specific to the local context produces outstanding metrics, empirically validating the findings of Linardi et al. [29].
This work complements our previous research on intelligent traffic light optimization in the Historic Center of Ayacucho [5], contributing to a comprehensive road safety ecosystem based on artificial intelligence for Andean historic centers.
4.6. Dataset Adequacy and Scalability Analysis
A critical question for any localized dataset is whether its size (2250 images, 2450 instances across 14 classes) is sufficient for robust model training. Three complementary lines of evidence address this concern.
Cross-architecture consistency: If the dataset were insufficient, architecturally diverse models would exhibit divergent performance due to varying data efficiency characteristics. Instead, the five architectures, spanning the CNN nano (2.4 M parameters), CNN medium (25.9 M), and transformer (32.0 M) paradigms, all converged to mAP@0.5 within the narrow band of 0.993–0.994. Per-class analysis revealed that 10 out of 14 sign classes achieved identical AP@0.5 across all five models (), with the remaining four classes exhibiting cross-model standard deviations below 0.007. This architecture-independent convergence provides strong indirect evidence that the dataset saturates the feature space for the 14-class TSR task.
Instance-per-class ratio comparison: The dataset provides an average of 175 instances per class (range: 89–412), which compares favorably with established TSR benchmarks. GTSDB [42] contains approximately 900 images with 43 classes (≈21 instances/class for detection). Linardi et al. [29] used subsets of GTSRB for evaluation. Zakaria et al. [30] expanded LISA from 47 to 55 classes with comparable per-class representation. The instance density of our dataset (175 instances/class) exceeds these benchmarks, providing denser per-class coverage for the closed-set 14-class problem. Furthermore, all classes in the dataset contain sufficient representation for both training (≥67 instances) and validation (≥17 instances) partitions.
Training saturation evidence: Our convergence analysis (Figure 7) demonstrated that all CNN models reached 99% of their final mAP@0.5 within 6–13 epochs and either activated early stopping or exhibited minimal improvement over the remaining 100+ epochs. YOLO26n triggered early stopping at epoch 140 after 50 epochs without improvement, while the other CNN models showed plateau behavior from approximately epoch 80. This saturation pattern indicates that additional training epochs could not extract further discriminative information from the dataset, suggesting that adequate coverage of the feature space for the target domain.
Nevertheless, systematic learning curve analysis with incremental dataset fractions (25%, 50%, 75%, 100%) and expanded dataset collection to include additional Andean cities (Cusco, Huancavelica, Puno) would strengthen these conclusions, and constitutes planned future work.
Regarding the high mAP@0.5 values (0.993–0.994), these results warrant examination of potential overfitting or dataset bias. Several factors argue against overfitting as the primary explanation. First, the metrics were computed on the held-out validation set (20% of data, 449 images), which was never used during training. Second, the convergence curves showed no signs of validation loss divergence from training loss, a hallmark of overfitting. Third, the high performance was consistent across five architecturally diverse models, including the 2.4 M-parameter YOLO26n. If overfitting were responsible, smaller models with lower capacity would be expected to show comparatively lower performance. Instead, the high metrics are attributable to the well-defined nature of the 14-class TSR task. Peruvian traffic signs follow standardized MTC templates with distinctive shapes, colors, and symbols, presenting lower classification difficulty than general object detection benchmarks. Similar performance levels (mAP@0.5 > 0.98) have been reported for localized TSR datasets in the literature [28,42]. Nevertheless, the absence of an independent test set collected at different times or locations remains a limitation that could introduce optimistic bias.
5. Limitations
While ADAS-TSR demonstrates strong detection performance across multiple architectures, several limitations should be acknowledged to contextualize the results and guide future research.
Geographic and contextual scope. The dataset was collected exclusively in the Historic Center of Ayacucho (2761 m a.s.l.), a single Andean city with specific colonial morphology, signage conditions, and atmospheric characteristics. Generalization to other Andean cities (Cusco, Huancavelica, Puno) or to coastal and jungle urban environments with different signage standards, vegetation interference, and climatic patterns has not been evaluated. Cross-domain validation across geographically diverse Peruvian cities is required before broader deployment claims can be made.
Dataset size and class balance. Although cross-architecture consistency analysis provides indirect evidence of dataset adequacy (Section 4.6), the dataset comprises 2250 images with 2450 instances distributed across 14 classes, with an imbalanced range from 89 (CV) to 412 (NE) instances per class. No systematic learning curve analysis with incremental dataset fractions was conducted. The minimum representation class (Speed Control, CV) exhibited the lowest performance across all architectures (AP@0.5 of 0.961–0.978), suggesting that targeted augmentation or additional data collection for underrepresented classes could further improve detection equity.
Single training run and statistical variance. All model training experiments were conducted as single runs without repeated trials, cross-validation, or variance analysis. While the stochastic nature of deep learning training (random weight initialization, data shuffling, augmentation randomness) can produce variation between runs, the consistency across five architecturally diverse models, all converging to mAP@0.5 within the 0.993–0.994 range, provides indirect evidence of result stability. Nevertheless, formal multi-run experiments with confidence intervals would strengthen the statistical rigor of the reported metrics.
Temporal filtering vs. multi-object tracking. The rule-based temporal filtering system (Section 2.6) employs heuristic spatial association (70-pixel tolerance) and confidence decay mechanisms rather than established multi-object tracking algorithms such as SORT [49], DeepSORT, or ByteTrack. This approach cannot handle identity switches when multiple signs of the same class appear simultaneously; in addition, the fixed positional tolerance may prove insufficient at varying vehicle speeds. Integration of learning-based tracking algorithms would improve temporal consistency, particularly in dense signage environments.
Hardware and real-time deployment. All experiments were conducted on an NVIDIA RTX 5080 desktop GPU (16 GB VRAM). Inference performance on edge devices relevant to vehicular deployment, such as NVIDIA Jetson Nano, Jetson Orin, or Raspberry Pi with neural accelerators, has not been benchmarked. The transition from desktop to embedded platforms may reveal latency bottlenecks that are not captured in the current evaluation, particularly for the larger models (YOLOv8m, RT-DETR-l).
Validation methodology. System validation was conducted through recorded vehicular simulations rather than real-time in-vehicle testing with actual drivers. The 94.7% detection rate was measured under controlled replay conditions, and may not reflect performance under real driving conditions with variable vehicle speed, driver behavior, and environmental variability. No user experience evaluation (e.g., cognitive load assessment, alert comprehension surveys, or System Usability Scale) was performed with actual drivers.
Environmental robustness. Although the dataset includes both daytime and nighttime captures, systematic evaluation under extreme conditions such as heavy rain, fog, direct sun glare, or severely deteriorated signage was not conducted. Adversarial robustness testing against input perturbations was not performed, which is a consideration for safety-critical ADAS deployment.
Signage coverage. The 14-class taxonomy covers the most prevalent vertical signs in the Historic Center of Ayacucho but does not encompass the complete Peruvian MTC signage catalog, which includes over 100 regulatory, warning, and informational sign types. Extension to horizontal signage (road markings, lane indicators) and temporary construction signs was not addressed.
6. Conclusions and Future Work
This research has presented ADAS-TSR, a deep learning-based advanced driver assistance system for vertical traffic sign recognition with differentiated voice alerts, that is specifically designed for the colonial morphology and high-altitude conditions of the Historic Center of Ayacucho, Peru (2761 m a.s.l.). The principal contributions and findings are summarized below.
An original dataset comprising 2250 images with 2450 annotated instances across 14 sign classes was constructed according to the Peruvian MTC Traffic Control Device Manual. The dataset was captured under real operational conditions, including deteriorated, partially occluded, and vehicle impact-deformed signage. This constitutes the first vertical signage dataset specific to the Peruvian Andean context, addressing the critical gap identified by Linardi et al. [29] regarding the severe performance degradation of models trained on international datasets when applied to local contexts.
A comprehensive multi-model benchmark comparing five detection architectures—four CNN-based (YOLOv8m, YOLO11n, YOLO26n, YOLO26s) and one Transformer-based (RT-DETR-l)—demonstrated that modern lightweight CNN models achieve equivalent or superior performance to heavier architectures. YOLO26s achieved the best overall mAP@0.5:0.95 of 0.989 with only 9.5 M parameters, while YOLO26n attained the highest mAP@0.5 of 0.994 with merely 2.4 M parameters, representing a 10.8× reduction from YOLOv8m (25.9 M) with no loss in detection quality. This finding has direct implications for edge deployment in resource-constrained ADAS hardware in developing countries, where model size directly impacts cost, power consumption, and deployment feasibility.
The cross-paradigm analysis revealed that CNN-based models maintain a significant advantage over the transformer-based RT-DETR-l in bounding box precision (mAP@0.5:0.95 of 0.987–0.993 vs. 0.907) while achieving 50% higher inference throughput (35 FPS vs. 23 FPS). This 8-percentage-point gap, established early in training and persistent throughout, suggests that the inductive biases of CNNs remain advantageous over global attention mechanisms for closed-set TSR tasks with well-defined object categories.
Uncertainty analysis demonstrated that modern architectures (YOLO11n, YOLO26s) exhibit significantly improved prediction calibration, with 93–97% of detections above the 0.9 confidence threshold compared to 85% for YOLOv8m. Cross-class fairness analysis confirmed equitable detection across all 14 sign classes, with Gini coefficients below 0.002 for CNN models. Finally, cross-architecture consistency analysis revealed that 10 out of 14 classes achieved identical AP@0.5 across all five architectures (), providing indirect evidence of dataset adequacy.
The rule-based temporal filtering system reduced redundant voice alerts by 73% while maintaining a detection coverage of 94.7% across 14.11 km of validation circuits spanning five representative urban scenarios.
Future Work
Building upon the limitations identified in Section 5 and the findings of this study, several directions for future research are planned.
Dataset expansion and cross-domain validation. Systematic learning curve analysis with incremental dataset fractions (25%, 50%, 75%, 100%) will be conducted to quantify the relationship between dataset size and model performance. The dataset will be expanded to include signage from additional Andean cities (Cusco, Huancavelica, Puno) in order to evaluate geographic generalization, and will also be extended to encompass horizontal signage (road markings, lane indicators) and temporary construction signs in order to progress towards comprehensive coverage of the Peruvian MTC signage catalog.
Multi-object tracking integration. The current rule-based temporal filtering system will be replaced with established multi-object tracking algorithms (DeepSORT, ByteTrack, or BoT-SORT) to enable robust identity association across frames, particularly in dense signage environments where multiple signs of the same class may appear simultaneously. This integration will also enable trajectory-based analysis for improved alert timing based on vehicle approach dynamics.
Edge deployment and embedded benchmarking. Model optimization through quantization (INT8, FP16), pruning, and knowledge distillation will be explored for deployment on edge computing platforms, including the NVIDIA Jetson Orin Nano, Jetson AGX Xavier, and Raspberry Pi 5 with Hailo-8 neural accelerators. Real-time inference benchmarks on these platforms will establish practical deployment constraints for vehicular ADAS applications.
User experience evaluation. In-vehicle real-time testing with actual drivers will be conducted to assess detection reliability under real driving conditions. User experience evaluation through the System Usability Scale (SUS), NASA-TLX cognitive load assessment, and alert comprehension surveys will guide iterative refinement of voice alert design, timing, and priority management.
Environmental robustness enhancement. Systematic evaluation under extreme conditions (heavy rain, fog, direct sun glare, severely deteriorated signage) will be performed. Data augmentation strategies including synthetic degradation, weather simulation, and domain randomization will be explored to improve model robustness. Adversarial robustness testing against input perturbations will be conducted to assess system reliability under potential edge cases relevant to safety-critical deployment.
Author Contributions
Conceptualization, D.O.T.-H. and E.L.-P.; methodology, D.O.T.-H., E.J.U.-D., Y.G.-G., and E.L.-P.; software, E.J.U.-D.; validation, D.O.T.-H., E.J.U.-D., H.L.-A., Y.G.-G., J.E.E.-C., W.E.M.-S., E.E.P.-F., and E.L.-P.; formal analysis, D.O.T.-H., E.J.U.-D., and Y.G.-G.; investigation, D.O.T.-H., E.J.U.-D., H.L.-A., and Y.G.-G.; resources, D.O.T.-H. and E.J.U.-D.; data curation, E.J.U.-D.; writing—original draft preparation, D.O.T.-H., E.J.U.-D., and Y.G.-G.; writing—review and editing, H.L.-A., J.E.E.-C., W.E.M.-S., E.E.P.-F., and E.L.-P.; visualization, E.J.U.-D.; supervision, E.L.-P.; project administration, E.L.-P. All authors have read and agreed to the published version of the manuscript.
Funding
This research received no external funding.
Institutional Review Board Statement
Not applicable.
Informed Consent Statement
Not applicable.
Data Availability Statement
The data presented in this study are available on request from the corresponding author due to privacy and ethical considerations. The dataset contains images and video frames captured in public urban spaces that include identifiable information such as vehicle license plates and pedestrian faces. Anonymization of this sensitive content is currently in progress, and the dataset may be made publicly available in a future release once privacy protection measures have been fully implemented.
Conflicts of Interest
The authors declare no conflicts of interest.
References
- World Health Organization. Global Status Report on Road Safety 2023; WHO: Geneva, Switzerland, 2023. [Google Scholar]
- World Health Organization. Leaders Make New Road Safety Commitments, Endorse New Declaration to Reduce Road Deaths. In Proceedings of the 4th Global Ministerial Conference on Road Safety, Marrakech, Morocco, 18–20 February 2025; Available online: https://www.who.int/news/item/19-02-2025-global-leaders-make-new-road-safety-commitments--endorse-new-declaration-on-action-to-reduce-road-deaths (accessed on 1 February 2026).
- Observatorio Nacional de Seguridad Vial (ONSV). Estadísticas de Siniestralidad Vial 2023; Ministerio de Transportes y Comunicaciones: Lima, Peru, 2024. Available online: https://www.onsv.gob.pe/ (accessed on 15 January 2026).
- Ministry of Transport and Communications of Peru. Traffic Accident Statistics 2023; MTC: Lima, Peru, 2024.
- Tenorio-Huarancca, D.O.; Lizarbe-Alarcon, H.; Ayala-Bizarro, R.G.; Tenorio-Palomino, M.G.; Bravo-Anaya, R.G.; Ircanaupa-Huamani, A.S.; Leon-Palacios, E.; Bellido-Aedo, V. Intelligent Traffic Light Optimization System Using Convolutional Neural Networks for Historic City Centers in Complex Scenarios. Math. Model. Eng. Probl. 2025, 12, 3247–3264. [Google Scholar] [CrossRef] [Scilit]
- Ayachi, R.; Said, Y.; Afif, M.; Alshammari, A.; Hleili, M.; Abdelali, A.B. Assessing YOLO Models for Real-Time Object Detection in Urban Environments for Advanced Driver-Assistance Systems (ADAS). Alex. Eng. J. 2025, 123, 530–549. [Google Scholar] [CrossRef] [Scilit]
- Chen, H.; Ali, M.A.; Abdulghafor, R. Computational Methods for Automatic Traffic Signs Recognition in Autonomous Driving on Road: A Systematic Review. Results Eng. 2024, 24, 103553. [Google Scholar] [CrossRef] [Scilit]
- LeCun, Y.; Bengio, Y.; Hinton, G. Deep Learning. Nature 2015, 521, 436–444. [Google Scholar] [CrossRef] [Scilit]
- Arcos-García, A.; Álvarez-García, J.A.; Soria-Morillo, L.M. Evaluation of Deep Neural Networks for Traffic Sign Detection Systems. Neurocomputing 2018, 316, 332–344. [Google Scholar] [CrossRef] [Scilit]
- Ren, S.; He, K.; Girshick, R.; Sun, J. Faster R-CNN: Towards Real-Time Object Detection with Region Proposal Networks. Adv. Neural Inf. Process. Syst. 2015, 28, 91–99. [Google Scholar] [CrossRef] [Scilit]
- Liu, W.; Anguelov, D.; Erhan, D.; Szegedy, C.; Reed, S.; Fu, C.Y.; Berg, A.C. SSD: Single Shot MultiBox Detector. In European Conference on Computer Vision; Springer: Cham, Switzerland, 2016; pp. 21–37. [Google Scholar]
- Flores-Calero, M.; Astudillo, C.A.; Guevara, D.; Mazo, J.; Lita, B.S.; de la Cruz, D.; Armingol Moreno, J.M. Traffic Sign Detection and Recognition Using YOLO Object Detection Algorithm: A Systematic Review. Mathematics 2024, 12, 297. [Google Scholar] [CrossRef] [Scilit]
- Dewi, C.; Chen, R.C.; Liu, Y.T.; Jiang, X.; Hartomo, K.D. Yolo V4 for Advanced Traffic Sign Recognition with Synthetic Training Data Generated by Various GAN. IEEE Access 2022, 10, 97228–97242. [Google Scholar] [CrossRef] [Scilit]
- Qiu, J.; Zhang, W.; Xu, S.; Zhou, H. DP-YOLO: A Lightweight Traffic Sign Detection Model for Small Object Detection. Digit. Signal Process. 2025, 165, 105311. [Google Scholar] [CrossRef] [Scilit]
- Zhu, Z.; Liang, D.; Zhang, S.; Huang, X.; Li, B.; Hu, S. Traffic-Sign Detection and Classification in the Wild. In Proceedings of the IEEE Conference on Computer Vision and Pattern Recognition; IEEE: Las Vegas, NV, USA, 2016; pp. 2110–2118. [Google Scholar]
- Niu, M.; Chen, Y.; Li, J.; Qiu, X.; Cai, W. YOLOv8s-DDA: An Improved Small Traffic Sign Detection Algorithm Based on YOLOv8s. Electronics 2024, 13, 3764. [Google Scholar] [CrossRef] [Scilit]
- Han, Y.; Wang, F.; Wang, W.; Zhang, X.; Li, X. EDN-YOLO: Multi-Scale Traffic Sign Detection Method in Complex Scenes. Digit. Signal Process. 2024, 153, 104615. [Google Scholar] [CrossRef] [Scilit]
- Zhang, L.; Yang, K.; Han, Y.; Li, J.; Wei, W.; Tan, H.; Yu, P.; Zhang, K.; Yang, X. TSD-DETR: A Lightweight Real-Time Detection Transformer of Traffic Sign Detection. Eng. Appl. Artif. Intell. 2025, 139, 109536. [Google Scholar] [CrossRef] [Scilit]
- Zhao, Y.; Lv, W.; Xu, S.; Wei, J.; Wang, G.; Dang, Q.; Liu, Y.; Chen, J. DETRs Beat YOLOs on Real-Time Object Detection. In Proceedings of the IEEE/CVF Conference on Computer Vision and Pattern Recognition; IEEE: Vancouver, BC, Canada, 2024; pp. 16965–16974. [Google Scholar]
- Jocher, G.; Chaurasia, A.; Qiu, J. Ultralytics YOLOv8. 2023. Available online: https://github.com/ultralytics/ultralytics (accessed on 15 November 2025).
- Ultralytics. YOLO26: Next-Generation Real-Time Object Detection. 2026. Available online: https://docs.ultralytics.com/models/yolo26/ (accessed on 20 January 2026).
- Cheng, T.; Song, L.; Ge, Y.; Liu, W.; Wang, X.; Shan, Y. YOLO-World: Real-Time Open-Vocabulary Object Detection. In Proceedings of the IEEE/CVF Conference on Computer Vision and Pattern Recognition; IEEE: Seattle, WA, USA, 2024; pp. 16901–16911. [Google Scholar]
- Liu, S.; Zeng, Z.; Ren, T.; Li, F.; Zhang, H.; Yang, J.; Li, C.; Yang, J.; Su, H.; Zhu, J.; et al. Grounding DINO: Marrying DINO with Grounded Pre-Training for Open-Set Object Detection. In European Conference on Computer Vision; Springer: Cham, Switzerland, 2024; pp. 38–55. [Google Scholar]
- He, Y.; Guo, M.; Zhang, Y.; Xia, J.; Geng, X.; Zou, T.; Ding, R. NTS-YOLO: A Nocturnal Traffic Sign Detection Method Based on Improved YOLOv5. Appl. Sci. 2025, 15, 1578. [Google Scholar] [CrossRef] [Scilit]
- Wang, P.; Mohamed, R.; Mustapha, N.; Manshor, N. YOLO-AEF: Traffic Sign Detection via Adaptive Enhancement and Fusion. Neurocomputing 2025, 655, 131430. [Google Scholar] [CrossRef] [Scilit]
- Choudhary, P.; Dey, S. FAIERDet: Fuzzy-Based Adaptive Image Enhancement for Real-Time Traffic Sign Detection. Expert Syst. Appl. 2026, 295, 128795. [Google Scholar] [CrossRef] [Scilit]
- Ji, B.; Xu, J.; Liu, Y.; Fan, P.; Wang, M. Improved YOLOv8 for Small Traffic Sign Detection Under Complex Conditions. Franklin Open 2024, 8, 100167. [Google Scholar] [CrossRef] [Scilit]
- Zhang, J.; Zou, X.; Kuang, L.D.; Wang, J.; Sherratt, R.S.; Yu, X. CCTSDB 2021: A More Comprehensive Traffic Sign Detection Benchmark. Hum.-Centric Comput. Inf. Sci. 2022, 12, 23. [Google Scholar]
- Linardi, R.; Soo, N.; Nabua, A.M.; Adhi, C.G.S.; Engel, V.J.L. Traffic Sign Detection Using YOLO: Evaluating Failures on Localized Data. Procedia Comput. Sci. 2025, 269, 1494–1501. [Google Scholar] [CrossRef] [Scilit]
- Zakaria, M.; Getahun, T.; Karimoddini, A. Traffic Sign Dataset for Connected and Automated Vehicle Operations in Rural Areas. Data Brief 2025, 63, 112280. [Google Scholar] [CrossRef] [Scilit]
- Yaamini, H.S.G.; Swathi, K.J.; Manohar, N.; Kumar, A.G. Lane and Traffic Sign Detection for Autonomous Vehicles on Indian Road Conditions. MethodsX 2025, 14, 103178. [Google Scholar] [CrossRef] [Scilit]
- Castañita Rodríguez, R.; Mendoza Carlos, C.; Vergara Villegas, O.O.; Cruz Sánchez, V.G.; Ochoa Domínguez, H.J. Mexican Traffic Sign Detection and Classification Using Deep Learning. Expert Syst. Appl. 2022, 202, 117247. [Google Scholar] [CrossRef] [Scilit]
- Xing, C.; Sun, H.; Yang, J. A Lightweight Traffic Sign Detection Model Based on Improved YOLOv8s for Edge Deployment. World Electr. Veh. J. 2025, 16, 478. [Google Scholar] [CrossRef] [Scilit]
- Sharma, V.K.; Dhiman, P.; Rout, R.K. Improved Traffic Sign Recognition Algorithm Based on YOLOv4-Tiny. J. Vis. Commun. Image Represent. 2023, 91, 103774. [Google Scholar] [CrossRef] [Scilit]
- Zhou, H.; Li, M.; Liu, Y.; Zhang, K. A Lightweight Traffic Sign Detection Method Based on Improved YOLOv8n. Electronics 2024, 13, 4521. [Google Scholar]
- Bhuvaneshwari, B.; Abbijeet, R.; Priyadharshini, C.S. Traffic Sign Classification and Voice Alert System Using CNN. Procedia Comput. Sci. 2025, 252, 10. [Google Scholar] [CrossRef] [Scilit]
- Asamoah, J.K.; Kyem, B.A.; Obeng-Amoako, N.D.; Aboah, A. SAAM-ReflectNet: Sign-Aware Attention-Based Multitasking Framework. Expert Syst. Appl. 2025, 286, 128003. [Google Scholar] [CrossRef] [Scilit]
- Trappey, A.J.C.; Shen, O.T.C. A Universal Traffic Sign Detection System Using Self-Training Neural Networks. Adv. Eng. Inform. 2024, 62, 102674. [Google Scholar] [CrossRef] [Scilit]
- Marino Ayuque, A. Traffic Sign Classification System Using Convolutional Neural Networks. Bachelor’s Thesis, Universidad Nacional de Ingeniería, Lima, Peru, 2016. [Google Scholar]
- Instituto Nacional de Estadística e Informática (INEI). Informe Técnico de Estadísticas de Criminalidad, Seguridad Ciudadana y Violencia, Tercer Trimestre 2024; INEI: Lima, Peru, 2024. [Google Scholar]
- Observatorio Nacional de Seguridad Vial (ONSV). Informe de Víctimas Fatales en Siniestros de Tránsito e Identificación de Puntos de Alta Siniestralidad en la Región Ayacucho, 2021–2024; MTC: Lima, Peru, 2024. [Google Scholar]
- Stallkamp, J.; Schlipsing, M.; Salmen, J.; Igel, C. Man vs. Computer: Benchmarking Machine Learning Algorithms for Traffic Sign Recognition. Neural Netw. 2012, 32, 323–332. [Google Scholar] [CrossRef] [Scilit]
- Ministry of Transport and Communications of Peru. Traffic Control Device Manual for Automobiles on Streets and Highways; MTC: Lima, Peru, 2016.
- Russell, B.C.; Torralba, A.; Murphy, K.P.; Freeman, W.T. LabelMe: A Database and Web-Based Tool for Image Annotation. Int. J. Comput. Vis. 2008, 77, 157–173. [Google Scholar] [CrossRef] [Scilit]
- CVAT.ai Contributors. Computer Vision Annotation Tool (CVAT). 2024. Available online: https://github.com/opencv/cvat (accessed on 10 January 2026).
- Tzutalin. LabelImg: Graphical Image Annotation Tool. 2015. Available online: https://github.com/tzutalin/labelImg (accessed on 10 January 2026).
- Tkachenko, M.; Malyuk, M.; Holmanyuk, A.; Liubimov, N. Label Studio: Data Labeling Software. 2020. Available online: https://github.com/HumanSignal/label-studio (accessed on 10 January 2026).
- Kirillov, A.; Mintun, E.; Ravi, N.; Mao, H.; Rolland, C.; Gustafson, L.; Xiao, T.; Whitehead, S.; Berg, A.C.; Lo, W.-Y.; et al. Segment Anything. In Proceedings of the IEEE/CVF ICCV; IEEE: Paris, France, 2023; pp. 4015–4026. [Google Scholar]
- Bewley, A.; Ge, Z.; Ott, L.; Ramos, F.; Upcroft, B. Simple Online and Realtime Tracking. In Proceedings of the IEEE International Conference on Image Processing (ICIP); IEEE: Phoenix, AZ, USA, 2016; pp. 3464–3468. [Google Scholar]
- Ratnam, N. pyttsx3: Text to Speech Library for Python. 2023. Available online: https://pypi.org/project/pyttsx3/ (accessed on 15 November 2025).

Disclaimer/Publisher’s Note: The statements, opinions and data contained in all publications are solely those of the individual author(s) and contributor(s) and not of MDPI and/or the editor(s). MDPI and/or the editor(s) disclaim responsibility for any injury to people or property resulting from any ideas, methods, instructions or products referred to in the content. |
© 2026 by the authors. Licensee MDPI, Basel, Switzerland. This article is an open access article distributed under the terms and conditions of the Creative Commons Attribution (CC BY) license.