


Abstract
Accurate quantification of the apparent chloride diffusion coefficient is pivotal for predicting the service life and assessing the durability of coastal infrastructure. While existing empirical models are informative, they fundamentally overlook the influence of reinforcement. This study establishes an integrated computational framework combining XGBoost machine learning with finite element (FE) analysis to elucidate chloride transport mechanisms in reinforced concrete (RC), explicitly accounting for the presence of reinforcement. Based on 171 experimental datasets, this study developed a prediction model to estimate the apparent chloride diffusion coefficient in reinforced concrete subjected to dry–wet cycles. The diameter of rebar was innovatively incorporated as a parameter, systematically integrating seven other key influencing factors into the model. Shapley Additive Explanations (SHAP) analysis reveals that exposure duration, sampling depth, coarse-to-total aggregate ratio, and rebar diameter constitute the dominant influencing parameters. Furthermore, FE analysis reveals that the presence of rebar redistributes aggregates, forming preferential pathways that increase chloride concentration at the steel-concrete interface. This study shows that the influence of reinforcement on chloride diffusion cannot be ignored. The proposed methodology advances durability science by data-driven modeling with physics-based modeling, providing actionable strategies for marine infrastructure optimization.
1. Introduction
Reinforced concrete structures in marine environments are susceptible to chloride-induced corrosion, which leads to steel degradation and concrete cracking—both of which are primary contributors to premature structural failure. Marine chlorides penetrate reinforced concrete through capillary absorption, diffusion, electromigration, and permeation. Among these, diffusion is considered the primary mechanism for chloride ions to pass through concrete [1], gradually destroying the passive film on the steel surface and threatening the durability of reinforced concrete structures. Accurately estimating the apparent chloride diffusion coefficients under given conditions helps accurately predict the durability of reinforced concrete in marine environments, providing a basis for designing durable and economical marine engineering. This research provides critical insights for developing innovative protective measures and materials, effectively extending structural service life while significantly reducing maintenance expenditures.
The chloride diffusion coefficient is influenced by multiple factors, making prediction challenging. Current research indicates that factors affecting chloride diffusion include environmental and material factors. In most previous studies, chloride diffusion coefficients were derived based on Fick’s second law. Researchers have studied and improved the formula based on Fick’s law, considering water-binder ratio, ambient temperature, fly ash ratio, curing age, etc. Torres et al. investigated the relationship between crack width and diffusion coefficient, indicating a linear correlation between the steady-state chloride diffusion coefficient and cracks [2]. Liu et al. demonstrated that the influence of cracks on chloride transport follows a threshold pattern: The impact increases modestly for crack widths from 0.05 mm to 0.10 mm, yet the chloride penetration capability increases substantially once the crack width attains 0.20 mm [3]. Wang et al. developed a diffusion model for recycled aggregate concrete under combined magnesium, sulfate and chloride attacks, examining the correlation between relative compressive strength loss rate and diffusion coefficient [4]. Lopes et al. aggregated around 40 distinct models for chloride diffusion coefficients, most of which are derived from Fick’s second law and incorporate modifications to improve predictive performance [5]. Rong et al. highlighted the limitations of these models, such as the lack of cross-comparisons and failure to comprehensively account for other influencing factors [6]. In practice, the factors influencing chloride diffusion coefficients are numerous and complex. Traditional empirical formulas often fail to adequately account for multi-factor interactions, which limits their predictive capability under multifactorial conditions.
Compared with traditional formula methods, properly trained machine learning algorithms can effectively predict unknown data and adapt to new data and environmental changes. They can reduce errors introduced by relying on polynomial empirical formulas. Zheng et al. used Bayesian-BP and other models to investigate the diffusion coefficient of machine-made sand concrete and, through importance analysis, found that relative humidity is the main factor affecting chloride diffusion [7]. Liu et al. used GBDT and other models to predict chloride penetration resistance in recycled aggregate concrete, noting that water content plays a major role in chloride permeation [8]. Wang et al. used Random Forest and other models to predict total chloride content in fly ash concrete with different mix ratios, finding that fly ash admixture below the threshold range of 30% to 40% can enhance the ability of fly ash concrete to resist chloride ion penetration [9]. Tran et al. created a database of various cementitious materials, including fly ash and silica fume, using Gradient Boosting and other models to predict their effects on chloride diffusion coefficients and analyze complex relationships [10]. The influence mechanism of steel reinforcement, as a key structural element, on the diffusion process has not yet been systematically characterized in machine learning prediction models.
Machine learning methods demonstrate significant advantages in predicting chloride diffusion, including higher prediction accuracy, greater adaptability, and better handling of complex nonlinear relationships. Liu et al. pointed out that traditional methods involve excessive assumptions and cannot handle complex datasets, often resulting in inaccurate predictions [11]. Machine learning algorithms can more accurately predict chloride diffusion coefficients. Liu et al. selected eight variables, including recycled aggregates and fly ash, as inputs, with passed electric charge as outputs to evaluate chloride penetration resistance [8]. All models achieved correlation coefficients exceeding 89%, with the GBDT model performing best. Taffese et al. considered nine factors, including coarse aggregate content, fly ash content, and slag content, and found that the model’s correlation coefficient on the test set reached 87% [12]. However, these high-precision models often operate as “black boxes,” and while they can reveal statistical associations between input features and output results, they struggle to clearly characterize the chloride ion transport process within reinforced concrete structures.
Machine learning methods improve the prediction accuracy and generalization capability of chloride diffusion coefficients by exploring nonlinear relationships and interactions in data. However, chloride diffusion coefficients are influenced by multiple factors, and databases established by different researchers vary. Golafshani et al. selected six factors, including water-binder ratio, curing mechanism, and silica fume-to-binder ratio, as feature values for predicting diffusion coefficients [13]. Taffese et al. established four models with different numbers of features for predicting chloride diffusion coefficients [14]. Current studies mainly focus on plain concrete, and no scholar has incorporated steel reinforcement factors as features in machine learning models for diffusion coefficient prediction. As a dense material, steel reinforcement causes aggregate redistribution within 4 mm, increasing the mortar content in its vicinity [15]. Compared to plain concrete, chloride concentration at the steel surface is higher at the same depth, making reinforcement more prone to corrosion. Therefore, existing databases have certain limitations in predicting real engineering scenarios.
To better meet practical engineering needs, this paper adopts a combined approach of machine learning and the finite element method. Prediction of the apparent chloride diffusion coefficient is achieved by incorporating rebar diameter as a parameter, and the chloride concentration on the steel surface is quantitatively characterized using finite element analysis. XGBoost was employed to construct the model and evaluate its fitting degree. Based on previous studies and considering the reinforcement’s effect on the diffusion coefficient, a machine learning model was developed with eight input variables and the diffusion coefficient as the output. By controlling different input variables, the various factors affecting the diffusion coefficient were analyzed, and SHAP analysis was utilized to explore the importance of different influencing factors. Finally, a mesoscale reinforced concrete model is established, considering the spatial redistribution of coarse aggregates induced by steel reinforcement. The chloride concentration distribution on the rebar surface under the indirect blocking effect of reinforcement is analyzed via finite element simulation.
The contents of this paper are structured as follows: Section 2 presents the data processing methodology. Section 3 establishes an XGBoost-based predictive model for chloride diffusion. Section 4 offers a comprehensive analysis of the results. Section 5 details the finite element simulation and its insights.
2. Processing of Experimental Data
This section describes the preprocessing of data collected from the literature [16,17,18,19,20,21,22,23,24,25,26,27,28,29]. All experiments were conducted under laboratory conditions and the details of the relevant wet-dry cycle experiments are presented in Table 1, the preprocessing included key feature extraction and correlation analysis. This facilitated the development and training of the apparent chloride diffusion coefficient model. The apparent chloride diffusion coefficient is a macroscopic equivalent parameter used to describe the overall migration rate of chloride ions in concrete under non-ideal conditions. Its value comprehensively reflects the coupled effects of various physicochemical factors, such as water-to-cement ratio and environmental humidity.
Table 1.
Details of the different wet–dry cycle experiments.
2.1. Experimental Dataset
To study the effect of reinforcement on the apparent chloride diffusion coefficient, chloride erosion tests were conducted under laboratory wet-dry cycles. Ten parameters, including Diameter, Depth, W/C, Aggregate (%), Day, Fly ash, D-W, RH, T and period, were collected from the literature, totaling 171 data groups [16,17,18,19,20,21,22,23,24,25,26,27,28,29]. Here, Diameter refers to rebar diameter. Depth denotes the sampling depth from the exposed surface. W/C is the water-to-cement ratio. Aggregate (%) refers to the proportion of coarse aggregate in the total aggregate. Day signifies the exposure time. Fly ash denotes the fly ash replacement ratio. D-W is defined as the ratio of drying time to soaking time. RH refers to the relative humidity of the ambient environment to which the concrete is exposed. T represents the average ambient temperature, while period indicates the time required to complete one full wet–dry cycle. Based on the correlation analysis conducted in Section 2.2, we ultimately retained the following eight parameters for model construction: Diameter, Depth, W/C, Aggregate (%), Day, Fly ash, D-W and RH.
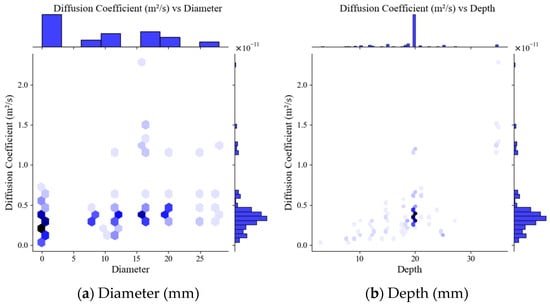
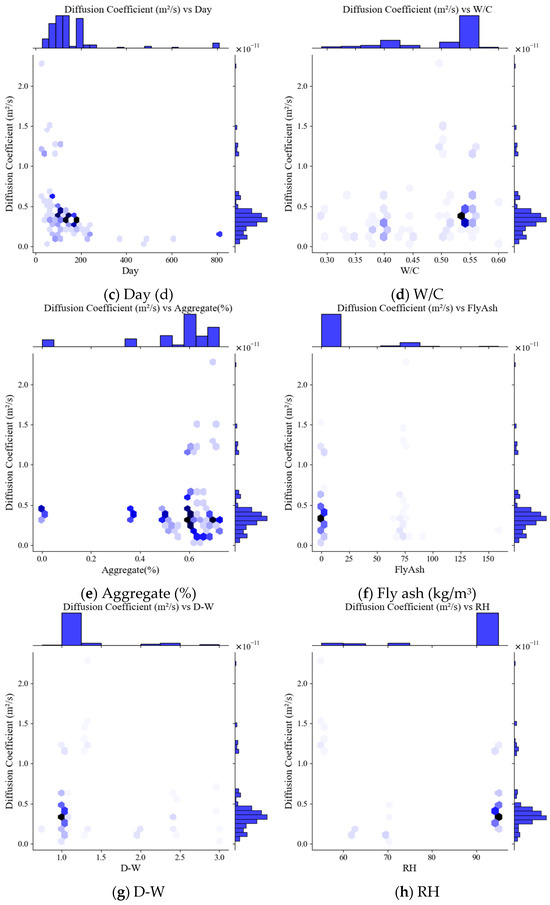
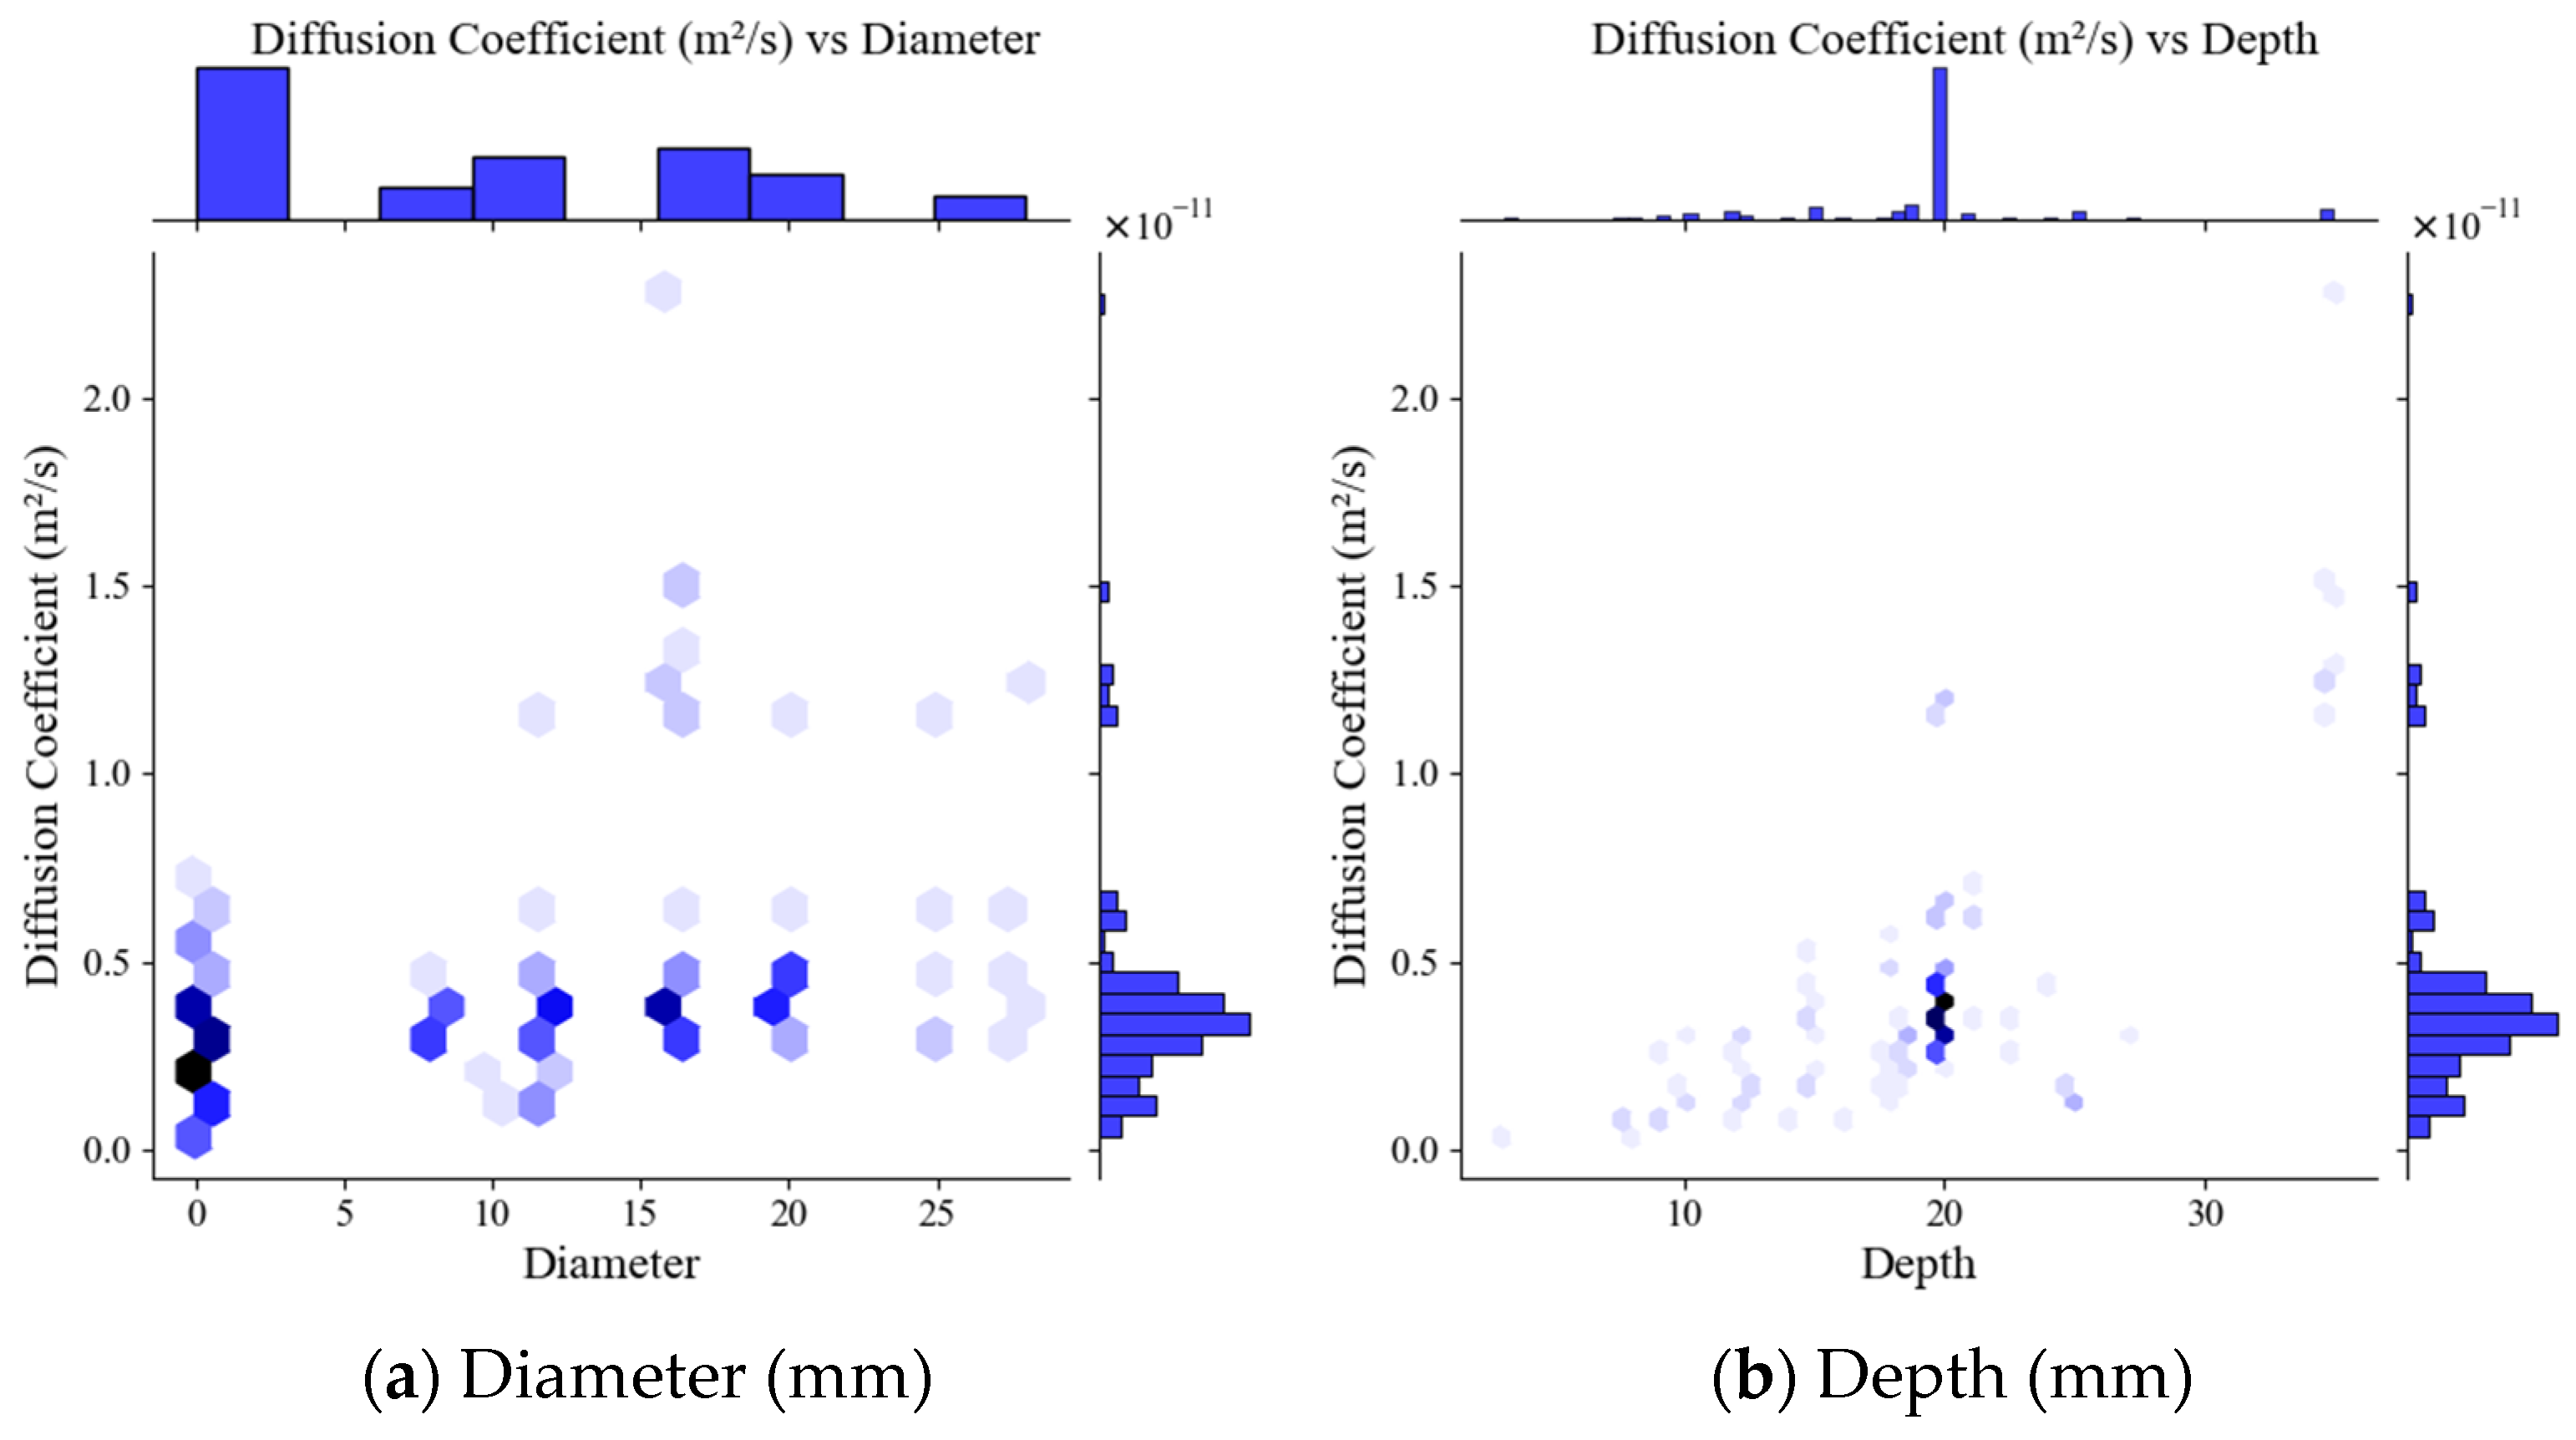
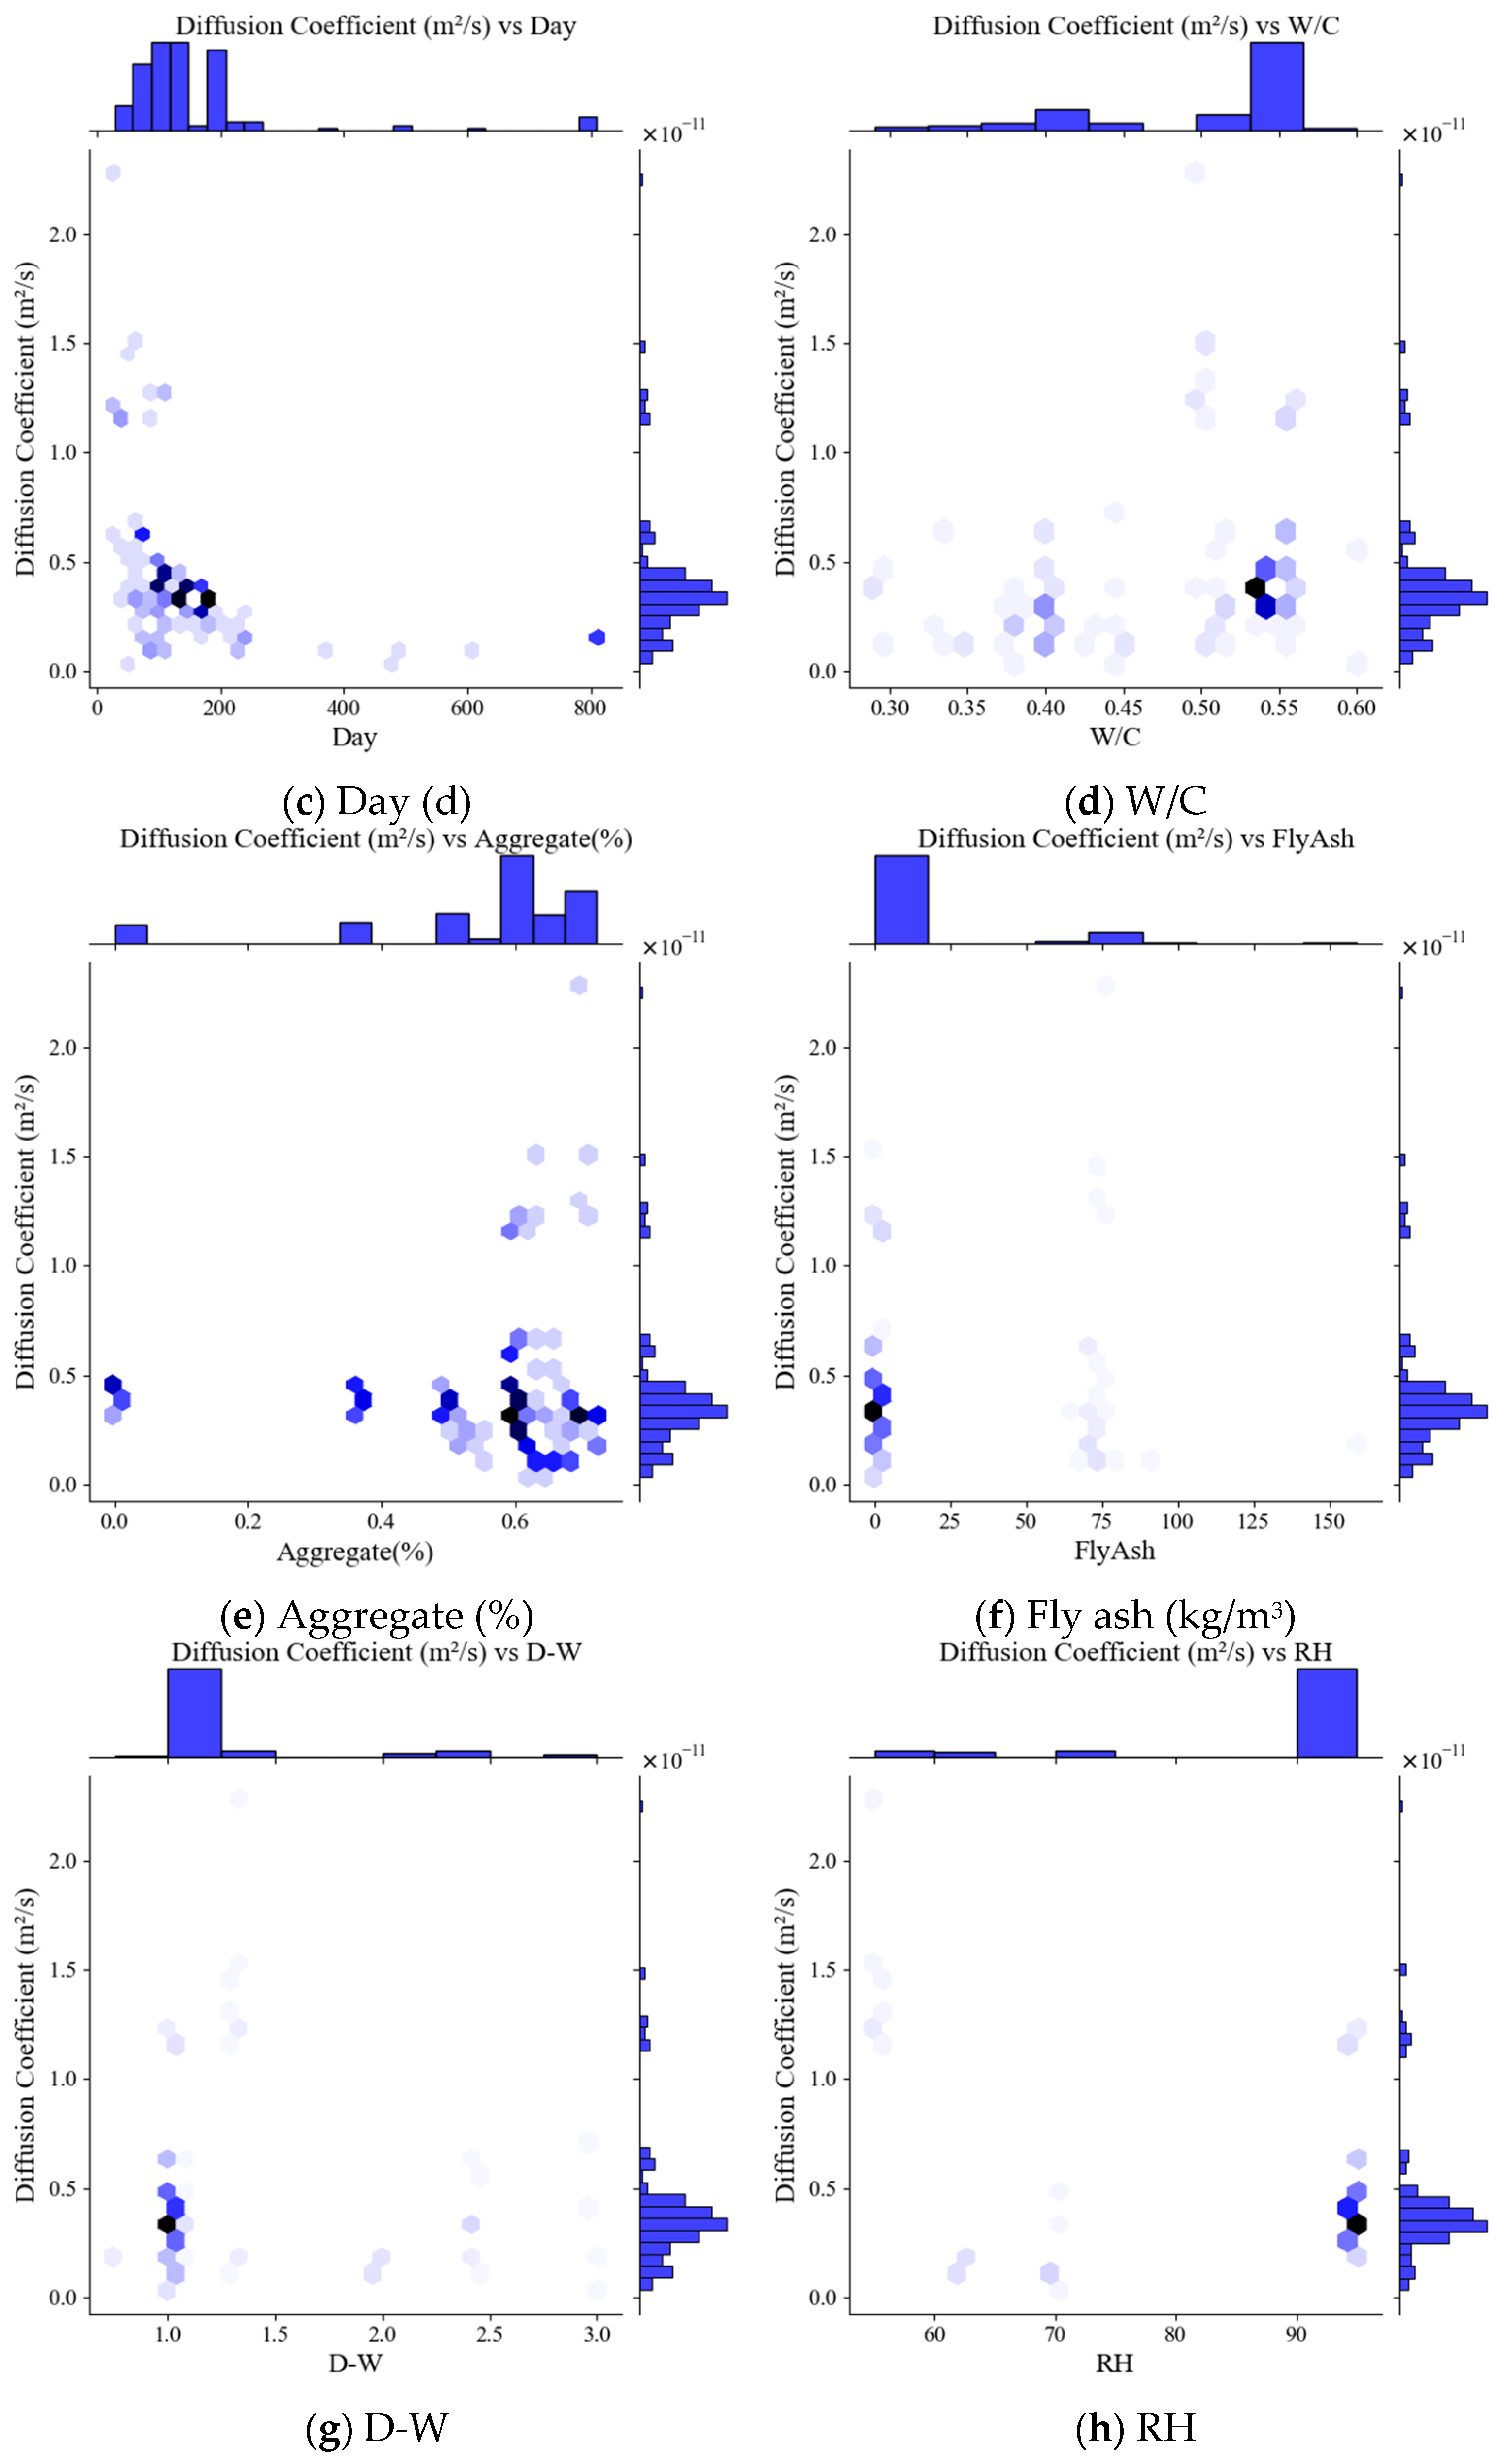
Hex contour plots were used to visualize the influence of input variables on apparent chloride diffusion coefficient, as shown in Figure 1. The x-axis of each subplot represents the parameter space distribution of independent variables, while the y-axis corresponds to the spatial distribution of apparent chloride diffusion coefficient. Darker regions reveal clustering characteristics of key parameter ranges. The analytical plots show the main concentration areas of various feature data.
Figure 1.
Hex contour graph of input parameters.
The apparent chloride diffusion coefficient ranges from 3.55 × 10⁻¹³ m2/s to 2.28 × 10⁻¹¹ m2/s, with most values concentrated between 1.14 × 10⁻¹² m2/s and 5.41 × 10⁻¹² m2/s. The plain concrete dataset accounts for 39.4% of the total dataset. Most data points correspond to Day between 100 days and 200 days. The Depth is mainly 20 mm. The Aggregate (%) shows that some specimens are mortar specimens, with Aggregate (%) mostly between 50% and 70%. According to the Table 2 dataset description, the W/C ranges from 0.29 to 0.61. D-W was predominantly 1, and 90% relative humidity accounted for the vast majority of RH measurements.
Table 2.
Statistical information of input and output variables.
2.2. Data Preprocessing
Before inputting data into the model, data preprocessing is required, including data standardization, feature selection, dataset division, etc. The steps are as follows:
where is the standardized value of the variable, is the original value before standardization, δ is the standard deviation of the variable, and is the mean of the variable.
Feature selection involves choosing features for the model from the existing features. The correlation coefficients between features are calculated using Equation (2). These coefficients range between [−1, +1], where +1 indicates perfect positive correlation, −1 indicates perfect negative correlation, and 0 indicates no correlation between features.
where and represent the values of the two features; and represent the mean values of the two features; and is the Pearson correlation coefficient between the two features.
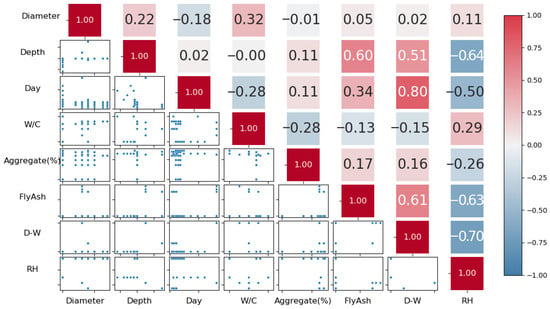
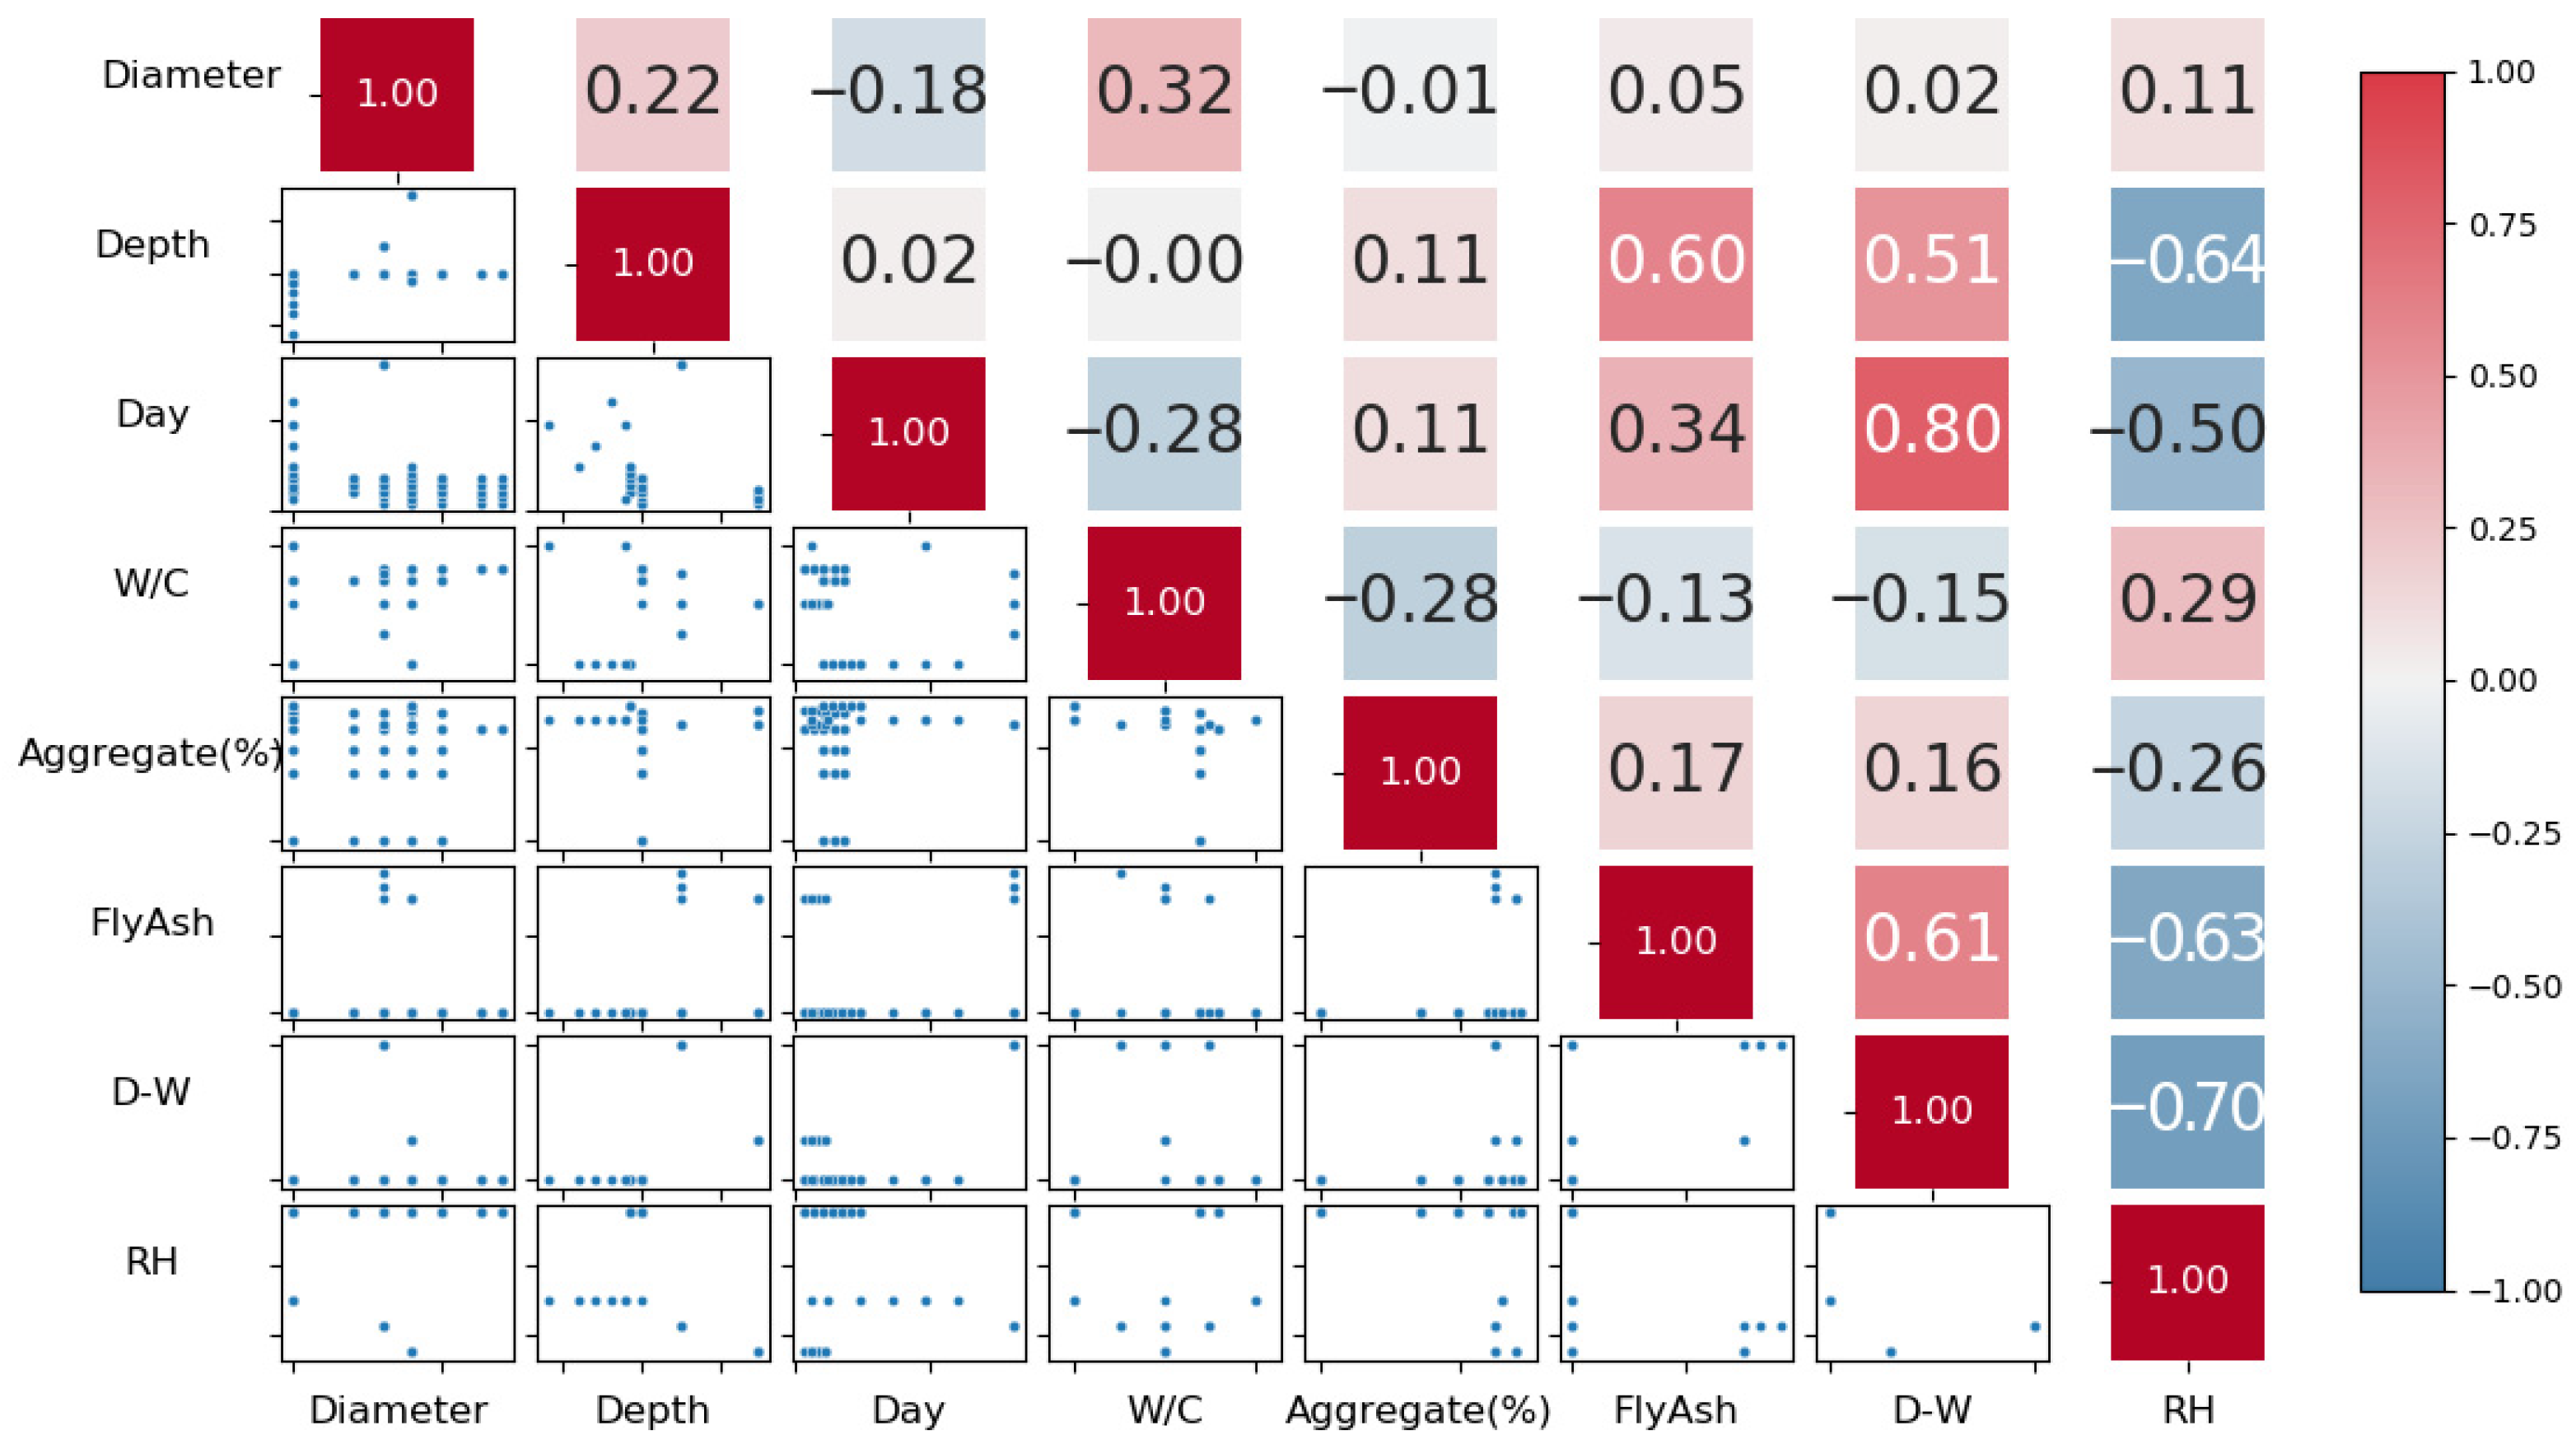
When strong inter-feature correlations are detected, elimination of redundant variables becomes necessary. Such collinearity demonstrates substantial informational redundancy that could impair the model’s ability to discern the effects of independent variables. As illustrated in Figure 2, the correlation matrix demonstrates that D-W achieves maximum positive correlation (0.80) with day, while showing peak negative correlation (−0.70) with RH. The bivariate analysis of W/C and Depth variables reveals a random point distribution pattern in the scatter plot, accompanied by a null correlation coefficient (0.00), indicating no linear relationship. Empirical studies suggest maintaining pairwise correlation coefficients below 0.8 between model input features to ensure statistical validity [30]. However, when using tree-based models that are less sensitive to multicollinearity, this threshold can be pragmatically relaxed to retain feature pairs with correlations around 0.8 [31]. Given the high linear correlation between period and D-W (correlation coefficient of 0.99), D-W was ultimately selected as the model parameter. Similarly, considering the strong correlation between T and Day (correlation coefficient of 0.85), Day was retained as the input feature. Consequently, the observed correlation magnitudes satisfy this threshold requirement, confirming the suitability of these features for chloride diffusion coefficient prediction modeling.
Figure 2.
Heatmap.
3. XGBoost-Based Prediction Model of Chloride Diffusion
This section establishes an XGBoost-based predictive model for chloride diffusion coefficients, introduces the SHAP framework to enhance model interpretability, and evaluates performance using five rigorously defined metrics.
3.1. Theoretical Basis of the XGBoost Model
XGBoost (Extreme Gradient Boosting), as a gradient boosting framework combining computational efficiency and architectural flexibility, demonstrates core advantages through exceptional operational performance and robust generalization capability. This study employs eight key predictors—Diameter, RH, D-W, Day, Depth, W/C, Aggregate (%), and Fly ash—to construct a chloride diffusion coefficient prediction model for single-mix reinforced concrete systems.
where denotes the loss function in question; denotes the input characteristics of the sample, e.g., Diameter, number of Days, etc.; denotes the actual value of sample , The apparent chloride diffusion coefficient in the sample ; denotes the previous predicted value of sample by the first t decision trees, i.e., the predicted value of the diffusion coefficient of chloride ions in the sample ; denotes the predicted value of sample by the tree; and denotes the complexity of the model of the tree, which in this case is the regularization term used to penalize the more complex models and to slow down overfitting.
During the training process, XGBoost uses a second-order Taylor expansion to approximate the loss function and coordinates the contribution of each weak learner through the greedy algorithm to optimize the overall model performance, whose second-order Taylor expansion is as follows:
where denotes the first-order derivative, and denotes the second-order derivative.
3.2. Principle of the SHAP
Machine learning models are often black-box models, where the impact of known features on the results is unknown. The SHAP model can effectively analyze the interpretability of machine learning, providing global and local interpretations of the model by calculating the contribution of each feature to the predicted result.
The SHAP value represents the contribution of the j-th feature of the i-th sample to the predicted value of the sample and can be used in the expression of the SHAP value as shown in the following equation:
where represents the baseline value, generally taken as the average of all predicted values, and is the SHAP value of . indicates a positive effect on the predicted value, and indicates a negative effect on the predicted value, where is calculated as shown in the following equation:
where is the set of all features, is the subset of features, denotes the number of elements in the subset , denotes the total number of elements in the set of features, denotes the predicted value of the input data when the model uses the subset of features plus feature j, and denotes the predicted value of the input data when the model uses only the subset of features.
3.3. Model Evaluation Indicators
In this study, five evaluation indices, namely mean square error (MSE), mean absolute error (MAE), coefficient of determination (R2), root mean square error (RMSE), and explained variance score (EVS), were used to systematically quantify the prediction accuracy, distribution of bias, and variance explanation ability of the regression model. The formulas for the evaluation metrics are shown in the following equations:
where represents the actual value, represents the predicted value, and represents the mean value, where Var represents the variance.
4. Results and Discussion
This section conducts a comprehensive investigation into the implementation of XGBoost for apparent chloride diffusion coefficient prediction in reinforced concrete systems, coupled with interpretability analysis. In this study, the dataset will be partitioned into training and testing subsets, with 80% of the samples designated for model training and the remaining 20% reserved for evaluation. Model efficacy is quantitatively assessed through the performance metrics defined in Equations (8)–(12). To establish connections between data-driven predictions and physical mechanisms, SHAP analysis based on Equation (7) is implemented, encompassing both global feature importance evaluation and local instance interpretation to discern critical parameters and elucidate their interactions with chloride transport phenomena.
4.1. XGBoost Predictive Model for Chloride Diffusion Coefficient
Hyperparameter tuning was performed using the Optuna 3.0.6 framework in Python 3.6, an automated optimization tool that effectively identifies optimal hyperparameter configurations to enhance predictive performance. The following section presents a detailed methodology for applying Optuna to optimize hyperparameters in the XGBoost framework.
An objective function is initially defined to specify the hyperparameter search space, encompassing critical XGBoost parameters such as n_estimators, max_depth, and learning_rate. Optuna performs automated sampling of hyperparameters across predefined domains and determines the best parameter configuration by maximizing R2 on the validation dataset.
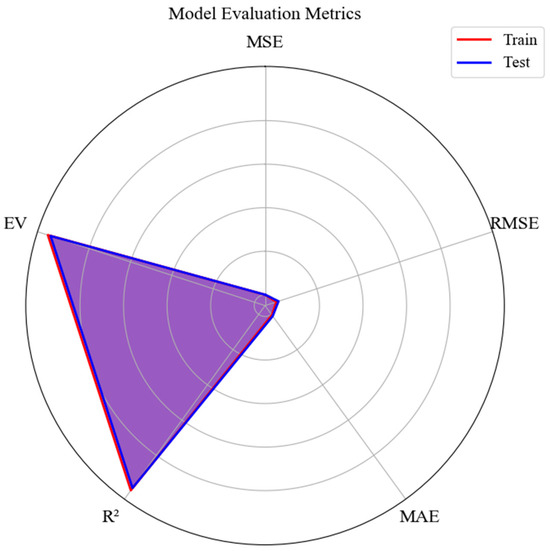
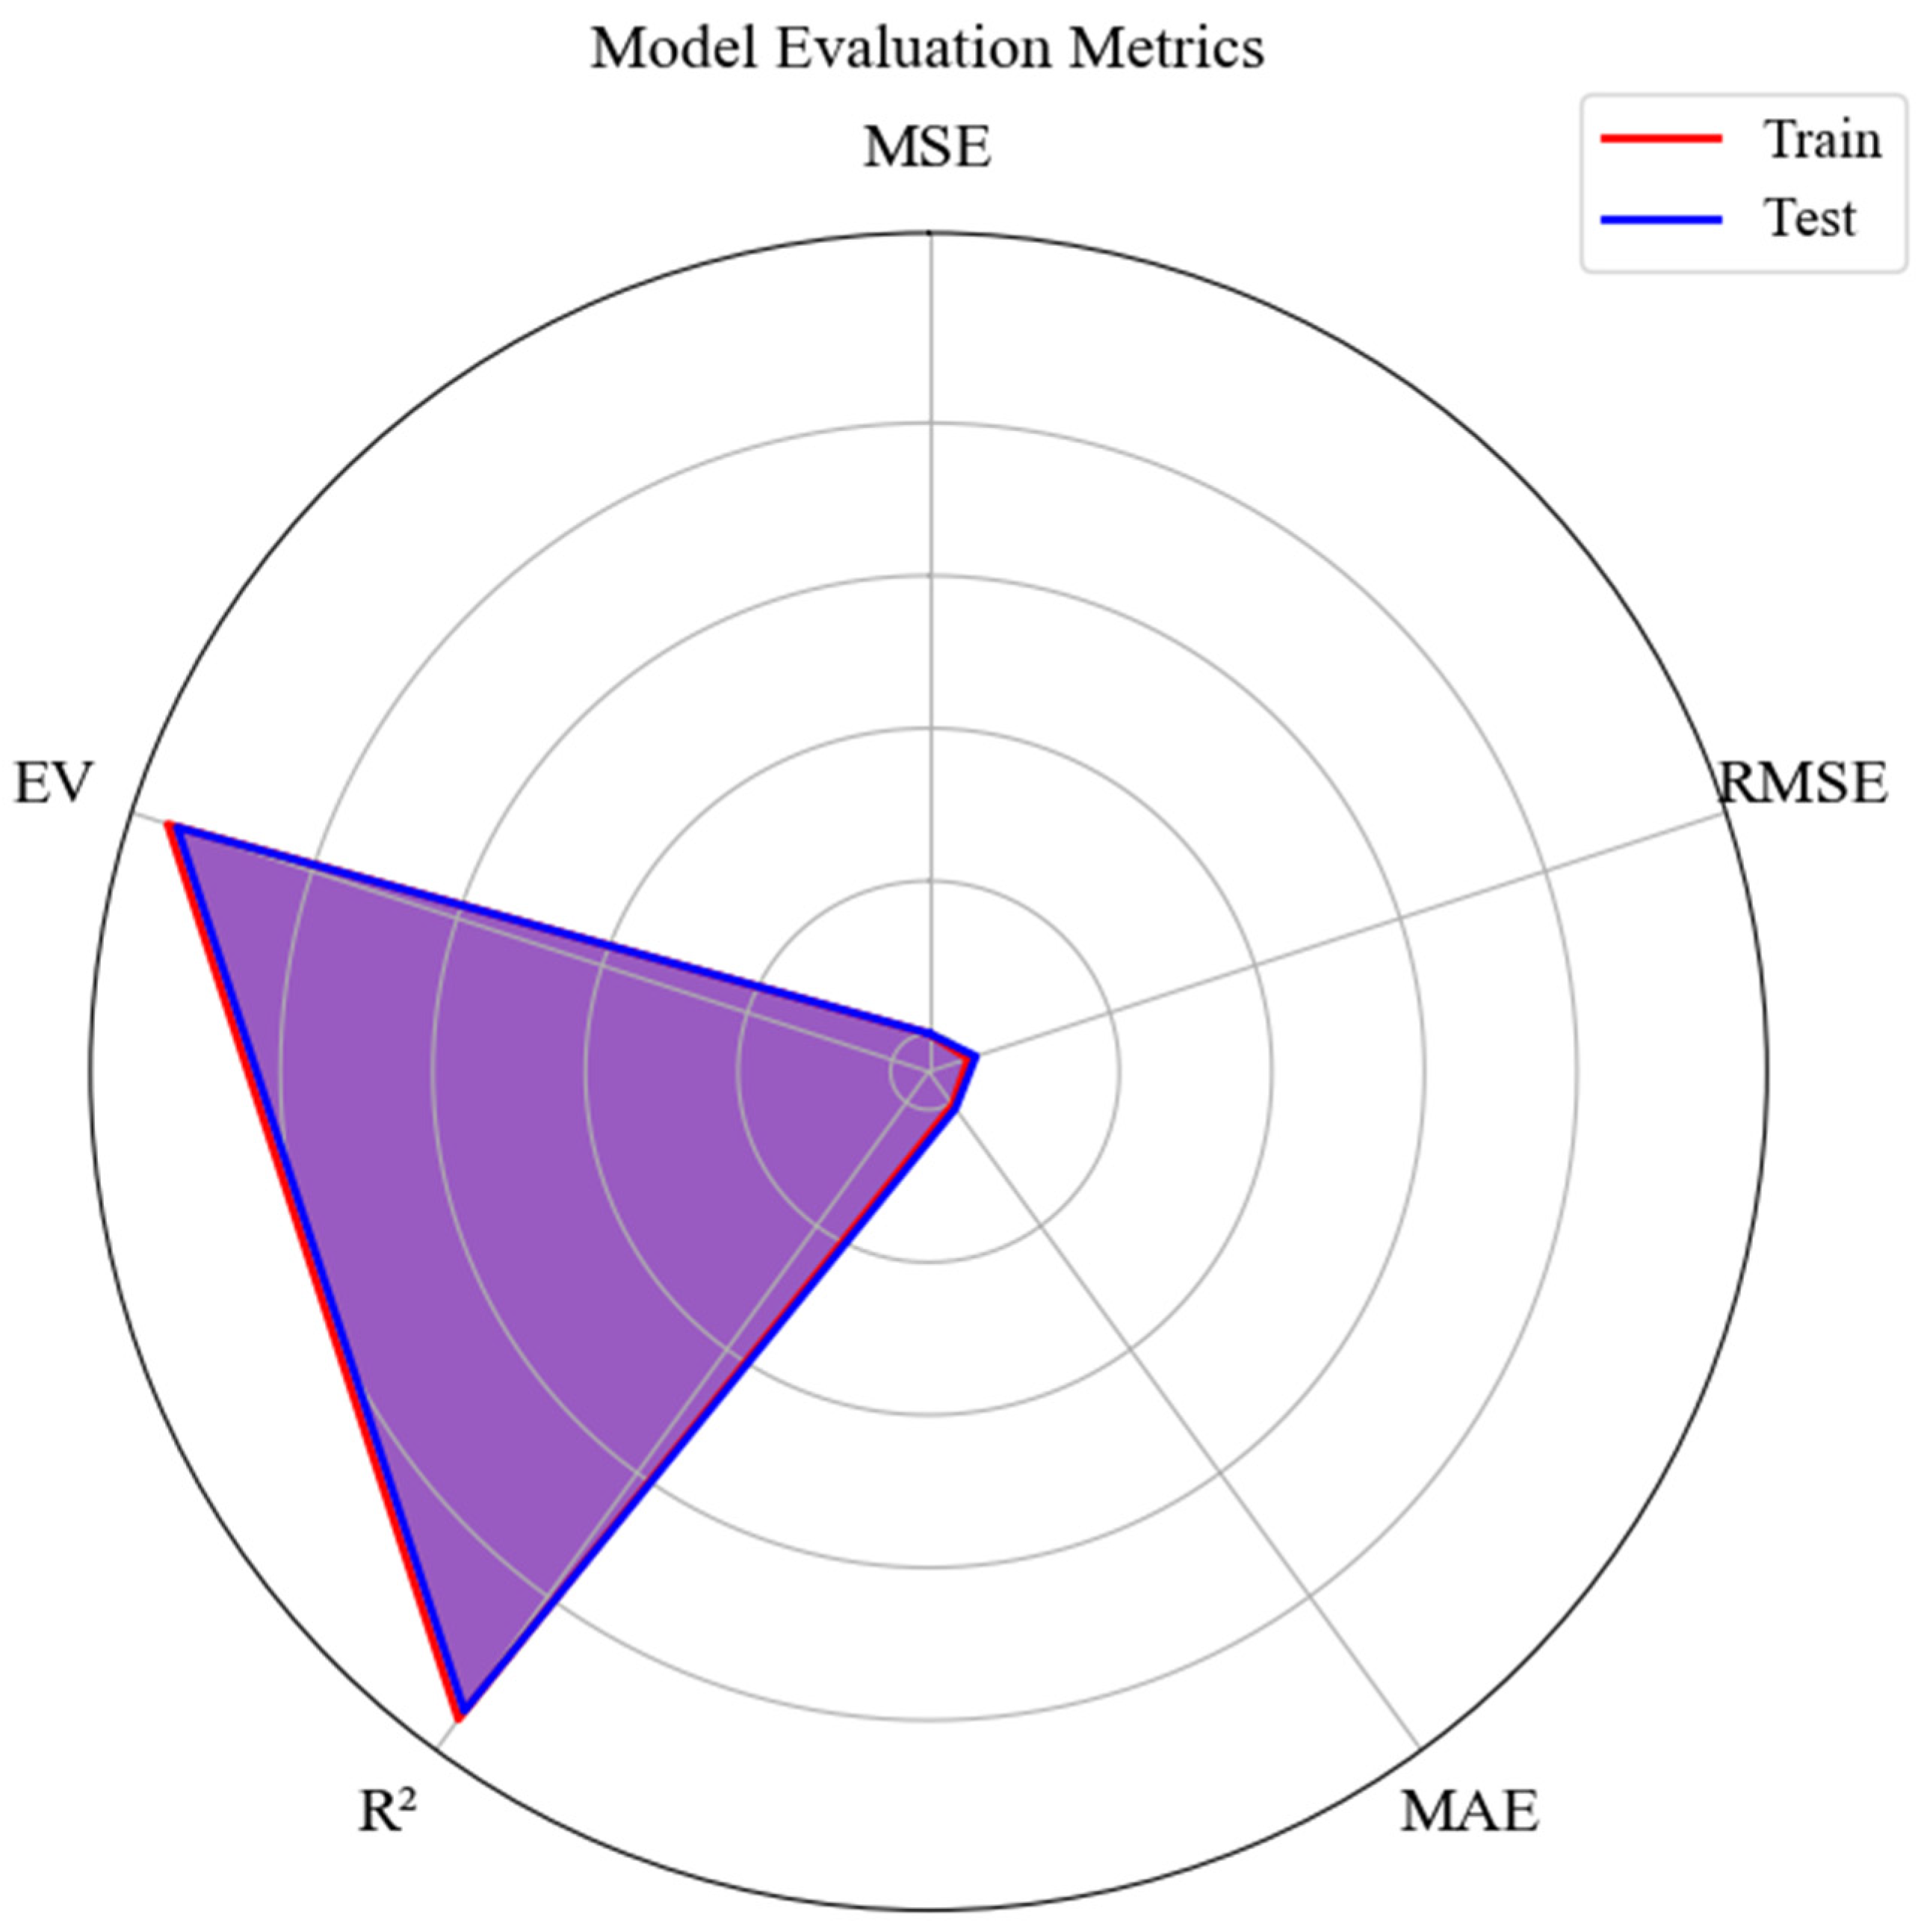
The radar plot in Figure 3 illustrates the model’s performance metrics across both training (red) and testing (blue) datasets. The assessment incorporates five metrics: Mean Squared Error (MSE), Root Mean Squared Error (RMSE), Mean Absolute Error (MAE), Coefficient of Determination (R2), and Explained Variance Score (EV). An Explained Variance (EV) score approaching unity signifies enhanced model interpretability and improved capability to account for data variability. The testing set’s R2 value, while slightly lower than the training set’s, demonstrates comparable performance, suggesting the absence of overfitting in the model.
Figure 3.
Model evaluation metrics.
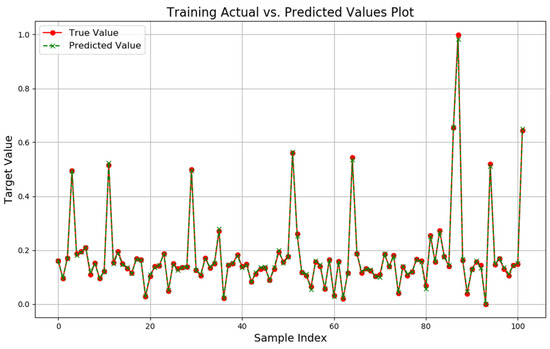
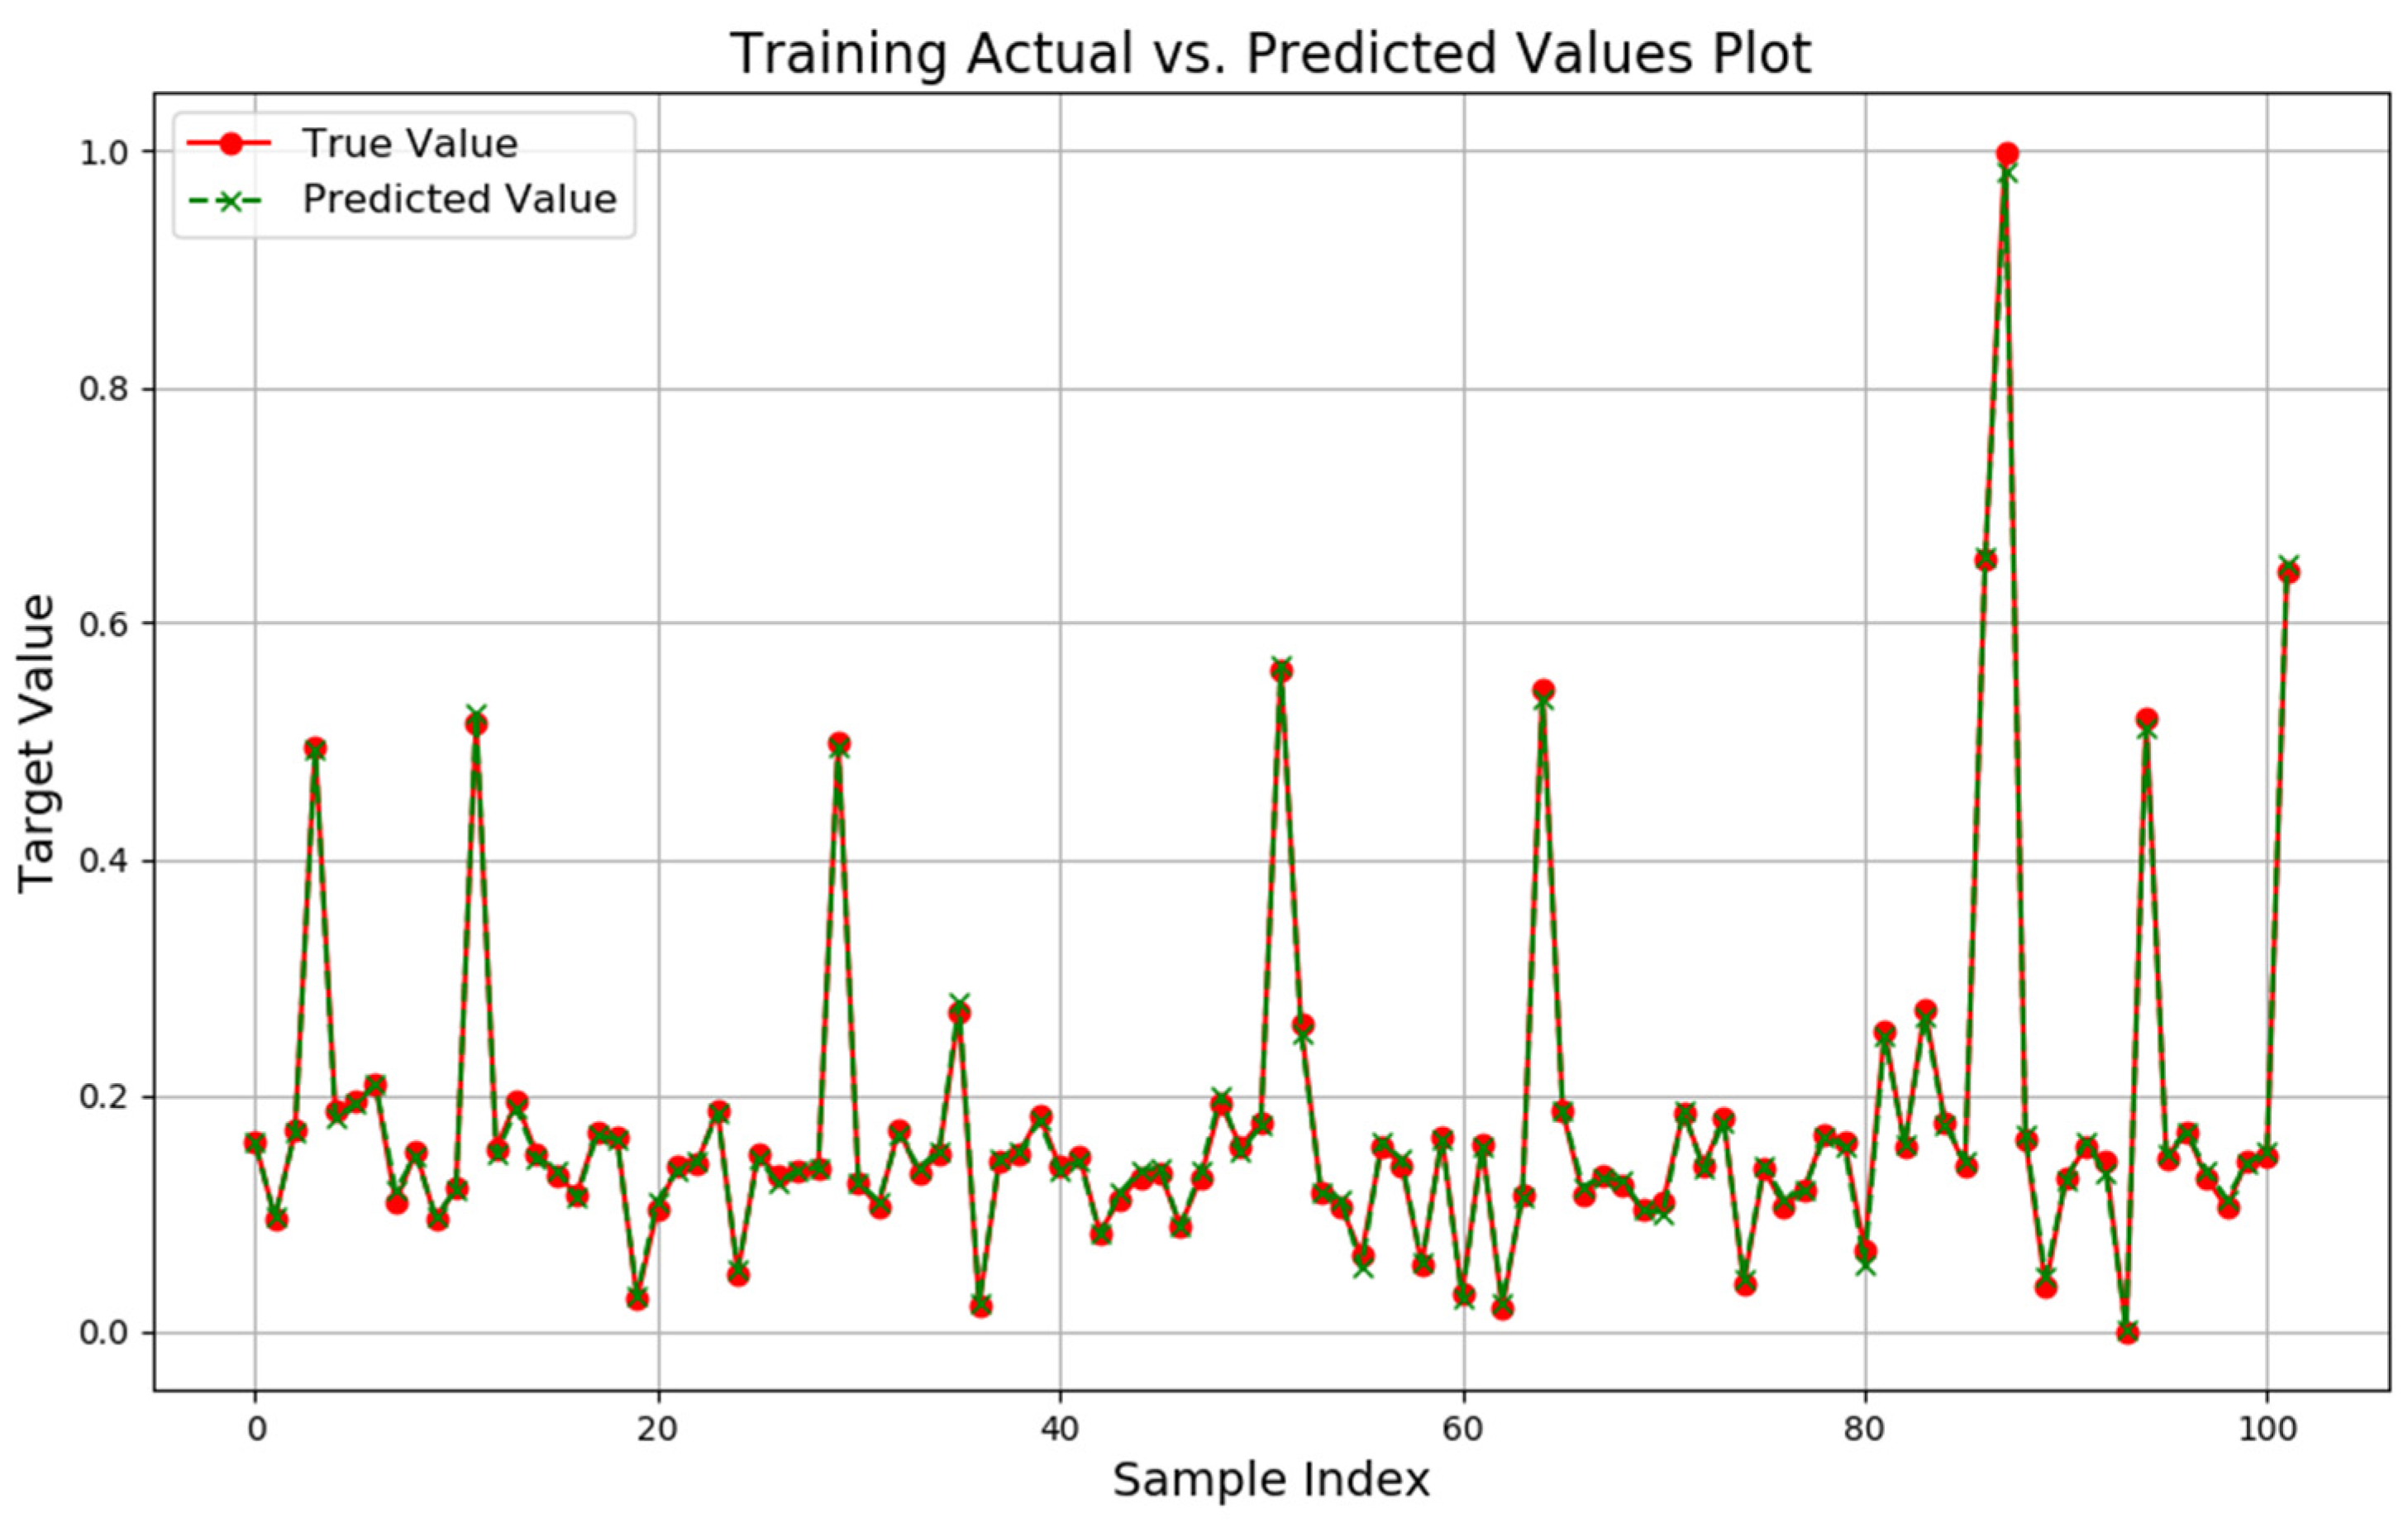
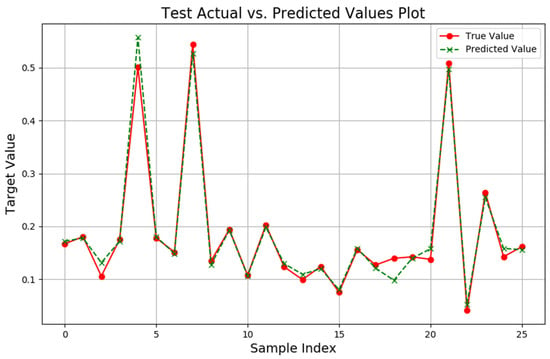
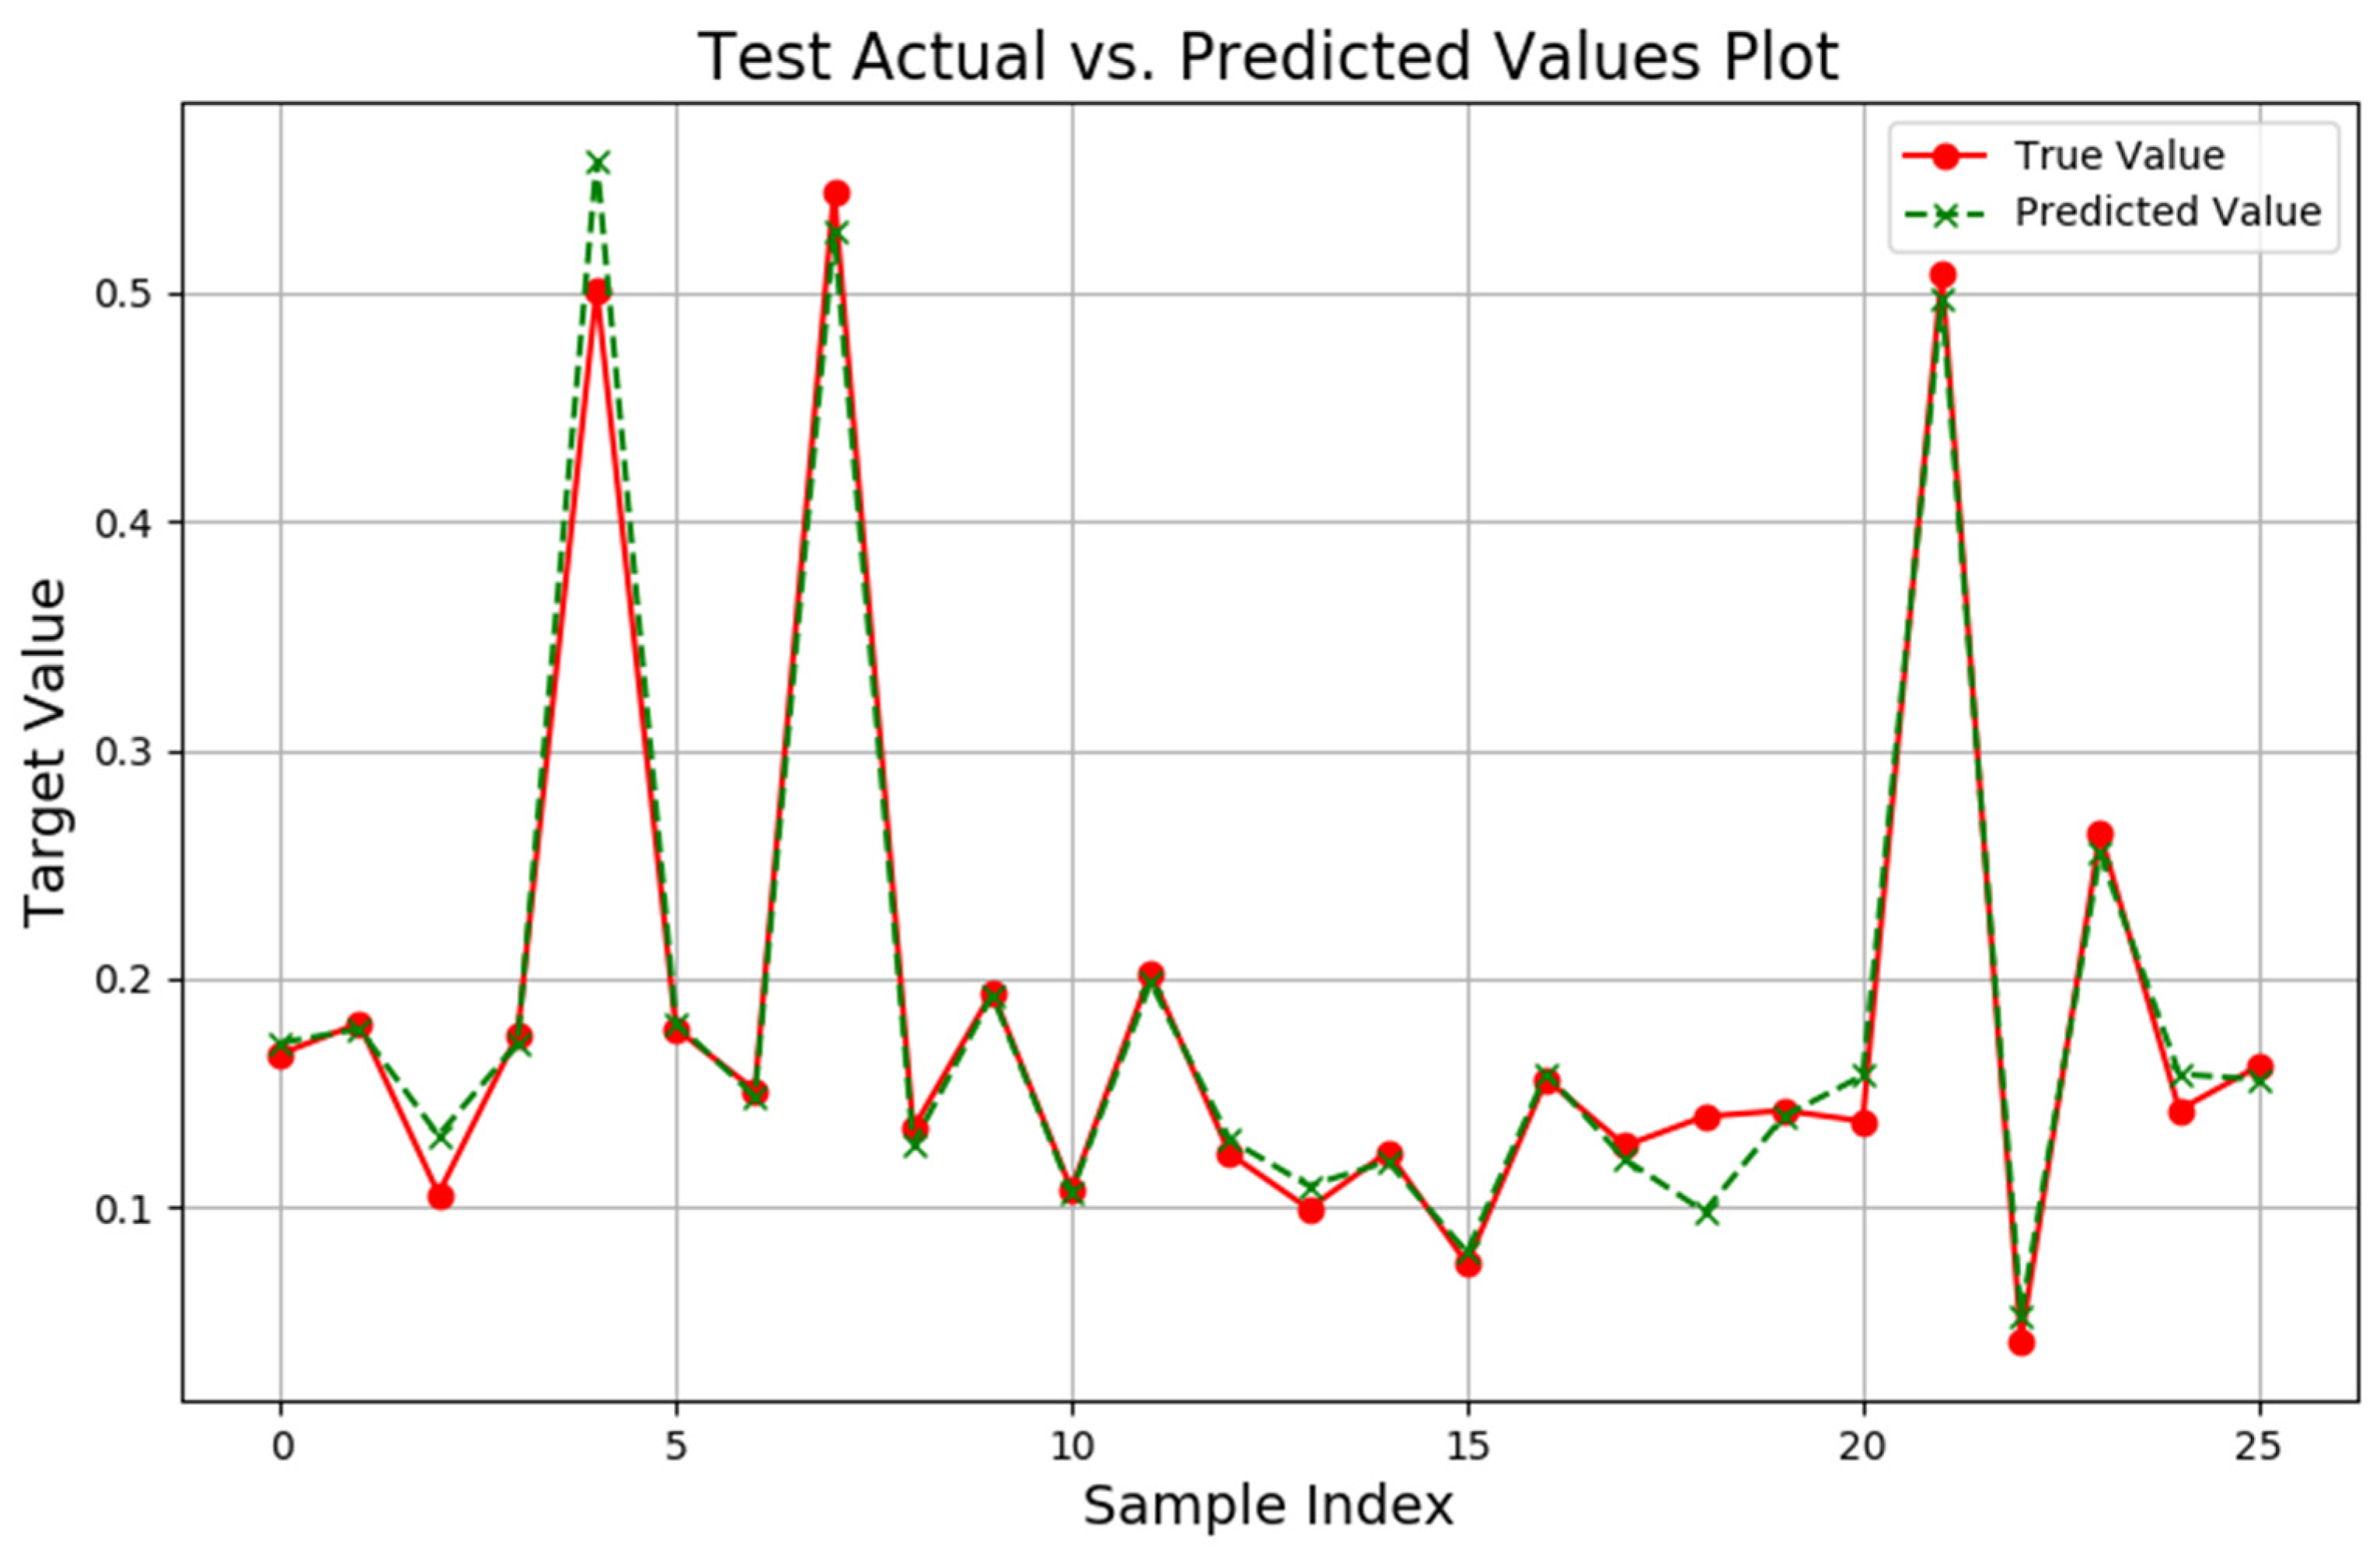
The predictive performance of the XGBoost model for the apparent chloride diffusion coefficient in reinforced concrete systems is visualized in Figure 4 and Figure 5 for the training and testing datasets, respectively. Model predictions are indicated by green markers, whereas red markers correspond to experimental measurements. The graphical representations reveal strong agreement between the model’s predictions and empirical observations.
Figure 4.
Comparison of the apparent chloride diffusion coefficient between the training dataset and model predictions.
Figure 5.
Comparison of the apparent chloride diffusion coefficient between the test dataset and model predictions.
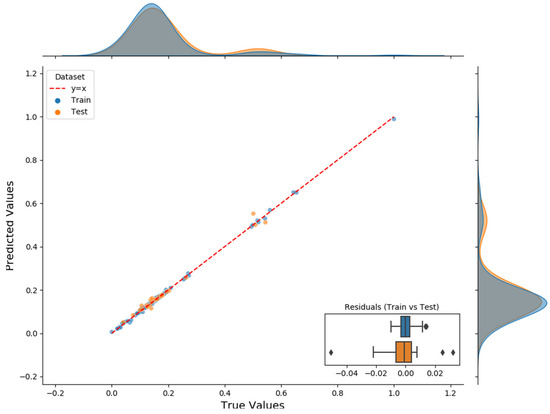
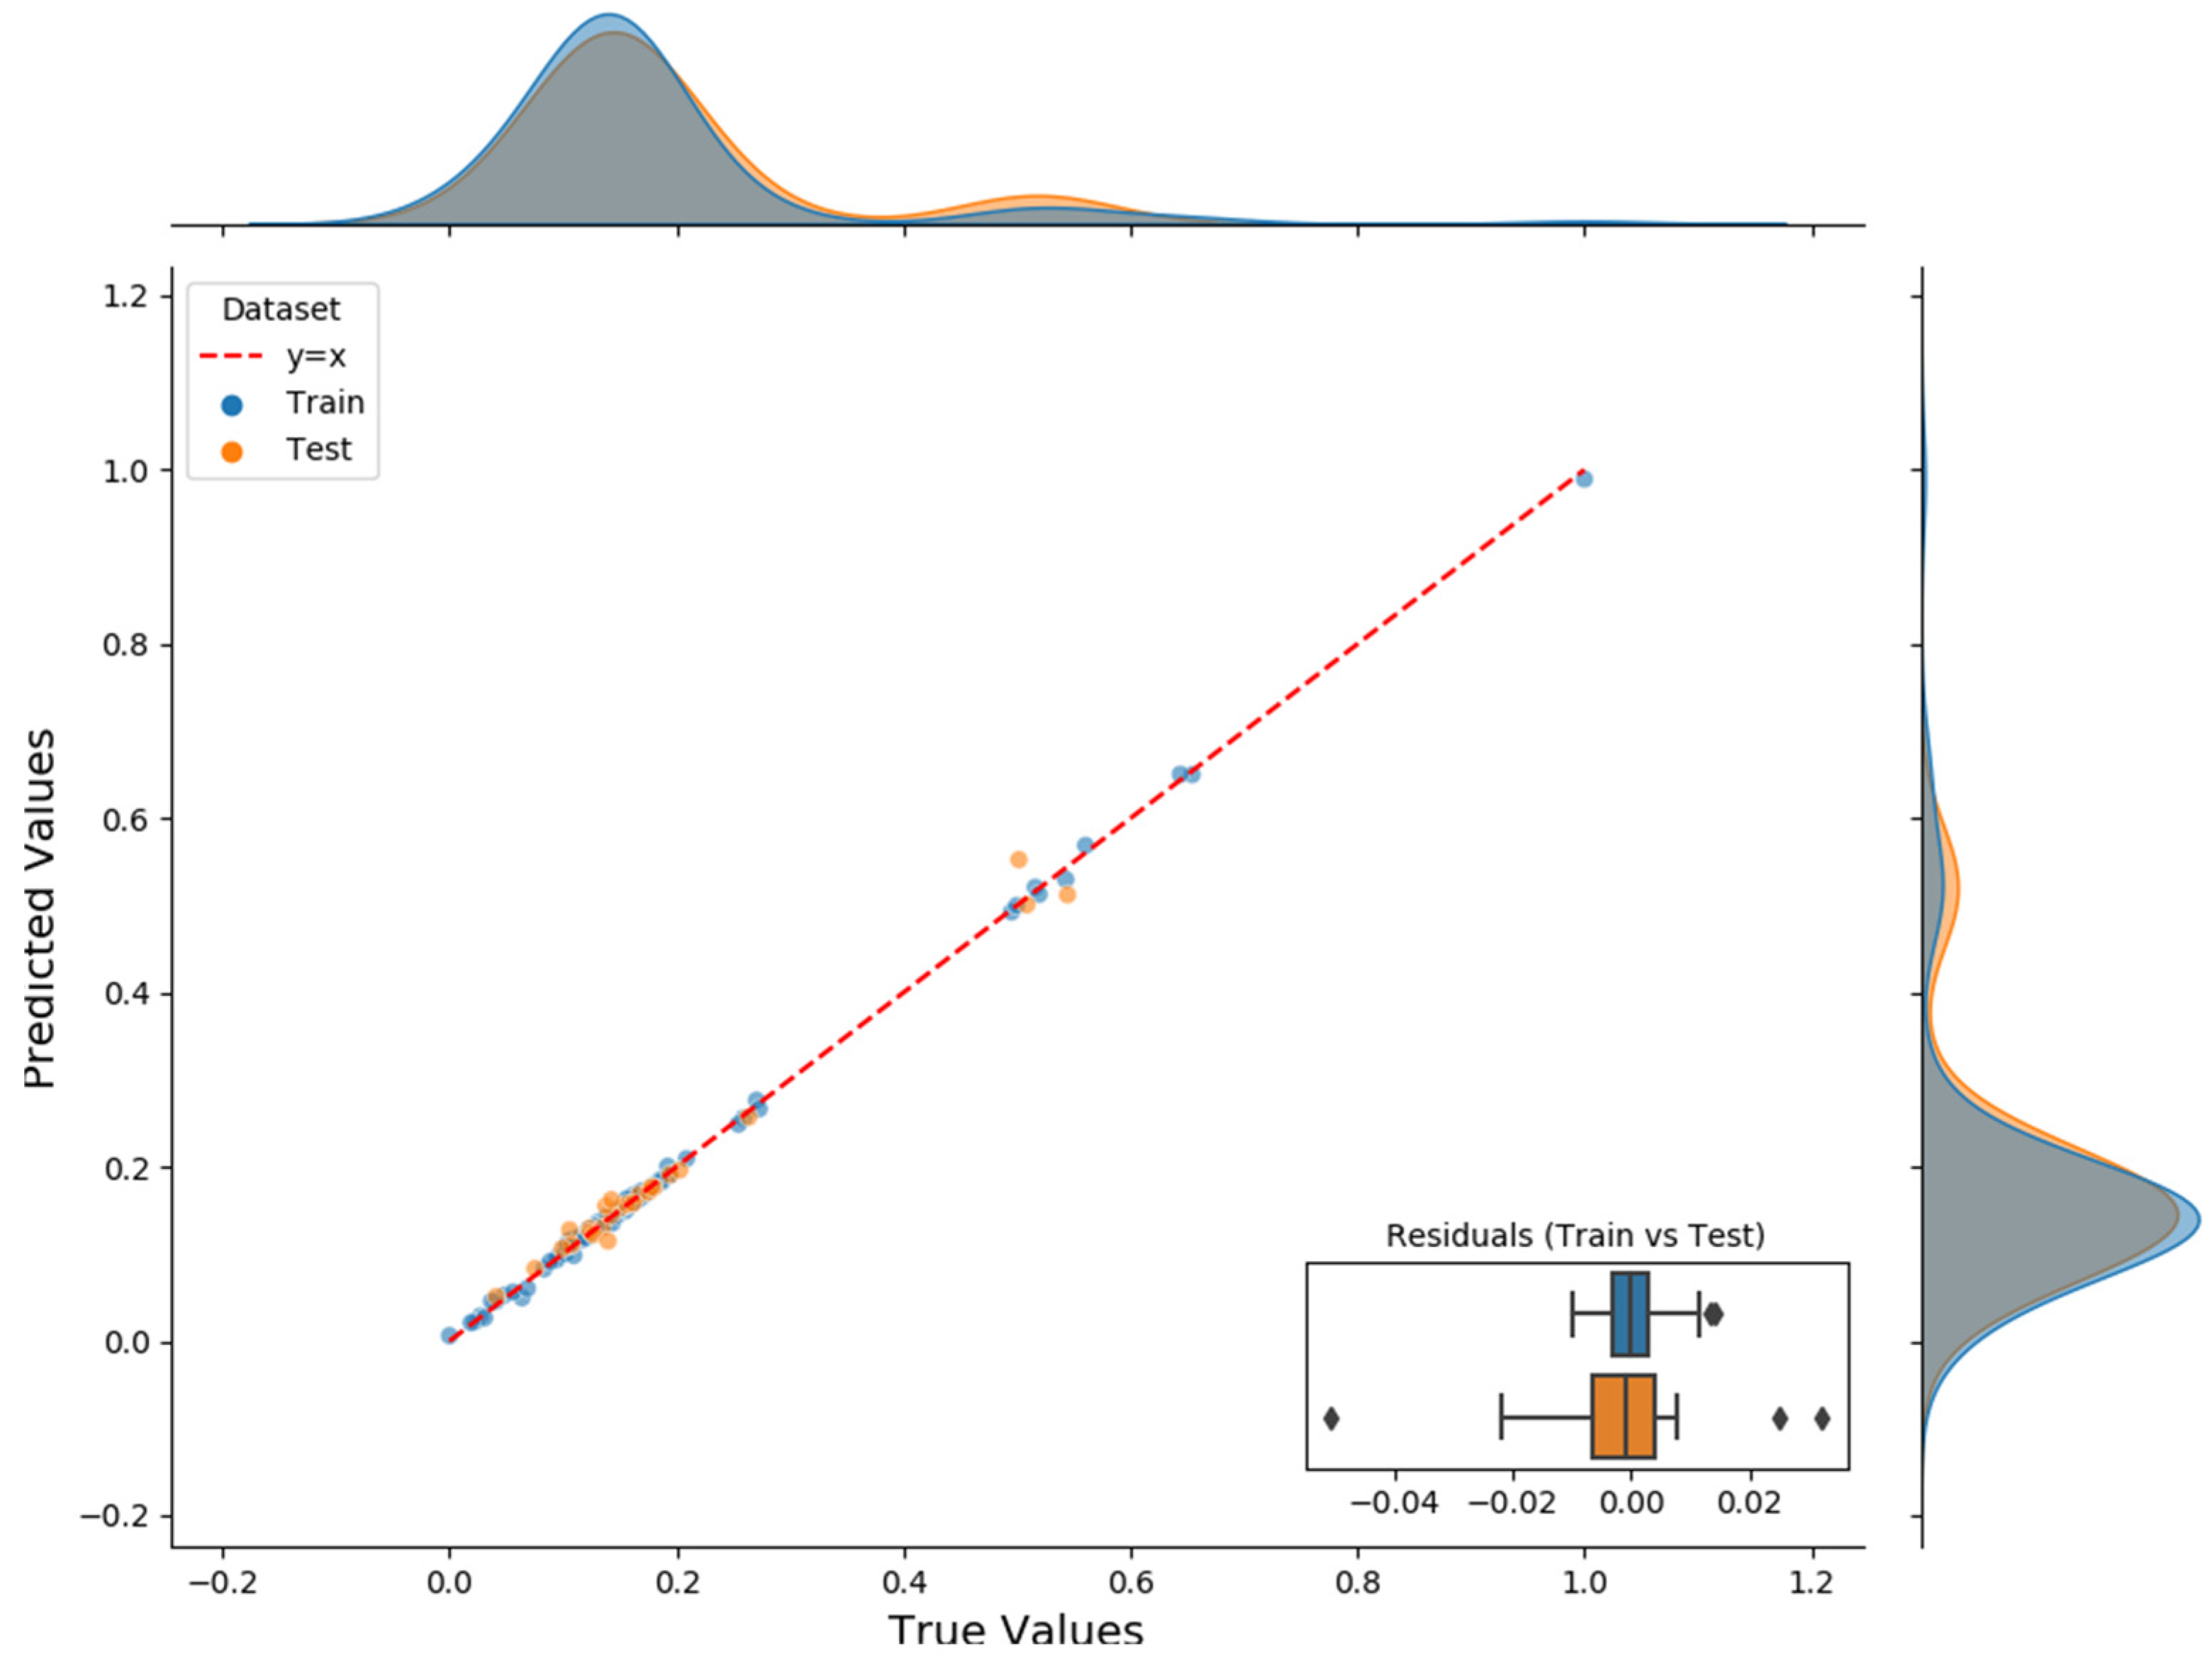
Figure 6 provides additional visualization of the XGBoost regression model’s performance characteristics. The scatter plot illustrates the correlation between predicted and observed values, with training data shown in blue and testing data in orange, demonstrating strong alignment along the reference line (red dashes) and confirming model accuracy. The bottom-right residual plot employs boxplot visualization to compare error distributions between the training and testing datasets, with residuals defined as prediction–actual value differences. Residual analysis reveals approximately normal error distributions with comparable patterns between the training and testing sets, suggesting consistent model performance across datasets. Statistical comparison of residual distributions using the Mann–Whitney U test (a non-parametric method for assessing distributional differences) yielded a p-value of 0.969, which exceeds the standard significance threshold (α = 0.05), confirming the absence of significant differences between the training and testing error distributions and demonstrating model consistency without overfitting.
Figure 6.
Regression performance analysis plot.
To validate the robustness and generalizability of the proposed XGBoost model, a five-fold cross-validation procedure was implemented. This approach mitigates the risk of overfitting and ensures the model’s reliability across different data partitions. The cross-validation results, summarized in Table 3, reveal excellent predictive performance with a mean testing R2 of 0.94 and an explained variance score (EVS) of 0.94, indicating that the model captures approximately 95% of the variability in chloride diffusion coefficients. Although a slight performance gap exists between the training set (R2 = 0.998) and the testing set, the consistent cross-validation metrics across all folds confirm the model’s generalizability and robustness.
Table 3.
Performance metrics of the XGBoost model under five-fold cross-validation.
4.2. SHAP Analysis for Chloride Diffusion Prediction Coefficient Model
According to the model validation results and evaluation metrics in Section 4.1, this study confirms the prediction accuracy of the XGBoost model. To further understand the prediction mechanism and achieve interpretability analysis, this study employs the SHAP method for in-depth model analysis. Considering that the RH parameter contains missing values, which could introduce bias and compromise the reliability of SHAP interpretation, this analysis is conducted using the remaining complete feature set to ensure robust and accurate model explanation.
4.2.1. Holistic Analysis
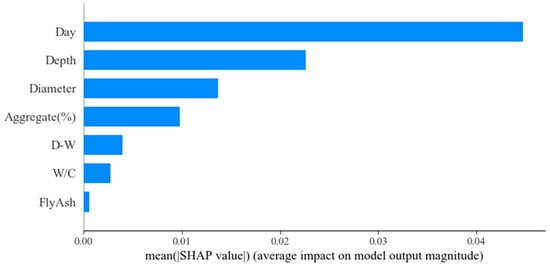
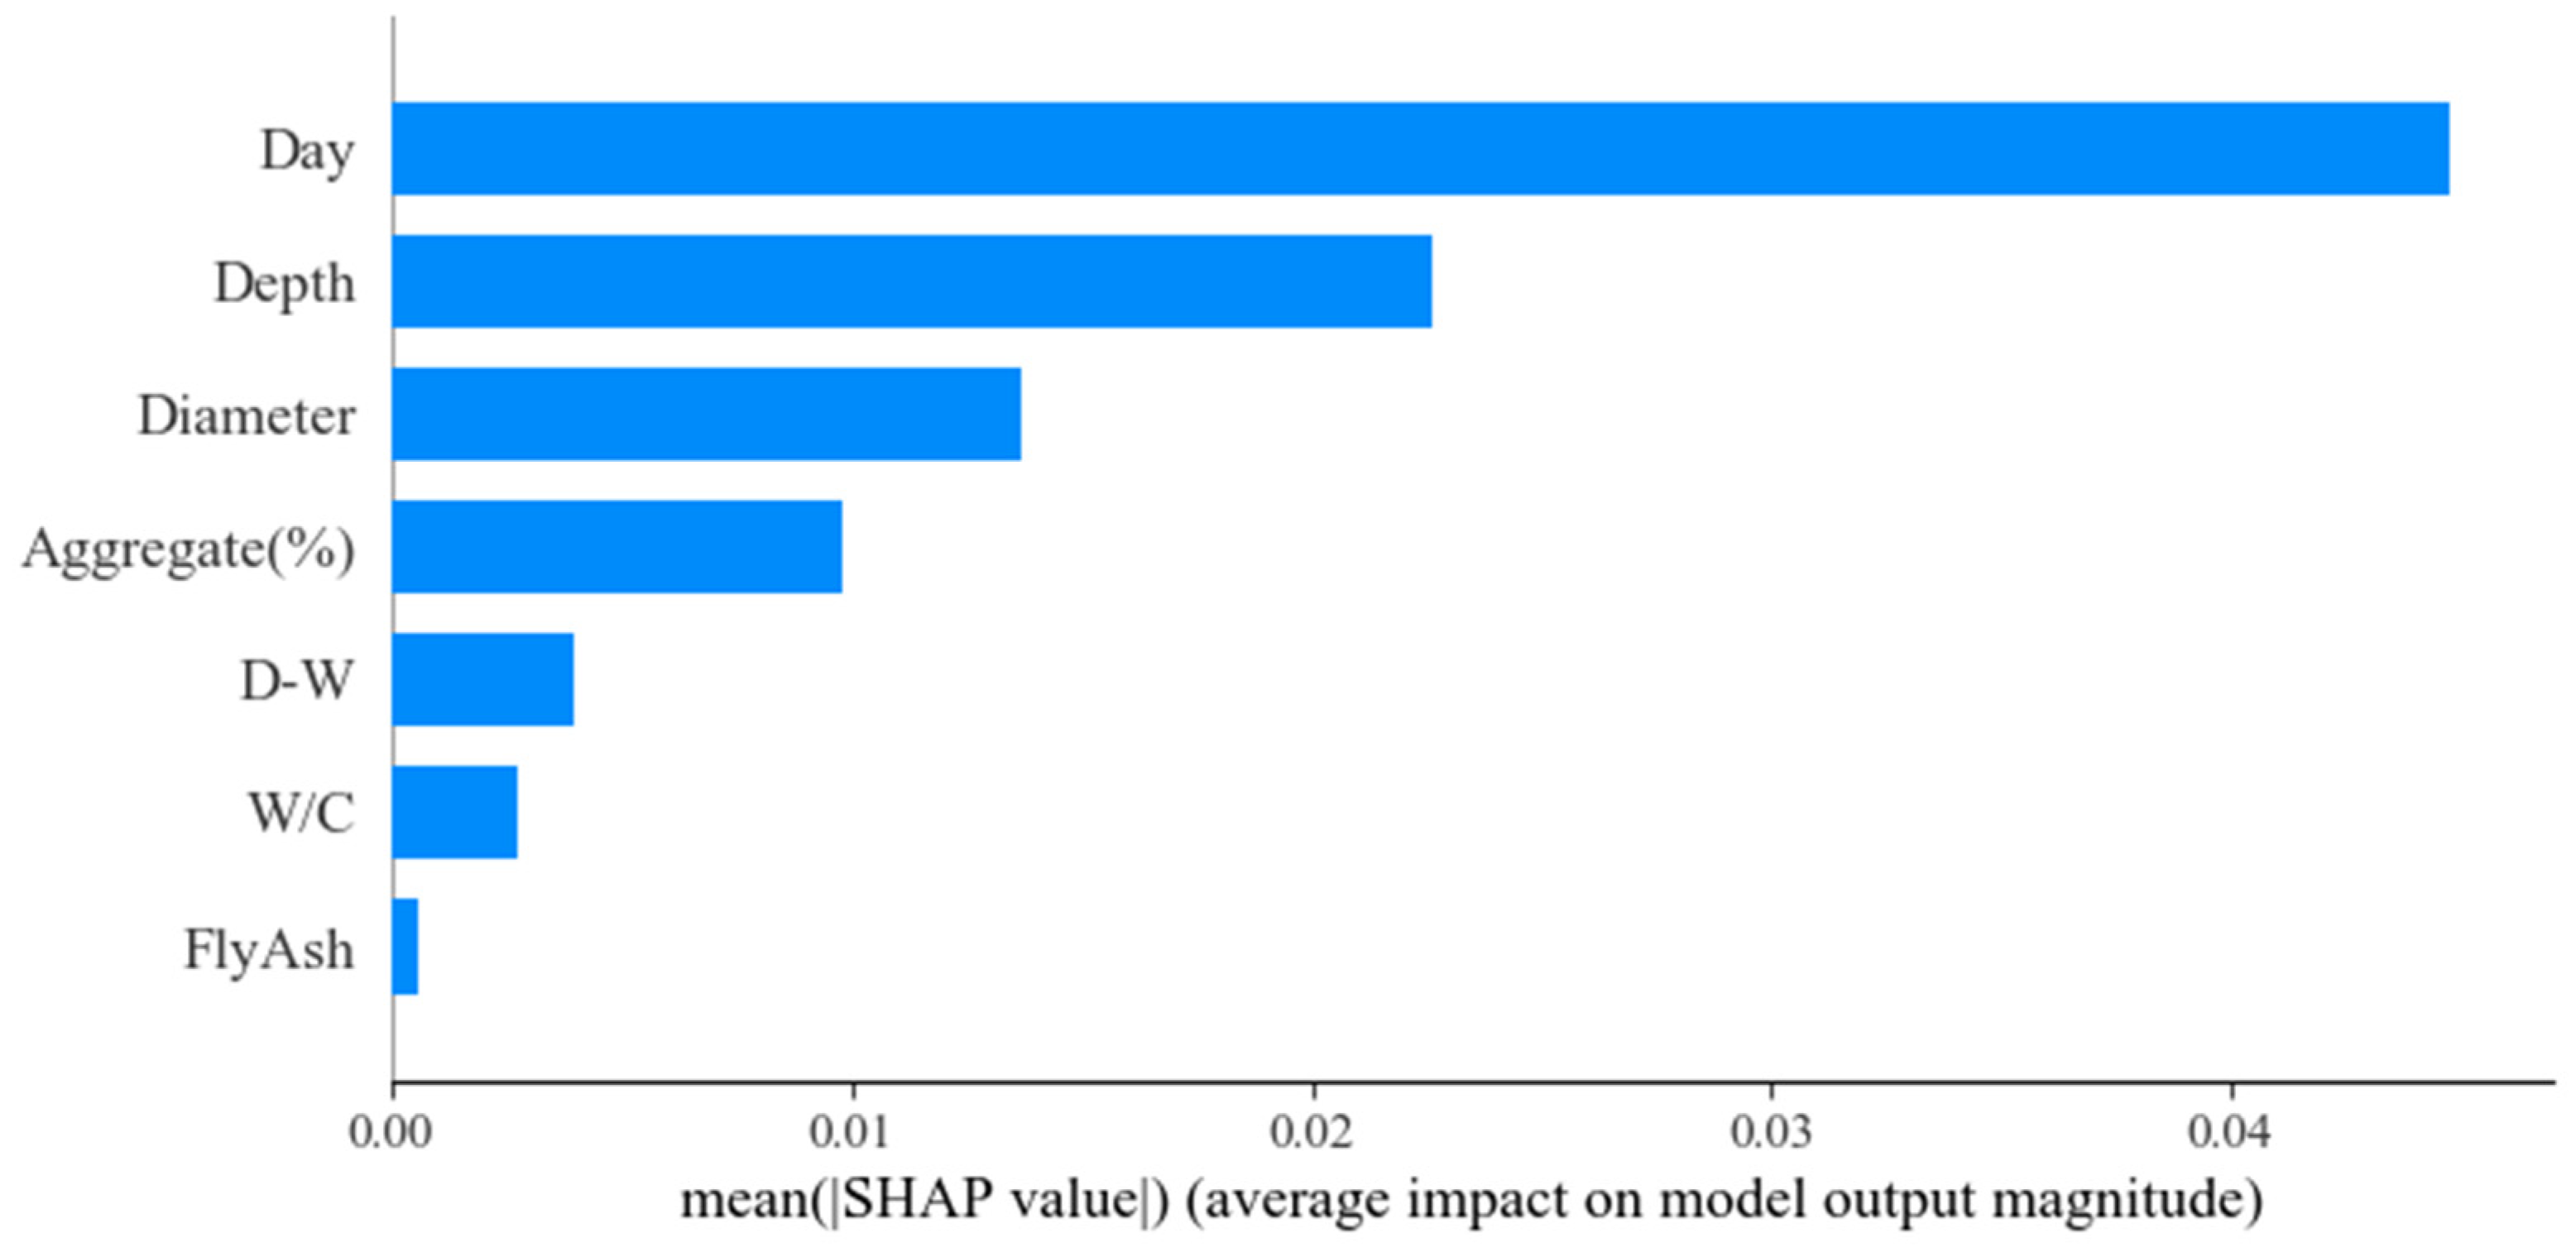
The prediction model established in this study systematically integrates eight key explanatory variables. The global feature importance plot based on the SHAP framework quantitatively visualizes the predictive contribution distribution of each variable to the chloride diffusion coefficient. Descending ranking by mean SHAP values reveals (Figure 7): Day dominates, followed by Depth. Notably, Diameter and Aggregate (%) show similar predictive contributions. The remaining features show relatively minor importance. This analysis confirms the core status of Day, Depth, Aggregate (%) and Diameter as key regulatory factors.
Figure 7.
Feature importance plot of the model.
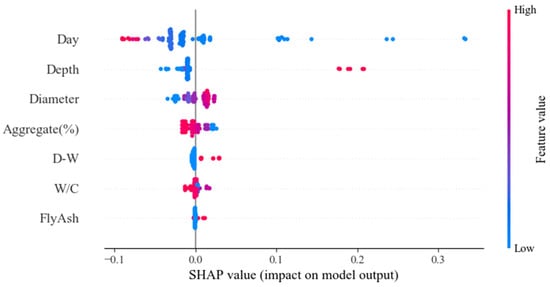
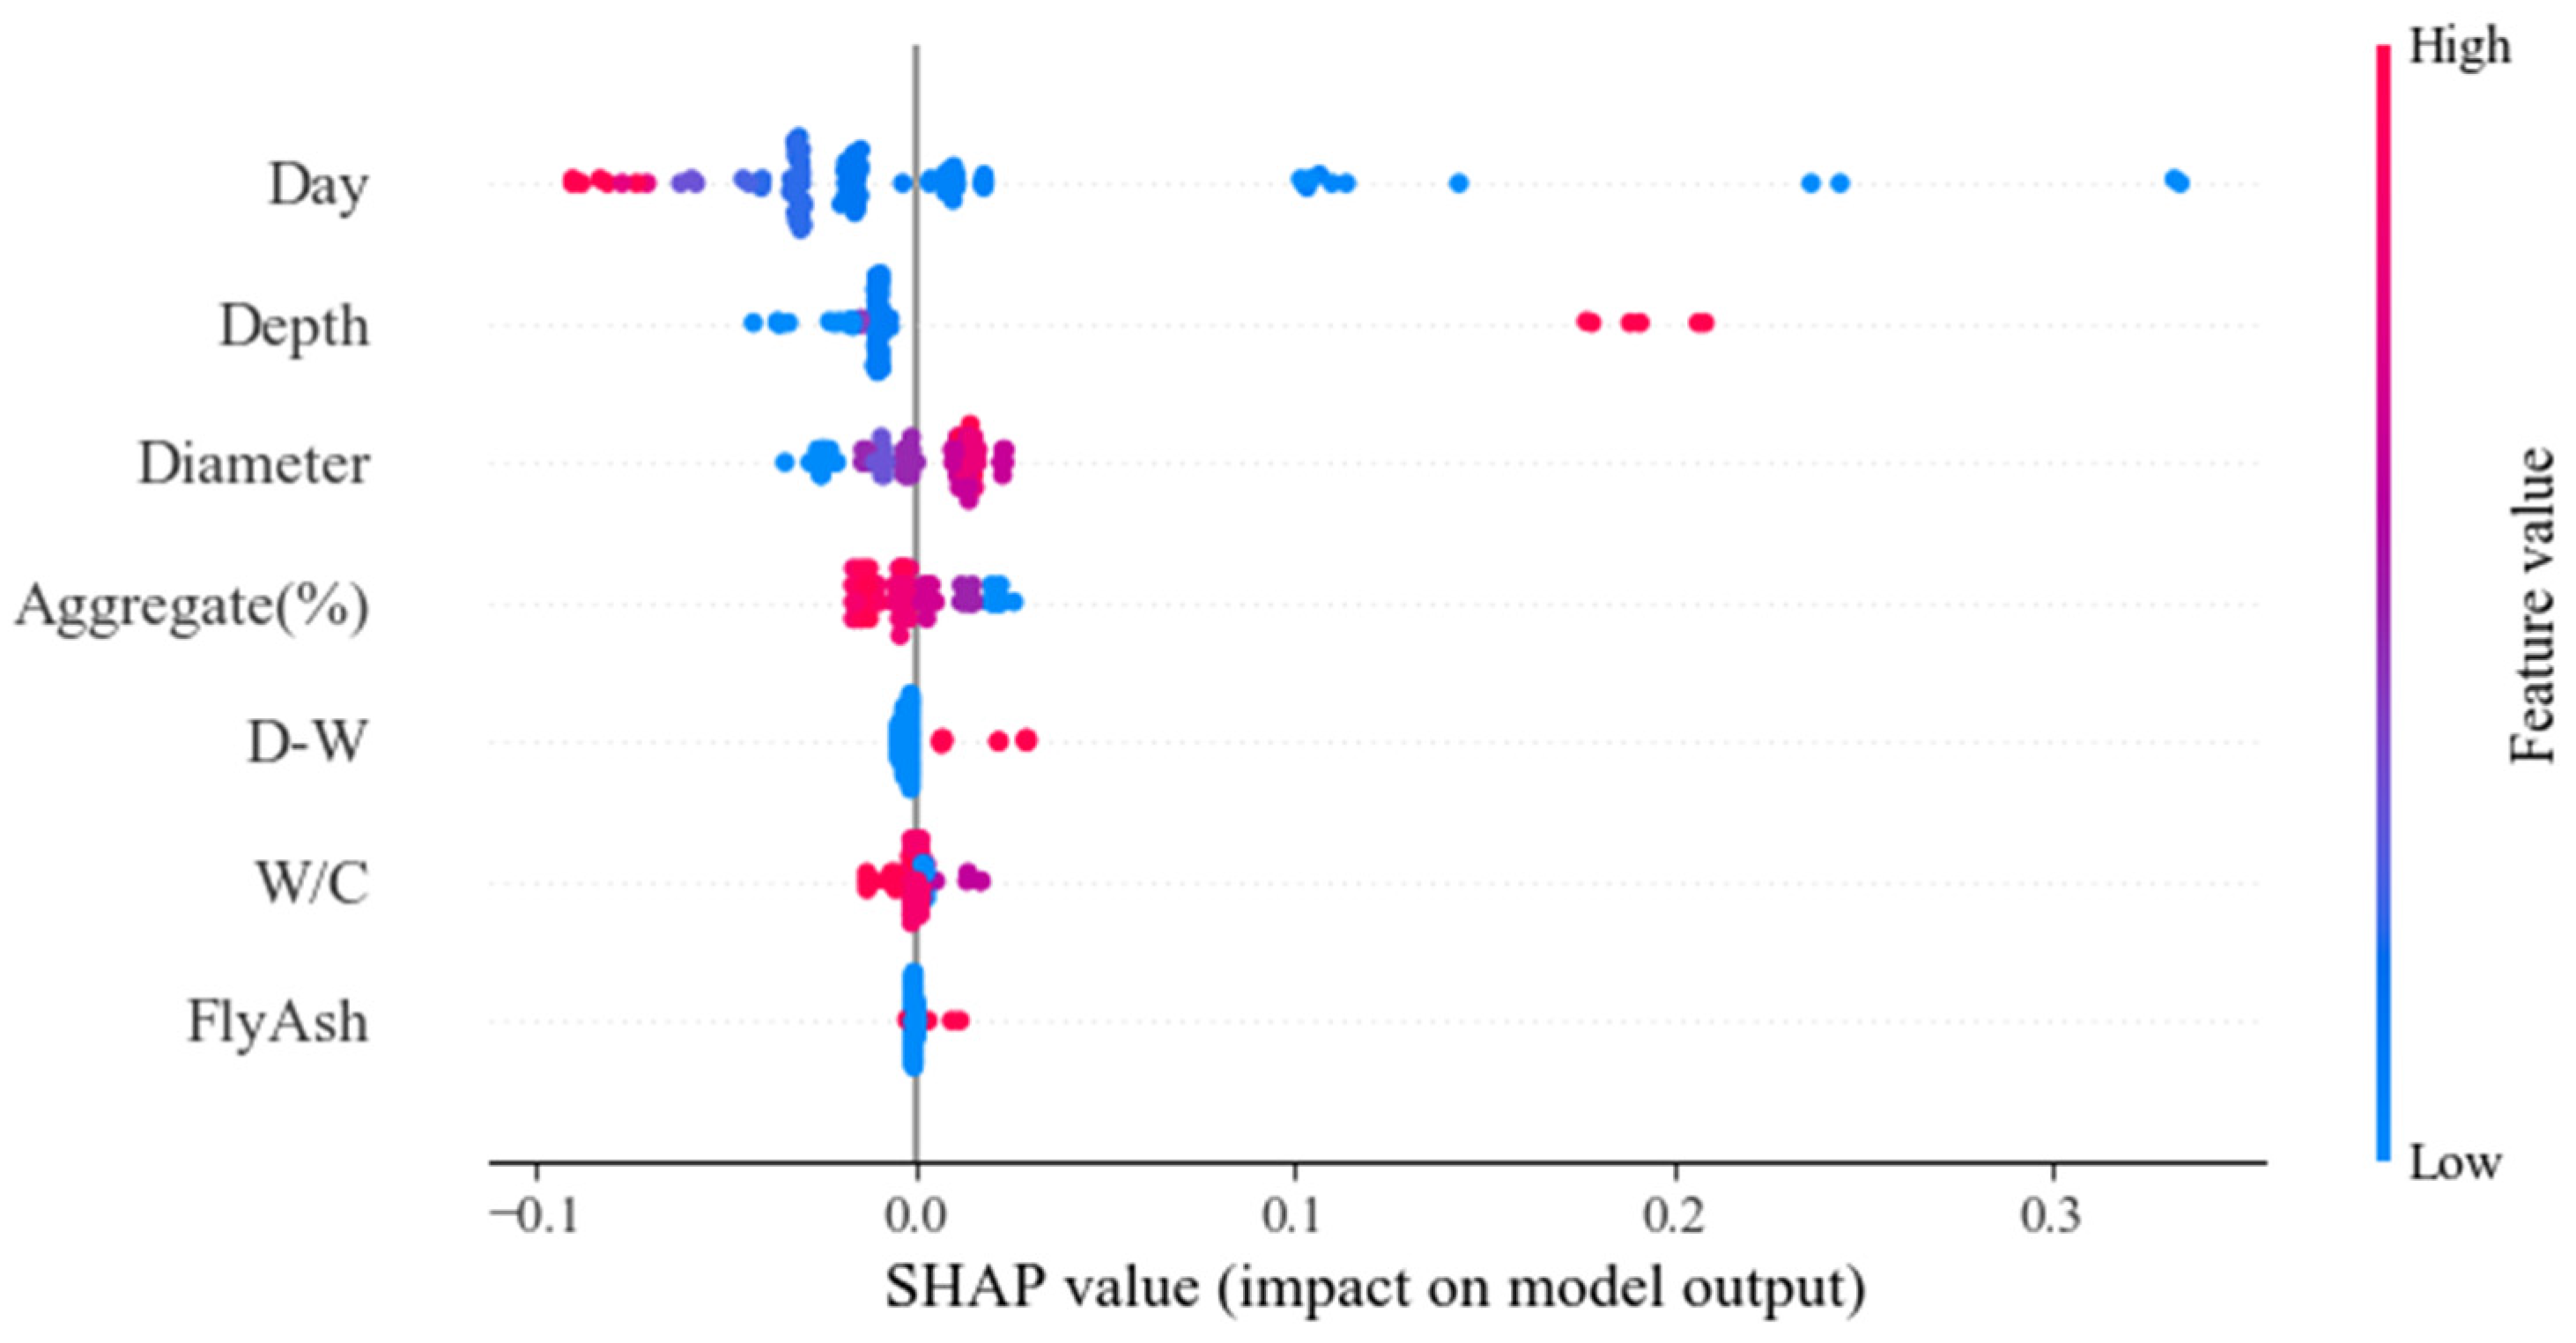
The SHAP beeswarm plot uses color coding to show the influence of feature values on the model output. As shown in Figure 8, the feature importance decreases from top to bottom. The color intensity of each dot represents feature value magnitude, with cool tones (blue) indicating low quantile values and warm tones (red) denoting high quantile values. The coordinate position of each dot reflects its specific contribution to model predictions. Scatter plot analysis reveals both global influence trends and individual contributions of features, providing visual evidence for model interpretability. Following the importance ranking, we sequentially analyze each factor’s mechanistic influence on the apparent chloride diffusion coefficient.
Figure 8.
SHAP summary plot of the model.
The apparent chloride diffusion coefficient shows a significant negative correlation with Day. This phenomenon originates from the time-dependent hydration process in cementitious materials. At the microscale, the continuous reconfiguration of the pore structure by hydration products leads to a systematic reduction in permeability [32]. Moreover, cement hydration products can react with free chloride ions to form insoluble compounds. Experimental observations show that the apparent chloride diffusion coefficient generally decreases over time due to ongoing hydration [33]. The dataset used in this study effectively isolates time-varying interference factors, such as cracking and carbonation, through strict environmental control.
The apparent chloride diffusion coefficient increases with Depth. The Depth corresponds to the concrete cover thickness in reinforced concrete structures. According to Debye–Hückel theory, interionic forces strengthen with concentration, leading to higher diffusion coefficients at lower concentrations. Studies show that free chloride concentration decreases with concrete depth [34,35,36].
Wu et al. prepared concrete specimens with different coarse aggregate volume fractions and found, through analysis of chloride diffusion coefficients, that Aggregate (%) has a positive effect on inhibiting chloride diffusion [37]. As coarse aggregate content increases, chloride transport paths become longer and diffusion time increases accordingly. Therefore, compared to mortar concrete without coarse aggregates, steel corrosion generally occurs earlier.
Based on the study by Bao et al., when the drying–wetting ratio is relatively small, the apparent chloride diffusion coefficient in strain-hardening cementitious composites shows a significant increasing trend with the rise of the drying-wetting ratio [38]. The primary mechanism lies in the prolongation of drying time, which intensifies the evaporation of pore water at the concrete surface, thereby enhancing the internal moisture gradient. This results in a stronger capillary absorption driving force during the subsequent wetting phase. This process markedly strengthens the convection-dominated chloride transport, consequently leading to an increase in the apparent diffusion coefficient.
The W/C is proportional to the apparent chloride diffusion coefficient, with higher ratios enhancing chloride diffusion capability. W/C is a key factor affecting concrete’s internal pore structure, influencing chloride diffusion behavior through pore modification. Reducing W/C optimizes the concrete pore structure and improves chloride penetration resistance. Fly ash, as supplementary cementitious material. promotes chloride binding in concrete, with increasing replacement ratios significantly reducing diffusion coefficients [39].
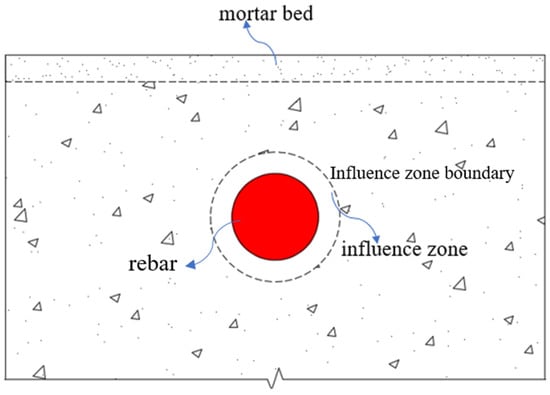
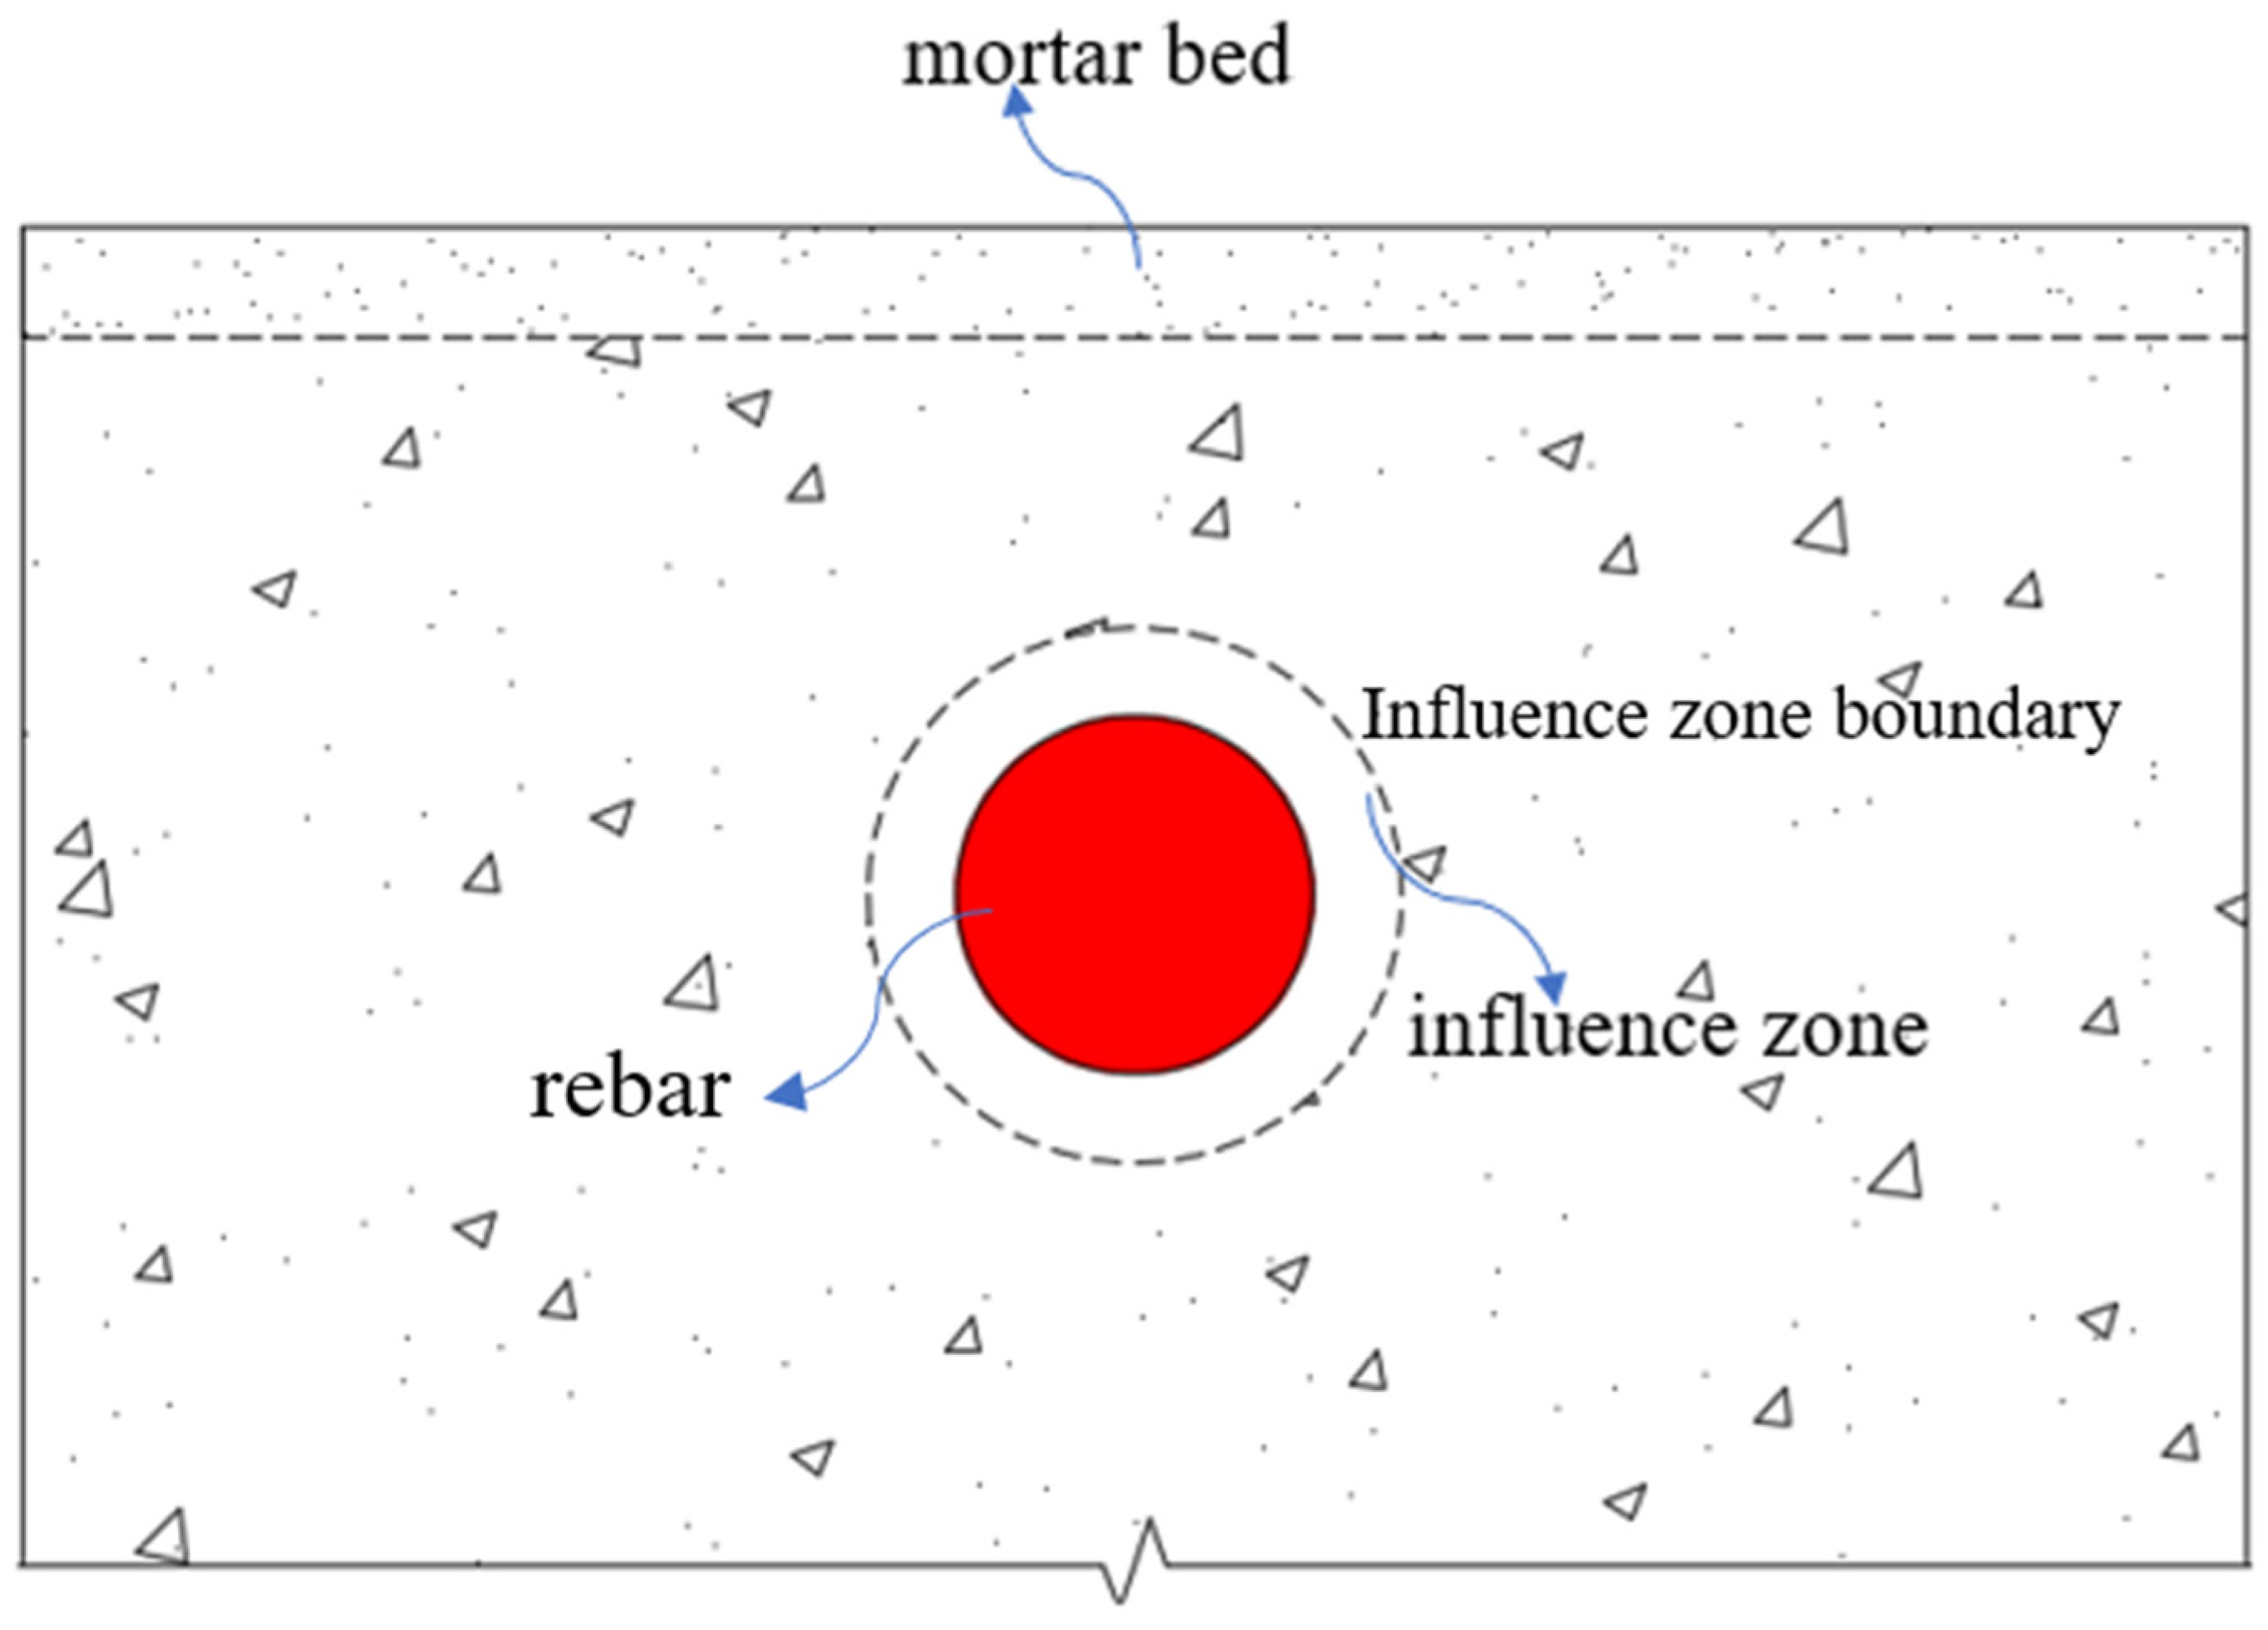
The presence and diameter of steel reinforcement significantly influence apparent chloride diffusion coefficients, and the blocking effect intensifies with increasing diameter. As shown in Figure 8, the influence of reinforcement and its size on apparent chloride diffusion coefficient cannot be ignored. Yu et al. showed that reinforcement changes the distribution of coarse aggregates around it, reducing coarse aggregate volume and increasing mortar volume [40]. Lv found that reinforcement’s influence is mainly within 4 mm, as shown in Figure 9, where the coarse aggregate volume fraction decreases with distance from the reinforcement surface and stabilizes beyond 4 mm [15]. Wang et al. further showed that a larger reinforcement diameter leads to higher chloride content at its surface at the same time [41]. This is due to direct and indirect blocking effects: The indirect effect adjusts the surrounding coarse aggregate content, while direct effect comes from reinforcement’s physical properties (higher density/hardness than mortar), directly blocking chloride diffusion and causing accumulation at the reinforcement apex [42]. Additionally, the steel–concrete interface characteristics cannot be ignored. The literature shows that pore sizes at this interface are larger than those in the aggregate–mortar interface transition zone [43]. Therefore, it can be inferred that the apparent chloride diffusion coefficient at the steel–concrete interface is higher than in bulk concrete.
Figure 9.
Area of influence of the mortar layer and reinforcement.
4.2.2. Local Analysis
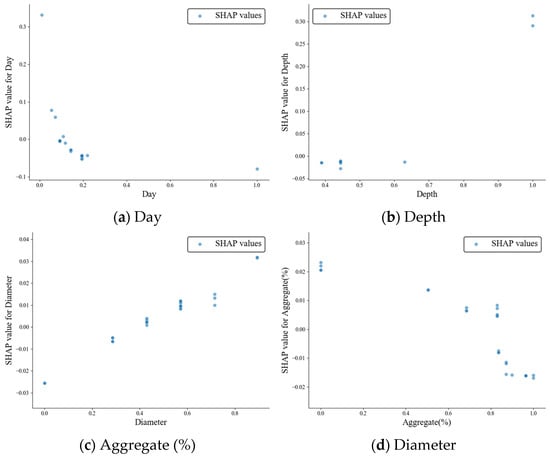
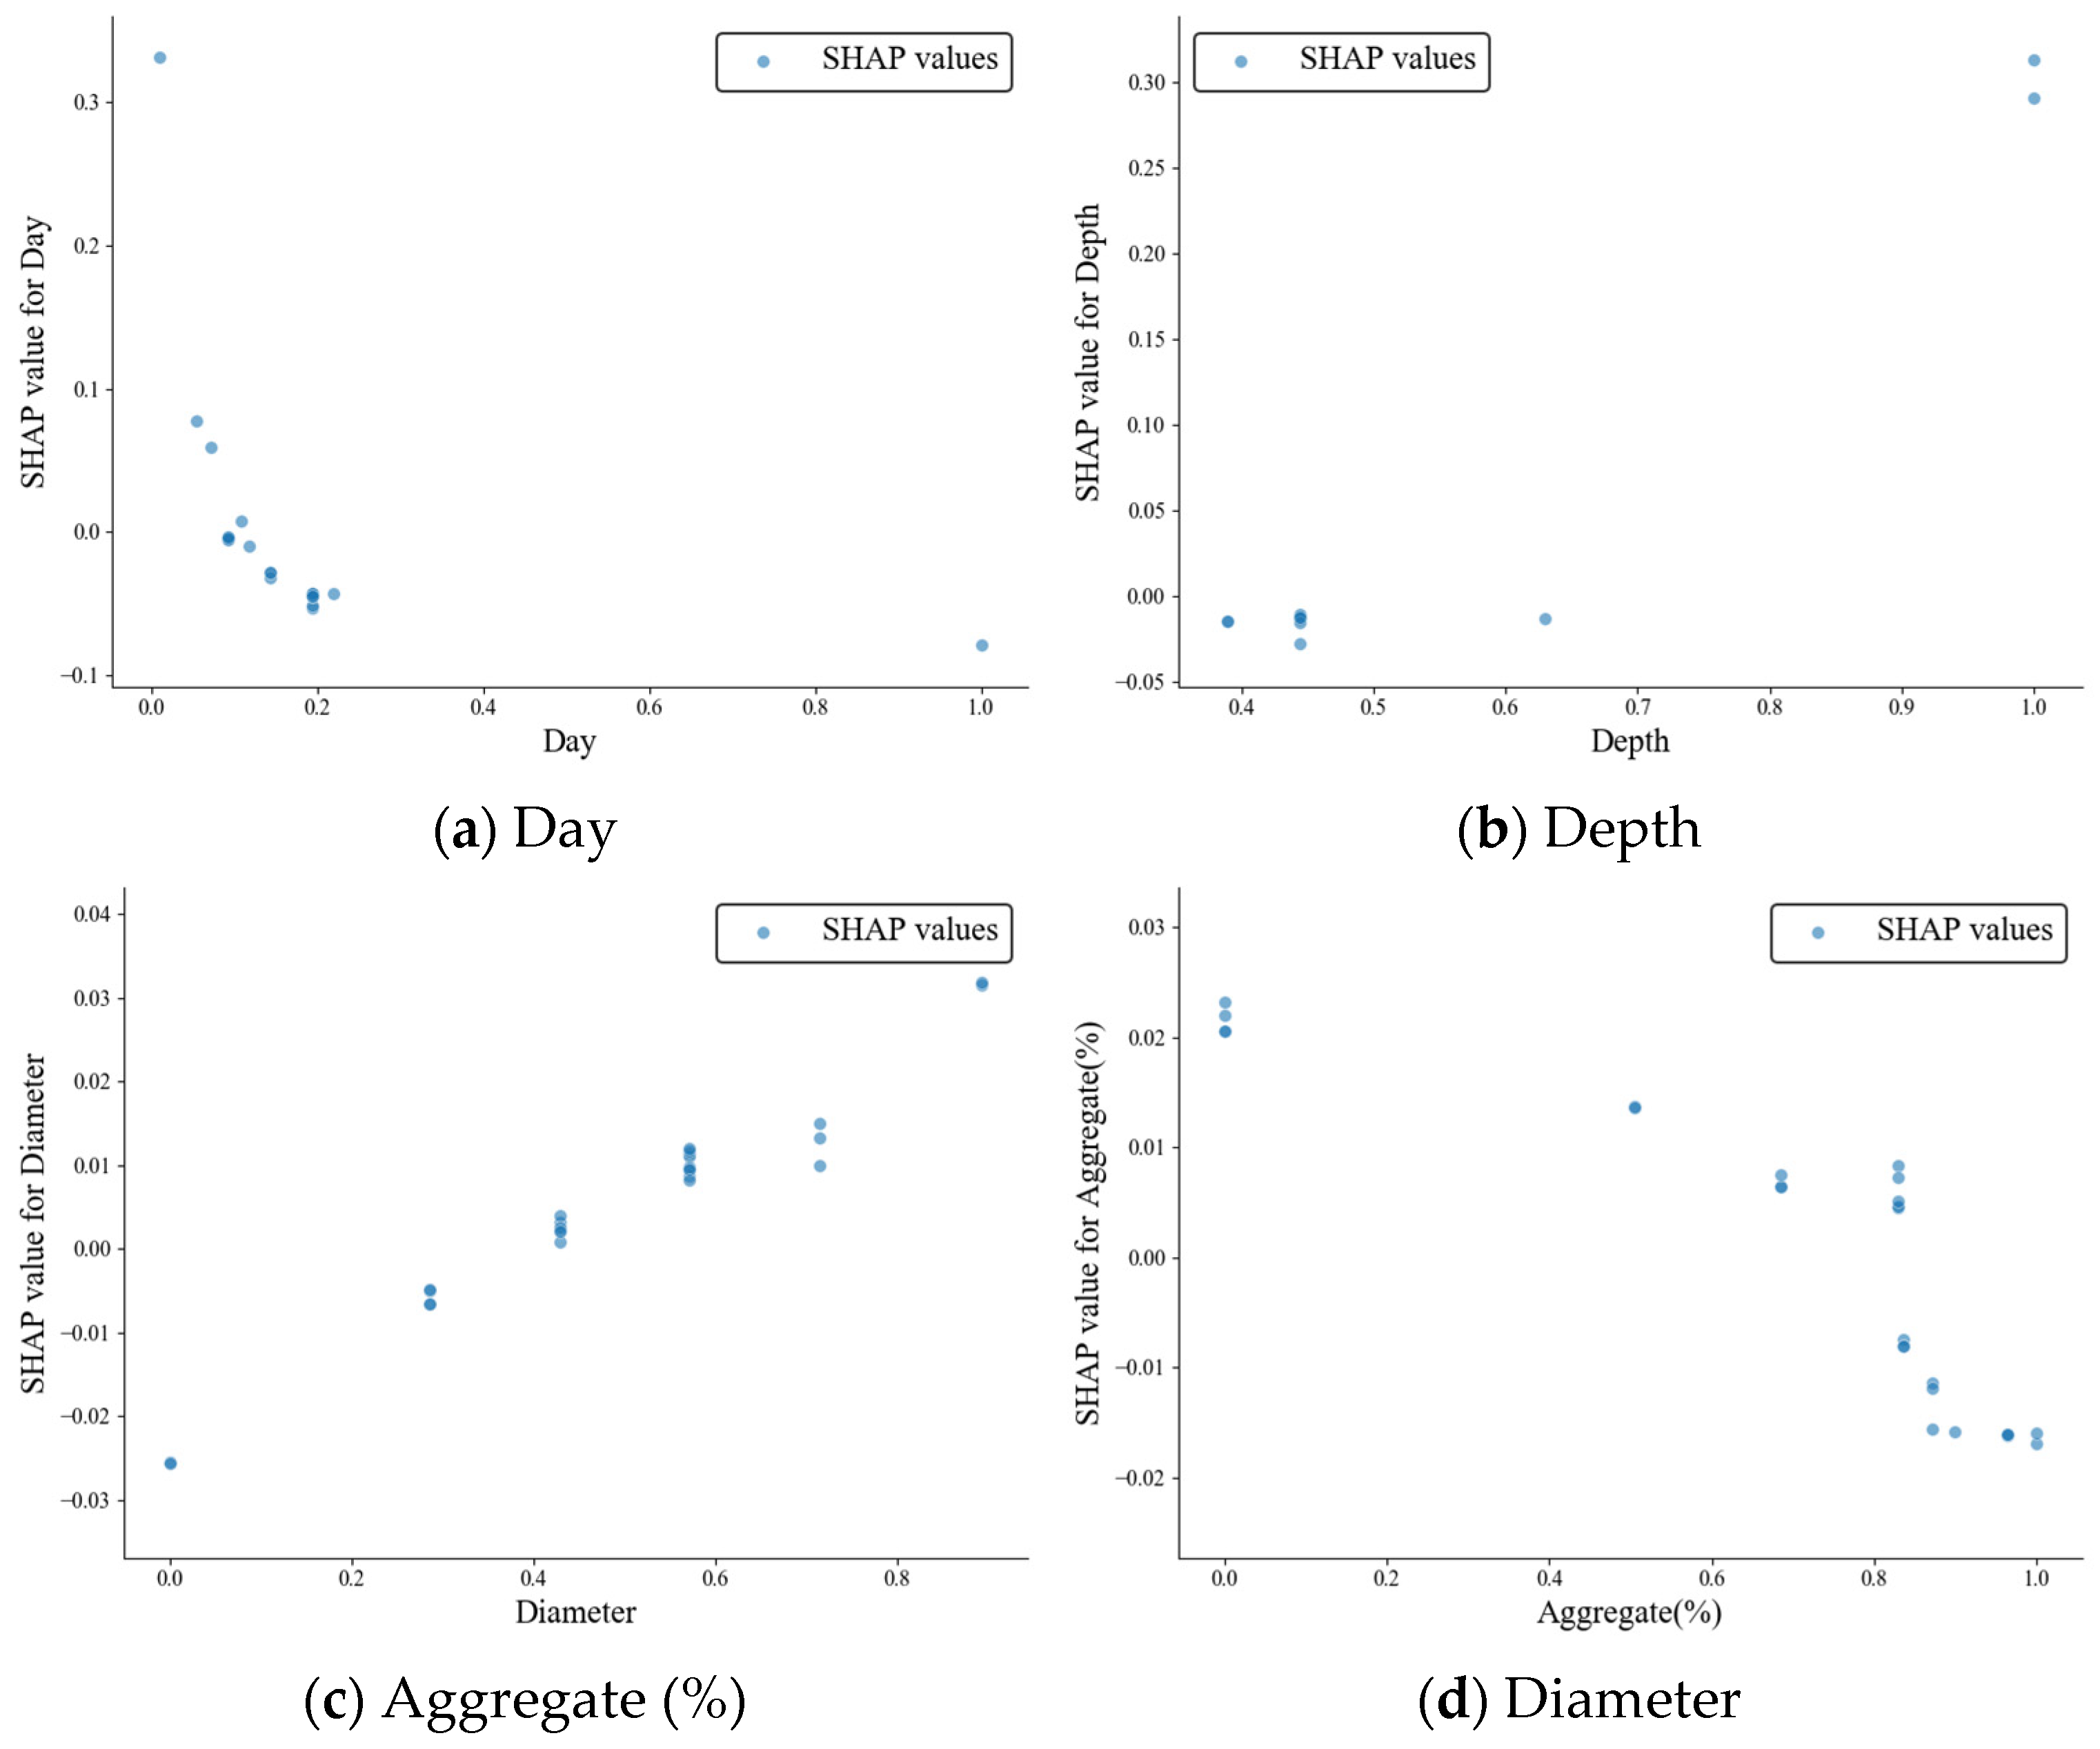
To more systematically evaluate the influence mechanism of single factors on the apparent chloride diffusion coefficient, this study selected the top four key parameters for partial dependence plot (PDP) analysis based on importance analysis results. As shown in Figure 10a, Day has a relatively significant impact on the apparent chloride diffusion coefficient in the initial stage, and its influence intensity decreases over time. This phenomenon can be attributed to the continuous hydration process in cement-based materials. Scrivener et al. showed that pore structures larger than 10 nm in concrete are gradually filled by hydration products, while the hydration rate progressively decreases, ultimately leading to the stabilization of the effect of exposure time on the chloride diffusion coefficient [44]. Regarding the mechanism of Depth shown in Figure 10b, quantitative analysis shows a positive correlation between this parameter and the apparent chloride diffusion coefficient, with the correlation strength increasing asymptotically with Depth. Wang et al. conducted chloride diffusion tests on concrete specimens with different coarse aggregate volume fractions, showing a decreasing trend between Aggregate (%) and the diffusion coefficient [45], which aligns well with our SHAP analysis results in Figure 10c. As quantitatively characterized in Figure 10d, Diameter shows a significant positive correlation with SHAP values at the same time points, following an increasing pattern.
Figure 10.
PDP plots of the four input features utilized in the model.
4.3. Design Analysis
Based on the key influencing factors (top four) screened by preliminary qualitative analysis, this study further adopts individual and pairwise combinations of reinforcement with other features to quantitatively assess the sensitivity of the apparent chloride diffusion coefficient in reinforced concrete using machine learning models and systematically analyze the differences and consistencies in prediction results.
4.3.1. The Influence of Single Factors
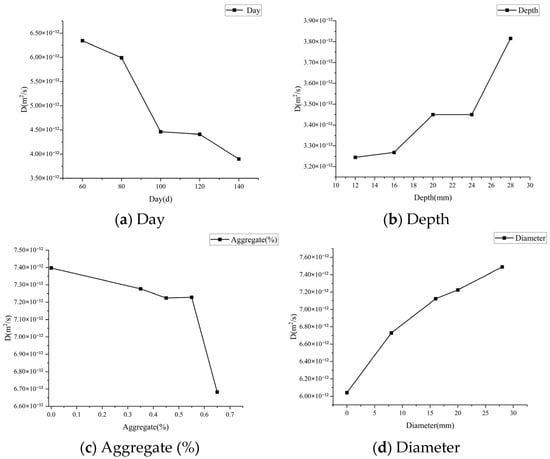
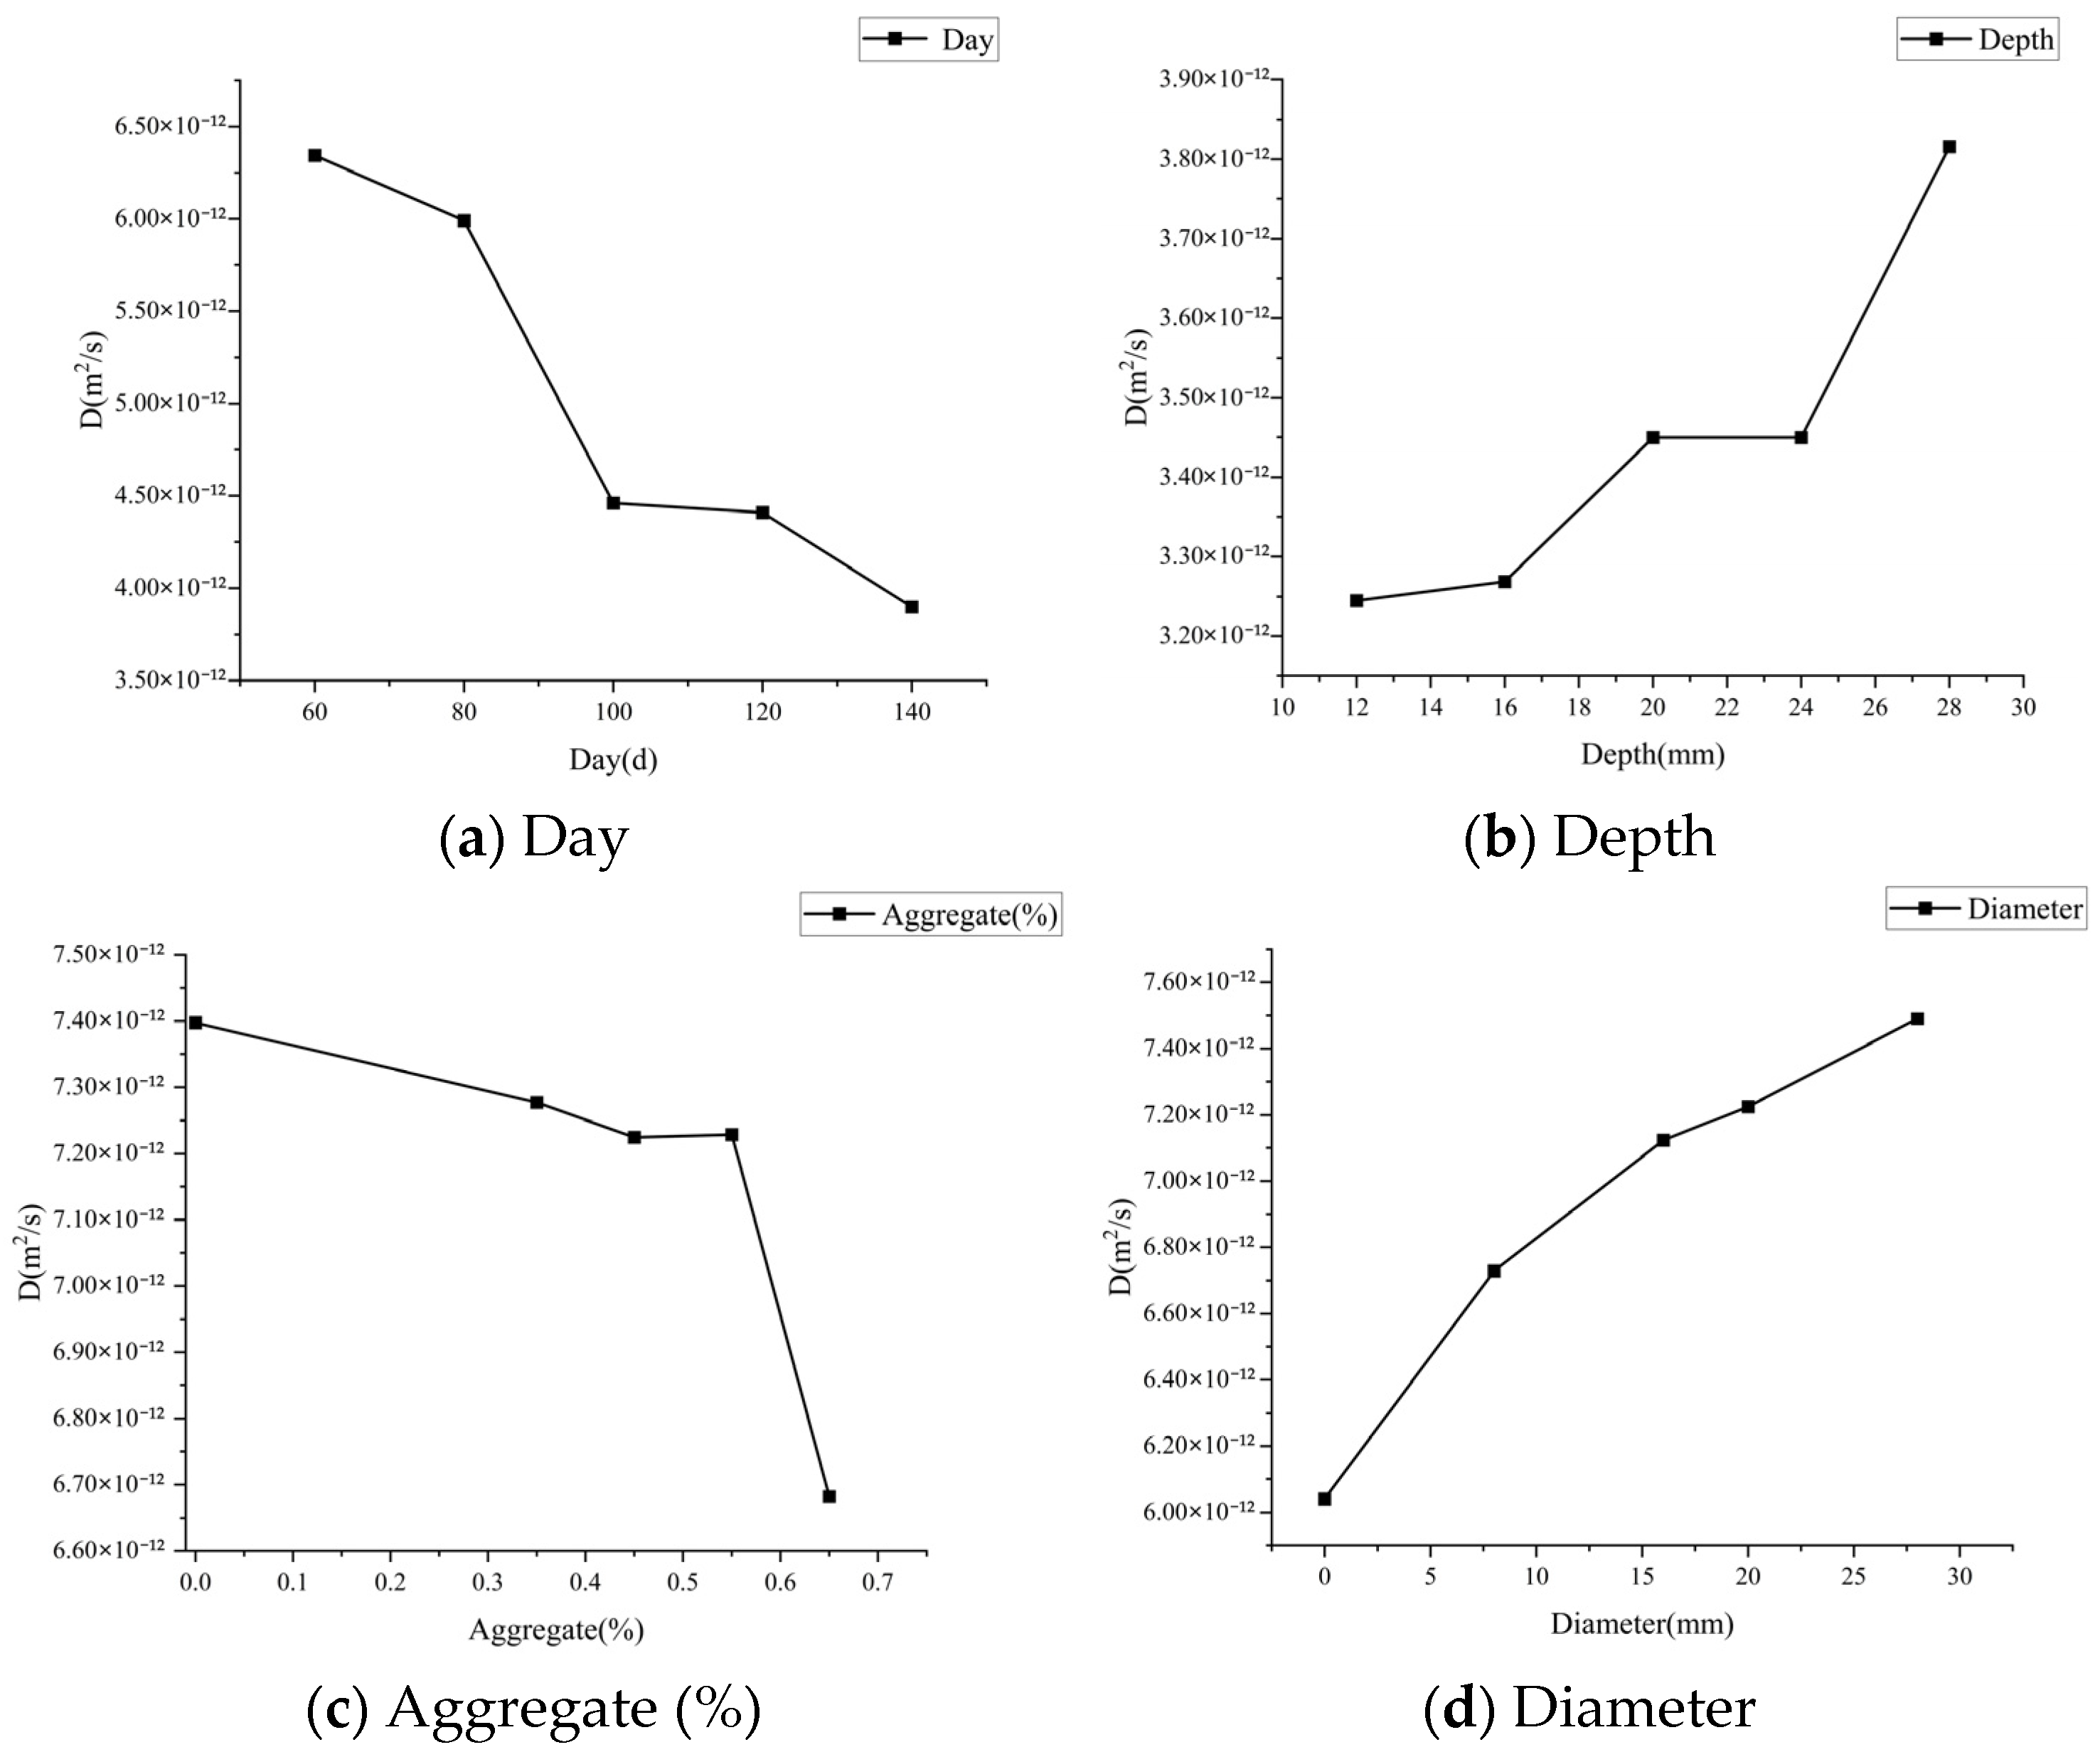
This section analyzes the influence of Day, Depth, Aggregate (%) and Diameter on apparent chloride diffusion coefficient through single-variable progressive analysis while keeping other factors constant. XGBoost was used to predict the apparent chloride diffusion coefficient, quantitatively revealing nonlinear response patterns between control variables and the apparent chloride diffusion coefficient, as shown in Figure 11. Figure 11 shows that with other factors constant, when Day increases from 60 days to 140 days, the apparent chloride diffusion coefficient decreases by about 38%, later stabilizing without fluctuation, consistent with PDP analysis in Figure 10a. Depth and Aggregate (%) show negative correlation trends with the apparent chloride diffusion coefficient. As shown in Figure 11b,c, increased Depth raises the apparent chloride diffusion coefficient by about 17.5%, while higher Aggregate (%) inhibits diffusion. Figure 11d shows that the apparent chloride diffusion coefficient of the specimens without reinforcement is lower than that of the specimens with reinforcement. Moreover, as the reinforcement diameter increases from 0 mm to approximately 28 mm, the apparent diffusion coefficient gradually rises from about 6.05 × 10⁻¹² m2/s to approximately 7.50 × 10⁻¹² m2/s, demonstrating a significant positive correlation and a nonlinear increasing trend.
Figure 11.
Dependence of individual factors on apparent chloride diffusion coefficients.
4.3.2. The Coupled Effects of Steel Bar Diameter and Other Factors
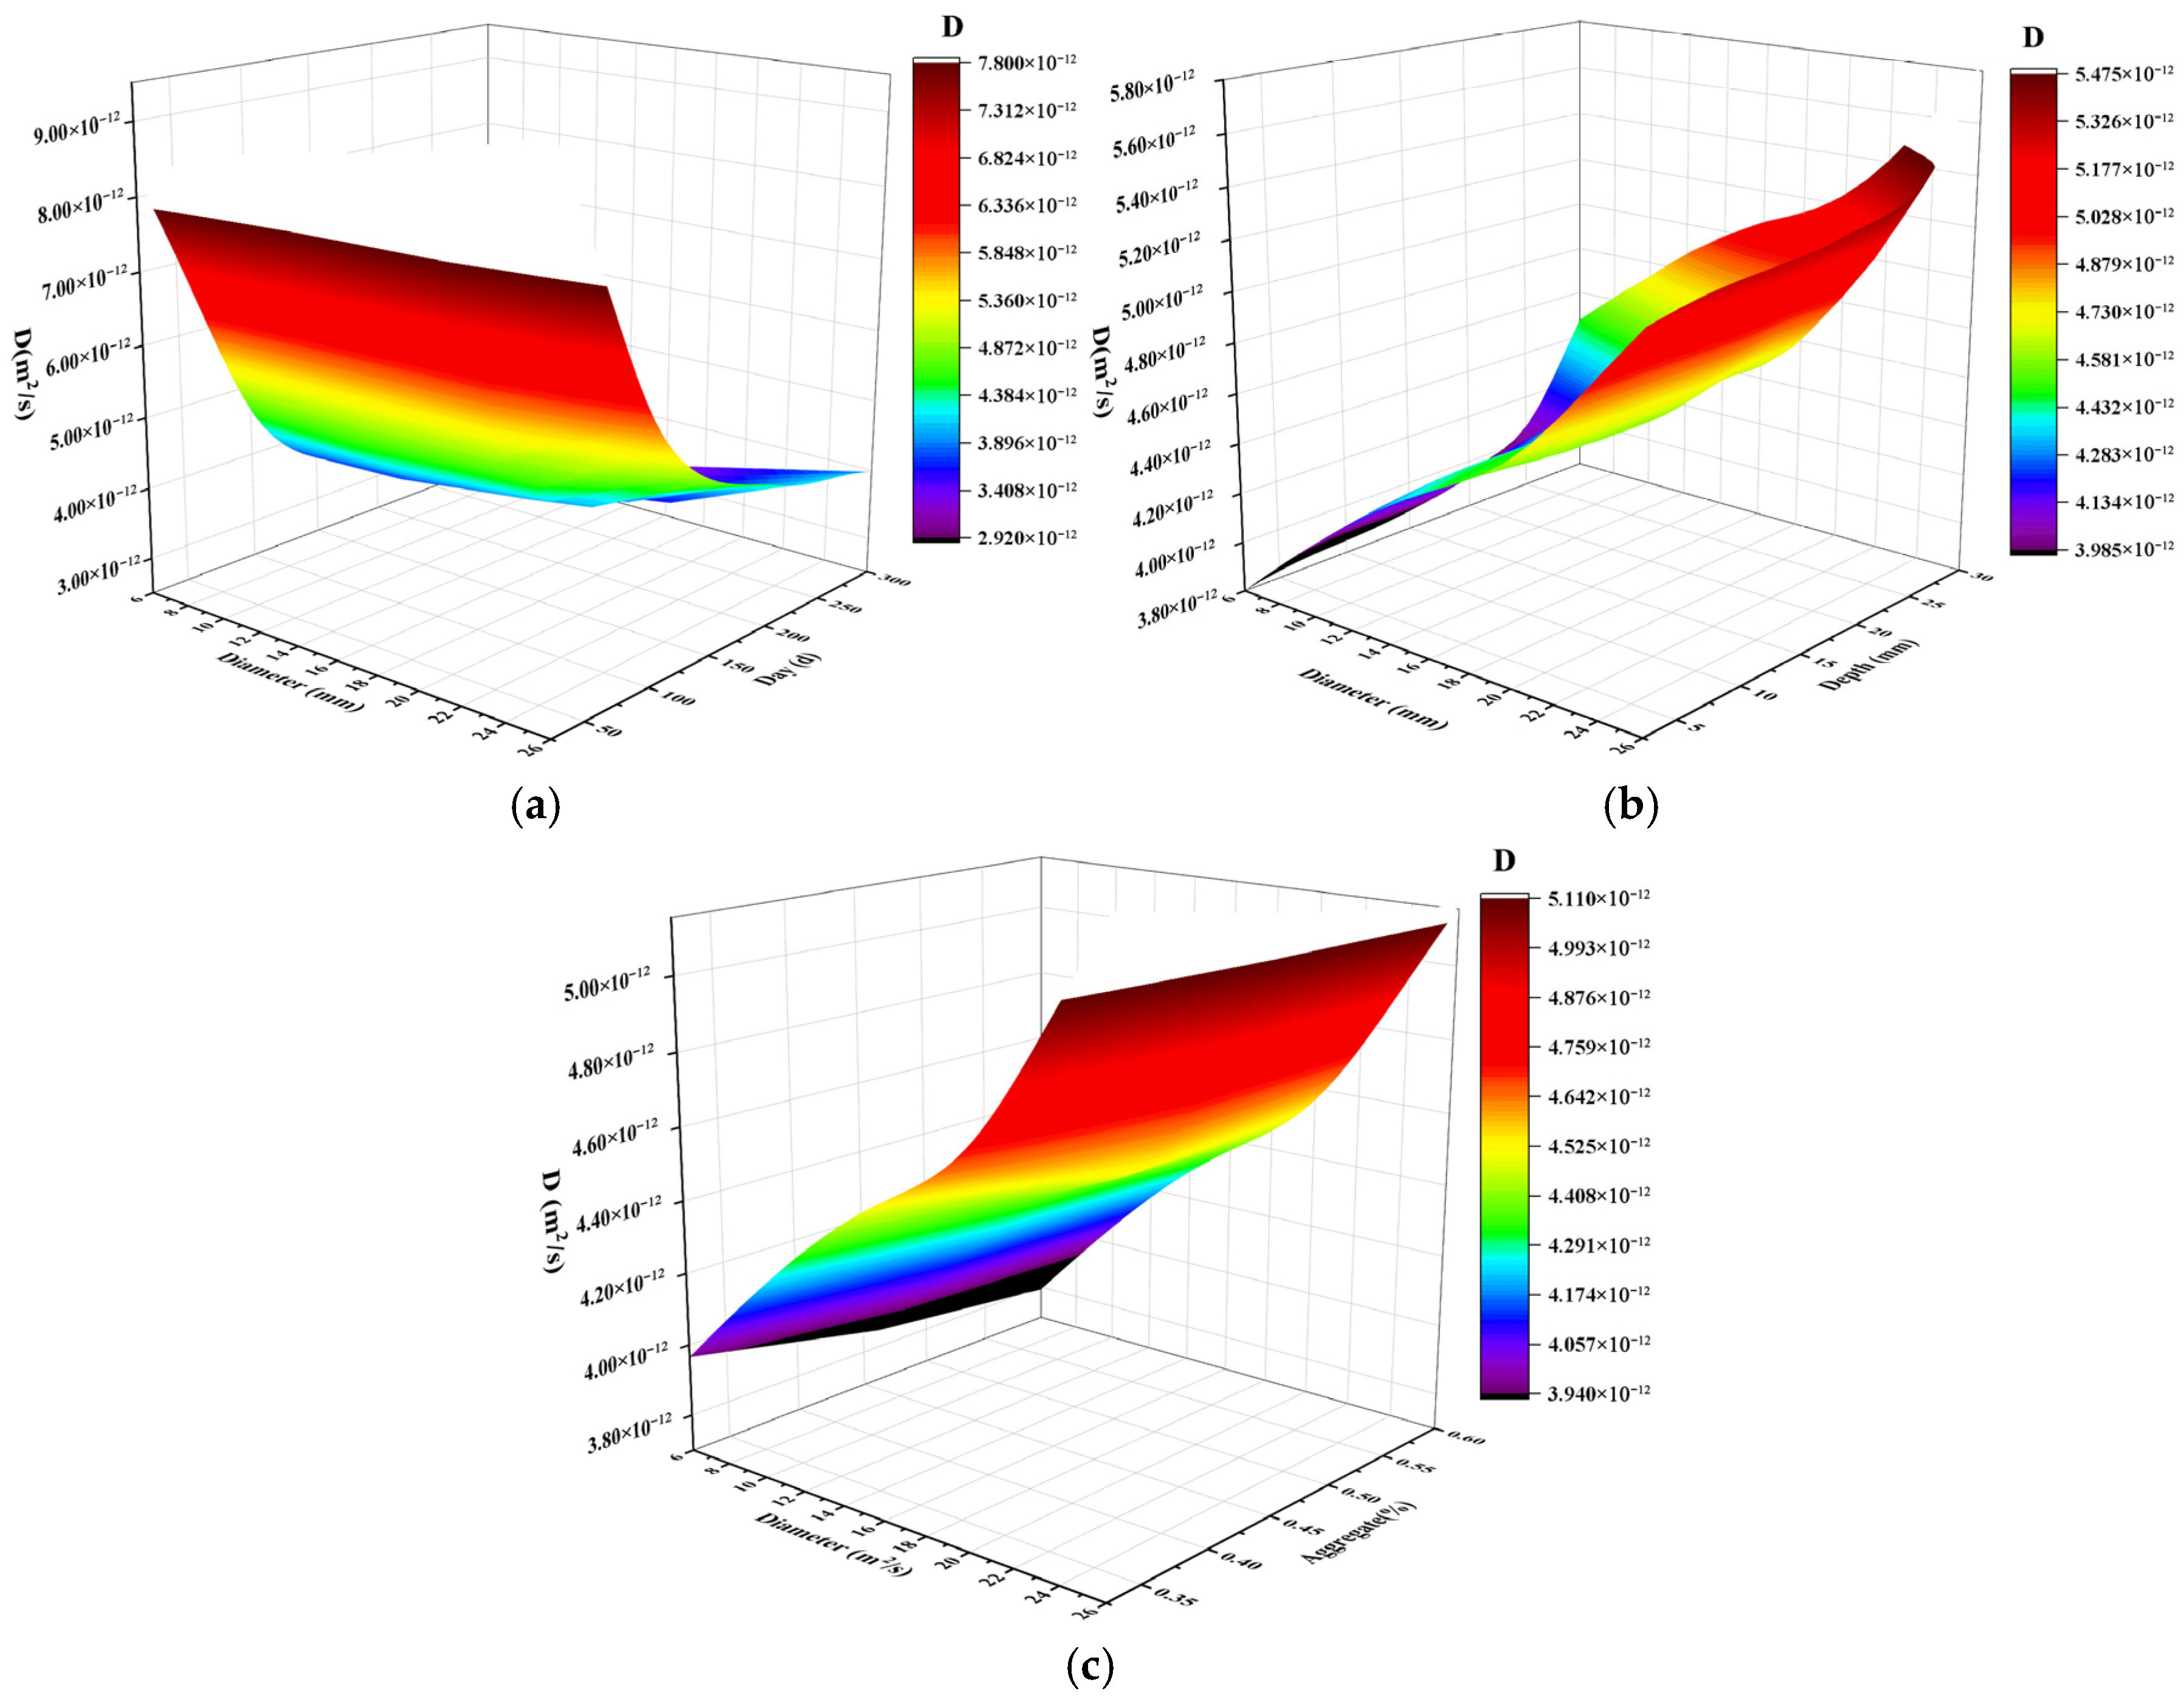
This section selects four factors (Diameter, Day, Depth and Aggregate (%)) for comprehensive prediction. By pairwise combining Diameter with the other three factors in the experimental design, we systematically analyzed their individual and combined effects on the chloride diffusion coefficient. Experimental parameters were set as follows: Diameter increases from 8 mm to 24 mm with 4 mm increment; Day increases from 60 days to 280 days with 20 day increment; Depth increases from 6 mm to 28 mm with 2 mm increment; and Aggregate (%) increases from 35% to 57% with 2% increments.
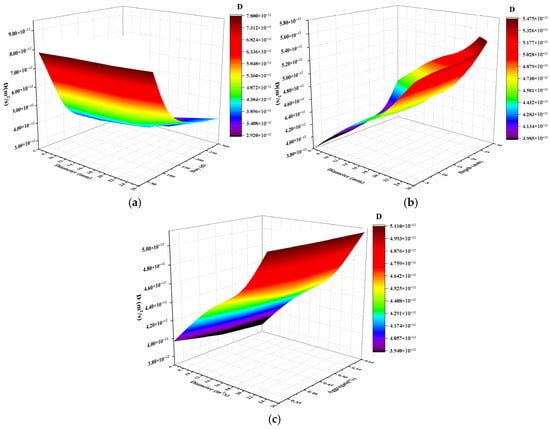
The model prediction results in Figure 12a show the interactive effects of Diameter and Day on the apparent diffusion coefficient. The results show that the apparent chloride diffusion coefficient exhibits a significant decreasing trend with increasing Day and Diameter, with the most pronounced reduction occurring during the early stages, after which the decline gradually stabilizes. As shown in Figure 12b, under the combined influence of Diameter and Depth, the apparent chloride diffusion coefficient exhibits a consistently increasing trend. When the Depth reaches 28 mm with a Diameter of 24 mm, the diffusion coefficient reaches its maximum value of 5.48 × 10⁻¹² m2/s. Conversely, at smaller depth values, the apparent diffusion coefficient remains relatively stable at approximately 3.98 × 10⁻¹² m2/s, representing a relative variation amplitude of 37.7%. As shown in Figure 12c, this study reveals the coupling effect of Diameter and Aggregate (%) on the apparent chloride diffusion coefficient. The results indicate that, under the given experimental conditions, Diameter exhibits a more significant influence: the apparent chloride diffusion coefficient shows a monotonically increasing trend with larger Diameters, and this parameter contributes substantially to the model predictions. In contrast, the effect of Aggregate (%) on the apparent diffusion coefficient is notably less pronounced than that of Diameter.
Figure 12.
Parametric influence of rebar diameter and other factors on the apparent chloride diffusion coefficient. (a) Variation in diffusion coefficient with Day and Diameter. (b) Variation in the diffusion coefficient with depth and Diameter. (c) Variation in diffusion coefficient with Aggregate (%) and Diameter.
5. Finite Element Simulation
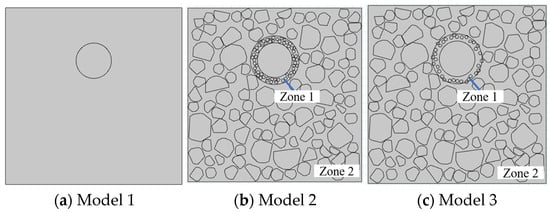
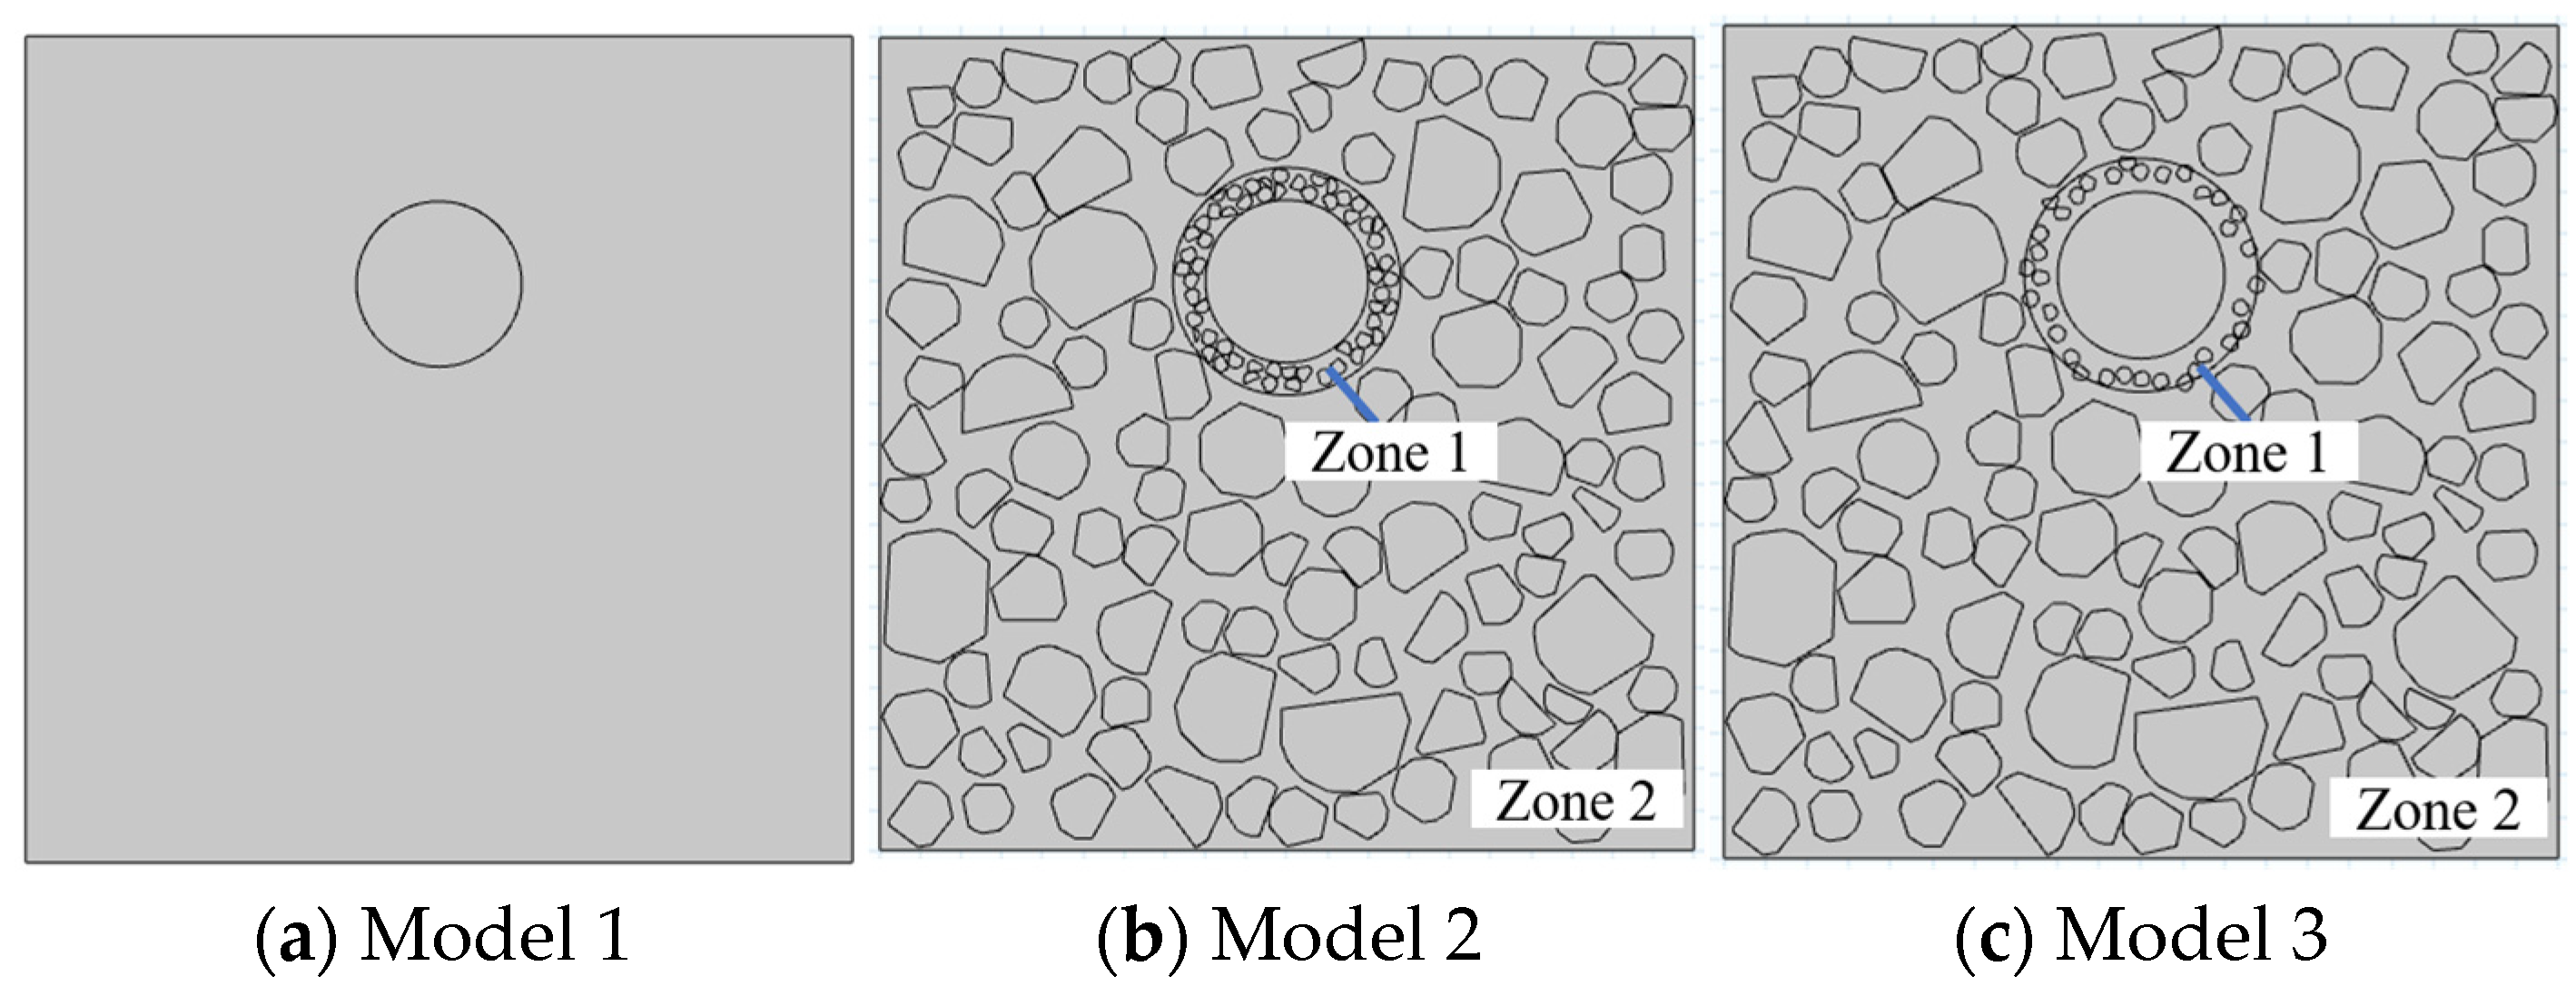
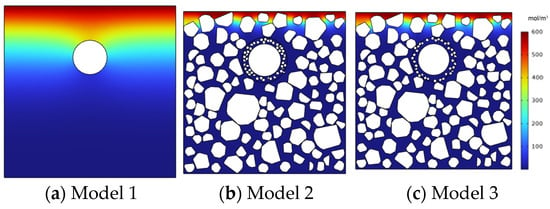
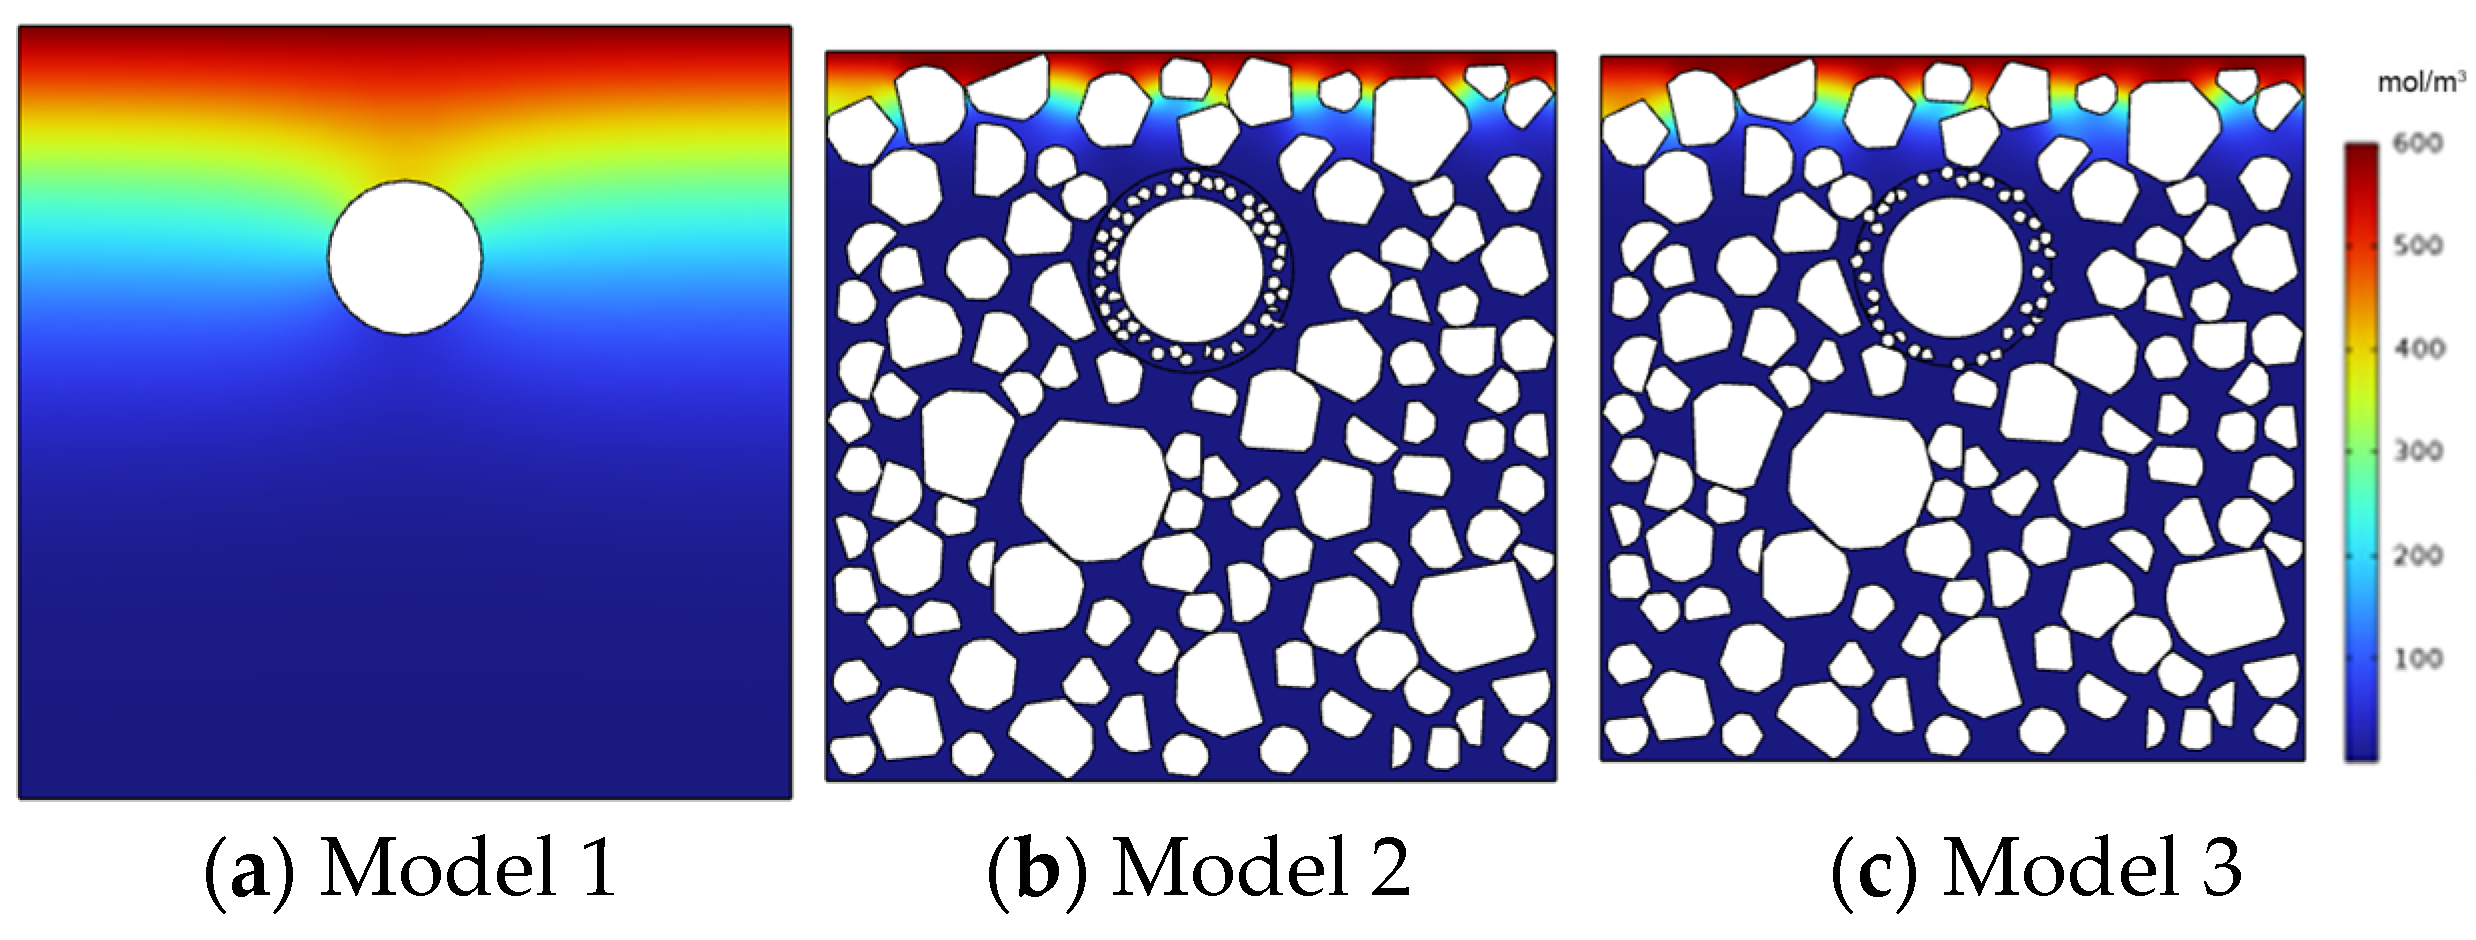
Based on the previously established machine learning prediction model, this study thoroughly investigates the influence mechanism of the coupled effect of steel–aggregate spatial redistribution on chloride ion transport behavior at the steel–mortar interface using finite element analysis for a concrete mix with a water-cement ratio of 0.56. Three comparative models were established: Model 1 (without coarse aggregates), Model 2 (containing 50% aggregate volume fraction without considering the indirect rebar blocking effect), and Model 3 (Containing 50% aggregate volume fraction with consideration of indirect rebar blocking effect).
Model 1 serves as the control group for the other two models, eliminating the influence of coarse aggregates to independently examine the diffusion behavior of chloride ions in the mortar matrix. Model 2 functions as the control group for Model 3, aiming to reveal the impact of the steel–aggregate spatial redistribution coupling effect on the chloride ion concentration distribution at the steel surface.
5.1. Mesoscale Modeling of Reinforced Concrete
The finite element analysis model is constructed through the following steps:
- (1)
- A 100 × 100 mm2 cubic numerical model was adopted, with 20 mm reinforcing bars and 20 mm concrete cover thickness.
- (2)
- Model 1 had 0% aggregate volume fraction. Zone 2 in both Model 2 and Model 3 has identical coarse aggregate size and quantity. Zone 1 of Model 2 incorporates more coarse aggregates than Model 3 to better demonstrate the indirect blocking effect of reinforcement.
- (3)
- The mortar matrix was modeled as an isotropic homogeneous medium, with polygonal coarse aggregates randomly distributed according to Fuller’s ideal gradation curve. In mesoscale simulation, both coarse aggregates and rebars were considered denser than the mortar phase; thus, chloride ions could only transport around rather than through these two phases.
- (4)
- A 4 mm radius annular region centered on the rebar was defined as the influence zone (Zone 1), with the remainder as Zone 2.
- (5)
- Aggregate sizes in Zone 2 ranged from 5 to 15 mm, while Zone 1 was limited to 1 mm. Aggregates in both zones were randomly distributed, except in Model 3 where Zone 1 aggregate content increased progressively with distance from the rebar.
- (6)
- The architectures of the three proposed models are illustrated in Figure 13.Figure 13. FE model.
Initial chloride concentration was set at C0 = 0 mol/m3, with 600 mol/m3 NaCl solution applied at the top boundary and zero-flux conditions on the other three sides. Using the controlled variable method, Section 3’s machine learning model predicted: Model 1 Dm = 4.69 × 10⁻¹² m2/s, Model 2 Da = 3.56 × 10⁻¹² m2/s, and Model 3 Dz1 = 4.40 × 10⁻¹² m2/s.
5.2. Chloride Ion Concentration Distribution in Reinforced Concrete Model
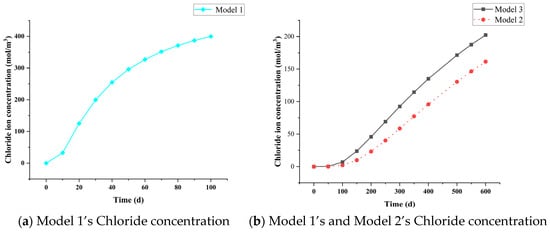
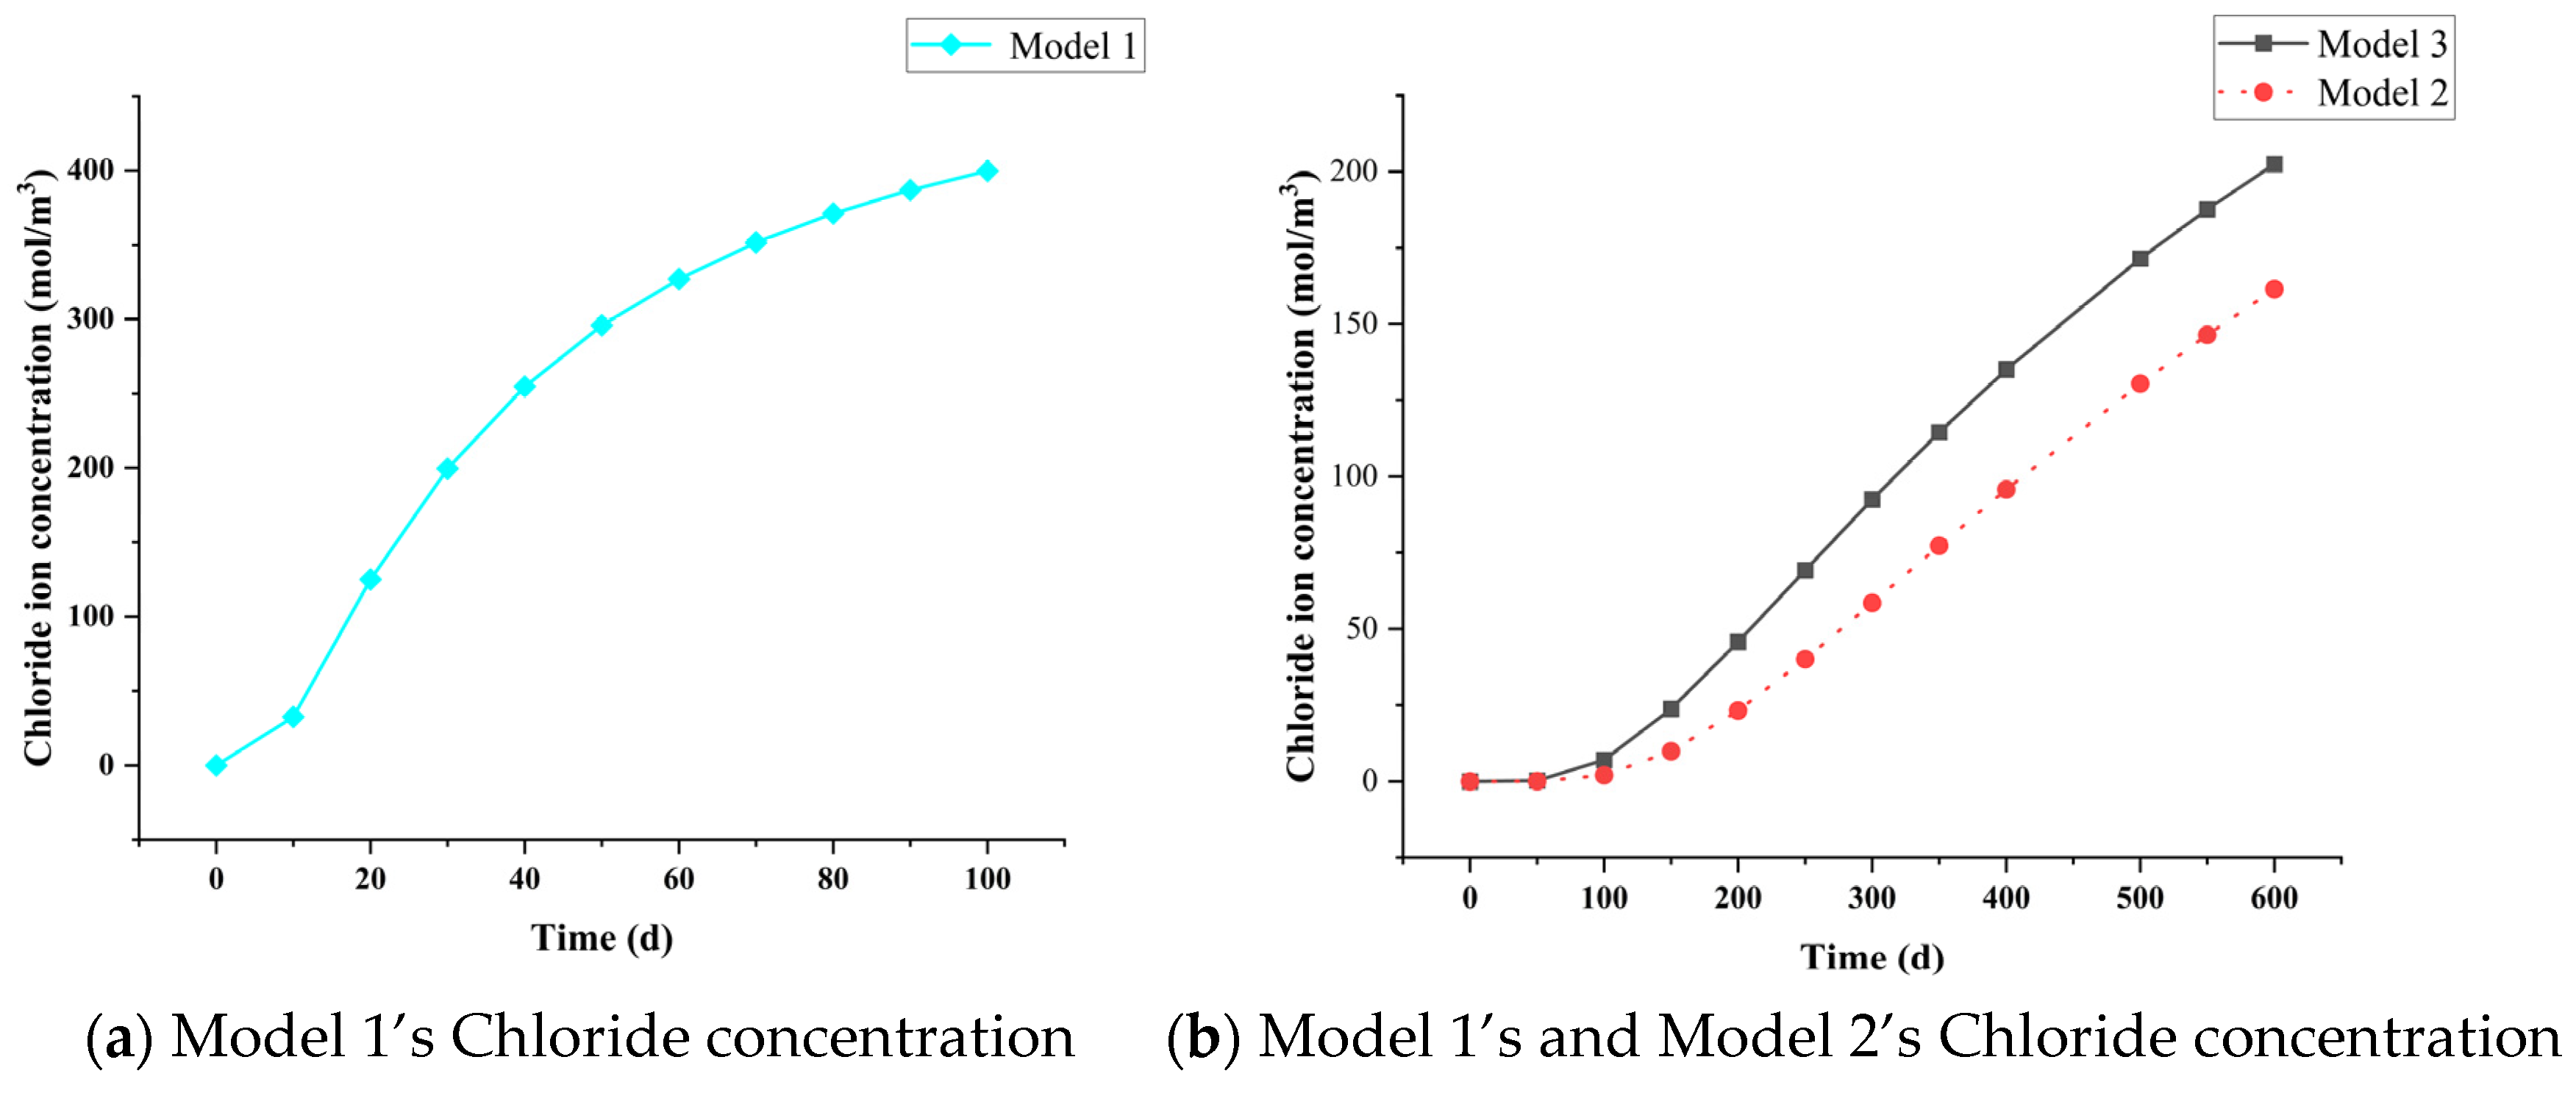
Using the three models as case studies, Figure 14 presents the contour maps of chloride ion concentration distribution during the 600 day simulation period in reinforced concrete structures. In the legend, red corresponds to peak chloride concentration, while blue indicates the minimum values. All three models exhibit decaying chloride concentration gradients with increasing depth, with spatial distributions showing higher concentrations at the upper rebar surface than at other regions. After concrete casting, rebars remain in a passive state, with a dense passive film forming on their surfaces. Sustained chloride attack disrupts the passive film when reaching critical threshold concentrations, initiating corrosion that causes rebar cross-section loss and progressive structural deterioration [46]. Previous analysis suggests depassivation initiates preferentially at the upper surface where chloride concentrations peak. Figure 15 reveals significant differences in peak chloride concentrations at the top rebar surfaces among the three models. Model 1 shows the highest vertex concentrations due to the absence of obstruction from coarse aggregates; the chloride ion concentration in Model 1 at 100 days already significantly exceeds that in Models 2 and 3 at 600 days, reaching 400 mol/m3, followed by Model 3, with Model 2 exhibiting the lowest values. Model 1 demonstrates the earliest concentration growth due to aggregate obstruction effects that prolong chloride migration paths in Models 2 and 3. Models 2 and 3 maintain low surface concentrations before 100 days, followed by marked escalation. At 600 days, Model 2’s maximum concentration is 41.02 mol/m3 lower than Model 3’s. This numerical study reveals that conventional approaches neglecting the indirect blocking effect of reinforcement tend to underestimate corrosion initiation time in RC structures, potentially leading to erroneous durability life predictions that compromise the scientific rigor and accuracy of engineering design and maintenance decisions.
Figure 14.
Chloride concentration contour plot of models.
Figure 15.
Temporal variation in chloride concentration at the vertex of upper rebar surface.
5.3. Chloride Diffusion Analysis for Varying Rebar Diameters
Following the comparative analysis of three models, this study further investigates the chloride concentration distribution characteristics at the bottom surfaces of reinforced concrete members with varying diameters. To ensure methodological consistency, three chloride diffusion coefficients corresponding to different diameters were selected from the dataset while keeping all other parameters constant, as presented in Table 4.
Table 4.
Chloride diffusion coefficients for varying diameters.
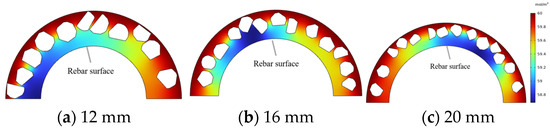
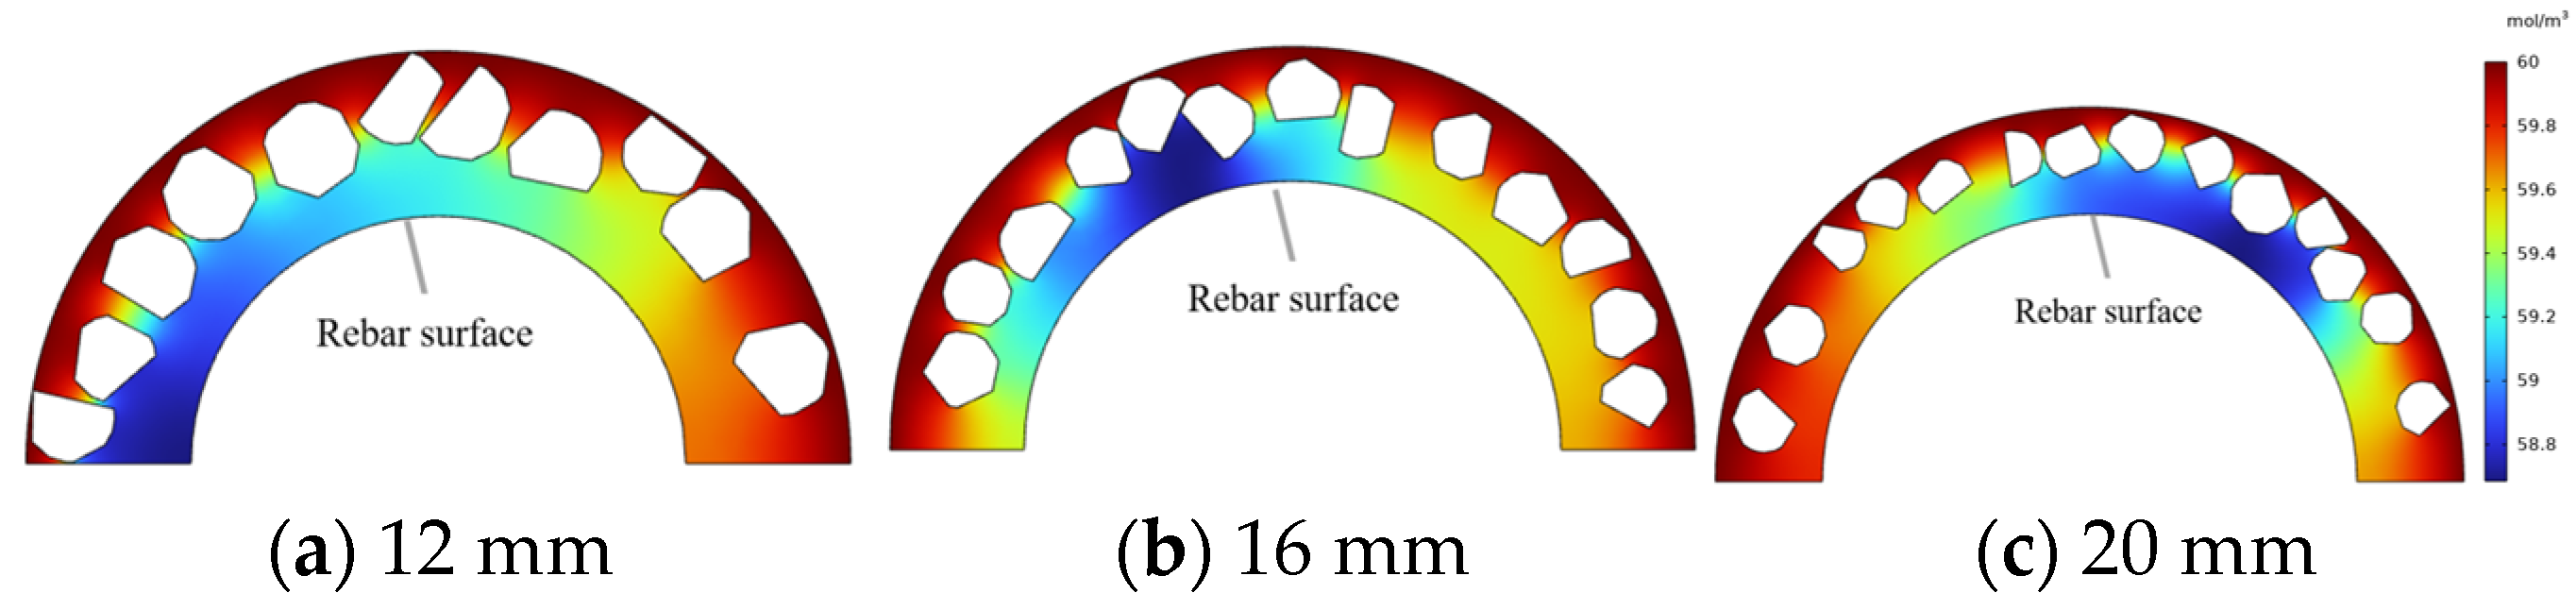
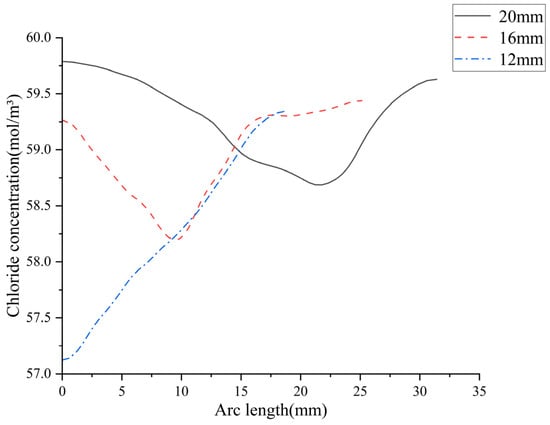
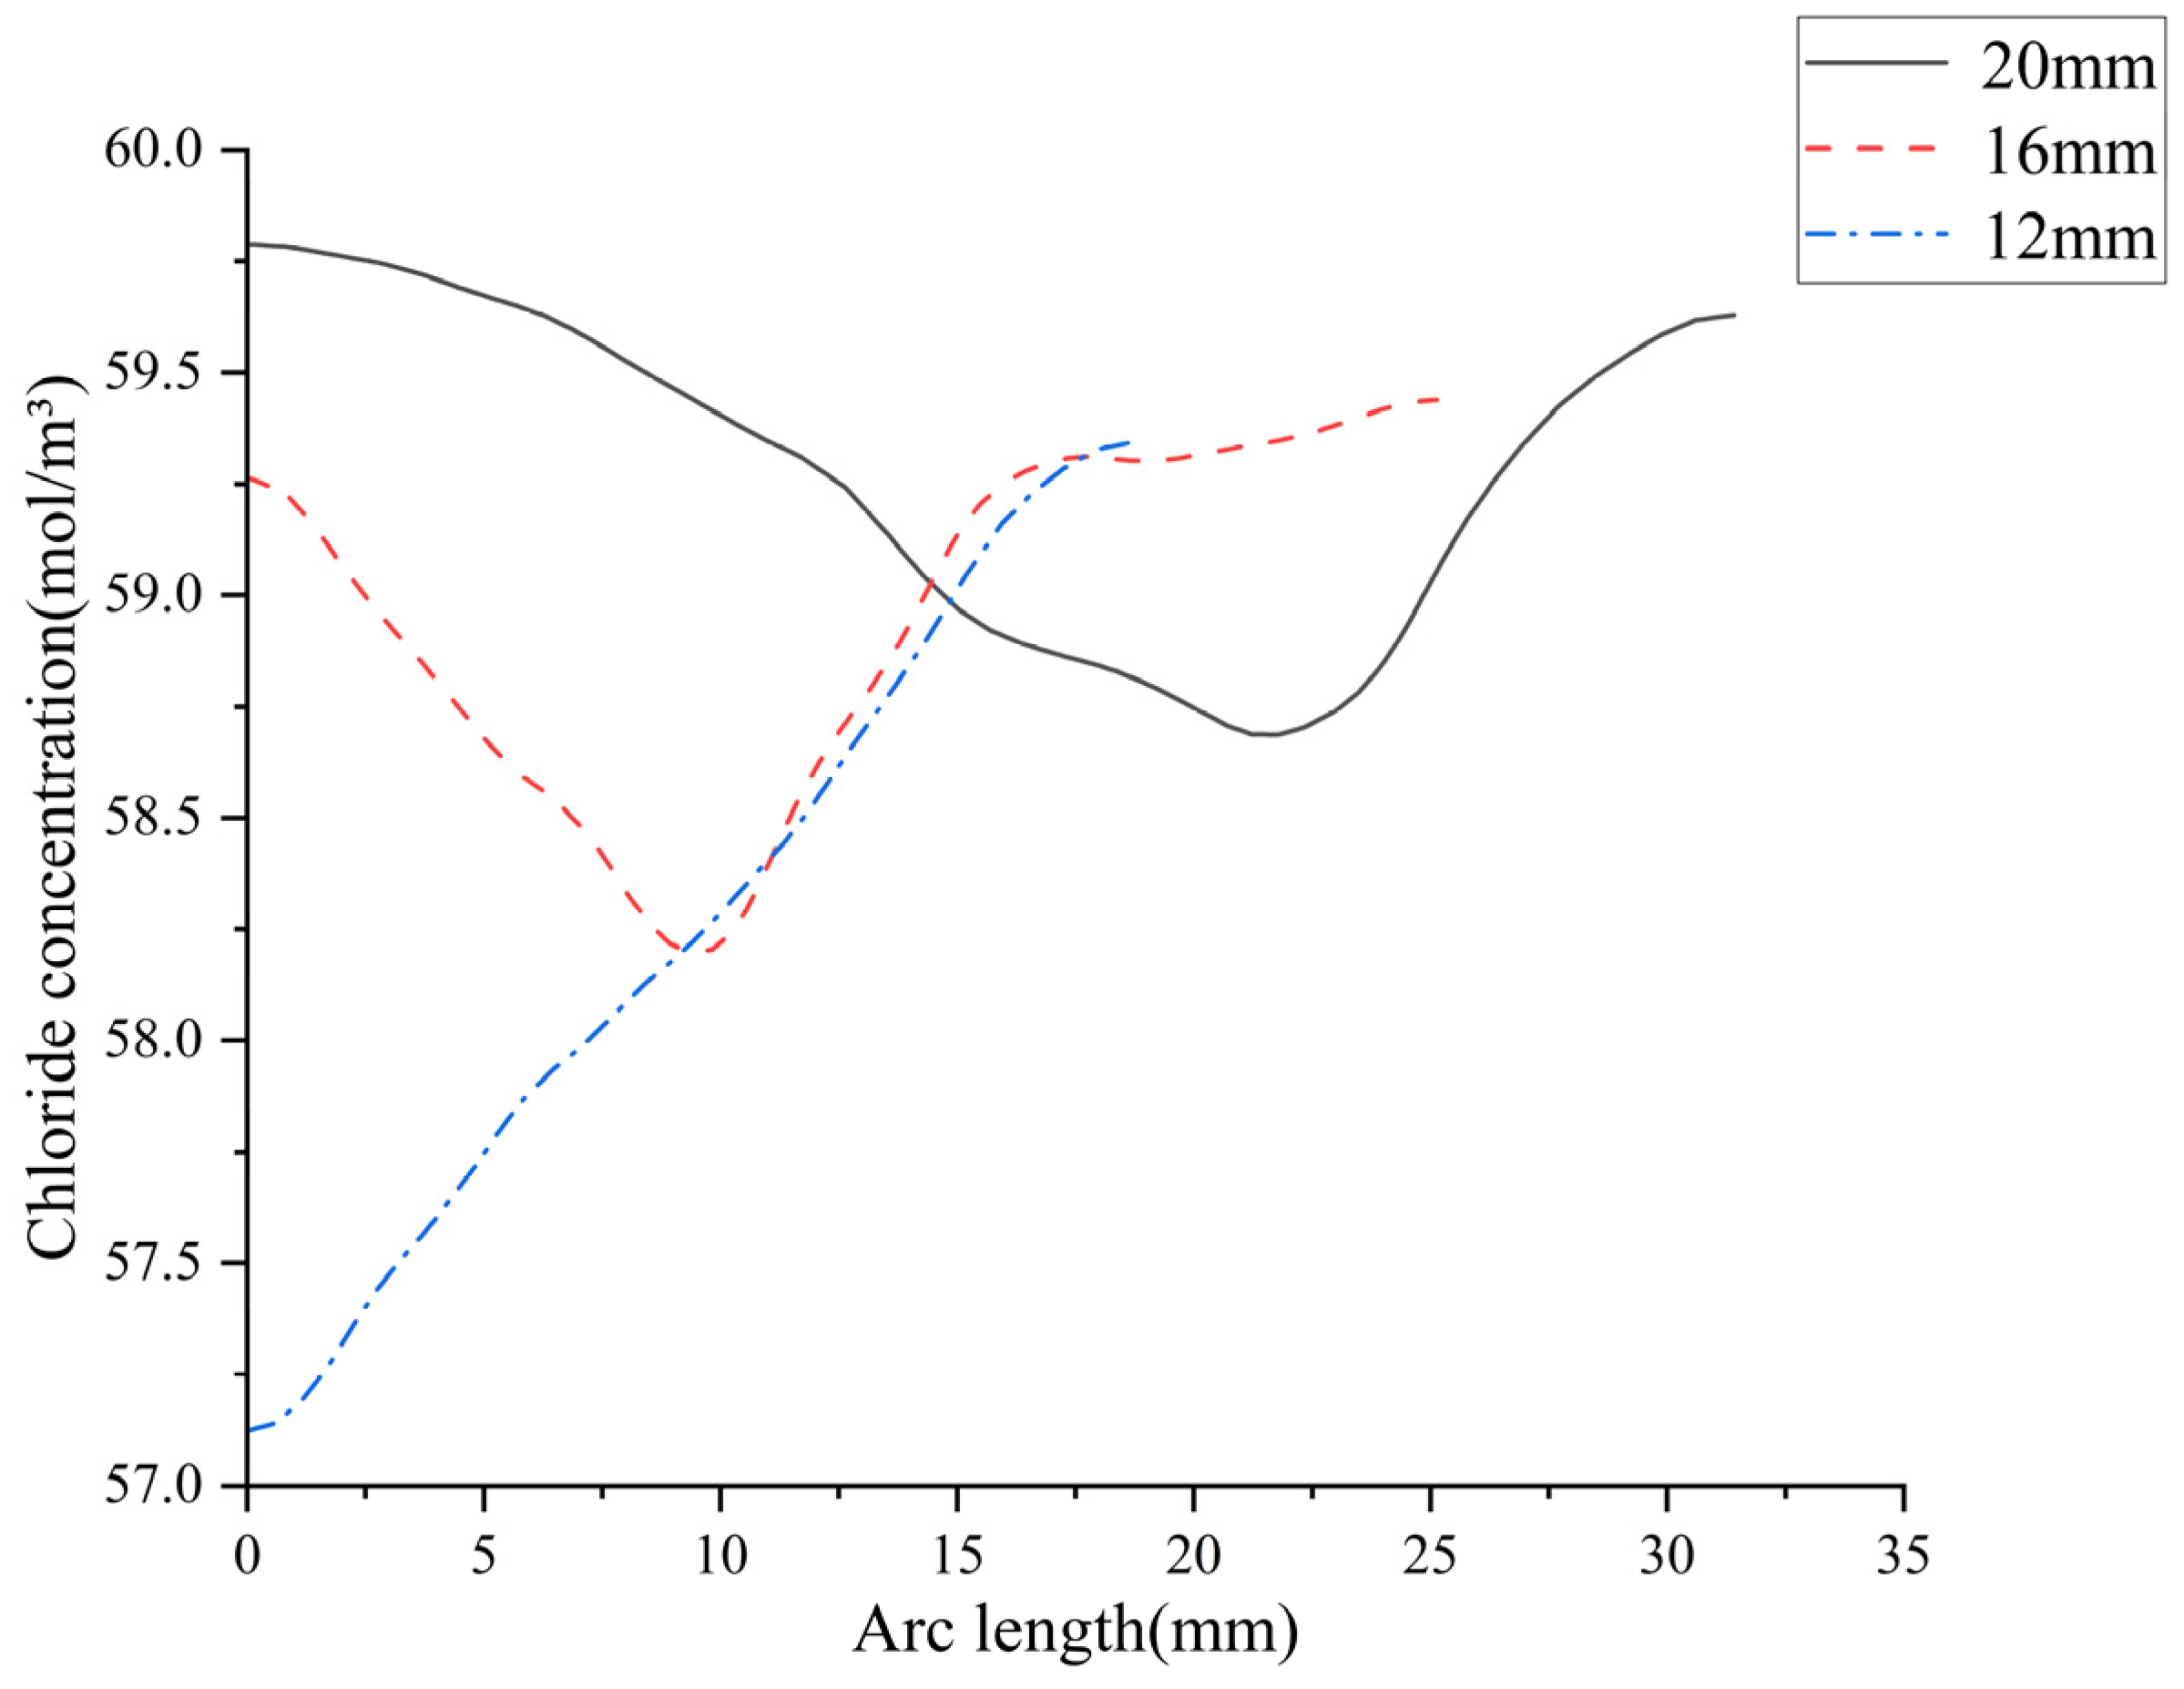
A 50 day transient diffusion finite element analysis was conducted on RC systems with three diameters. Initial chloride concentration was set at C0 = 0 mol/m3, with 60 mol/m3 NaCl solution applied at the top boundary and zero-flux conditions on the other three sides. Chloride distribution contours for the three models are shown in Figure 16. Comparative analysis at 50 days reveals that peak chloride concentrations occur at different locations on the upper rebar surface across models due to varied aggregate distributions. Figure 17 demonstrates a positive correlation between rebar diameter and surface chloride concentration. Quantitatively, when diameter increased from Φ12 mm to Φ20 mm, peak surface concentration rose from 59.346 to 59.628 mol/m3 (Δ = 0.282 mol/m3). This results from the 57% larger influence zone area (276.46 vs. 175.92 mm2) within the 4 mm equivalent stress-affected region for Φ20 mm versus Φ12 mm rebars.
Figure 16.
Chloride concentration contours under varying diameters.
Figure 17.
Chloride concentration at rebar surfaces with varying diameters.
Previous studies inadequately accounting for the indirect blocking effect of reinforcement typically overestimate depassivation time, leading to delayed maintenance decisions and elevated structural failure risks. The indirect blocking effect of rebars, particularly in chloride-aggressive environments, emerges as a critical parameter affecting service life predictions of RC structures. Our findings underscore that the influence of rebar’s indirect blocking effect on RC structural performance must not be overlooked.
6. Conclusions
This study employs XGBoost machine learning to predict and analyze the apparent chloride diffusion coefficient in reinforced concrete under dry–wet cycles using experimental data. Meanwhile, the influence of rebar-aggregate interaction on chloride transport behavior was investigated through finite element simulation. The following conclusions were drawn:
- (1)
- The apparent chloride diffusion coefficients estimated by the XGBoost model exhibit strong agreement with experimental data, validating the model’s accuracy. Notably, this study is the first to incorporate rebar diameter and presence as key features in the machine learning model, thereby more accurately representing real-world chloride diffusion behavior in reinforced concrete structures. SHAP analysis was employed to rank the eight input features by their relative importance, demonstrating that exposure time exerts the strongest influence on the chloride diffusion coefficient, followed sequentially by the sampling depth, rebar diameter and the proportion of coarse aggregate in total aggregate.
- (2)
- The finite element simulations reveal that in the model with 50% aggregate volume fraction, Model 3 (accounting for the indirect blocking effect of reinforcement) demonstrates significantly higher chloride concentrations at the steel-concrete interface compared to Model 2 (neglecting this effect). Specifically, Model 3 shows a 41.02 mol/m3 increase in chloride concentration within the first 600 days of exposure. These results demonstrate that the synergistic interaction between reinforcing steel and aggregate promotes localized chloride accumulation, consequently reducing the depassivation time of the reinforcement. This finding implies that previous studies may have overestimated structural durability by predicting a delayed onset of reinforcement corrosion.
- (3)
- Comparative analysis of reinforced concrete models with varying rebar diameters (12 mm to 20 mm) revealed two key findings: The maximum chloride concentration at the rebar-concrete interface exhibits a positive correlation with rebar diameter, and the rebar’s influence zone expands proportionally with diameter, thereby constraining aggregate distribution. These results demonstrate that rebar geometric parameters significantly influence chloride diffusion behavior in concrete structures.
In conclusion, the results of this study show that reinforcement in the RC composite system has a certain influence on the chloride diffusion process. These findings provide guidance for subsequent modeling of RC components and numerical simulations of chloride transport behavior. They also offer valuable insights into the influence mechanisms of key parameters such as rebar diameter and surface characteristics.
Author Contributions
Conceptualization, X.L. and J.Q.; methodology, X.L.; software, Q.C.; validation, Q.C.; formal analysis, X.L. and Q.C.; investigation, X.L., Q.C. and J.Q.; writing—original draft preparation, Q.C.; writing—review and editing, X.L.; supervision, project administration and funding acquisition, X.L. and J.Q. All authors have read and agreed to the published version of the manuscript.
Funding
This research was funded by the Natural Science Foundation of Xiamen Municipality (Grant No. 3502Z202372016), Fujian Provincial Natural Science Foundation—General Program (Grant No. 2025J01344), and Department of Education, Fujian Province—General Program Foundation (Grant No. JAT220175) for the first author, and Xiamen Science and Technology Subsidy Project (Grant No. 2023CXY0311) for the corresponding author.
Institutional Review Board Statement
Not applicable.
Informed Consent Statement
Not applicable.
Data Availability Statement
The raw data supporting the conclusions of this article will be made available by the authors on request.
Acknowledgments
The authors would like to express their sincere gratitude to Fujian Sanbao Iron and Steel Co., Ltd., for their valuable support and assistance throughout this research. During the preparation of this study, the authors used Python 3.6 software to develop the chloride ion diffusion coefficient prediction model, and COMSOL Multiphysics 6.1 software for establishing the reinforced concrete finite element model. The authors have reviewed and edited the output and take full responsibility for the content of this publication.
Conflicts of Interest
The authors declare no conflicts of interest.
Abbreviations
The following abbreviations are used in this manuscript:
| C_s | Chloride concentration at the exposed surface |
| D | Diffusion Coefficient |
| D-W | Dry–Wet Cycle Ratio |
| EV | Explained Variance Score |
| FE | Finite Element |
| MAE | Mean Absolute Error |
| MSE | Mean Squared Error |
| PDP | Partial Dependence Plot |
| RC | Reinforced Concrete |
| RMSE | Root Mean Squared Error |
| R2 | Coefficient of Determination |
| RH | Relative Humidity |
| SHAP | Shapley Additive Explanations |
| T | Average Temperature |
| W/C | Water–Cement ratio |
| XGBoost | Extreme Gradient Boosting |
References
- Ratha, B.; Yadav, A.; Mohanty, B. Chloride Diffusion Behaviour and Structural Performance of Basalt Fiber-Reinforced Concrete Beam in Marine Environment. Structures 2024, 61, 106094. [Google Scholar] [CrossRef] [Scilit]
- Torres, J.; Andrade, C.; Sánchez, J. Periodo de iniciación de la corrosión por ión cloruro según la EHE 08 en elementos de hormigón fisurados. Inf. Constr. 2020, 72, e331. [Google Scholar] [CrossRef] [Scilit]
- Liu, Y.; Mao, S.; Lu, N. Study on Chloride Ion Diffusion Behavior in Cracked Cement Mortar with High Fly Ash Content. J. China Foreign Highw. 2025, 45, 25–32. [Google Scholar] [CrossRef]
- Wang, J.; Fu, M.; Zheng, K.; Zhang, K.; Fan, Y.; Niu, D. Ion Transport Mechanism and Diffusion Model Establishment in Recycled Aggregate Concrete Subjected to Magnesium, Sulfate, and Chloride Attack. Constr. Build. Mater. 2024, 428, 136273. [Google Scholar] [CrossRef] [Scilit]
- Lopes, R.C.; Oliveira, A.M.; Cascudo, O. Service Life Prediction Models of Concrete Structures Subjected to the Initiation of Reinforcing Steel Corrosion by Chloride Ions: Contribution to the State of the Art Through Systematic Literature Review—Part 2. Matéria 2022, 27, e2022044823. [Google Scholar] [CrossRef] [Scilit]
- Rong, G.; He, T.; Zhang, G.; Li, Y.; Wang, Y.; Xie, W. A Review on Chloride Transport Model and Research Method in Concrete. Mater. Res. Express 2023, 10, 042002. [Google Scholar] [CrossRef] [Scilit]
- Zheng, W.; Cai, J. An Optimum Prediction Model of Chloride Ion Diffusion Coefficient of Machine-Made Sand Concrete Based on Different Machine Learning Methods. Constr. Build. Mater. 2024, 411, 134414. [Google Scholar] [CrossRef] [Scilit]
- Liu, K.-H.; Zheng, J.-K.; Pacheco-Torgal, F.; Zhao, X.-Y. Innovative Modeling Framework of Chloride Resistance of Recycled Aggregate Concrete Using Ensemble-Machine-Learning Methods. Constr. Build. Mater. 2022, 337, 127613. [Google Scholar] [CrossRef] [Scilit]
- Wang, R.; Huo, Y.; Wang, T.; Hou, P.; Gong, Z.; Li, G.; Li, C. Machine Learning Method to Explore the Correlation between Fly Ash Content and Chloride Resistance. Materials 2024, 17, 1192. [Google Scholar] [CrossRef] [Scilit]
- Tran, V. Machine Learning Approach for Investigating Chloride Diffusion Coefficient of Concrete Containing Supplementary Cementitious Materials. Constr. Build. Mater. 2022, 328, 127103. [Google Scholar] [CrossRef] [Scilit]
- Liu, Q.-F.; Iqbal, M.F.; Yang, J.; Lu, X.-Y.; Zhang, P.; Rauf, M. Prediction of Chloride Diffusivity in Concrete Using Artificial Neural Network: Modelling and Performance Evaluation. Constr. Build. Mater. 2021, 268, 121082. [Google Scholar] [CrossRef] [Scilit]
- Taffese, W.Z.; Espinosa-Leal, L. Unveiling Non-Steady Chloride Migration Insights Through Explainable Machine Learning. J. Build. Eng. 2024, 82, 108370. [Google Scholar] [CrossRef] [Scilit]
- Golafshani, E.M.; Kashani, A.; Arashpour, M. Chloride Diffusion Modeling of Concrete Using Tree-Based Forest Models. Struct. Concr. 2023, 24, 5614–5634. [Google Scholar] [CrossRef] [Scilit]
- Taffese, W.Z.; Espinosa-Leal, L. A Machine Learning Method for Predicting the Chloride Migration Coefficient of Concrete. Constr. Build. Mater. 2022, 348, 128566. [Google Scholar] [CrossRef] [Scilit]
- Lv, Y.W. Experimental Study on Chloride Diffusion into Concrete Specimens Considering the Effects of Coarse Aggregate and Reinforcement. Master’s Thesis, Tianjin University, Tianjin, China, 2017. (In Chinese) [Google Scholar]
- Lin, C.A.P. Research on Chloride Diffusion and Durability in Concrete Members Considering Effects of Reinforcement Presence. Master’s Thesis, Tianjin University, Tianjin, China, 2014. (In Chinese) [Google Scholar]
- Wu, L.J. Chloride Diffusion into Concrete Considering the Heterogeneity of Materials and the Blocking Effect of Reinforcement. Ph.D. Thesis, Tianjin University, Tianjin, China, 2018. (In Chinese) [Google Scholar]
- Gao, Q.Y. Study on Chloride Ion Transport in Cracked Fly Ash Slag Concrete. Master’s Thesis, Yanshan University, Qinhuangdao, China, 2023. (In Chinese) [Google Scholar]
- Han, X.; Zhan, S.; Xu, Q.; Tang, X.; Wang, L.; Qian, K. Effect of Dry-Wet Cycling on Resistance of Concrete to Chloride Ion Permeation Erosion. Acta Mater. Compos. Sin. 2020, 37, 198–204. (In Chinese) [Google Scholar]
- Chen, C.H.; Yu, J.; Liu, R.G.; Wang, L.; Liu, H.; Wu, J.L. Chloride Ion Permeability of Recycled Fine Aggregate Concrete under Dry-Wet Cycles. Bull. Chin. Ceram. Soc. 2023, 42, 1217–1225. (In Chinese) [Google Scholar]
- Jiang, L.H.; Liu, R.; Mo, L.L.; Xu, J.; Chu, H. Effect of Cation Type on Corrosion Behavior of Steel Reinforcement in Fly Ash Concrete. J. Hohai Univ. Nat. Sci. 2013, 41, 32–36. (In Chinese) [Google Scholar]
- Yan, Y.; Wang, X.; Lu, C.; Zhang, X.; Li, X.; Chen, J. Resistance of Manufactured Sand Concrete with Fly Ash to Chloride Ion Attack under Dry-Wet Cycle. J. Jiangsu Univ. (Nat. Sci. Ed.) 2023, 44, 731–737. (In Chinese) [Google Scholar]
- Qiu, J.S.; Zhang, R.Y.; Hou, B.W.; Guan, X.; Gao, X.; Li, L. Pore Structure Characteristics and Chloride Ion Corrosion Resistance Mechanism of Coal Gangue Concrete under Drying-Wetting Cycles. Bull. Chin. Ceram. Soc. 2021, 40, 3993–4001. (In Chinese) [Google Scholar]
- Han, Q.; Yang, Y.; Zhang, J.; Hou, D.; Dong, B. Experimental Investigation and Numerical Simulation of Chloride Diffusion in Rubber Concrete under Dry-Wet Cycles. J. Build. Eng. 2024, 96, 110558. [Google Scholar] [CrossRef] [Scilit]
- Wu, L.; Ju, X.; Ma, Y.; Guan, L. Prediction Model of Chloride Diffusion Blocking Effect of Reinforcing Steel in Concrete. J. Build. Mater. 2021, 24, 296–303. [Google Scholar]
- Jee, A.A.; Pradhan, B. Long-Term Effect of Chloride and Sulfates Concentration, and Cation Allied with Sulfates on Corrosion Performance of Steel-Reinforced in Concrete. J. Build. Eng. 2022, 56, 104813. [Google Scholar] [CrossRef] [Scilit]
- Ju, X.; Wu, L.; Liu, M.; Jiang, H.; Zhang, W. Modelling of Chloride Concentration Profiles in Concrete by the Consideration of Concrete Material Factors under Marine Tidal Environment. J. Mar. Sci. Eng. 2022, 10, 917. [Google Scholar] [CrossRef] [Scilit]
- Wang, L.; Chen, C.; Liu, R.; Zhu, P.; Liu, H.; Jiang, H.; Yu, J. Chloride Corrosion Process of Concrete with Different Water–Binder Ratios under Variable Temperature Drying–Wetting Cycles. Materials 2024, 17, 2263. [Google Scholar] [CrossRef] [Scilit] [PubMed]
- Yuan, M.S. Experimental Study on Anti-Chloride Permeability Performance of Ceramic Powder Concrete. Master‘s Thesis, East China Jiaotong University, Nanchang, China, 2018. (In Chinese) [Google Scholar]
- Corotis, R.B. Probability and Statistics in Civil Engineering: By GN Smith; Nichols Publishing Company: New York, NY, USA, 1986; 244p. [Google Scholar]
- Rosati, S.; Gianfreda, C.M.; Balestra, G.; Martincich, L.; Giannini, V.; Regge, D. Correlation Based Feature Selection Impact on the Classification of Breast Cancer Patients Response to Neoadjuvant Chemotherapy. In Proceedings of the 2018 IEEE International Symposium on Medical Measurements and Applications (MeMeA), Rome, Italy, 11–13 June 2018; pp. 1–5. [Google Scholar] [CrossRef] [Scilit]
- Yan, S.; Liang, Y. Fractal Derivative Model with Time Dependent Diffusion Coefficient for Chloride Diffusion in Concrete. J. Build. Eng. 2023, 74, 106897. [Google Scholar] [CrossRef] [Scilit]
- Huang, Y.; Ji, F.; Chen, Z.-L.; Li, W.; Yu, J. Time-Dependent Concrete Chloride Diffusion Coupled with Nonlinear Chloride Binding: An Analytical Study. J. Build. Eng. 2024, 91, 109587. [Google Scholar] [CrossRef] [Scilit]
- Lian, S.; Meng, T.; Zhao, Y.; Liu, Z.; Zhou, X.; Ruan, S. Experimental and Theoretical Analyses of Chloride Transport in Recycled Concrete Subjected to a Cyclic Drying-Wetting Environment. Structures 2023, 52, 1020–1034. [Google Scholar] [CrossRef] [Scilit]
- Gang, X.; Li, Y.-P.; Su, Y.-B.; Xu, K. Chloride Ion Transport Mechanism in Concrete Due to Wetting and Drying Cycles. Struct. Concr. 2015, 16, 289–296. [Google Scholar] [CrossRef] [Scilit]
- Wang, Y.; Guo, S.; Yan, B.; Liu, Z.; Wang, Y.; Yuan, C. Experimental and Analytical Investigation on Chloride Ions Transport in Concrete Considering the Effect of Dry-Exposure Ratio under Diurnal Tidal Environment. Constr. Build. Mater. 2022, 328, 127138. [Google Scholar] [CrossRef] [Scilit]
- Wu, L.; Ju, X.; Liu, M.; Guan, L.; Ma, Y.; Li, M. Influences of Multiple Factors on the Chloride Diffusivity of the Interfacial Transition Zone in Concrete Composites. Compos. Part B Eng. 2020, 199, 108236. [Google Scholar] [CrossRef] [Scilit]
- Bao, J.; Kong, L.; Zhang, X.; Zhang, P.; Qin, L.; Guo, W. Mesoscale Numerical Analysis of Chloride Ingress Behavior of Strain Hardening Cement-Based Composites. Acta Mater. Compos. Sin. 2024, 41, 2137–2147. [Google Scholar] [CrossRef]
- Liu, J.; Liu, J.; Huang, Z.; Zhu, J.; Liu, W.; Zhang, W. Effect of Fly Ash as Cement Replacement on Chloride Diffusion, Chloride Binding Capacity, and Micro-Properties of Concrete in a Water Soaking Environment. Appl. Sci. 2020, 10, 6271. [Google Scholar] [CrossRef] [Scilit]
- Yu, H.; Hartt, W.H. Effects of Reinforcement and Coarse Aggregates on Chloride Ingress into Concrete and Time-to-Corrosion: Part 1—Spatial Chloride Distribution and Implications. Corrosion 2007, 63, 843–849. [Google Scholar] [CrossRef] [Scilit]
- Wang, Y.; Li, Q.; Lin, C. Chloride Diffusion Analysis of Concrete Members Considering Depth-Dependent Diffusion Coefficients and Effect of Reinforcement Presence. J. Mater. Civ. Eng. 2016, 28, 04015183. [Google Scholar] [CrossRef] [Scilit]
- Wang, Y.; Gong, X.; Wu, L. Prediction Model of Chloride Diffusion in Concrete Considering the Coupling Effects of Coarse Aggregate and Steel Reinforcement Exposed to Marine Tidal Environment. Constr. Build. Mater. 2019, 216, 40–57. [Google Scholar] [CrossRef] [Scilit]
- Cai, Y.; Zhang, W.; Yu, L.; Chen, M.; Yang, C.; François, R.; Yang, K. Characteristics of the Steel-Concrete Interface and Their Effect on the Corrosion of Steel Bars in Concrete. Constr. Build. Mater. 2020, 253, 119162. [Google Scholar] [CrossRef] [Scilit]
- Scrivener, K.; Ouzia, A.; Juilland, P.; Mohamed, A.K. Advances in Understanding Cement Hydration Mechanisms. Cem. Concr. Res. 2019, 124, 105823. [Google Scholar] [CrossRef] [Scilit]
- Wang, Y.; Wu, L.; Wang, Y.; Liu, C.; Li, Q. Effects of Coarse Aggregates on Chloride Diffusion Coefficients of Concrete and Interfacial Transition Zone under Experimental Drying-Wetting Cycles. Constr. Build. Mater. 2018, 185, 230–245. [Google Scholar] [CrossRef] [Scilit]
- Borah, M.M.; Dey, A.; Sil, A. Service Life Assessment of Chloride Affected Bridge Located in Coastal Region of India Considering Variation in the Inherent Structural Parameters. Structures 2020, 23, 191–203. [Google Scholar] [CrossRef] [Scilit]

Disclaimer/Publisher’s Note: The statements, opinions and data contained in all publications are solely those of the individual author(s) and contributor(s) and not of MDPI and/or the editor(s). MDPI and/or the editor(s) disclaim responsibility for any injury to people or property resulting from any ideas, methods, instructions or products referred to in the content. |
© 2026 by the authors. Licensee MDPI, Basel, Switzerland. This article is an open access article distributed under the terms and conditions of the Creative Commons Attribution (CC BY) license.