


Abstract
Frequency-Modulated Continuous-Wave (FMCW) millimeter-wave (mmWave) radars, originally developed for automotive applications, can be also explored for environmental sensing due to their compact size, low cost, and robustness under adverse environmental conditions. However, measurements obtained from commercial automotive radars are often affected by environmental noise and intrinsic self-interference caused by coupling between transmitting and receiving patch antennas, which can degrade the reliability of relative power-based range profiles. In this paper, the performance of the AWR1843BOOST FMCW mmWave radar from Texas Instruments is investigated, with particular emphasis on noise due to antenna coupling. A sub-optimal post-processing technique based on Noise Environmental Measurement (NEM) removal is proposed to remove both deterministic noise, associated with antenna coupling, and stochastic noise, related to environmental contributions. The proposed approach is validated through controlled laboratory experiments involving different targets characterized by distinct dielectric properties, including a metallic object, an absorbing object, and a target with varying degrees of wetness. The experimental results demonstrate that the NEM removal technique significantly enhances the clarity of the backscattered target’s relative power, preserving differences between target values, and improves the radar’s sensitivity to material properties and water content. Measurements accomplished at the electromagnetic and remote sensing laboratory of the Università degli Studi di Napoli Parthenope confirmed the soundness of the proposed NEM removal technique and the sensitivity of the AWR radar to the dielectric properties of targets.
1. Introduction
From the early 1960s to the present day, radar technologies have been widely applied across several human activities [1]. Initially developed for military purposes [2], radar systems have progressively transitioned into civilian applications, enabled by advances in miniaturization, cost reduction, and the adoption of advanced techniques such as millimeter-wave (mmWave) radar [3]. These developments boosted the integration of radar sensors into a wide range of fields, including automotive, environmental monitoring, and telecommunications [4,5].
Frequency-Modulated Continuous-Wave (FMCW) mmWave radars are compact and cost-effective sensors capable of operating reliably under adverse environmental conditions. FMCW mmWave radars continuously transmit a frequency-modulated signal, commonly referred to as a chirp, while a receiving antenna continuously collects the echoed signal. Signal processing techniques enable the extraction of key target parameters such as distance, velocity, angular position, and dielectric properties [6].
FMCW mmWave radars have found increasing use in industrial environments, often in combination with other sensing technologies. Their high precision and accuracy make them suitable for surface detection [7], liquid level and interface sensing [8], and material identification classification [9,10]. In the healthcare domain, mmWave radar sensors have been employed for non-invasive blood glucose monitoring [11], early detection of skin cancer [12], detecting seniors living alone [13], and monitoring biometric parameters [14,15]. Additional applications include automatic extraction of Doppler envelopes for gait analysis [16], range measurements [17], the super-resolution problem of range and angle [18], human motion analysis [19], and micro-action recognition systems [20].
The most popular FMCW mmW radar application is within the automotive and transportation context, including relative vehicle positioning [21], frequency regulation and ultra-wideband techniques for automotive systems [22], and obstacle detection [23].
Automotive radar has also recently been used in agricultural applications to measure soil moisture [24] and water contents for the vegetation health [25,26], replacing remote sensing technologies [27] because of their lack of accessibility and limited potential for automation [27]. Among the radar platforms used in the automotive field, the AWR1843BOOST FMCW mmWave radar (hereinafter AWR radar) from Texas Instruments (TI) has gained significant attention due to its cost-effectiveness and widespread availability [28,29].
In all of the above-mentioned applications, the relative power obtained by the AWR radar is directly evaluated without applying post-processing techniques aimed at removing environmental noise, which is inherently present in radar and antenna measurements [24,26]. This kind of environmental noise can significantly increase the false alarm and false positive rates, potentially triggering system responses when no target is in place. Furthermore, the AWR radar architecture integrates high-gain transmitting and receiving patch antennas, which impose a minimum operational distance between the radar and the target that must be applied to prevent self-interference and to avoid receiver overload. In other words, the layout of the transmitting (Tx) and receiving (Rx) patch antennas implies that the signal is partially leaking between the Tx and the Rx, degrading the performance of the whole AWR radar system. In addition, a component of random noise due to the surrounding environment is always present, and it can provide false alarms if not removed.
In this study, a sub-optimal noise removal technique is proposed to address the noise issue affecting AWR measurements, which consists of removing the environmental noise that affects data. In particular, a Noise Environmental Measurement (NEM) removal technique is proposed for the first time, which relies on the signal subtraction between the target backscattered data and the corresponding environmental ones. It is important to note that the short-range part of the NEM is characterized by the contribution of deterministic noise due to the antenna coupling. Once the NEM removal technique is performed, the sensitivity of the radar to targets with different dielectric properties is accomplished. The NEM removal technique does not modify the relative power reflected by the target. Additionally, false alarms due to antenna coupling are effectively removed when the NEM removal technique is applied. The component of the deterministic noise due to antenna coupling self-interference effects is equal to a multiple of the range resolution chosen during the AWR radar’s parameter configuration. This is an intrinsic characteristic of AWR radar. It is important to note that this novel NEM removal technique was applied to AWR radar measurements for the first time. To the best of the authors’ knowledge, no details on the noise removal technique are present in previous papers that performed measurements only with the AWR radar.
Then, the sensitivity of the AWR radar to the degree of wetness was evaluated by measuring the relative power obtained by a piece of commercial A4 paper sprayed with water over a time period of 15 min. In summary, the goal of this paper is twofold:
- On the one hand, to remove the deterministic noise due to the Tx and Rx antenna coupling;
- On the other hand, to evaluate the sensitivity of the automotive radar employed here to different dielectric properties of targets.
Measurements accomplished at the Electromagnetic Remote Sensing (EMRS) Lab of the Engineering Department of the Università degli Studi di Napoli Parthenope confirm the soundness of the proposed technique and show the ability to get noise-free measurements, as well as the sensitivity of the AWR radar to the degree of wetness. The rest of this paper is organized as follows: an overview of the device and its settings used for the experiments is provided in Section 2; experimental results and discussions are given in Section 3; conclusions are drawn in Section 4.
2. Materials and Methods
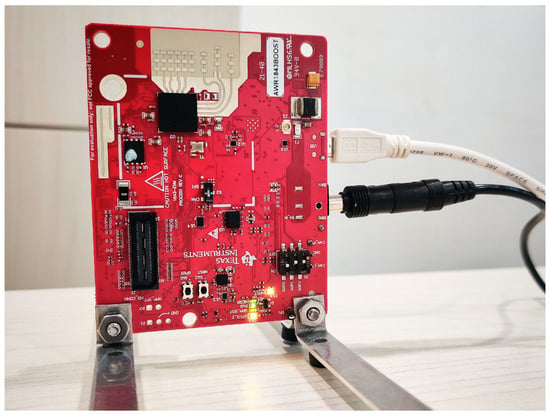
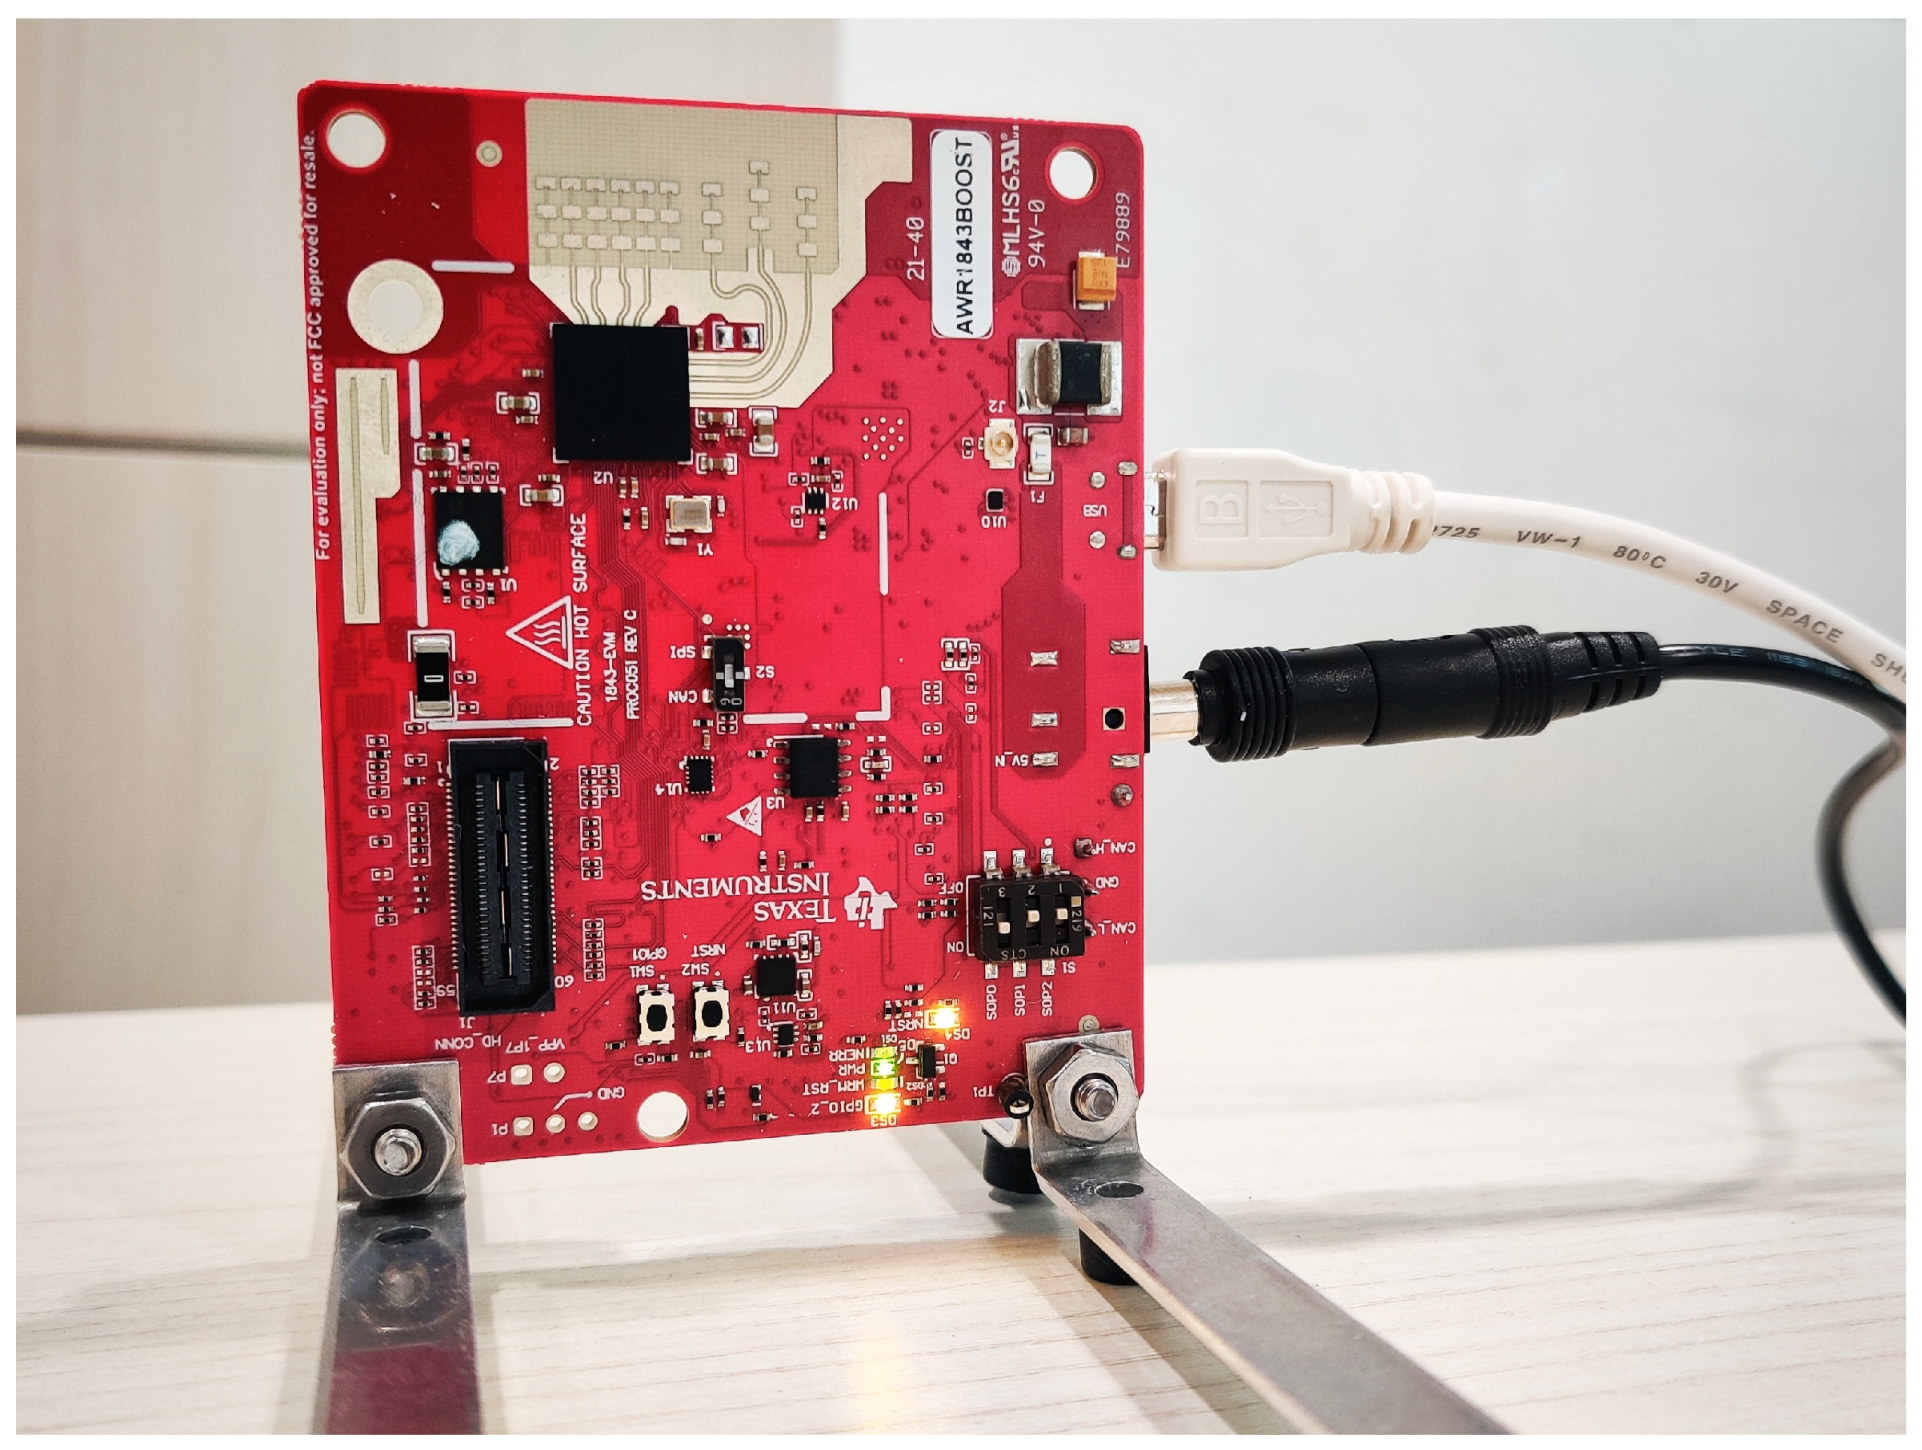
This section describes the materials and methods that underpin the experimental part of the study. The FMCW mmWave AWR1843BOOST radar is an evaluation board developed by Texas Instruments (TI) based on the AWR1843 chip [30]. It is an cm thin board where 3 Tx and 4 Rx high-gain patch antennas are integrated. Information about the radar is provided by the technical data sheet in [30]. This radar is designed to develop, test, and explore radar applications using millimeter waves and an FMCW signal in the automotive field. It requires a computer with a 5 V bidirectional USB serial port for communication and application support. The device is shown in Figure 1, while key specifications are listed in Table 1.
Figure 1.
Texas Instruments AWR1843BOOST FMCW mmWave radar.
Table 1.
Texas Instruments AWRBOOST1843 FMCW mmWave radar specifications.
The FMCW radar signal is characterized by a time-dependent sinusoidal wave form [18]:
where A is the amplitude, is the initial frequency, and k is the parameter that rules the linear frequency modulation slope. A complete representation of the transmitted signal can be found in [18].
For the radar configuration, data acquisition, and data visualization, the web browser-based application “mmWave Demo Visualizer (DV)” made available by TI, which works on any operating system, was used. The best configuration suggested in [31] was adopted, i.e., Windows operating system with Google Chrome as the web browser.
Different settings depend on the type of evaluation board, the number of Tx and Rx antennas, and the configuration (with or without azimuth resolution) [31]. The parameters that can be set in the mmWave DV, used for each experiment, were as follows:
- Frequency Band: 77–81 GHz;
- Acquisition Time 10 s;
- Maximum Unambiguous Range 2.41 m;
- Range Resolution 4.7 cm.
The configuration used was the “Best Range Resolution”. Such a configuration is achieved by maximizing the radar’s available bandwidth (4 GHz) and providing a range resolution of 4.7 cm. The measurement acquisition system is achieved by establishing a bidirectional communication connection between the radar and the computer via a USB cable. Once all the parameters of the setup (platform, antenna configuration, frequency), scene (frame rate, range, velocity), and plots of interest are selected, it is possible to send the configuration by setting a specific time of interest, as mentioned above.
The choice of the parameters listed above can be summarized as follows:
- The widest available frequency band was set to ensure the finest range resolution;
- The acquisition time was set at a sufficiently narrow interval in order not to have significant variations in the measurement target;
- The maximum unambiguous range was set to reduce reflections from the objects surrounding the target in the measurement environment as much as possible, i.e., walls, ceiling, floor, desk, etc. (see Figure 2);
- The range resolution was set at 4.7 cm, compatible with the maximum unambiguous range of 2.41 m, as they are inter-correlated on the DV platform.
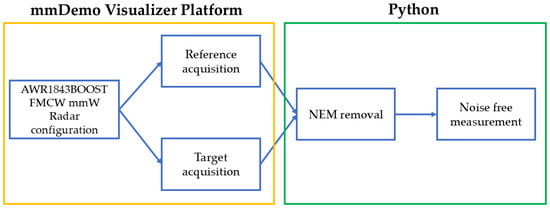
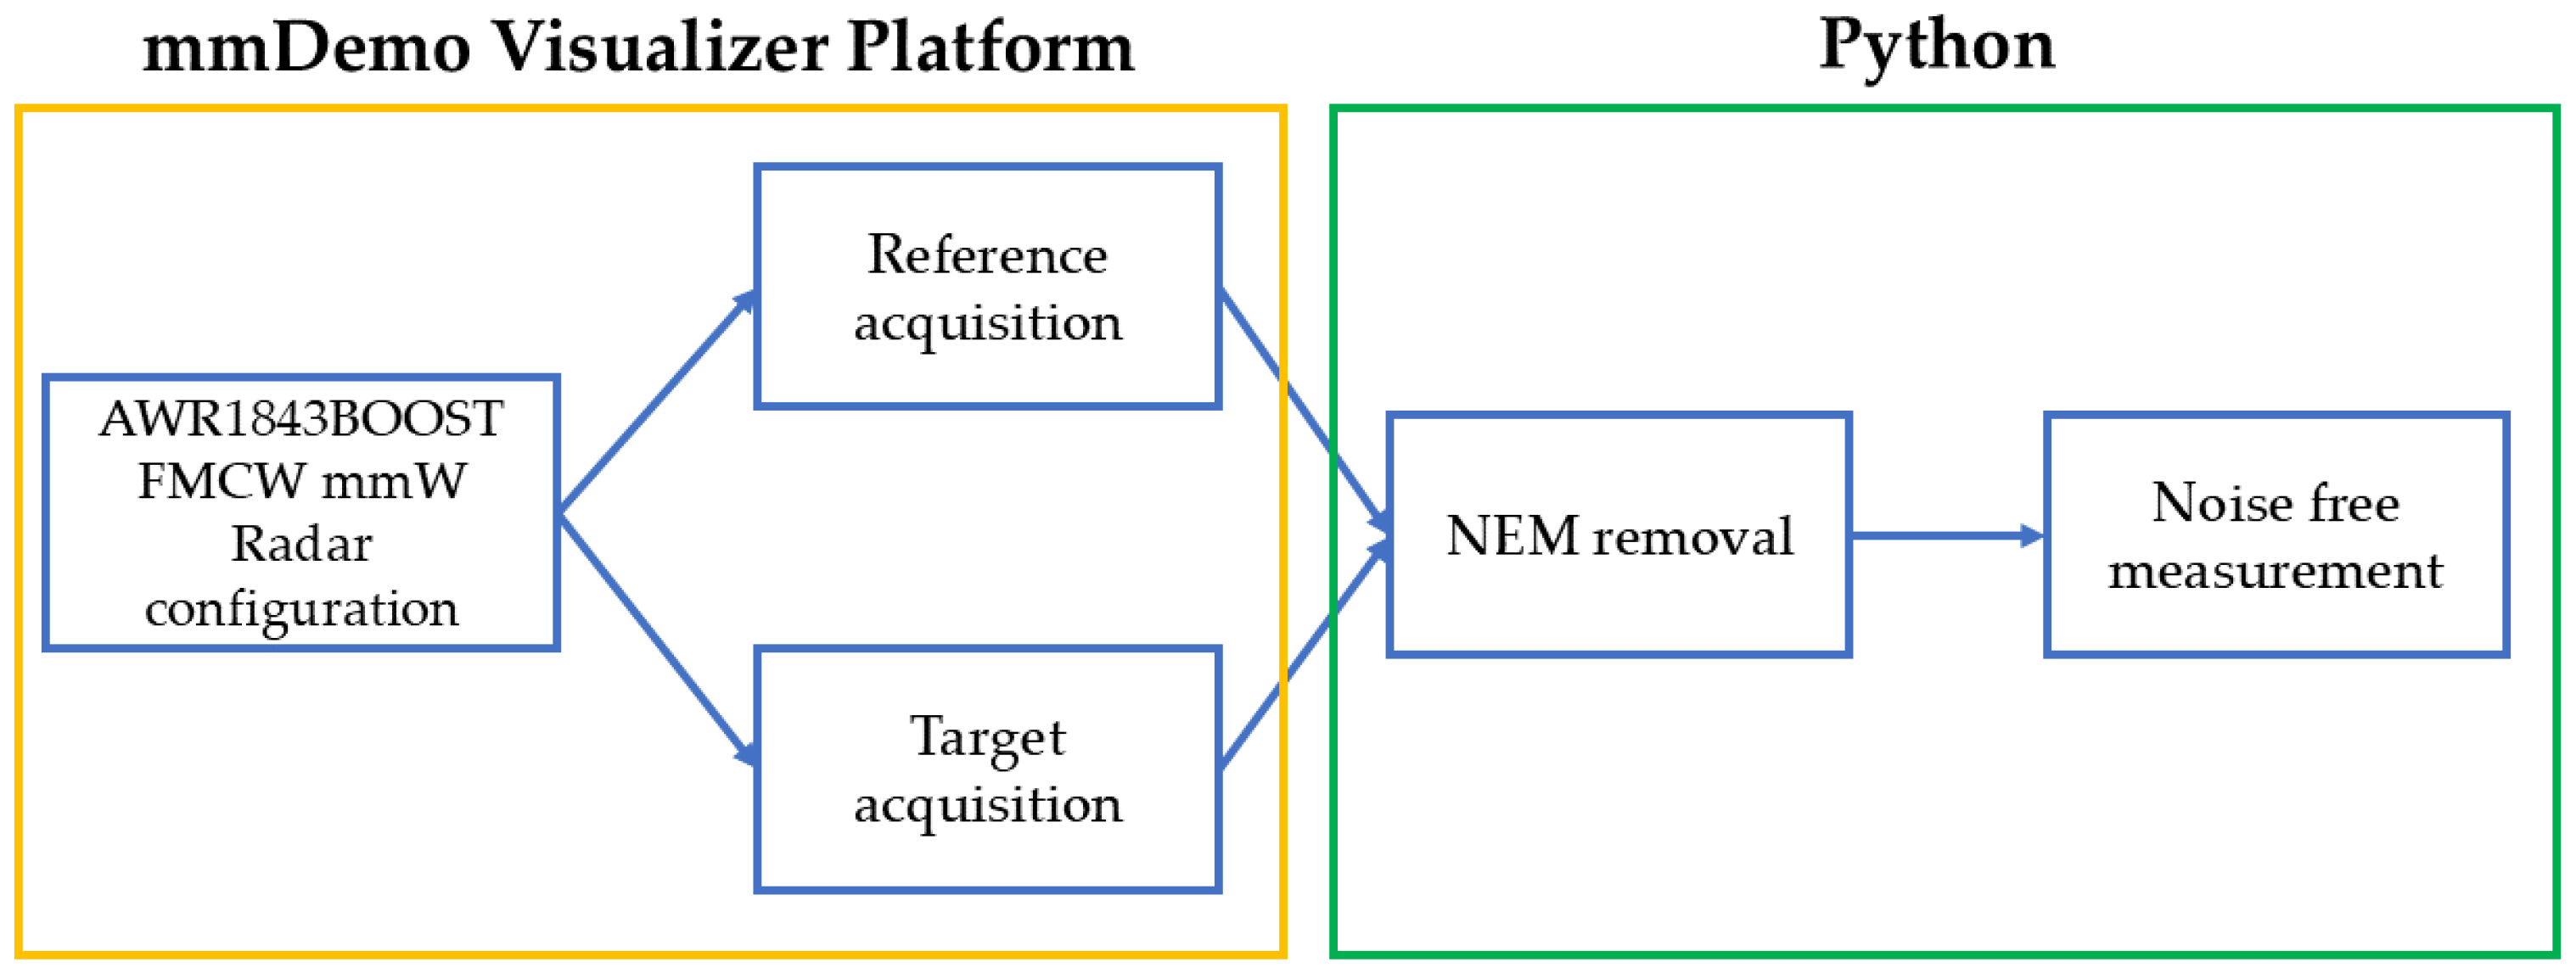
Figure 2.
Logic flowchart of the proposed approach.
Note that, in the DV platform, the best resolution could be set to 3.9 cm. Such a range resolution modifies the maximum unambiguous range to a value of 11.99 m. According to the physical dimensions of the measurement environment, i.e., the EMRS Lab, the value of 11.99 m ambiguous range definitively exceeds the distance value where the target is placed, involving more time-consuming procedures in data analysis. Hence, measurement samples were taken with a range resolution of 4.7 cm, which corresponds to a 2.1 m maximum ambiguous range. It is important to note that the AWR radar configuration parameters were used only to optimize the radar results, without removing any type of noise from the measurements. For the mathematical representation of the transmitted radar signal, see [18].
Figure 2 shows a schematic of the proposed measurement approach. Once the radar setting is done, the configuration is stored in a “.cfg” format file and the measurements are collected in binary format in a “.dat” file. Both files are downloadable from the DV tool, and all of the plots visualized in the DV tool—corresponding to the reference and target measurements—are in real time. This tool serves as a starting point for a deeper analysis and for data processing performed using a Python (version 3.12.11) code developed by authors. This code is used to decode binary data and to extract the configuration parameters automatically, allowing us to work directly with the configuration and the data files as inputs. The Python code consists of a first part that allows the generic “.cfg” file to be opened to read its parameters and save them in a vector that will be applied to the relative “.dat” binary file, which is opened by the code. The subsequent parts of the code are related to the plotting of range profiles and operations on the graphs, including the NEM removal.
3. Experimental Results and Discussion
This section presents and discusses the experimental results obtained with the TI AWR radar.
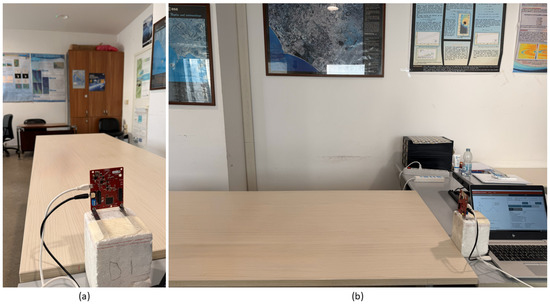
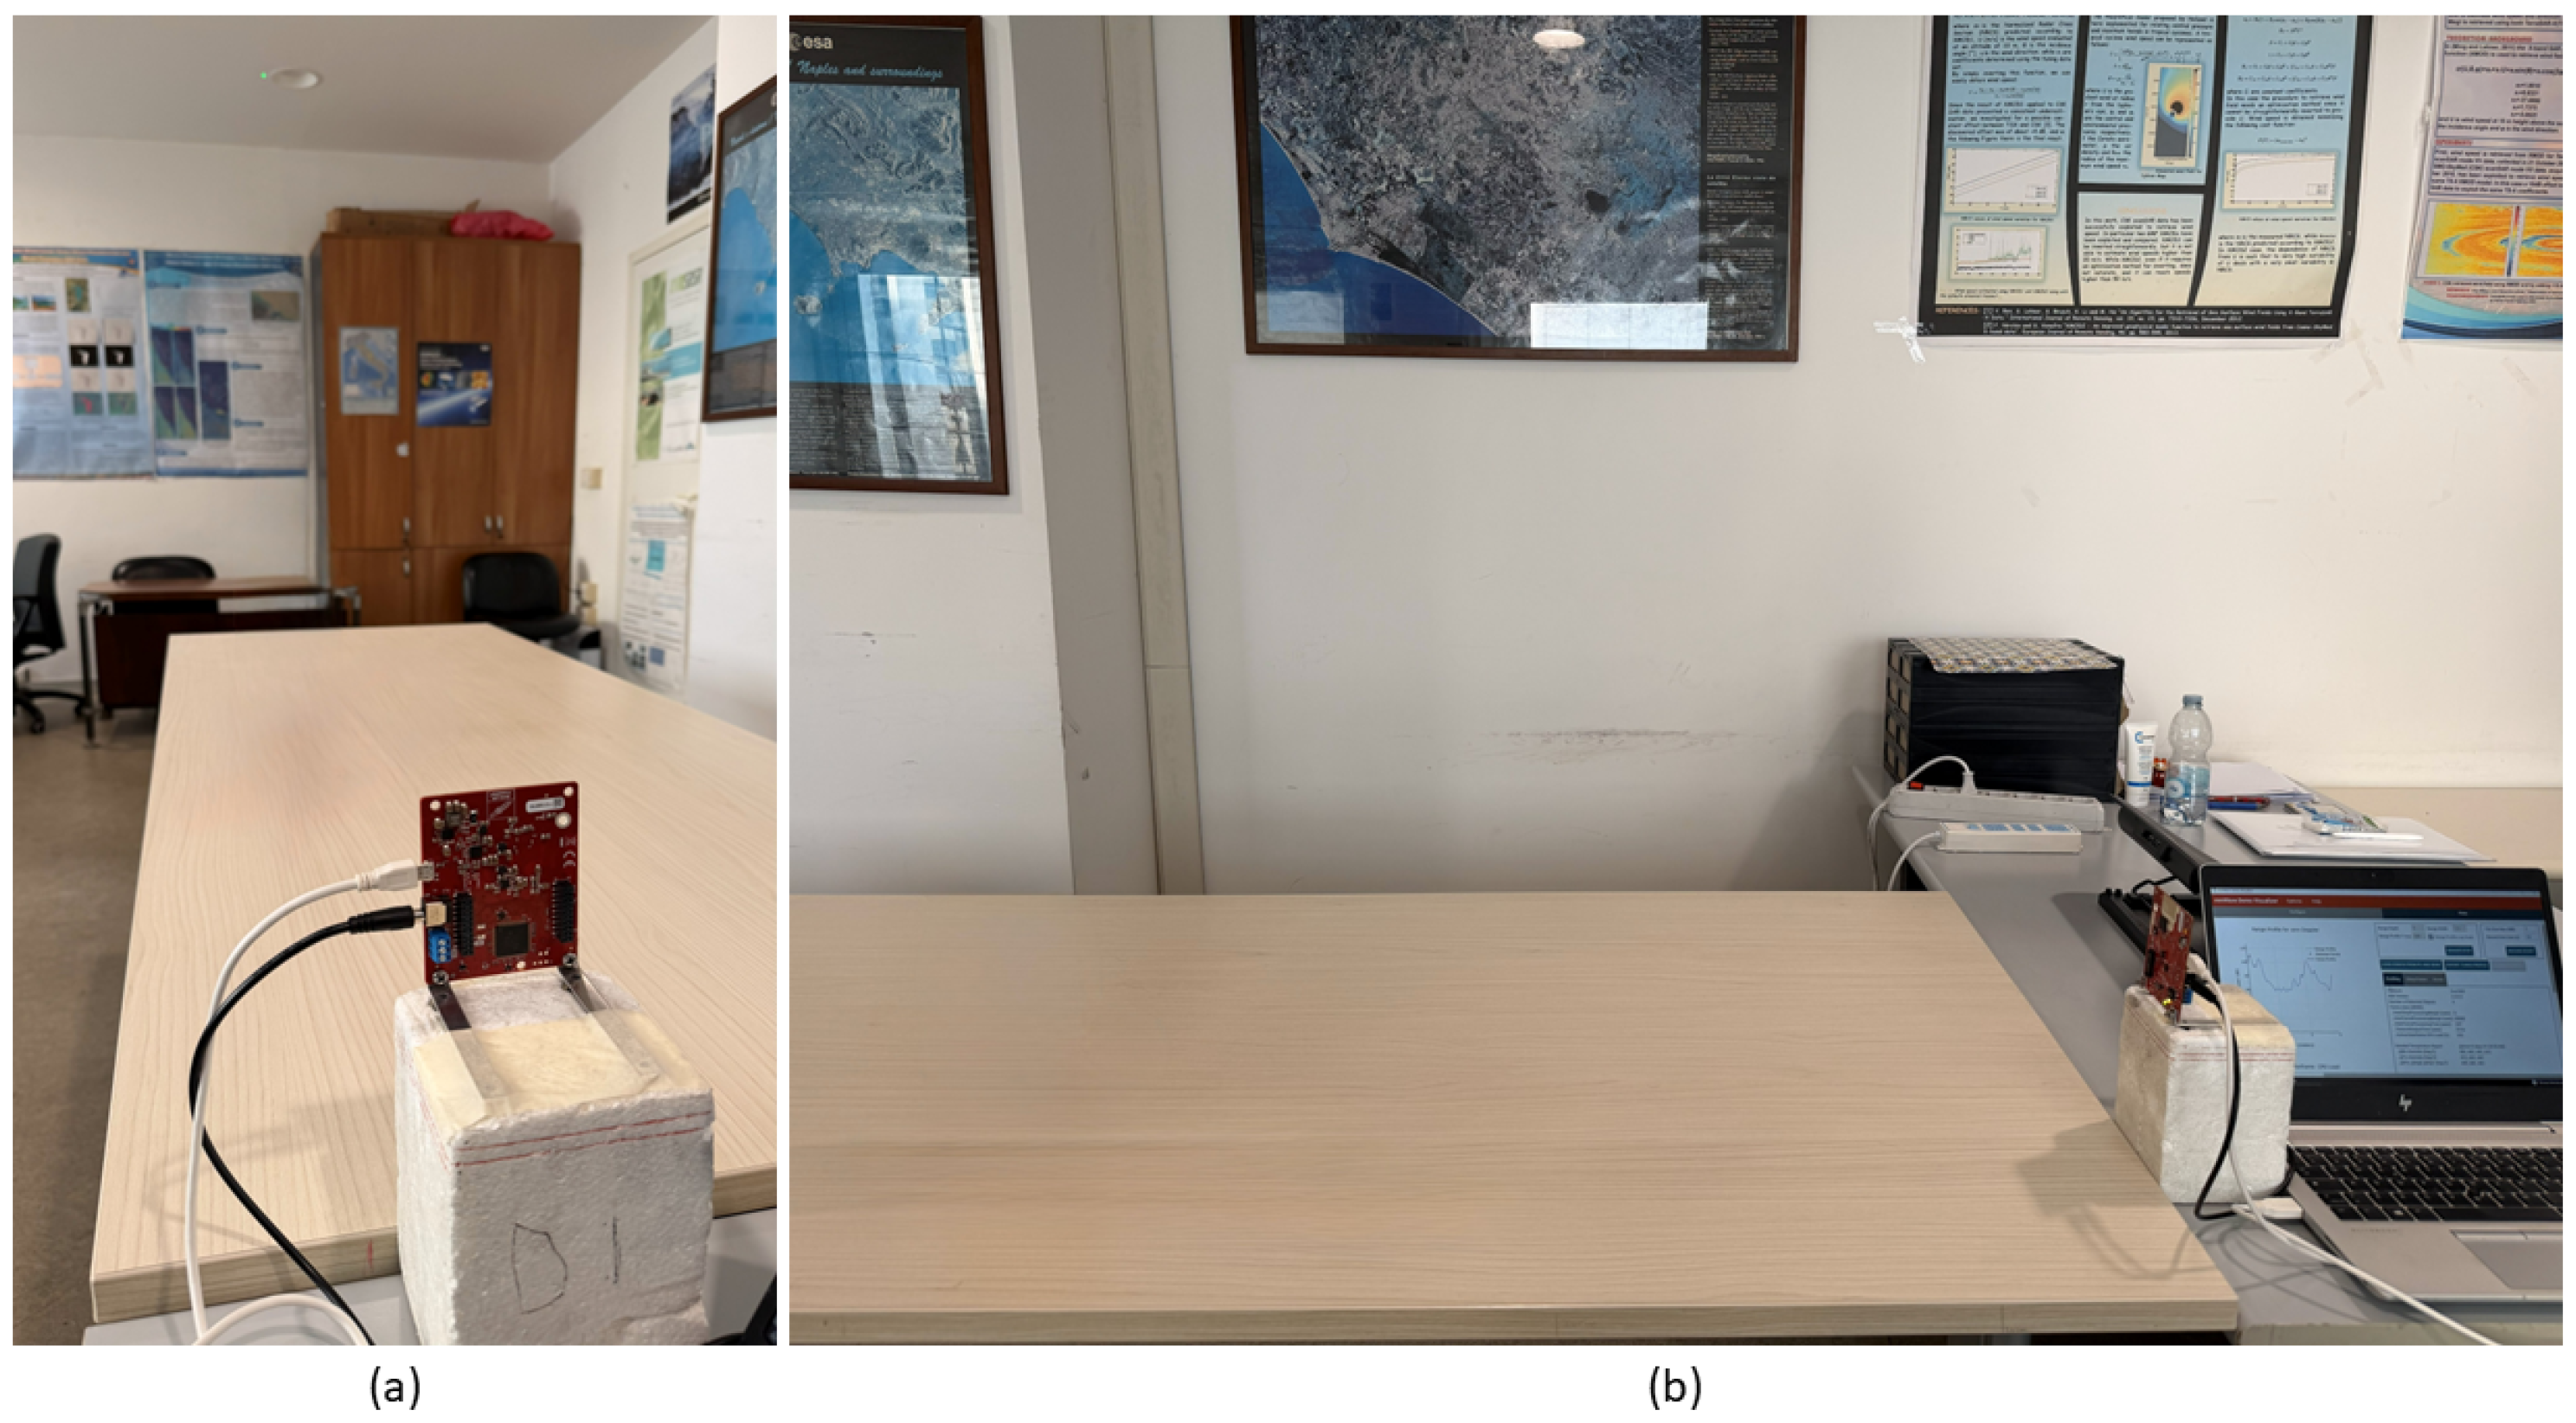
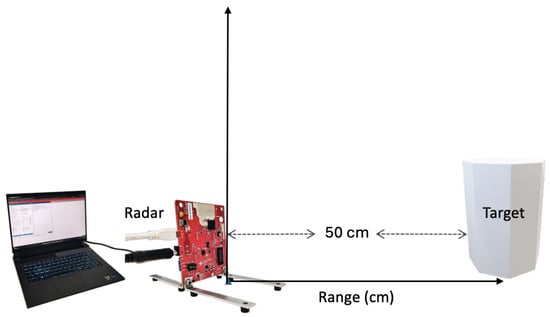
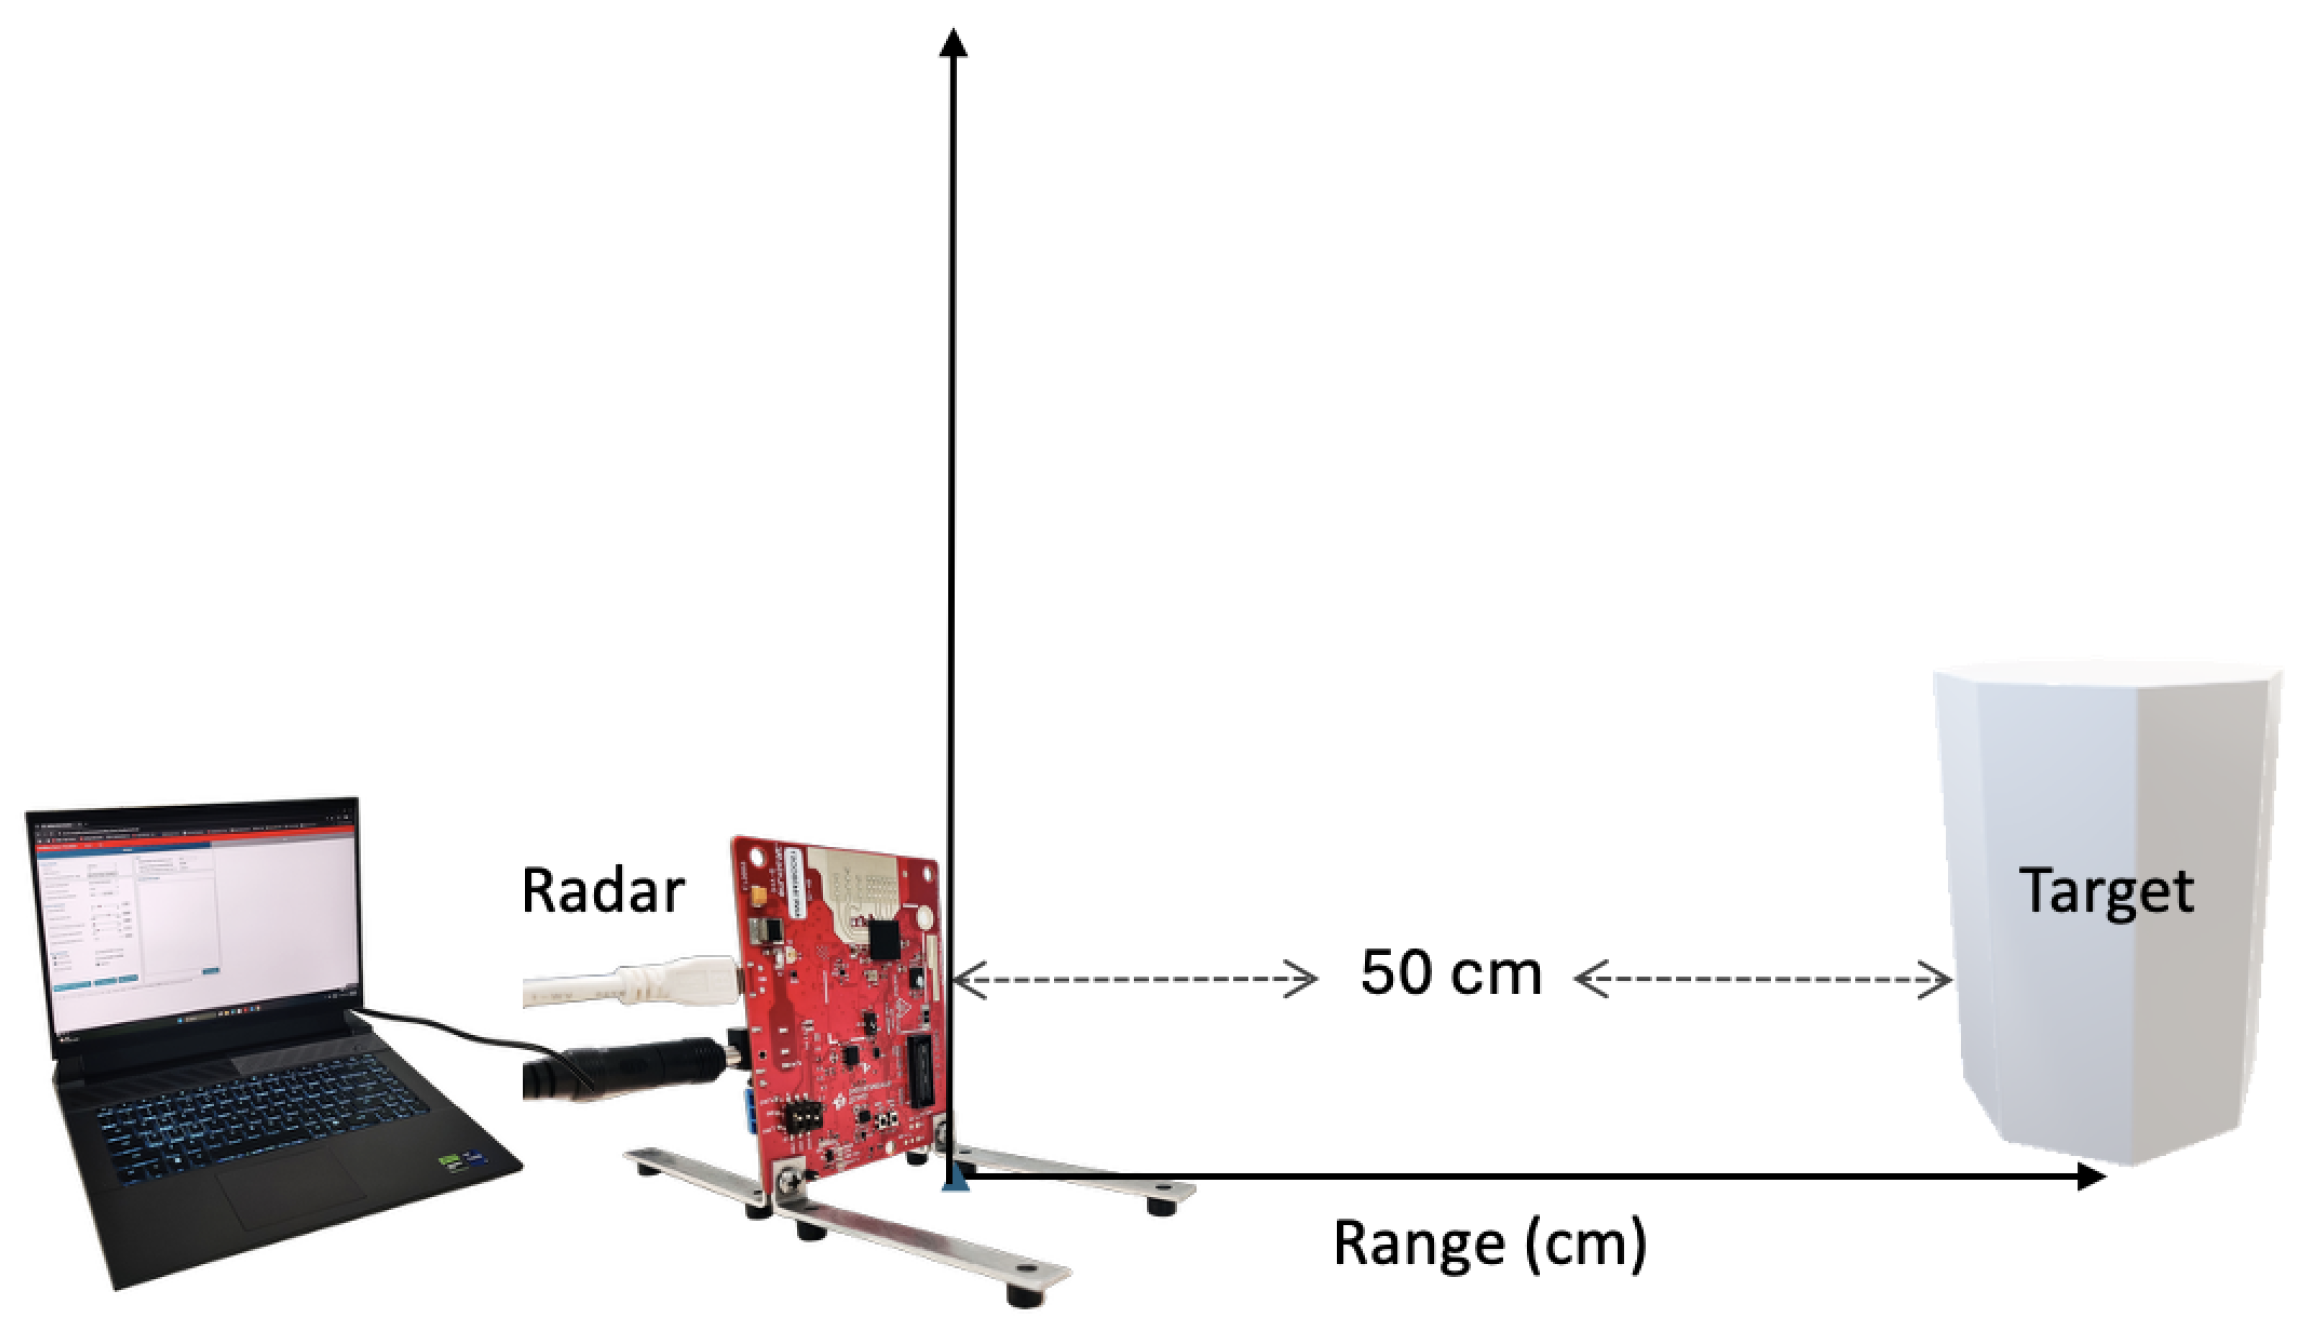
Three different types of experiments were performed within the Electromagnetic and Remote Sensing (EMRS) Laboratory at the Engineering Department of the Università degli Studi di Napoli Parthenope (see Figure 3). Such an environment is characterized by significant background noise due to signal reflections from the walls, floor, and other objects present within the laboratory. A sketch of the experimental setup is shown in Figure 4. The distance between the radar antennas and the targets was set at 50 cm; therefore, only the relative power around the 50 cm range was evaluated. Hence, points on the range axis greater than 90 cm were not considered. In other words, the closest point to 90 cm, i.e., 89.3 cm according to the range resolution of 4.7 cm, was considered the cutoff distance, beyond which the relative power has a value of 0.
Figure 3.
Two images of the EMRS Laboratory setup at the Engineering Department of the Università degli Studi di Napoli Parthenope: front view (a) and side view (b).
Figure 4.
Sketch of the experimental setup.
The experimental setup was placed on a wooden table, and the AWR radar was mounted on a polystyrene cube whose sides measured 13.5 cm (see Figure 3b) and held vertically by the two metallic supports provided by the TI installation kit and fixed on the cube with adhesive tape in order to hold the radar vertically. The metal supports were mounted on the back side of the radar with respect to the antennas to avoid interference between the Tx/Rx antennas (see Figure 3a). The antennas were pointed towards the target, with the AWR radar placed orthogonally with respect to the table surface (see Figure 3b).
Three experiments were performed:
- The case where no target was placed in front of the AWR radar, with the aim of testing the NEM removal technique considered here;
- Two different targets characterized by different dielectric properties and dimensions placed simultaneously in front of the radar in order to evaluate its detection capability;
- The sensitivity of the radar to the degree of wetness was investigated using a target with time-varying dielectric properties.
3.1. NEM Removal Technique Analysis
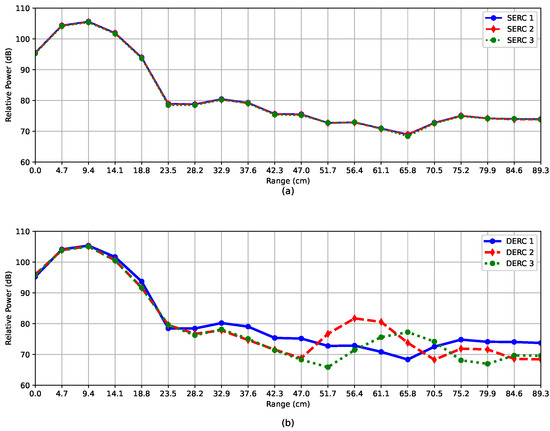
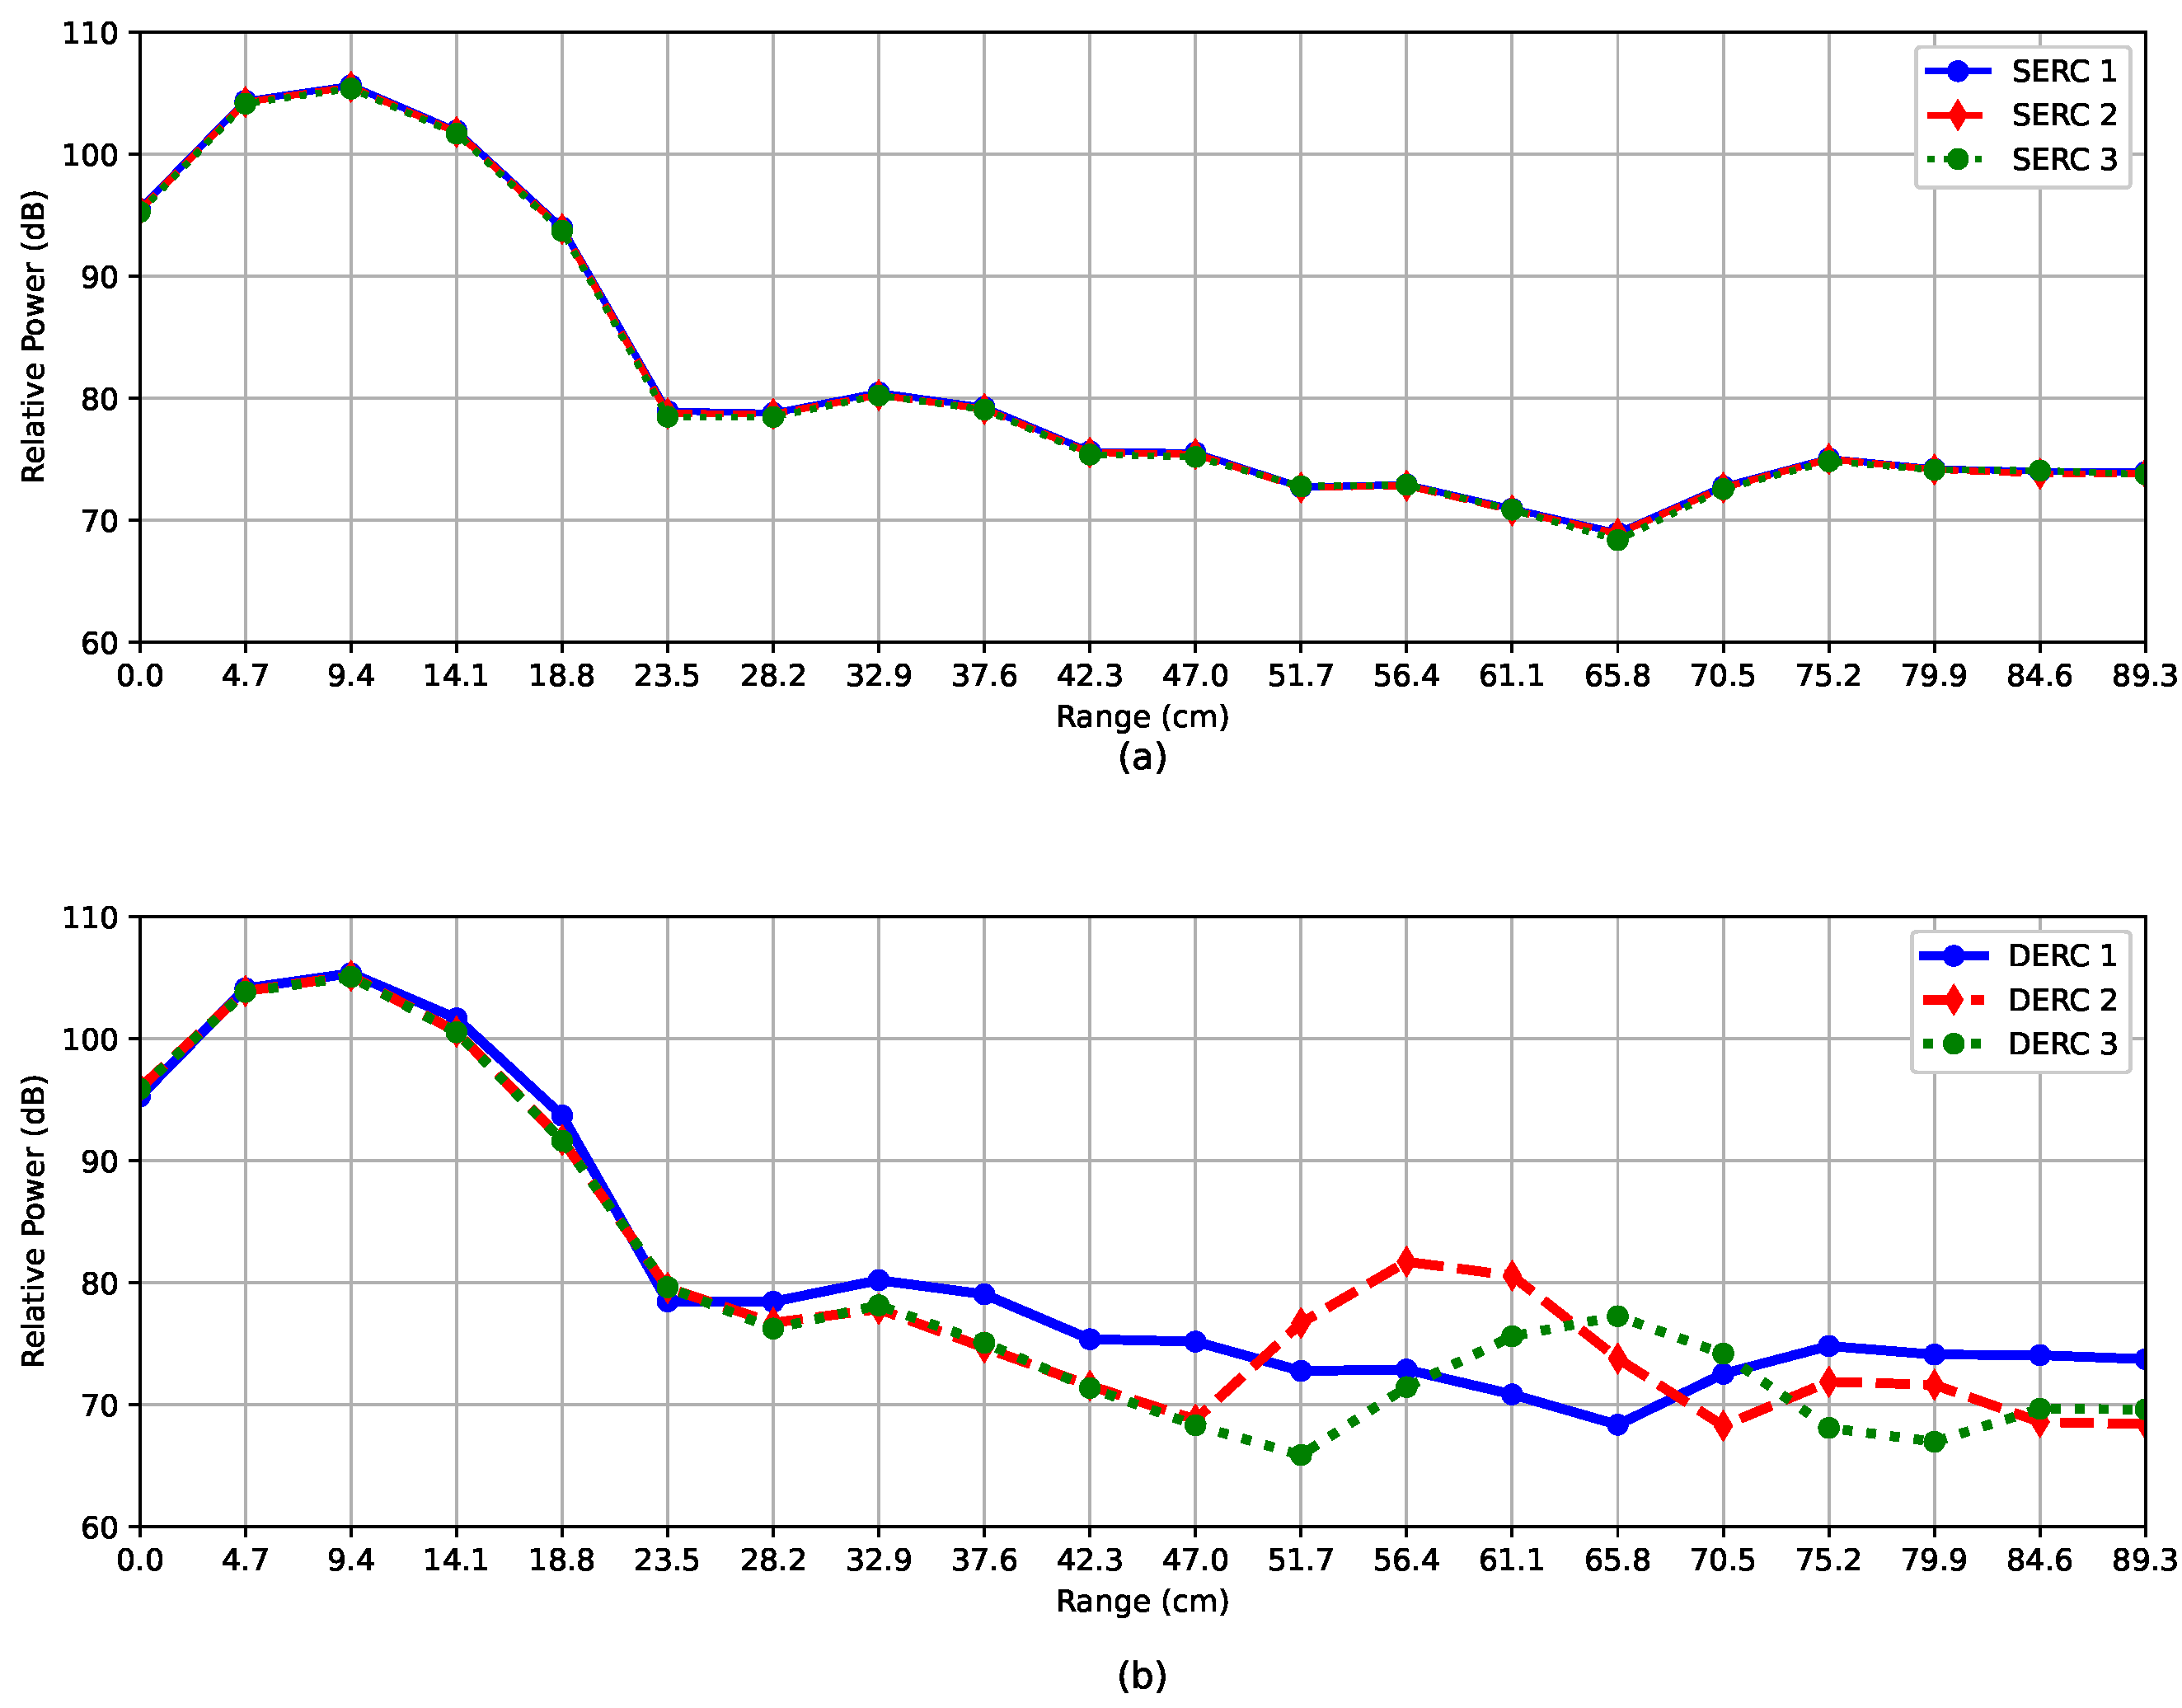
To estimate the environmental noise that affects the relative power measured by the AWR radar, several measurements were performed. In particular, to emphasize the noise contributions that apply to the data, two different types of measurements were applied (see Figure 5). In the first set of data, measurements were repeated using the same radar configuration at different time intervals under the same environmental conditions. In the second set, measurements were repeated using the same radar configuration at different time intervals under different environmental conditions. This latter condition refers to variations in the position of objects near the radar. It is important to note that, in all cases, measurements were performed with no target placed in front of the radar. The relative power corresponding to the backscattered intensity by the environment is shown in Figure 5, where blue, red, and green are the curves corresponding to the same environmental radar conditions (SERC, a) and the different environmental radar conditions (DERC, b). For a qualitative and quantitative comparison between the two figures, it can be noted that from 0 to 23.5 cm the behavior of the relative power is the same in all measurements. In particular, the curves are perfectly overlapped between the SERC case and the corresponding DERC one. This means that, in this range, the noise is no longer random but is deterministic. Since no objects are placed from 0 to 23.5 cm, the peak relative power values are not due to the environment but to the patch antenna system, i.e., to the radar itself. In other words, since the Tx and the Rx antennas are very close to each other on the radar platform, the relative power in the 0–23.5 cm range corresponds to a direct coupling between Tx and Rx. This contribution, created by self-interference between Tx and Rx antennas, can affect the target measurements, generating false alarms at distance points where no targets are present. This self-interference or antenna coupling contribution can be removed by applying a post-processing technique, i.e., the NEM removal technique, on the received relative power, as shown in Section 3.2 and Section 3.3. This fundamental aspect is an intrinsic limitation of the AWR radar when measurements with targets are performed within this range (0–23.5 cm), as the radar will not detect the objects. As a matter of fact, the AWR radar does not allow for the detection of objects up to five times the range resolution when the value of 4.7 cm is chosen. This distance is a function of the range resolution chosen in radar parameter configuration. From 23.5 to 89.3 cm, the three trends overlap in the SERC cases (due to the same environmental conditions being considered) while they are different in the DERC cases, where the measurements correspond to different environmental conditions. For the purpose of this paper, an average value of the three environmental noise measurements (in the SERC case) was taken and used to apply the NEM removal technique to the target data. It is important to note that the NEM removal technique, using stationary environmental conditions, results in small errors—usually lower than 0.3 dB—in the relative power of the target (see Section 3.2). Accordingly, the NEM technique is sub-optimal, since a residual error smaller than 0.3 dB is expected.
Figure 5.
Relative power in (dB) scale versus range (cm): independent measurements relative to (a) the same environmental radar conditions (SERC) and (b) different environmental radar conditions (DERC).
3.2. Sensitivity Analysis to Dielectric Properties
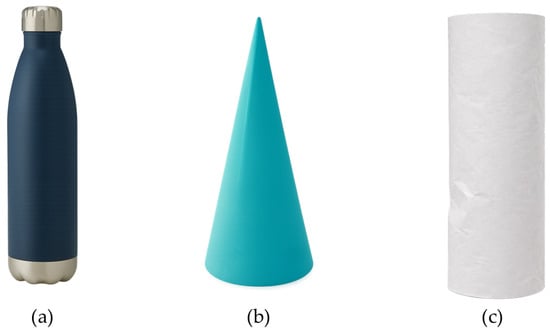
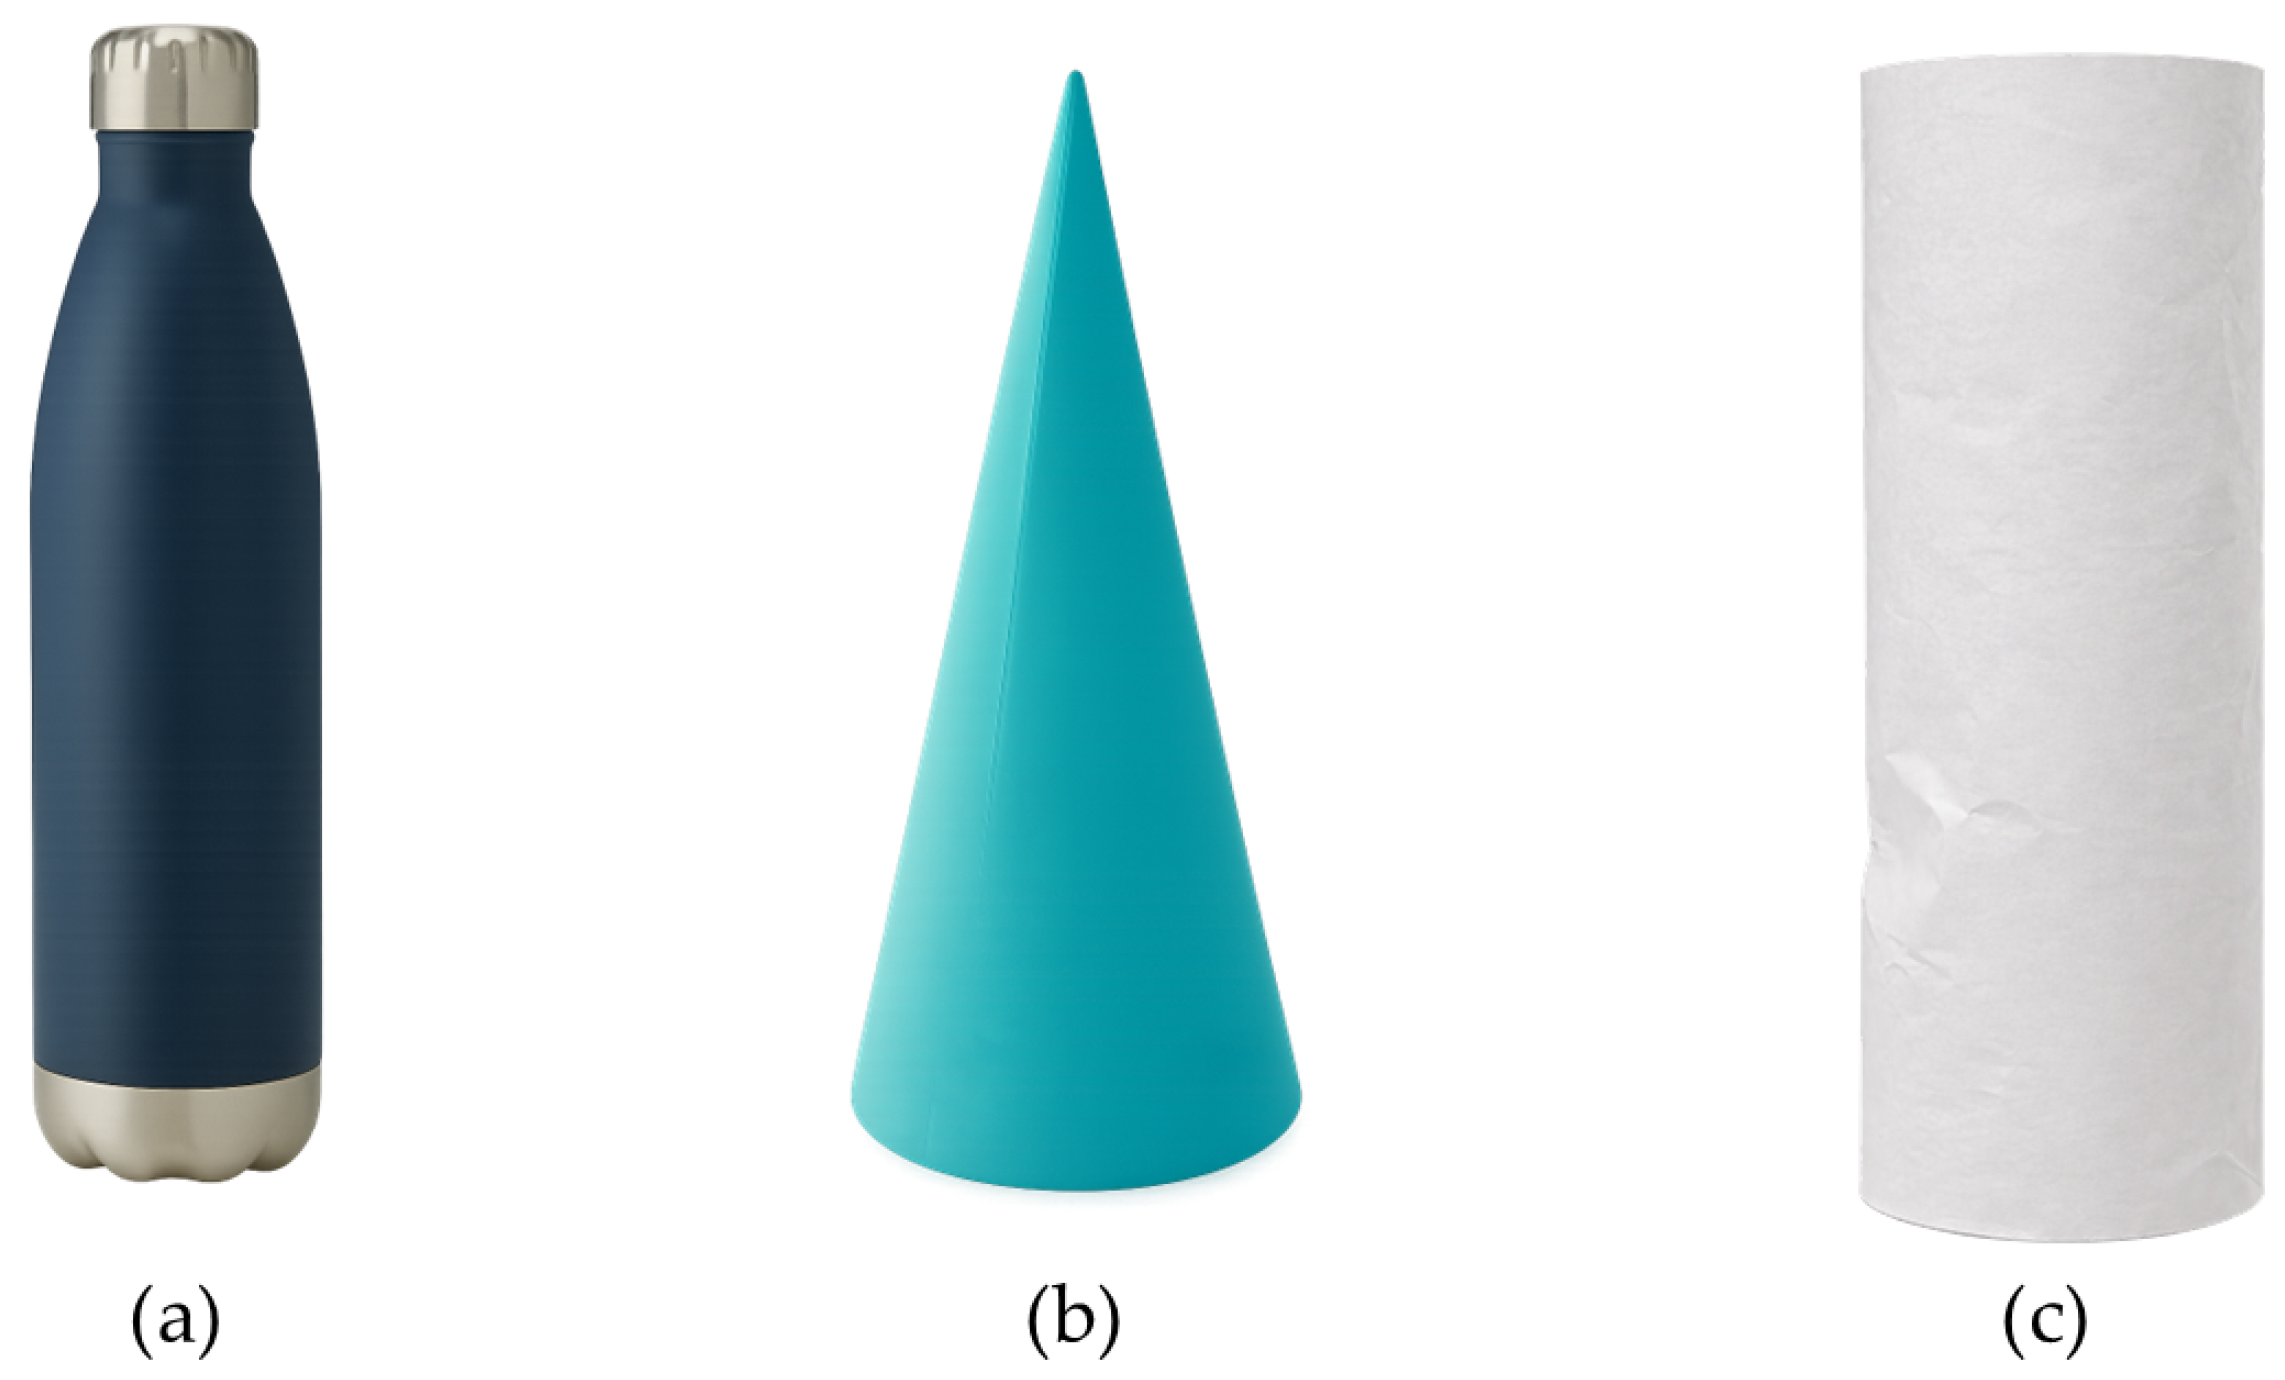
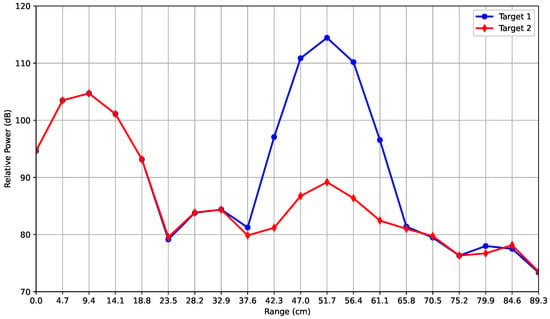
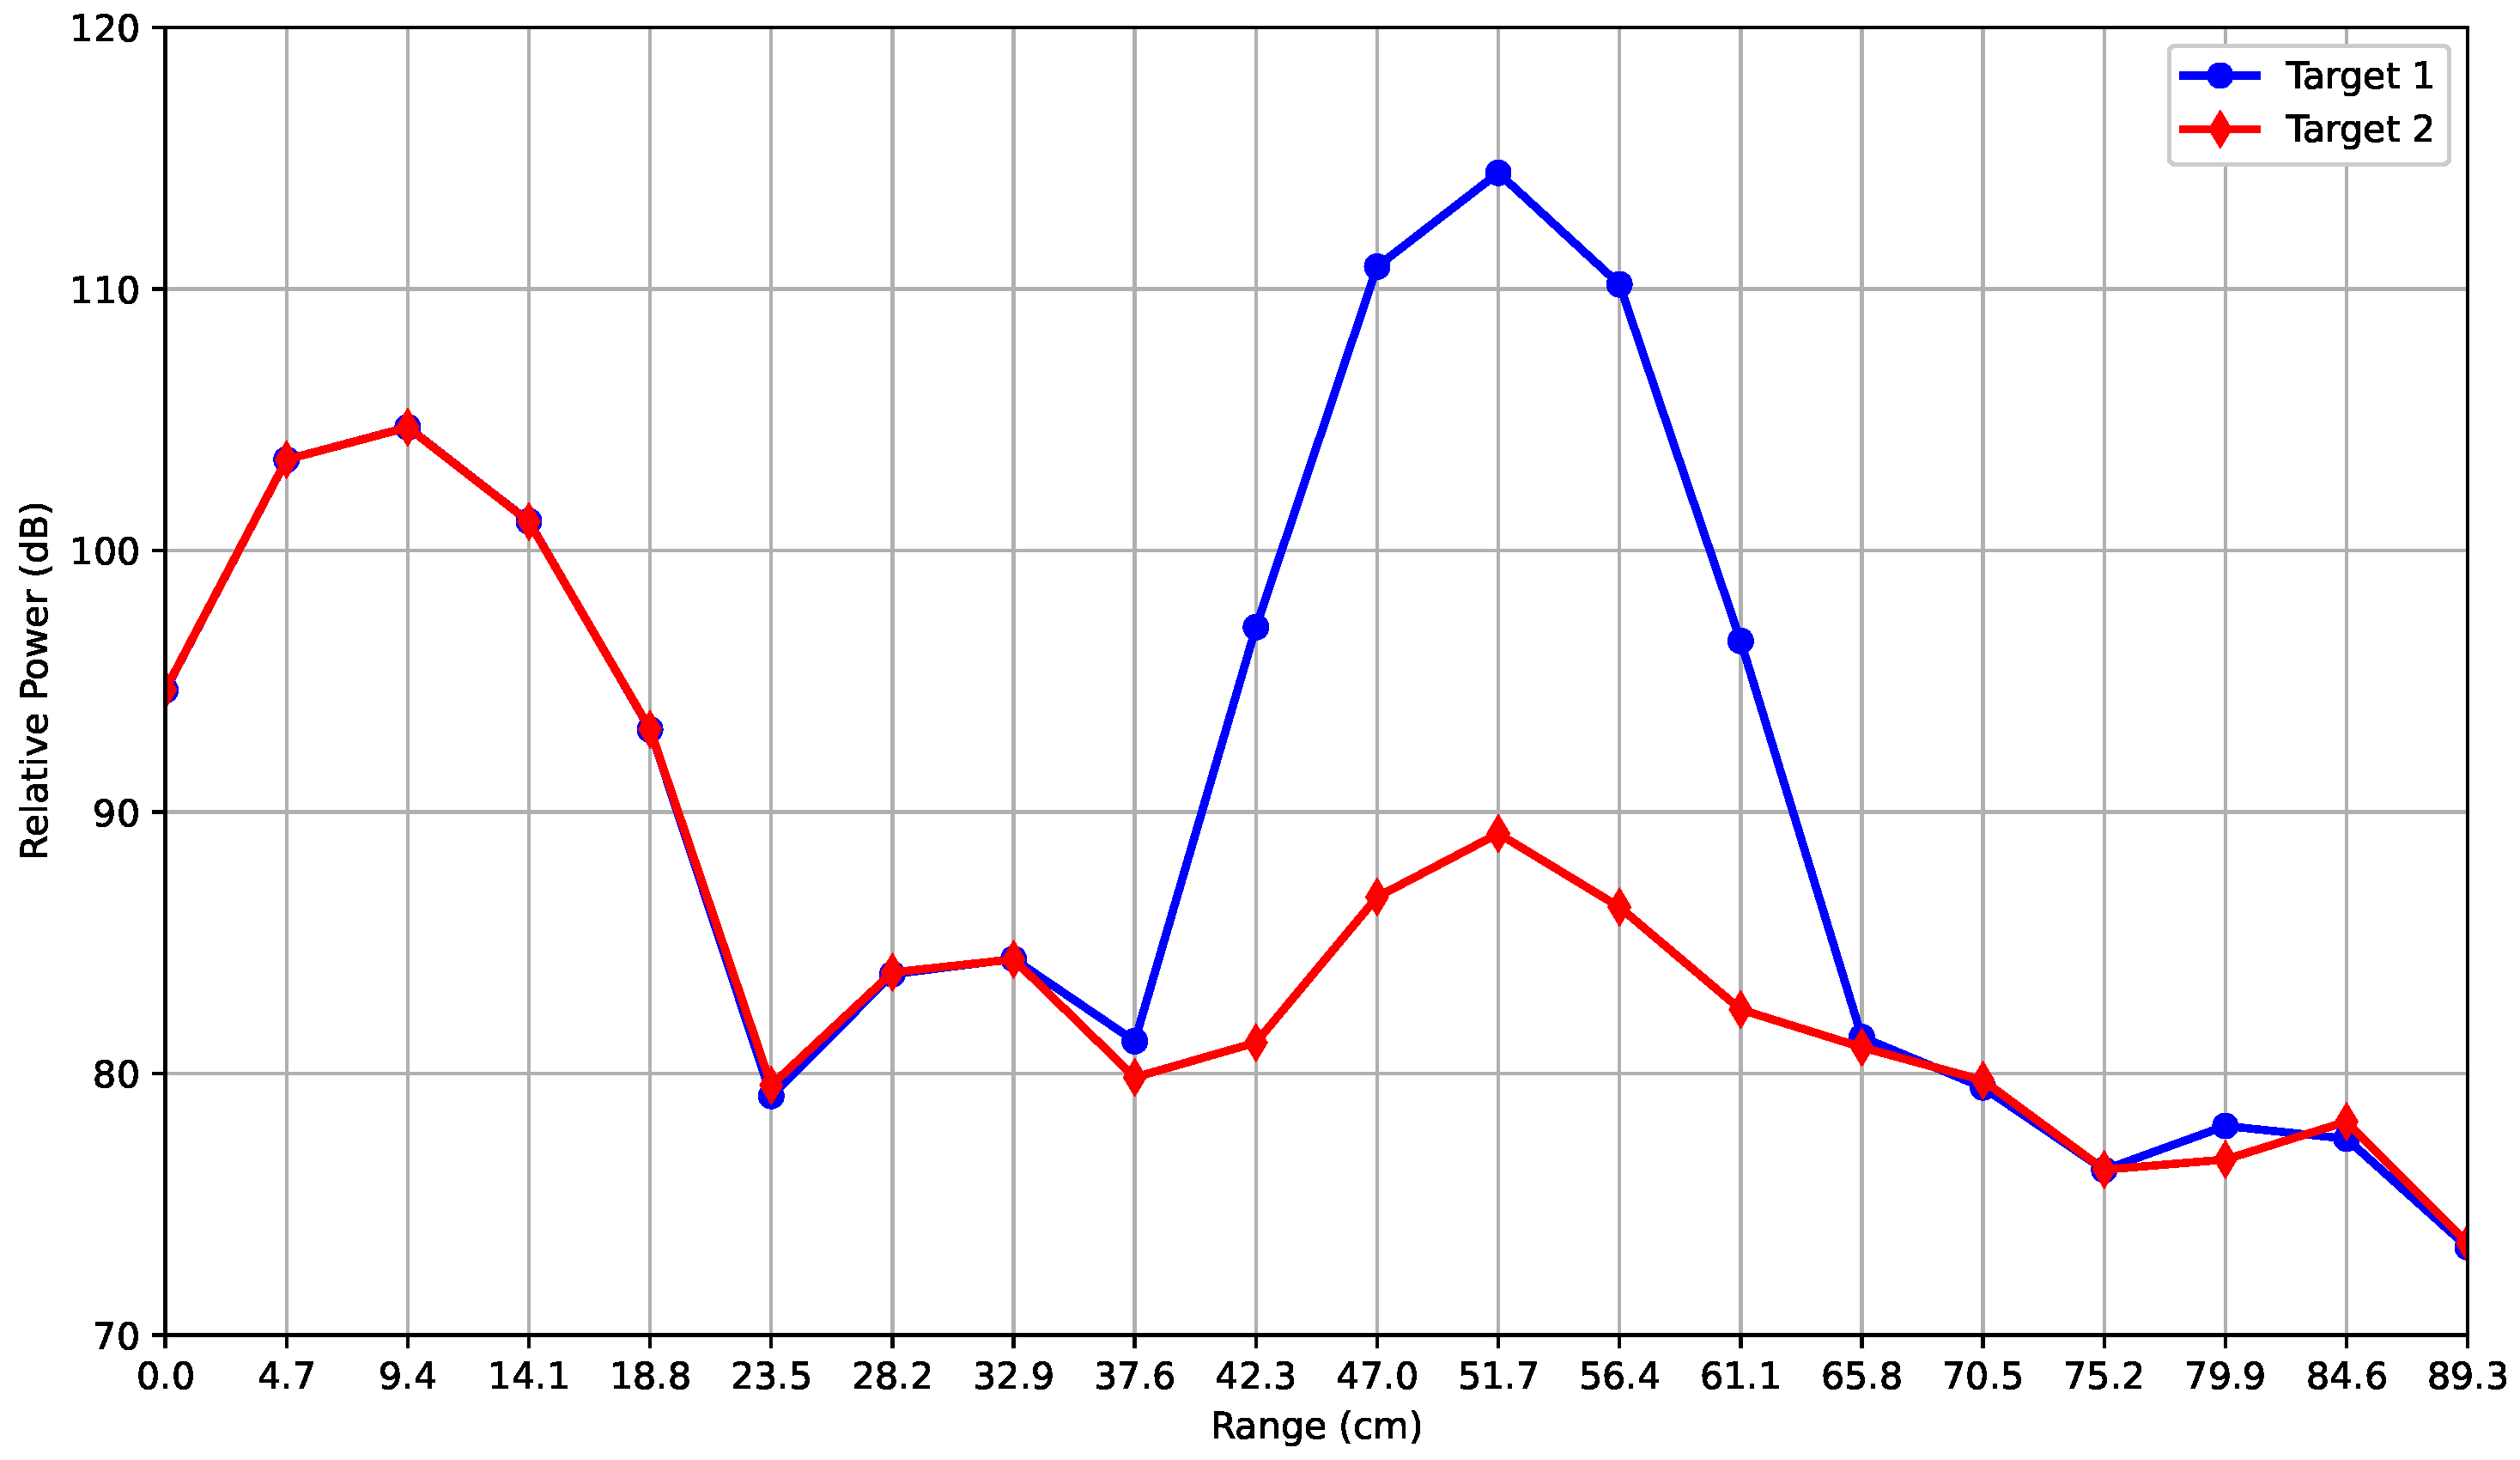
The relative powers reflected by different targets—a cylindrical metallic bottle (target 1) with a volume of about 1 dm3, and a square pyramid-shaped graphene absorbing cone (target 2) with a volume of about 0.25 dm3—were analyzed (see Table 2 and Figure 6). Both targets were placed at a 50 cm distance during two independent measurements. Figure 6 shows the results obtained for the two targets when the proposed NEM removal technique was not applied, where the blue and red curves refer to target 1 and target 2, respectively.
Table 2.
Main features of the targets shown in Figure 6.
Figure 6.
Targets used for the experiments: (a) metallic bottle, (b) absorbing cone, (c) A4 rolled paper.
It can be observed that, in the range from 0 to 23.5 cm, the profiles are completely overlapped. This further confirms the presence of a deterministic relative noise power, i.e., the Tx and Rx antenna coupling, which is not related to the targets.
In the 37.6 cm–65.8 cm range, the difference in the relative power of the targets is clearly visible, illustrating that the AWR radar is sensitive to the different materials that comprise the two targets. In particular, the radar is sensitive to the differences in the permittivity of the materials that comprise the target. The relative power peak of target 1 is equal to 114 dB, while that corresponding to the target 2 is equal to 89 dB (Figure 7), i.e., a difference of 25 dB, at 51.7 cm in both cases, compatible with the actual distance from the radar (50 cm). For ranges greater than 65.8 cm, since at this distance the measurement environment is the same for both targets, the two profiles overlap, with differences of less than 1 dB.
Figure 7.
Relative power (dB) versus range (cm) for metallic bottle (target 1—blue line) and absorbing cone (target 2—red line) before NEM removal technique.
To obtain a noise-free relative power from the targets, the NEM removal technique was applied, in addition to what has been done in previous works [24,26]. This technique aims at getting noise-free measurements by removing the deterministic (i.e., antenna coupling peak) and random (i.e., environmental) noise components, which introduce unexpected fluctuations in the relative power. The NEM removal technique exploits the independence between measurements: it consists of a subtraction method between the power backscattered by targets and the average of the three environmental backscattered signal noise measurements described in Section 3.1. The NEM technique works directly in logarithmic units (dB). Hereinafter, relative power data values after applying the NEM removal technique are considered.
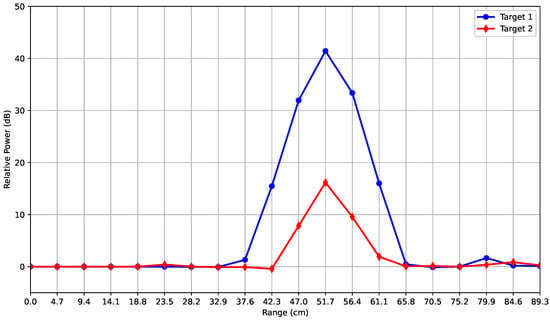
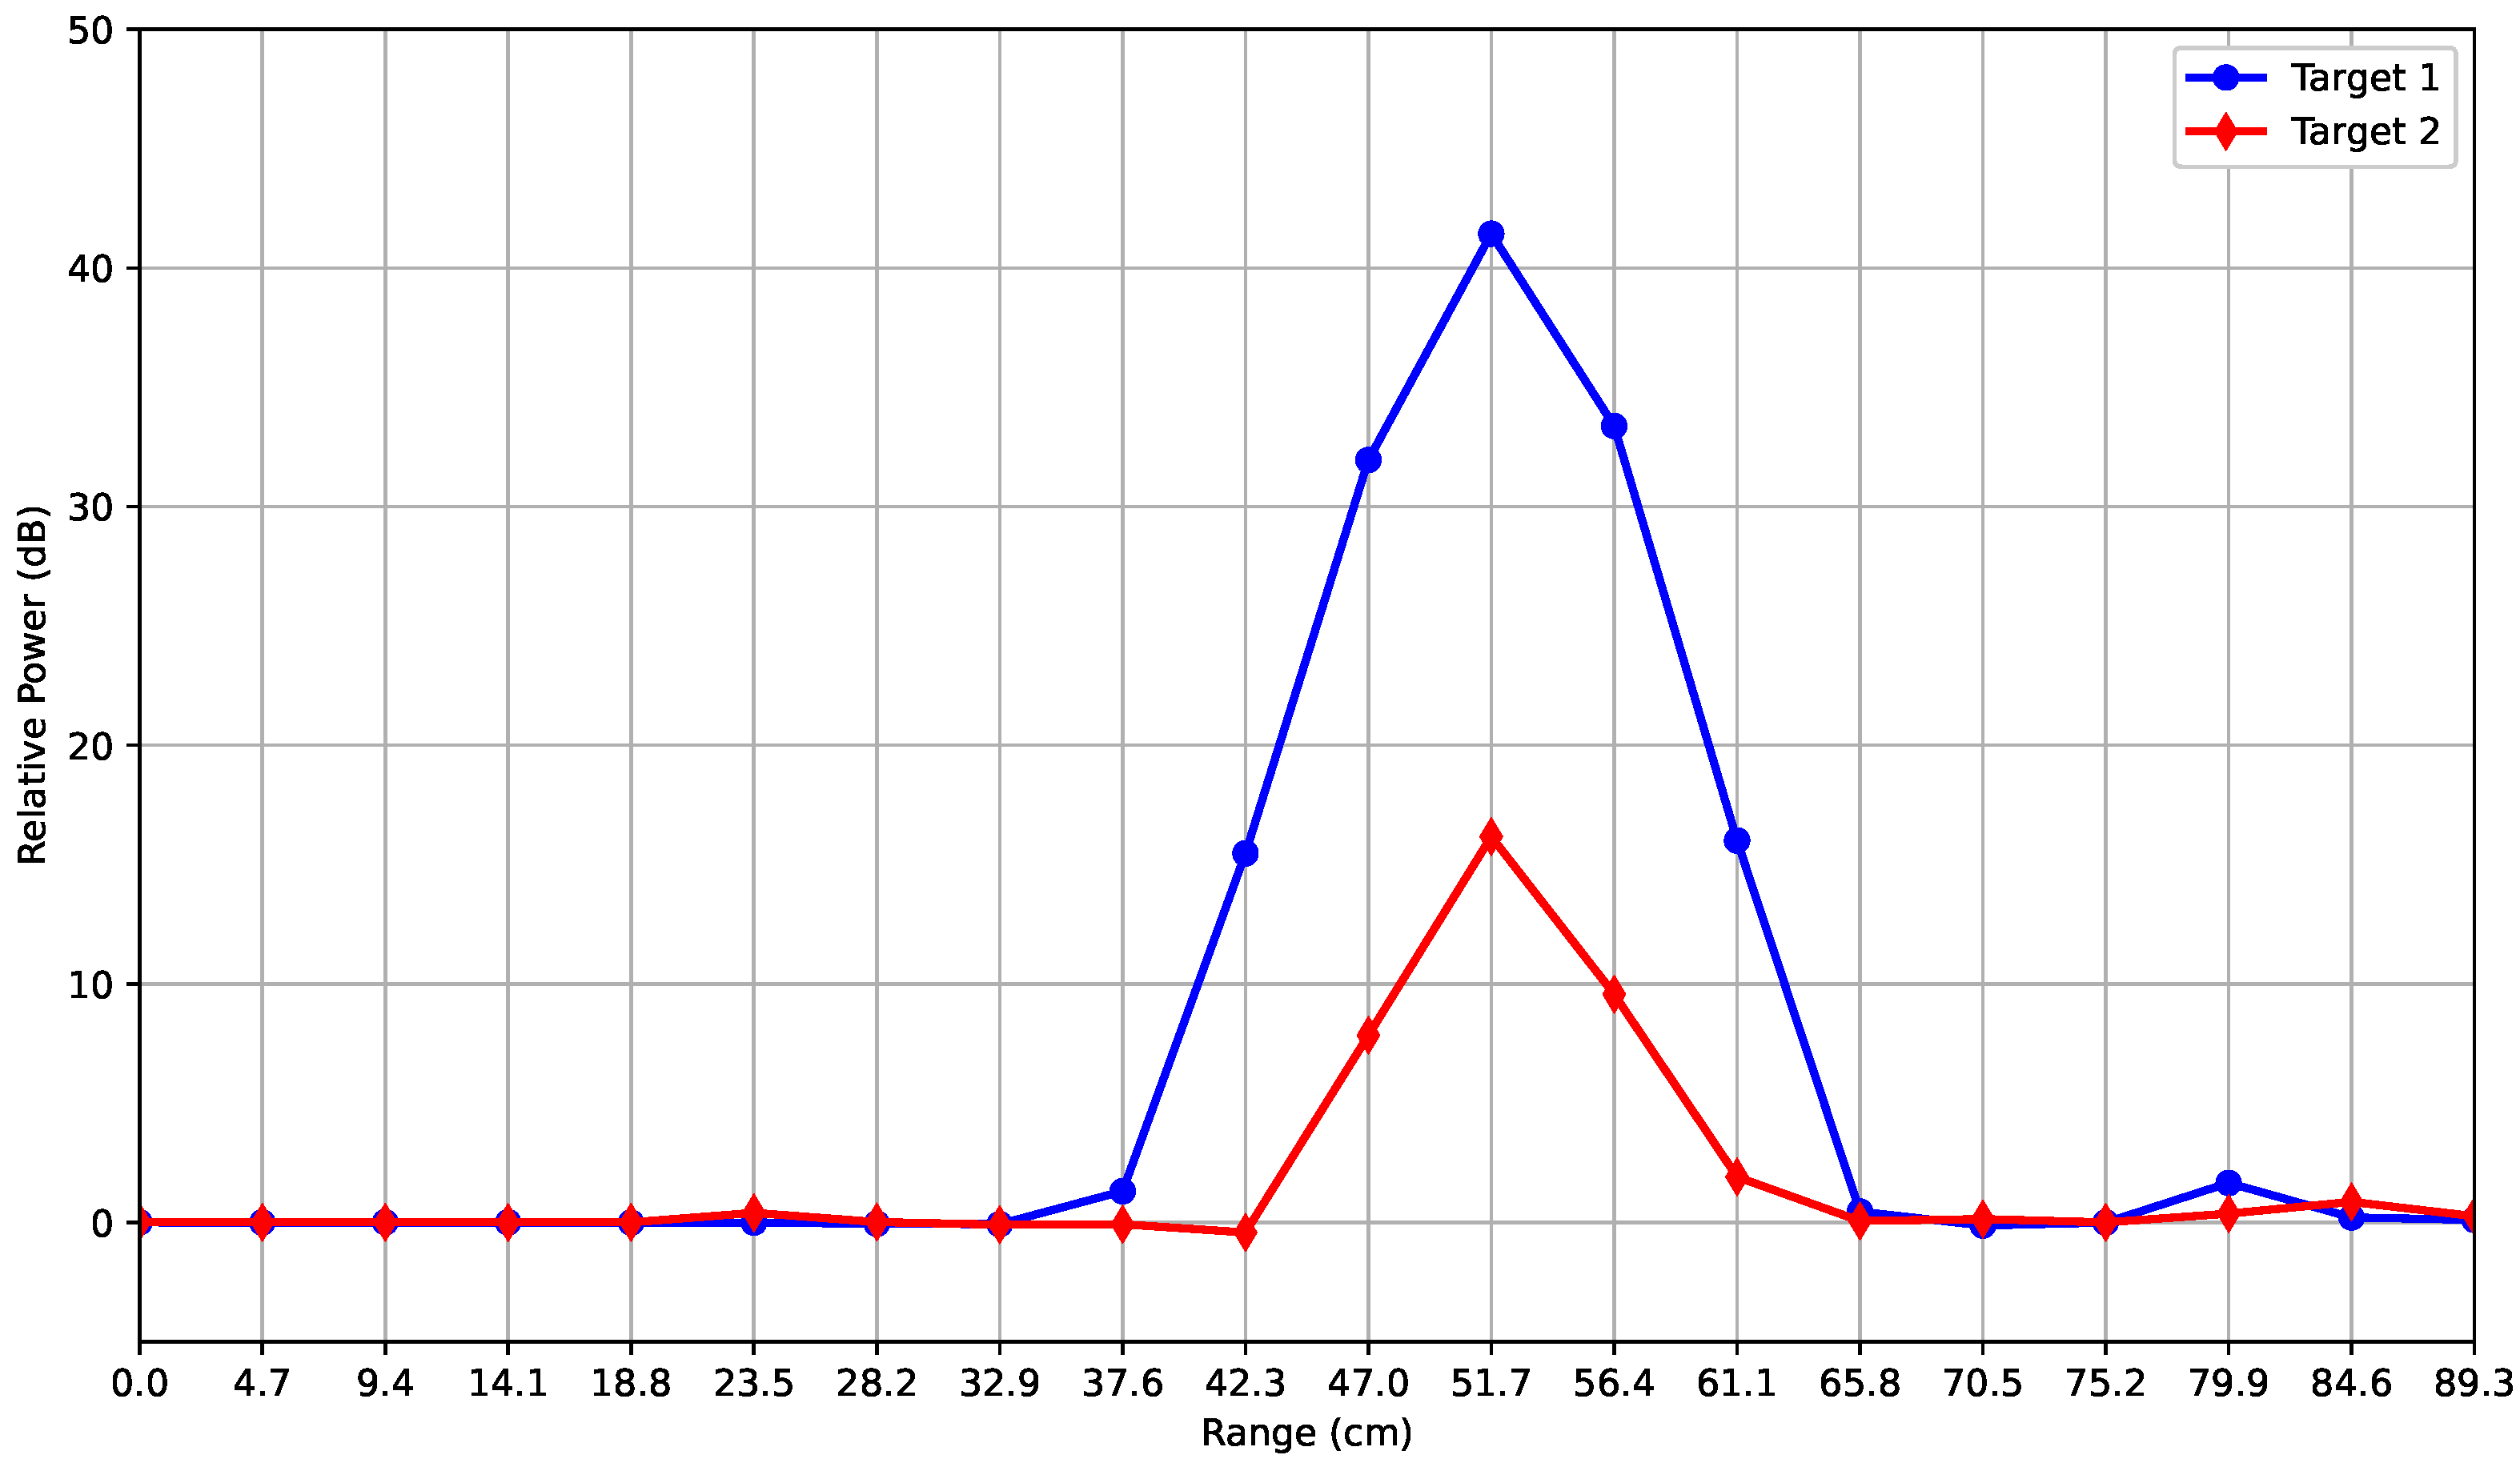
The results obtained for the two targets using the NEM removal technique are shown in Figure 8. Even in this case, the two targets were detected by the radar. With respect to noisy measurements (see Figure 7), the relative power reads 0 dB. The first peak was observed at a 51.7 cm distance for both targets, as expected. It should be noted that the highest peak (about 42 dB) was given by the metallic bottle, while the peak associated with the absorbing cone was still lower and equal to 17 dB, meaning that the difference between the targets corresponding to the noise-affected and noise-free measurement cases remained unchanged and was equal to 25 dB. These results highlight the sensitivity of the AWR radar to the target materials. The lobe widths of the blue and red curves in the noise-free results are equal to those of the corresponding noise-affected ones. In fact, the start and end points of the two lobes are at 37.6 cm and 65.8 cm on the x-axis, respectively, in both cases.
Figure 8.
Relative power (dB) versus range (cm) for metallic bottle (target 1—blue line) and absorbing cone (target 2—red line) after NEM removal technique.
It is important to note that the red and the blue curves have 0 dB of reflected power from 0 to 32.9 cm on the range axis. Such behavior is confirmed by the measurement configuration adopted, since no targets are present in this range. From 37.6 to 65.8 cm, the difference in relative power profile for the two targets is due to their different dielectric properties. In particular, due to the NEM removal technique, it must be noted that from 37.6 to 42.3 cm the red curve values are almost equal to 0 dB, since the NEM removal technique proposed here entails an average of three different environmental measurements, as described in Section 3.1. In other words, measurements downstream of the NEM technique are affected by very small errors (less than 0.2 dB), since an average is applied. These errors are present at the edge of the lobes, i.e., 42.3 cm and 65.8 cm on the range axis. Once again, the NEM removal technique does not change the effective difference between the relative power values of the targets. The difference between the blue curve, i.e., target 1, and the red curve, i.e., target 2, is equal to 15.98 dB without applying the NEM removal technique and 15.88 dB when applying the NEM removal technique when the 42.3 cm point is considered.
3.3. Analysis of Sensitivity to the Degree of Wetness
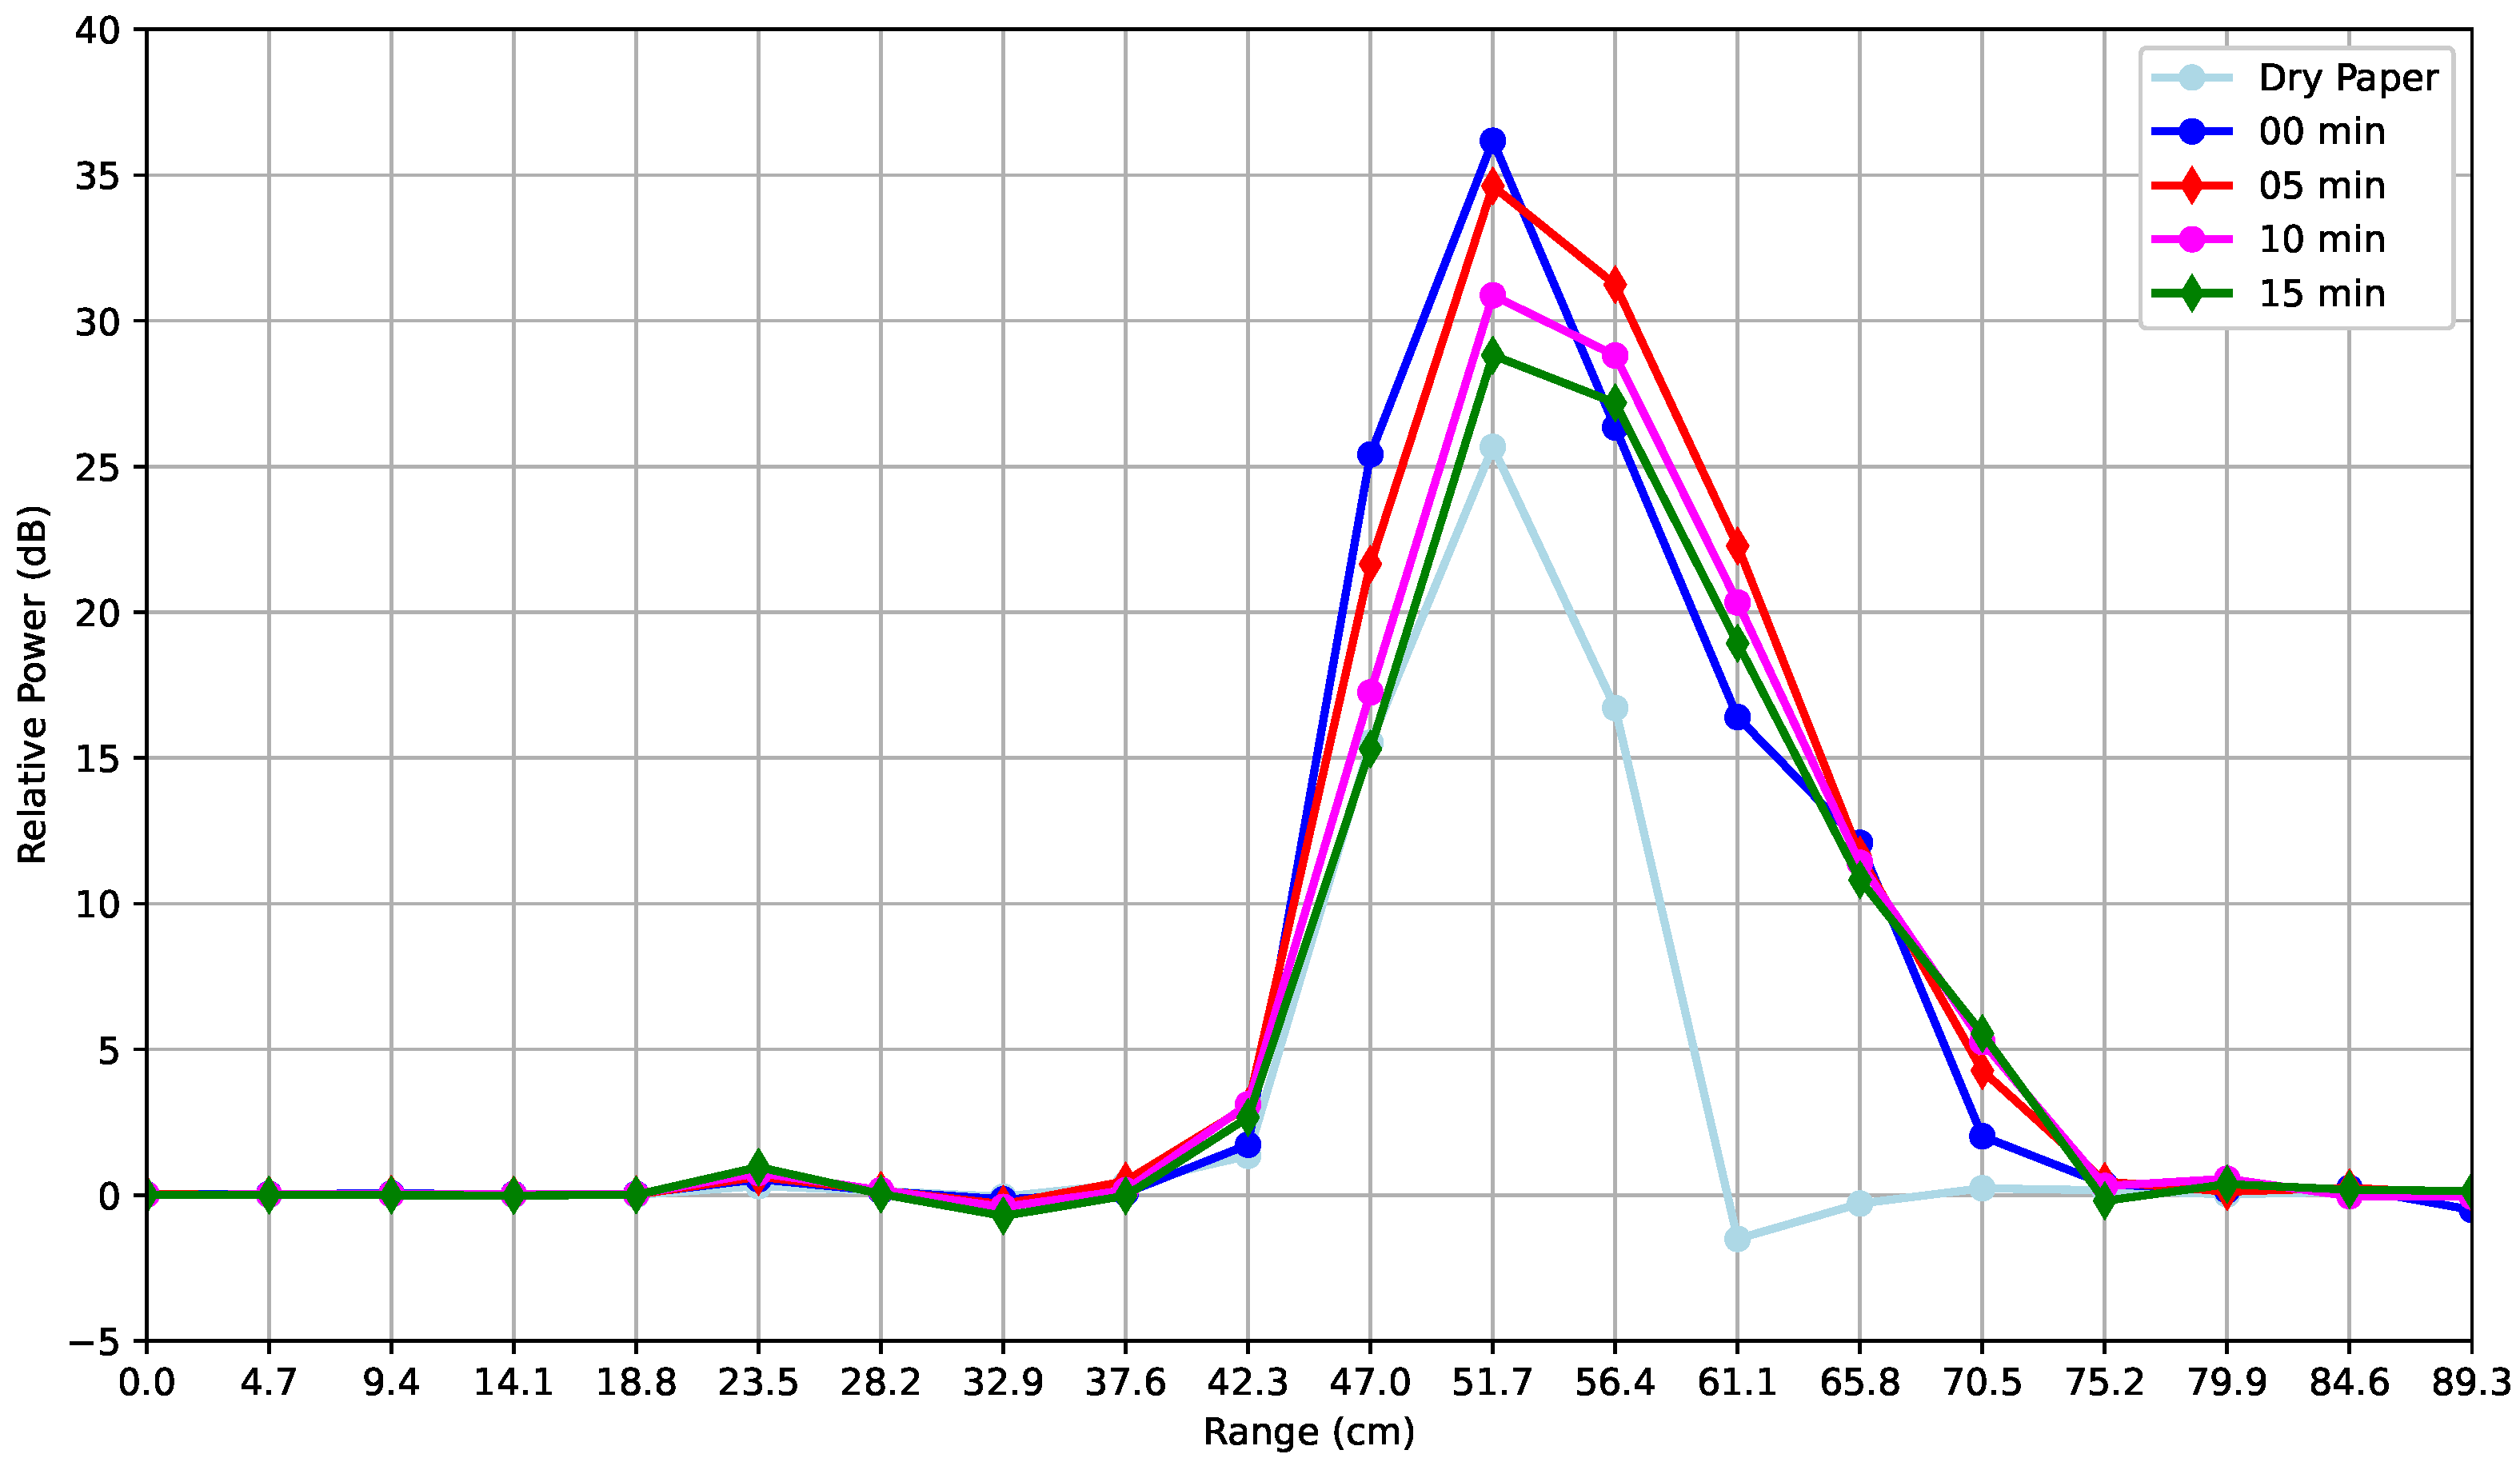
In this section, the results of the third experiment on a piece of wet commercial A4 paper are shown. A single rolled sheet of paper forming a hollow cylinder was placed vertically in front of the radar at a 50 cm distance. Five different measurements were performed, where the first was obtained considering the dry paper. Then, water was sprayed onto the side of the paper facing the radar, and starting from t = 0 s, measurements of the relative power of the wet paper were obtained. Therefore, the measurements were performed at t = 0, 5, 10, and 15 min. The results of the temporal evolution of the relative power profiles under different degrees of wetness are shown in Figure 9.
Figure 9.
Relative power (dB) versus range (cm): profiles of dry paper and paper sprayed with water over different time intervals.
With reference to Figure 9, a significant decrease in relative power over time can be observed. In fact, by considering the distance of 51.7 cm on the range axis, the highest relative power obtained by the radar, after the NEM subtraction technique was applied, is given by the blue curve, which is equal to 36 dB. This curve corresponds to a t = 0 s case, i.e., when the paper sheet was just sprayed with water. The lowest value (28 dB), without considering the dry paper case, is given by the green curve, i.e., when the t = 15 min case is considered. As expected, this value is very close to the dry paper measurement (cyan curve), highlighting the AWR radar’s sensitivity to the degree of wetness. In other words, the relative power is directly related to the water content of the target. In particular, as already shown in Section 3.2, the radar is sensitive to the differences in the permittivity of the material that comprises the target. Once again, the slightly negative values of the dry paper are due to the application of the NEM removal technique. The differences in width between the lobes of the sprayed paper and the dry paper are due to the dielectric properties and backscattering of water [32]. This means that, despite being designed for automotive purposes, the sensitivity to targets with different material permittivity could be explored in future works on environmental sensing.
4. Conclusions
This paper investigated the performance of the TI AWR1843BOOST FMCW mmWave radar for short-range sensing applications, with particular attention to measurements affected by environmental noise and antenna coupling. A sub-optimal post-processing technique termed as “NEM removal” is proposed to mitigate both deterministic (i.e., the antenna coupling signal) and stochastic (i.e., relative to environmental configurations) noise components.
Experimental results obtained with targets characterized by different geometry and dielectric properties demonstrate that the proposed approach improves the data quality, reducing false alarms or false positives due to the direct coupling while preserving relative power differences. As a matter of fact, the range distance that prevents object detection is equal to a multiple of the range resolution chosen during the AWR radar parameter configuration. Measurements also confirm the sensitivity of the AWR radar signal to the degree of wetness of targets and, in general, to the permittivity of different material characteristics, which could be explored in future work on environmental sensing.
This means that, despite being designed for automotive purposes, the radar can be effectively used to perform environmental proximity sensing.
Author Contributions
Conceptualization, S.Y., E.S. and A.S.; Methodology, E.S., A.S. and S.Y.; Software, E.S., A.S.; Validation, All; Data Curation, S.Y., E.S. and A.S.; Writing—original draft preparation, S.Y. and E.S.; writing—review and editing, All; Visualization, A.S., E.S. and S.Y.; Supervision: A.F., M.M. and A.B.; Project Administration: A.F., M.M. and A.B.; Funding Acquisition: A.F., M.M., A.B. All authors have read and agreed to the published version of the manuscript.
Funding
This study was partially funded by the European Union-Next Generation EU and the Italian Ministry of University and Research (MUR) under the Research Projects of National Relevance (PRIN) 2022 Resilience and Recovery National Plan (PNRR) “Innovative technologies for non-invasive assessment of plant health condition to support precision farming (VEGETATION)”, project ID P2022ZF9P2. This study was partially supported by the Italian Ministry of Enterprises and Made in Italy (MMIT) within the “ACCORDI PER L’INNOVAZIONE” (2026-2028) through the Project EOPAC under Grant CUP: B29I23001460007.
Data Availability Statement
All experiments were performed on actual radar measurements undertaken for the purpose of this study.
Conflicts of Interest
The authors declare no conflict of interest.
References
- Venon, A.; Dupuis, Y.; Vasseur, P.; Merriaux, P. Millimeter wave FMCW radars for perception, recognition and localization in automotive applications: A survey. IEEE Trans. Intell. Veh. 2022, 7, 533–555. [Google Scholar] [CrossRef] [Scilit]
- Morris, P.J.B.; Hari, K. Detection and localization of unmanned aircraft systems using millimeter-wave automotive radar sensors. IEEE Sens. Lett. 2021, 5, 6001304. [Google Scholar] [CrossRef] [Scilit]
- Wilson, A.; Kumar, A.; Jha, A.; Cenkeramaddi, L.R. Embedded sensors, communication technologies, computing platforms and machine learning for UAVs: A review. IEEE Sens. J. 2021, 22, 1807–1826. [Google Scholar] [CrossRef] [Scilit]
- Soumya, A.; Krishna Mohan, C.; Cenkeramaddi, L.R. Recent advances in mmWave-radar-based sensing, its applications, and machine learning techniques: A review. Sensors 2023, 23, 8901. [Google Scholar] [CrossRef] [Scilit] [PubMed]
- Sweeney, C.; Lie, D.Y.C.; Mayeda, J.C.; Lopez, J. Broadband Millimeter-Wave Front-End Module Design Considerations in FD-SOI CMOS vs. GaN HEMTs. Appl. Sci. 2024, 14, 11429. [Google Scholar] [CrossRef] [Scilit]
- Iovescu, C.; Rao, S. The Fundamentals of Millimeter Wave Radar Sensors; Texas Instruments: Dallas, TX, USA, 2020; pp. 1–7. [Google Scholar]
- Park, J.; Nguyen, C. Development of a new millimeter-wave integrated-circuit sensor for surface and subsurface sensing. IEEE Sens. J. 2006, 6, 650–655. [Google Scholar] [CrossRef] [Scilit]
- Nakagawa, T.; Hyodo, A.; Kogo, K.; Kurata, H.; Osada, K.; Oho, S. Contactless liquid-level measurement with frequency-modulated millimeter wave through opaque container. IEEE Sens. J. 2012, 13, 926–933. [Google Scholar] [CrossRef] [Scilit]
- Skaria, S.; Hendy, N.; Al-Hourani, A. Machine-learning methods for material identification using mmWave radar sensor. IEEE Sens. J. 2022, 23, 1471–1478. [Google Scholar] [CrossRef] [Scilit]
- Weiß, J.; Santra, A. One-shot learning for robust material classification using millimeter-wave radar system. IEEE Sens. Lett. 2018, 2, 7001504. [Google Scholar]
- Omer, A.E.; Shaker, G.; Safavi-Naeini, S.; Murray, K.; Hughson, R. Glucose levels detection using mm-wave radar. IEEE Sens. Lett. 2018, 2, 3502004. [Google Scholar] [CrossRef] [Scilit]
- Arab, H.; Chioukh, L.; Ardakani, M.D.; Dufour, S.; Tatu, S.O. Early-stage detection of melanoma skin cancer using contactless millimeter-wave sensors. IEEE Sens. J. 2020, 20, 7310–7317. [Google Scholar] [CrossRef] [Scilit]
- Yu, Y.S.; Wie, S.; Lee, H.; Lee, J.; Kim, N.H. Long Short-Term Memory-Based Fall Detection by Frequency-Modulated Continuous Wave Millimeter-Wave Radar Sensor for Seniors Living Alone. Appl. Sci. 2025, 15, 8381. [Google Scholar] [CrossRef] [Scilit]
- Liang, Y.; Zhou, A.; Wen, X.; Huang, W.; Shi, P.; Pu, L.; Zhang, H.; Ma, H. airBP: Monitor your blood pressure with millimeter-wave in the air. ACM Trans. Internet Things 2025, 15, 28. [Google Scholar] [CrossRef] [Scilit]
- Antolinos, E.; García-Rial, F.; Hernández, C.; Montesano, D.; Godino-Llorente, J.I.; Grajal, J. Cardiopulmonary activity monitoring using millimeter wave radars. Remote Sens. 2020, 12, 2265. [Google Scholar] [CrossRef] [Scilit]
- Kim, S.; Shin, H.C. Automatic Extraction of Doppler Envelopes for Gait Analysis Using FMCW Radar: A Novel Approach for Spatio-Temporal Parameters Estimation. Appl. Sci. 2025, 15, 7446. [Google Scholar] [CrossRef] [Scilit]
- Brooker, G.M.; Scheding, S.; Bishop, M.V.; Hennessy, R.C. Development and application of millimeter wave radar sensors for underground mining. IEEE Sens. J. 2005, 5, 1270–1280. [Google Scholar] [CrossRef] [Scilit]
- Wu, Z.; Ma, X.; Chang, F.; Li, C.; Luo, Z.; Leung, M.-F. Enhanced Sensing for Automotive mmWave Radar: Super-Resolution Range and Angle Estimation With Coherent Extension and Advanced IAA. IEEE Trans. Consum. Electron. 2025, 71, 4797–4806. [Google Scholar] [CrossRef] [Scilit]
- Takamatsu, H.; Hinohara, N.; Suzuki, K.; Fuminori, S. Experimental Analysis of Accuracy and Precision in Displacement Measurement Using Millimeter-Wave FMCW Radar. Appl. Sci. 2025, 15, 3316. [Google Scholar] [CrossRef] [Scilit]
- Zhang, Z.; Meng, W.; Song, M.; Liu, Y.; Zhao, Y.; Feng, X.; Li, F. Application of multi-angle millimeter-wave radar detection in human motion behavior and micro-action recognition. Meas. Sci. Technol. 2022, 33, 105107. [Google Scholar] [CrossRef] [Scilit]
- de Ponte Müller, F. Survey on ranging sensors and cooperative techniques for relative positioning of vehicles. Sensors 2017, 17, 271. [Google Scholar] [CrossRef] [Scilit]
- Schneider, M. Automotive radar—Status and trends. In Proceedings of the German Microwave Conference, Ulm, Germany, 5–7 April 2005; pp. 144–147. [Google Scholar]
- Chang, S.; Zhang, Y.; Zhang, F.; Zhao, X.; Huang, S.; Feng, Z.; Wei, Z. Spatial attention fusion for obstacle detection using mmwave radar and vision sensor. Sensors 2020, 20, 956. [Google Scholar] [CrossRef] [Scilit]
- Kang, J.; Hamidi, O.; Vanäs, K.; Eidevåg, T.; Nilsson, E.; Friel, R. Effects of Dust and Moisture Surface Contaminants on Automotive Radar Sensor Frequencies. Sensors 2025, 25, 2192. [Google Scholar] [CrossRef] [Scilit]
- Yousaf, S.; Iqbal, M.A.; Buono, A.; Nunziata, F.; Migliaccio, M. Active Microwave Sensors for Vegetation Water Content Estimation. In Proceedings of the 2024 IEEE International Humanitarian Technologies Conference (IHTC), Bari, Italy, 27–30 November 2024; pp. 1–6. [Google Scholar]
- Santos, L.C.; dos Santos, F.N.; Morais, R.; Duarte, C. Potential non-invasive technique for accessing plant water contents using a radar system. Agronomy 2021, 11, 279. [Google Scholar] [CrossRef] [Scilit]
- Čermák, J.; Kučera, J.; Nadezhdina, N. Sap flow measurements with some thermodynamic methods, flow integration within trees and scaling up from sample trees to entire forest stands. Trees 2004, 18, 529–546. [Google Scholar] [CrossRef] [Scilit]
- Cenkeramaddi, L.R.; Rai, P.K.; Dayal, A.; Bhatia, J.; Pandya, A.; Soumya, J.; Kumar, A.; Jha, A. A novel angle estimation for mmWave FMCW radars using machine learning. IEEE Sens. J. 2021, 21, 9833–9843. [Google Scholar] [CrossRef] [Scilit]
- Hu, Y.; Toda, T. Remote vital signs measurement of indoor walking persons using mm-wave FMCW radar. IEEE Access 2022, 10, 78219–78230. [Google Scholar] [CrossRef] [Scilit]
- Texas Instruments. AWR1843BOOST, Single-Chip 76-GHz to 81-GHz Automotive Radar Sensor Evaluation Module. 2025. Available online: https://www.ti.com/tool/AWR1843BOOST (accessed on 31 July 2025).
- Texas Instruments. mmWave Demo Visualizer. 2025. Available online: https://dev.ti.com/gallery/view/mmwave/mmWave_Demo_Visualizer/ver/3.5.0/ (accessed on 31 July 2025).
- Simula, S.; Ikäläinen, S.; Niskanen, K.; Varpula, T.; Seppä, H.; Paukku, A. Measurement of the Dielectric Properties of Paper. J. Imaging Sci. Technol. 1999, 43, 472–477. [Google Scholar] [CrossRef] [Scilit]

Disclaimer/Publisher’s Note: The statements, opinions and data contained in all publications are solely those of the individual author(s) and contributor(s) and not of MDPI and/or the editor(s). MDPI and/or the editor(s) disclaim responsibility for any injury to people or property resulting from any ideas, methods, instructions or products referred to in the content. |
© 2026 by the authors. Licensee MDPI, Basel, Switzerland. This article is an open access article distributed under the terms and conditions of the Creative Commons Attribution (CC BY) license.