


Abstract
The detection of deepfake speech has become a significant research area due to rapid advancements in generative AI for speech synthesis. These technologies pose significant security risks in applications such as biometric authentication, voice-controlled systems, and automatic speaker verification (ASV) systems. Therefore, enhancing the detection capabilities of such applications is essential to mitigate potential threats. This study investigates perceptual speech-pathological features, which are commonly used to evaluate the unnaturalness of voice disorders in clinical settings, as potential indicators for detecting deepfake speech. Specifically, the timbral attributes of hardness, depth, brightness, roughness, sharpness, warmth, boominess, and reverberation are examined. The analysis reveals that these attributes provide meaningful distinctions between genuine and synthetic speech. Furthermore, the detection performance is enhanced by extending the dimensional representation of timbral attributes, enabling a more comprehensive characterization of the speech signal. This paper proposes a method that combines two models: one utilizing the different dimensions of speech-pathological features with a deep neural network (DNN), and another employing a gammatone filterbank model that simulates the auditory processing mechanism of the human cochlea with ResNet-18 architecture, improving deepfake speech detection. The proposed method is evaluated on the Automatic Speaker Verification Spoofing and Countermeasures Challenge (ASVspoof) 2019 dataset. Experimental results demonstrate that the proposed approach outperforms baseline models in terms of Equal Error Rate (EER), achieving an EER of %.
1. Introduction
Recent in developments Artificial Intelligence (AI) are transforming many aspects of our daily lives. With its remarkable capabilities, AI offers numerous benefits in diverse fields such as healthcare, finance, transportation, and entertainment. In the field of speech, AI has driven transformative innovations, offering numerous advantages and applications such as speech recognition, speech synthesis, and text-to-speech (TTS). Despite the numerous advantages offered by AI speech, the misuse of AI technologies, such as deepfake speech, poses a significant threat to economies and societies around the world. As a case in point, as highlighted by a report from AP News, ahead of the New Hampshire primary election, deepfake AI technology was used in robocalls that falsely attributed messages to US President Joe Biden, creating confusion and concern during the campaign [1]. This underscores the growing threat of AI-generated misinformation in political campaigns, which can undermine trust in political and social systems. Thus, security systems that utilize speech as a form of access, such as automatic speaker verification systems, have an inherent need for strong mechanisms related to the detection and countering of deepfake speech.
Several methods have been proposed for detecting deepfake speech [2,3,4,5]. These methods primarily focus on two main aspects: the exploration of various acoustic features [3,6,7] and the development of efficient classifiers [8,9,10].
The first aspect emphasizes utilizing and enhancing acoustic features. Various acoustic features have been employed to detect deepfake speech, such as spectrograms [11], mel-spectrograms [12], linear-frequency cepstral coefficients (LFCCs) [13], constant-Q cepstral coefficients (CQCCs) [14], constant-Q transform (CQT) [15], and mel-frequency cepstral coefficients (MFCCs) [16]. These features are represented using phase, power spectrum, and cepstral coefficients. However, they provide high-dimensional representations.
The second aspect employs a variety of classifiers, such as Gaussian mixture models (GMMs) [17], deep neural networks [18], convolutional neural networks (CNNs) [19], recurrent neural networks (RNNs) [20], long short-term memory (LSTM) [21], bidirectional LSTM (Bi-LSTM) [22], and residual neural networks (ResNets) [23].
Acoustic speech-pathological features are widely used to detect voice disorders [24,25,26] and have also been introduced to identify unnatural characteristics in synthesized speech [27] and audio [28]. These acoustic speech-pathological features effectively distinguish between genuine and deepfake speech [29,30].
Perceptual speech-pathological features have long been used to evaluate voice quality in disordered speech [31,32,33,34,35]. Recently, a limited number of studies have explored the applicability of such speech-pathological features for detecting deepfake speech, including our own earlier investigations [36,37]. These prior studies primarily focused on demonstrating the feasibility of using perceptual pathological features through global or utterance-level representations.
However, deepfake speech often differs from genuine speech not only in global perceptual characteristics but also in localized temporal inconsistencies, such as unstable timbral behavior across short segments, which is largely obscured by global averaging. To date, the segmental dynamics and temporal variability of perceptual speech-pathological features have not been systematically analyzed for deepfake speech detection, representing a critical gap in the literature.
In this study, we extend prior work by shifting from utterance-level feature aggregation to a segmental frame-wise analysis of perceptual speech-pathological features. This enables the modeling of temporal instability patterns that more closely reflect how human listeners perceive unnaturalness in synthetic speech. Furthermore, we conduct a comprehensive feature-level analysis and ablation study to identify which perceptual attributes contribute most significantly to deepfake discrimination. Finally, we propose a dual-path detection framework that integrates segmental perceptual features with an auditory-inspired gammatone filterbank model, exploiting their complementary perceptual dimensions through score-level fusion.
2. Perceptual Speech-Pathological Features
This research focuses on timbre as the primary perceptual attribute, given its vital role in music and audio cognition [38,39]. Timbre conveys essential emotional and perceptual information, making it invaluable across various areas of audio processing.
In more detail, timbre represents a complex range of auditory qualities that together determine the character or nature of a sound. It typically consists of various spectral and harmonic components that contribute distinctive characteristics to a sound [40]. Timbre is defined as the characteristic that allows listeners to distinguish between two sounds with identical pitch, loudness, and duration. Despite similarities in these aspects, unique timbral qualities enable the perception of distinct auditory experiences [41].
Several studies have investigated the modeling of timbre through psychoacoustic frameworks, focusing on the development of objective metrics for various timbral attributes [42,43,44]. In this study, we employ an extraction algorithm developed by the Audio Commons Project that has been extensively applied in psychoacoustic research [45]. This model expresses eight timbral characteristics—hardness, depth, brightness, roughness, sharpness, warmth, and boominess—and rates them from 0 to 100, while reverberation rate is represented by a value of 0 or 1 [45]. These timbral features are described in detail below.
2.1. Hardness
The perception of sound hardness is largely influenced by two key elements: loudness and harshness. A sound described as harsh suggests a disruption within its audio core, specifically within the 2 kHz to 5 kHz frequency range, where human hearing is most sensitive. Hardness, therefore, functions as an indicator of a sound’s desirability or lack thereof, and the connection between its loudness and frequency range can be analyzed based on human auditory perception.
Four key parameters are suitable for predicting hardness: the mean of the spectral centroid over time, the time-weighted average of the spectral centroid as it varies over time, the mean of the time-varying spectral level, and the slope of the spectral level [44].
2.2. Depth
Depth can refer to either a timbral or spatial attribute and has been reported to be associated with a marked low-frequency component [46]. In this study, we developed a depth model to calculate the depth metric by performing linear regression with three main elements: lower spectral centroid (LSP), lower ratio, and low-frequency limit (LSL):
where is the bin number relating to frequency , is the frequency of the k bin, and is the magnitude of the k bin. The mean lower spectral centroid is then calculated across all frames:
where k(Nyquist) represents the frequency bin corresponding to the Nyquist frequency. The mean lower ratio is subsequently computed across all frames as
2.3. Brightness
Brightness has been explored in considerable detail, with studies demonstrating that the spectral centroid strongly correlates with perceived brightness [47,48]. In a recent study, Pearce examined existing models and formulated a novel brightness model that integrates both a variant of the spectral centroid and the spectral energy ratio [49]. We apply this model in the current study. The calculation of brightness involves two metrics, one of which is the frequency-limited spectral centroid (FLSC) designed to focus on frequencies exceeding 3 kHz, and the other is the ratio:
and
where represents the bin number corresponding to a frequency , represents the frequency linked to the k-th bin, denotes the magnitude of the k-th bin, and stands for the bin number corresponding to the Nyquist frequency. Finally, linear regression is performed to derive findings for brightness:
2.4. Roughness
Roughness causes a buzzing sensation and creates a harsh perception. Rough sounds are perceived based on amplitude fluctuations in the voice modulated at between 16 and 80 Hz. The roughness model is built based on three variables derived from a study using a sinusoidal model approach. The first two variables, which correspond to the amplitude of two sinusoidal components, are the dependence of roughness on intensity and the dependence of roughness on the degree of amplitude fluctuation [50]. Roughness is calculated as
where
and
and indicate the maximum and minimum magnitudes of the peak pairs, respectively, and and correspond to the maximum and minimum frequencies of the two peaks.
2.5. Warmth
Relatively few studies have explored the perception of warmth and the various factors that contribute to it. One example is the work of Sorensen, who found that the acoustic characteristics of concert venues, including their shape and the way sound reflects, significantly affect how warm orchestral music sounds to listeners [51]. Specific features of a room, such as its size, the duration of sound echoes, and the location of reflections, were shown to enhance the sense of liveliness and fullness in the lower frequencies of music, which are closely associated with the perception of warmth.
Bromham explored how different audio effect processing techniques influence warmth [52]. The study highlighted the importance of the bass ratio (BR) metric, which measures the distribution of energy in the low-frequency spectrum. Changes to BR, implemented through methods like equalization, were found to significantly impact the perceived warmth of the audio.
In this study, the warmth model was developed using an iterative modeling technique. Various subsets of low-level timbral characteristics were selected, and a multilinear regression approach was applied [46].
2.6. Sharpness
Sharpness is a metric associated with the perception of acute or piercing sensations, which becomes more pronounced as the central frequency shifts to a higher range. Based on this observation, Zwicker et al. introduced the concept of “acum”, which is defined as the unit of sharpness for narrowband noise centered at 1000 Hz and with a loudness level of 60 phons [53]. Sharpness is calculated using a model based on loudness density and is measured across the Bark scale. The resulting sharpness is typically represented as
where 24Bark refers to the 24 critical bands of human hearing. denotes the density of loudness within the critical-band rate z. Loudness, a fundamental characteristic of auditory perception, is measured in phons. The function serves as the weighting factor for sharpness at a given rate. Psychoacoustic studies have determined that this weighting factor is for frequencies up to , rising sharply to for frequencies beyond this range.
2.7. Boominess
Boominess is evaluated to quantify the booming sensation through a method that involves summing the power of the 1/3 octave band signals [54]. As booming is commonly perceived as a low-frequency vibration, it is represented by the ratio of the loudness below 280 Hz to the overall bandwidth. The degree of booming is calculated as the booming index (BI), a quantitative measure for assessing and characterizing the boominess of sound, as
where “PS” represents the power summation of the 1/3 octave band signals, denotes the loudness of the total band, and refers to the loudness of the band below 280 Hz.
2.8. Reverberation
Reverberation is a prolonged sound that continuously persists even after the source has already stopped. Reverberation may be caused by the reflection of multiple sounds from the environment. The term reverberation refers to the acoustic fading of an audio signal and encompasses various standard measures. Among these, the most prevalent is Reverberation Time 60 (RT60), which gauges the duration of decay. Although RT60 is often assessed in concert halls and similar settings, estimating it from recordings poses challenges. In 2015, the IEEE conducted the Acoustic Characterization of Environments (ACE) challenge to attempt blind estimation of RT60 and direct-to-reverberant ratio in recorded speech signals [55]. The RT60 values are provided as inputs to a linear regression model, which produces binary outputs, where 0 denotes the absence of reverberation and 1 denotes the presence of reverberation.
2.9. Gammatone Filterbank
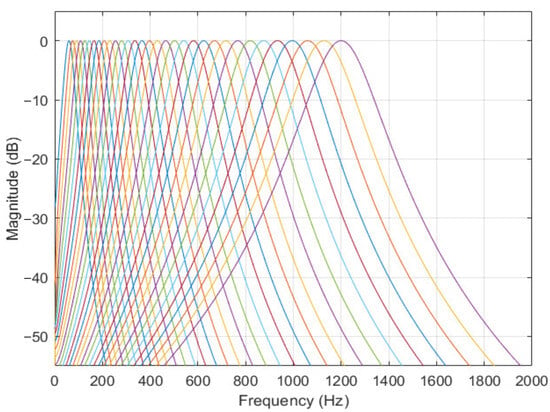
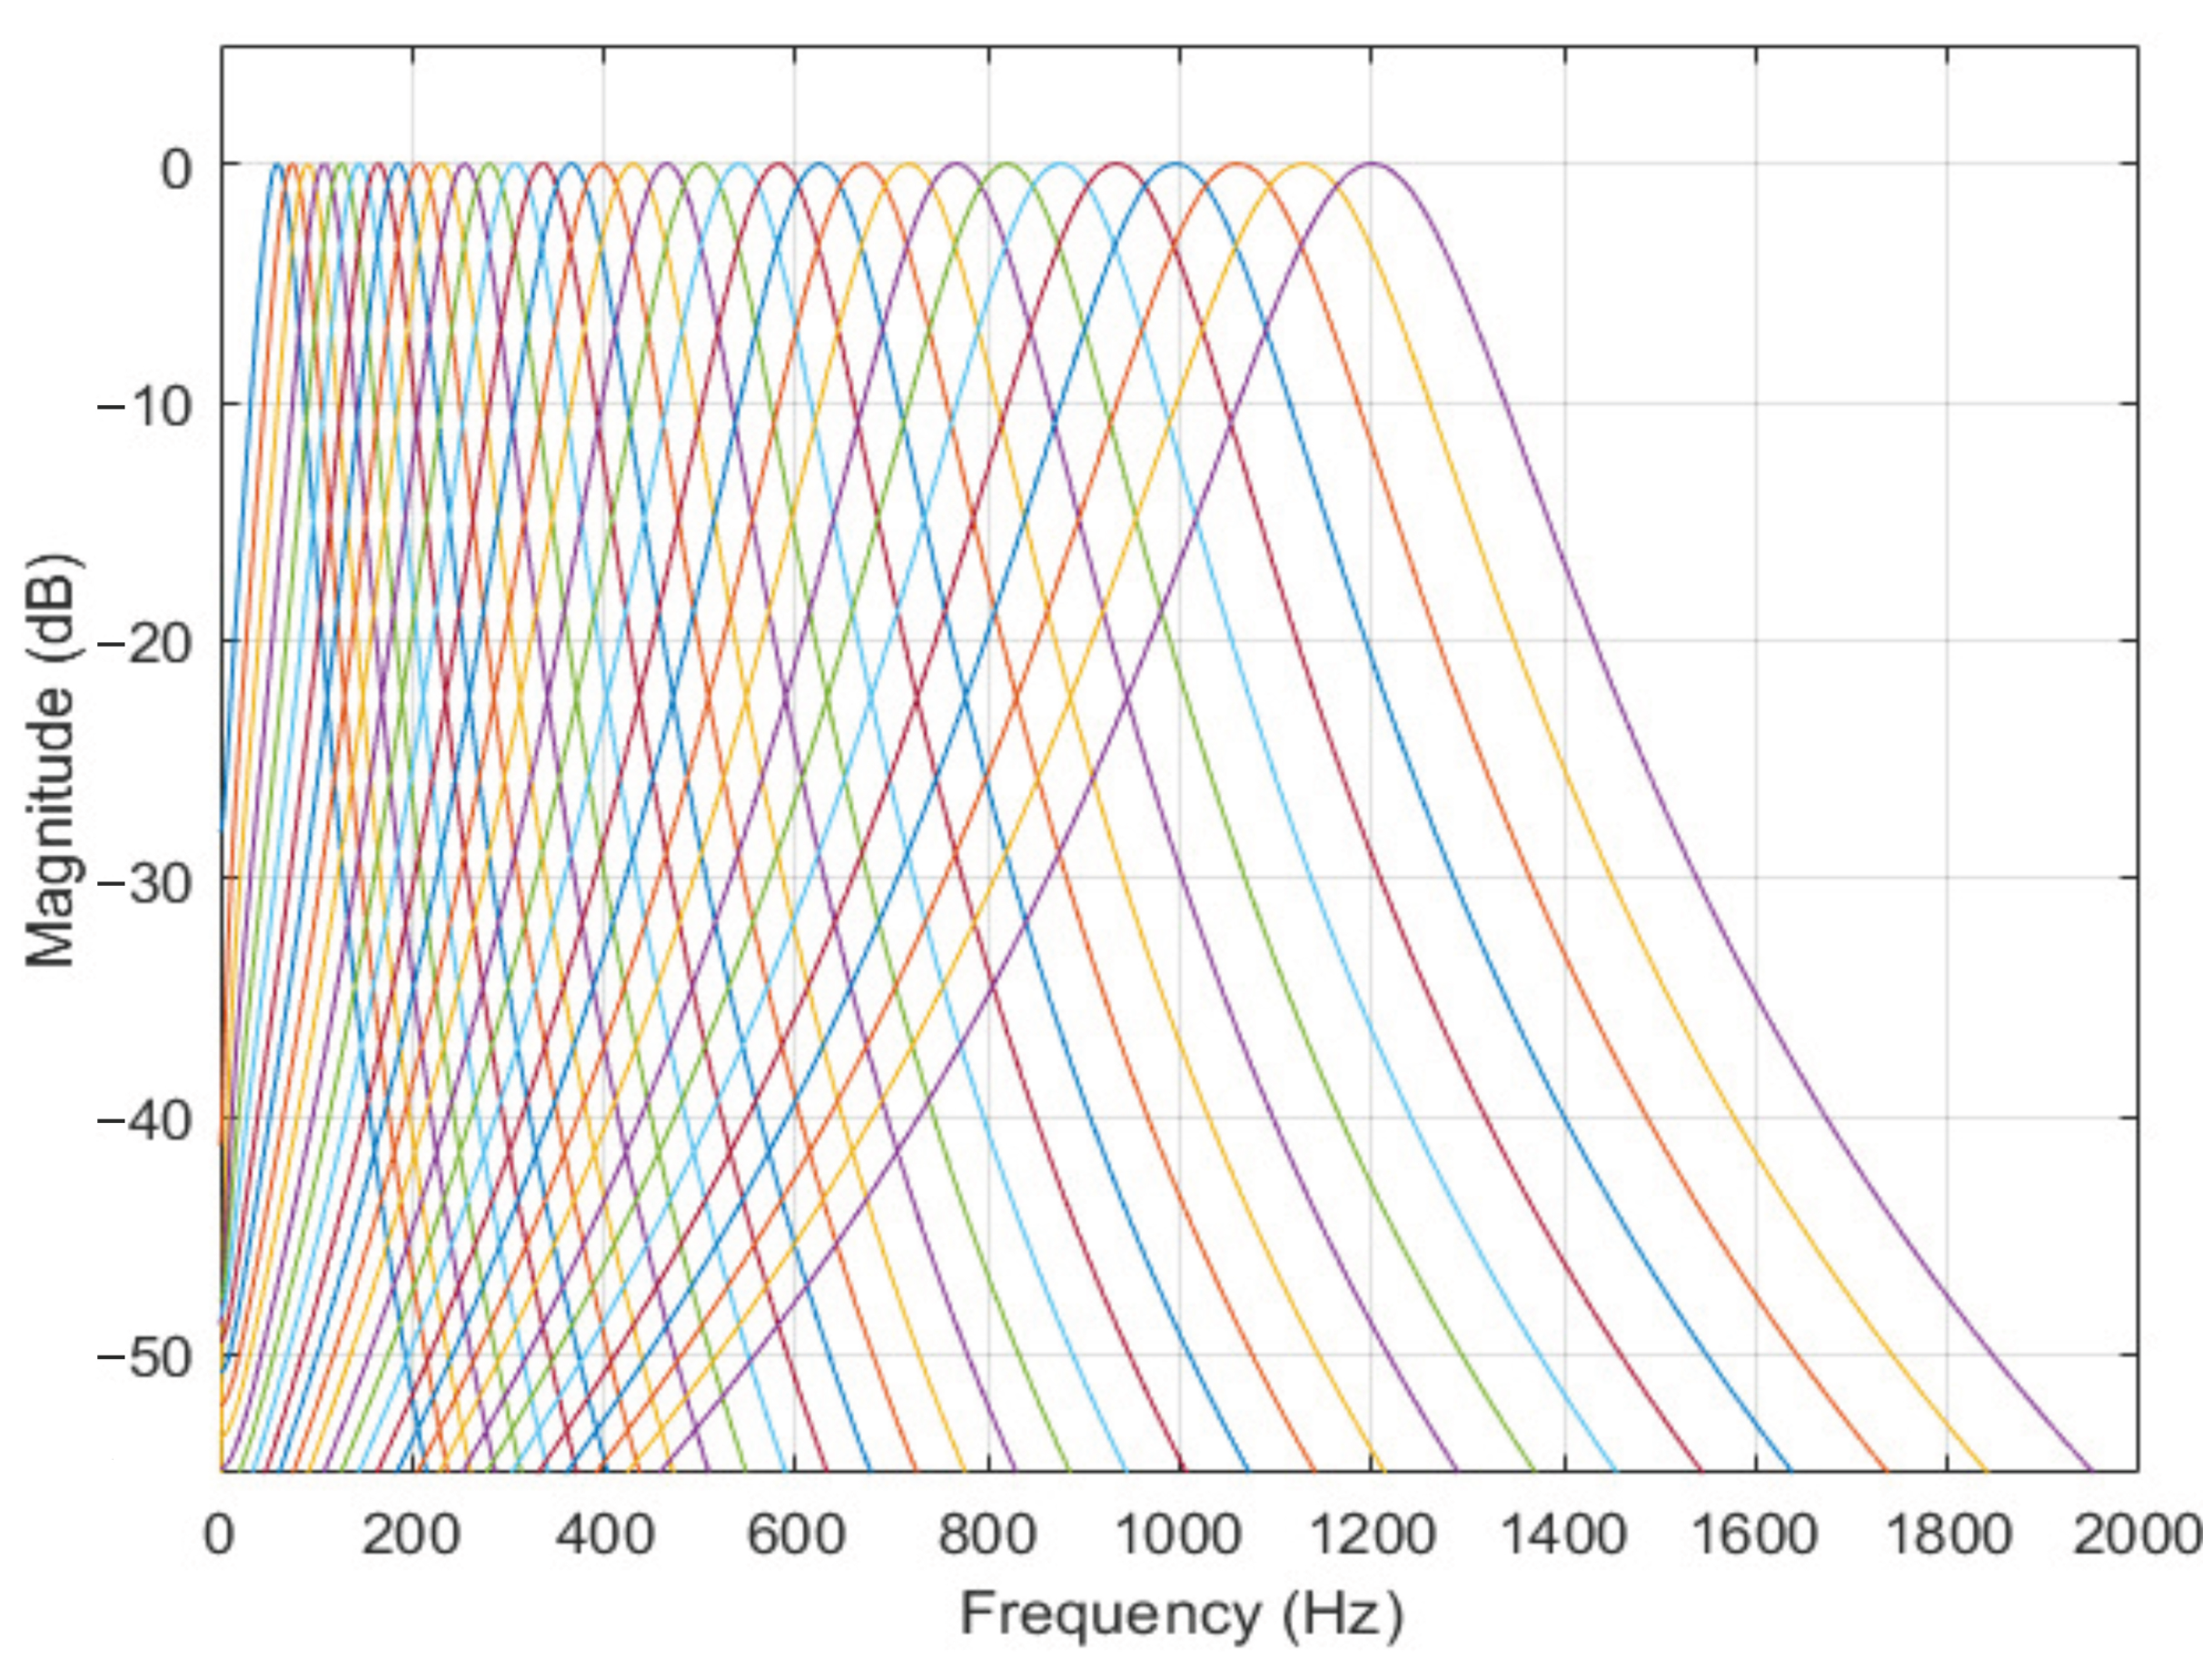
The gammatone filterbank is related to human auditory perception and serves as a key component of auditory signal processing, designed to replicate the time-frequency analysis performed by the basilar membrane of the human cochlea [56]. It consists of a series of filters, each tuned to a specific frequency range, reflecting the frequency-selective properties of different regions along the basilar membrane. The most frequently used gammatone filterbank models are the cochlear model [57] and the auditory filterbank model based on Equivalent Rectangular Bandwidth ERB [58]. Figure 1 visually represents the frequency responses generated by the gammatone filterbank.
Figure 1.
Frequency response of gammatone filterbank.
In this study, the speech signal duration was fixed at 4 s with a sampling rate of 16 k . To ensure uniformity, signals shorter than 4 s were looped from the beginning, while longer signals were truncated to match the specified duration. The gammatone filterbank employed in the analysis consists of 32 filters, with a minimum center frequency of 60 and a maximum center frequency of 1200 . As a result, the extracted feature representation has a dimensionality of .
3. Proposed Method
3.1. Feature Analyses
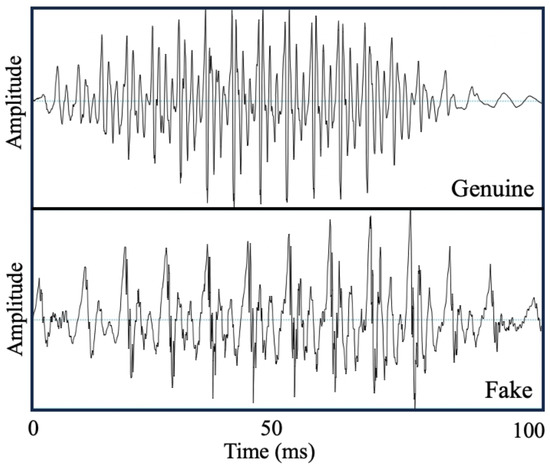
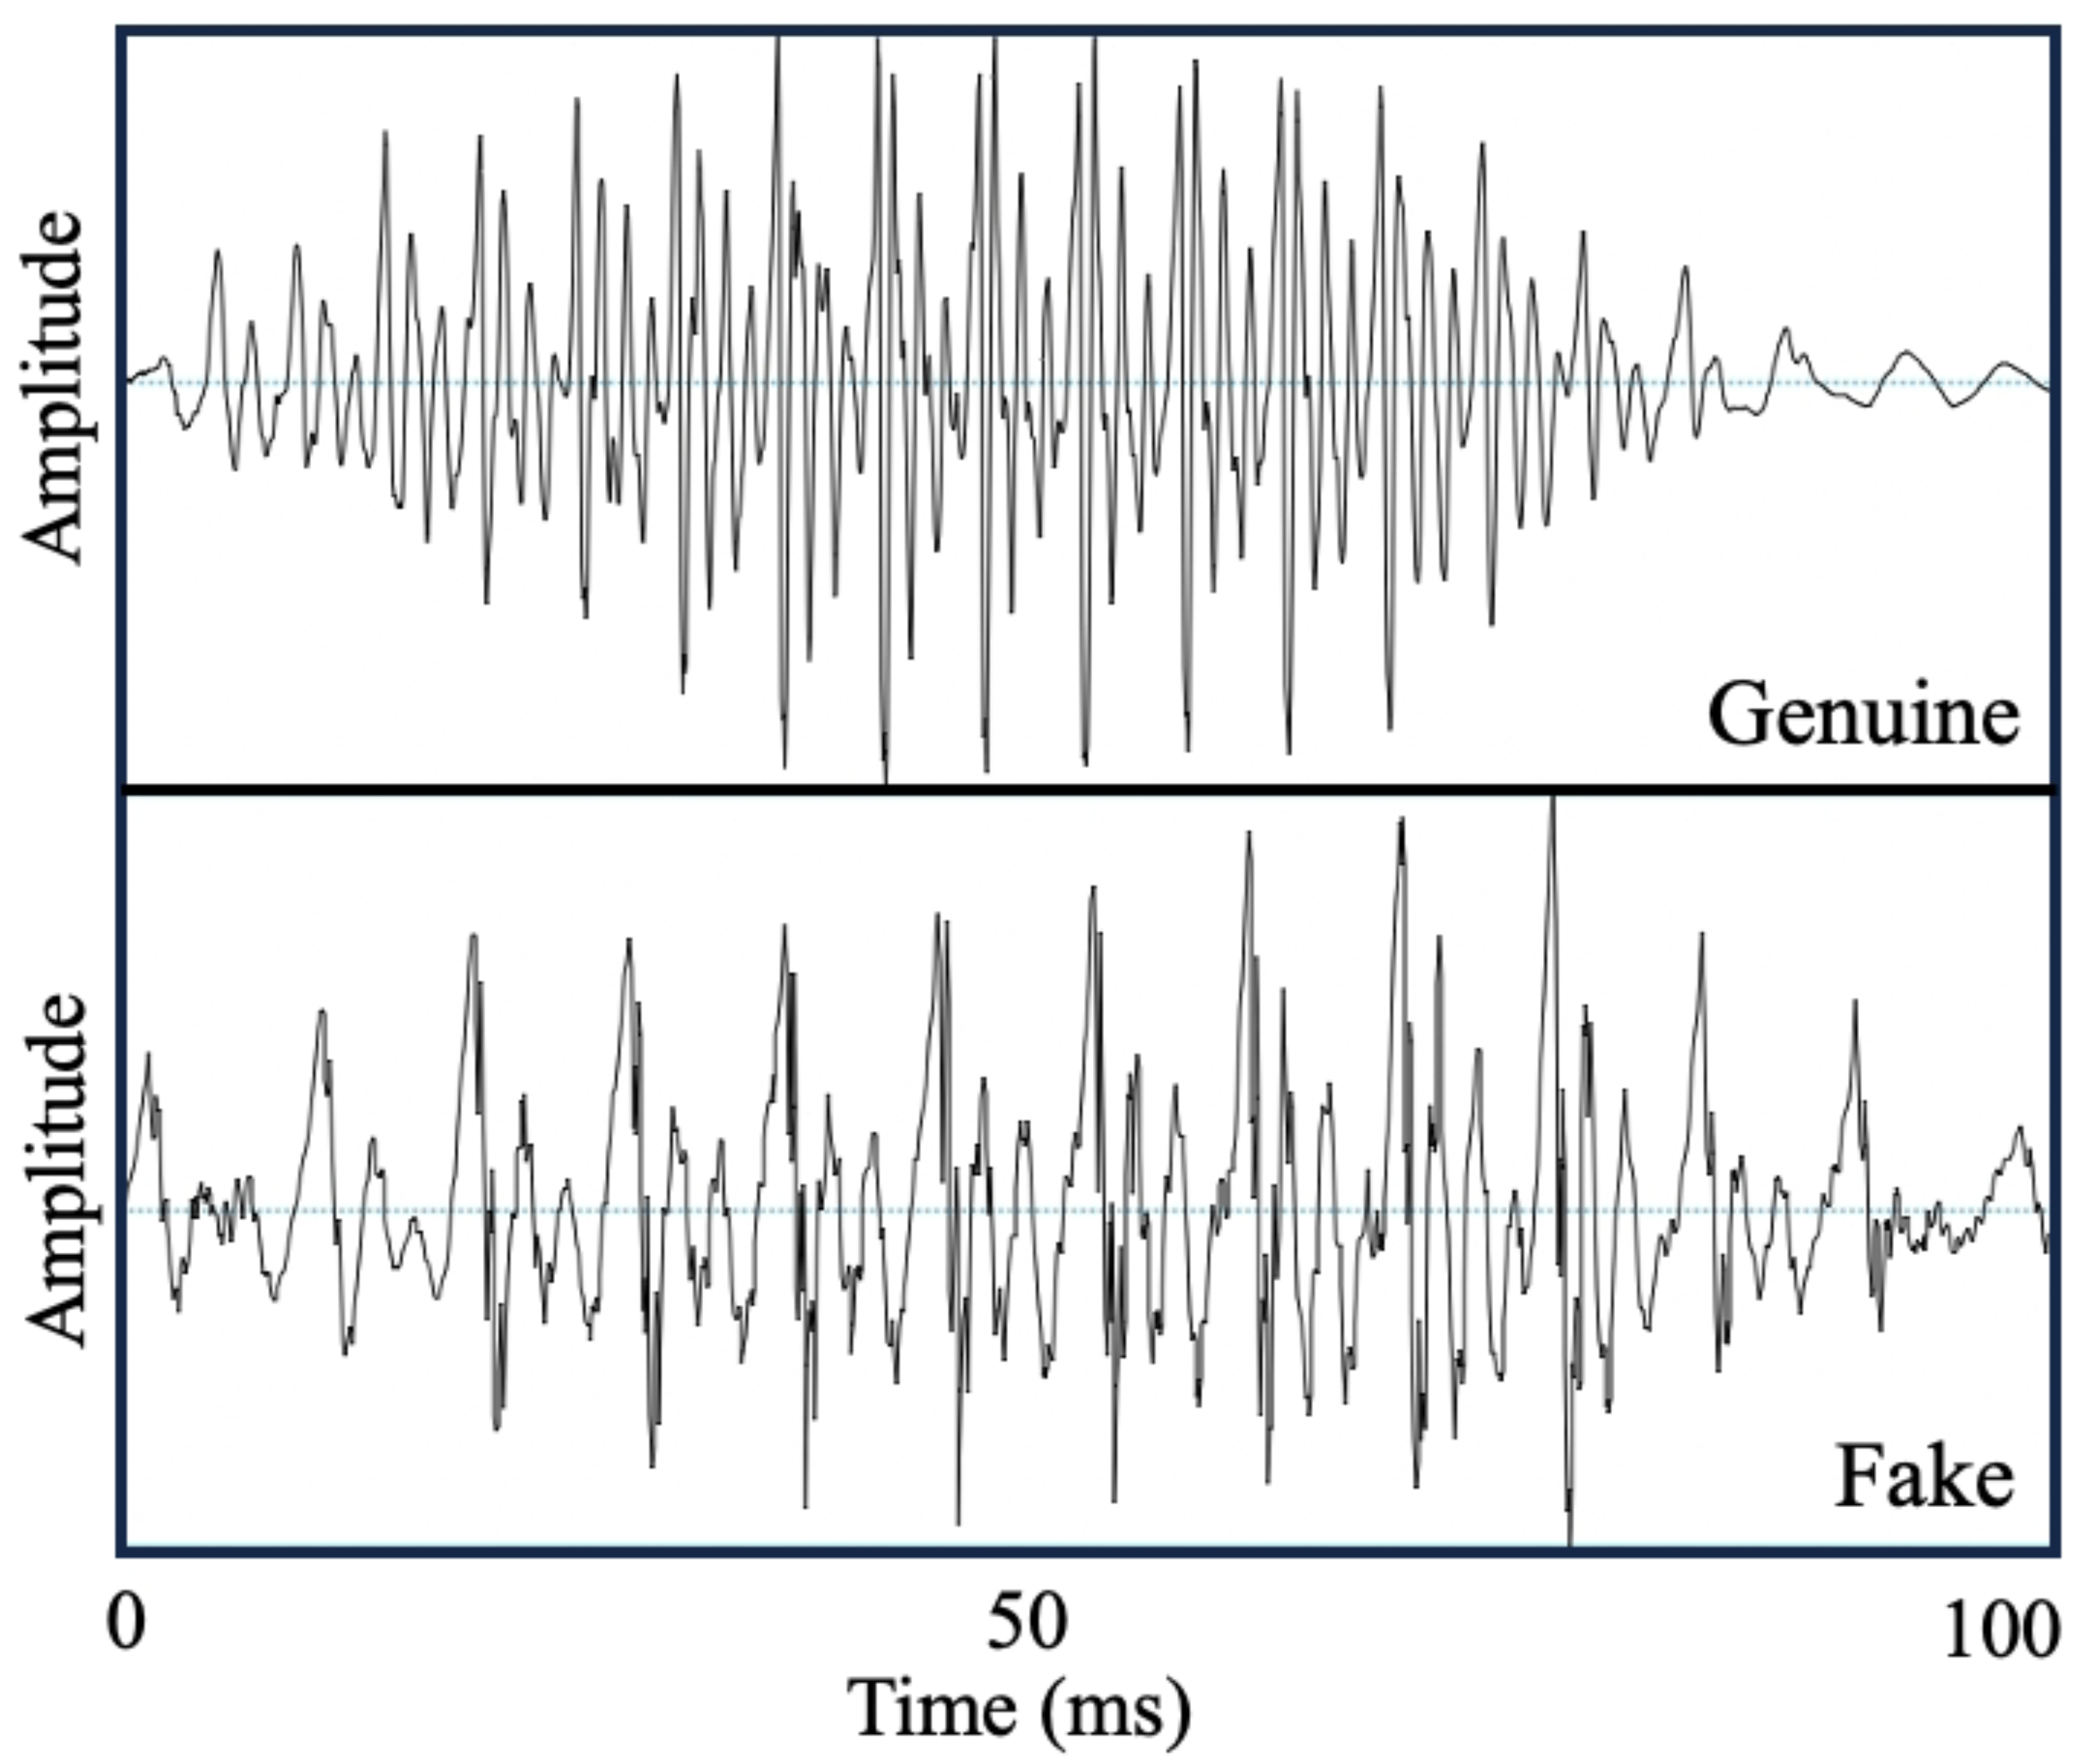
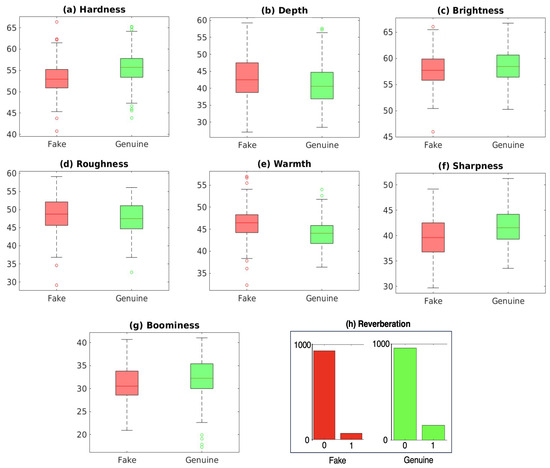
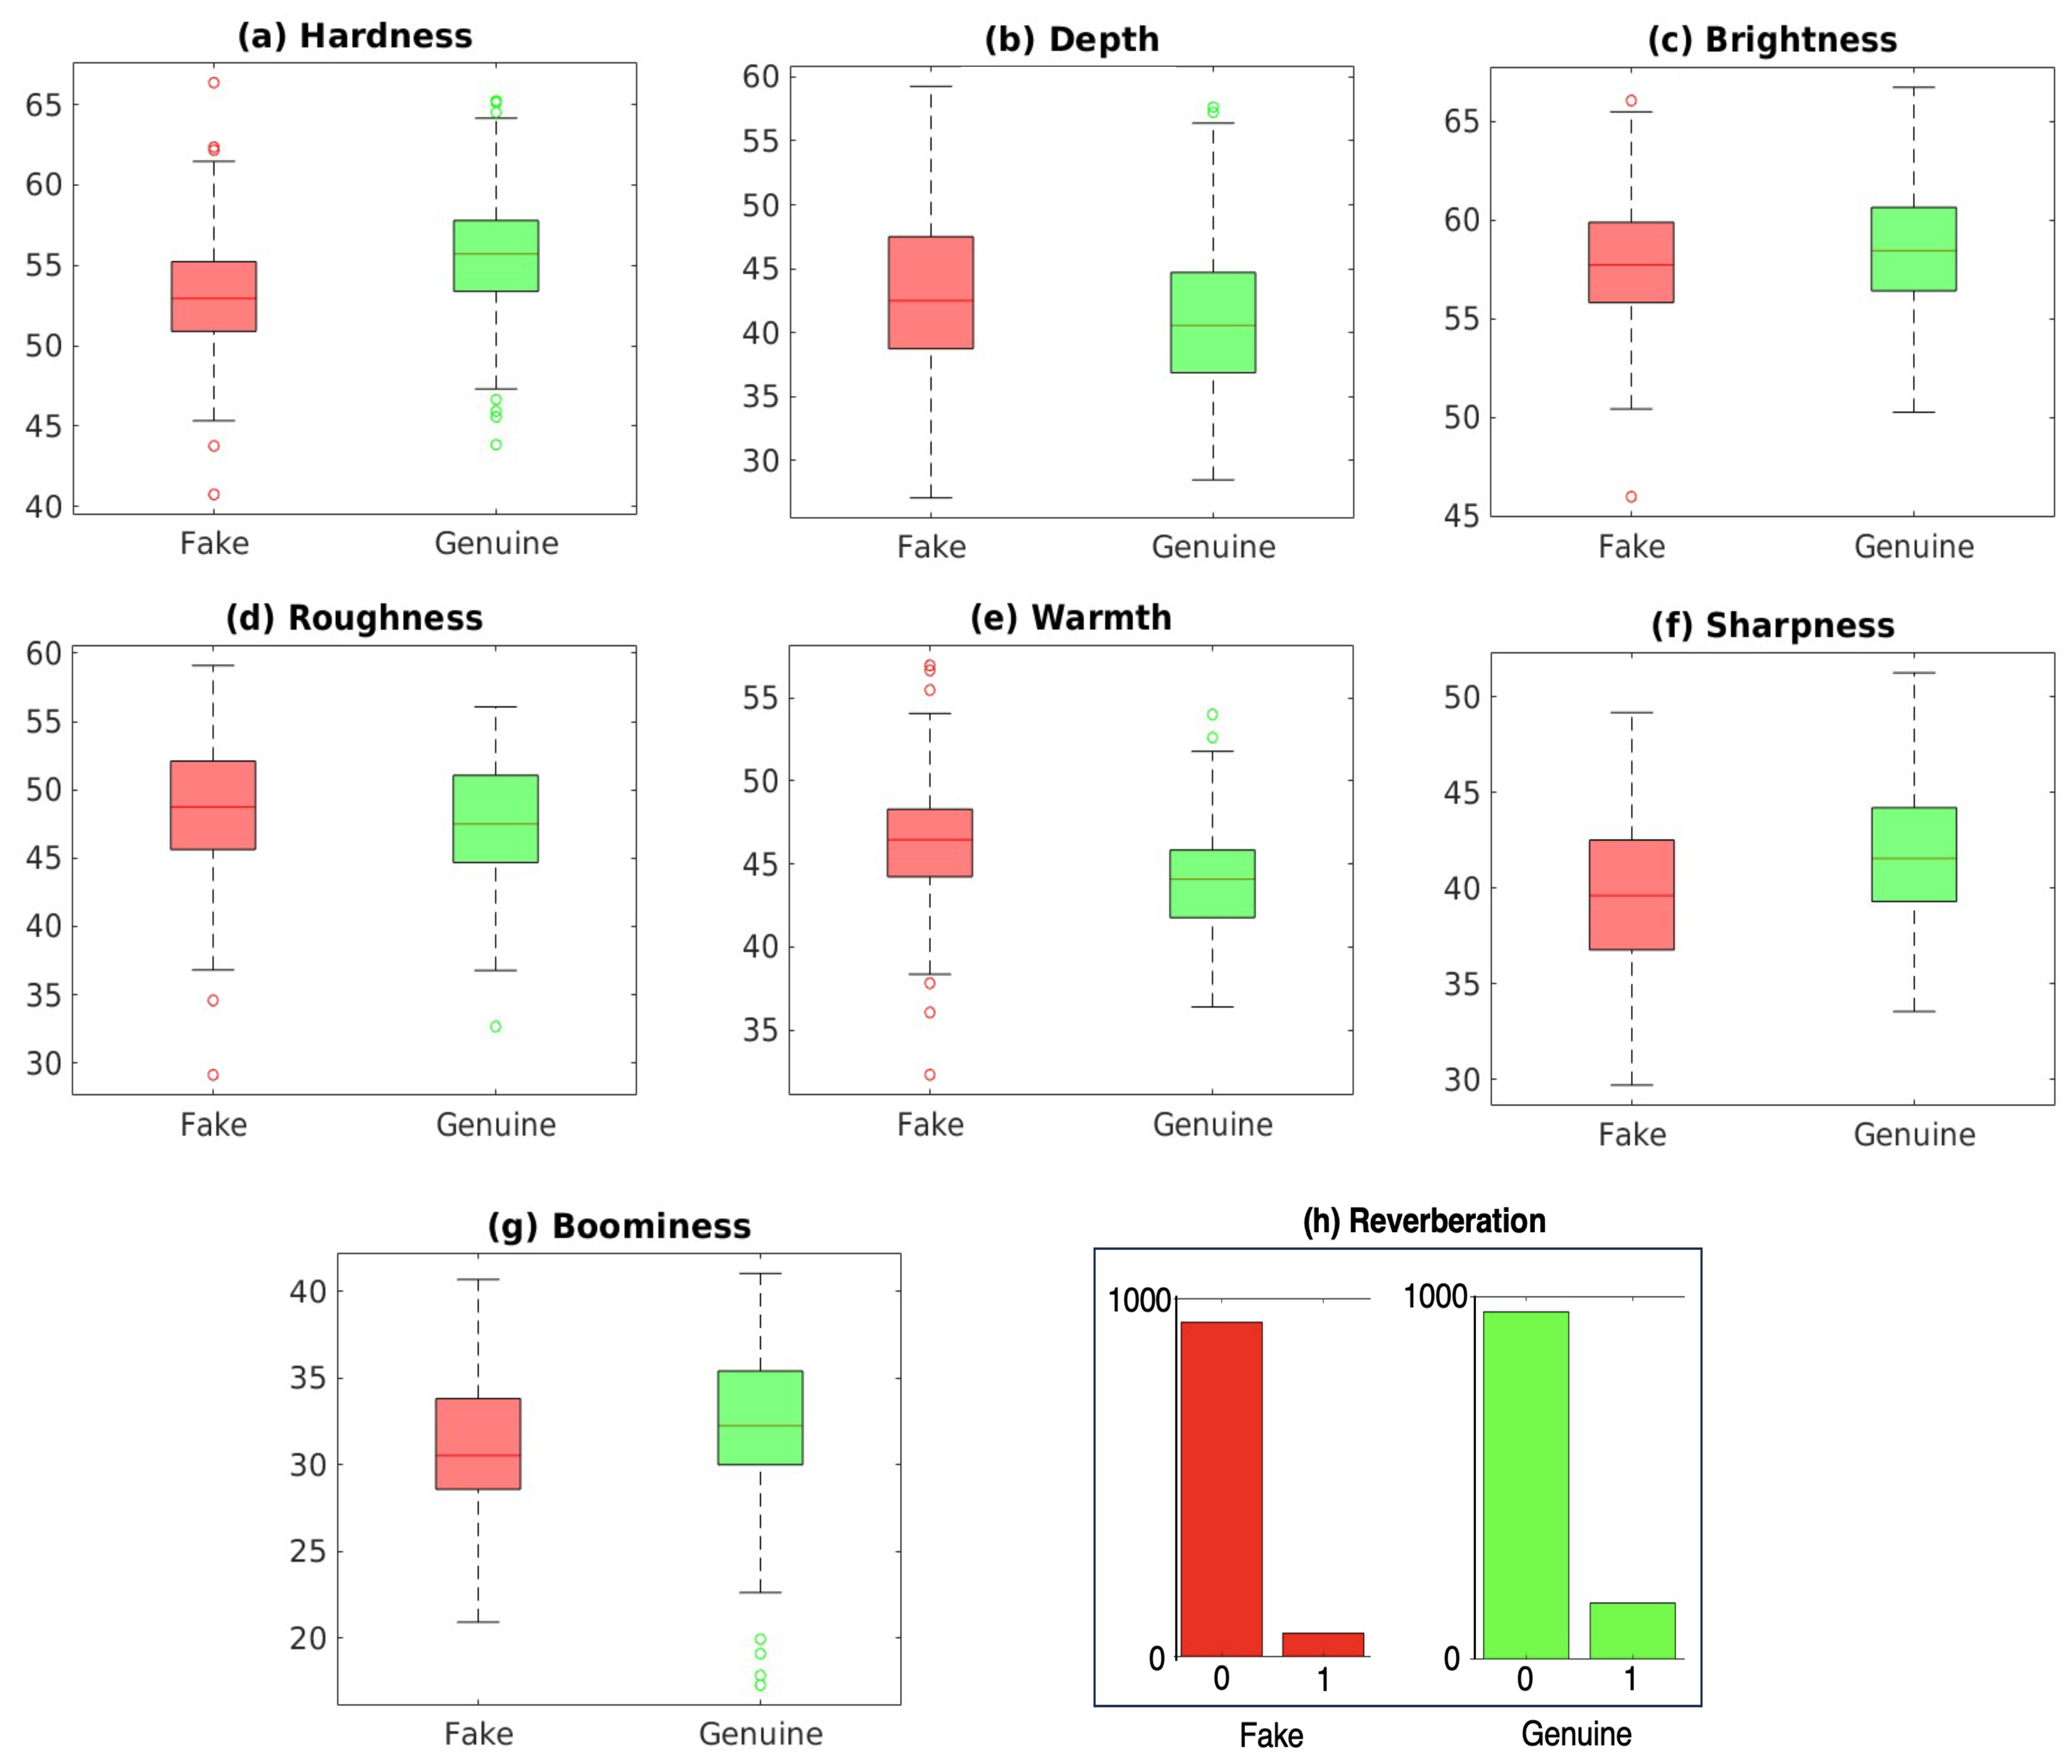
This section explores the potential of speech-pathological features for differentiating between genuine and deepfake speech. Figure 2 compares the raw waveforms of genuine (top) and fake (bottom) speech signals. The figure shows that the fake speech signal appears to be mixed with noise compared to the genuine speech signal. Figure 3 presents box plots illustrating the differences in each pathological feature when distinguishing between genuine and fake speech signals, based only on their average values from the Audio Commons Project [45]. In this chart, 1000 genuine and 1000 fake speech signals were randomly selected from the ASVspoof 2019 dataset, as summarized in Table 1 and Table 2. Each speech signal was standardized to a duration of 4 s with a sample rate of 16 k . To ensure consistency, signals shorter than 4 s were looped from the beginning, while those exceeding 4 s were cropped accordingly. The results indicate that hardness and warmth are particularly effective in differentiating genuine speech from deepfake speech. Additionally, depth, sharpness, and boominess provide moderate utility in this distinction. However, features such as brightness, roughness, and reverberation may be less effective in separating genuine speech from deepfake signals. The reverberation feature cannot be represented using a box plot because its output is binary, taking a value of either 1 (indicating the presence of reverberation) or 0 (indicating its absence).
Figure 2.
A comparison between two segments extracted from genuine and fake speech waveforms.
Figure 3.
Box plots of speech-pathological features derived from 1000 signals of both genuine (green) and fake (red) speech: (a) hardness, (b) depth, (c) brightness, (d) roughness, (e) warmth, (f) sharpness, (g) boominess, and (h) a bar chart of reverberation.
3.2. Segmental Frames of Analysis
Even though the average of speech-pathological features can help distinguish between genuine and deepfake speech, it may be insufficient. For example, if the difference between genuine and fake speech pertains to consistency, where approximately 70–80% of the speech is consistent but the remaining segments exhibit significant fluctuations, the average value becomes less meaningful. Therefore, rather than computing the average of speech-pathological features from the entire speech signal, as is typically done, we propose extracting these features using a segmented frame analysis approach.
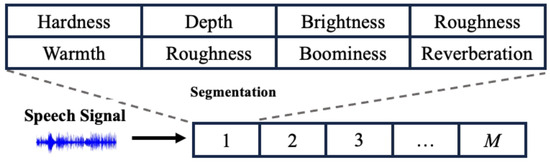
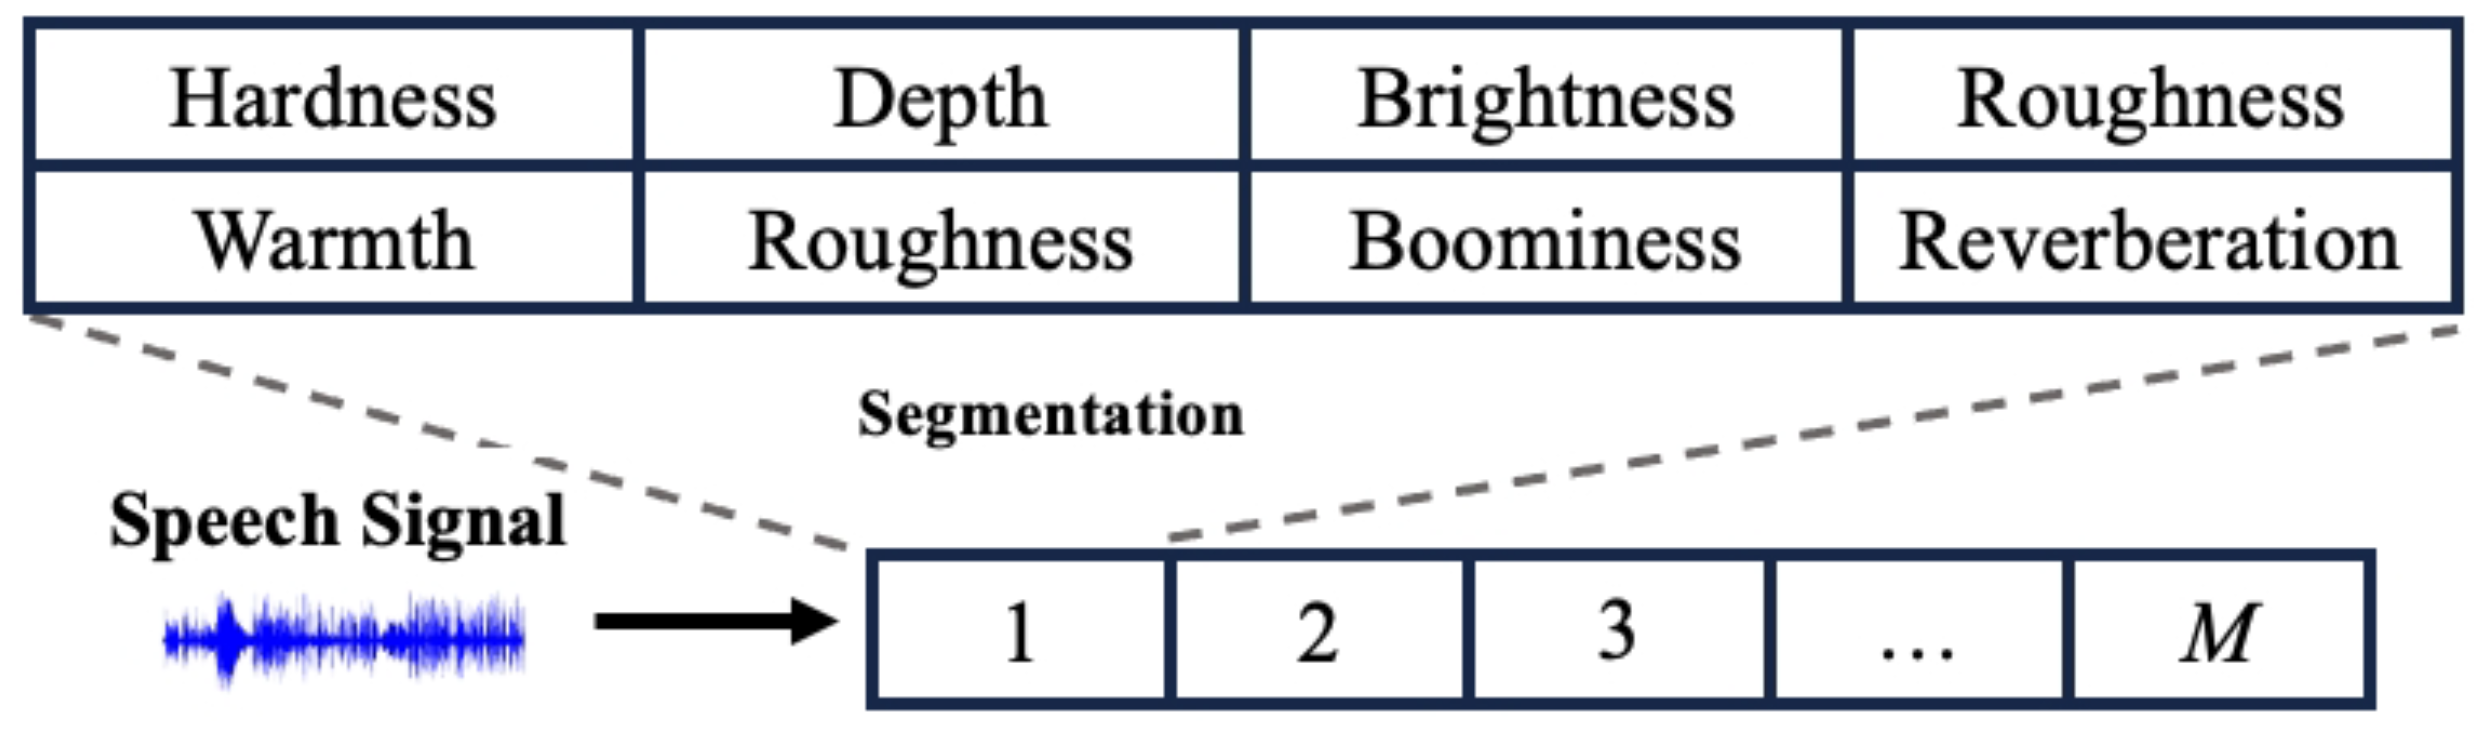
The procedure for extracting perceptual speech-pathological features through segmented frame analysis is depicted in Figure 4. This process begins with receiving a speech signal, which is subsequently divided into M frames. The perceptual speech-pathological features are then extracted from each individual frame. The extraction continues sequentially from the first frame to the M-th frame, meaning the total number of perceptual speech-pathological features corresponds to the total number of frames processed.
Figure 4.
Segmental frames of analysis of speech-pathological features.
Table 4 shows the effectiveness of the segmented frame analysis of perceptual speech-pathological features with Multi-Layer Perceptron Neural Network (MLP). Here, each feature is derived on a frame-by-frame basis, using a window frame of 1 s with an overlap of 50%. The data in frame 1 is fed into the feature extraction process, where feature values are obtained and stored in an array at position 1. This feature extraction process is then repeated for frames 2, 3, and so on until the last frame, which in this case is the 7th frame. Consequently, for each feature, the data for a single voice is located at position 7. The total number of segmented frames depends on the duration of the speech and the window frame size.
3.3. Classifier
There are three classifiers applied in this study.
3.3.1. Multi-Layer Perceptron Neural Network
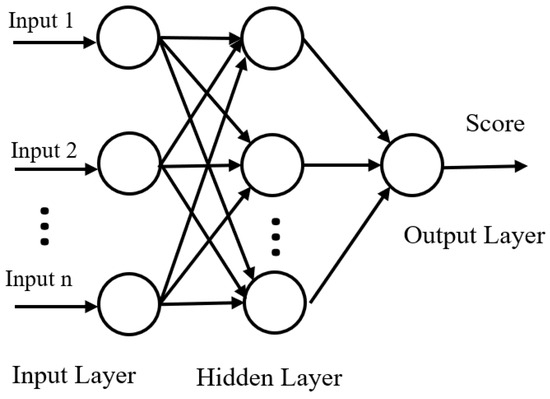
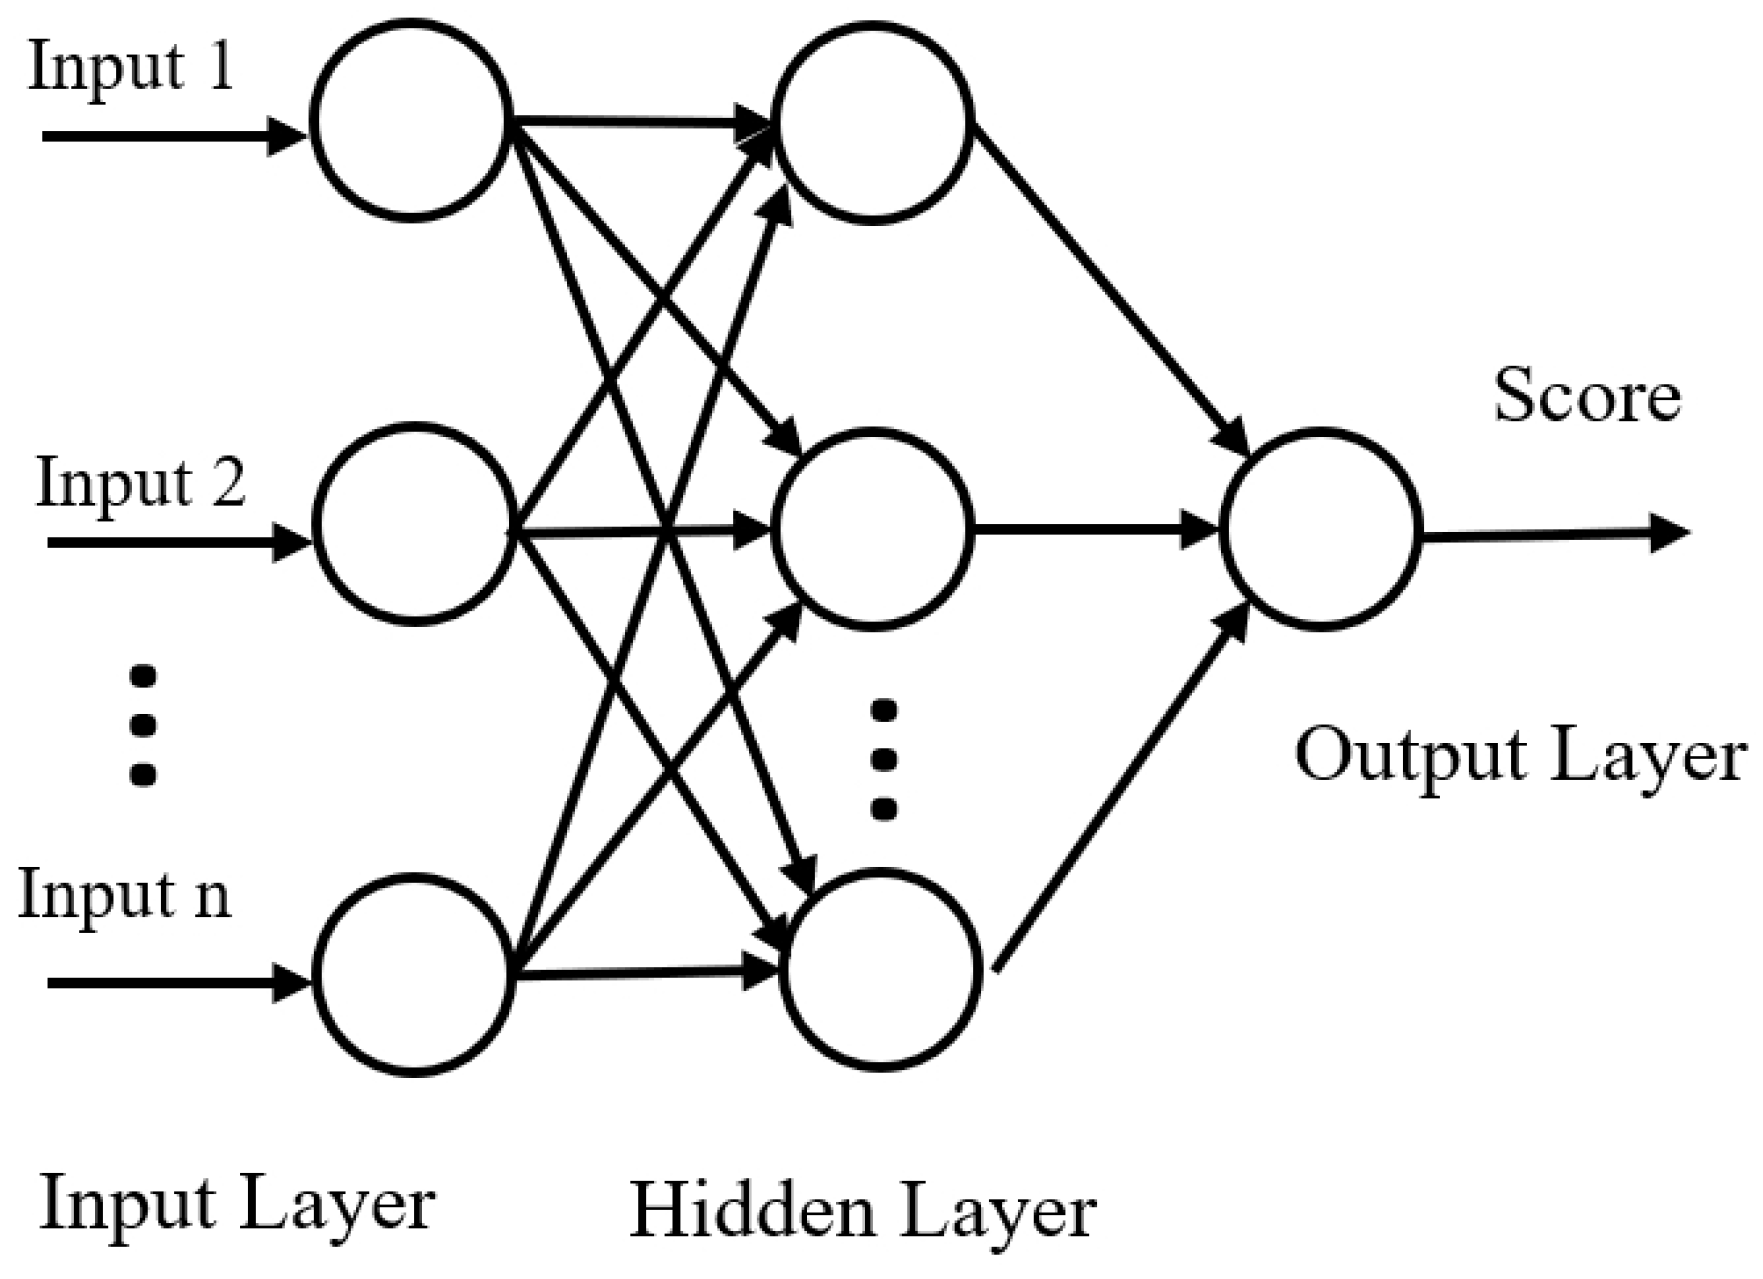
The MLP used in this study consists of three layers: an input layer, a hidden layer, and a single-node output layer. The dimensions of the input and hidden layers are determined by the size of the input feature set. As shown in Table 3, the network configuration for individual features, from hardness to reverberation, is , whereas the combination of all features results in an architecture. Similarly, in Table 4, the dimensions for individual features are , while the combined feature set excluding reverberation uses a configuration. Reverberation is excluded from this combined set because it lacks efficacy in distinguishing between fake and genuine samples. For the analysis in Table 5, the dimensions are . The hidden layer is activated using the Rectified Linear Unit (ReLU) function, while the output layer employs the sigmoid function. The classifier was trained for up to 100 epochs with a learning rate of and a batch size of 128. A dropout rate of was applied to the final layers to mitigate overfitting. Binary cross-entropy served as the loss function, and the Adam optimizer was utilized. The MLP model architecture employed in this study is illustrated in Figure 5.
Figure 5.
MLP architecture.
3.3.2. DNN
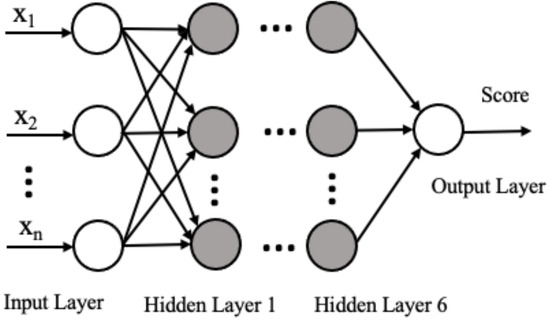
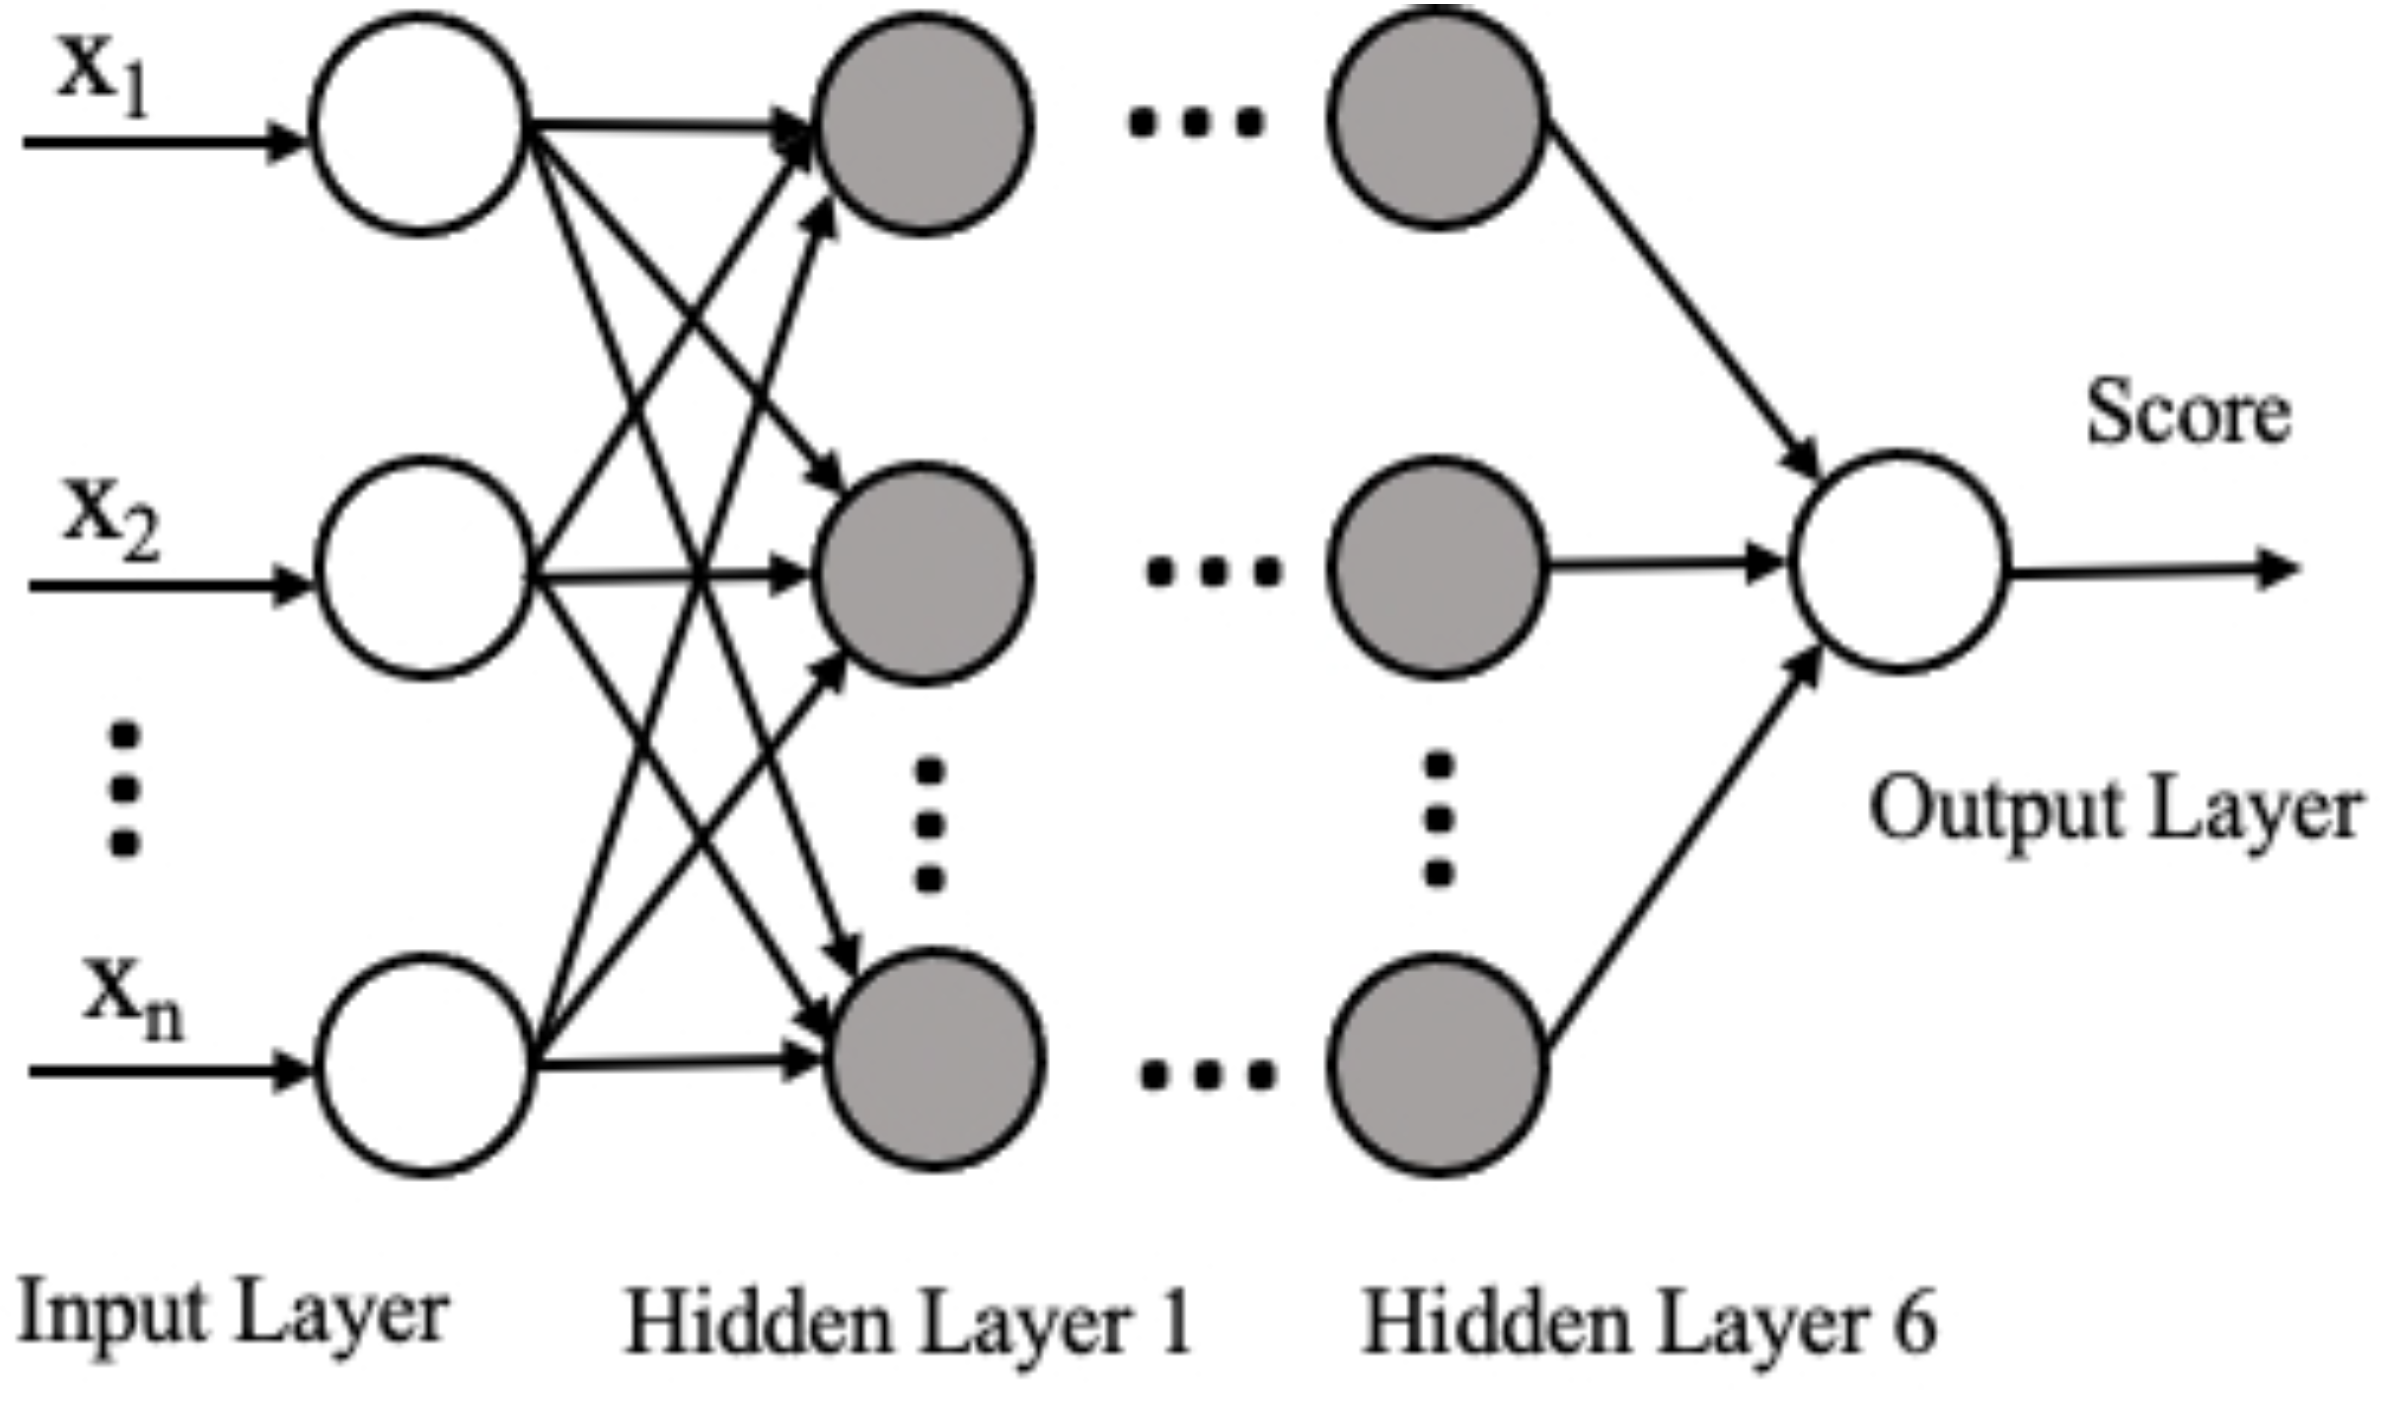
The DNN architecture used in this study consists of eight layers: an input layer, six hidden layers, and a single-node output layer. The hidden layers employ the ReLU activation function, while the output layer uses the sigmoid activation function. The input layer configuration depends on the input dimensions; for example, as shown in Table 6, a 1 s frame size results in a dimension of 49, while frame sizes of 500 ms and 250 ms result in dimensions of 105 and 217, respectively. The first and second hidden layers consist of 128 nodes each, while the third, fourth, fifth, and sixth hidden layers contain 64, 32, 16, and 8 nodes, respectively. A dropout rate of is applied to the first through third hidden layers to reduce overfitting. The structure of the DNN model applied in this study is shown in Figure 6. The training configurations are similar to those of the MLP model.
Figure 6.
DNN architecture.
3.3.3. ResNet-18
A ResNet, employed as a classifier, represents a highly effective deep neural network architecture designed to mitigate the vanishing gradient problem, where gradients become excessively small during backpropagation [59]. Its robust performance has led to its widespread adoption in various audio and speech signal processing applications [60]. The function of the residual block, which integrates an intermediate input with the output of a sequence of convolutional layers, is formulated as
where and are the input and output of the preceding layer, respectively, and denotes the residual mapping consisting of multiple convolutional layers. Residual blocks are implemented across several layers ranging in number from 10 to over 100, with each layer containing a specific number of residual blocks. However, incorporating an excessive number of features was deemed unnecessary for this study. Therefore, the ResNet-18 model, consisting of 18 residual layers, was selected as the classifier. We conducted the training process over 100 epochs with a learning rate of and a batch size of 32, utilizing the Adam optimizer. A dropout rate of is utilized for the final layers to reduce overfitting. Binary cross-entropy was adopted as the loss function to measure the discrepancy between the predicted and target values. The output score was derived from the activation of the “fake” node in the final fully connected layer, prior to applying the sigmoid function.
The hyperparameter settings for MLP, DNN, and ResNet-18 are summarized in Table 1. The implementation was conducted on a computer with an NVIDIA GeForce RTX 3090 graphics card with 24 GB of memory, an Intel Core i9-10920X CPU operating at GHz, and 128 GB of system memory.
Table 1.
Hyperparameters of the classifiers.
4. Evaluation
This section presents the details of the datasets and evaluation metrics, followed by a comprehensive discussion of the results and findings.
4.1. Dataset and Metrics
The dataset and metrics are explained in the following sections.
4.1.1. Dataset
We used the dataset of the ASVspoof 2019 challenge to evaluate the performance of the proposed method. The ASVspoof 2019 dataset is a widely utilized benchmark for evaluating the resilience of automatic speaker verification (ASV) systems against spoofing attacks, specifically in distinguishing between bonafide (authentic) and spoofed (fake) speech. The Logical Access (LA) subset of ASVspoof 2019 [61,62] is divided into three parts: the training subset (approximately %), which includes 8 male and 12 female speakers, contributing 2580 bonafide and 22,800 spoofed speech samples; the development subset (approximately %), which features 4 male and 6 female speakers, with 2548 bonafide and 22,296 spoofed samples; and the evaluation subset (approximately %), which expands to 21 male and 27 female speakers, offering 7355 bonafide and 63,882 spoofed samples, as shown in Table 2. This dataset provides a rich and diverse resource for advancing research in anti-spoofing technologies, enabling the development, validation, and evaluation of robust ASV systems.
Table 2.
Number of utterances in the ASVspoof 2019 dataset.
4.1.2. Evaluation Metrics
Accuracy, F1-score, and EER are used to evaluate the proposed method.
Accuracy
Accuracy measures the proportion of correctly classified instances to the total number of instances:
where TP is True Positive, TN is True Negative, FP is False Positive, and FN is False Negative.
F1-Score
The F1-score is the harmonic mean of Precision and Recall:
where
Equal Error Rate (EER)
Equal Error Rate (EER) is the operating point at which the False Acceptance Rate (FAR) equals the False Rejection Rate (FRR). This is achieved by adjusting a decision threshold, which determines the boundary for classifying inputs as positive or negative:
where
The threshold directly influences the rates of FAR and FRR. A lower threshold may reduce the FRR but increase the FAR, and vice versa. The EER is determined at the specific threshold where both rates are equal, providing a single metric to evaluate the balance between these errors in a system.
4.2. Results and Discussion
Table 3 highlights the performance of various averages of timbral features applied with a neural network on the ASVspoof 2019 development set, measured in terms of accuracy, F1-score, and EER. Among the features, depth achieves the highest accuracy of 80%, while brightness records the best F1-score of 87.96%. Hardness shows the lowest EER of 35.70%. Some features, such as warmth and boominess, exhibit balanced performance across metrics, whereas sharpness and roughness perform relatively poorly. Interestingly, reverberation achieves a high F1-score of 86.70% but suffers from a high EER of 48.23%.
These results indicate that individual timbral features capture different and complementary perceptual cues, with no single feature consistently outperforming others across all evaluation metrics. Combining all features leads to significant improvements, resulting in the best overall performance with an 82.03% accuracy, an F1-score of 89.89%, and the lowest EER of 32.37%, demonstrating the effectiveness of feature aggregation for improved spoof detection. While this performance remains below recent state-of-the-art deep feature-based systems, it establishes a meaningful perceptual baseline, which influences the advanced modeling strategies presented later.
Table 4 presents the results of using segmental frames to analyze perceptual speech-pathological features with neural networks on the ASVspoof 2019 development set. Among the individual features, sharpness achieves the best performance with an EER of 33.08%, followed closely by boominess and hardness. In contrast, reverberation fails entirely, with 0% accuracy and F1-score and an EER of 50%, indicating its ineffectiveness in this context.
Compared to average-based feature representations, the segmental analysis improves discrimination for most timbral features by capturing localized temporal variations that are characteristic of spoofed speech. In particular, sharpness and boominess benefit from frame-wise modeling, suggesting that temporal fluctuations in spectral emphasis are informative cues for imitation detection.
Table 3.
Results of applying an average of timbral features with an MLP [63] on the development set of ASVspoof 2019.
Table 4.
Results of using segmental frames of analysis of perceptual speech-pathological features with an MLP [63] on the development set of ASVspoof 2019.
When all features are combined and fed to the MLP, the model achieves the highest overall performance, with 93.98% accuracy, a 96.70% F1-score, and the lowest EER of 13.82%, highlighting the advantage of integrating features for spoof detection. This improvement confirms the complementary nature of perceptual features in the segmental domain and supports the effectiveness of feature fusion prior to more advanced modeling strategies.
Table 5 reports the results of an ablation study evaluating the contribution of individual speech-pathological features to the performance of an MLP model applied to the ASVspoof 2019 development set. Among all the features, depth emerges as the most crucial, as its exclusion leads to the lowest accuracy of % and a notable increase in EER of %. Similarly, removing sharpness significantly affects performance, resulting in the lowest F1-score of % and the highest EER of %, highlighting its importance in maintaining precision. Features like roughness and warmth also contribute substantially, with their exclusion increasing EER to % and %, respectively, whereas features such as brightness and hardness show relatively minor impacts when excluded. The study uses an MLP model, demonstrating its sensitivity to specific features for detecting spoofed audio. The results underscore that certain features are more integral to the model’s performance, with the exclusion of key features like depth and sharpness causing pronounced drops, whereas the model is more resilient to the removal of others. This highlights the importance of feature selection in optimizing neural network-based audio spoof detection.
Table 5.
Ablation study of segmental frames of analysis of perceptual speech-pathological features with an MLP [63] on development set of ASVspoof 2019.
Table 6 evaluates the impact of different segmental frame sizes for analyzing speech-pathological features for spoof detection on the evaluation set of ASVspoof 2019. Larger frames, such as 1 s, capture more comprehensive feature information, achieving the highest accuracy of % and F1-score of %. Shorter frames, like 500 ms, strike a balance, yielding the lowest EER of % while maintaining a competitive accuracy of % and an F1-score of %. The smallest frame, 250 ms, offers finer temporal resolution but performs slightly worse, with an EER of % and a moderate F1-score of %.
These results highlight that the DNN model adapts to varying frame sizes with consistent performance across metrics. Longer frames, such as 1 s, enhance feature extraction and maximize accuracy and precision, whereas shorter frames, like 500 ms, provide a trade-off by reducing EER, possibly due to improved ability to capture fine-grained temporal variations within each segment. These findings suggest that the choice of frame size is crucial for optimizing model performance based on application requirements, balancing accuracy and error rates effectively.
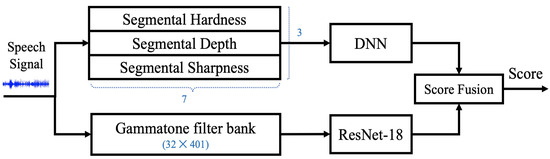
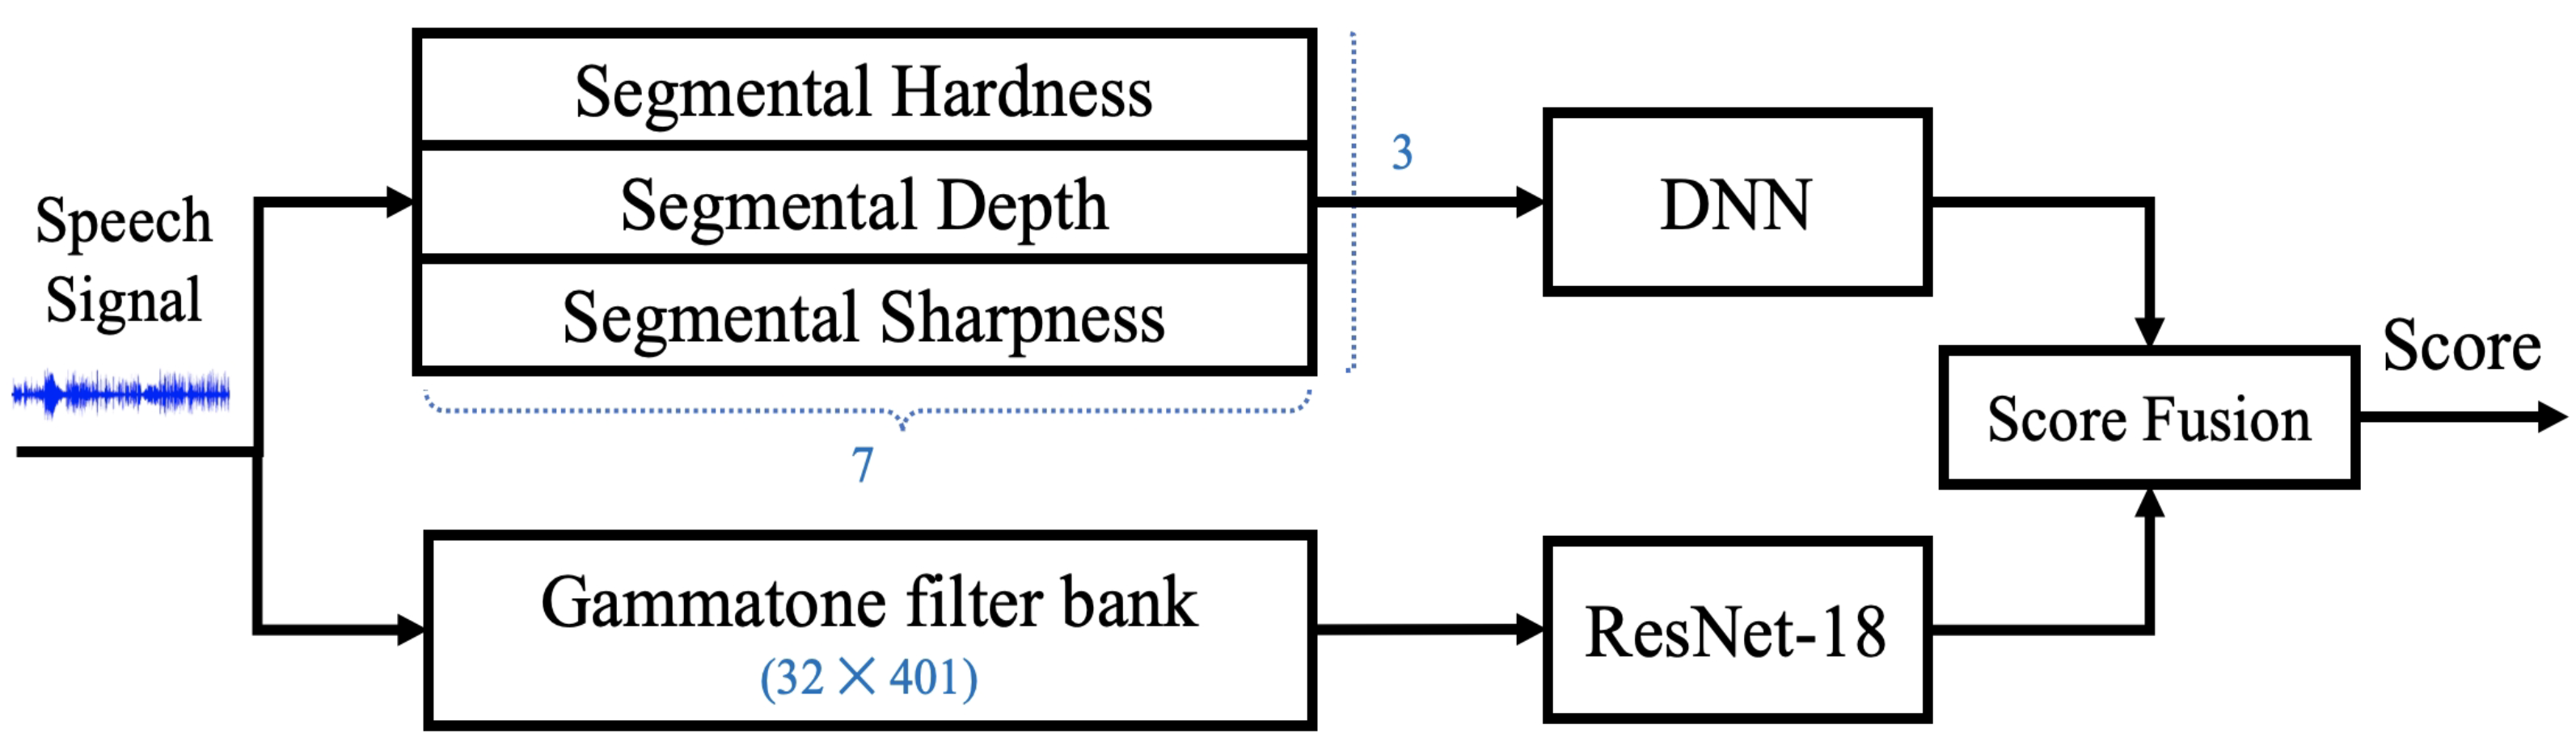
To investigate further, we evaluated various methods using different features, classifiers, and frame dimensions on the ASVspoof 2019 evaluation set, as shown in Table 7. Initially, all seven timbral features with a frame size of 1 s and a dimension of were analyzed using a DNN, achieving an accuracy of %, an F1-score of %, and an EER of %. To refine the approach, the three best-performing features—hardness, depth, and sharpness—were selected with the same frame size but reduced dimensions of , resulting in a slightly higher accuracy of % but an increased EER of %, indicating a trade-off in feature reduction. Additionally, using a gammatone filterbank with larger dimensions of and a ResNet-18 classifier significantly improved performance, yielding an accuracy of %, an F1-score of %, and an EER of %. Finally, the proposed method combines a gammatone filterbank with three timbral features, utilizing their respective models, ResNet-18 and a DNN, through score fusion, as shown in Figure 7. In this strategy, the gammatone filterbank with ResNet-18 serves as the primary model, while the timbral features with the DNN constitute the secondary model. If the prediction score exceeds a threshold of , it is directly considered the final decision. However, if the score falls below the threshold, the final score is determined using a weighted average of 70% from the primary model and 30% from the secondary model. The results indicate that the proposed approach achieved a superior performance, with an accuracy of %, an F1-score of %, and a lowest EER of %, thus demonstrating the effectiveness of integrating advanced classifiers with refined feature representations.
Figure 7.
The proposed method, combining (1) three pathological segment features with DNN and (2) gammatone filterbank with ResNet-18, through score fusion.
Table 6.
Results of using segmental frames of analysis of perceptual speech-pathological features with DNN with different frame sizes on the evaluation set of ASVspoof 2019.
Table 7.
Comparison of seven timbral features, three selected timbral features, and the gammatone filterbank.
4.3. Comparison with ASVspoof 2019 Evaluation Method
The comparison with related works in Table 8 shows that the proposed method achieves competitive performance on the ASVspoof 2019 dataset, particularly when compared with classical and recent deep learning-based baselines. With an EER of 1.33% on the development set and 5.93% on the evaluation set, the proposed approach consistently outperforms traditional cepstral feature-based systems such as CQCC- and LFCC-GMM models, as well as several transformer-based and CNN-based methods evaluated by the same benchmark. Although some state-of-the-art approaches leveraging high-dimensional spectral representations achieve comparable or slightly lower EERs, the proposed method offers a distinct advantage by relying on perceptually motivated, low-dimensional timbral features. This comparison highlights that incorporating auditory-inspired representations, together with segmental-wise analysis and hybrid modeling, provides a robust and interpretable alternative for deepfake speech detection, complementing existing state-of-the-art systems rather than replacing them.
Table 8.
Comparison of the proposed method with related works.
5. Conclusions
This study tackled the critical challenge of detecting deepfake speech by emphasizing the segmental frame-wise analysis of speech-pathological features, such as timbral attributes, to identify nuanced and localized differences between genuine and synthetic speech. By integrating these perceptual attributes with a gammatone filterbank that simulated human auditory processing, the proposed method significantly enhanced detection performance. Experimental results on the ASVspoof 2019 dataset validated the effectiveness of this approach, with the combination of ResNet-18 and DNN models achieving an Equal Error Rate (EER) of %, outperforming baseline methods. These findings highlight the importance of segmental analysis in improving the robustness of deepfake detection systems.
Despite the promising results, several limitations remain. Some perceptual features, particularly reverberation, showed limited effectiveness in their current binary formulation. In addition, the frame-wise extraction of perceptual timbral features increases computational overhead, which may hinder real-time or resource-constrained deployment. Future work will address these limitations by extending experiments to cross-corpus, multilingual, and real-world datasets, refining perceptual feature representations, and incorporating additional auditory-inspired features. Moreover, lightweight architectures and adaptive fusion strategies will be explored to reduce computational cost while maintaining detection performance, thereby improving robustness and practical applicability.
Author Contributions
Conceptualization, A.C., K.Z., S.D., J.K., W.K. and M.U.; Methodology, A.C., K.Z. and M.U.; Software, A.C.; Validation, A.C. and K.L.; Formal analysis, A.C., K.Z., K.L., S.D., J.K., W.K. and M.U.; Investigation, A.C.; Resources, S.D. and M.U.; Writing – original draft, A.C., K.Z. and K.L.; Writing – review & editing, K.Z., K.L., S.D., J.K., W.K. and M.U.; Visualization, K.Z.; Supervision, K.L., J.K., W.K. and M.U.; Project administration, M.U.; Funding acquisition, M.U. All authors have read and agreed to the published version of the manuscript.
Funding
This work was supported by a Grant-in-Aid for the Promotion of Joint International Research (Fostering Joint International Research (B)) (20KK0233), a Grant-in-Aid for Transformative Research Areas (A) (23H04344) and the JST Program for co-creating startup ecosystem (JPMJSF2318). This work was also supported by a grant from the SIIT-JAIST-NSTDA Dual Doctoral Degree Program and from the Thammasat University Research Fund (TUFT 83/2566). This work was financially supported by the National Institute of Information and Communications Technology (NICT) and was a part of the ASEAN IVO project titled ’Spoof Detection for Automatic Speaker Verification’ (www.nict.go.jp/en/asean_ivo), accessed on 4 February 2026.
Institutional Review Board Statement
Not applicable.
Informed Consent Statement
Not applicable.
Data Availability Statement
The original contributions presented in the study are included in the article, further inquiries can be directed to the corresponding authors.
Conflicts of Interest
The authors declare no conflicts of interest.
References
- Associated Press. New Hampshire Grapples with Biden Deepfake Robocalls Ahead of Primary. 2024. Available online: https://apnews.com/article/new-hampshire-primary-biden-ai-deepfake-robocall-f3469ceb6dd613079092287994663db5 (accessed on 28 November 2024).
- Sahidullah, M.; Kinnunen, T.H.; Hanilçi, C. A comparison of features for synthetic speech detection. In Proceedings of the 16th Annual Conference of the International Speech Communication Association, INTERSPEECH 2015, Dresden, Germany, 6–10 September 2015. [Google Scholar] [CrossRef] [Scilit]
- Yu, H.; Tan, Z.H.; Ma, Z.; Martin, R.; Guo, J. Spoofing detection in automatic speaker verification systems using DNN classifiers and dynamic acoustic features. IEEE Trans. Neural Netw. Learn. Syst. 2017, 29, 4633–4644. [Google Scholar] [CrossRef] [Scilit]
- Lei, Z.; Yang, Y.; Liu, C.; Ye, J. Siamese Convolutional Neural Network Using Gaussian Probability Feature for Spoofing Speech Detection. Interspeech 2020. [Google Scholar] [CrossRef] [Scilit]
- Khochare, J.; Joshi, C.; Yenarkar, B.; Suratkar, S.; Kazi, F. A deep learning framework for audio deepfake detection. Arab. J. Sci. Eng. 2021, 47, 3447–3458. [Google Scholar] [CrossRef] [Scilit]
- Yang, J.; Das, R.K. Long-term high frequency features for synthetic speech detection. Digit. Signal Process. 2020, 97, 102622. [Google Scholar] [CrossRef] [Scilit]
- Godino-Llorente, J.I.; Gómez-Vilda, P. Automatic detection of voice impairments by means of short-term cepstral parameters and neural network based detectors. IEEE Trans. Biomed. Eng. 2004, 51, 380–384. [Google Scholar] [CrossRef] [Scilit]
- Zhang, Z.; Yi, X.; Zhao, X. Fake speech detection using residual network with transformer encoder. In Proceedings of the 2021 ACM Workshop on Information Hiding and Multimedia Security; Association for Computing Machinery: New York, NY, USA, 2021; pp. 13–22. [Google Scholar] [CrossRef] [Scilit]
- Wang, Z.; Cui, S.; Kang, X.; Sun, W.; Li, Z. Densely connected convolutional network for audio spoofing detection. In Proceedings of the 2020 Asia-Pacific Signal and Information Processing Association Annual Summit and Conference (APSIPA ASC), Auckland, New Zealand, 7–10 December 2020; IEEE: Piscataway, NY, USA, 2020; pp. 1352–1360. Available online: https://ieeexplore.ieee.org/document/9306423 (accessed on 27 January 2026).
- Zaman, K.; Sah, M.; Direkoglu, C.; Unoki, M. A survey of audio classification using deep learning. IEEE Access 2023, 11, 106620–106649. [Google Scholar] [CrossRef] [Scilit]
- Ali, M.; Sabir, A.; Hassan, M. Fake audio detection using hierarchical representations learning and spectrogram features. In Proceedings of the 2021 International Conference on Robotics and Automation in Industry (ICRAI), Guangzhou, China, 19–22 November 2021; IEEE: Piscataway, NJ, USA, 2021; pp. 1–6. [Google Scholar] [CrossRef] [Scilit]
- Firc, A.; Malinka, K.; Hanáček, P. Deepfake Speech Detection: A Spectrogram Analysis. In Proceedings of the 39th ACM/SIGAPP Symposium on Applied Computing, Avila, Spain, 8–12 April 2024; pp. 1312–1320. [Google Scholar] [CrossRef] [Scilit]
- Mon, K.Z.; Galajit, K.; Mawalim, C.O.; Karnjana, J.; Isshiki, T.; Aimmanee, P. Spoof Detection using Voice Contribution on LFCC features and ResNet-34. In Proceedings of the 2023 18th International Joint Symposium on Artificial Intelligence and Natural Language Processing (iSAI-NLP), Bangkok, Thailand, 27–29 November 2023; IEEE: Piscataway, NJ, USA, 2023; pp. 1–6. [Google Scholar] [CrossRef] [Scilit]
- Todisco, M.; Delgado, H.; Evans, N.W. A New Feature for Automatic Speaker Verification Anti-Spoofing: Constant Q Cepstral Coefficients. In Proceedings of the Odyssey, 2016, Bilbao, Spain, 21–24 June 2016; Volume 2016, pp. 283–290. [Google Scholar] [CrossRef] [Scilit]
- Yang, J.; Das, R.K. Low frequency frame-wise normalization over constant-Q transform for playback speech detection. Digit. Signal Process. 2019, 89, 30–39. [Google Scholar] [CrossRef] [Scilit]
- Kumbhar, H.S.; Bhandari, S.U. Speech emotion recognition using MFCC features and LSTM network. In Proceedings of the 2019 5th International Conference On Computing, Communication, Control Furthermore, Automation (ICCUBEA), Pune, India, 19–21 September 2019; IEEE: Piscataway, NJ, USA, 2019; pp. 1–3. [Google Scholar] [CrossRef] [Scilit]
- Wang, Y.; Chen, W.; Zhang, J.; Dong, T.; Shan, G.; Chi, X. Efficient Volume Exploration Using the Gaussian Mixture Model. IEEE Trans. Vis. Comput. Graph. 2011, 17, 1560–1573. [Google Scholar] [CrossRef] [Scilit]
- Duraibi, S.; Alhamdani, W.; Sheldon, F.T. Replay spoof attack detection using deep neural networks for classification. In Proceedings of the 2020 International Conference on Computational Science and Computational Intelligence (CSCI), Las Vegas, NV, USA, 16–18 November 2020; IEEE: Piscataway, NJ, USA, 2020; pp. 170–174. [Google Scholar] [CrossRef] [Scilit]
- Wu, J. Introduction to Convolutional Neural Networks. Natl. Key Lab Nov. Softw. Technol. Nanjing Univ. China 2017, 5, 495. Available online: https://cs.nju.edu.cn/wujx/paper/CNN.pdf (accessed on 4 February 2026).
- Sherstinsky, A. Fundamentals of recurrent neural network (RNN) and long short-term memory (LSTM) network. Phys. Nonlinear Phenom. 2020, 404, 132306. [Google Scholar] [CrossRef] [Scilit]
- Qadir, G.; Zareen, S.; Hassan, F.; Rahman, A.U. Voice spoofing countermeasure based on spectral features to detect synthetic attacks through LSTM. Int. J. Innov. Sci. Technol. 2022, 3, 153–165. [Google Scholar] [CrossRef] [Scilit]
- Merryton, A.R.; Augasta, M.G. A Novel Framework for Fake News Detection using Double Layer BI-LSTM. In Proceedings of the 2023 5th International Conference on Smart Systems and Inventive Technology (ICSSIT), Tirunelveli, India, 23–25 January 2023; IEEE: Piscataway, NJ, USA, 2023; pp. 1689–1696. [Google Scholar] [CrossRef] [Scilit]
- Shafiq, M.; Gu, Z. Deep residual learning for image recognition: A survey. Appl. Sci. 2022, 12, 8972. [Google Scholar] [CrossRef] [Scilit]
- Farrús, M.; Hernando, J.; Ejarque, P. Jitter and shimmer measurements for speaker recognition. In Proceedings of the International Speech Communication Association (ISCA), Antwerp, Belgium, 27–31 August; 2007; pp. 778–781. [Google Scholar] [CrossRef] [Scilit]
- Jiang, J.J.; Wexler, D.B.; Titze, I.R.; Gray, S.D. Fundamental Frequency and Amplitude Perturbation in Reconstructed Canine Vocal Folds. Ann. Otol. Rhinol. Laryngol. 1994, 103, 145–148. [Google Scholar] [CrossRef] [Scilit] [PubMed]
- Gómez-García, J.; Moro-Velázquez, L.; Arias-Londoño, J.D.; Godino-Llorente, J.I. On the design of automatic voice condition analysis systems. Part III: Review of acoustic modelling strategies. Biomed. Signal Process. Control 2021, 66, 102049. [Google Scholar] [CrossRef] [Scilit]
- Dellwo, V.; Huckvale, M.; Ashby, M. How is individuality expressed in voice? An introduction to speech production and description for speaker classification. In Speaker Classification I: Fundamentals, Features, and Methods; Springer: Berlin, Germany, 2007; pp. 1–20. [Google Scholar] [CrossRef] [Scilit]
- Chaiwongyen, A.; Duangpummet, S.; Karnjana, J.; Kongprawechnon, W.; Unoki, M. Deepfake-speech detection with pathological features and multilayer perceptron neural network. In Proceedings of the 2023 Asia Pacific Signal and Information Processing Association Annual Summit and Conference (APSIPA ASC), Taipei, Taiwan, 31 October–3 November 2023; IEEE: Piscataway, NJ, USA, 2023; pp. 2182–2188. [Google Scholar] [CrossRef] [Scilit]
- Chaiwongyen, A.; Duangpummet, S.; Karnjana, J.; Kongprawechnon, W.; Unoki, M. Potential of Speech-pathological Features for Deepfake Speech Detection. IEEE Access 2024, 12, 121958–121970. [Google Scholar] [CrossRef] [Scilit]
- Li, K.; Wang, Y.; Le Nguyen, M.; Akagi, M.; Unoki, M. Analysis of amplitude and frequency perturbation in the voice for fake audio detection. In Proceedings of the 2022 Asia-Pacific Signal and Information Processing Association Annual Summit and Conference (APSIPA ASC), Chiang Mai, Thailand, 7–10 November 2022; IEEE: Piscataway, NJ, USA, 2022; pp. 929–936. [Google Scholar] [CrossRef] [Scilit]
- Sasou, A. Automatic identification of pathological voice quality based on the GRBAS categorization. In Proceedings of the 2017 Asia-Pacific Signal and Information Processing Association Annual Summit and Conference (APSIPA ASC), Kuala Lumpur, Malaysia, 12–15 December 2017; IEEE: Piscataway, NJ, USA, 2017; pp. 1243–1247. [Google Scholar] [CrossRef] [Scilit]
- Watts, C.R.; Clark, R.; Early, S. Acoustic measures of phonatory improvement secondary to treatment by oral corticosteroids in a professional singer: A case report. J. Voice 2001, 15, 115–121. [Google Scholar] [CrossRef] [Scilit]
- Shama, K.; Krishna, A.; Cholayya, N.U. Study of harmonics-to-noise ratio and critical-band energy spectrum of speech as acoustic indicators of laryngeal and voice pathology. Eurasip J. Adv. Signal Process. 2006, 2007, 085286. [Google Scholar] [CrossRef] [Scilit]
- Jouaiti, M.; Kirby, P.; Vaidyanathan, R. Matching Acoustic and Perceptual Measures of Phonation Assessment in Disordered Speech-A Case Study. In Proceedings of the Annual Conference of the International Speech Communication Association, INTERSPEECH, Rotterdam, The Netherlands, 17–21 August 2023; Volume 2023, pp. 4508–4512. [Google Scholar] [CrossRef] [Scilit]
- Kurt, İ.; Ulukaya, S.; Erdem, O. Musical feature based classification of Parkinson’s disease using dysphonic speech. In Proceedings of the 2018 41st International Conference on Telecommunications and Signal Processing (TSP), Athens, Greece, 4–6 July 2018; IEEE: Piscataway, NJ, USA, 2018; pp. 1–4. [Google Scholar] [CrossRef] [Scilit]
- Chaiwongyen, A.; Songsriboonsit, N.; Duangpummet, S.; Karnjana, J.; Kongprawechnon, W.; Unoki, M. Contribution of Timbre and Shimmer Features to Deepfake Speech Detection. In Proceedings of the 2022 Asia-Pacific Signal and Information Processing Association Annual Summit and Conference (APSIPA ASC), Chiang Mai, Thailand, 7–10 November 2022; IEEE: Piscataway, NJ, USA, 2022; pp. 97–103. [Google Scholar] [CrossRef] [Scilit]
- Unoki, M.; Li, K.; Chaiwongyen, A.; Nguyen, Q.H.; Zaman, K. Deepfake speech detection: Approaches from acoustic features related to auditory perception to deep neural networks. IEICE Trans. Inf. Syst. 2025, E108.D, 300–310. [Google Scholar] [CrossRef] [Scilit]
- Ren, J.M.; Wu, M.J.; Jang, J.S.R. Automatic Music Mood Classification Based on Timbre and Modulation Features. IEEE Trans. Affect. Comput. 2015, 6, 236–246. [Google Scholar] [CrossRef] [Scilit]
- Jiang, W.; Liu, J.; Zhang, X.; Wang, S.; Jiang, Y. Analysis and Modeling of Timbre Perception Features in Musical Sounds. Appl. Sci. 2020, 10, 789. [Google Scholar] [CrossRef] [Scilit]
- McAdams, S.; Giordano, B.L. The Perception of Musical Timbre; Oxford Academic: Oxford, UK, 2014. [Google Scholar] [CrossRef] [Scilit]
- Jensen, K. The timbre model. J. Acoust. Soc. Am. 2002, 112, 2238. [Google Scholar] [CrossRef] [Scilit]
- Morchen, F.; Ultsch, A.; Thies, M.; Lohken, I. Modeling timbre distance with temporal statistics from polyphonic music. IEEE Trans. Audio, Speech, Lang. Process. 2006, 14, 81–90. [Google Scholar] [CrossRef] [Scilit]
- Pearce, A.; Brookes, T.; Mason, R. Timbral Attributes for Sound Effect Library Searching. In Proceedings of the Audio Engineering Society Conference: 2017 AES International Conference on Semantic Audio. Audio Engineering Society, Erlangen, Germany, 22–24 June 2017; Available online: https://api.semanticscholar.org/CorpusID:1114232 (accessed on 4 February 2026).
- Pearce, A.; Brookes, T.; Mason, R. Modelling timbral hardness. Appl. Sci. 2019, 9, 466. [Google Scholar] [CrossRef] [Scilit]
- Pearce, A.; Brookes, T.; Mason, R. First prototype of timbral characterisation tool for semantically annotating non-musical. Audio Commons Proj. Deliv. D 2017, 5, 3268. [Google Scholar]
- Pearce, A.; Brookes, T.; Mason, R. Audio Commons: Deliverable D5.2: First Prototype of Timbral Characterisation Tools for Semantically Annotating Non-Musical Content. Technical Report D5.2. 2017. Available online: https://audiocommons.github.io/assets/files/AC-WP5-SURREY-D5.2%20First%20prototype%20of%20timbral%20characterisation%20tools%20for%20semantically%20annotating%20non-musical%20content.pdf (accessed on 4 February 2026).
- Schubert, E.; Wolfe, J.; Tarnopolsky, A. Spectral centroid and timbre in complex, multiple instrumental textures. In Proceedings of the International Conference on Music Perception and Cognition, North Western University, Evanston, IL, USA, 3–7 August 2004; pp. 112–116. Available online: https://www.academia.edu/30547781/Spectral_centroid_and_timbre_in_complex_multiple_instrumental_textures (accessed on 4 February 2026).
- Schubert, E.; Wolfe, J. Does timbral brightness scale with frequency and spectral centroid? Acta Acust. United Acust. 2006, 92, 820–825. Available online: https://www.phys.unsw.edu.au/~jw/reprints/SchubertWolfe06.pdf (accessed on 27 January 2026).
- Pearce, A. Perceived Differences Between Microphones. Ph.D. Thesis, University of Surrey, Guildford, UK, 2017. Available online: https://openresearch.surrey.ac.uk/esploro/outputs/doctoral/Perceived-differences-between-microphones/99511345902346 (accessed on 27 January 2026).
- Vassilakis, P.N. SRA: A Web-based Research Tool for Spectral and Roughness Analysis of Sound Signals. 2007. Available online: https://api.semanticscholar.org/CorpusID:14866123 (accessed on 4 February 2026).
- Sorensen, K.M.; Vigeant, M.C. Study of the perception of warmth in concert halls and correlation with room acoustics metrics. J. Acoust. Soc. Am. 2016, 140, 3176. [Google Scholar] [CrossRef] [Scilit]
- Bromham, G.; Moffat, D.; Barthet, M.; Danielsen, A.; Fazekas, G. The impact of audio effects processing on the perception of brightness and warmth. In Proceedings of the 14th International Audio Mostly Conference: A Journey in Sound, Nottingham, UK, 18–20 September 2019; pp. 183–190. [Google Scholar] [CrossRef] [Scilit]
- Zwicker, E.; Fastl, H. Psycho-Acoustics: Facts and Models; Springer Science & Business Media: Berlin, Germany, 2013. [Google Scholar]
- Hatano, S.; Hashimoto, T. Booming Index as a Measure for Evaluating Booming Sensation. In Proceedings of the 29th International Congress on Noise Control Engineering, Nice, France, 27–30 August 2000; Volume 233, pp. 1–5. Available online: https://ince.publisher.ingentaconnect.com/content/ince/incecp/2000/00002000/00000003/art00040.
- Eaton, J.; Gaubitch, N.D.; Moore, A.H.; Naylor, P.A. Estimation of room acoustic parameters: The ACE challenge. IEEE/ACM Trans. Audio Speech Lang. Process. 2016, 24, 1681–1693. [Google Scholar] [CrossRef] [Scilit]
- Patterson, R.D.; Allerhand, M.H.; Giguere, C. Time-domain modeling of peripheral auditory processing: A modular architecture and a software platform. J. Acoust. Soc. Am. 1995, 98, 1890–1894. [Google Scholar] [CrossRef] [Scilit]
- Slaney, M. Lyon’s Cochlear Model. Citeseer: Cham, Switzerland, 1988. Volume 13. Available online: https://engineering.purdue.edu/~malcolm/apple/tr13/LyonsCochlea.pdf (accessed on 27 January 2026).
- Moore, B.C.; Glasberg, B.R. Suggested formulae for calculating auditory-filter bandwidths and excitation patterns. J. Acoust. Soc. Am. 1983, 74, 750–753. [Google Scholar] [CrossRef] [Scilit]
- He, K.; Zhang, X.; Ren, S.; Sun, J. Deep Residual Learning for Image Recognition. In Proceedings of the 2016 IEEE Conference on Computer Vision and Pattern Recognition (CVPR), Las Vegas, NV, USA, 27–30 June 2016; pp. 770–778. [Google Scholar] [CrossRef] [Scilit]
- Yousefi, M.; Hansen, J.H. Speaker Conditioning of Acoustic Models Using Affine Transformation for Multi-Speaker Speech Recognition. In Proceedings of the 2021 IEEE Automatic Speech Recognition and Understanding Workshop (ASRU), Cartagena, Colombia, 13–17 December 2021; pp. 283–288. [Google Scholar] [CrossRef] [Scilit]
- Todisco, M.; Wang, X.; Vestman, V.; Sahidullah, M.; Delgado, H.; Nautsch, A.; Yamagishi, J.; Evans, N.; Kinnunen, T.; Lee, K.A. ASVSpoof 2019: Future horizons in spoofed and fake audio detection. In Proceedings of the Annual Conference of the International Speech Communication Association, Interspeech, Graz, Austria, 15–19 September 2019; Volume 2019, pp. 1008–1012. [Google Scholar] [CrossRef] [Scilit]
- Wang, X.; Yamagishi, J.; Todisco, M.; Delgado, H.; Nautsch, A.; Evans, N.; Sahidullah, M.; Vestman, V.; Kinnunen, T.; Lee, K.A.; et al. ASVspoof 2019: A large-scale public database of synthesized, converted and replayed speech. Comput. Speech Lang. 2020, 64, 101–114. [Google Scholar] [CrossRef] [Scilit]
- Aitkin, M.; Foxall, R. Statistical modelling of artificial neural networks using the multi-layer perceptron. Stat. Comput. 2003, 13, 227–239. [Google Scholar] [CrossRef] [Scilit]
- Nautsch, A.; Wang, X.; Evans, N.; Kinnunen, T.H.; Vestman, V.; Todisco, M.; Delgado, H.; Sahidullah, M.; Yamagishi, J.; Lee, K.A. ASVspoof 2019: Spoofing countermeasures for the detection of synthesized, converted and replayed speech. IEEE Trans. Biom. Behav. Identity Sci. 2021, 3, 252–265. [Google Scholar] [CrossRef] [Scilit]
- Yang, Y.; Qin, H.; Zhou, H.; Wang, C.; Guo, T.; Han, K.; Wang, Y. A robust audio deepfake detection system via multi-view feature. In Proceedings of the 2024 IEEE International Conference on Acoustics, Speech and Signal Processing (ICASSP), Seoul, Republic of Korea, 14–19 April 2024; IEEE: Piscataway, NJ, USA, 2024; pp. 13131–13135. [Google Scholar] [CrossRef] [Scilit]
- Cuccovillo, L.; Gerhardt, M.; Aichroth, P. Audio spectrogram transformer for synthetic speech detection via speech formant analysis. In Proceedings of the 2023 IEEE International Workshop on Information Forensics and Security (WIFS), Nurnberg, Germany, 4–7 December 2023; IEEE: Piscataway, NJ, USA, 2023; pp. 1–6. [Google Scholar] [CrossRef] [Scilit]
- Talagini Ashoka, A.B.; Cuccovillo, L.; Aichroth, P. Audio transformer for synthetic speech detection via Benford’s law distribution analysis. In Proceedings of the 3rd ACM International Workshop on Multimedia AI against Disinformation, Phuket, Thailand, 10–14 June 2024; pp. 23–29. [Google Scholar] [CrossRef] [Scilit]
- Ulutas, G.; Tahaoglu, G.; Ustubioglu, B. Deepfake audio detection with vision transformer based method. In Proceedings of the 2023 46th International Conference on Telecommunications and Signal Processing (TSP), Virtual, 12–14 June 2023; IEEE: Piscataway, NJ, USA, 2023; pp. 244–247. [Google Scholar] [CrossRef] [Scilit]
- Das, R.K.; Yang, J.; Li, H. Long range acoustic and deep features perspective on ASVspoof 2019. In Proceedings of the 2019 IEEE Automatic Speech Recognition and Understanding Workshop (ASRU), Sentosa, Singapore, 14–18 December 2019; IEEE: Piscataway, NJ, USA, 2019; pp. 1018–1025. [Google Scholar] [CrossRef] [Scilit]
- Nosek, T.; Suzić, S.; Papić, B.; Jakovljević, N. Synthesized speech detection based on spectrogram and convolutional neural networks. In Proceedings of the 2019 27th Telecommunications Forum (TELFOR), Belgrade, Serbia, 26–27 November 2019; IEEE: Piscatway, NJ, USA, 2019; pp. 1–4. [Google Scholar] [CrossRef] [Scilit]
- Cheng, H.; Mawalim, C.O.; Li, K.; Wang, L.; Unoki, M. Analysis of Spectro-Temporal Modulation Representation for Deep-Fake Speech Detection. In Proceedings of the 2023 Asia Pacific Signal and Information Processing Association Annual Summit and Conference (APSIPA ASC), Taipei, Taiwan, 31 October–3 November 2023; IEEE: Piscataway, NJ, USA, 2023; pp. 1822–1829. [Google Scholar] [CrossRef] [Scilit]
- Zaman, K.; Samiul, I.J.; Sah, M.; Direkoglu, C.; Okada, S.; Unoki, M. Hybrid transformer architectures with diverse audio features for deepfake speech classification. IEEE Access 2024, 12, 149221–149237. [Google Scholar] [CrossRef] [Scilit]
- Lai, C.I.; Chen, N.; Villalba, J.; Dehak, N. ASSERT: Anti-Spoofing with Squeeze-Excitation and Residual Networks. In Proceedings of the 20th Annual Conference of the International Speech Communication Association INTERSPEECH 2019, Graz, Austria, 15–19 September 2019; pp. 1013–1017. [Google Scholar] [CrossRef] [Scilit]
Disclaimer/Publisher’s Note: The statements, opinions and data contained in all publications are solely those of the individual author(s) and contributor(s) and not of MDPI and/or the editor(s). MDPI and/or the editor(s) disclaim responsibility for any injury to people or property resulting from any ideas, methods, instructions or products referred to in the content. |
© 2026 by the authors. Licensee MDPI, Basel, Switzerland. This article is an open access article distributed under the terms and conditions of the Creative Commons Attribution (CC BY) license.