


Abstract
Much of Japan’s social infrastructure was concentrated during the period of rapid economic growth around the 1970s and is now facing the serious problem of simultaneous aging. To address this, a shift from conventional reactive maintenance to asset management utilizing various data is urgently needed. However, a critical barrier in practice is that inspection data predominately exists in analog paper formats or unstructured files, relying on subjective expert ratings (e.g., scale A to D). This lack of digital structure and the presence of “Assessor Bias” make it difficult to secure the robustness required for direct statistical analysis. To advance data analysis under these constraints, it is crucial to first verify whether a mathematical model can handle such uncertainty. This paper focuses on verifying the robustness and convergence of a deterioration prediction model designed to bridge this gap. Specifically, it incorporates the expert’s “judgment variation” into the model as probabilistic fluctuations (e.g., Beta-distributed noise) and uses large-scale Monte Carlo simulations to verify whether the model can produce stable results. This establishes a foundation for advancing future data analysis. Based on these verifications, we promote not only the “micro-segmentation of homogeneous statistical populations” but also the “micro-detailing of analytical models.” Such efforts are expected to drive the shift from qualitative methods reliant on human intuition to quantitative methods in modern society.
1. Introduction
1.1. Background of the Research
Our nation faces a serious challenge as much of the social capital intensively developed during the high-growth period has passed the 50-year mark since construction, leading to simultaneous aging [1,2]. According to predictions by the Ministry of Land, Infrastructure, Transport and Tourism, 75% of road bridges and 66% of port facilities will exceed 50 years since construction by 2040 [3]. The maintenance of this infrastructure has become a top national priority. Meanwhile, declining tax revenues due to a declining birthrate, an aging population, and overall population decrease are placing increasingly severe constraints on financial resources allocated to infrastructure management. This has made it imperative to shift from conventional post-failure maintenance to preventive maintenance that maximizes effectiveness within a limited budget [1,2]. Against this backdrop, the importance of “infrastructure asset management”—a systematic management method that treats social infrastructure as assets to maximize their value—is growing [1,2]. Traditionally, infrastructure management has heavily relied on the experience and knowledge of skilled engineers, but this approach has faced issues such as the personalization of judgments and the difficulty of long-term prediction [1].
In response to this situation, Dr. Maeda, from a field perspective in his doctoral dissertation (2022), stated, “From the future socio-economic situation, management based on the administration and analysis of big data, as represented by advanced information processing like AI and IoT, is anticipated.” He strongly argued for the urgent necessity of transitioning to “data-driven management” that makes rational decisions based on data [2]. Deterioration prediction based on scientific evidence is the core technology of this data-driven management.
To achieve this, theoretical frameworks for complex systems and mathematical modeling have been discussed as a foundation for transdisciplinary science [4]. In the domain of civil engineering, extensive research has been conducted on deterioration prediction using field data. Seminal works by Kaito et al. (2003) and Tsuda et al. (2005) established methods for estimating Markov transition probabilities from visual inspection data [5,6], aligning with international foundational studies by Cesare et al. (1992) and Madanat et al. (1995) [7,8]. Furthermore, to capture the time-dependent nature of deterioration, hazard models have been widely applied [9,10,11,12,13]. These models have been adapted for specific facilities, including tunnel lighting systems [14] and other systems with time-dependent processes [15,16].
The integration of these probabilistic models into Bridge Management Systems (BMS) has facilitated the development of optimal maintenance strategies [17,18]. Research has evolved to include Life Cycle Cost (LCC) optimization [19,20,21,22,23] and schedule equalization using Genetic Algorithms (GA) [24,25]. Beyond bridges, these methodologies have been successfully expanded to pavement management [26,27,28,29,30], sewage treatment facilities [31], and port and coastal facilities [32,33,34,35]. More recently, with the advent of digital transformation, research has expanded into advanced techniques utilizing deep learning, digital twins, and physics-informed neural networks [36,37,38,39,40,41].
Despite this rich body of literature, applying these models to tunnel lighting facilities presents unique challenges due to the specific constraints of analog data and assessor bias described below. This paper focuses on lighting facilities installed within road tunnels, among the many types of social infrastructure. Tunnel lighting facilities play an extremely important role in mitigating the difference in brightness between the inside and outside of the tunnel, providing a safe visual environment within it [2,42]. However, these facilities are constantly exposed to harsh environments, including humidity, exhaust gases within the tunnel, and de-icing agents applied during winter. They deteriorate through various mechanisms, including the corrosion of metal parts [2,3]. As equipment failure can significantly compromise traffic safety, it is essential to accurately predict their state of deterioration and perform maintenance and renewal at the appropriate times.
1.2. Problem Statement
Two major challenges exist in constructing and verifying the accuracy of a deterioration prediction model for tunnel lighting facilities.
- 1.
- Analog Data and Scarcity: In practice, inspection records for tunnel lighting are predominantly stored in paper format or non-structured PDF files.Unlike bridges or pavements where digital databases (BMS) are established, lighting facilities lack sufficient time-series digital data for training complex machine learning models.
- 2.
- Subjectivity and Assessor Bias: The deterioration state is assessed through visual inspections by specialized engineers and rated on a discrete scale (e.g., A, B, C, D). This process inherently contains “Assessor Bias,” where judgments vary among evaluators. For instance, the boundary between “Rating B (Minor deterioration)” and “Rating C (Repair needed)” often depends on the engineer’s tacit knowledge and experience.
Given these constraints, directly applying data-driven approaches to raw data is risky. Therefore, this study establishes a preliminary verification protocol: instead of relying solely on scarce real data, we explicitly model the “Expert’s Judgment Variability” as stochastic noise (e.g., Beta distribution) and verify whether the prediction model remains robust under such uncertainty.
1.3. Research Protocol and Methodology
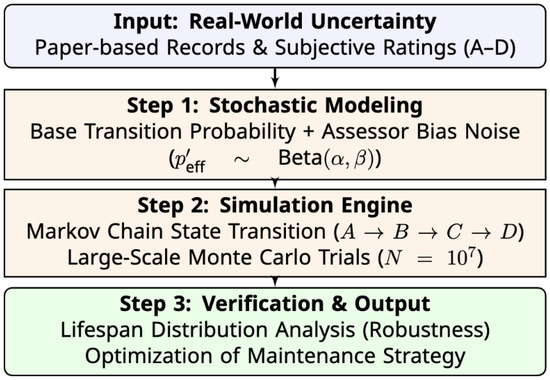
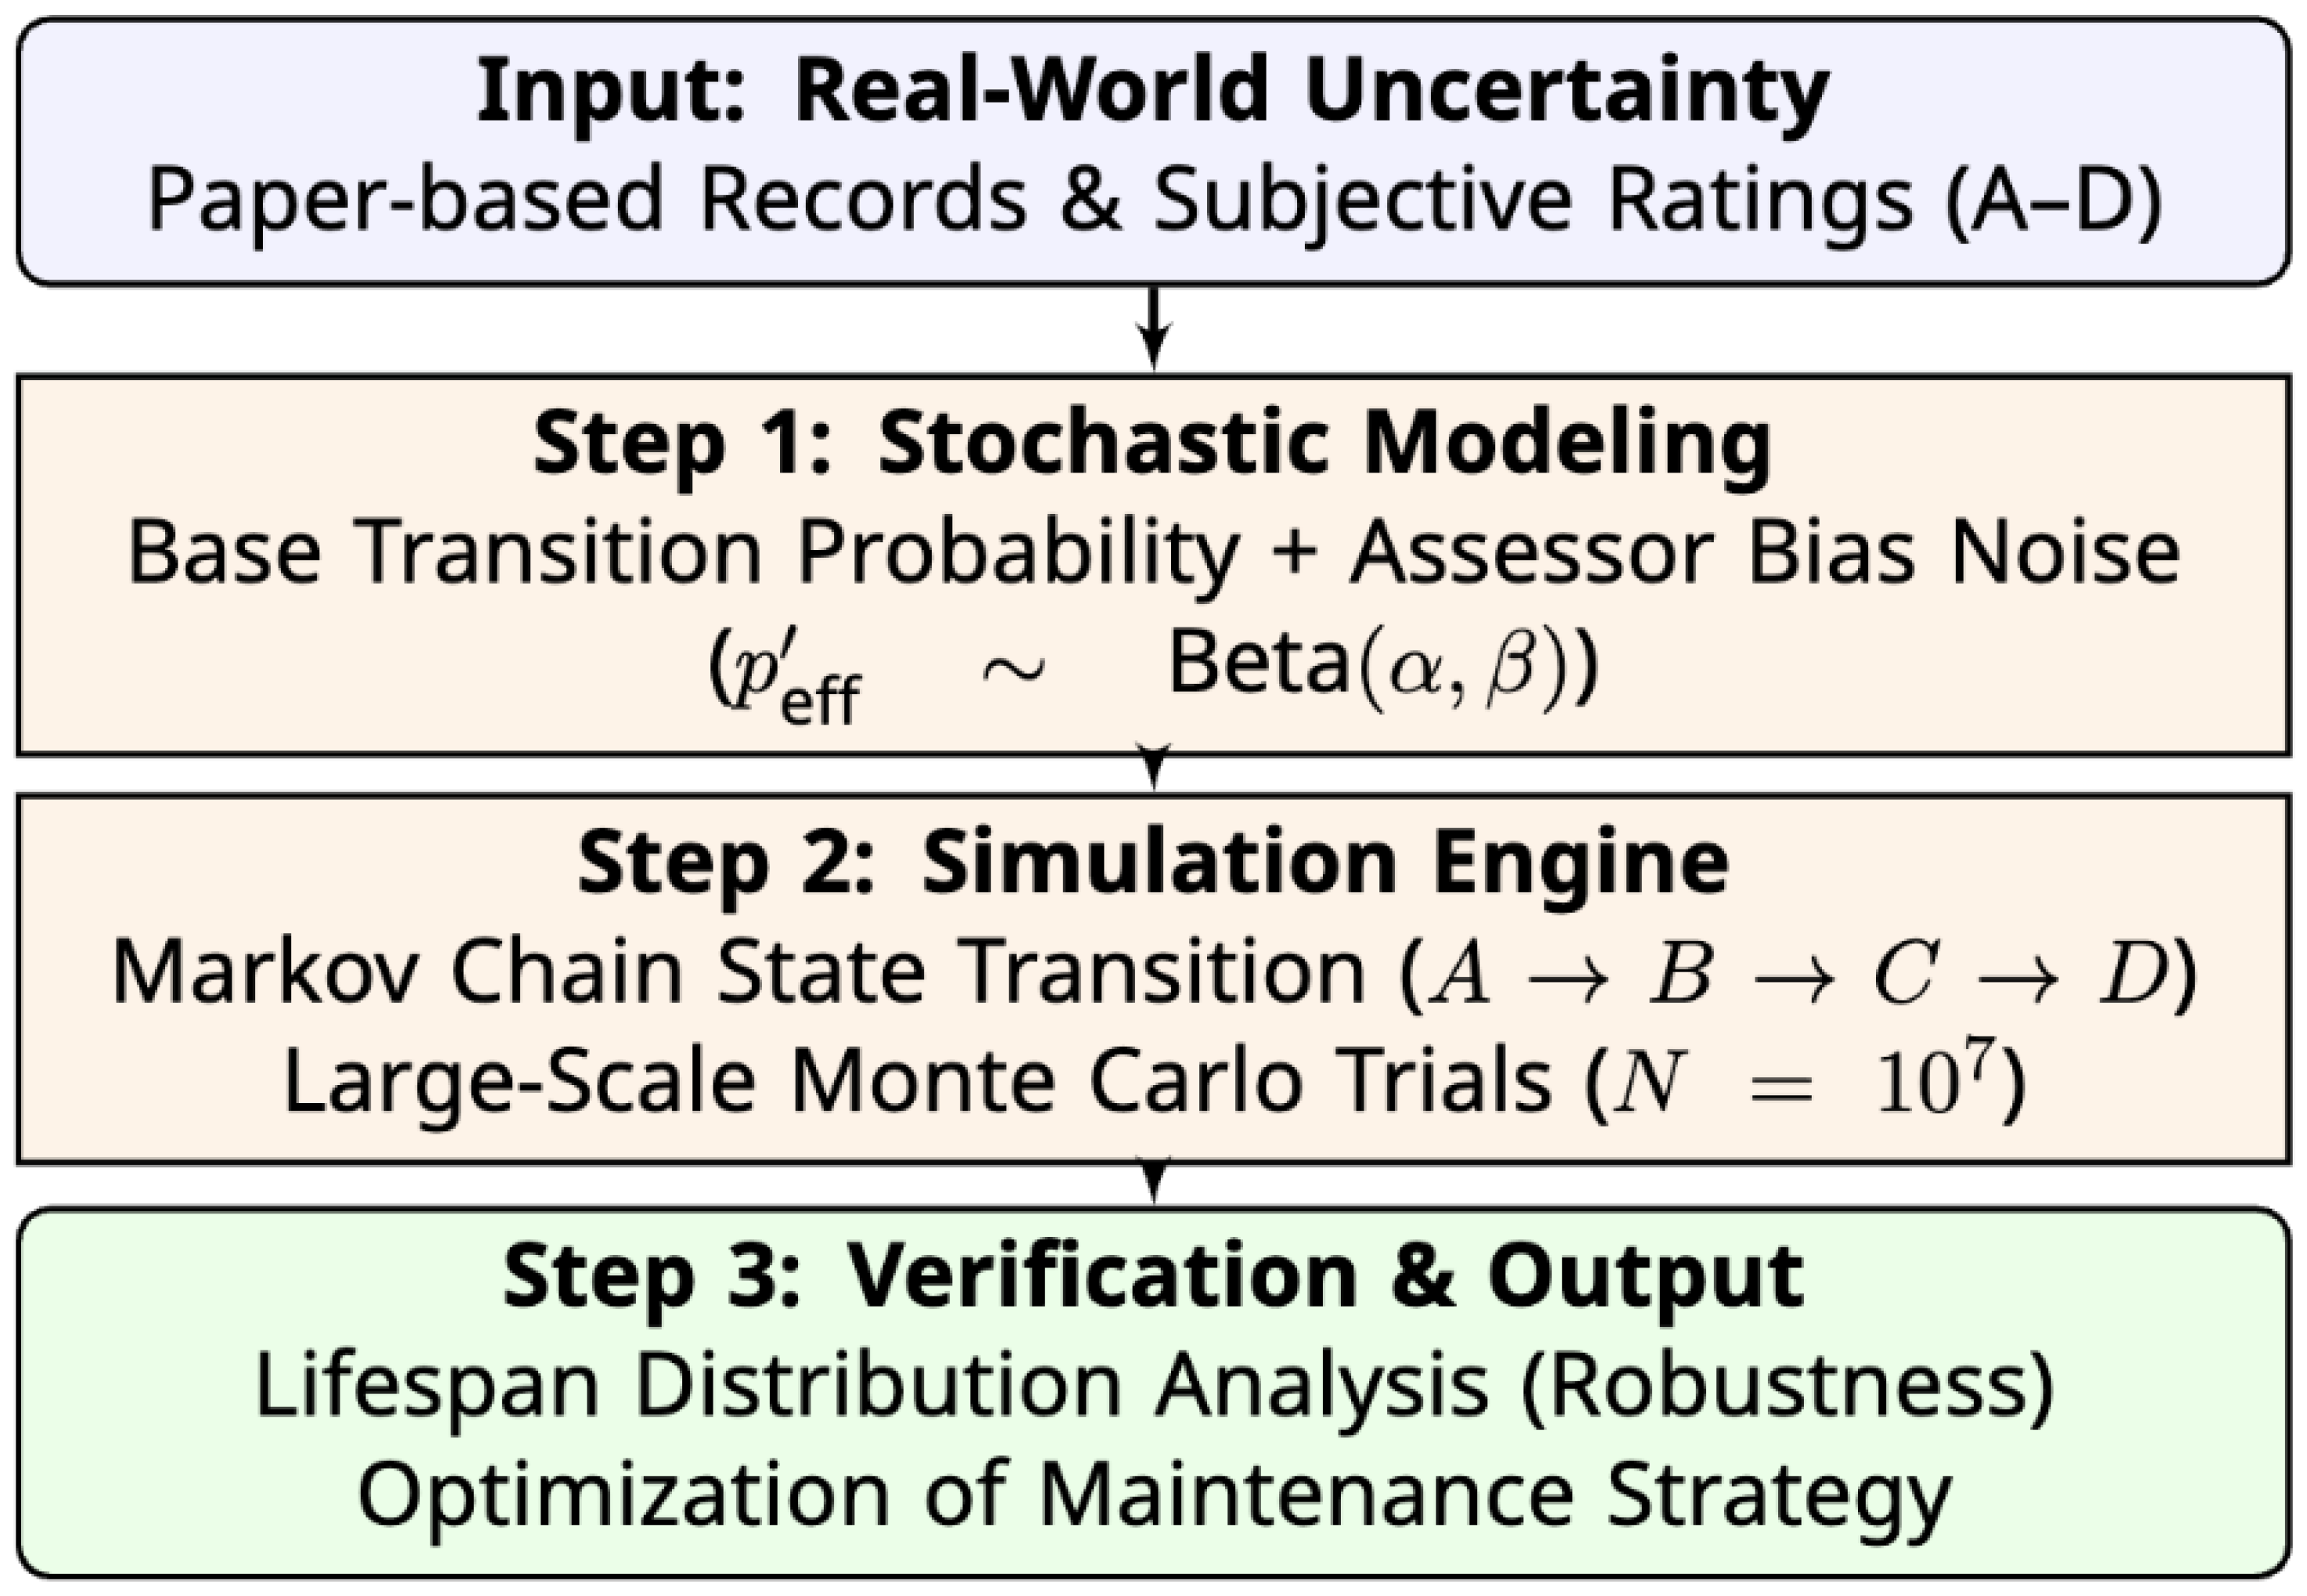
To address the aforementioned issues, this study adopts the following three-step protocol. Figure 1 illustrates the comprehensive architecture of this stochastic deterioration prediction framework, designed to transform analog expert knowledge into a scientifically verifiable model.
Figure 1.
Complete Architecture Flowchart of the Proposed Stochastic Deterioration Prediction Protocol. This process bridges the gap between analog expert inputs and quantitative robustness verification.
- STEP 1 Modeling Uncertainty: Define the transition probabilities based on expert heuristics and introduce stochastic noise (Beta distribution) to simulate assessor bias.
- STEP 2 Robustness Verification (Dry Run): Execute large-scale Monte Carlo simulations () to verify if the model produces stable lifespan distributions despite the input uncertainty.
- STEP 3 Optimization: Identify the critical transition paths (e.g., ) that most significantly impact the facility’s lifespan to guide future maintenance strategies.
1.4. Physical Deterioration Mechanisms of Tunnel Lighting
Unlike general outdoor road lighting, tunnel lighting facilities operate in a semi-enclosed, harsh environment that accelerates specific deterioration modes.
- Environmental Corrosivity: High humidity and the accumulation of vehicle exhaust gases (SOx, NOx) create a corrosive atmosphere inside tunnels. In winter, sprayed de-icing agents (chlorides) are misted into the tunnel by passing vehicles, adhering to lighting fixtures and accelerating the corrosion of metallic housings and mounting brackets [2].
- Vibration Fatigue: Lighting fixtures suspended from the tunnel ceiling are continuously exposed to aerodynamic vibrations caused by high-speed vehicle passage (piston effect) and low-frequency vibrations from heavy traffic. This mechanical stress can lead to the loosening of internal electrical connections and fatigue failure of mounting hardware over time [42].
- Thermal Stress: The heat generated by the light source (LED or sodium) combined with ambient temperature fluctuations inside the tunnel induces thermal cycling stress on the electronic driver components and solder joints, serving as a primary driver for random deteriorations [42].
These complex, interacting physical factors make deterministic prediction difficult, justifying the use of a stochastic approach where transition probabilities are modeled with probabilistic distributions.
1.5. Definition of State Space
The health of the facility is represented by a state space S consisting of the following four discrete states.
- State A: Healthy state
- State B: Minor deterioration state not requiring repair
- State C: Deterioration state requiring repair
- State D: State requiring emergency repair (absorbing state)
The simulation proceeds in discrete time steps of one month, and the facility belongs to one of these states. State D is an absorbing state; once a facility transitions to this state, it does not change to any other state thereafter.
1.6. Transition Probabilities and Stochastic Fluctuations
At each time step, the probability of a facility transitioning from its current state to the next deterioration state is defined by the base transition probability . In this model, deterioration is an irreversible process, so the only transitions considered are , , and . A key feature of this model is the introduction of stochastic fluctuations to these transition probabilities.
Models of Stochastic Fluctuation
To accurately model the variability in expert judgment, this study employs the Beta-distributed model as the primary method, ensuring mathematical rigor. The static normal model used in preliminary studies is retained solely for comparative validation in Experiment 4.
- 1.
- Beta-Distributed Model (Primary Method): The transition probability is treated as a random variable following a Beta distribution, which is naturally bounded within the interval .The shape parameters and are defined using the base probability p and a concentration parameter K (representing the reliability of the expert’s judgment):This approach resolves the boundary issues associated with Gaussian noise, as pointed out in mathematical deterioration modeling literature.
- 2.
- Static Normal Model (Comparative): For comparison with conventional methods, we also define a model where Gaussian noise is added to the base probability.Note that in this model, values exceeding the range are artificially clamped, which introduces a statistical bias that motivates the shift to the Beta model.
- 3.
- Time-Varying Model: A model that considers the aging effect where the transition probability increases with elapsed time t.
These models are selectively applied through conditional branching within the simulation engine.
2. Design of Computational Experiments
In this study, we conduct computational experiments based on the Monte Carlo method to analyze the behavior of the stochastic deterioration model described above. The Monte Carlo method is a numerical computation technique that obtains approximate solutions for probabilistic events by repeatedly performing simulations using random numbers and statistically aggregating the results.
2.1. Estimation of Equipment Lifespan
A single trial simulates the entire stochastic process of a single facility starting from State A until it reaches the absorbing State D. By repeating this trial on a large scale, we obtain the probability distribution of the equipment lifespan (number of months until reaching State D). From a large number of trial results, we can estimate statistical measures such as the mean lifespan and the variance of the lifespan with high precision.
2.2. Role of Pseudo-Random Number Generators
The reliability of the Monte Carlo method heavily depends on the quality of its underlying Pseudo-Random Number Generator (PRNG). This simulation employs PRNGs such as Xoshiro and Mersenne Twister, which are widely adopted in scientific and technical computing for their excellent statistical properties, extremely long periods, and high speed. For the validation of the model’s appropriateness, it is important to compare the results across different PRNGs with varying characteristics to confirm that the simulation’s conclusions are not dependent on a specific algorithm (robustness against the algorithm).
2.3. Strategy for Resolving Class Imbalance
As highlighted in the Problem Statement (Section 1.2), real-world inspection data suffers from severe class imbalance: the vast majority of facilities are in the healthy state (State A), while data for the deterioration state (State D) is extremely scarce. This scarcity hinders the training of data-driven models. Parameter Sensitivity, observing the color gradient of the heatmap, the color changes more steeply in the horizontal direction (P(A → B) change) than in the vertical direction (P(B → C) change). This suggests that the average lifespan is more sensitive to variations in P(A → B) than in P(B → C). In other words, how to delay the progression to minor damage state (State B) after healthy state (State A) has occurred is likely a more critical factor in determining the overall lifespan. This study resolves this issue by employing a simulation approach based on Weighted Random Sampling.
By repeating this process on a large scale (), we can mathematically generate a sufficient number of samples even for rare deterioration paths that are statistically underrepresented in empirical data. Quantitatively, even if the probability of a specific deterioration path is extremely low (e.g., ), a simulation with trials is expected to generate approximately 100 samples of that rare event. This ensures that the resulting lifespan distribution covers the entire domain of possibility, including the heavy tails, thereby effectively overcoming the limitation of class imbalance inherent in the raw data.
3. Experimental Content and Objectives
In this study, we verify the mathematical properties of the deterioration model through the following two computational experiments. The effective transition probability is made to mimic more realistic environmental factors and individual differences by adding stochastic noise (fluctuations) to the base transition probability . Note that since the simulation logic is binary (either transition to or stay in ), the probability of remaining in the current state is automatically determined as . This ensures that the conservation of probability (the sum of probabilities in a row equals 1) is strictly maintained at every step, addressing the normalization issue inherent in stochastic matrix perturbations. In this code, multiple methods for this noise model are implemented.
3.1. Experiment 1: Verification of Model Robustness
The purpose of this experiment is to verify whether multiple deterioration scenarios with different transition probability parameter settings produce statistically distinguishable lifespan distributions as intended, i.e., whether the model is robust to its parameters.
Figure 2 shows the probability density distributions (via kernel density estimation) of equipment lifespan obtained from 10 million Monte Carlo simulations using the Beta-distributed model.
- Distribution Separation and Validity: The lifespan distributions for the three scenarios are clearly separated. Their respective mean lifespans (Low-Deterioration: 30.5 years, Standard: 15.3 years, High-Deterioration: 7.6 years) are consistent with the magnitude relationship of the transition probabilities. This indicates that the simulation model sensitively reflects parameter changes and can appropriately model different deterioration environments.
- Interpretation of Distribution Shape: All distributions exhibit an asymmetric shape with a long tail to the right (positive skewness). This accurately reproduces a characteristic often seen in the lifespan distributions of real industrial products, where most equipment reaches the end of its life around the mean lifespan, while some units, due to probabilistic factors, fail earlier than expected or function for a significantly longer period.
- Trend in Variance: The distribution for the “High-Deterioration” scenario has a sharper peak and is observed to have a smaller standard deviation compared to the other scenarios. This suggests that in harsh environments where deterioration-promoting factors are dominant, the influence of probabilistic variability inherent in individual equipment becomes relatively smaller, leading to a concentration of deteriorations within a short period.
Figure 2.
Experiment 1: Probability Density Distributions of Equipment Lifespan (Model: Beta-distributed, N = 10,000,000).
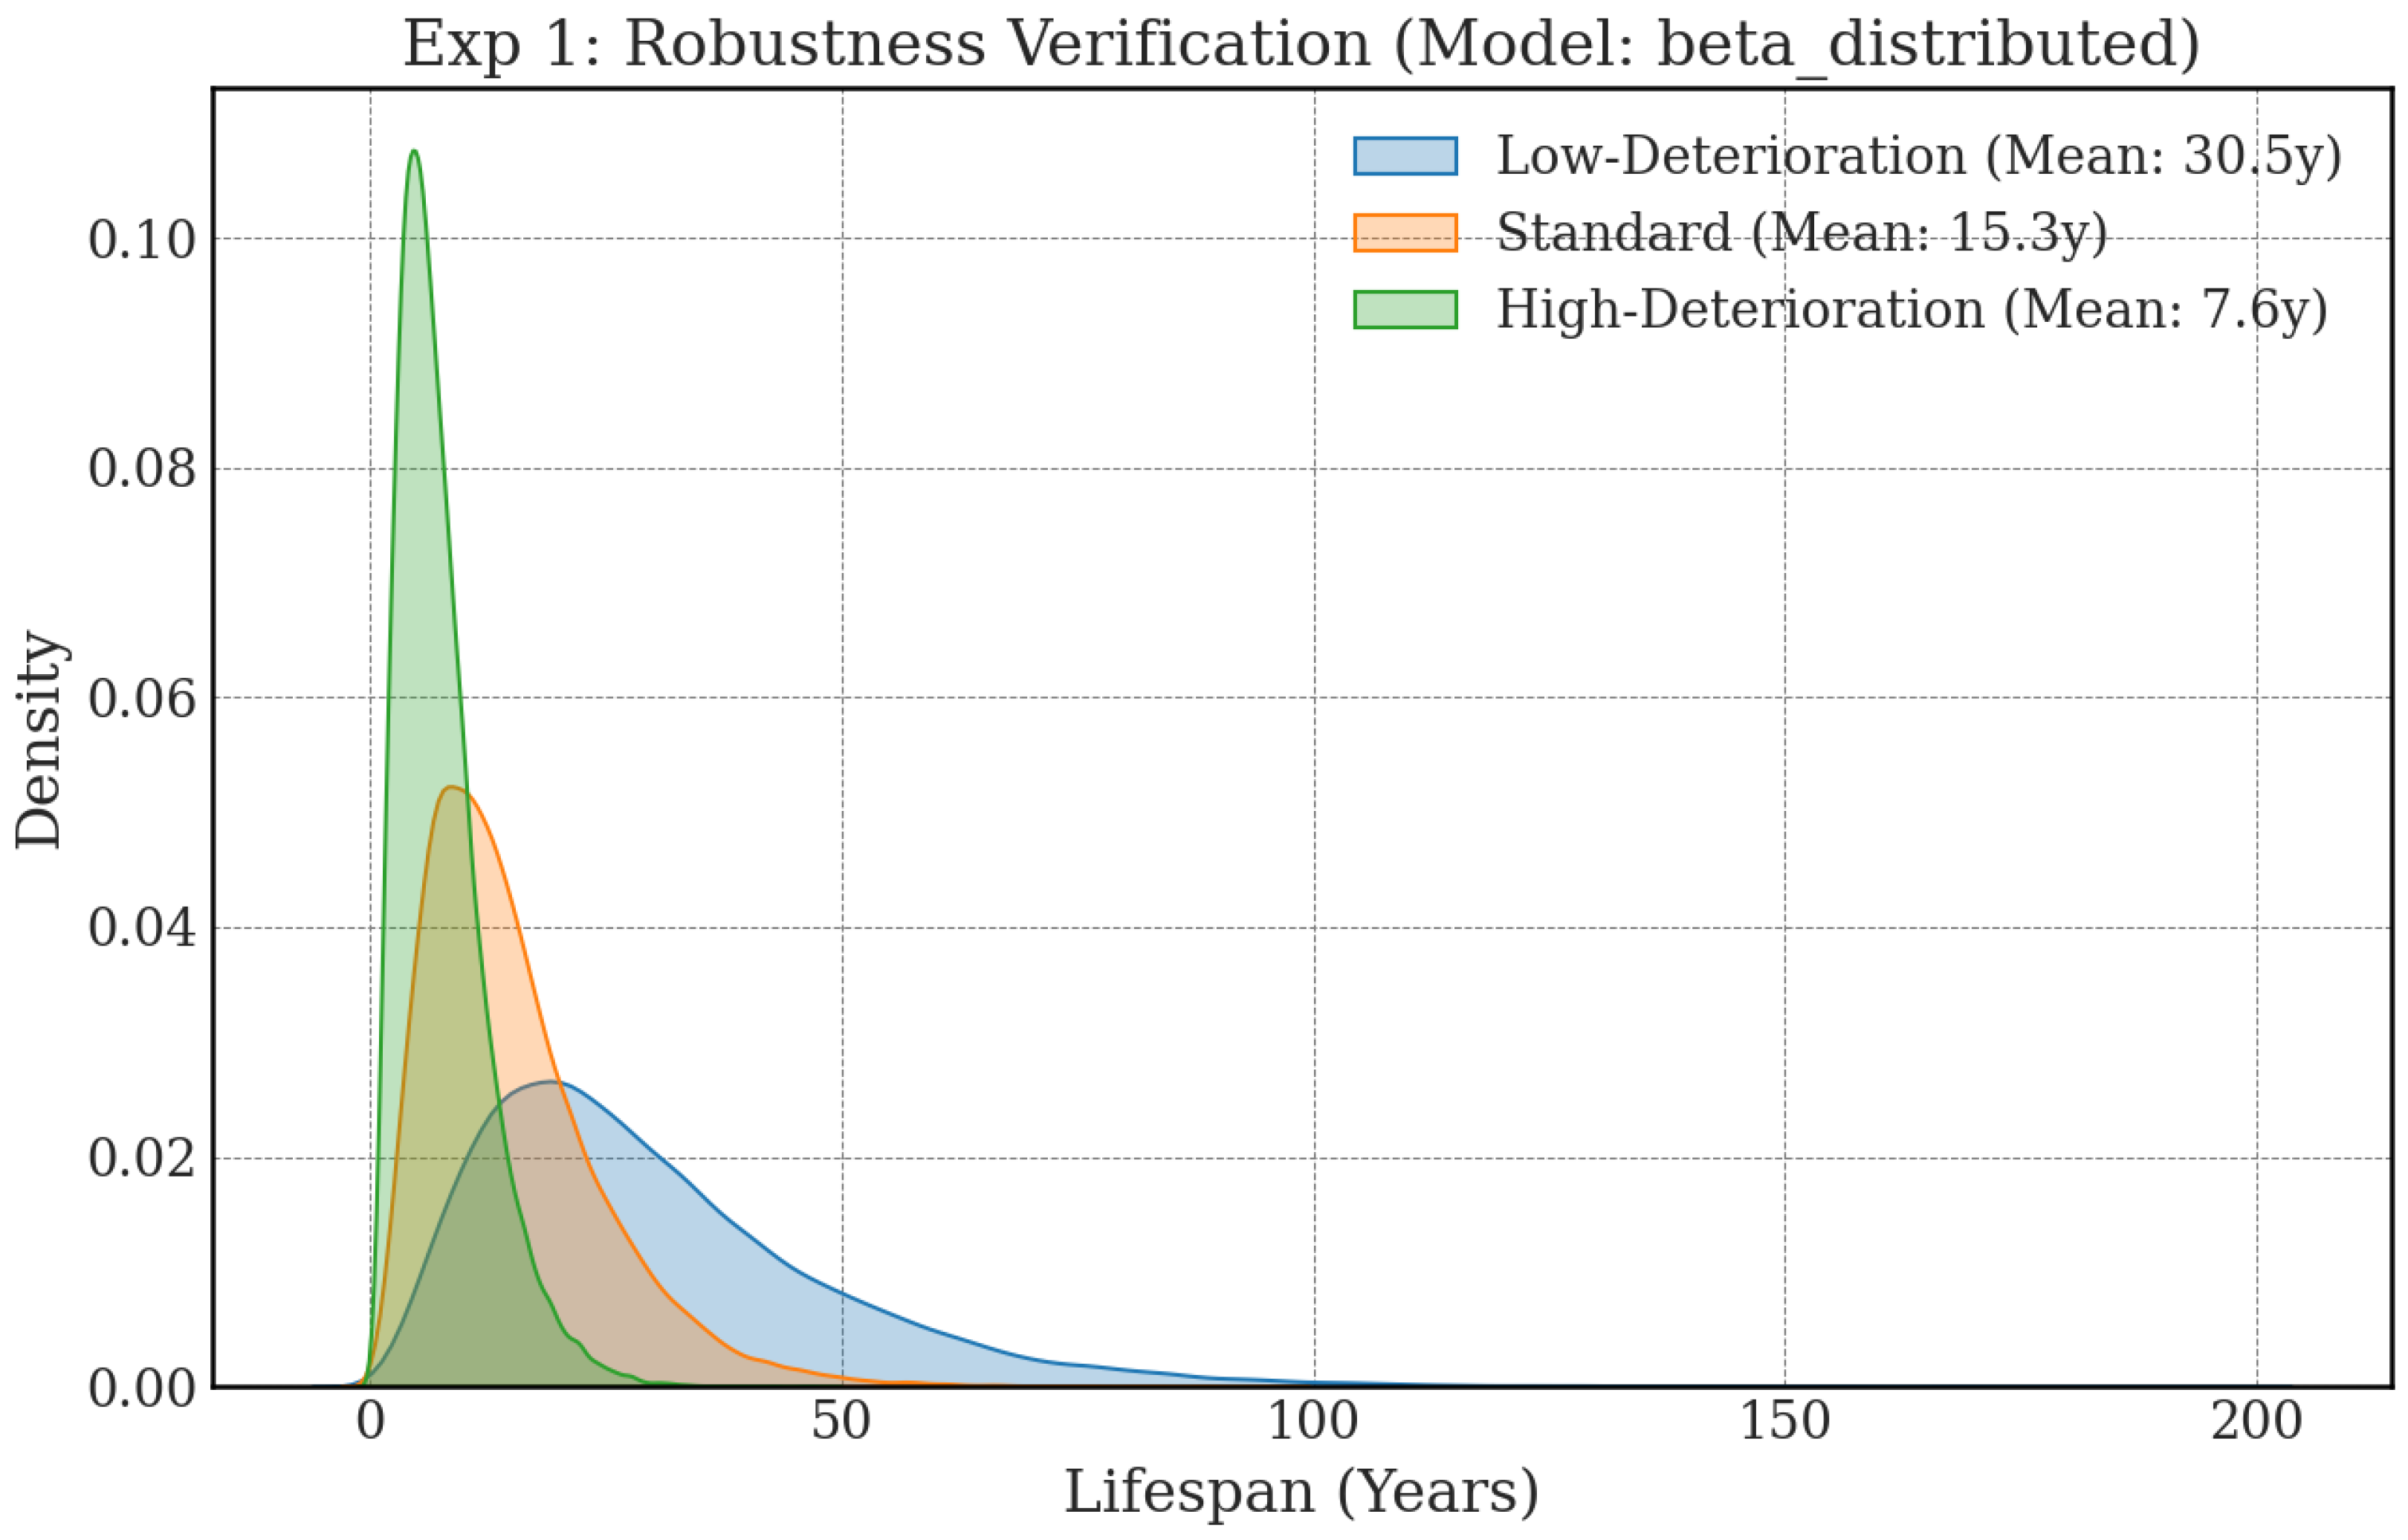
From these results, it has been verified that this simulation model is robust and capable of generating statistically meaningful lifespan distributions for various deterioration personas (scenarios) that will be set based on AHP results in future research.
3.2. Experiment 2: Search for Optimal Transition Probabilities
This experiment aims to exploratively analyze which combination of parameters (transition probabilities) is optimal for the objective of maximizing the average equipment lifespan.
Figure 3 is a heatmap where the color represents the average equipment lifespan as the initial transition probability and the intermediate transition probability are varied. Lighter (yellower) colors indicate a shorter average lifespan.
- Identification of Optimal Region: It is clearly shown that the average lifespan is maximized in the upper-left region of the figure, i.e., when both and are small. This intuitively confirms that suppressing both the transition from a healthy state to initial deterioration and the transition from initial deterioration to a state requiring repair is essential for extending lifespan.
- Parameter Sensitivity: Observing the color gradient of the heatmap, the color changes more steeply in the vertical direction ( change) than in the horizontal direction ( change). This suggests that the average lifespan is more sensitive to variations in than in . In other words, how to delay the progression to a serious state (State C) after minor damage (State B) has occurred is likely a more critical factor in determining the overall lifespan.
Figure 3.
Experiment 2: Heatmap for Exploring Transition Probabilities to Maximize Mean Lifespan (Model: Beta-distributed).
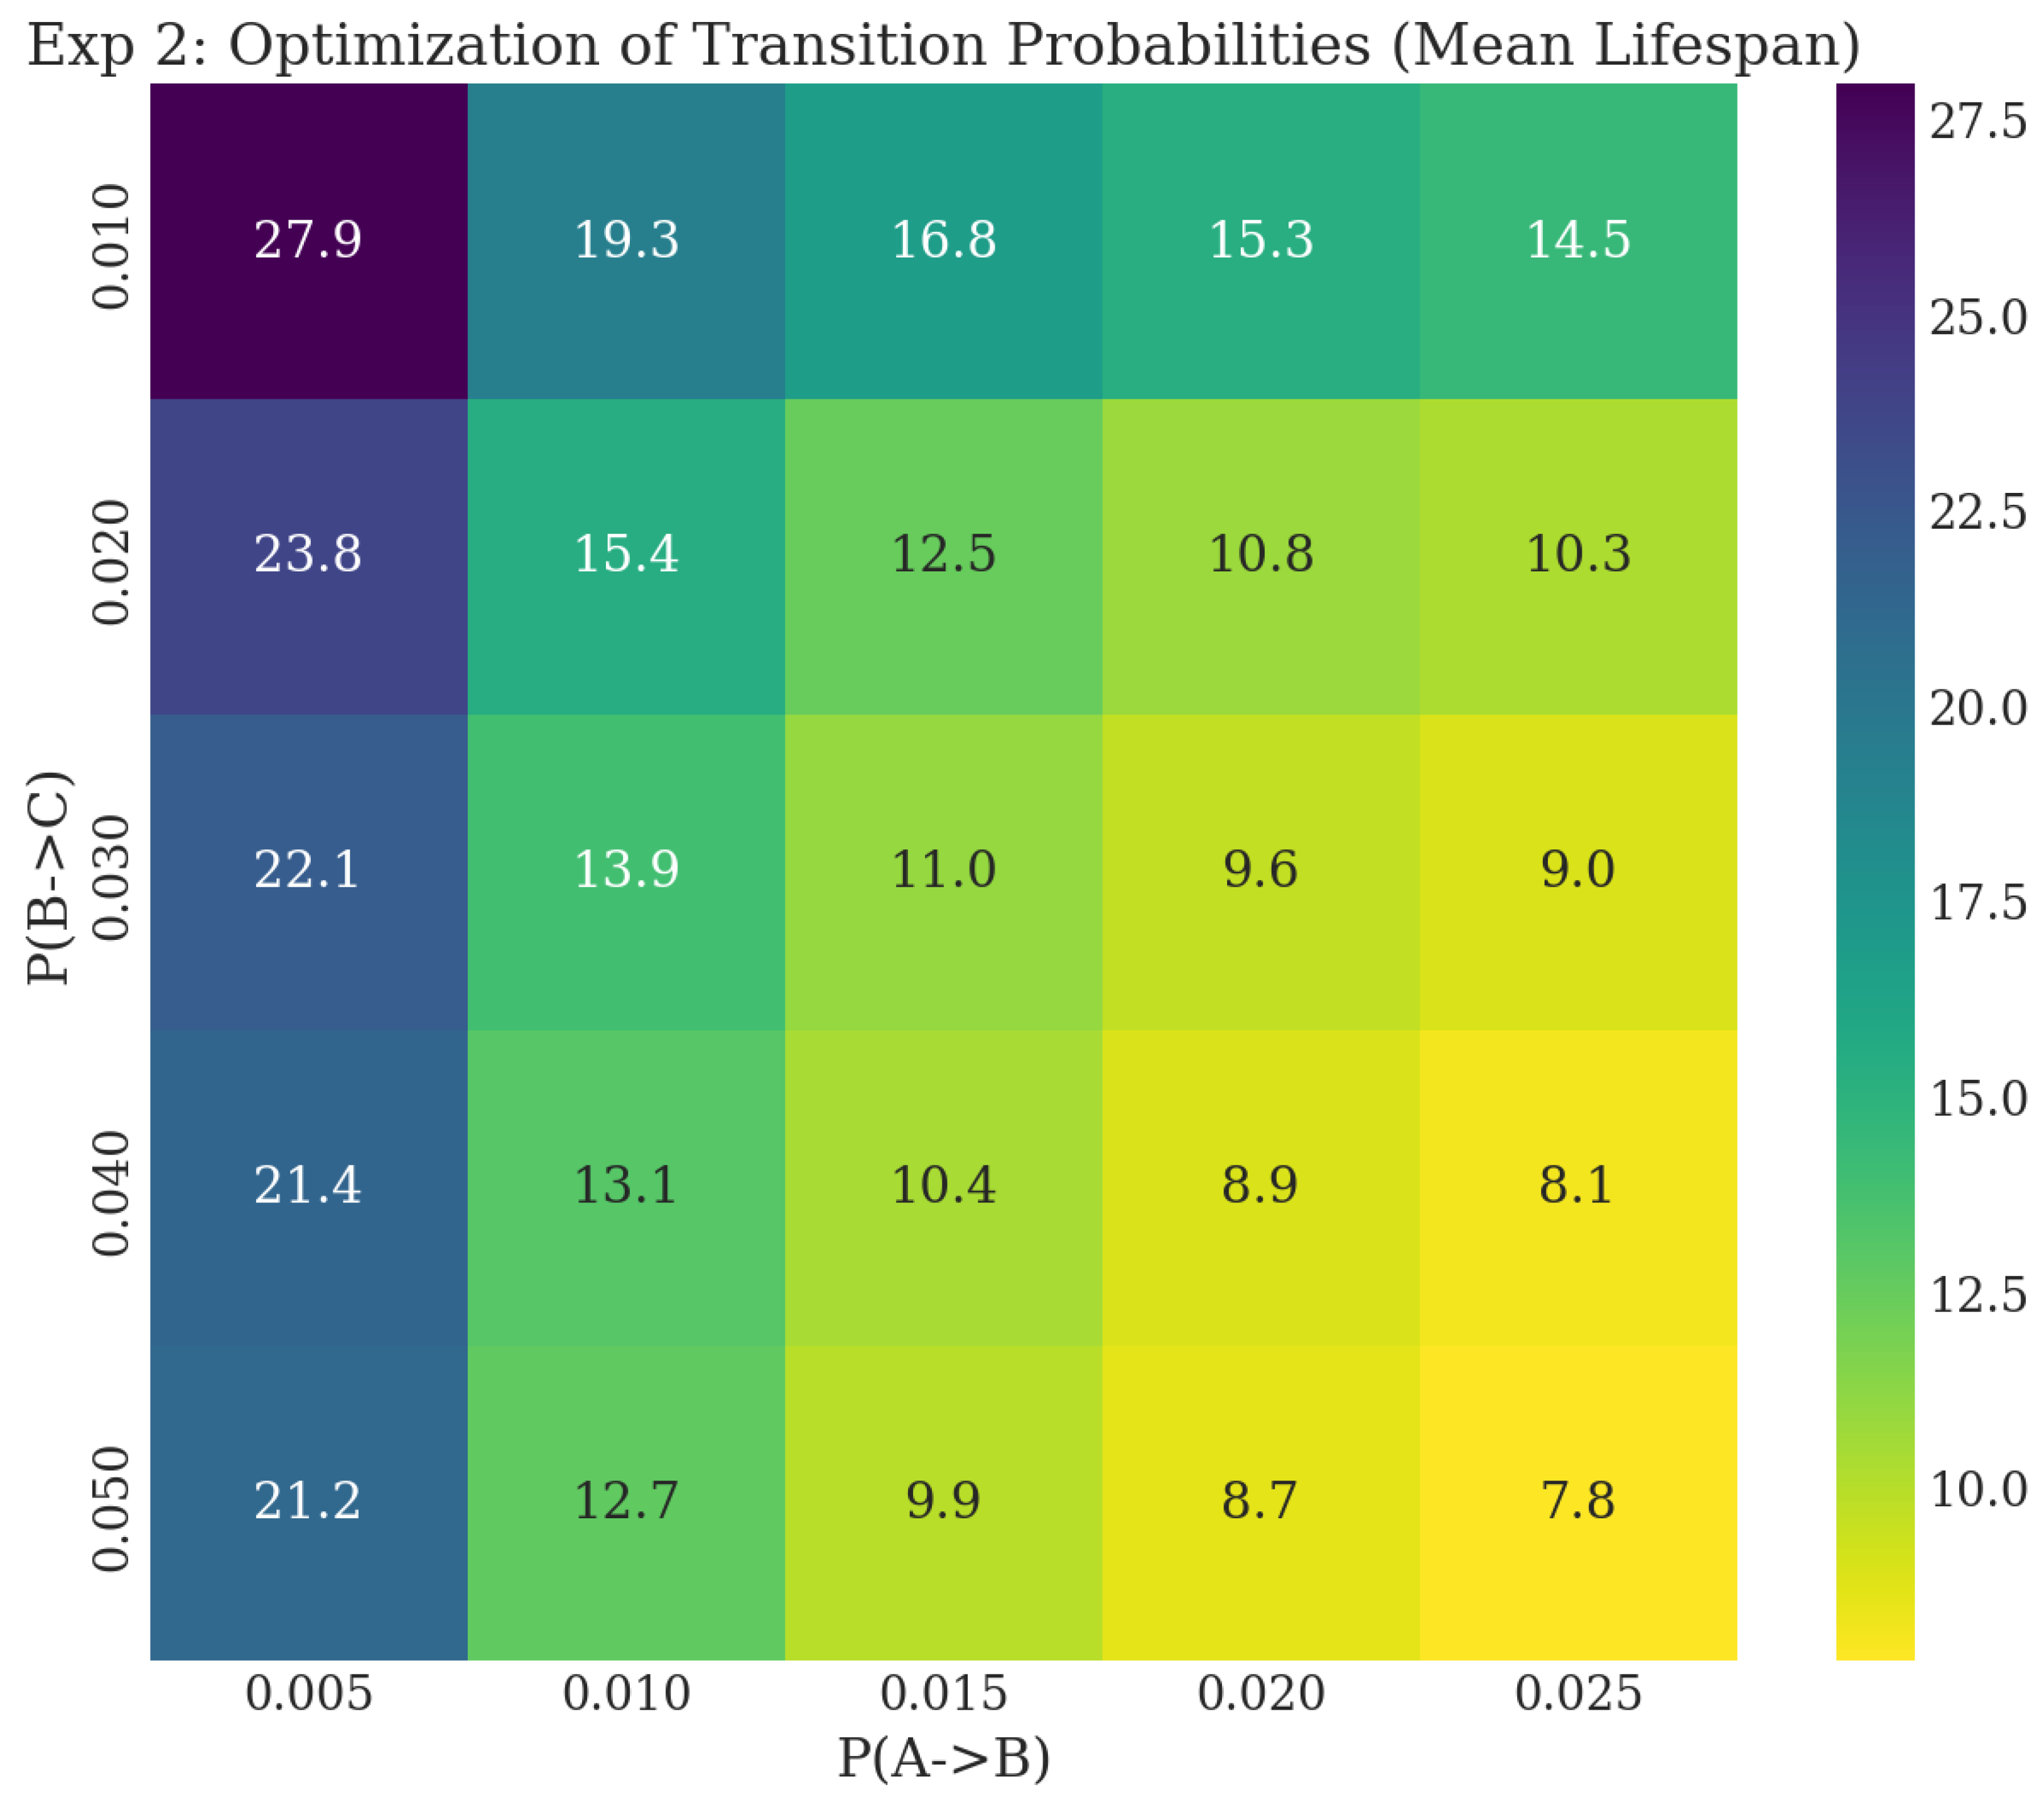
This analysis provides a quantitative basis for determining which stage of deterioration to target for the most cost-effective maintenance strategy in future planning.
3.3. Experiment 4: Comparison of Gaussian vs. Beta Models
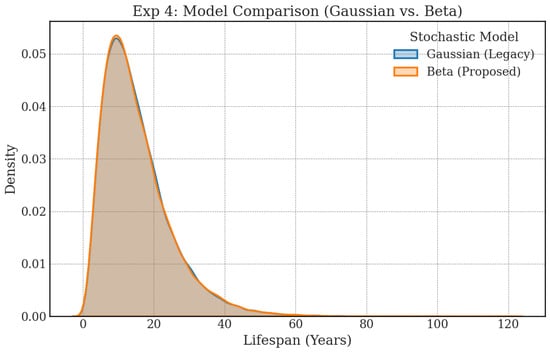
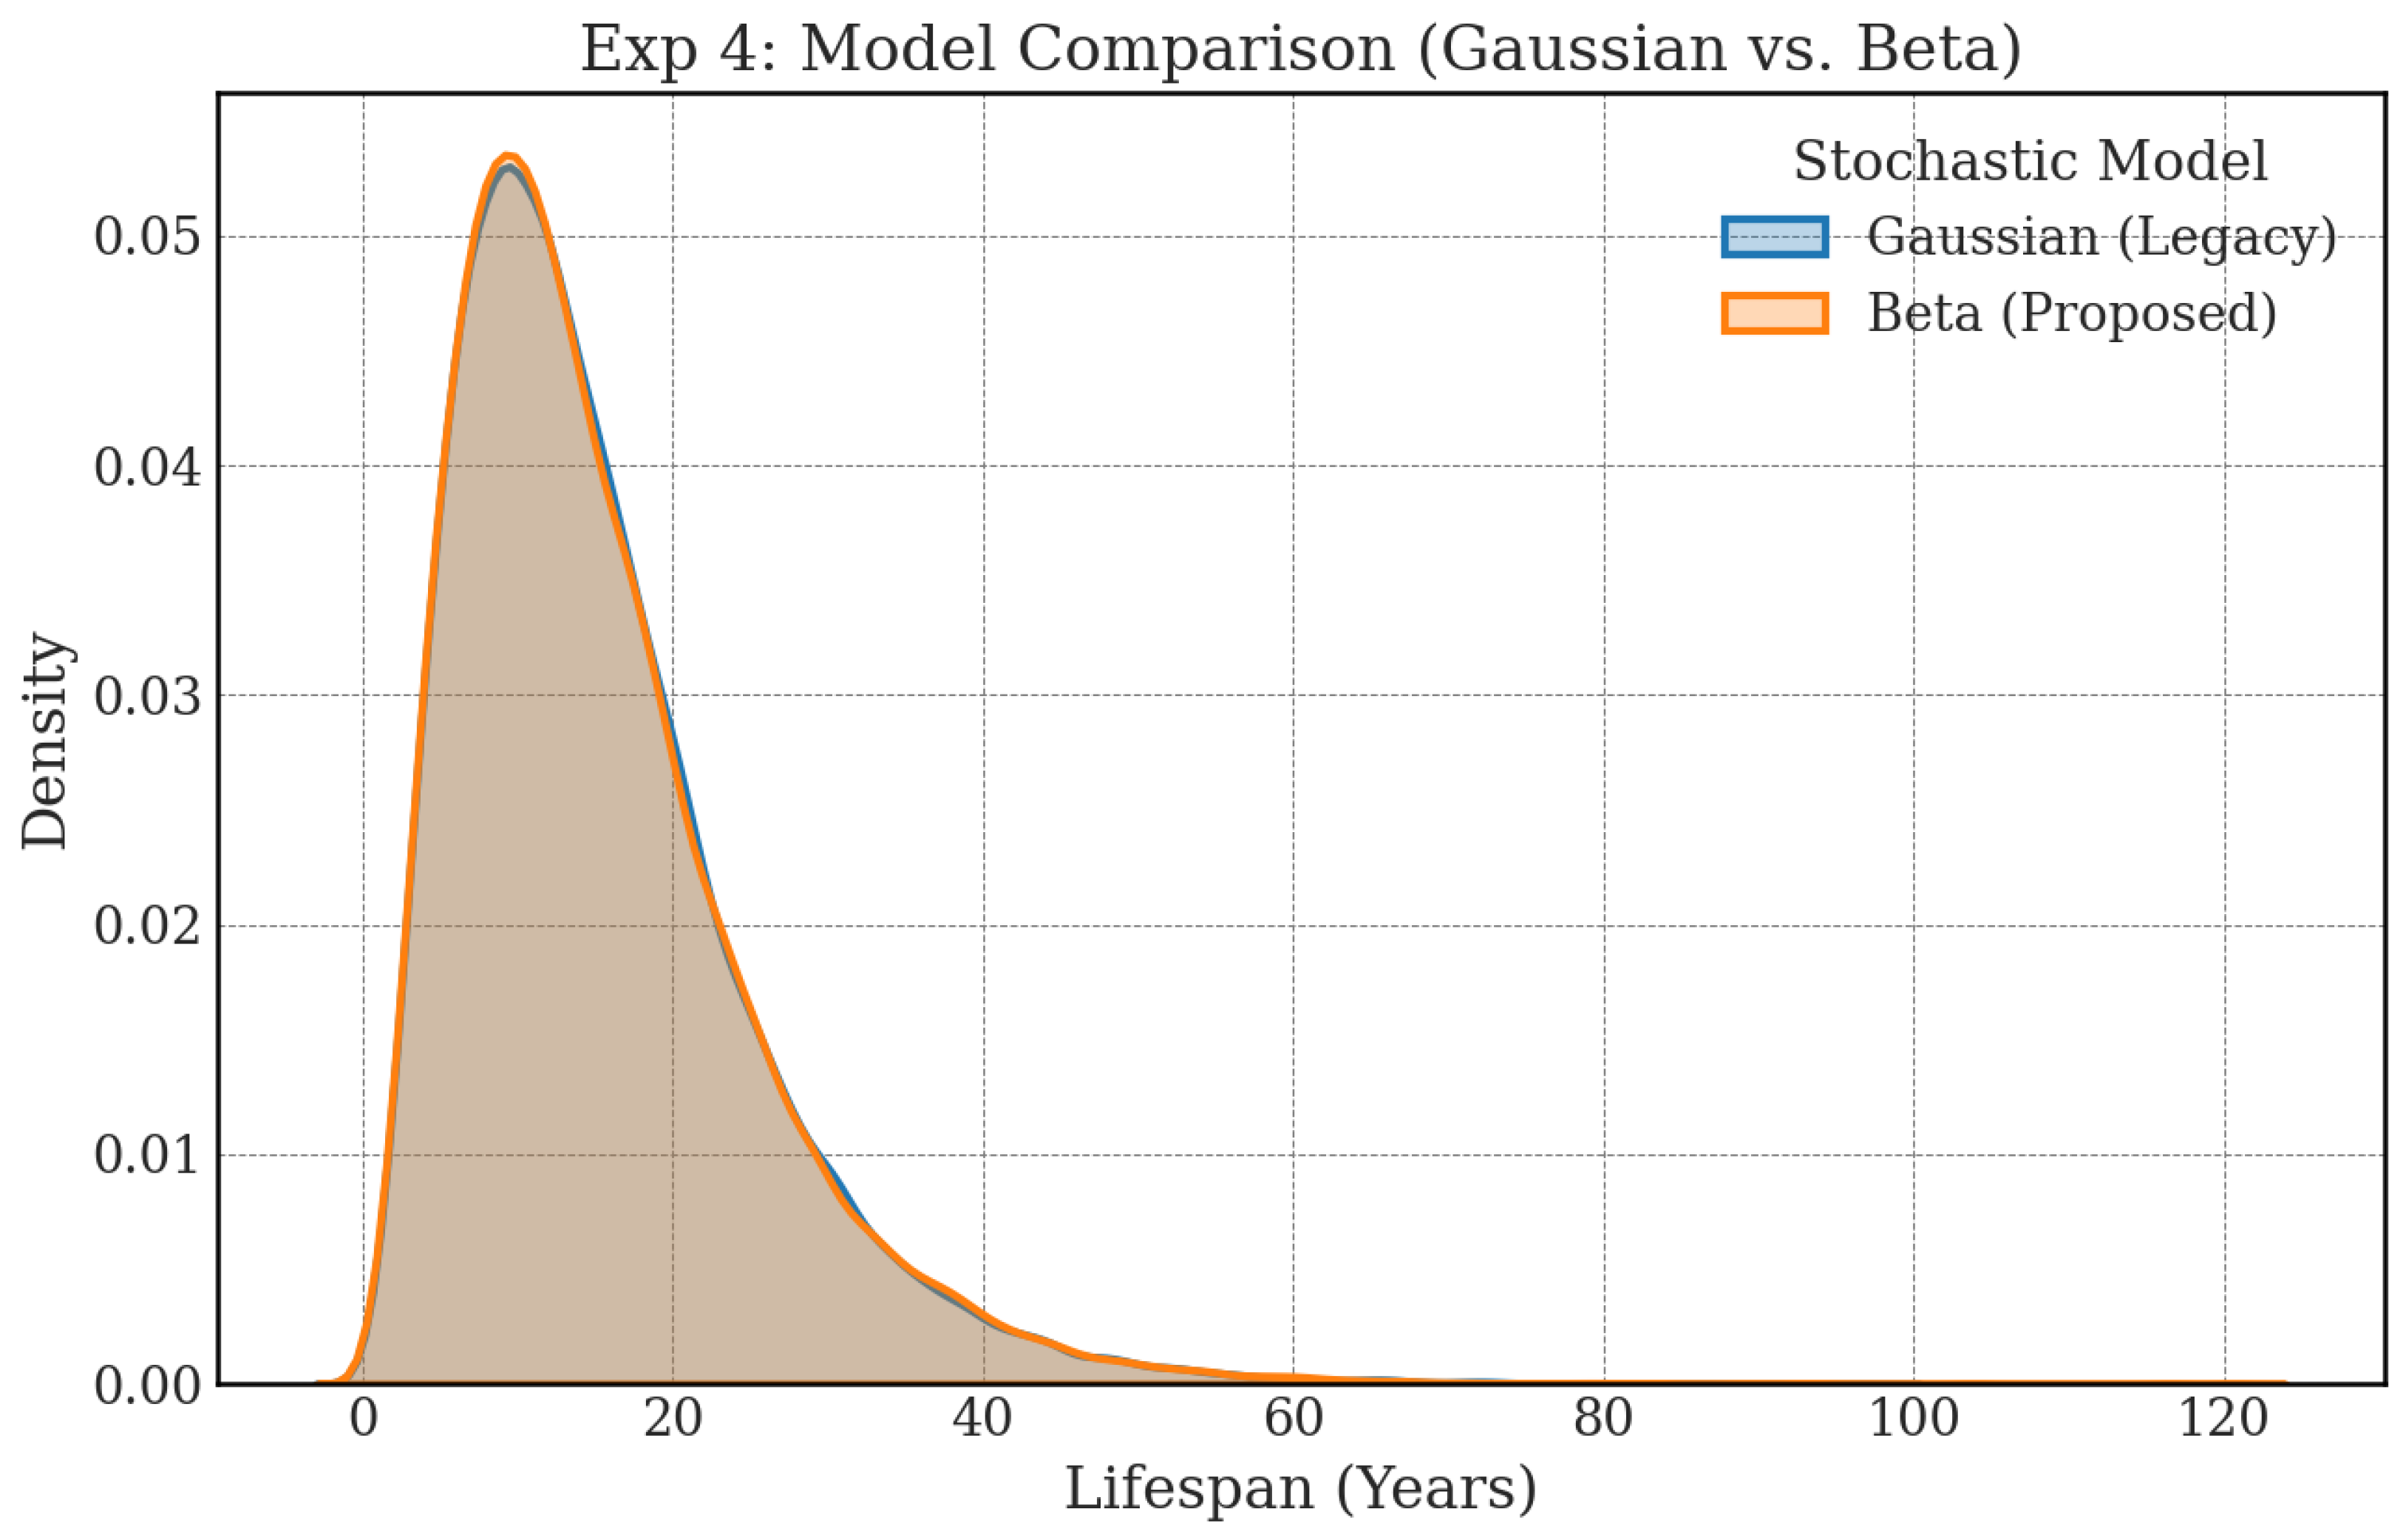
To address the mathematical validity of the stochastic noise model, we explicitly compared the lifespan distributions generated by the legacy Gaussian model (with clamping) and the proposed Beta model.
As shown in Figure 4, the distributions from both models overlap significantly. While the Gaussian model theoretically suffers from boundary issues requiring clamping, the simulation results show that it approximates the mathematically rigorous Beta model very closely under the tested conditions. This comparison confirms that the proposed simulation framework is robust to the choice of noise distribution, and the conclusions derived from previous Gaussian-based preliminary studies remain valid. However, for future scalability and theoretical consistency, the Beta model is adopted as the standard for this framework.
Figure 4.
Experiment 4: Comparison of Lifespan Distributions between Gaussian (Legacy) and Beta (Proposed) Models. The distributions overlap significantly, indicating the robustness of the simulation framework.
3.4. Experiments 3, 5: Verification of Dependency on Random Number Generators and Stochastic Reproducibility
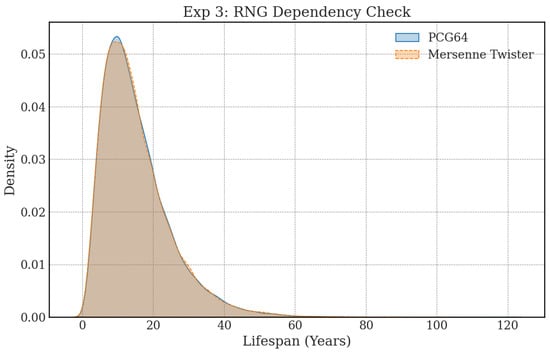
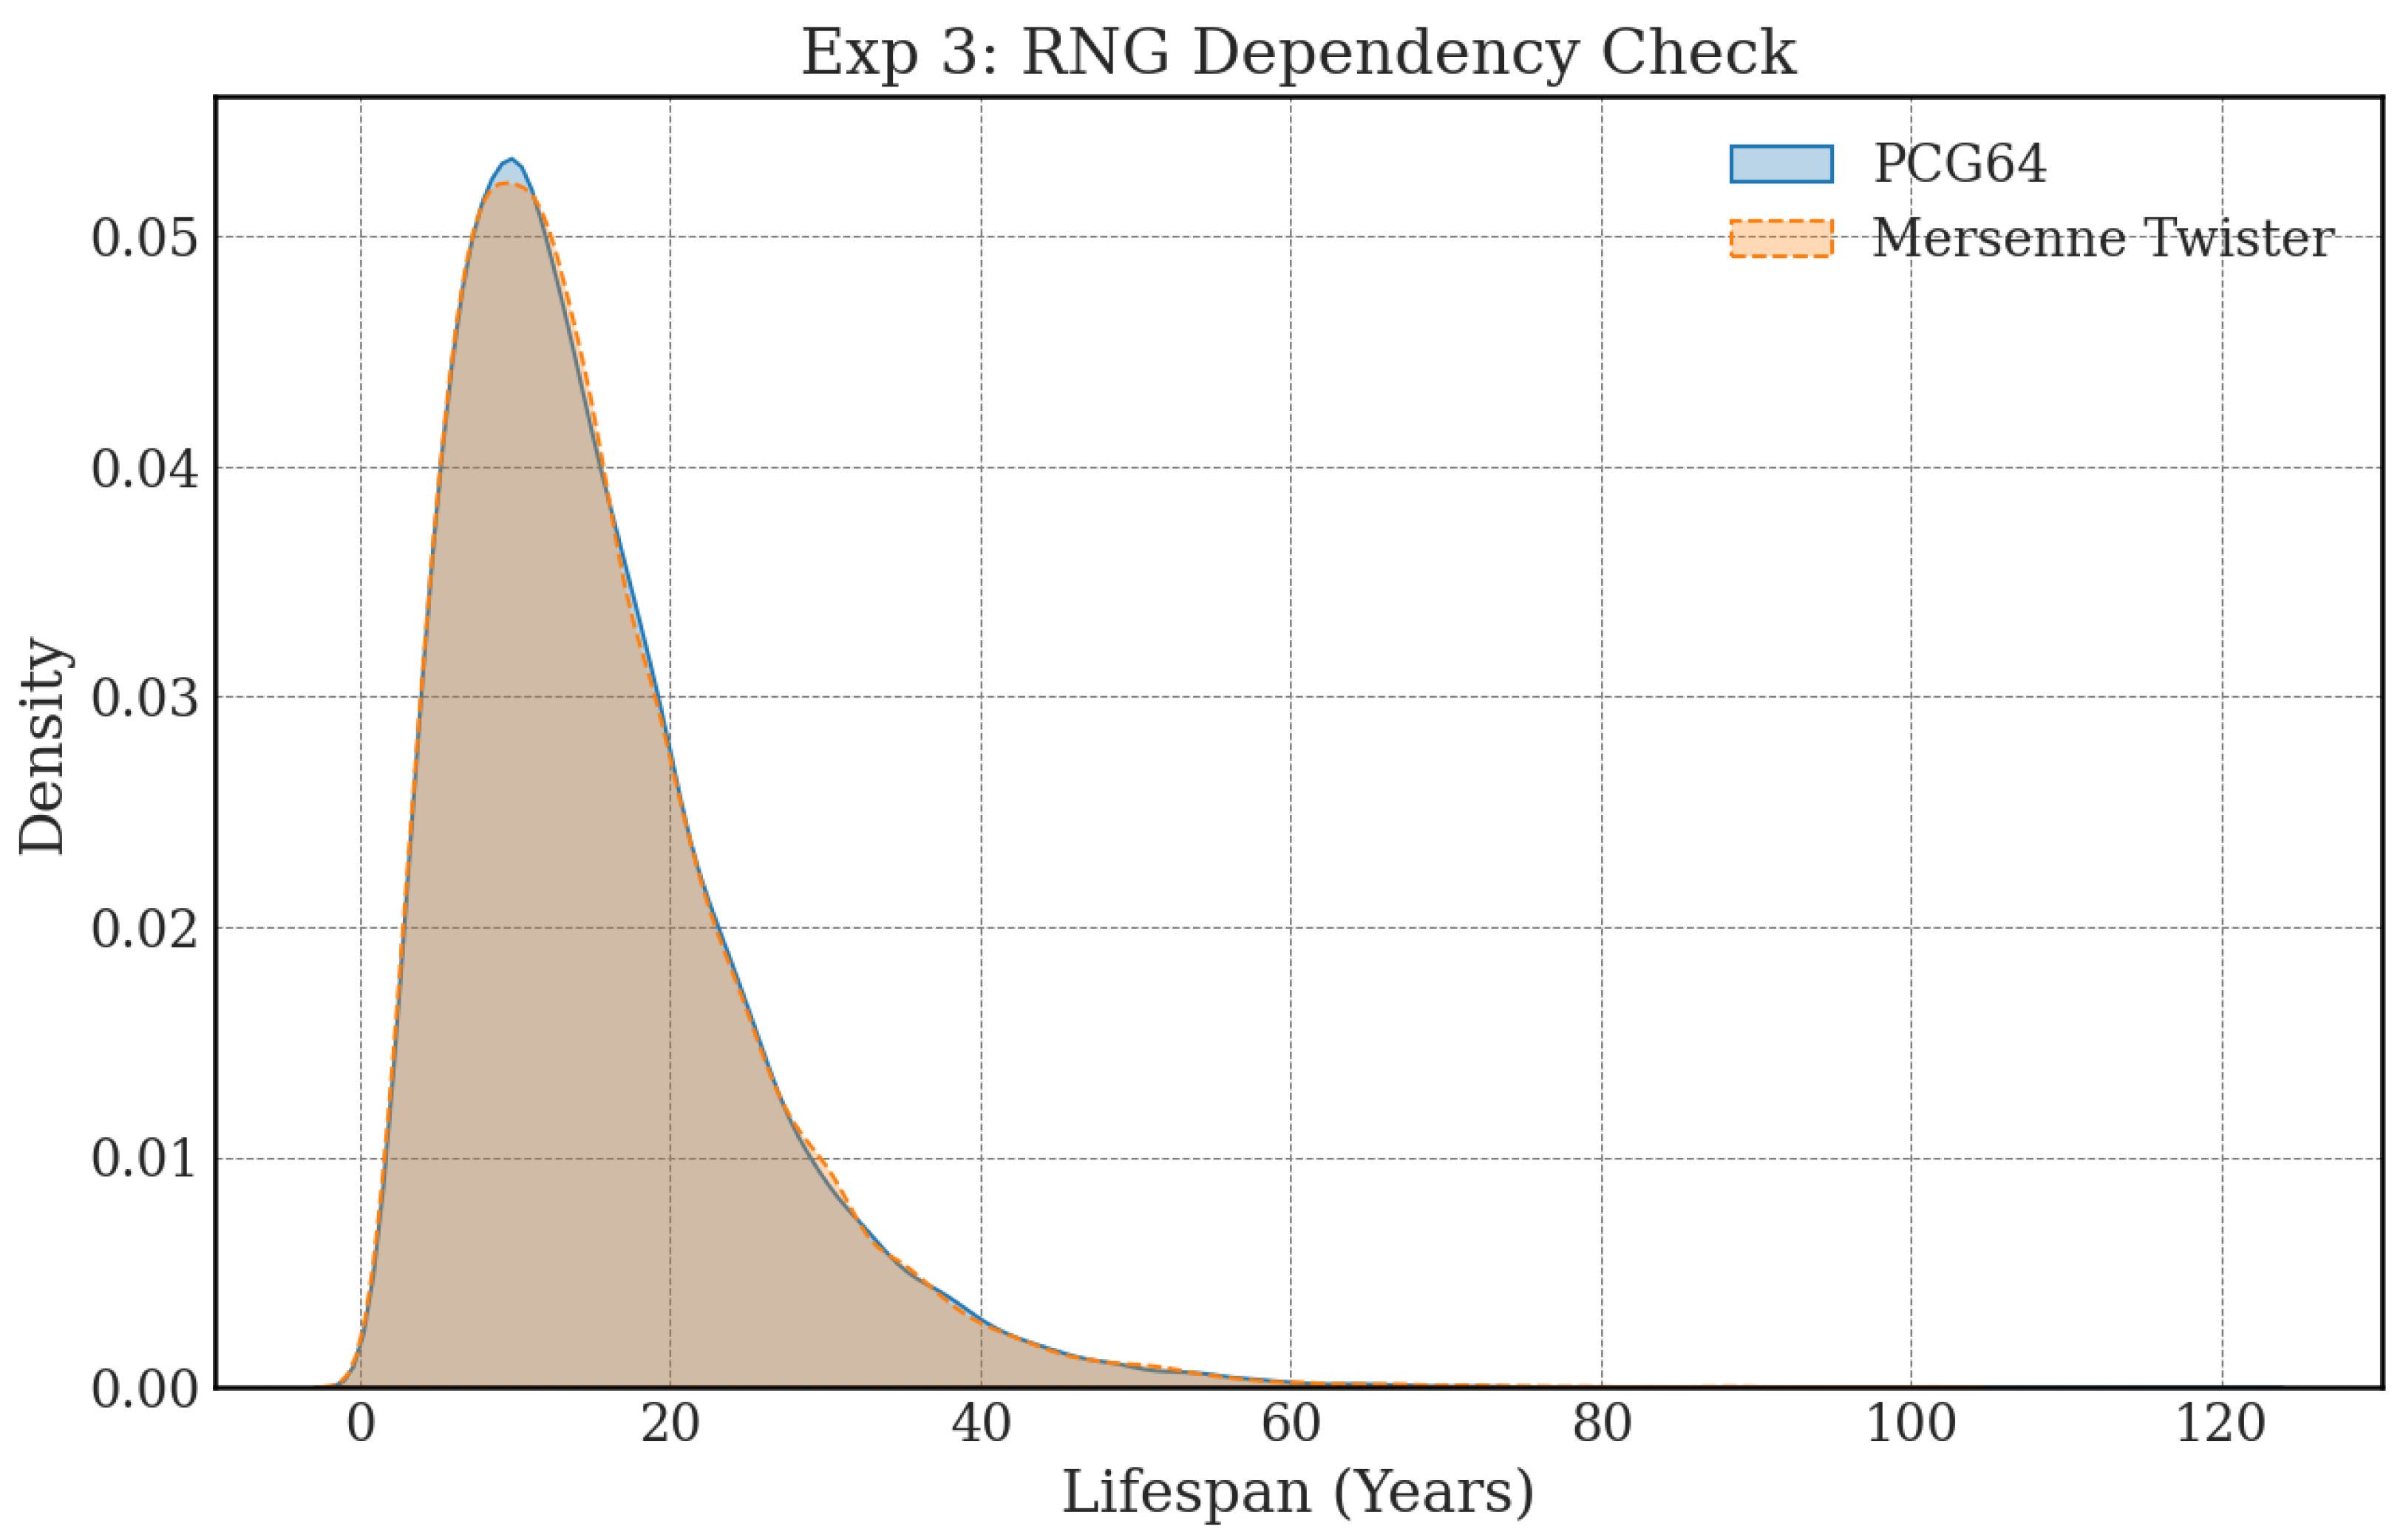
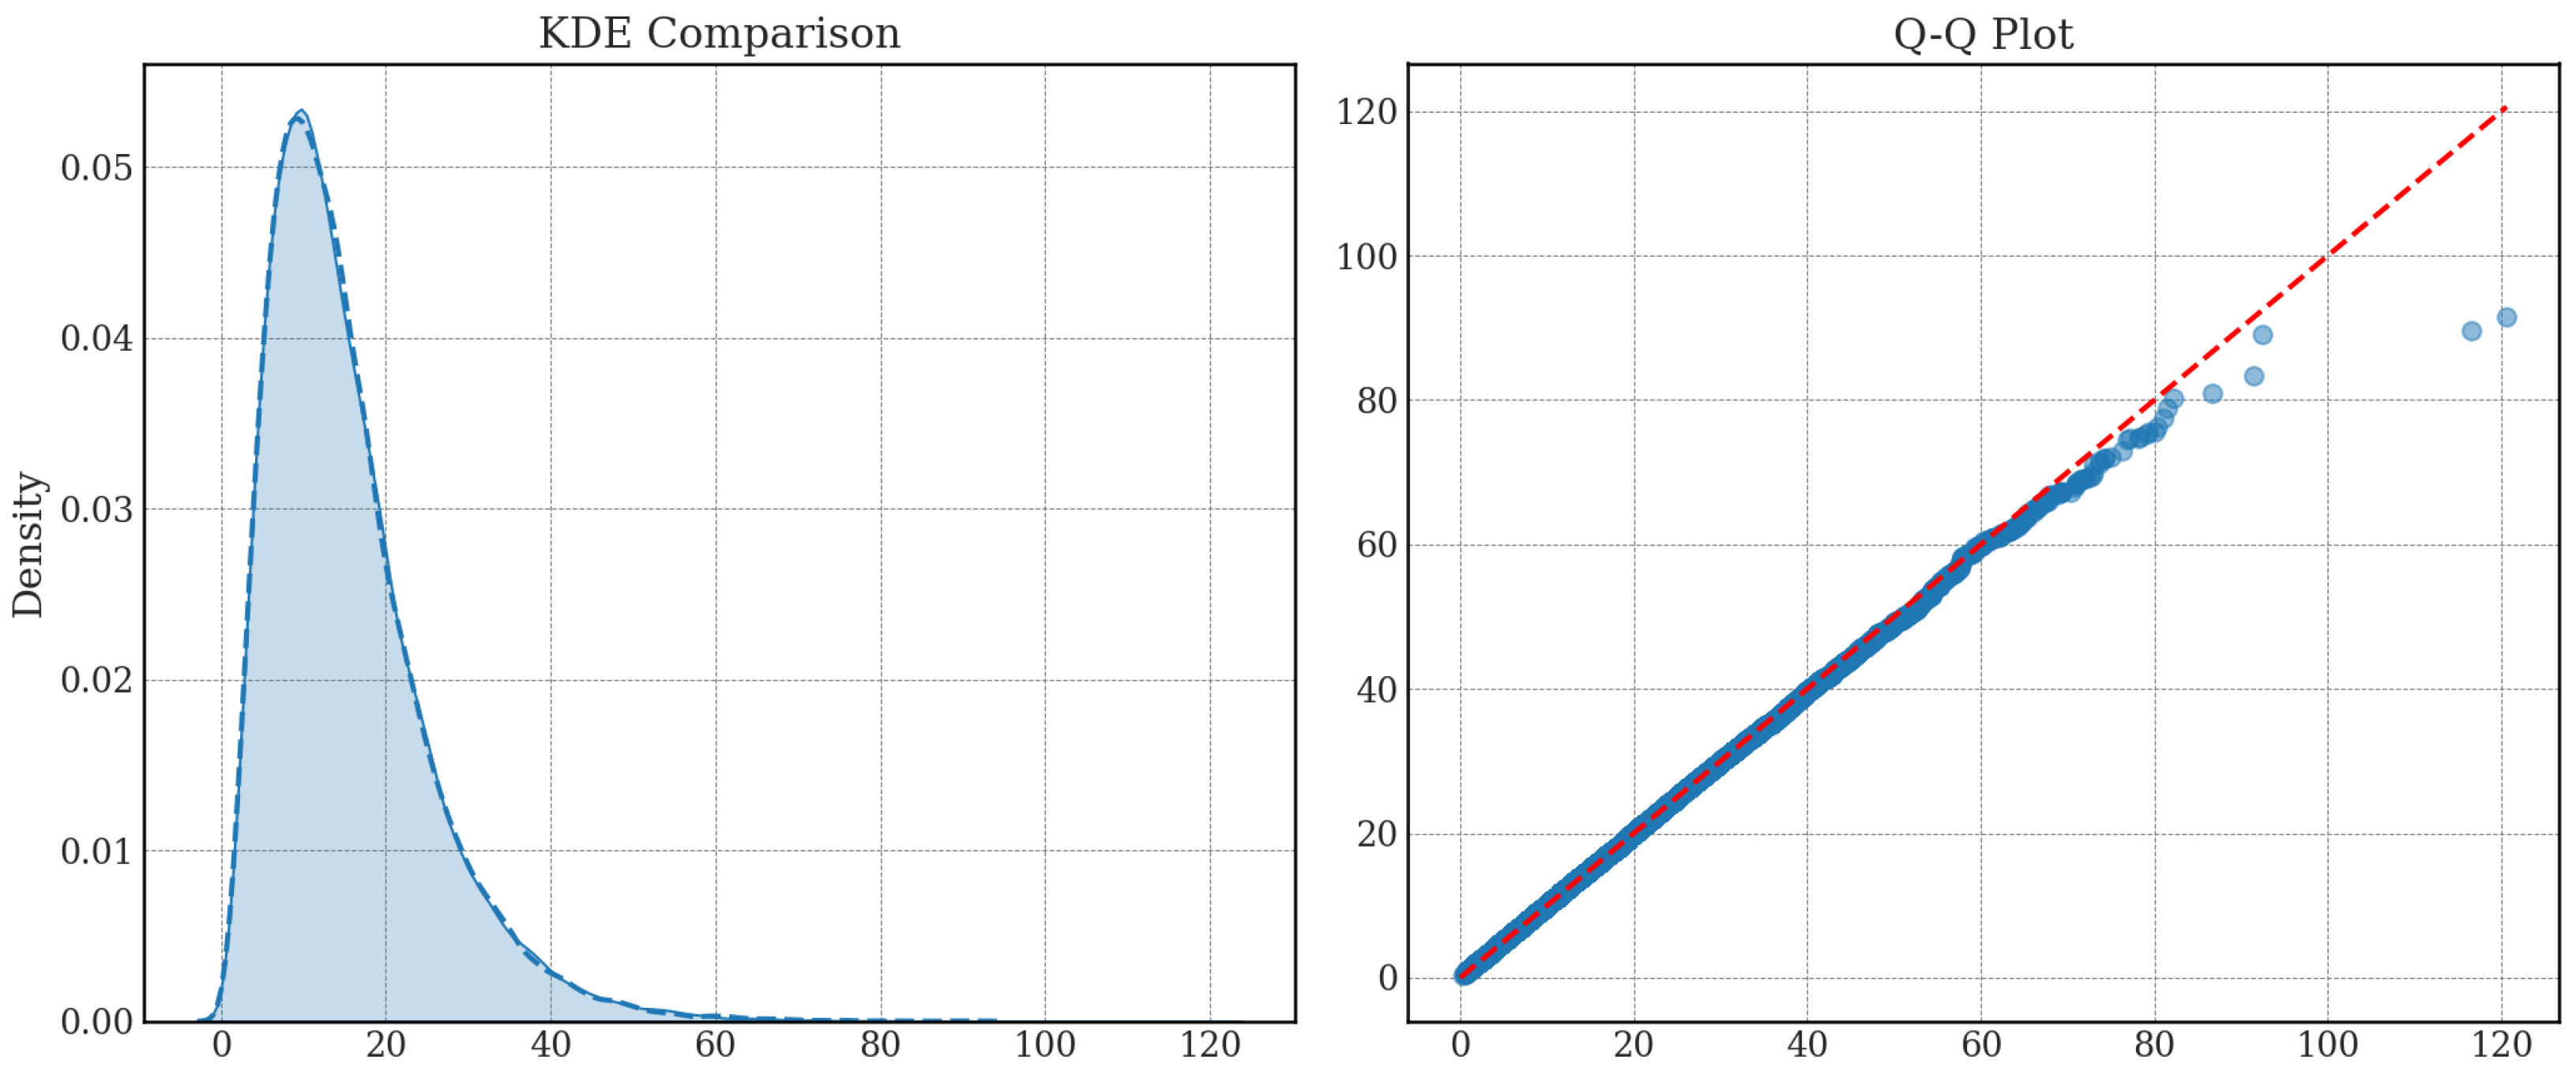
These experiments are essential for ensuring the scientific reliability of the simulation results. Experiment 3 aims to confirm that the results are not dependent on a specific random number generator (RNG) algorithm, while Experiment 5 aims to ensure that statistically identical results can be reproduced using different random seeds.
In Figure 5, the lifespan distributions generated by two different RNG algorithms (PCG64 and Mersenne Twister) are visually identical. The mean lifespans show no statistically significant difference. Figure 6 shows the results of the stochastic reproducibility verification. The KDE plot on the left indicates that the two distributions obtained from different random seeds are identical. Furthermore, in the Q-Q plot on the right, the points plotting the quantiles of the two datasets align almost perfectly on the reference line . This means that the quantiles of the two datasets match across the entire range, providing strong visual evidence that they are samples from the same probability distribution. These results prove that the statistical distributions generated by this simulation are objective and highly reproducible, determined solely by the model’s parameters and not influenced by computational contingencies such as the RNG algorithm or seed value.
Figure 5.
Experiment 3: RNG Dependency Check (PCG64 vs Mersenne Twister), x-axis “Lifespan (years)”.
Figure 6.
Experiment 5: Comparison of Simulation Results Using Two Different Random Seeds (Left: KDE Comparison, Right: Q-Q Plot), y-axis and x-axis “Lifespan (years)”.
3.5. Experiments 7, 8: Dynamic Analysis of the Deterioration Process
These experiments aim to visualize the macro-level deterioration behavior of the entire population and the micro-level deterioration paths of individual units to understand their dynamic behavior. Identification of the Transition Probability with the Greatest Influence on Deterioration Behavior , it was confirmed that a maintenance strategy that maintains State A and prevents transition to State B is effective for extending the service life of the equipment.
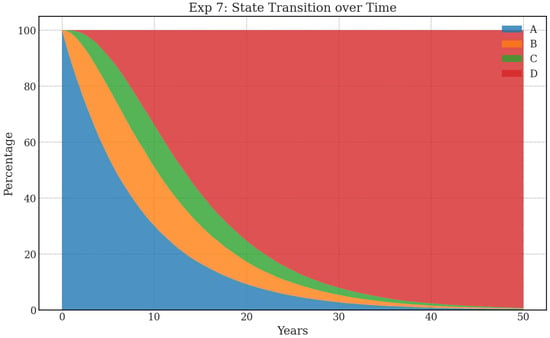
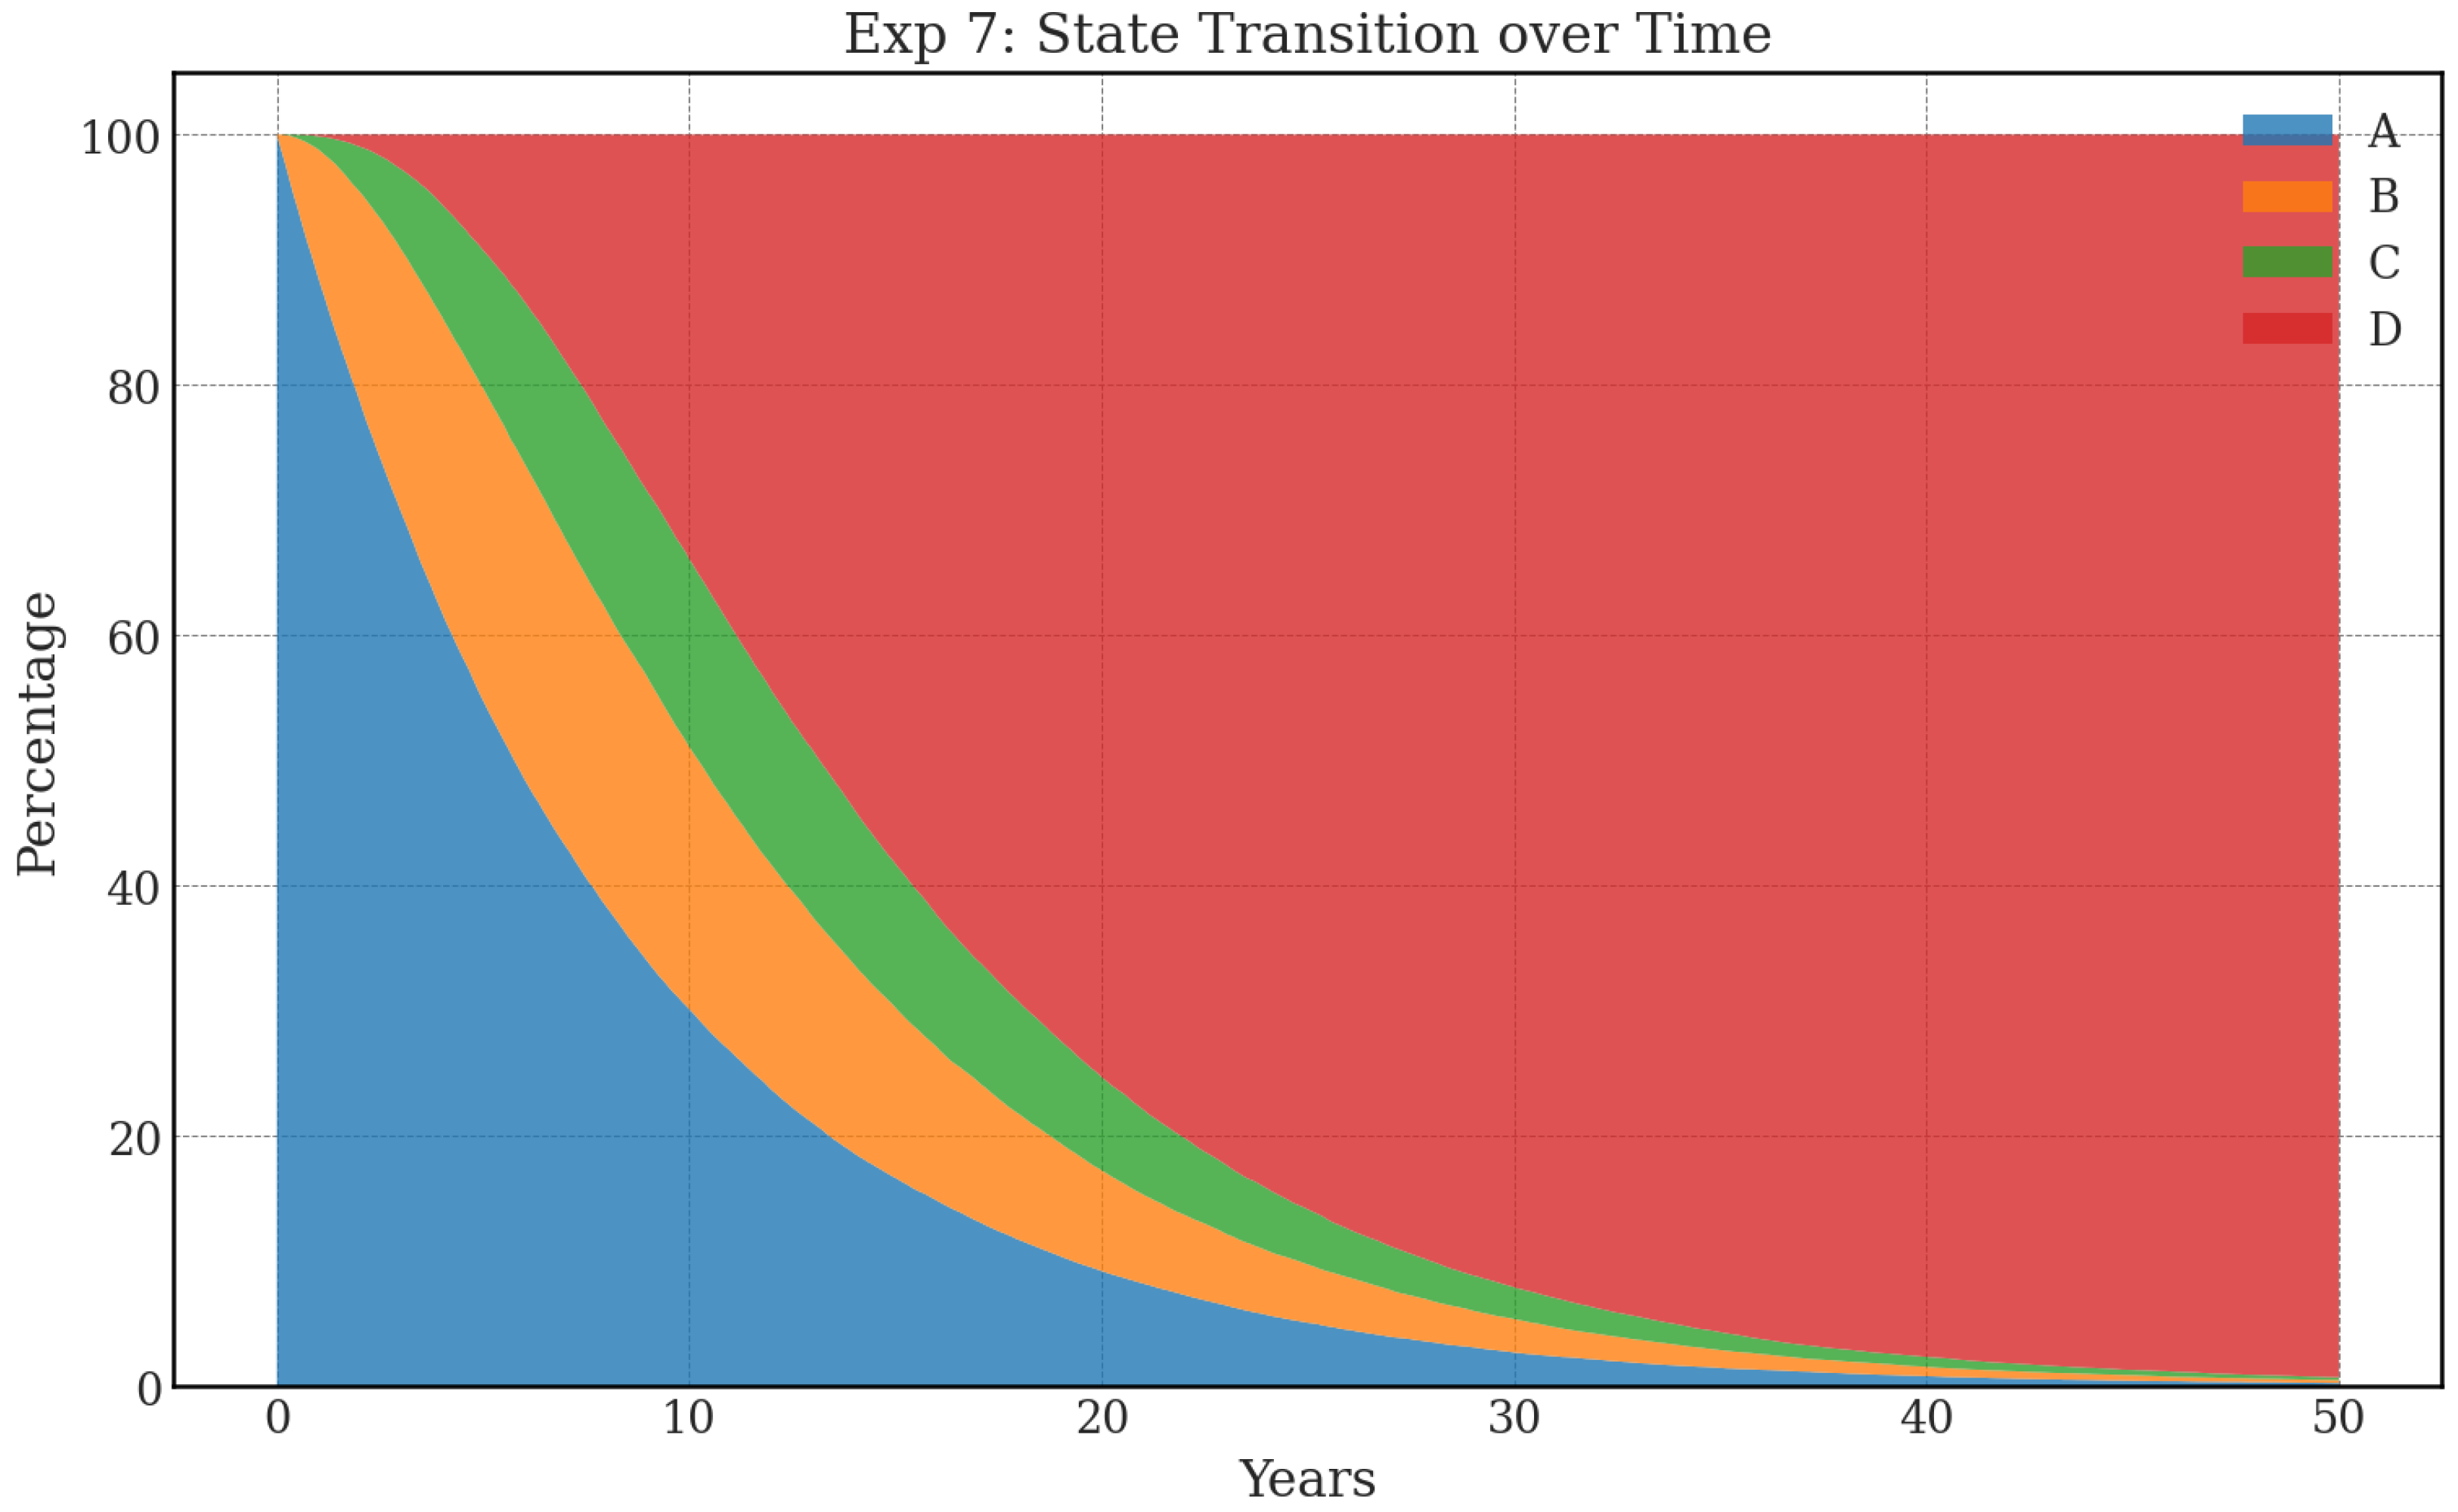
Figure 7 shows how the proportion of the entire equipment cohort in each state changes over time. It clearly captures the process where the proportion of State A (blue), initially at 100%, decreases over time, transitioning through State B (orange) and C (green), and eventually converging to the absorbing State D (red). This graph provides fundamental information for asset managers to predict future repair and renewal demands from a macro perspective. Equipment Life Extension Strategy through Optimization of Transition Probabilities: From the simulation results of the transition probabilities governing deterioration behavior, it was confirmed that reducing the transition probability from State A (healthy state) to State B (minor deterioration not requiring repair) leads to the extension of equipment lifespan. This makes it possible to extract subdivided homogeneous statistical populations based on factors that reduce the transition probability from State A to State B by comparing them with analysis results from the micronization of homogeneous statistical populations based on the experience and knowledge of field engineers using AHP, etc.
Figure 7.
Experiment 7: Time-Series Change in State Proportions of an Equipment Cohort.
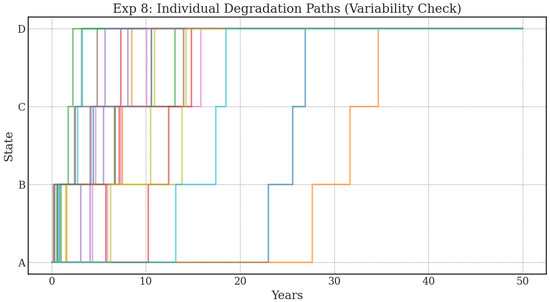
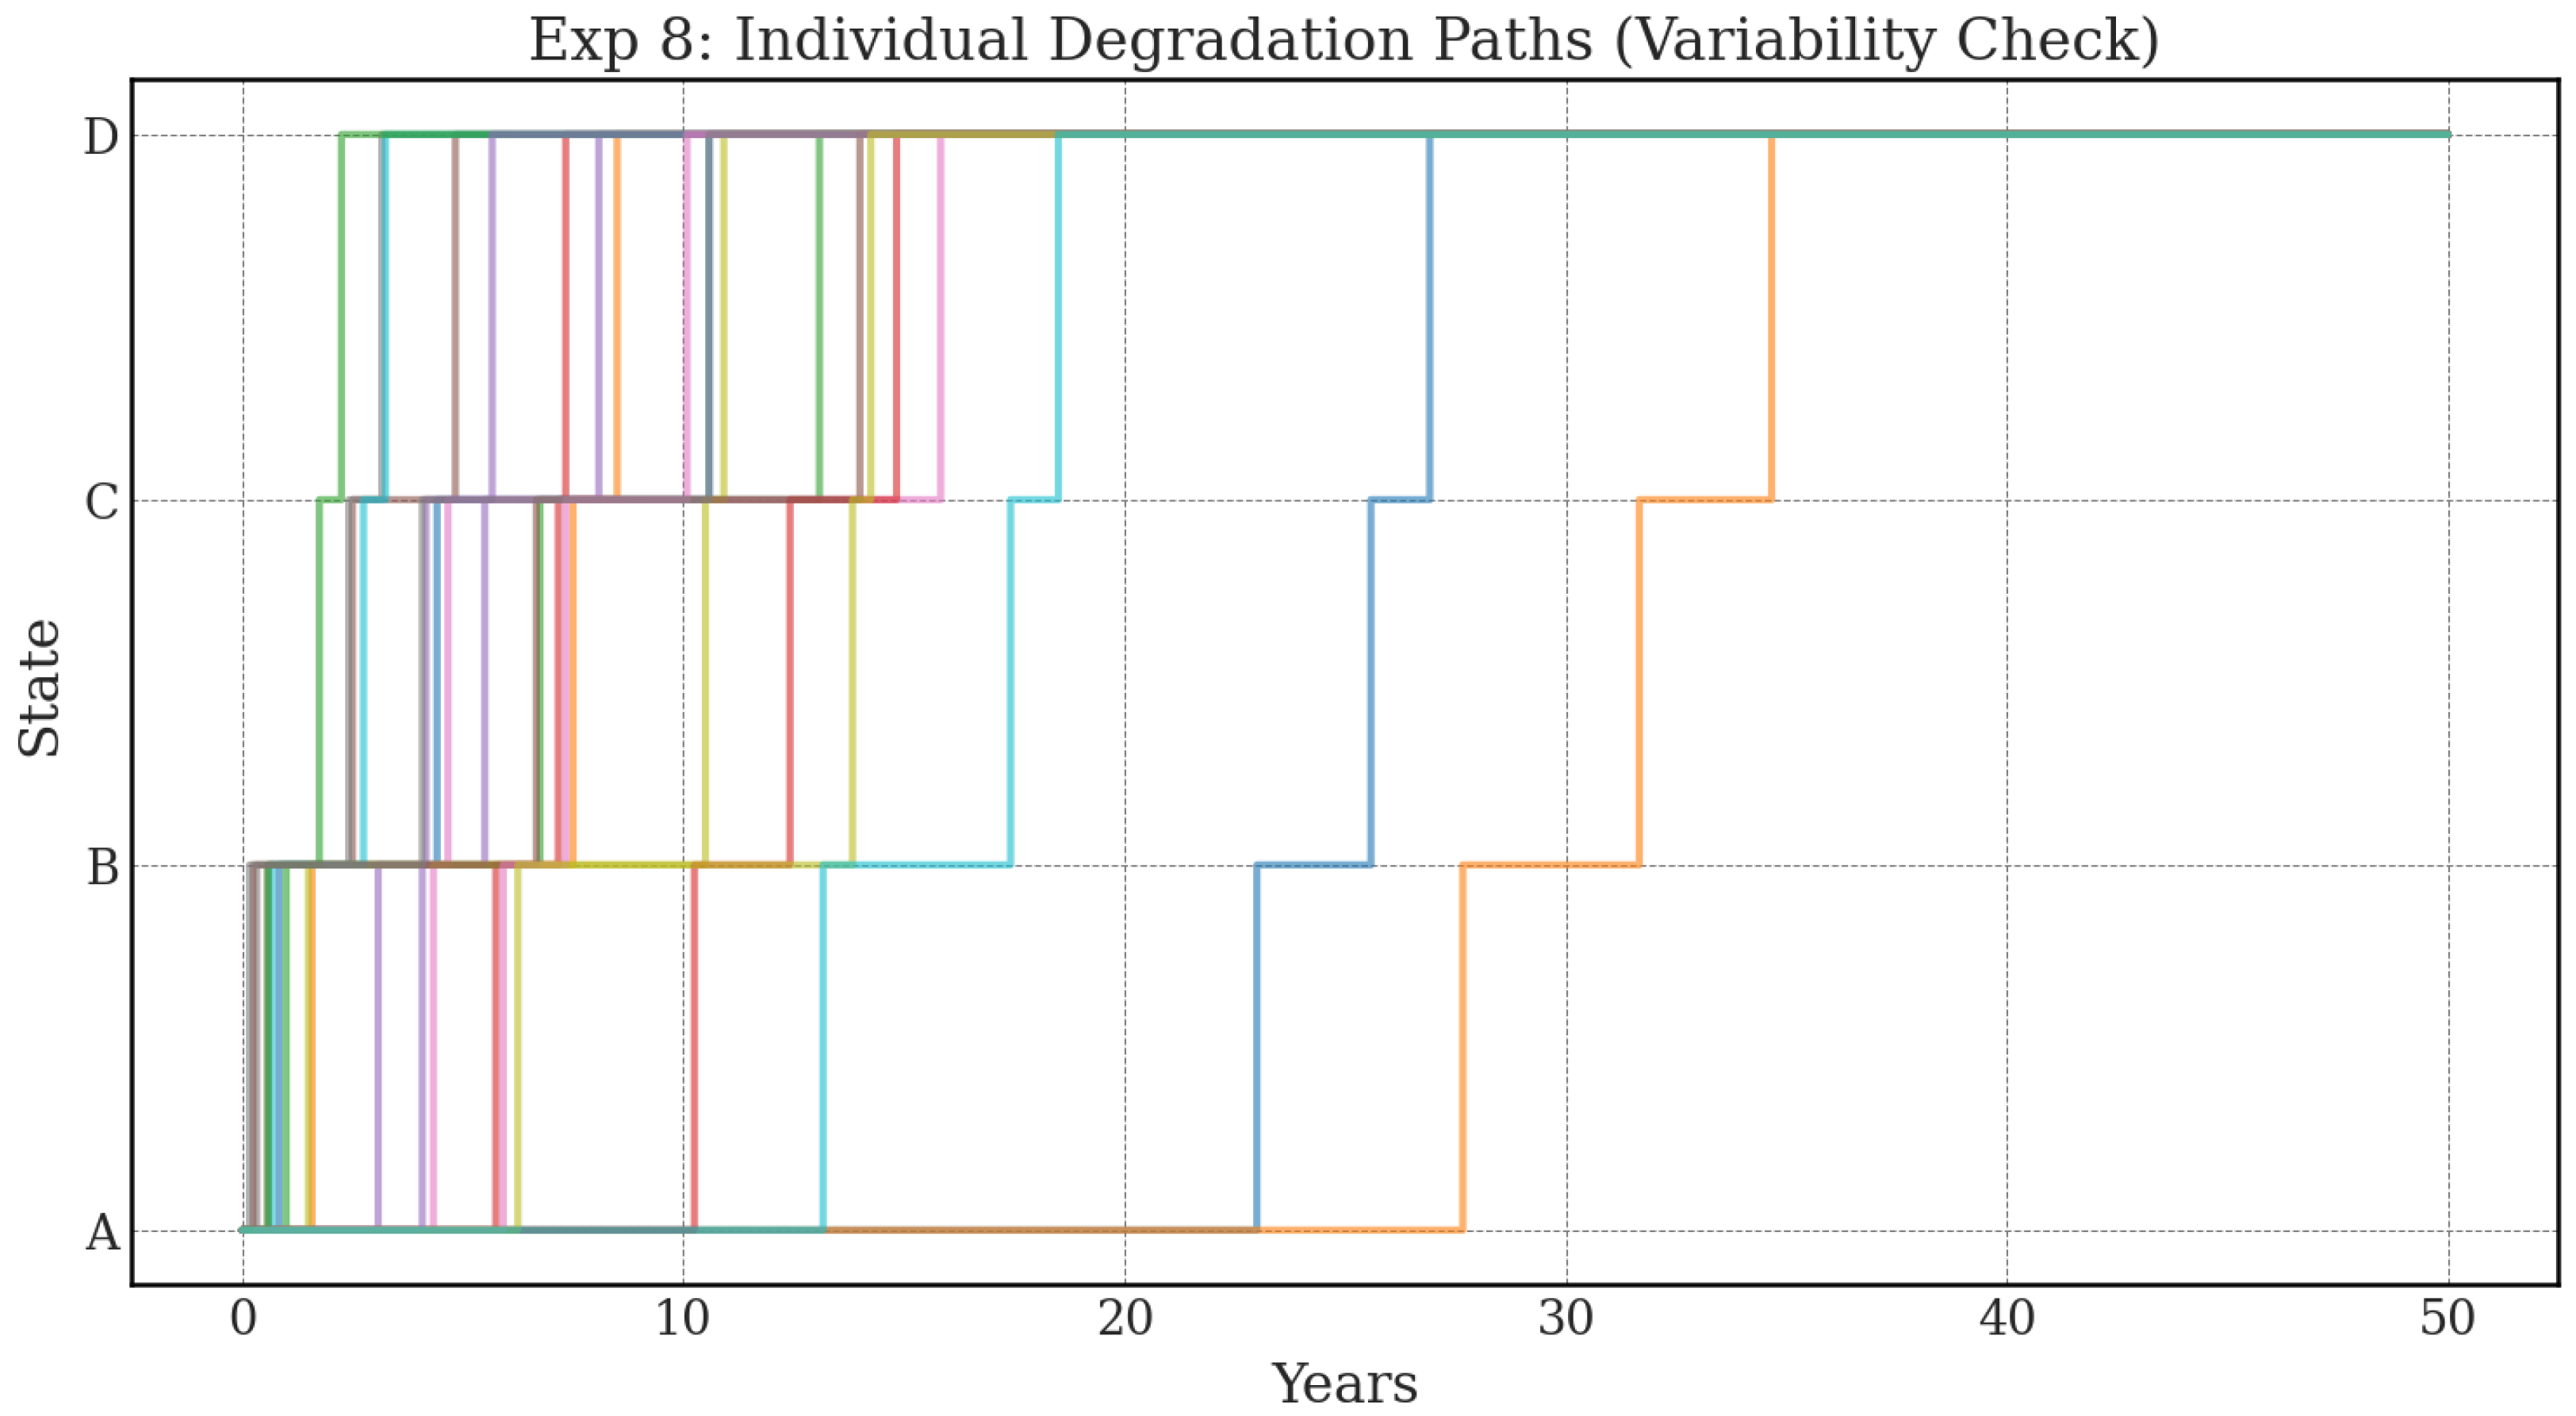
On the other hand, Figure 8 shows the individual deterioration paths. Although all units deteriorate in the same sequence , the timing of these state transitions varies greatly among individuals. Some units reach their lifespan (State D) early, while others remain in State C for a longer period. This graph visualizes the probabilistic behavior of individual units hidden behind the average behavior, suggesting the importance of Condition-Based Maintenance (CBM)—that is, the necessity of monitoring the condition of individual units and intervening at the optimal time.
Figure 8.
Experiment 8: Visualization of Individual Deterioration Paths (Variability Check).
3.6. Convergence of Results and Model Reliability
The ultimate reliability of the series of simulations in this study depends on whether the obtained statistical quantities converge to stable values when the number of trials N is sufficiently large.
Figure 9 plots the behavior of key indicators (mean lifespan and standard deviation) obtained from the Beta-distributed model against the number of trials N on the horizontal axis (logarithmic scale).
- Theoretical Validity of Convergence: As seen in the graphs, the fluctuations in both mean lifespan and standard deviation rapidly decrease as N increases, asymptotically approaching fixed values. From a theoretical standpoint, this behavior is a self-evident consequence of the Law of Large Numbers. Since the transition probabilities are modeled using bounded Beta distributions, the resulting lifespan distribution possesses finite moments. Therefore, the Monte Carlo estimator is mathematically guaranteed to be consistent, with its standard error scaling as .
- Confirmation of Implementation Correctness: The fact that the simulation results exhibit this clear asymptotic behavior serves as a vital “sanity check.” It confirms that the stochastic process is correctly implemented without numerical instability and that the sample size of is sufficient to render statistical noise negligible.
- Implication for Reproducibility: The stability of the standard deviation (right graph) further implies that the shape of the lifespan distribution is robustly reproduced across trials. This ensures that the heavy-tailed characteristics discussed in Section 3.1 are intrinsic features of the model, not artifacts of insufficient sampling.
Figure 9.
Final Result: Mathematical Convergence of the Proposed Beta-Distributed Model ( to ). The mean lifespan (left) and standard deviation (right) converge to stable values, demonstrating the mathematical reliability of the Beta model without the clutter of auxiliary metrics.
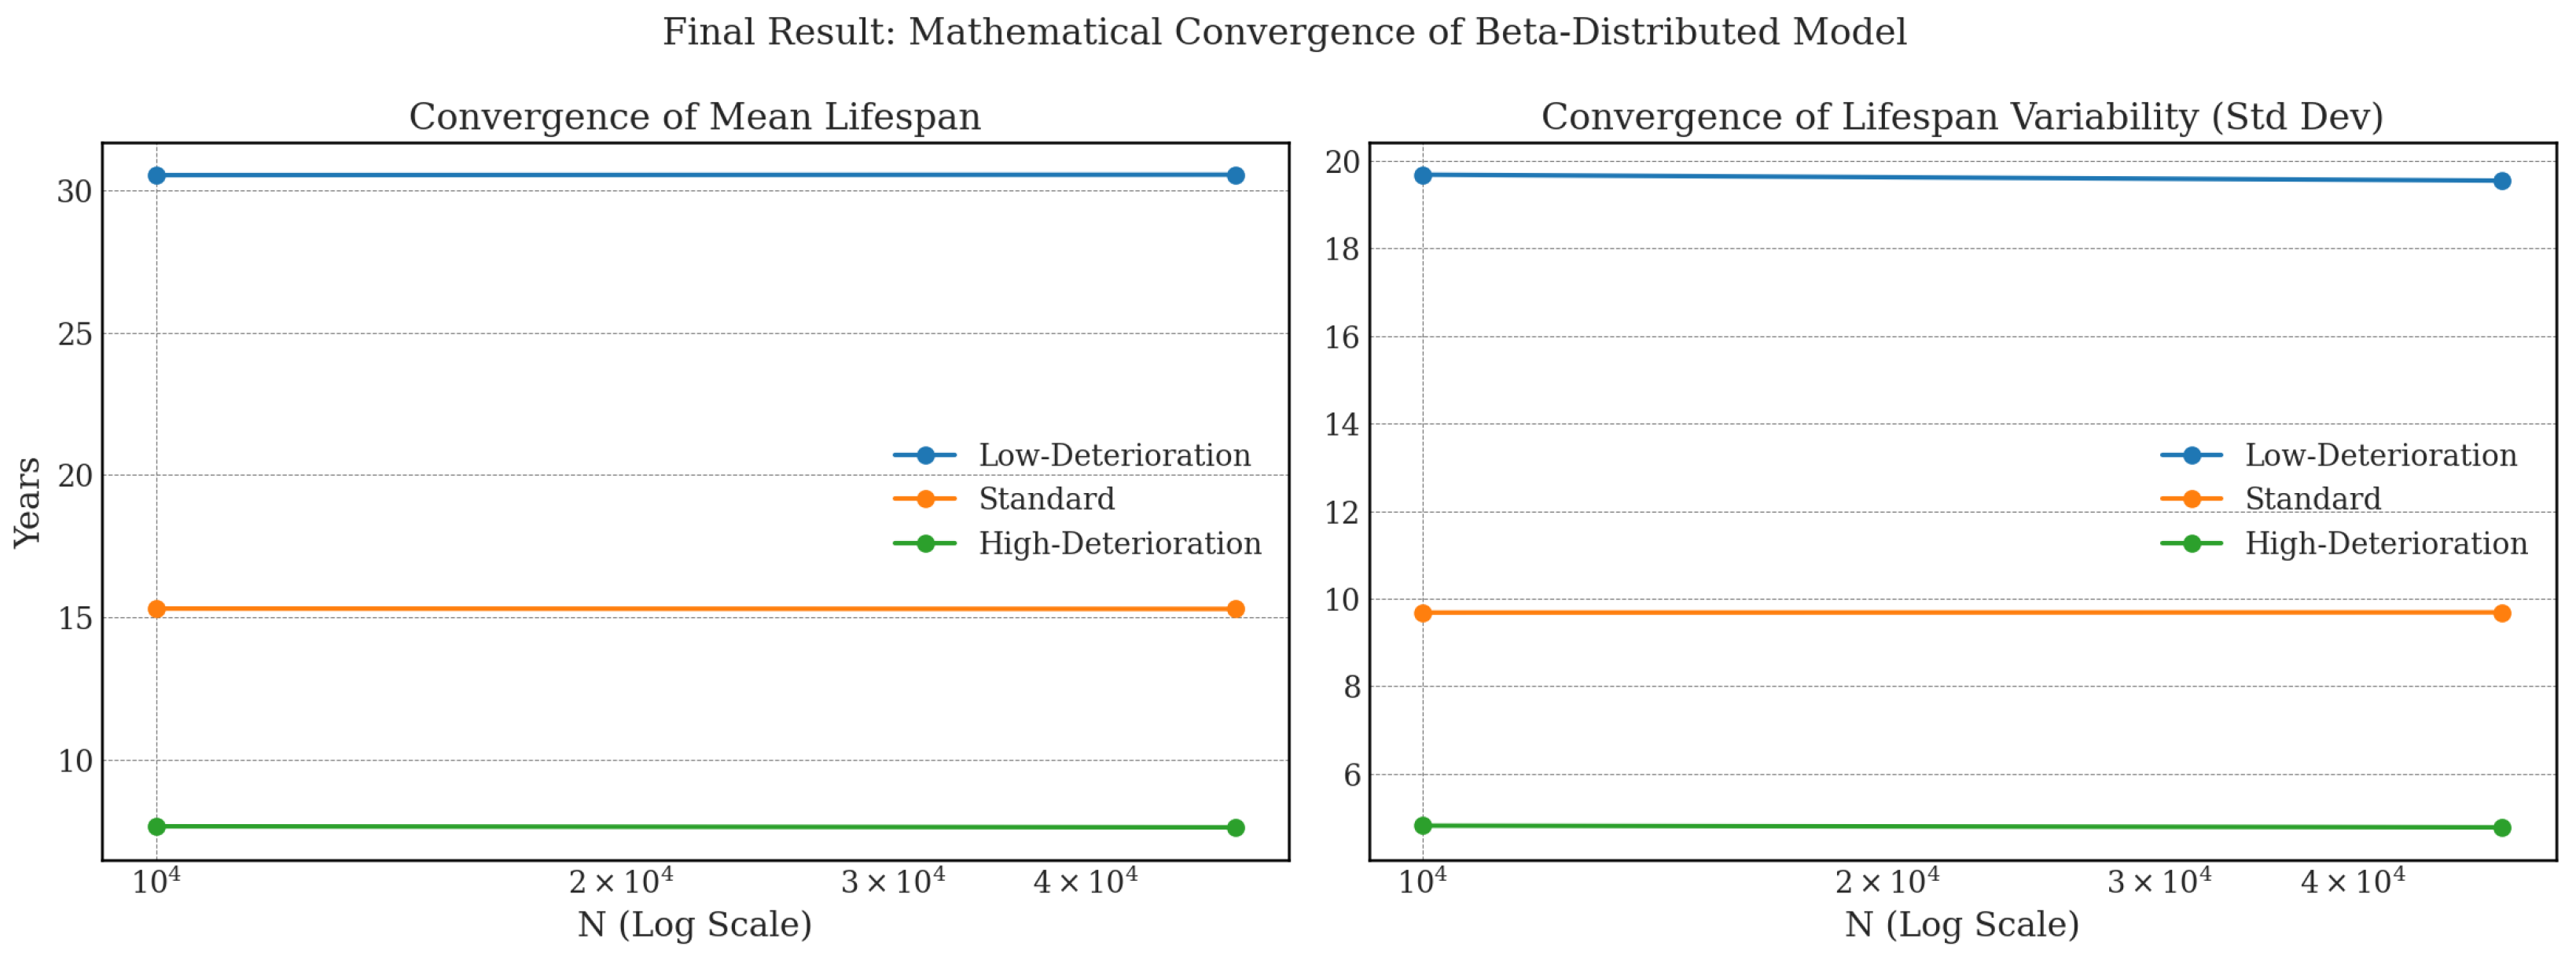
Overall, this convergence analysis demonstrates that the simulations performed in this study are not only empirically stable but also mathematically consistent with the underlying probabilistic theory.
4. Conclusions
As a practical challenge in validating the model’s applicability, Japan’s tunnel inspection data often relies on poorly organized paper records, and long-term expert evaluations inevitably contain judgmental bias. This study constructed a model that accommodates this “judgment variation” as probabilistic fluctuation and simulated its impact using random numbers. This demonstrated that the proposed model functions stably even under uncertainty, thereby re-evaluating its validity. This study addressed the fundamental barriers of “lack of real data” and “subjectivity in evaluation” that deterioration prediction model construction and evaluation face in the quest to realize data-driven asset management for the national challenge of aging social infrastructure.
4.1. Key Findings of This Study
The following key findings were obtained through this study:
- Robustness of the Deterioration Analysis Model Based on Markov Stochastic Process: Through large-scale computational experiments, it was confirmed that the deterioration analysis model is capable of accommodating AHP and model extensions.
- Model Independence from Noise Distribution: By comparing the newly implemented Beta-distributed model with the conventional Gaussian model, we confirmed that the simulation results are robust to the mathematical formulation of stochastic noise.This ensures that the model remains valid even when the exact shape of expert judgment variability is uncertain.
- Identification of the Transition Probability with the Greatest Influence on Deterioration Behavior (): It was confirmed that a maintenance strategy that maintains State B and prevents transition to State C is effective for extending the service life of the equipment.
- Necessity of a Time-Varying Model for Non-Linear Responses: It was confirmed that extension to a time-varying model makes it possible to reflect the results of AHP, etc.
- Extensibility of the Prediction Model: While a deterioration prediction model that is easy to implement in the field requires simplicity, it is difficult for it to accommodate the subdivision (micronization) of homogeneous statistical populations.Therefore, an ideal deterioration analysis model should maintain simplicity while also possessing the extensibility to handle the micronization of homogeneous statistical populations composed of various deterioration factors. The results of this experimental verification confirmed that the model can handle various deterioration scenarios. In the future, by considering the extension of the time-evolving deterioration analysis model, it will be possible to enhance its sophistication.Furthermore, with an eye on deployment to data-driven machine learning models, it is expected to become a foundation for the implementation of non-linear machine learning models using large-scale data.
- Equipment Life Extension Strategy through Optimization of Transition Probabilities: From the simulation results of the transition probabilities governing deterioration behavior, it was confirmed that reducing the transition probability from State B (minor deterioration not requiring repair) to State C (deterioration requiring repair) leads to the extension of equipment lifespan.This makes it possible to extract subdivided homogeneous statistical populations based on factors that reduce the transition probability from State B to State C by comparing them with analysis results from the micronization of homogeneous statistical populations based on the experience and knowledge of field engineers using AHP, etc.
4.2. Significance of This Research
The significance of this research lies in both its academic and practical aspects. Academically, it presents a methodology for advancing scientific inquiry in a research domain where real data is extremely limited, by using a simulation-based approach that integrates expert knowledge. In particular, the attempt to incorporate the variability of evaluators’ subjective judgments as stochastic fluctuations in the model contains implications that are widely applicable in the modeling of social systems and engineering systems involving humans. Practically, the greatest significance lies in the potential for this framework to become a powerful tool for infrastructure managers to support decision-making based on scientific evidence. By simulating future deterioration behavior under various scenarios, it becomes possible to provide quantitative data for the most critical questions in asset management: to which equipment, at what timing, and how should limited budgets and personnel be allocated.
4.3. Limitations of This Study and Future Research Prospects
In this study, while we adopted a mathematical analysis model that considers the mechanisms of the equipment deterioration phenomenon and confirmed its model characteristics through simulation, mathematical analysis models inherently capture complex real-world phenomena in a somewhat simplified manner. Therefore, there may be unobservable deterioration factors not considered in this study. Based on these limitations, the following directions are considered for future research prospects:
- Validation using AHP: AHP is a powerful method for hierarchically organizing the various factors involved in the complex phenomenon of equipment deterioration and quantifying their relative importance through pairwise comparisons by experts. The use of this method is expected to enable the conversion of experts’ tacit knowledge into explicit knowledge, allowing for the design of objective and reproducible deterioration scenarios (personas). Specifically, an approach considering the durability of lighting fixture materials and the environmental conditions of the installation location can be considered. The calculation conditions for deterioration analysis using AHP for these factors will be large-scale but are important hypotheses and verification items.
- Integration with Real-time Data: With the advancement of IoT sensor technology, it is becoming possible to collect environmental data such as vibration, temperature, and humidity in real-time. Dynamically incorporating this measured data into the model of this study and continuously improving prediction accuracy using a Bayesian updating framework is a promising approach.
- Modeling the Impact of Climate Change: In future infrastructure management, it is essential to consider the increase in environmental stress due to climate change (e.g., intensification of typhoons, increase in extremely hot days). Incorporating climate change scenarios into this model to conduct risk assessments from a longer-term perspective is also required.
- Development into a Digital Twin: By constructing high-fidelity virtual models (digital twins) corresponding to individual tunnels and facilities and integrating the simulation engine from this study, “custom-made” deterioration prediction and optimal maintenance planning for specific equipment will become possible.
- Integration with LCC Optimization: By directly combining the deterioration analysis model of this study with Life Cycle Cost (LCC) analysis and mathematical optimization methods, the construction of a comprehensive decision support system that balances the maintenance of health and the pursuit of economic efficiency is expected.
In an era where the sustainability of social infrastructure is being questioned, approaches like this study, which fuse experience and intuition with the power of data science, will be an indispensable cornerstone for passing on safe and high-quality social capital to future generations. In particular, capturing homogeneous statistical populations as models and confirming their statistical superiority will be an important discussion related to practical application.
5. Future Prospects
As suggested above, we are considering ultimately expanding upon the discussions in Dr. Maeda’s (2022) doctoral dissertation [2]. Furthermore, the AHP process, which allows for the introduction of various conditions as suggested in the prospects, can enable the verification and re-recognition of sensitivity analysis by feeding back the analysis results from micronized homogeneous statistical populations. This feedback of analysis results also has a spiral structure that leads to the refinement of the quantification by AHP.
Based on these points, we are considering the “micronization of homogeneous statistical populations.” The rigorous definition of what constitutes a “homogeneous group” is essential for accurate modeling. Historically, the concept of “homogeneity” (Homogenität) in statistical mass has been a subject of profound debate, particularly in German social statistics. Nagaya (1989, 1990) and Arita (1939, 1941) have extensively discussed the distinction between “formal homogeneity” and “structural homogeneity” in their series of studies on the homogeneity controversy [43,44,45,46,47]. Revisiting these fundamental theoretical discussions is crucial when defining the boundaries of data groups for diverse infrastructure assets in the era of big data. By theoretically clarifying the statistical properties of these populations, we aim to refine the analysis model through time evolution and quantization.
This will enable the conversion of qualitative human sensitivity into quantitative measures, and at the same time, it will become a foundation for the shift from human resources to artificial resources such as AI in the coming society of population decline, thereby exploring its utility in many fields.
Author Contributions
Conceptualization, N.M.; methodology, N.M.; software, Y.K.; validation, S.H. and N.M.; formal analysis, Y.K.; investigation, Y.K.; resources, N.M.; data curation, Y.K.; writing—original draft preparation, Y.K.; writing—review and editing, Y.K., N.M. and S.H.; visualization, Y.K.; supervision, N.M.; project administration, Y.K. Specifically, the concept, mathematical model, and overall vision were developed by N.M.; programming, simulation coding, large-scale computation, visualization, and the overall structure of the paper were conducted by Y.K.; the scrutiny and verification of the model’s calculation results were performed by S.H. All authors have read and agreed to the published version of the manuscript.
Funding
This research received no external funding.
Institutional Review Board Statement
Not applicable.
Informed Consent Statement
Not applicable.
Data Availability Statement
The simulation code used in this study, including the Beta-distributed stochastic model and the convergence analysis suite, is openly available in the GitHub repository at: https://github.com/RUDATAScience/tunnellightingdeteriorationsim (accessed on 27 January 2026).
Acknowledgments
In carrying out this research, we received valuable support and cooperation from many individuals. We would like to express our deepest gratitude here.
Conflicts of Interest
Author Noriaki Maeda was employed by the company East Nippon Expressway Company Limited. The remaining authors declare that the research was conducted in the absence of any commercial or financial relationships that could be construed as a potential conflict of interest.
References
- Kobayashi, K.; Kaito, K.; Lethanh, N. A statistical deterioration forecasting method using hidden Markov model for infrastructure management. Transp. Res. Part B Methodol. 2011, 46, 544–561. [Google Scholar] [CrossRef] [Scilit]
- Maeda, N. A Study on the Utilization of a Mathematical Deterioration State Prediction Model for Road Tunnel Lighting Facility Management. Doctoral Dissertation, Graduate School of Sciences and Technology for Innovation, Yamaguchi University, Yamaguchi, Japan, 2022. [Google Scholar]
- Ministry of Land, Infrastructure, Transport and Tourism. White Paper on Land, Infrastructure, Transport and Tourism in Japan; MLIT: Tokyo, Japan, 2022. [Google Scholar]
- Aihara, K.; Imura, J.; Horio, Y.; Suzuki, H.; Horai, S. Construction of Basic Theory of Mathematical Modeling for Complex Systems and Its Transdisciplinary Science and Technology Applications. IEICE Fundam. Rev. 2015, 8, 218–228. (In Japanese) [Google Scholar] [CrossRef] [Scilit]
- Kaito, K.; Abe, M.; Fujino, Y. Deterioration Prediction of Structures Based on Field Data. J. Jpn. Soc. Civ. Eng. 2003, 744, 29–38. (In Japanese) [Google Scholar]
- Tsuda, Y.; Kaito, K.; Aoki, K.; Kobayashi, K. Estimation of Markov Transition Probabilities for Bridge Deterioration Prediction. J. Jpn. Soc. Civ. Eng. 2005, 23, 69–82. (In Japanese) [Google Scholar]
- Cesare, M.A.; Santamarina, C.; Turkstra, C.; Vanmarcke, E.H. Modeling bridge deterioration with Markov chains. J. Transp. Eng. 1992, 118, 820–833. [Google Scholar] [CrossRef] [Scilit]
- Madanat, S.; Mishalani, R.; Ibrahim, W.H.W. Estimation of infrastructure transition probabilities from condition rating data. J. Infrastruct. Syst. 1995, 1, 120–125. [Google Scholar] [CrossRef] [Scilit]
- Aoki, K.; Yamamoto, K.; Kobayashi, K. Estimation of Hazard Models for Deterioration Prediction. J. Jpn. Soc. Civ. Eng. 2005, 791, 111–124. (In Japanese) [Google Scholar]
- Aoki, K.; Yamamoto, K.; Tsuda, Y.; Kobayashi, K. Multi-stage Weibull Deterioration Hazard Model. J. Jpn. Soc. Civ. Eng. 2005, 791, 125–136. (In Japanese) [Google Scholar]
- Kaito, K.; Kobayashi, K. Bayesian Estimation of Markov Deterioration Hazard Model. J. Jpn. Soc. Civ. Eng. Ser. A 2007, 63, 336–355. (In Japanese) [Google Scholar] [CrossRef] [Scilit]
- Weibull, W. A Statistical Distribution Function of Wide Applicability. J. Appl. Mech. 1951, 18, 293–297. [Google Scholar] [CrossRef] [Scilit]
- Cox, D.R. Regression Models and Life-Tables. J. R. Stat. Soc. Ser. B 1972, 34, 187–220. [Google Scholar] [CrossRef] [Scilit]
- Aoki, K.; Yamamoto, K.; Kobayashi, K. Optimal Inspection and Replacement Policy for Tunnel Lighting Systems. J. Jpn. Soc. Civ. Eng. 2005, 805, 105–116. (In Japanese) [Google Scholar] [CrossRef] [Scilit] [PubMed]
- Aoki, K.; Yamamoto, K.; Kobayashi, K. Aggregate Optimal Inspection and Repair Model for Systems with Time-Dependent Deterioration Processes. J. Jpn. Soc. Civ. Eng. Ser. F 2006, 62, 240–257. (In Japanese) [Google Scholar]
- Morcous, G. Performance prediction of bridge deck systems using Markov chains. J. Perform. Constr. Facil. 2006, 20, 146–155. [Google Scholar] [CrossRef] [Scilit]
- Kawamura, K.; Miyamoto, A.; Nakamura, H.; Ono, M. Development of Maintenance Strategy Selection System in Bridge Management System (BMS). J. Jpn. Soc. Civ. Eng. 2000, 658, 121–139. (In Japanese) [Google Scholar]
- Furuta, H.; Kayano, M.; Watanabe, E. Current Status and Future Prospects of Bridge Maintenance and Bridge Management Systems. J. Jpn. Soc. Civ. Eng. Ser. F 2007, 63, 287–294. (In Japanese) [Google Scholar]
- Furuta, H.; Kanamori, A.; Dogaki, M. Research on Optimal Maintenance Planning Support System for RC Slabs of Bridge Groups Considering Life Cycle Cost. J. Soc. Mater. Sci. Jpn. 1998, 47, 1245–1250. (In Japanese) [Google Scholar] [CrossRef] [Scilit]
- Miyamoto, A.; Kawamura, K.; Nakamura, H. Formulation of Optimal Maintenance Plan for Existing Bridges Using Bridge Management System (BMS). J. Jpn. Soc. Civ. Eng. 1998, 191–208. (In Japanese) [Google Scholar]
- Frangopol, D.M.; Kallen, M.J.; van Noortwijk, J.M. Probabilistic Models for Life-Cycle Performance of Deteriorating Structures. Prog. Struct. Eng. Mater. 2004, 6, 197–212. [Google Scholar] [CrossRef] [Scilit]
- Van den Boomen, M.; Schoenmaker, R.; Wolfert, A.R.M. A Life Cycle Costing Approach for Discounting in Age and Interval Replacement Optimisation Models for Civil Infrastructure Assets. Struct. Infrastruct. Eng. 2018, 14, 1–13. [Google Scholar] [CrossRef] [Scilit]
- Thoft-Christensen, P. Life-Cycle Cost-Benefit Analysis of Bridges from a User and Social Point of View. Struct. Infrastruct. Eng. 2009, 5, 49–57. [Google Scholar] [CrossRef] [Scilit]
- Chikata, Y.; Shintani, K.; Aso, K.; Kido, T. Study on Equalization of Maintenance Costs Over Time for Bridge Groups Using GA. J. Civ. Eng. Inf. Process. Syst. 2006, 15, 193–198. (In Japanese) [Google Scholar]
- Furuta, H.; Nomura, Y.; Nakatsu, K.; Kagawa, Y.; Uchida, M. Repair Planning Considering Schedule Changes in Asset Management of Bridge Groups. J. Jpn. Soc. Civ. Eng. Ser. A2 (Appl. Mech.) 2014, 1, I_959–I_970. (In Japanese) [Google Scholar]
- Kobayashi, K.; Eguchi, T.; Oi, A.; Aoki, K.; Kaito, K.; Matsumura, Y. Optimal Repair and Renewal Model for Pavement Structures. J. Jpn. Soc. Civ. Eng. Ser. E1 (Pavement Eng.) 2012, 68, 54–68. (In Japanese) [Google Scholar]
- Miyazaki, B.; Kato, H.; Obama, K.; Kaito, K.; Kazato, T.; Tanaka, K. Proposal of Evaluation Method for Pavement Repair Policies Based on Massive Road Condition Survey Data. J. Jpn. Soc. Civ. Eng. Ser. F4 (Constr. Manag.) 2015, 71, 142–161. (In Japanese) [Google Scholar]
- Taniguchi, S.; Ito, M.; Nomura, T.; Abe, T. Study on Method for Creating Performance Curves Using Pavement Database. J. Pavement Eng. JSCE 2003, 8, 99–106. (In Japanese) [Google Scholar] [CrossRef] [Scilit]
- Shin, H.C.; Madanat, S. Development of a stochastic model of pavement distress initiation. J. Infrastruct. Plan. Manag. 2003, 744, 61–67. [Google Scholar] [CrossRef] [Scilit]
- Mishalani, R.; Gong, L. Impacts of design and material quality on pavement rutting progression. J. Infrastruct. Plan. Manag. 2003, 744, 69–75. [Google Scholar] [CrossRef] [Scilit]
- Hori, M.; Obama, K.; Kaito, K.; Kobayashi, K. Optimal Inspection and Repair Model for Sewage Treatment Facilities. J. Infrastruct. Plan. Manag. 2008, 25, 213–224. (In Japanese) [Google Scholar] [CrossRef] [Scilit]
- Kawamura, H.; Ota, T.; Matsumi, Y.; Koyanagi, J.; Sato, T. Optimal Preventive Maintenance Level for Wave Dissipating Works Using Cumulative Damage Model. J. Jpn. Soc. Civ. Eng. Ser. B2 (Coast. Eng.) 2018, 74, I_1075–I_1080. (In Japanese) [Google Scholar]
- Iwasaki, K.; Asai, M.; Miyachi, Y.; Morihashi, M.; Tamaishi, M.; Iwanami, M. Case Analysis on Life Cycle Cost Reduction Effect of Port Facilities by Preventive Maintenance. J. Ocean Eng. (JSCE) 2008, 24, 543–548. (In Japanese) [Google Scholar]
- Komure, K.; Hamada, H.; Yokota, H.; Yamaji, T. Development of Deterioration Progression Model for RC Pier Superstructure Due to Chloride Attack. Concr. Res. Technol. 2004, 15, 13–22. (In Japanese) [Google Scholar] [CrossRef] [Scilit] [PubMed]
- Furuya, K.; Yokota, H.; Hashimoto, K.; Hanada, S. Reliability Evaluation of Deterioration Prediction for Mooring Facilities Using Markov Chain Model. J. Jpn. Soc. Civ. Eng. Ser. F4 (Constr. Manag.) 2011, 67, I_159–I_168. (In Japanese) [Google Scholar]
- Li, D.; Zhang, H.; Chen, L.; Zhou, Y.; Li, Y.; Qian, R.; Jiang, Y. Rural road surface distress detection algorithm based on mask R-CNN with data augmentation. Front. Built Environ. 2025, 11, 1566979. [Google Scholar] [CrossRef] [Scilit]
- Soni, R.; Alam, M.; Vishwakarma, S. Prediction of InSAR deformation time-series using improved LSTM deep learning model. Sci. Rep. 2025, 15, 5333. [Google Scholar] [CrossRef] [Scilit]
- Qiliang, Z.; Bochao, S.; Weijian, Z.; Watanabe, T.; Usui, T.; Takeda, H. Improved GAN-based deep learning approach for strain field prediction and failure analysis of precast bridge slab joints. Eng. Struct. 2024, 321, 119023. [Google Scholar] [CrossRef] [Scilit]
- Liu, T.; Liu, F. Graph Neural Networks for Evaluating the Reliability and Resilience of Infrastructure Systems: A Systematic Review of Models, Applications, and Future Directions. IEEE Access 2025, 13, 164883–164904. [Google Scholar] [CrossRef] [Scilit]
- Mengya, Z.; Aoli, L.; Qiling, Z.; Linrui, K. Research on Optimization of Financial Risk Early Warning System Driven by Big Data. In Proceedings of the 2025 International Conference on Computers, Information Processing and Advanced Education (CIPAE), Ottawa, ON, Canada, 26–28 August 2025; pp. 1040–1044. [Google Scholar]
- Alvin, C.; Renfei, H.; Limao, Z. Physics Informed Machine Learning (PIML) for Design, Management and Resilience-Development of Urban Infrastructures: A Review. Arch. Comput. Methods Eng. 2025, 32, 399–439. [Google Scholar]
- East Nippon Expressway Company Limited. Design Standards for Road Tunnel Lighting Facilities; NEXCO East: Tokyo, Japan, 2020. [Google Scholar]
- Nagaya, M. Statistical Mass and Homogeneity: The Homogeneity Controversy in German Social Statistics (1). Econ. Rev. (Keizai Ronso) 1989, 143, 344–372. (In Japanese) [Google Scholar]
- Nagaya, M. Homogeneity and Essential Equality: The Homogeneity Controversy in German Social Statistics (2). Econ. Rev. (Keizai Ronso) 1989, 144, 155–179. (In Japanese) [Google Scholar]
- Nagaya, M. Homogeneity and Structural Equality: The Homogeneity Controversy in German Social Statistics (3). Econ. Rev. (Keizai Ronso) 1990, 145, 46–72. (In Japanese) [Google Scholar]
- Arita, S. Formal Homogeneity in Statistical Mass. Econ. Rev. (Keizai Ronso) 1939, 48, 861–865. (In Japanese) [Google Scholar]
- Arita, S. Žižek and the Problem of Formal Homogeneity. Econ. Rev. (Keizai Ronso) 1941, 52, 245–259. (In Japanese) [Google Scholar]
Disclaimer/Publisher’s Note: The statements, opinions and data contained in all publications are solely those of the individual author(s) and contributor(s) and not of MDPI and/or the editor(s). MDPI and/or the editor(s) disclaim responsibility for any injury to people or property resulting from any ideas, methods, instructions or products referred to in the content. |
© 2026 by the authors. Licensee MDPI, Basel, Switzerland. This article is an open access article distributed under the terms and conditions of the Creative Commons Attribution (CC BY) license.