


Abstract
The Laser Interferometer Space Antenna (LISA) is an ESA mission designed to detect gravitational waves from space. To initiate the science phase, six test masses (TMs) are precisely handled and released into near-perfect free fall by dedicated mechanisms known as the Grabbing, Positioning, and Release Mechanisms (GPRMs). The stringent requirements on the noise level affecting the TMs’ release acceleration are extremely ambitious, motivating the need to experimentally verify the feasibility of achieving such performance. To this end, a dedicated precursor mission, LISA Pathfinder (LPF), flew from 2015 to 2017 to test key technologies. However, during the LPF mission, most release tests exhibited anomalous release velocities, often exceeding the requirements. In addition, the TM repositioning tests also revealed a bi-stable behavior in the TM rotations, which depend on the repositioning direction. This effect is produced by an unexpected non-rectilinear motion of the GPRM end effector, characterized by a micrometric side motion at the reversal of its axial motion. The bi-stable behavior also contributes to a TM-GPRM end effector misalignment, producing unwanted contacts and increasing the probability of a non-compliant TM release. Previous analyses identified asymmetric friction forces in the side-guiding system of the GPRM end effector as the primary cause of this behavior. Starting from the LPF flight experience, the GPRM delta development project in view of LISA led to a redesign of the mechanism architecture, supported by numerical analyses and multi-body models. Since the rectilinearity of the end-effector motion has been identified as critical for flight operation, alternative side-guiding concepts are developed, analyzed, and tested experimentally to evaluate their impact on the overall mechanism performance. The correlation of the models with ground and flight experimental data strengthens the understanding of the guiding system behavior, providing pivotal insights for selecting the GPRM design baseline for LISA.
1. Introduction
In the field of space science, LISA (Laser Interferometer Space Antenna, [1,2,3,4]) constitutes the first space-based gravitational waves detector, enabling observation of phenomena in the sub-Hertz bandwidth. LISA comprises three spacecraft arranged in an equilateral triangle formation with a side length of 2.5 million km. Each spacecraft hosts two gold test masses (TMs), in free-falling conditions, one for each adjacent side of the constellation.
To detect the very small distortions of the TMs’ formation, a laser interferometry technique is employed [5]. Each TM acts as a mirror for a laser beam used in the interferometric measurement system. The TM is placed within an electrode housing that enables precise electrostatic sensing of its position and orientation. It also provides electrostatic actuation in the directions along which the interferometric measurement is not performed, to maintain the TM aligned and centered in its enclosure [6].
To initiate the science phase, from a launch-locked configuration, the TMs must be set into geodesic trajectories, where they are ideally subjected to the planetary gravitational interactions only. At the transition from locked to free fall, the release phase will ensure a TM residual momentum low enough to allow the electrostatic control system to capture and control it, avoiding its collision with the surrounding electrode housing walls. For this reason, TM residual velocity requirements are set to 15 μm s−1 and 500 μrad s−1 for linear angular components, representing one of the key engineering challenges of the LISA mission.
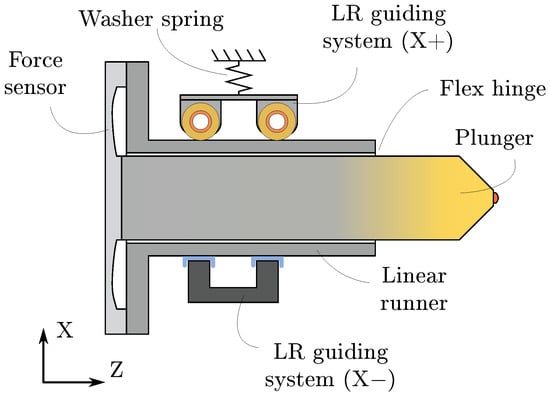
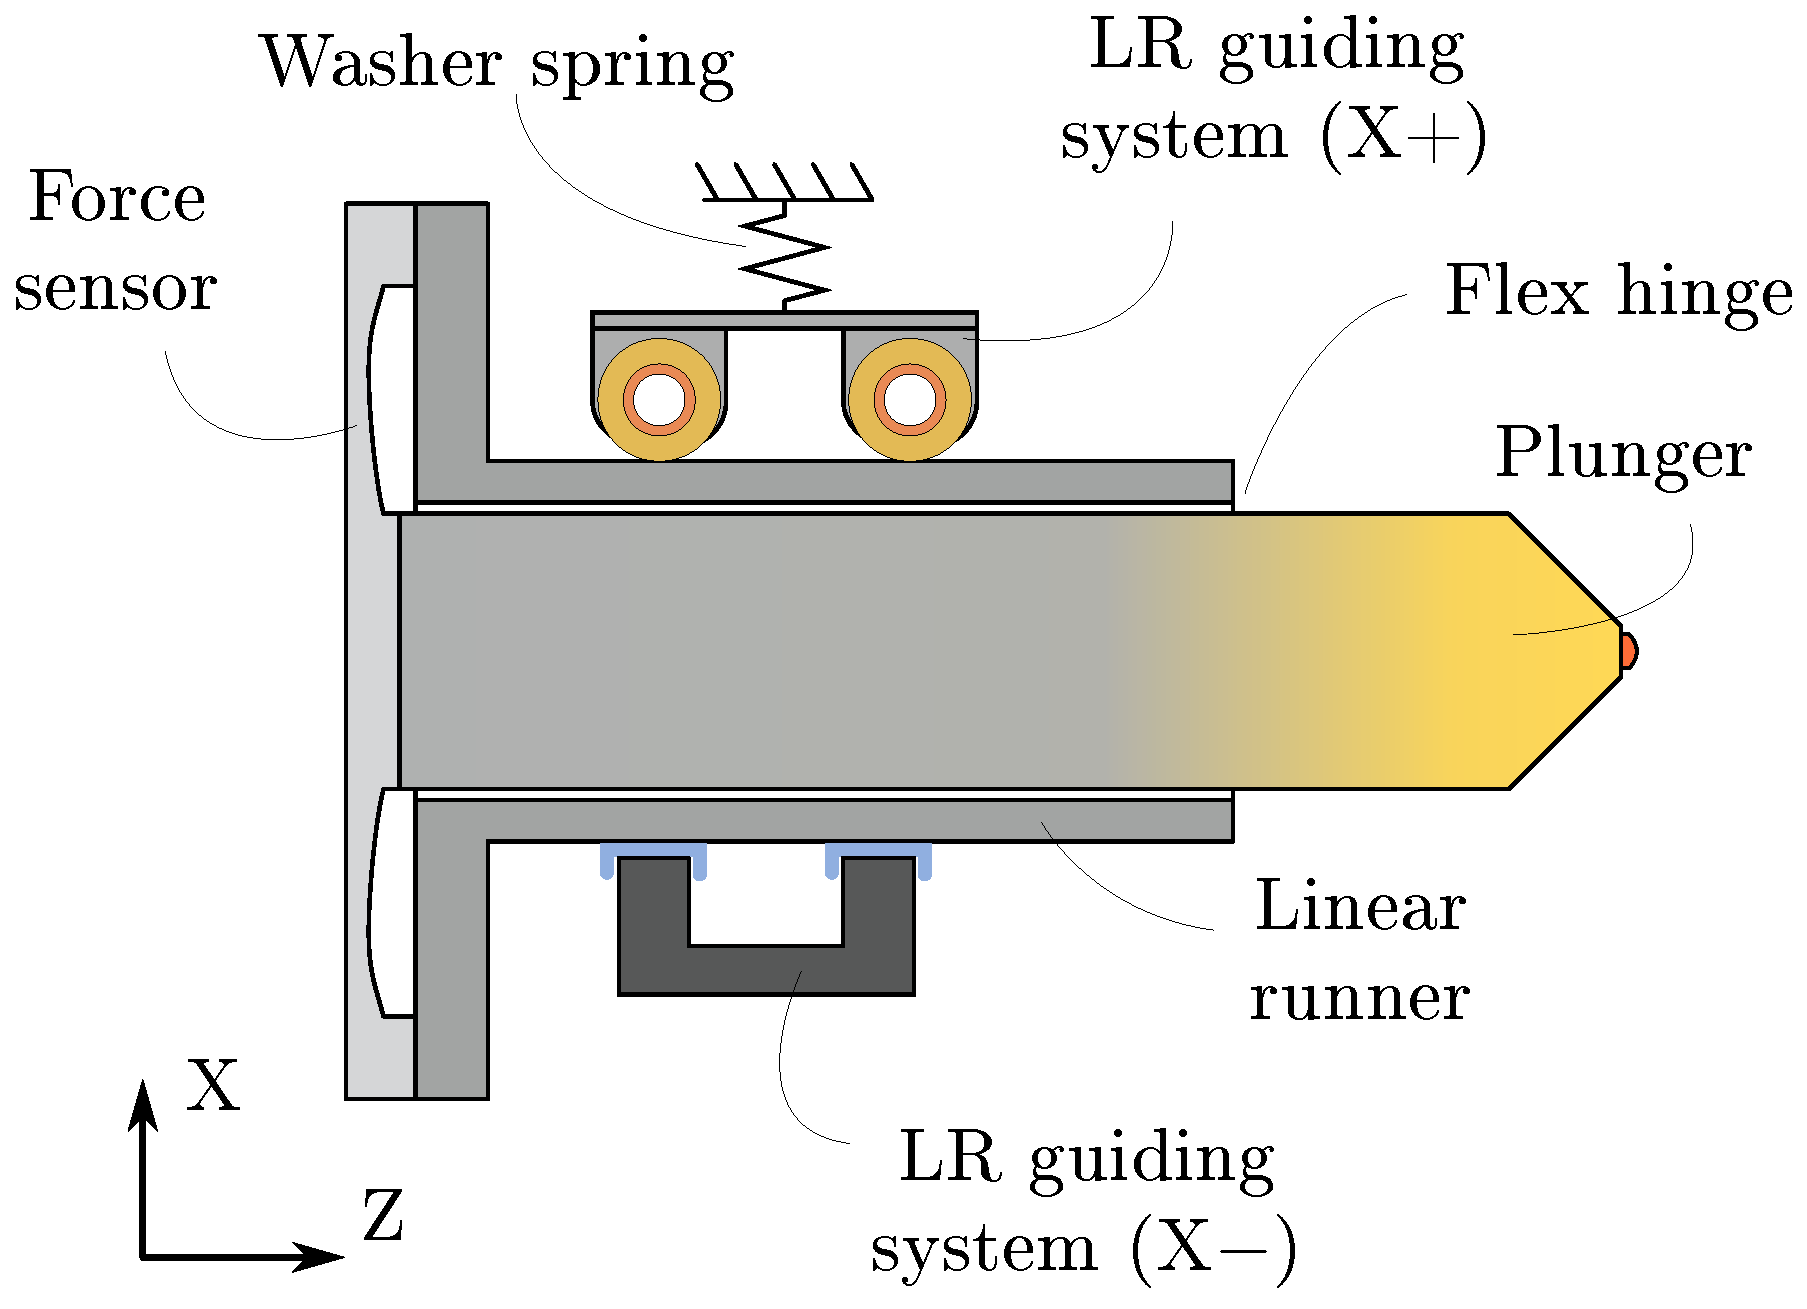
A caging mechanism [7] is designed to secure the TM within the electrode housing during the high-acceleration launch environment throughout the spacecraft’s ascent and orbit commissioning phases. However, the large preload force, together with the associated adhesion and fretting phenomena at the mechanical interfaces with the TM, limits the achievable release performance. As a result, the stringent requirements on TM position and residual velocity cannot be met without the adoption of a release mechanism. Although release mechanisms are widely employed in launch operations and in the separation of payloads and structural components ([8,9,10,11]), a dedicated release mechanism is designed for LISA. This mechanism is referred to as the Grabbing, Positioning, and Release Mechanism (GPRM, [12,13]), and is composed of two nearly symmetric units at the two opposite sides of each TM. A schematic representation of a section view of a single GPRM unit is reported in Figure 1.
Figure 1.
Schematic representation of the section view of a single unit of the LPF GPRM flight model (FM). The figure shows the main structural and functional elements of the mechanism. The linear runner guiding system is made of a fixed slider guide (X− side of the runner) and a roller guide (X+ side of the runner), preloaded by a washer spring. A piezo-walker motor acts on the linear runner (LR) on the plane orthogonal to the section, and it is not reported in the figure.
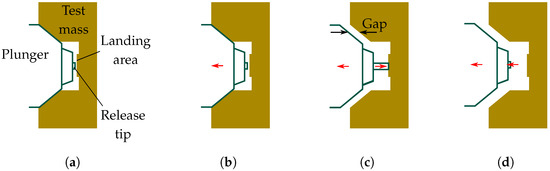
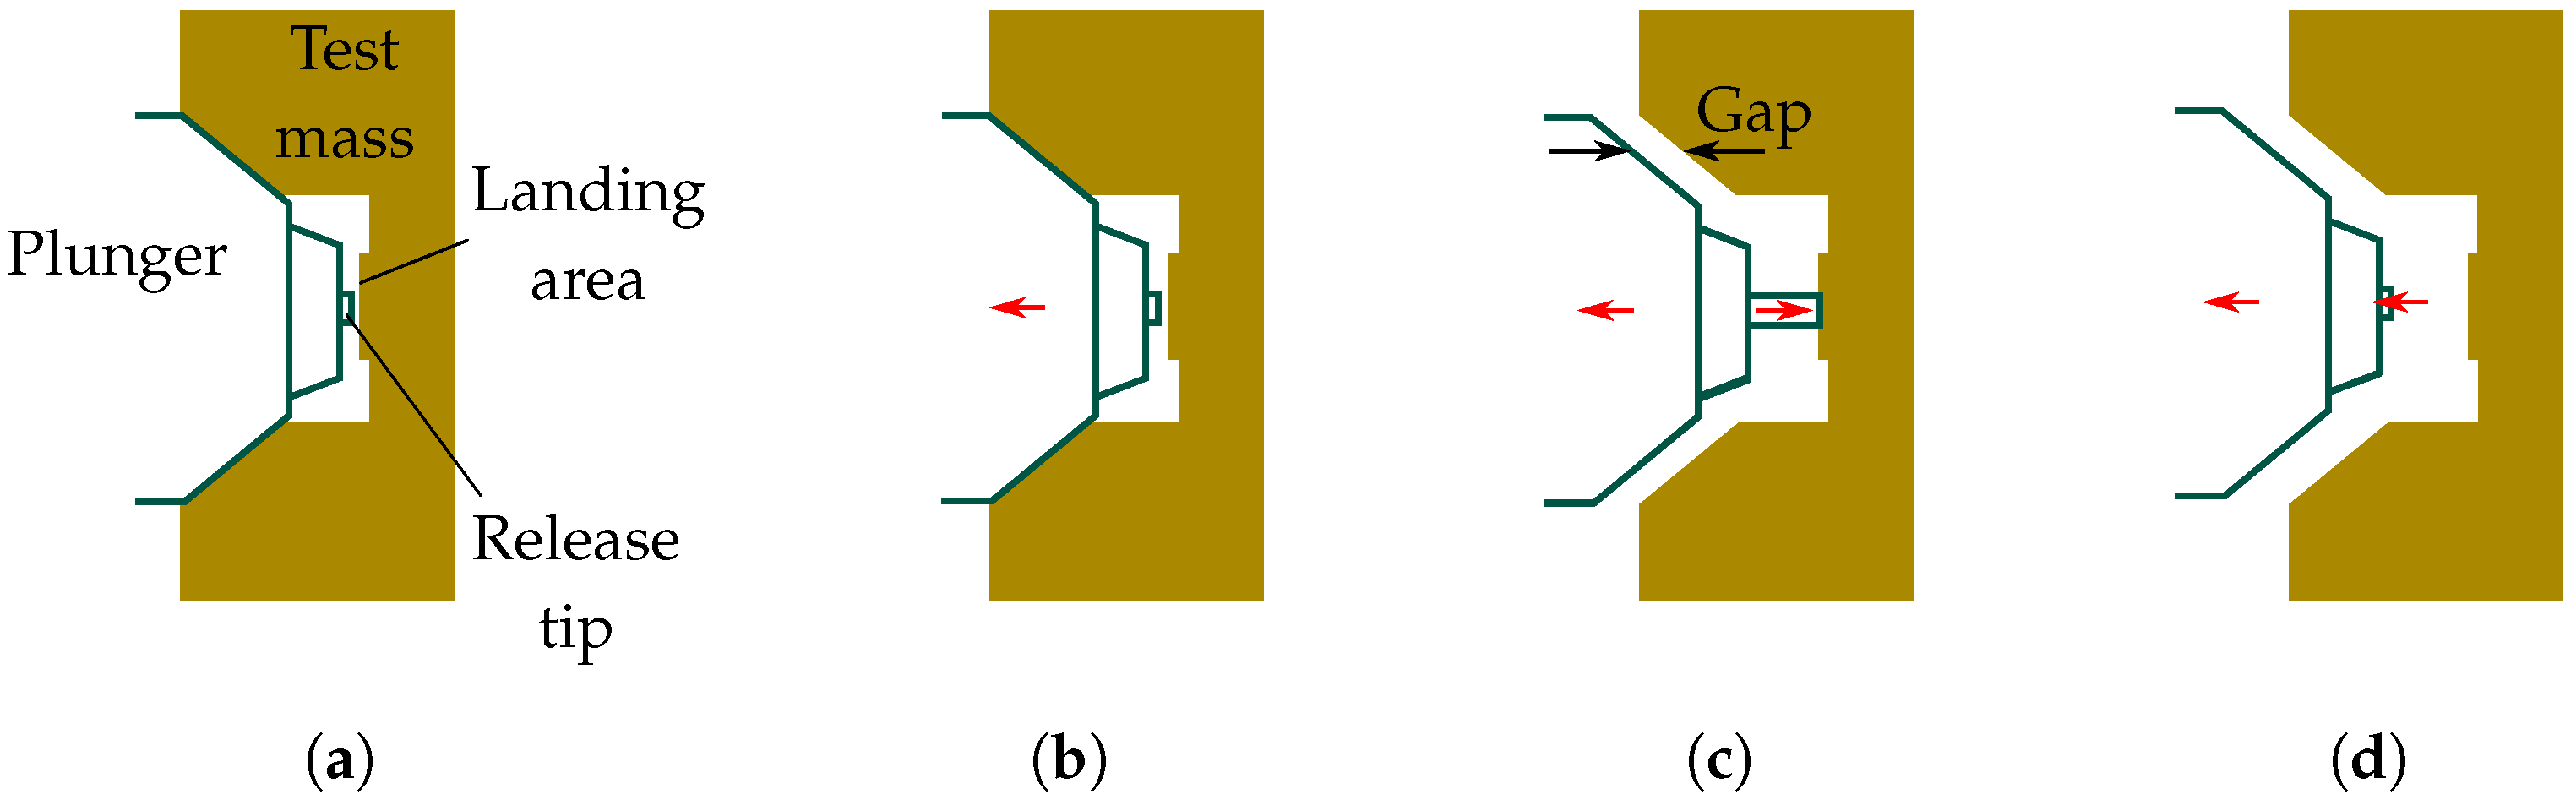
The GPRM is a reusable mechanism, able to grab the TM, reposition it at the center of its enclosure, and release it into free fall. The strict residual velocity requirements are achieved by means of a precise dynamic release procedure (see Figure 2), defined to minimize the transferred momentum to the mass. When the TM is grabbed, the main mechanism end effectors, called plungers (one for each unit), fit on dedicated indentations machined on the TM surfaces. The plunger heads and the corresponding indentations are designed to ensure proper alignment of the TM with the plunger axis. The plunger is attached to a linear runner (LR) by means of flexures. The runner is actuated by a piezo-walker motor, acting on the YZ plane (out-of-plane in Figure 1), and constrained on the XZ plane by a guiding system. The repositioning is performed by a coordinated and opposed motion of the plungers, leading to a translation of the TM along the Z-axis. Once the TM is positioned and held by the plungers, centered in its housing with the nominal preload force, the nominal release procedure begins (Figure 2a). The release procedure follows a dynamic strategy, executed in three sequential steps. First, the preload exerted to the TM by the plunger is reduced by retracting the LR (Figure 2b) while maintaining the plungers in contact with the TM. Second, a voltage-controlled, gold-coated tip is independently actuated and extended from the plunger head along the axial direction, touching the TM in a dedicated surface. After contact is established, further extension of the tip causes the plunger to retract, ideally maintaining a constant preload on the TM (Figure 2c). This phase, called handover, switches the contact with the TM from the plunger head to the tip, with a reduced and controlled final contact area between the TM and the mechanism. Due to the limited stroke of the tip (18 μm), a micrometric gap remains between the plunger head and the TM at the end of the handover phase. Third, the two tips are quickly and simultaneously retracted at the two sides of the TM (Figure 2d), and the plungers are retracted and moved away from the TM. The resulting TM dynamics at the release is one-dimensional, since it is expected to involve only a residual velocity along the Z-axis, produced by asymmetries in the tips’ retraction time histories and in the TM-tips’ adhesive bonds. Indeed, the space environment is characterized by adhesion-sensitive conditions [14,15], which may affect the functionality of space mechanisms [16,17,18]. For this reason, adhesion at the interface between the tip and the TM is expected to be a critical factor for the GPRM performance.
Figure 2.
Nominal LPF TM release procedure (not to scale). Red arrows highlight the motion of the mechanism components during the different phases of the release procedure. In (a), the plunger engages the TM on a dedicated indentation (grabbing). (b) Represents the force-relaxation step: the LR retracts reducing the preload force on the TM, without loosing contact. (c) Illustrates the handover phase: the contact with the TM is switched to the tip by a coordinated extension of the tip and retraction of the plunger. (d) Shows the tip (and plunger) retraction, corresponding to the TM release.
Given the stringent requirements set on the release velocity and the technical challenges associated with LISA, a demonstration mission, called LISA Pathfinder (LPF, [7,19,20]), was flown to test key technologies and improve their readiness level. LPF consisted of a single interferometric arm of LISA shrunk to 30 to fit within a single spacecraft. In this configuration, LPF was not sensitive to gravitational waves. However, it was able to characterize the acceleration noise budget between the two TMs at the two ends of the interferometric arm, which constituted the main scientific result of the mission functional to the LISA design. The scientific results of LPF outperformed the mission requirements, satisfying the stringent free-falling purity requirements set for LISA [19].
Despite its considerable success, LPF highlighted shortcomings in the GPRM dynamic performance. In particular, the GPRM was not able to release the TM according to the nominal procedure and in compliance with the mission’s requirements [21]. Even if dedicated ground-based testing campaigns demonstrated that the TM release velocity requirements should be met in at least 96% of releases [22], some anomalies were observed according to the mission’s telemetry data. Specifically, for the majority of in-flight releases, none of the linear or rotational TM velocity components met the requirements, indicating that the actual in-flight dynamics deviated from the expected one-dimensional release. Therefore, an extended dedicated testing campaign was conducted at the conclusion of the nominal mission phase, exploring alternative release strategies. The analysis of telemetry data from these tests, combined with dedicated on-ground experiments, demonstrated that the non-compliant velocities are caused by impacts between the plungers and the TM during release [23,24].
The likely cause of the impact is the reduction in the micrometric clearance between the TM and the main end effector (plunger) prior to release. Under nominal conditions, the 18 μm extension of the release tip during the handover phase should provide sufficient separation to prevent any impact between the plunger and the TM during the tip retraction. However, erosion of this clearance can lead to unintended contacts during release. Many factors could erode the gap, such as misalignment between the units [25], causing impacts triggered by the mechanism vibration at the impulsive retraction of the tip. Another relevant source of the gap erosion is linked to a non-rectilinear motion of the plunger [26]. This behavior is attributed to a non-symmetric guiding system, which generates unbalanced friction forces on the two sides of the runner during the transient phase associated with the reversal of LR motion. For LPF (see Figure 1), the guiding system was made of a fixed slider guide on one side (X−) and a pair of rollers on the other side (X+), preloaded to the runner by a washer spring. When the direction of the runner motion is reversed, the forces between the runner and guiding systems evolve differently at the two runners’ sides, producing an LR rotation around the Y-axis. Since the plunger is attached to the runner, the effect is a non-rectilinear motion (in X direction) of the plunger head, potentially affecting the gap with the TM.
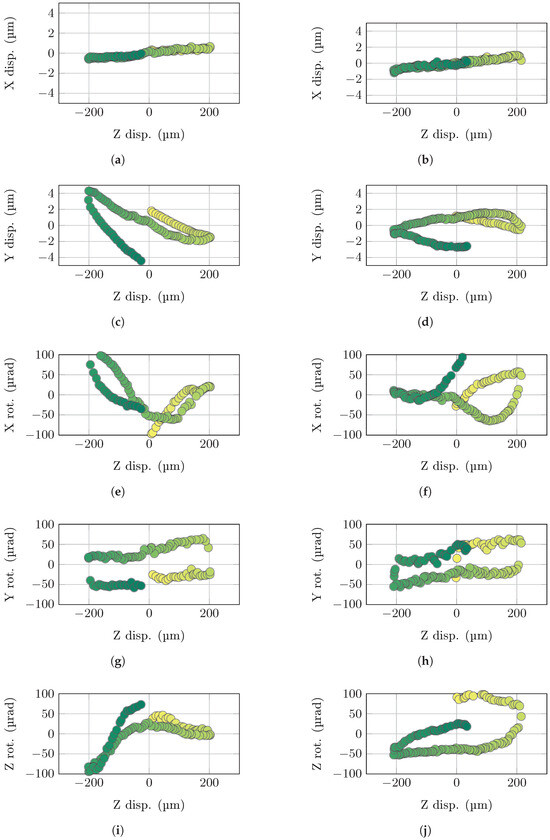
During the extended mission phase, TM repositioning tests were performed, consisting in repositioning the TM along Z in the range from −200 to 200 μm [21,26]. Telemetry of both TMs during a repositioning test is reported in Figure 3. No particular patterns can be recognized in most of the TM degrees of freedom, except for TM X displacement and Y rotation, whose results are similar for the two TMs. In particular, no effects are observed in the TM X position. The TM rotation around Y, instead, suddenly switches between two levels, when the direction of the motion is reversed. Considering that the TM is handled by the plungers, the inversion of the TM motion produces opposed displacements of the two plungers’ heads, nearly compensating each other in the overall X-displacement of the TM, but producing the observed Y rotation. The approximately linear drift observed in the X displacement and Y rotation is explained by the imperfect alignment of the GPRM reference frame with respect to that of the housing’s sensing electrodes. This results in measurement drift due to cross-talk with the TM’s actual Z displacement.
Figure 3.
TMs’ states during LPF in-flight repositioning tests, as a function of the TM Z displacement inside the housing: on the left for TM1 (a,c,e,g,i) and on the right for TM2 (b,d,f,h,j). (a,b) show the X displacement of the TM. (c,d) show the Y displacement of the TM. (e,f) show the TMs’ rotation around X. (g,h) show the TMs’ rotation around Y. (i,j) show the TMs’ rotation around Z. The color code refers to the time: lighter points come earlier in time.
The other TM degrees of freedom, instead, are not subject to this behavior. For this reason, they are not considered in the following analyses. However, a possible interpretation for the large TM displacement in Y and rotation around X and Z can be the TM settlement on the plungers. As demonstrated in [21], the grabbing process can lead to a non-perfect fit of the plungers inside the TM indent. During TM repositioning, the plungers can settle more accurately into the indentations, thereby aligning the TM with the mechanism reference. This can result in significant variations in the system’s degrees of freedom, compatible with the one reported in Figure 3.
In [26], the behavior of the flight mechanism is predicted based on tests performed on its Engineering Qualifying Model (EQM) version. However, the different materials adopted in the EQM and FM side guiding system introduced high uncertainty in the FM model parameters.
The GPRM is undergoing a dedicated redesign for LISA, aimed at improving its functionality. During the redesign phase, two candidate side-guiding concepts are analyzed: one is the LPF FM version of the guiding system, shown in Figure 1, and the other is a more symmetric structure, involving rollers on both sides of the runner.
These two solutions are analyzed by using finite element (FE) and multi-body software tools. Moreover, they are embedded in a breadboard model (BBM) of the mechanism, developed by OHB-Italia and tested at the University of Trento, with the support of the National Institute for Nuclear Physics (INFN).
The BBM allows for testing both the guiding system configurations, giving a direct comparison between the two alternatives. In addition, the BBM tests fill the lack of tests for the LPF FM configuration, improving the understanding of the flight mechanism behavior.
In the present work, the tests performed on the BBM are summarized. The multi-body and FE models are correlated to the experimental data by estimating the main mechanism’s parameters. Then, the results of the BBM models are extended to the flight case, reproducing the LPF telemetry data during the TM repositioning tests and giving relevant insight for the mechanism behavior in LISA. Finally, the results of both test and simulation activities are exploited to select the baseline for the side guiding configuration in LISA.
2. Mechanism Ground Testing: The BBM
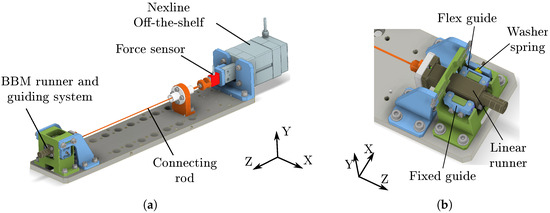
The GPRM BBM is designed to reproduce the main features of the mechanism and to test the behavior of the guiding system. It remains modular, allowing easy modification of the guiding system to test two alternative configurations. The first configuration replicates the flight version of the LPF GPRM. It consists of a two-cup slider on one side of the LR and a pair of rollers on the opposite side. For this reason, it is referred to as the slider–roller configuration. The second configuration features rollers on both sides of the runner and is therefore referred to as the roller–roller configuration. Figure 4 and Figure 5 show the CAD model and the actual BBM: in particular, the section view in Figure 4b highlights the guiding system in the roller–roller configuration. Unlike the EQM and FM, in the BBM, the LR is not directly actuated by the piezo-walker motor. Instead, it is connected through a flexible rod to an off-the-shelf Nexline piezo-stepping motor, produced by Physik Instrumente (PI).
Figure 4.
CAD model of the GPRM BBM in the roller–roller configuration. In (a), the overall assembly of the mechanism is shown. The commercial off-the-shelf Nexline actuator can be seen on the right part of the figure. The rod connects the Nexline runner to the BBM LR. In (b), a magnified view of the mechanism is sectioned to highlight the guiding system and the linear runner.
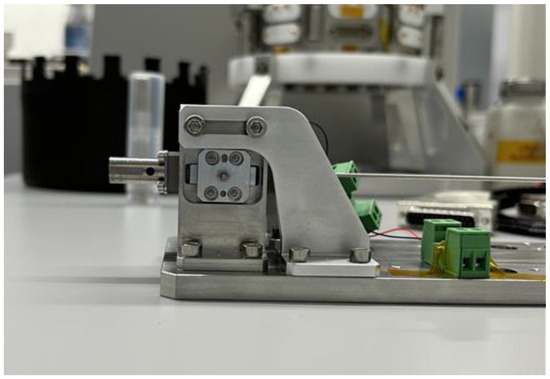
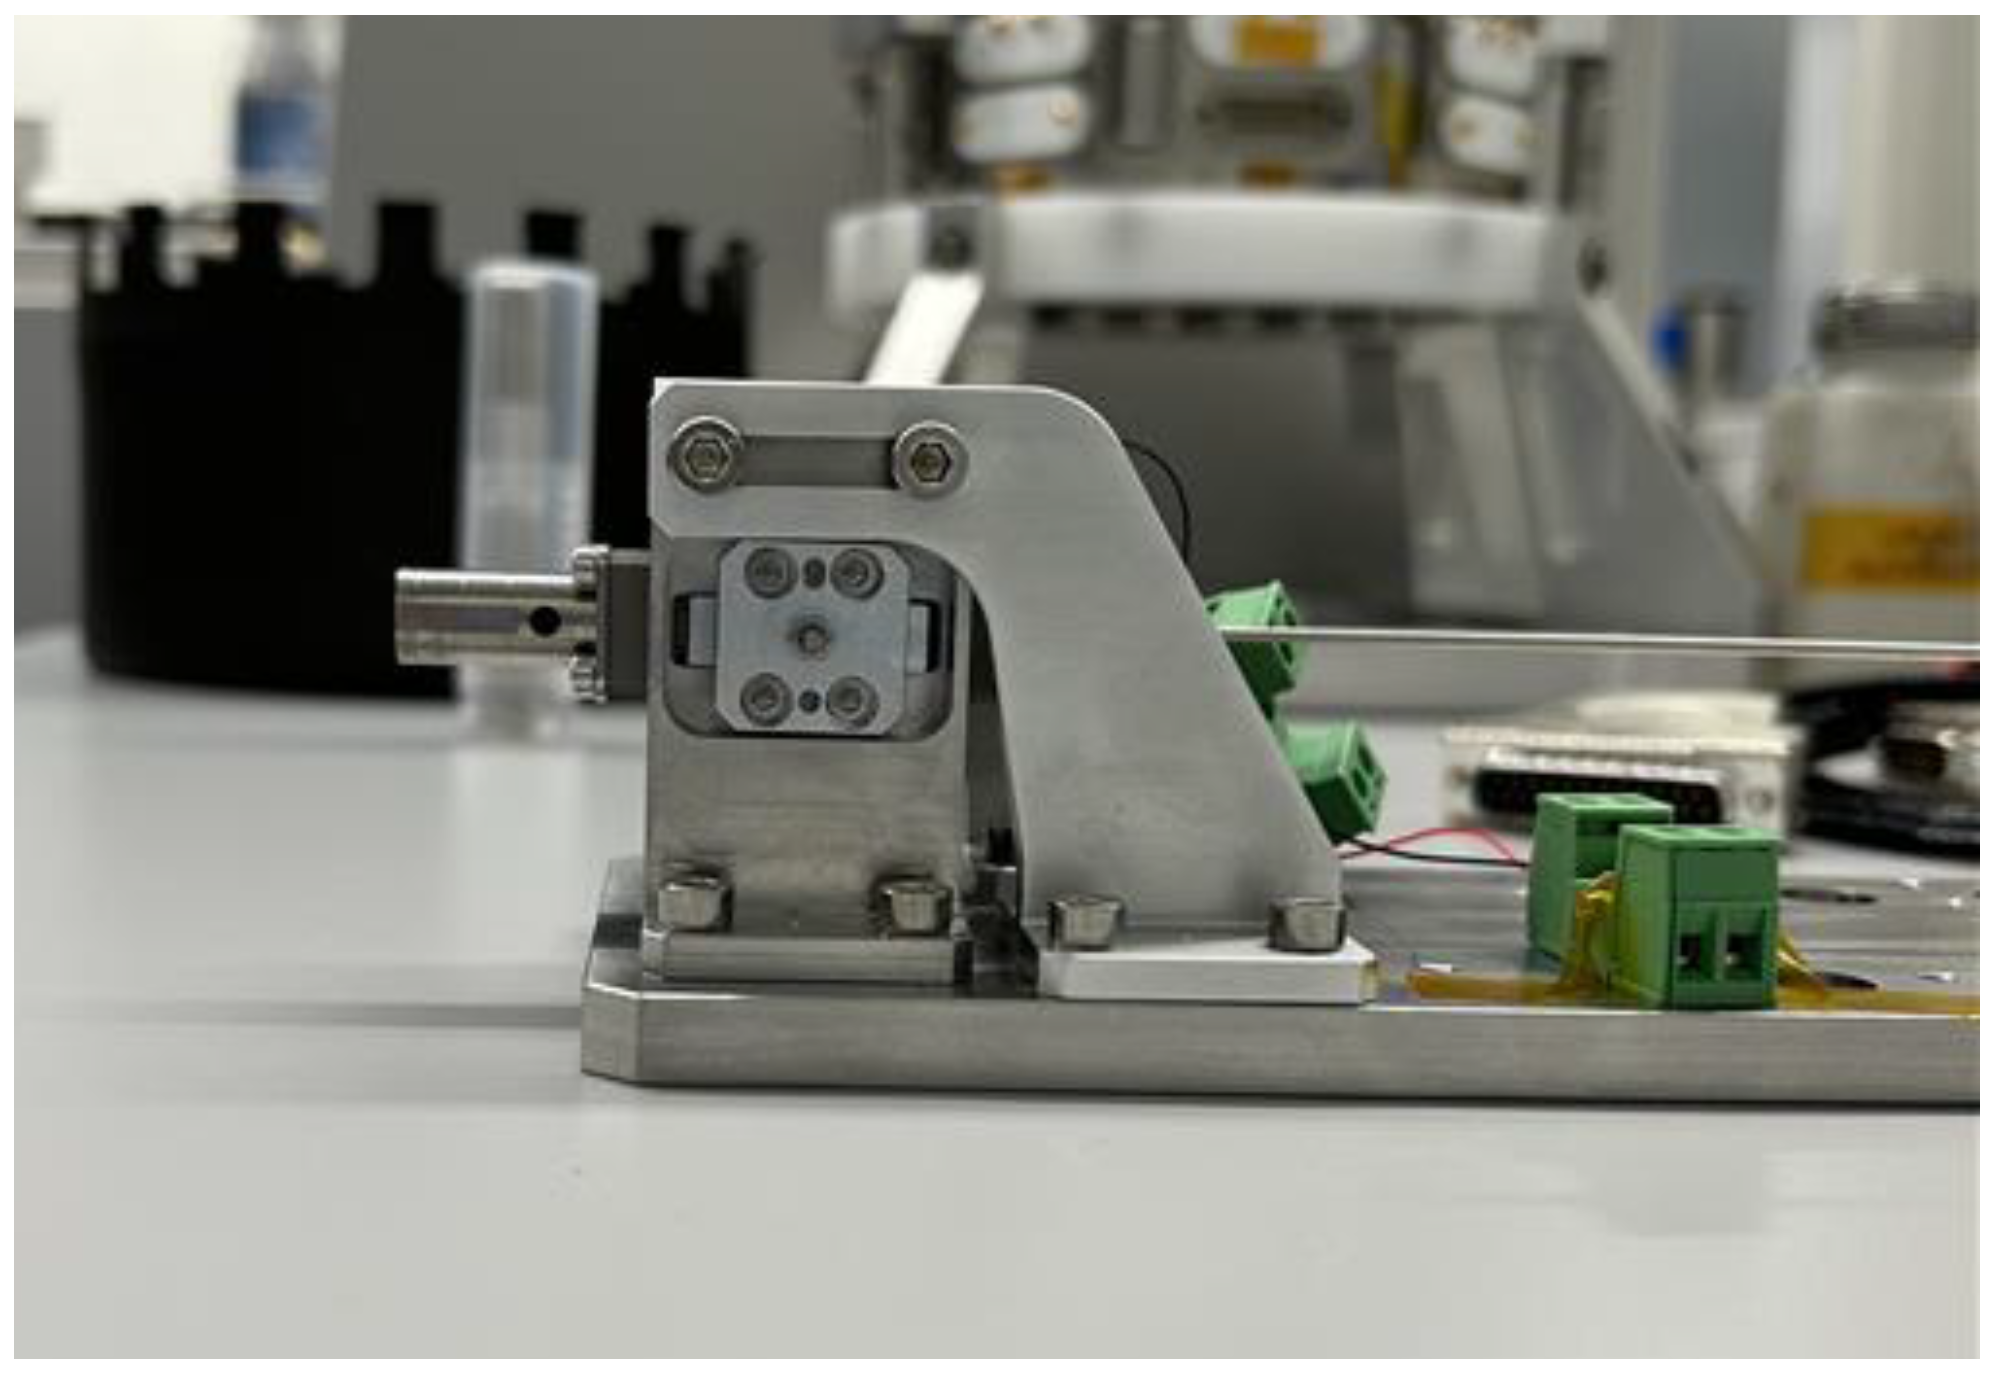
Figure 5.
The image shows part of the LISA GPRM breadboard, integrated in the OHB-Italia facility. The piezo-electric stepper motor is not included in the image.
The rod is designed to transfer the axial displacement from the actuator to the mechanism linear runner by producing a negligible action in the lateral direction, also in the presence of lateral misalignment. In this way, the contribution of the plunger side motion can be fully ascribed to the guiding system.
The actual GPRM structure embeds the piezo-walker motor in its frame, acting directly on the LR in the YZ plane. The actuator offers a guiding action also in the plane orthogonal to the guiding system, which disappears for the BBM. However, the YZ guiding is not expected to affect the plunger side motion.
The side-guiding system is mounted on a fixed structure, simulating the GPRM frame. On the X− side of the XZ plane, the guides are fixed to the frame; on the opposite side (X+), the guides are connected to the frame by a washer spring. The spring preloads the guiding system to the LR but introduces flexibility. For this reason, the X+ guide is also called flex-guide, while the X− one is called fixed-guide.
The guiding system configuration can be switched by substituting the fixed guide only, mounting either a fixed slider or a roller guide. The guiding system preload is calibrated in the tests’ preliminary operation, and it is set to and , respectively, for the roller–roller or slider–roller configuration.
The BBM plunger motion is measured by two SIOS laser instruments: a single-beam and a three-beam interferometer are used to acquire the plunger head displacement and rotation during the runner stroke. The commercial laser system allows having all the laser channels synchronized up to a sampling frequency of 2 per channel. However, given the slow velocity at which the system moves, the laser sampling frequency is set to 5 . Additionally, a force sensor is integrated between the connecting rod and the piezo-walker motor to monitor the friction opposing the linear runner movement. The force sensor acquisition is not synchronized with the laser equipment, and it is just used to identify the friction force value.
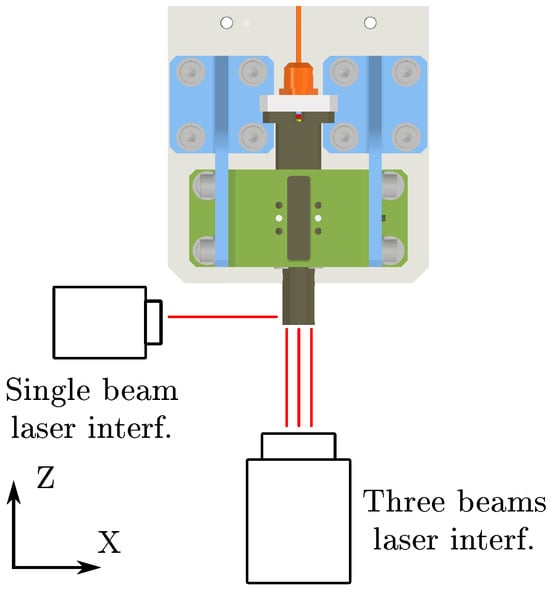
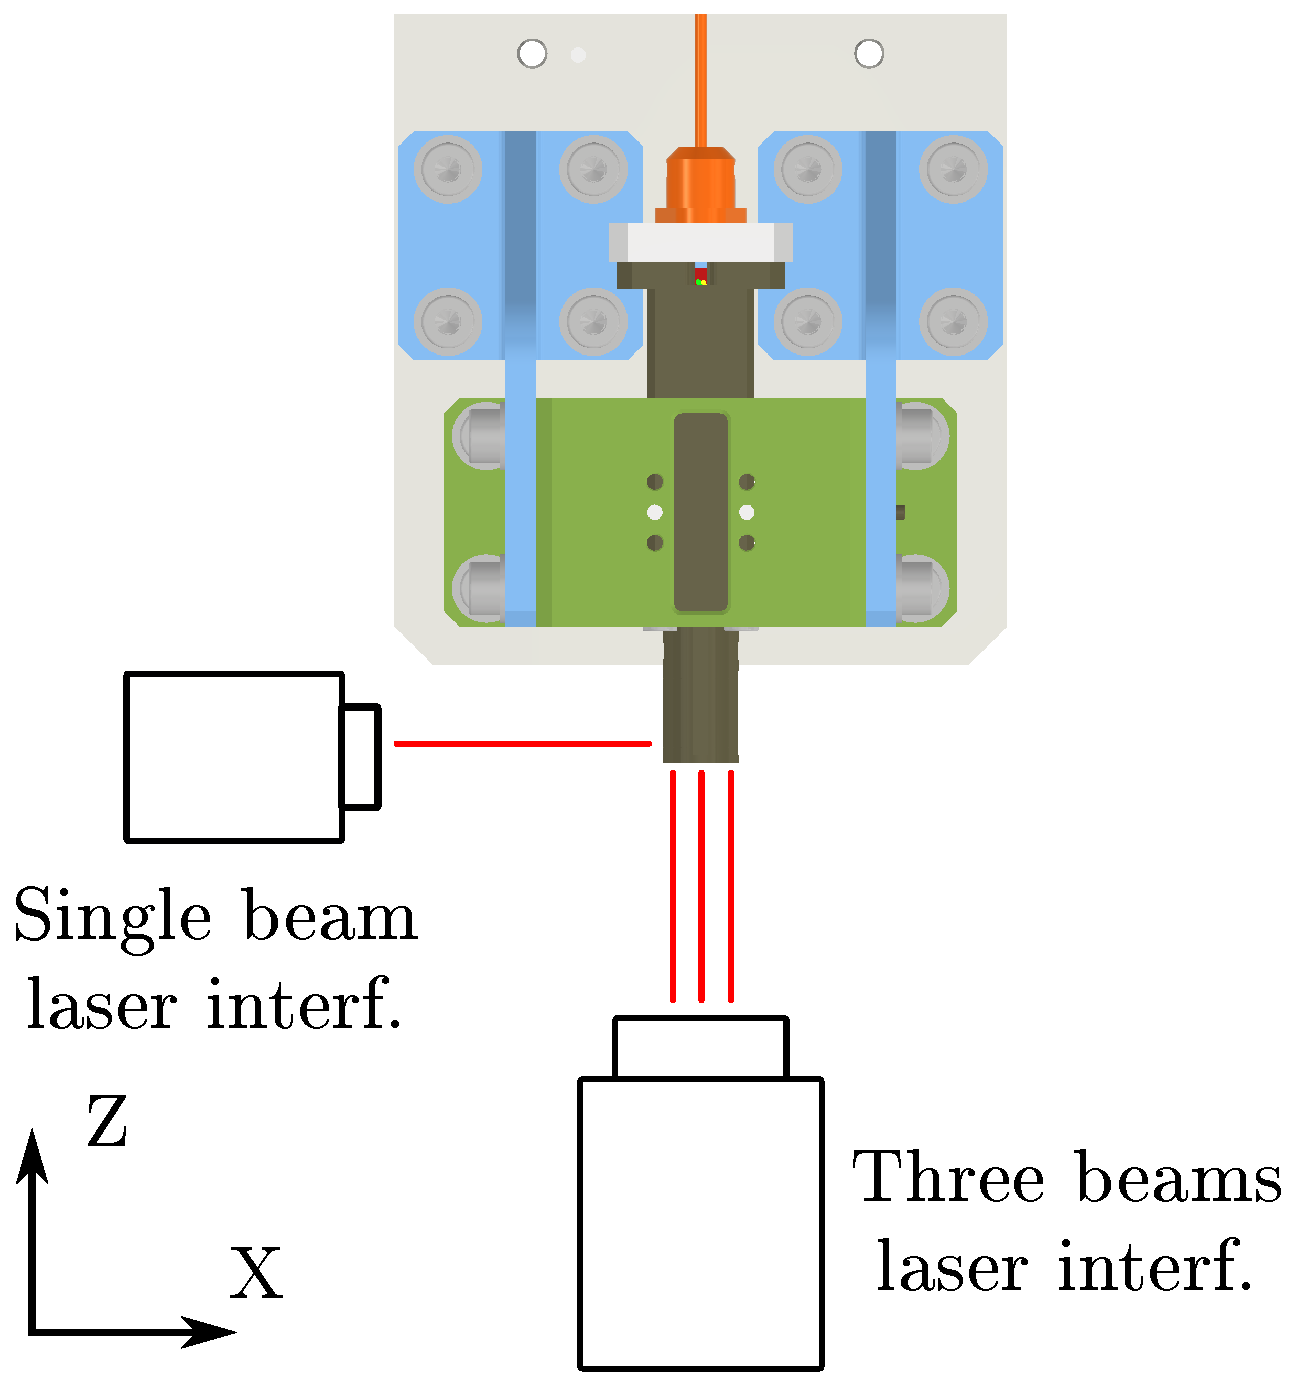
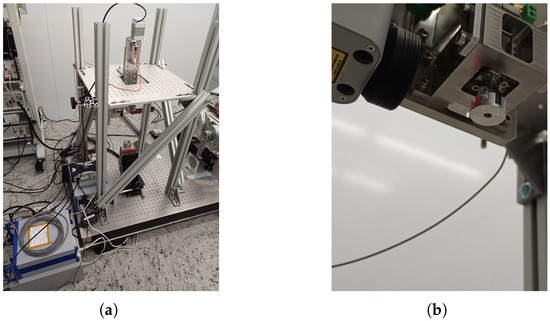
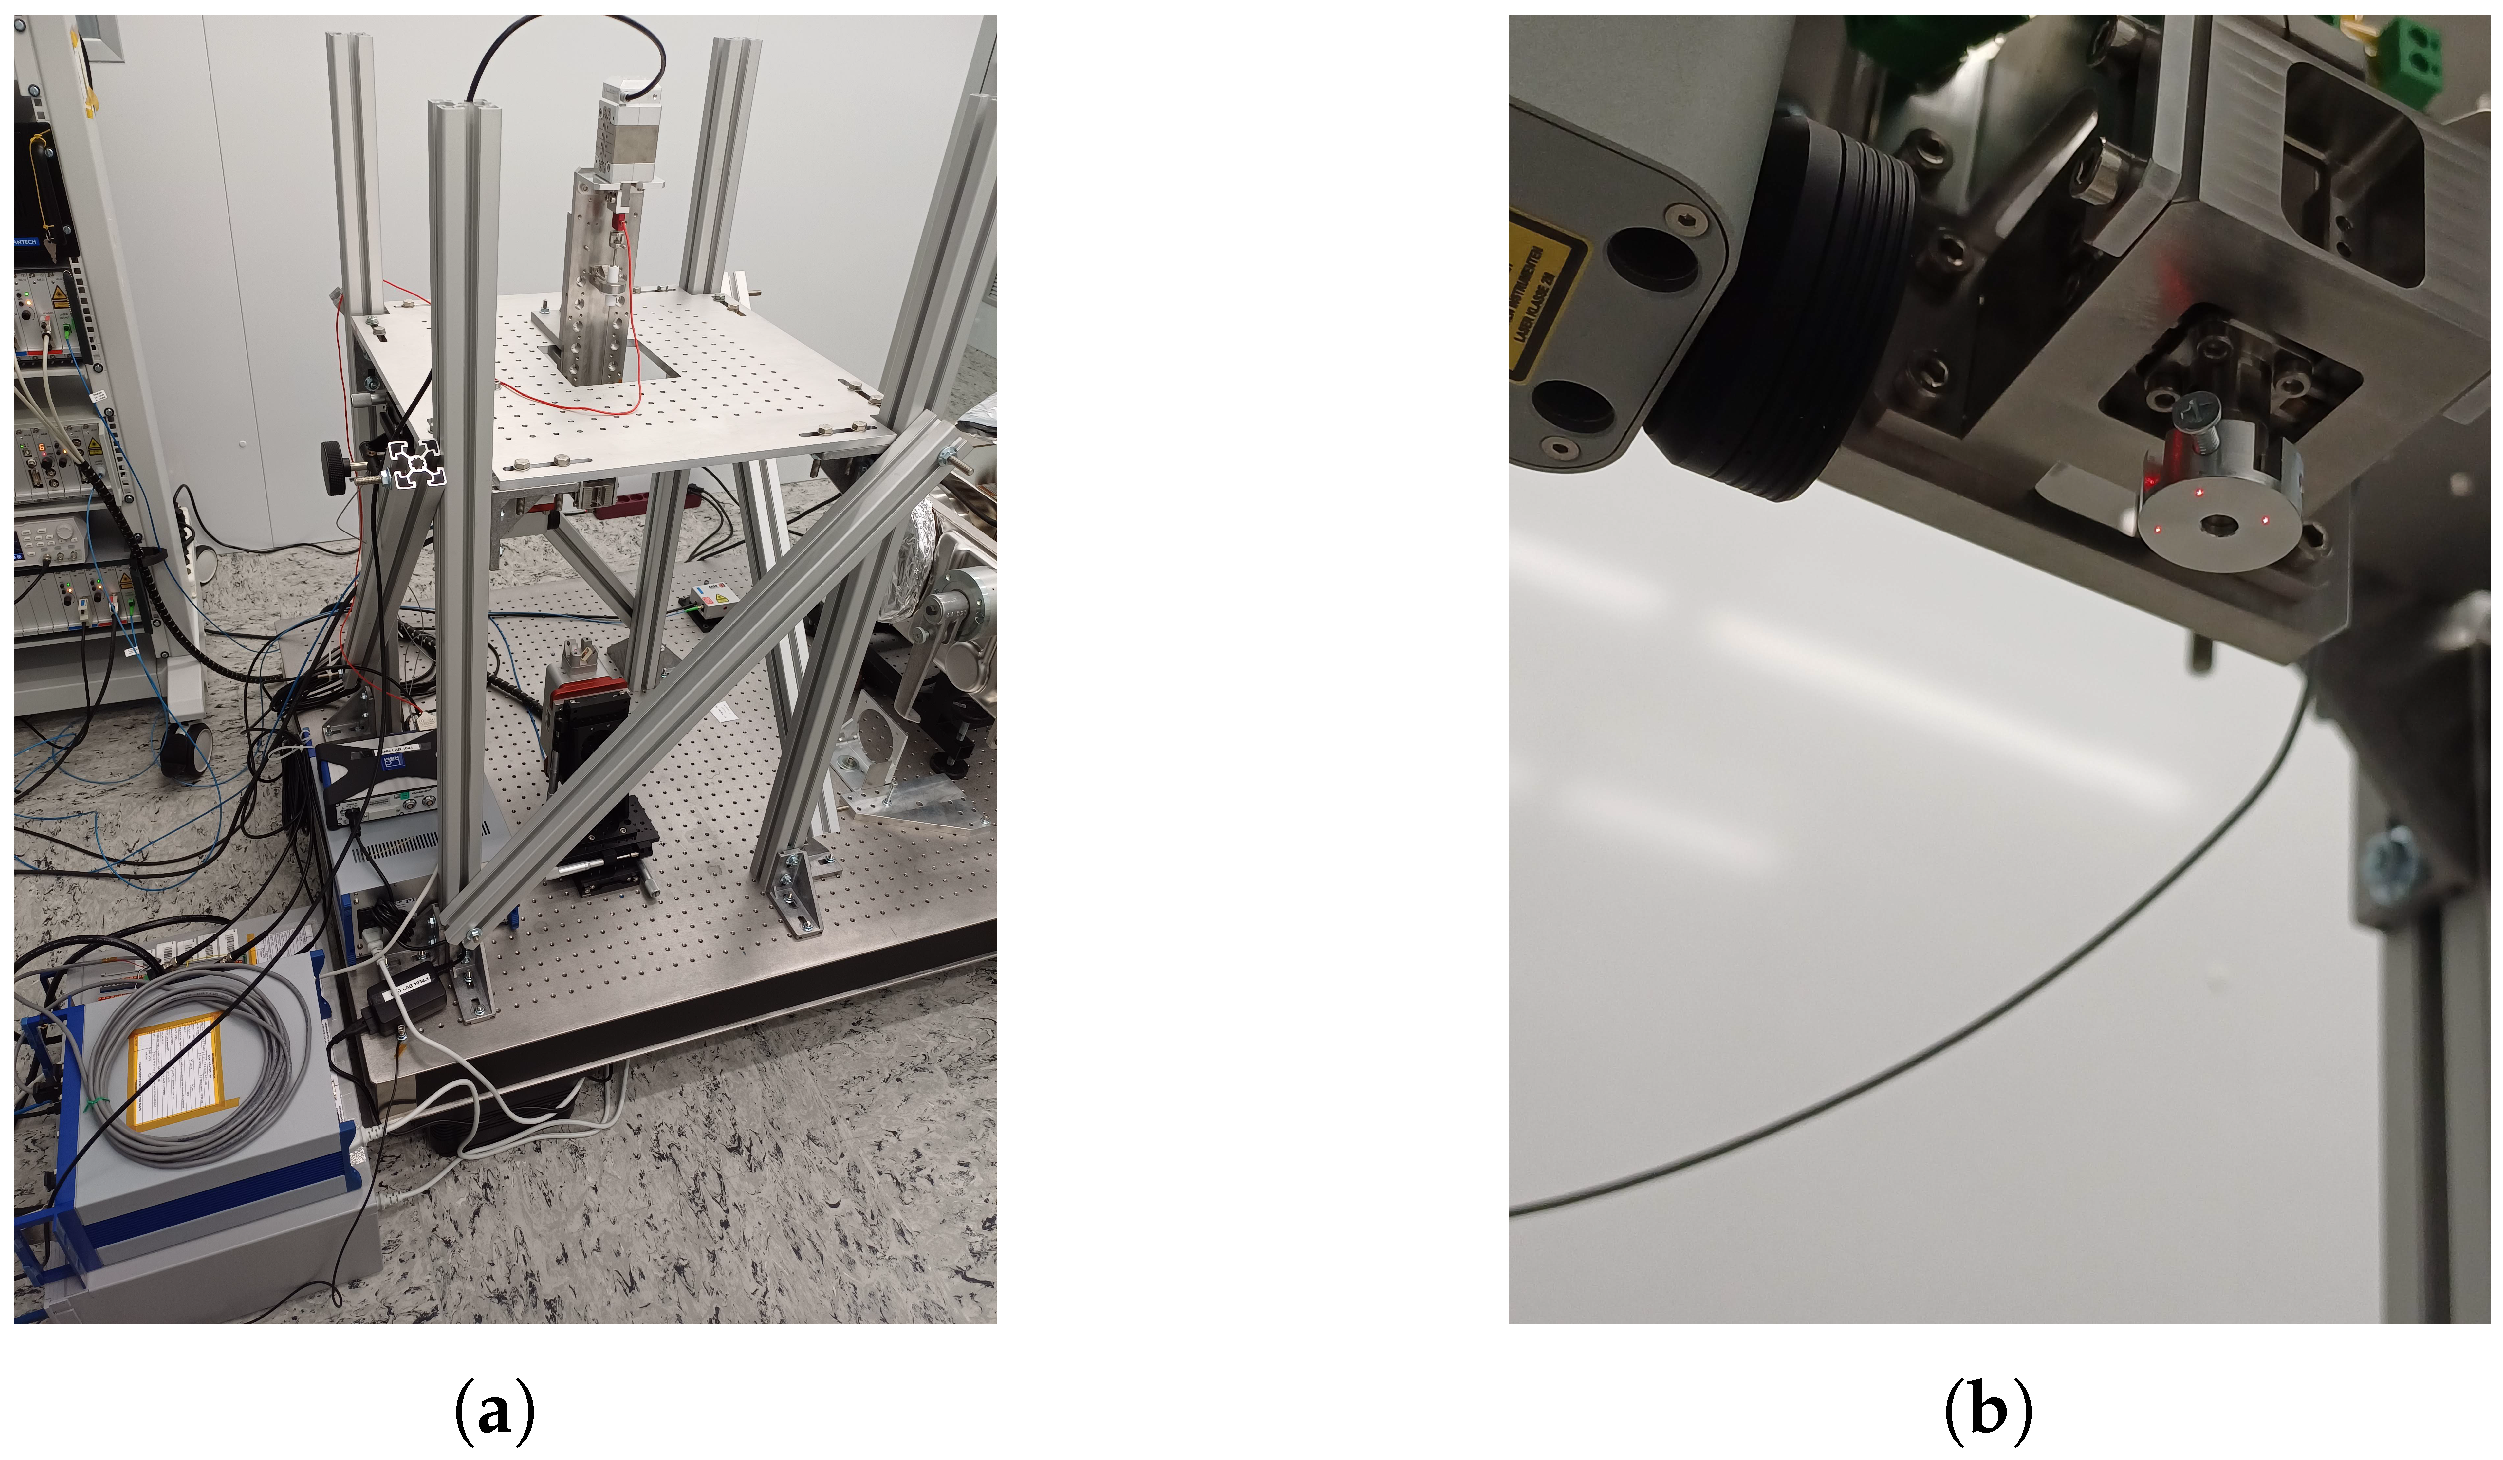
The scheme of the test setup is shown in Figure 6. The mechanism is mounted vertically, with the plunger oriented downwards, inside an ISO 7 cleanroom. The mechanical structure, installed on an anti-vibration platform, accommodates the BBM mechanism. The three-beam interferometer at the base points upwards to the plunger head, while the single-beam interferometer points laterally (in X the direction) to the plunger head. The three-beam laser allows for simultaneously measuring the plunger displacement in the Z direction. Moreover, the laser system supplier provides a calibration sheet to convert the three independent measures, coming from the interferometer beams, to compute also the target rotations around X and Y. The single-beam laser, instead, measures the lateral (X) displacement of the plunger head. The tests are carried out in air by controlling the temperature and humidity (20 °C and 40% humidity). All the mechanism components are cleaned with isopropyl alcohol before being integrated, and handled with nitrile gloves. This avoids having contaminants on the surfaces affecting the friction values. Pictures of the BBM test setup are shown in Figure 7. A reflective mask, visible in Figure 7b, is installed on the plunger head to ensure a correct laser pointing for the three-beam interferometer.
Figure 6.
Scheme of the BBM test setup. A three-beam interferometer is aligned in the axial direction with the plunger to measure its Z displacement and X and Y rotations, while a single-beam interferometer is pointed in the lateral direction at the plunger head to measure its X displacement.
Figure 7.
Pictures of the BBM test setup. In (a), the BBM is installed in the vertical direction on the supporting structure, fixed on top of an anti-vibration platform. In (b), the head of the BBM plunger is shown. The single-beam laser head is pointed in the lateral direction (X), and the three laser spots of the three-beam laser is pointed in the Z direction on a mask, installed on the plunger head.
The most critical in-flight mechanism configuration occurs when the plunger is close to the TM, with the plunger nearly fully extended. For this reason, the BBM tests are designed to investigate this particular configuration.
The BBM Nexline control policy is the same foreseen for the in-flight operation, also adopted for the LPF mechanism. For this reason, the parameters of the actuator’s controller are tuned to have a size of the piezo-walker step of approximately 2 μm and a stepping frequency producing approximately 100 μm s−1 linear runner speed. Additionally, the actuator is controlled in an open loop, as for the custom version of the mechanism used for the flight models of the GPRM. The open loop control policy does not account for the variation of friction force when switching the guiding system configuration. Because the tuning is performed in a roller–roller configuration, the resulting runner stroke—guided by a slider–roller setup—will be reduced (and slowed) due to increased friction that opposes the runner’s motion.
The tests are classified into two main categories: the short-stroke tests and the long-stroke tests. During the short-stroke tests, the linear runner is commanded to move approximately 200 μm in the Z direction, first in extension and then in retraction, recording a complete cycle of the plunger head trajectory. Each test is preceded by a runner motion in the opposite direction to ensure that the BBM response at reversal is captured in both extension and retraction. These tests are performed to adequately characterize the hysteretic behavior observed in the tests of the LPF EQMs [26]. The long-stroke tests are designed to assess the rectilinearity of the plunger head motion. The runner is first commanded to extend until it reaches its maximum extension. Then, it is commanded to move by approximately 7 mm in the retraction direction. Finally, the runner is commanded again in the extension direction to reach the starting position.
During the long-stroke tests, the single-beam interferometer frequently loses the signal due to the limited target surface on the plunger lateral surface. Therefore, only the three-beam interferometer data are used, providing the rotations of the LR around X and Y.
For each test configuration, five complete cycles are acquired, allowing to have five complete repetitions of the same test. At the beginning of each test, a noise run is performed by acquiring the laser data, while the system is not actuated and still. This allows for evaluating the noise floor in the laser interferometer measurement for any configuration. When all the tests are performed for a given configuration, the guiding system is changed. A dedicated jig, similar to a couple of fixed slider guides, clamps the runner in the YZ plane by constraining and centering it. Then, the fixed guide already tested is removed and substituted by the new one. Finally, the jig is removed. This process allows the guiding system to be safely replaced without leaving the runner suspended on the rod. At the same time, it centers the runner within its frame, preventing excessive drift in the Y direction when guidance in that direction is absent.
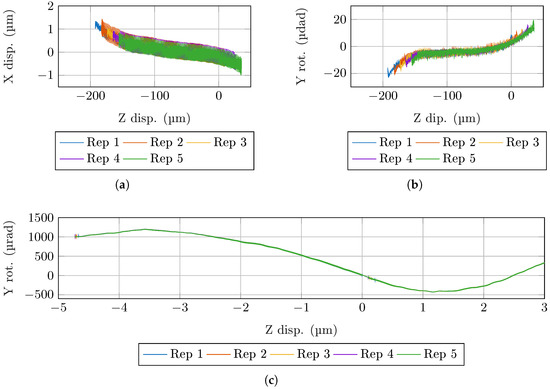
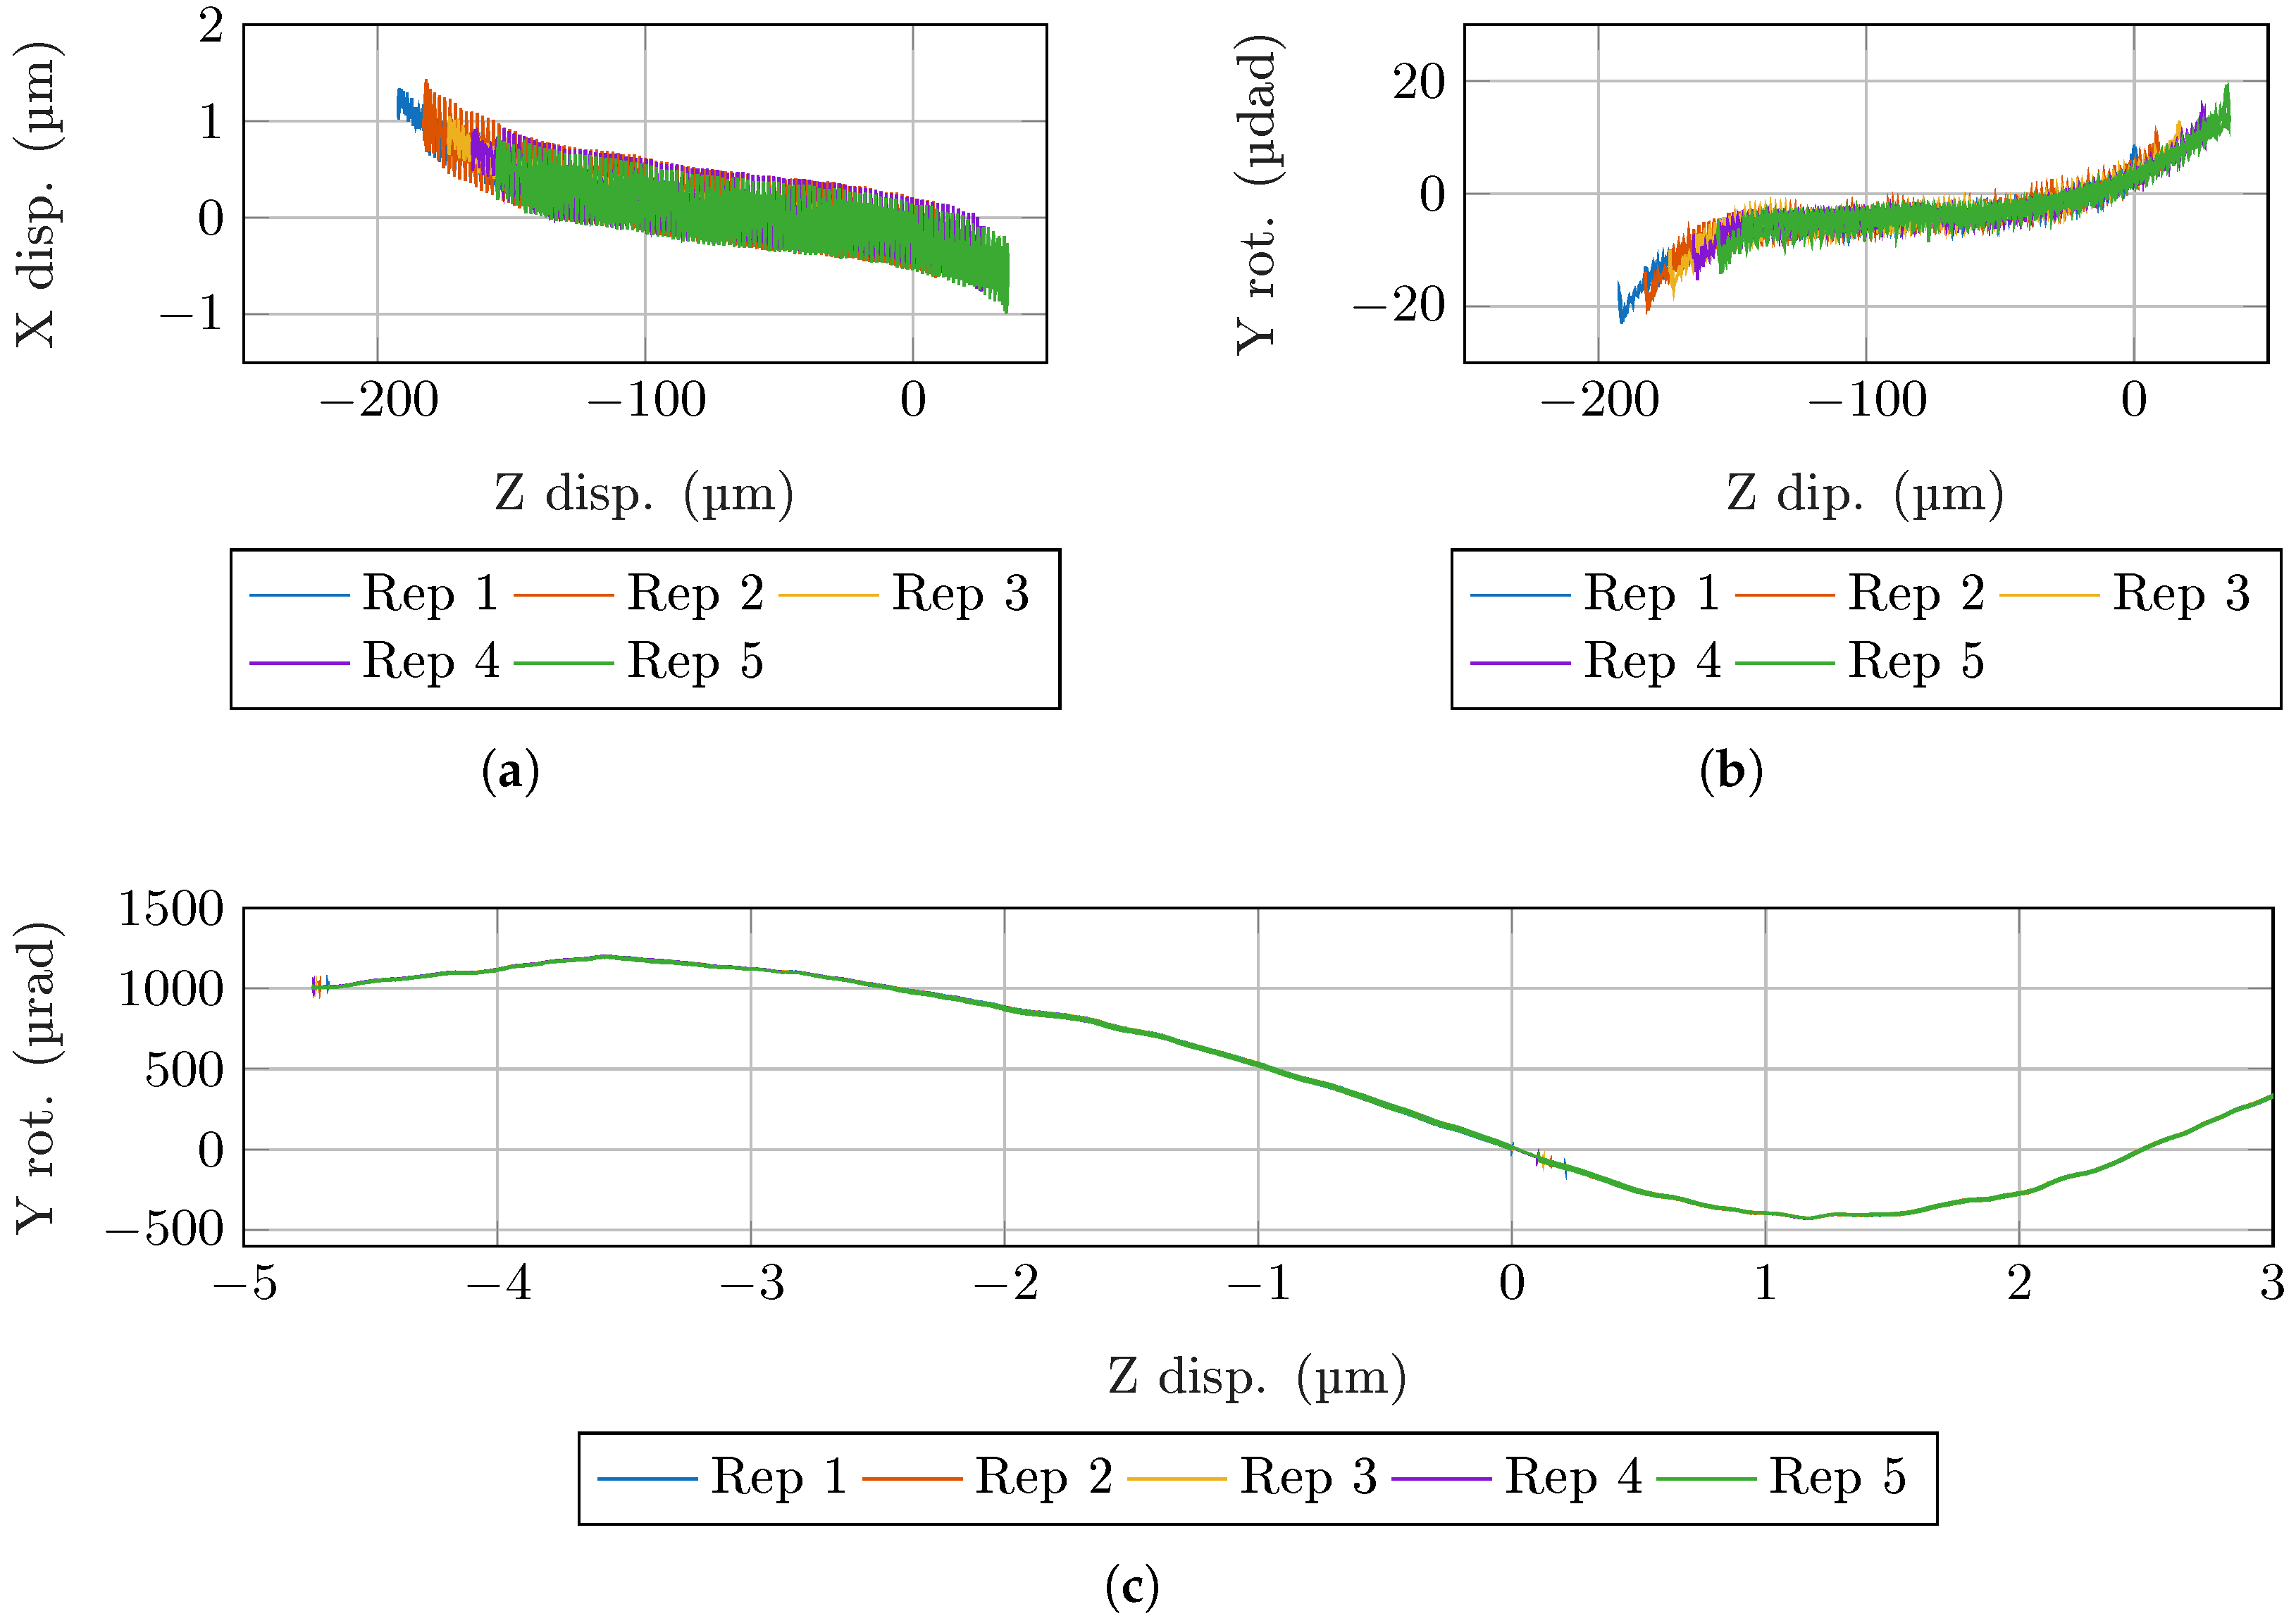
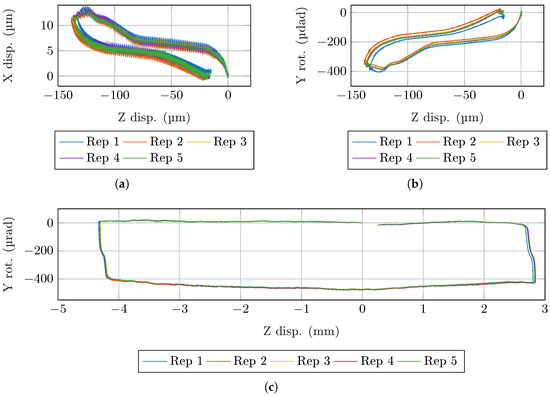
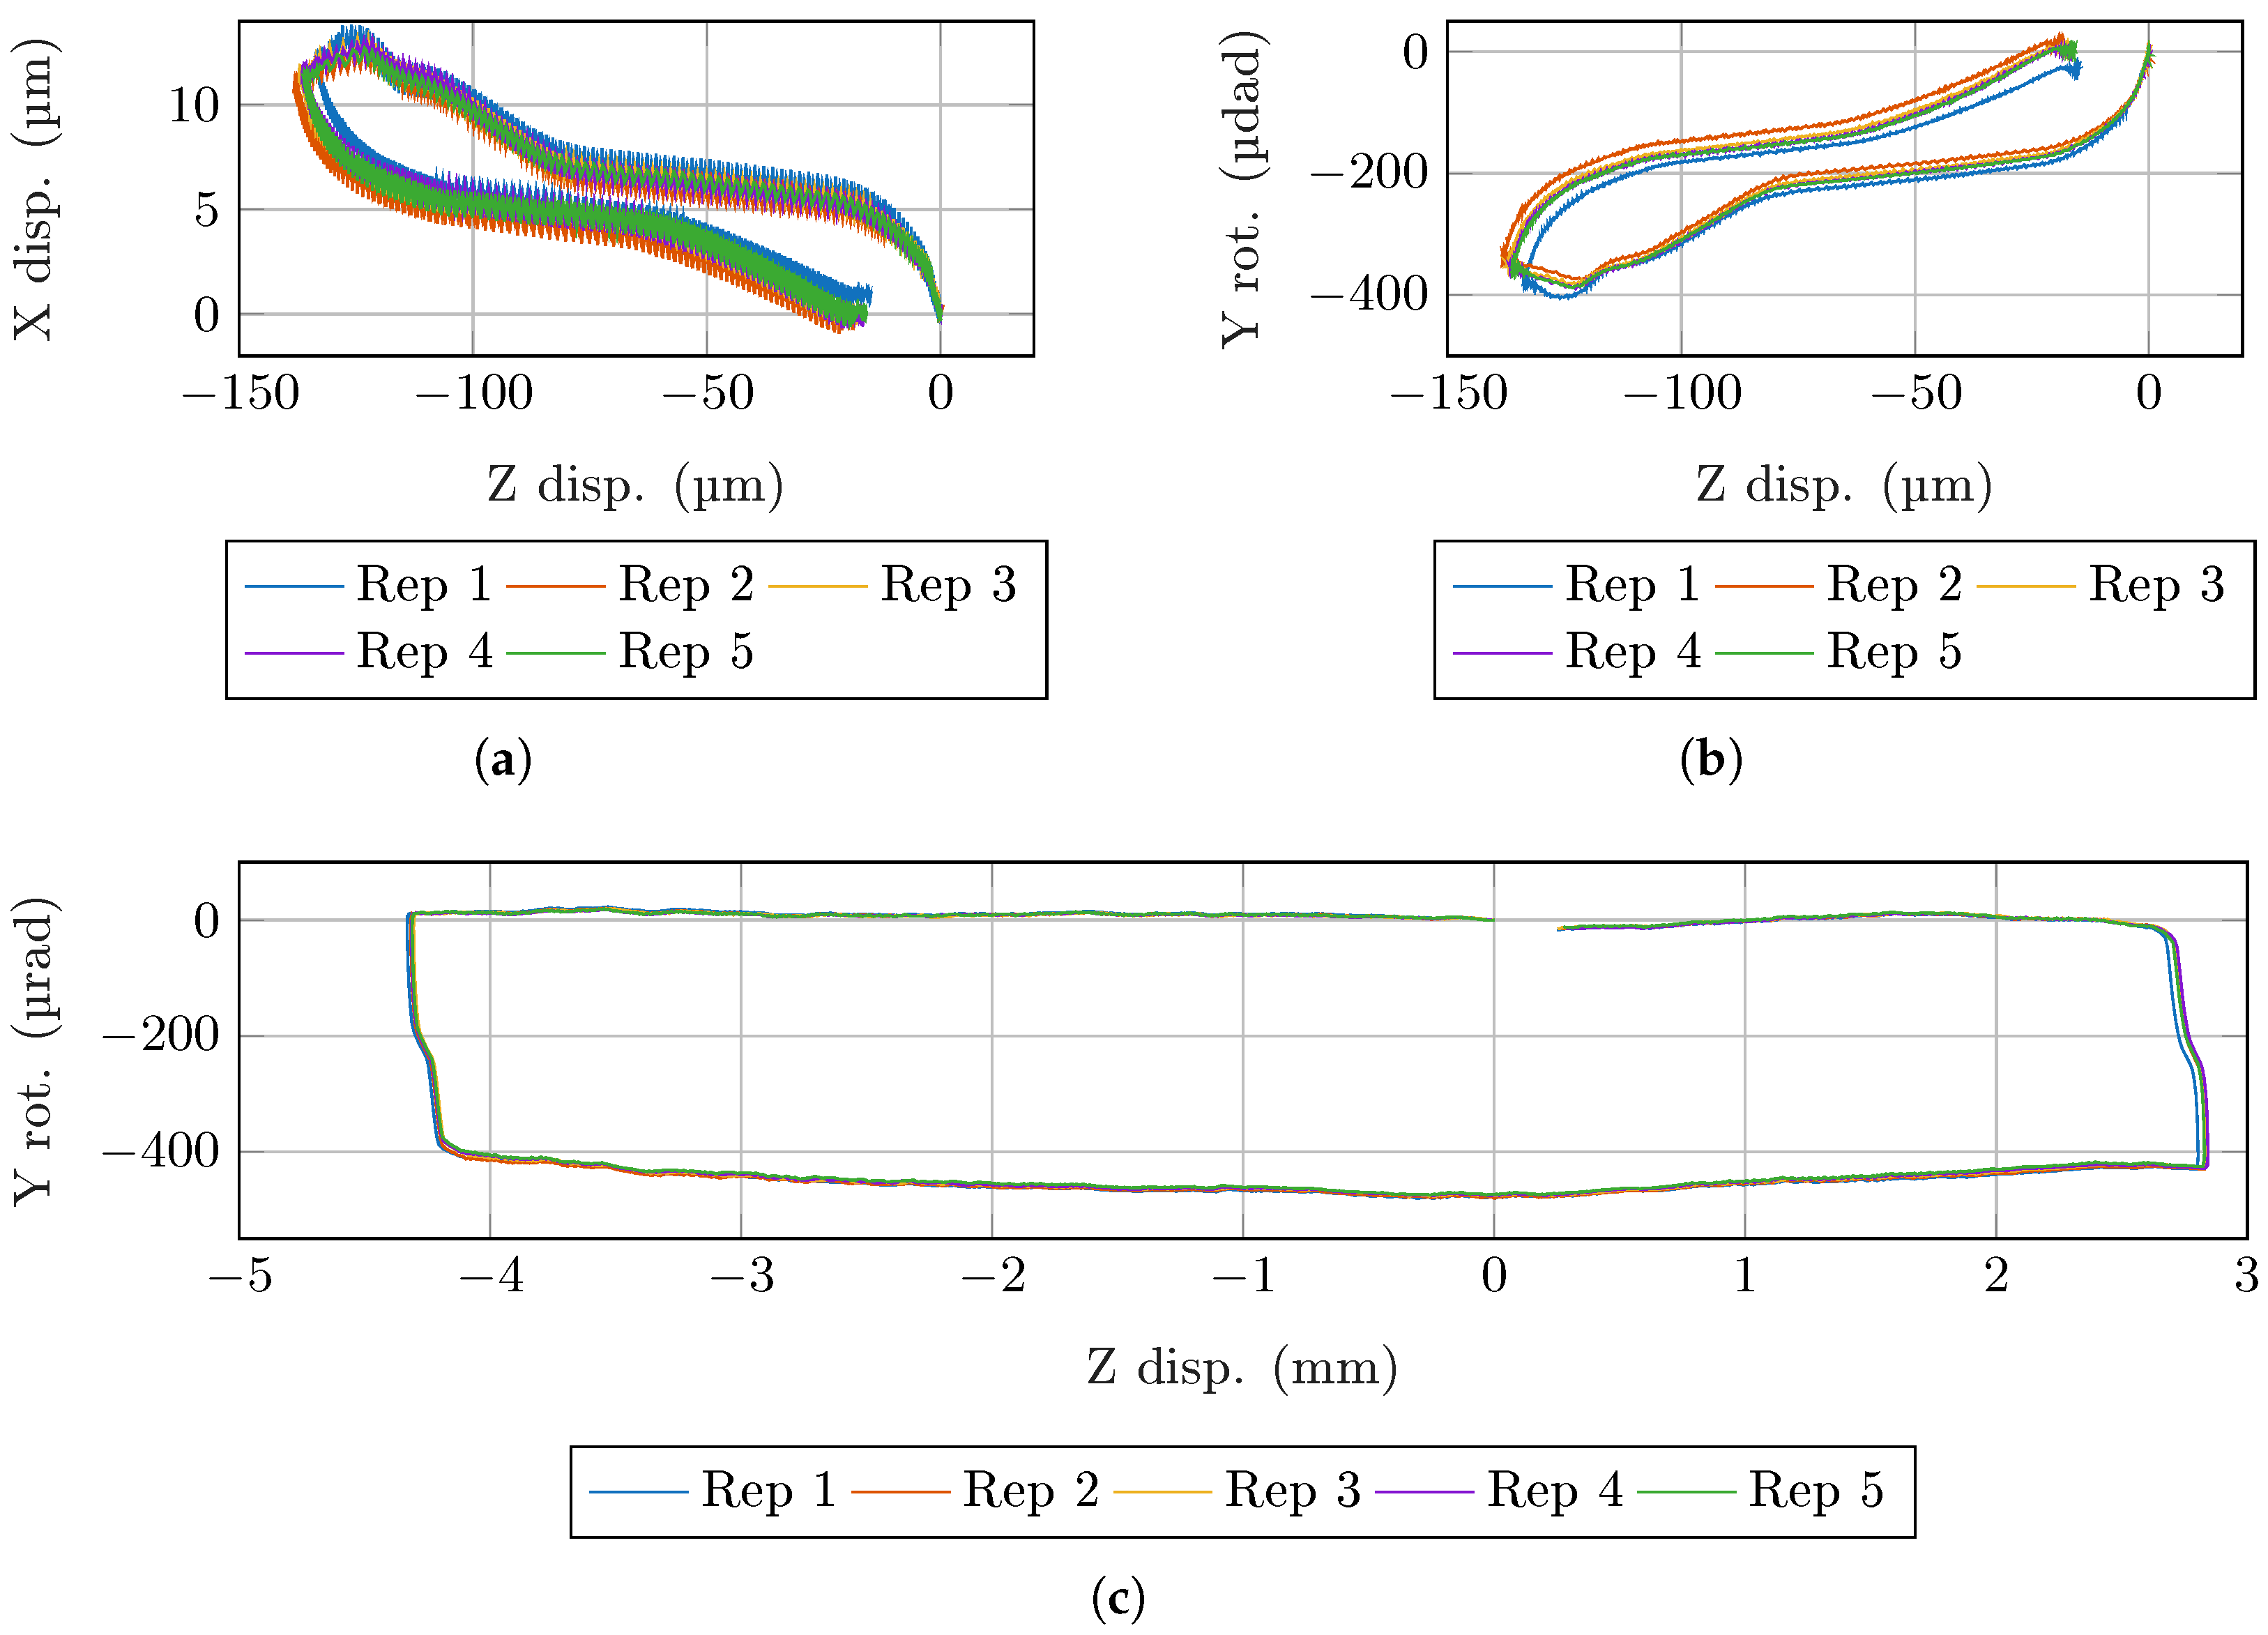
In Table 1, the list of the tests performed in the laboratory is reported, with the level of noise observed in each measurement channel. The results, obtained by both short and long stroke tests, are shown in Figure 8 and Figure 9, respectively, for the roller–roller and slider–roller guiding system configuration. As can be seen from the plots, the behavior of the mechanism is highly repeatable, producing only marginal changes among the five acquired cycles, i.e., the five repetitions of the tests. Additionally, based on the slider–roller short-stroke tests, the plunger head motion along the X direction can be interpreted as a scaled representation of the plunger rotation about the Y axis. This relationship is particularly relevant for the long-stroke tests, during which the single-beam interferometer signal—and therefore the X direction plunger displacement—is not available. This is not the same for the roller–roller configuration. However, in general, it is reasonable to say that a low runner rotation around Y occurs when also the plunger side motion is low.
Table 1.
Test matrix for the BBM tests. A total of 5 repetitions are run for each test configuration. The noise level for each measurement quantity is also reported in the table: Z displacement (Z), X displacement (X), and Y rotation (RY) of the plunger head.
Figure 8.
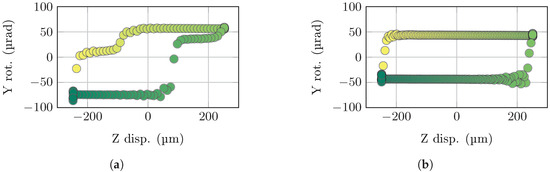
Data acquired for the BBM tests in the roller–roller configuration: (a,b) report the X displacement and Y rotation of the plunger, as a function of its Z displacement, during short-stroke tests; (c) reports Y rotation of the plunger, as a function of its Z displacement, during long-stroke tests. Different test repetitions are reported with different colors.
Figure 9.
Data acquired for the BBM tests in the slider–roller configuration: (a,b) report the X displacement and Y rotation of the plunger, as a function of its Z displacement, during short-stroke tests; (c) reports the Y rotation of the plunger, as a function of its Z displacement, during long-stroke tests. Different test repetitions are reported with different colors.
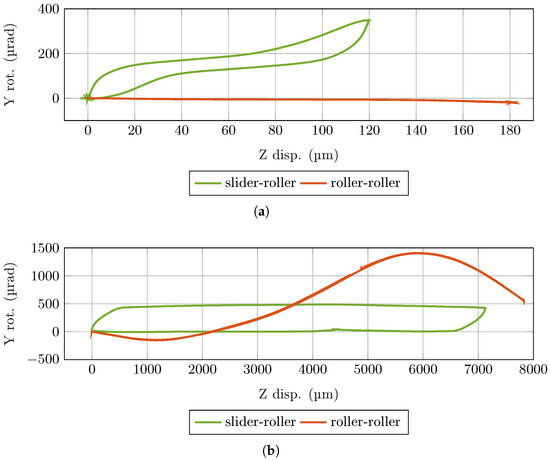
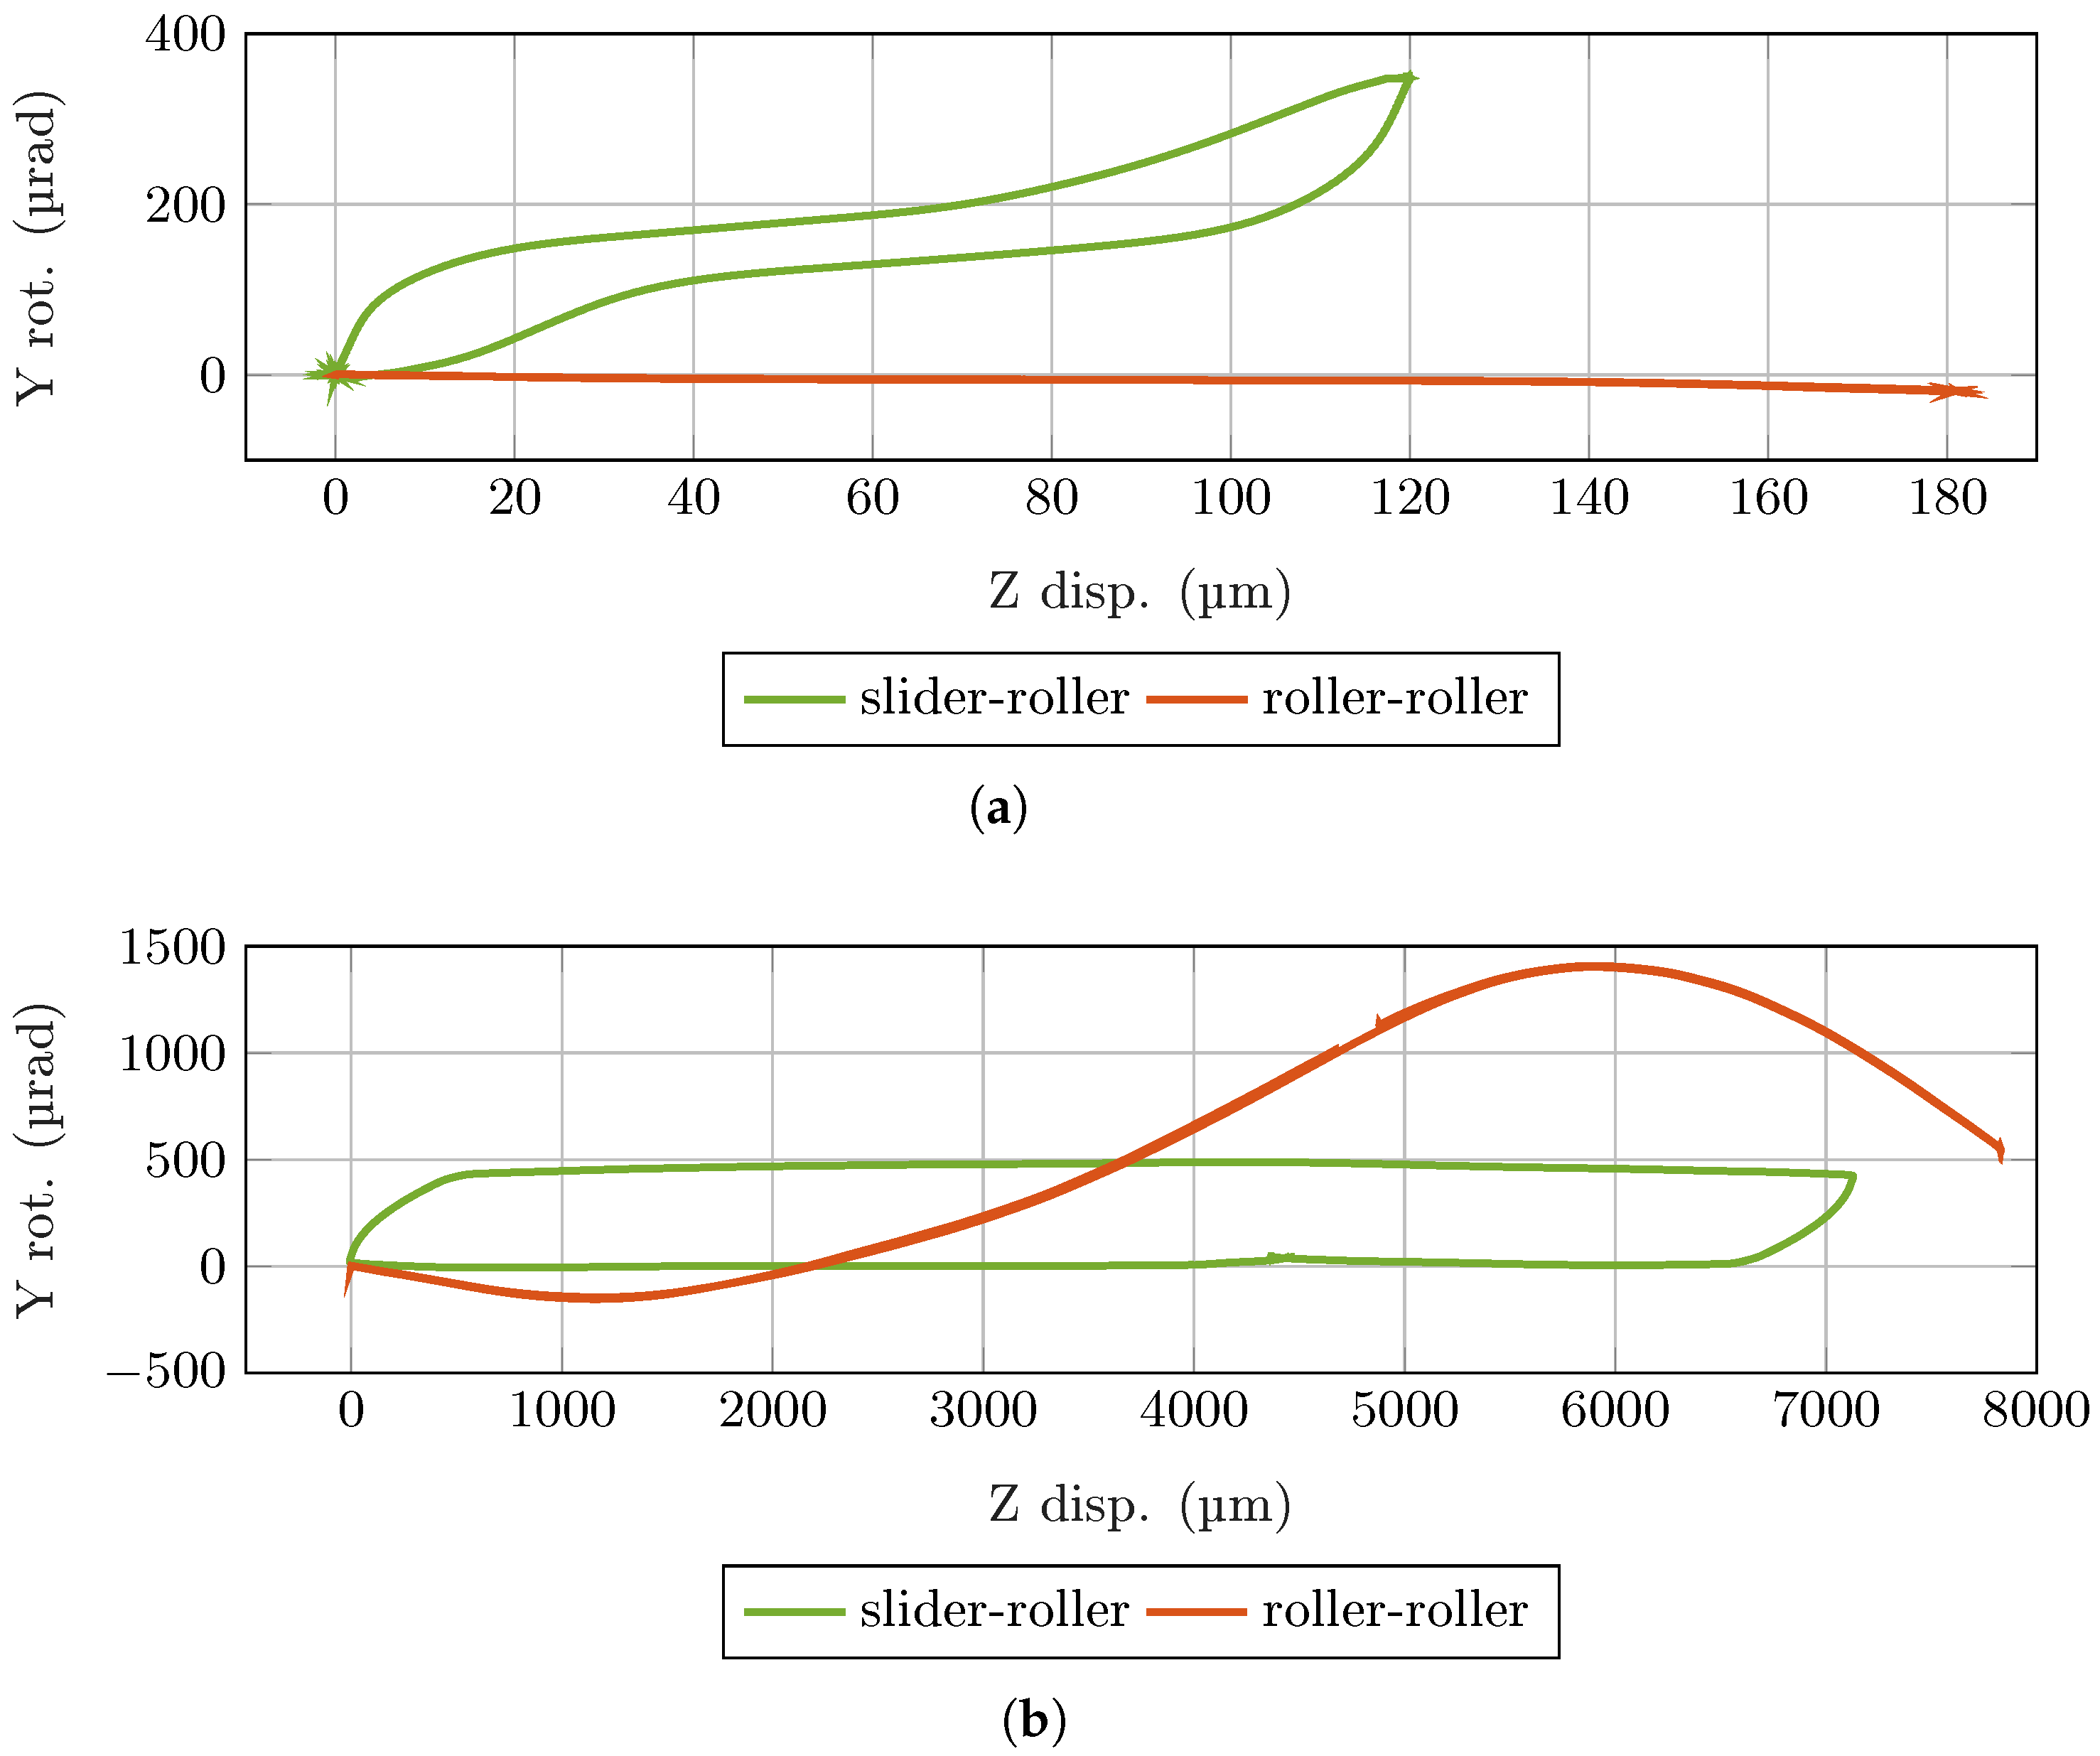
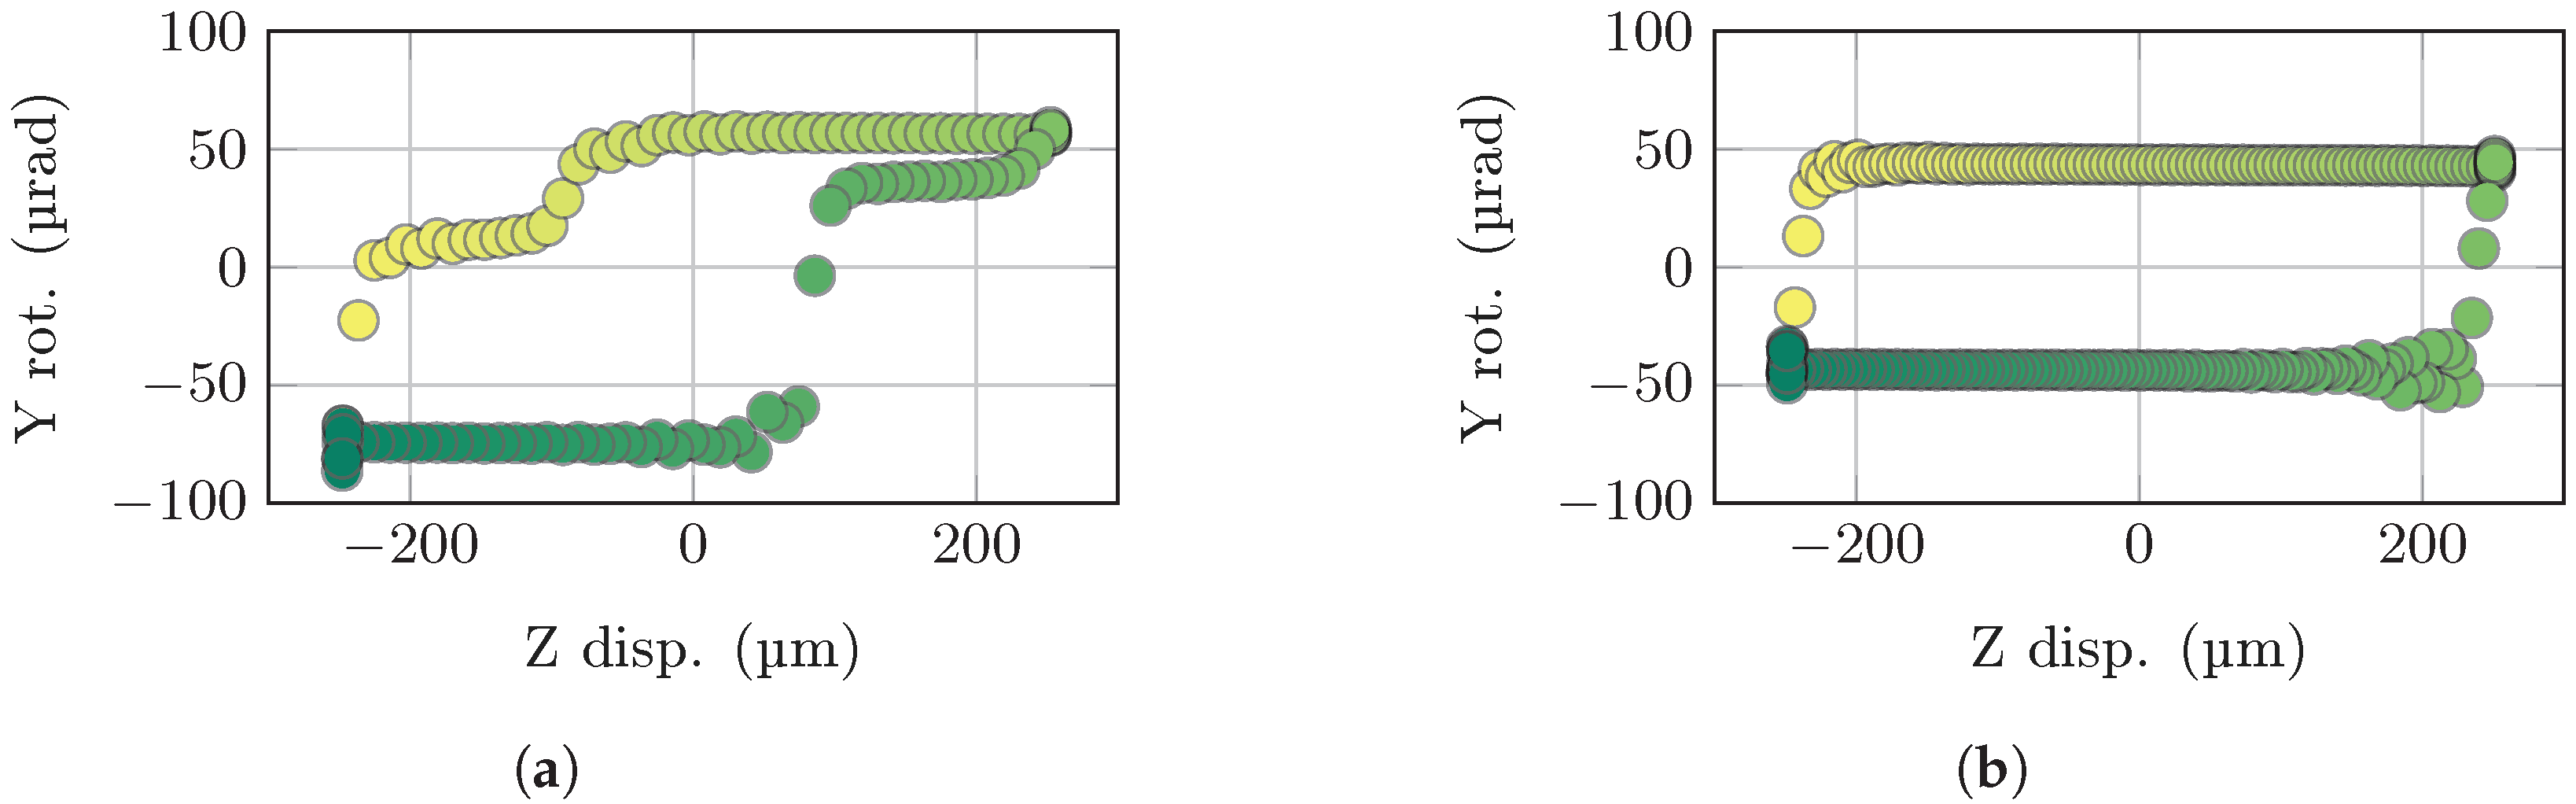
A comparison between the plunger rotation around Y produced in the roller–roller and slider–roller configurations is shown in Figure 10 for both short-stroke and long-stroke tests. The comparison is carried out for the fifth repetition of the test, avoiding considering eventual guiding system run-in. Nevertheless, only marginal changes are observed among the test repetitions, suggesting that the run-in effect does not significantly impact the system behavior.
Figure 10.
Comparison between slider–roller and roller–roller tests results for both short- and long-stroke tests, respectively, in (a,b).
Figure 10a shows that the slider–roller configuration experiences a sudden and large rotation at motion reversal. This is primarily caused by the higher friction between the slider cups and the linear runner, compared with the friction exerted by the rollers. In contrast, the roller–roller configuration results in a much smaller rotation for the same runner stroke, and the hysteretic behavior is eliminated. This occurs because the friction forces are symmetrical on both sides of the linear runner, with the same type of guidance at the X+ and X− sides.
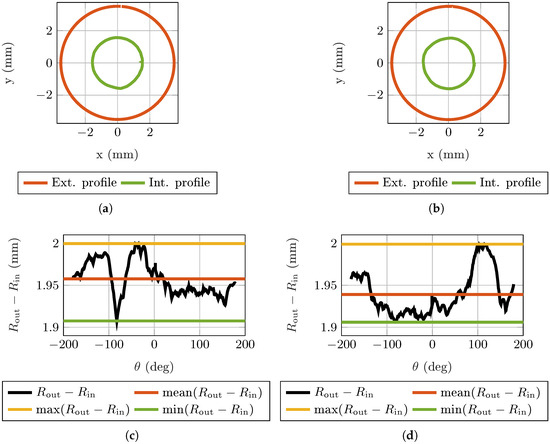
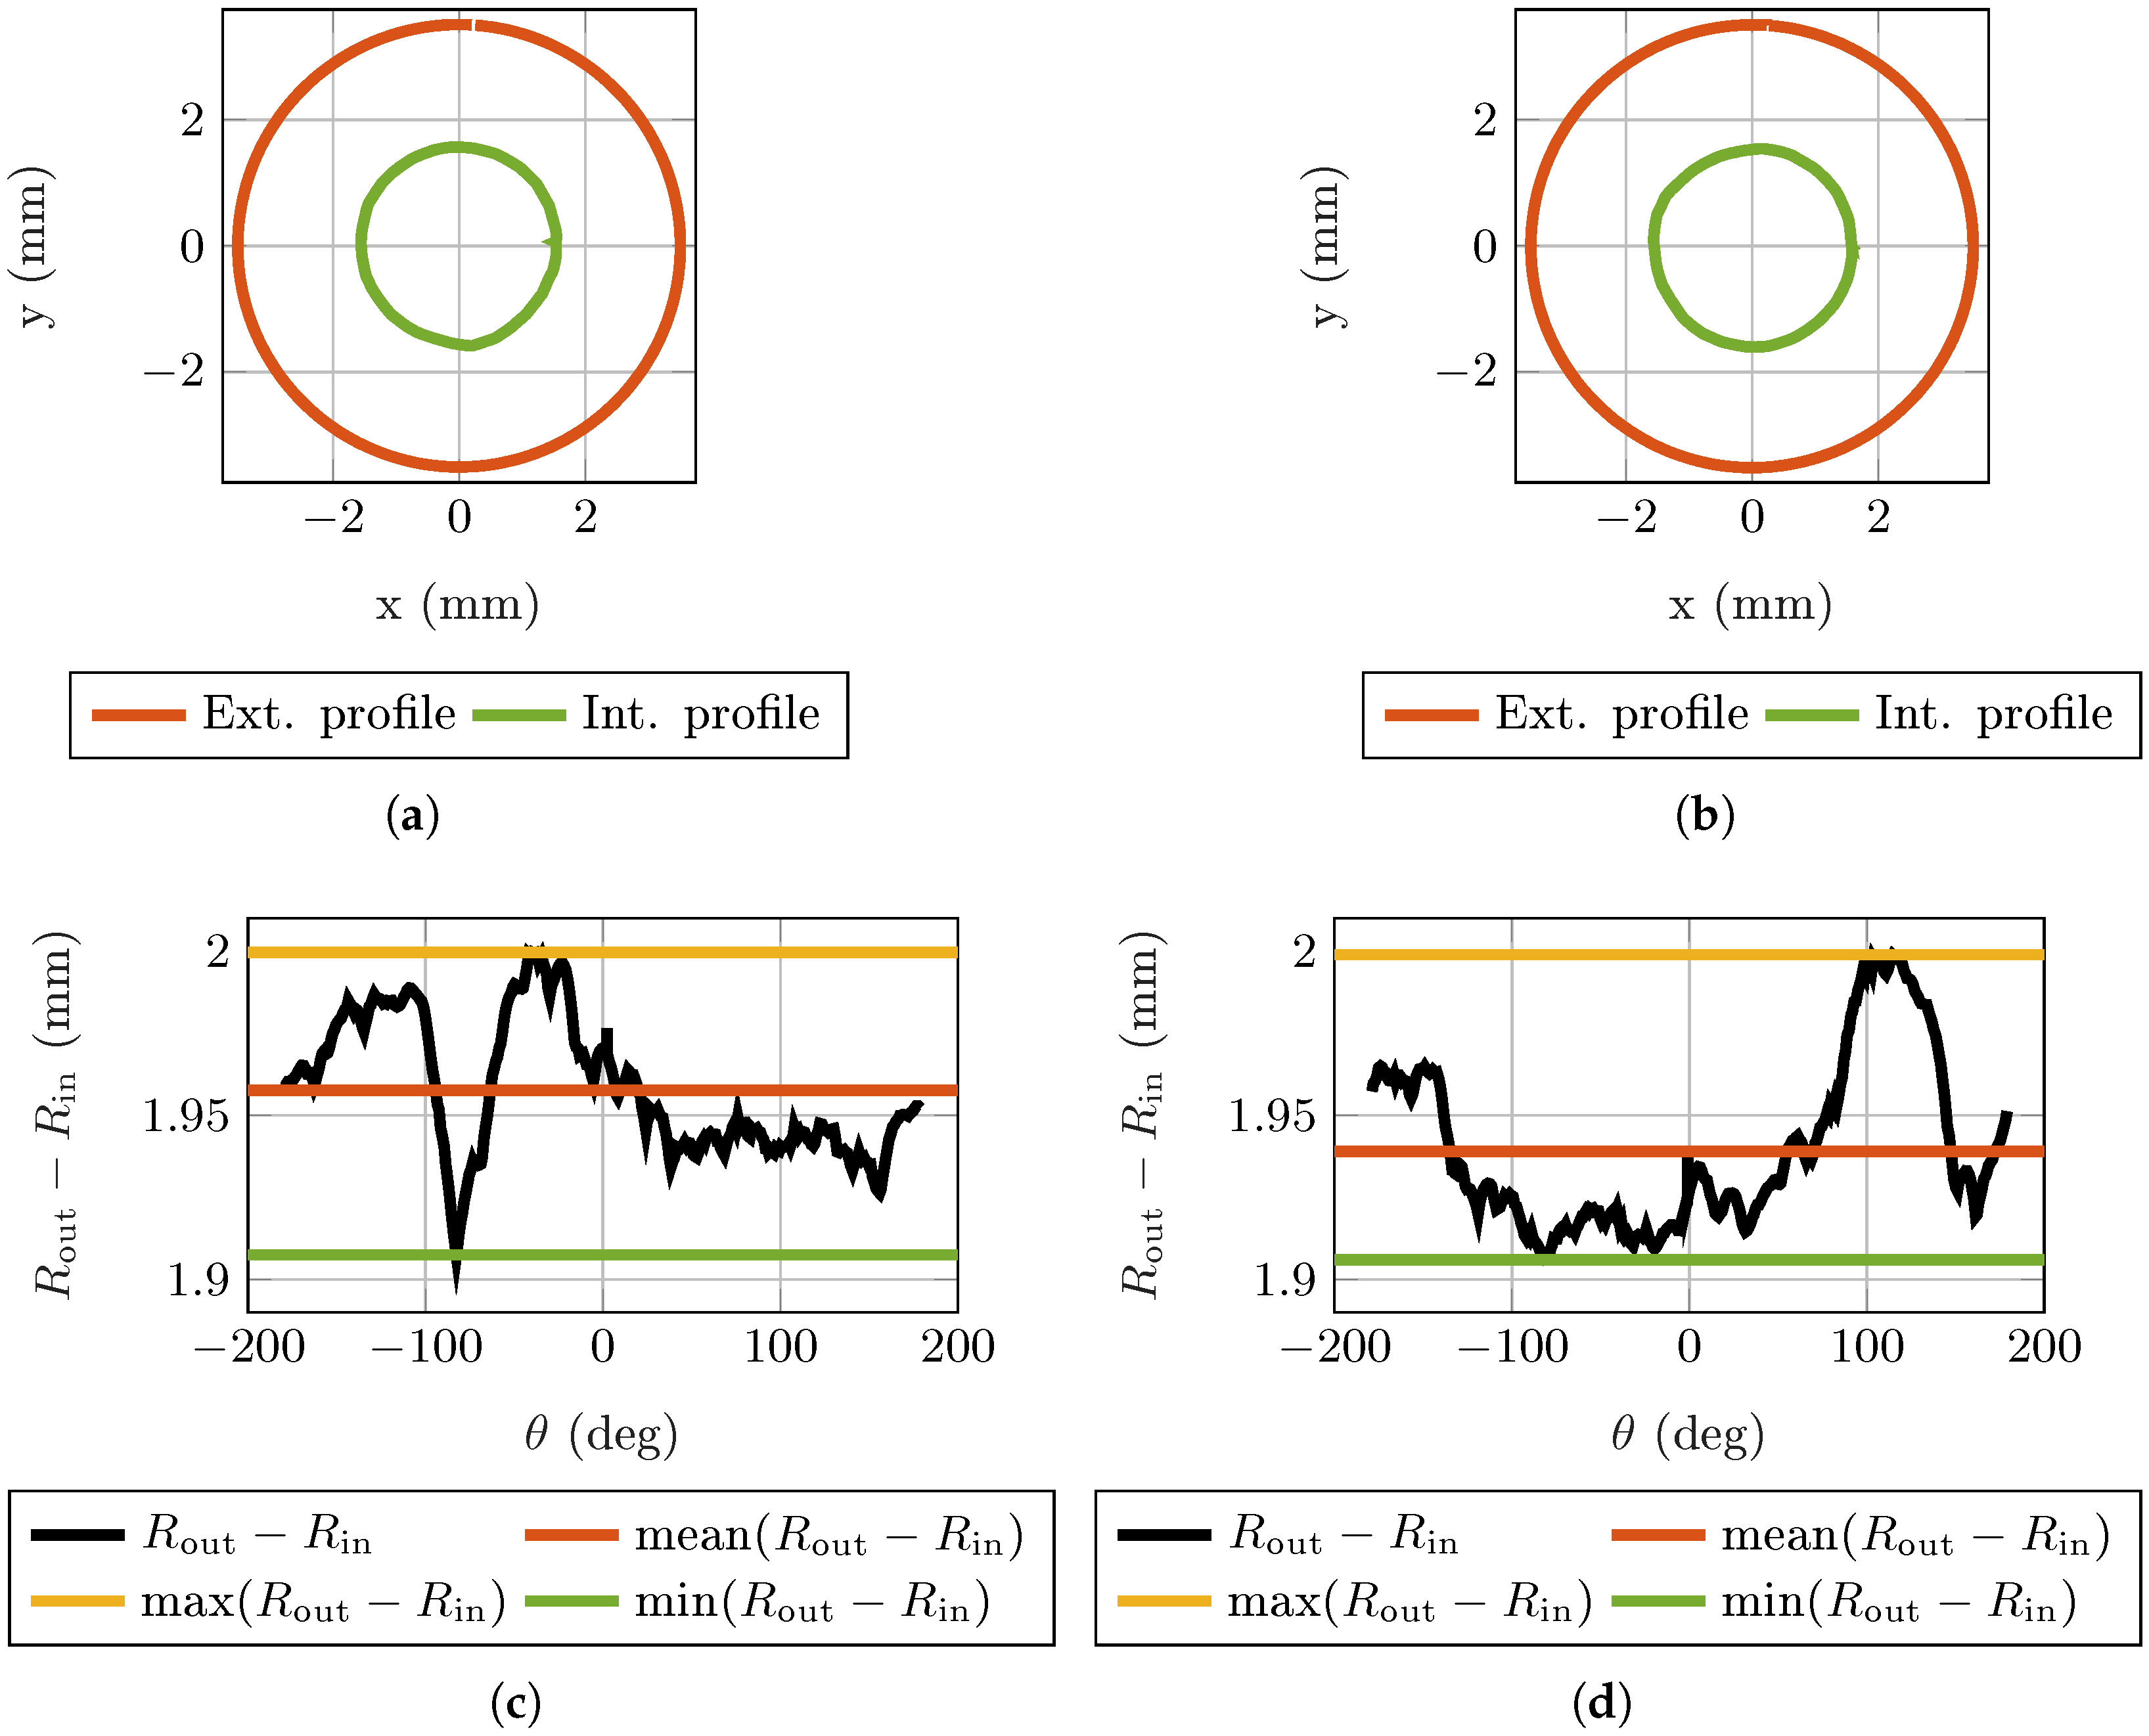
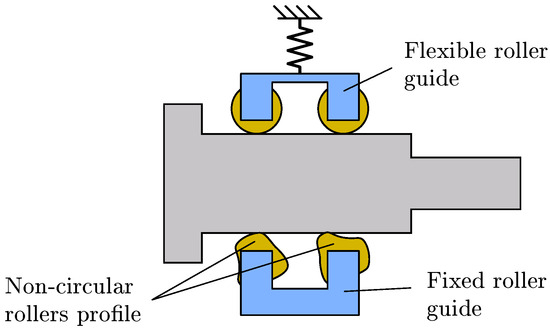
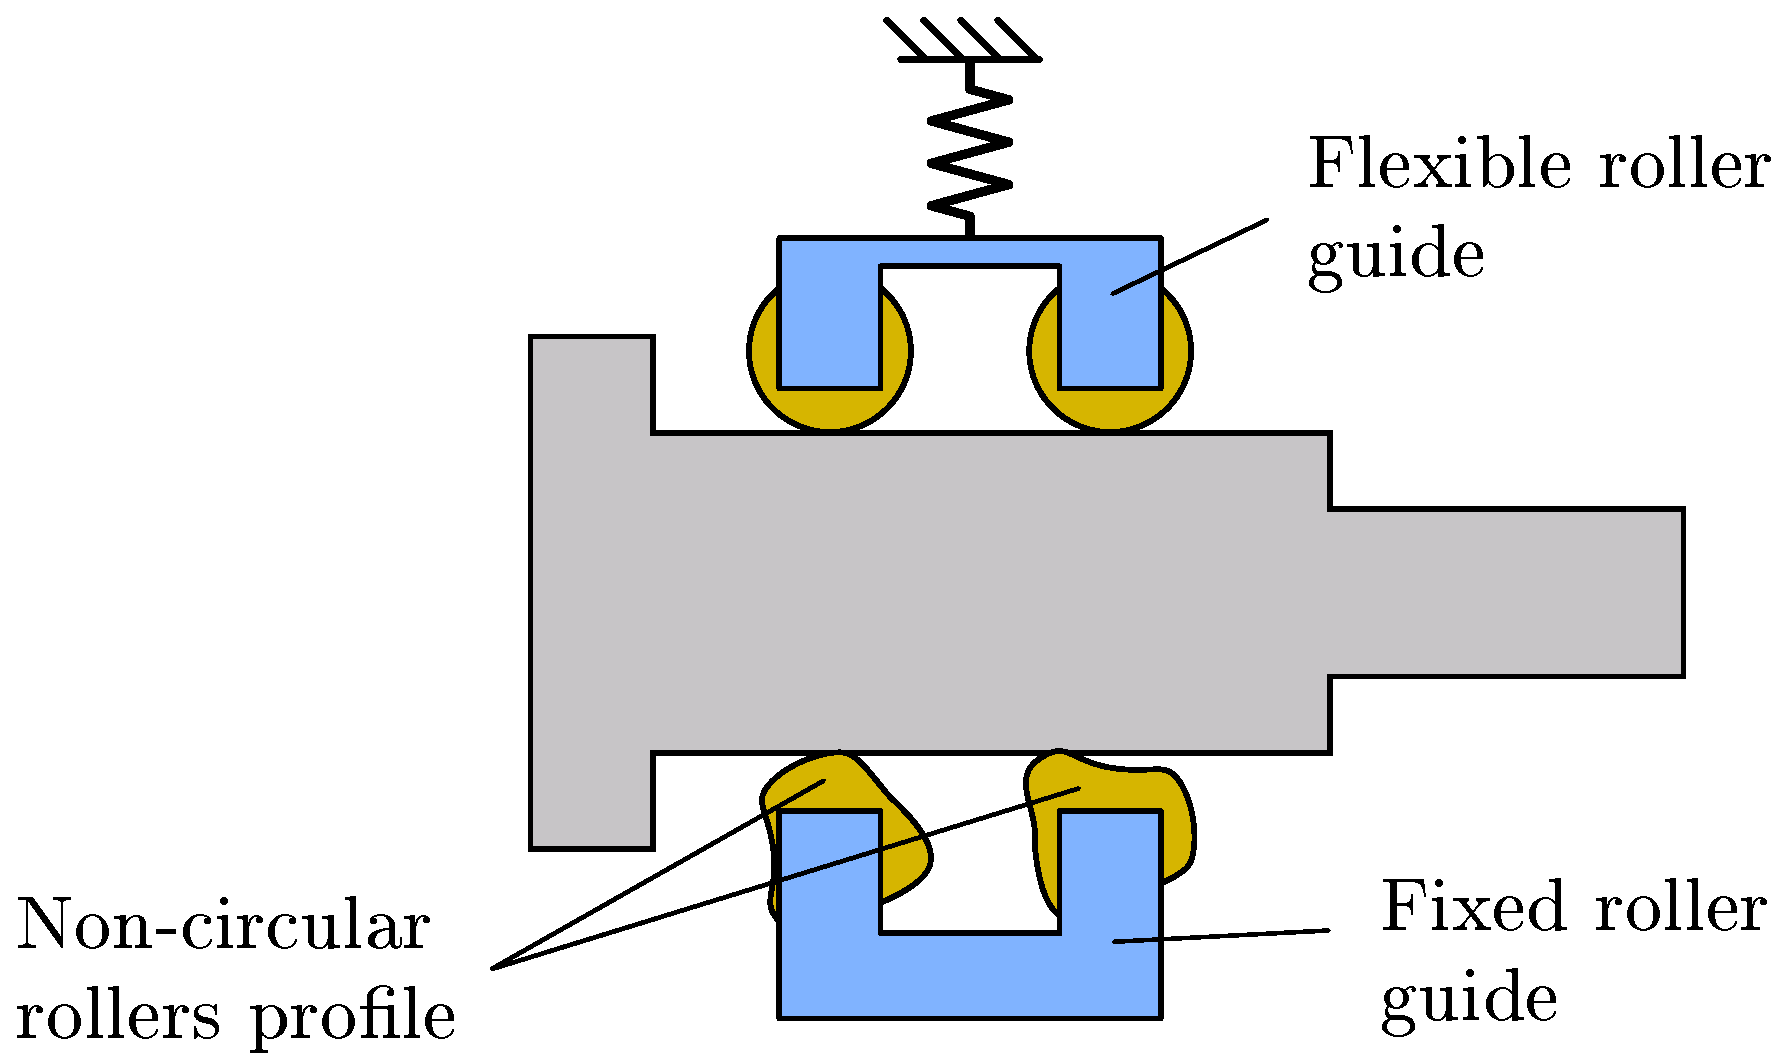
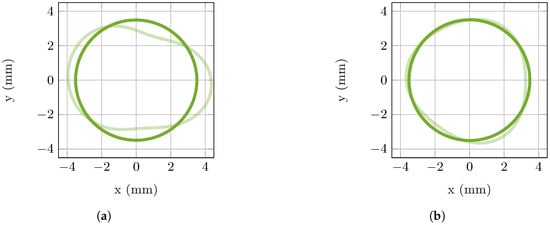
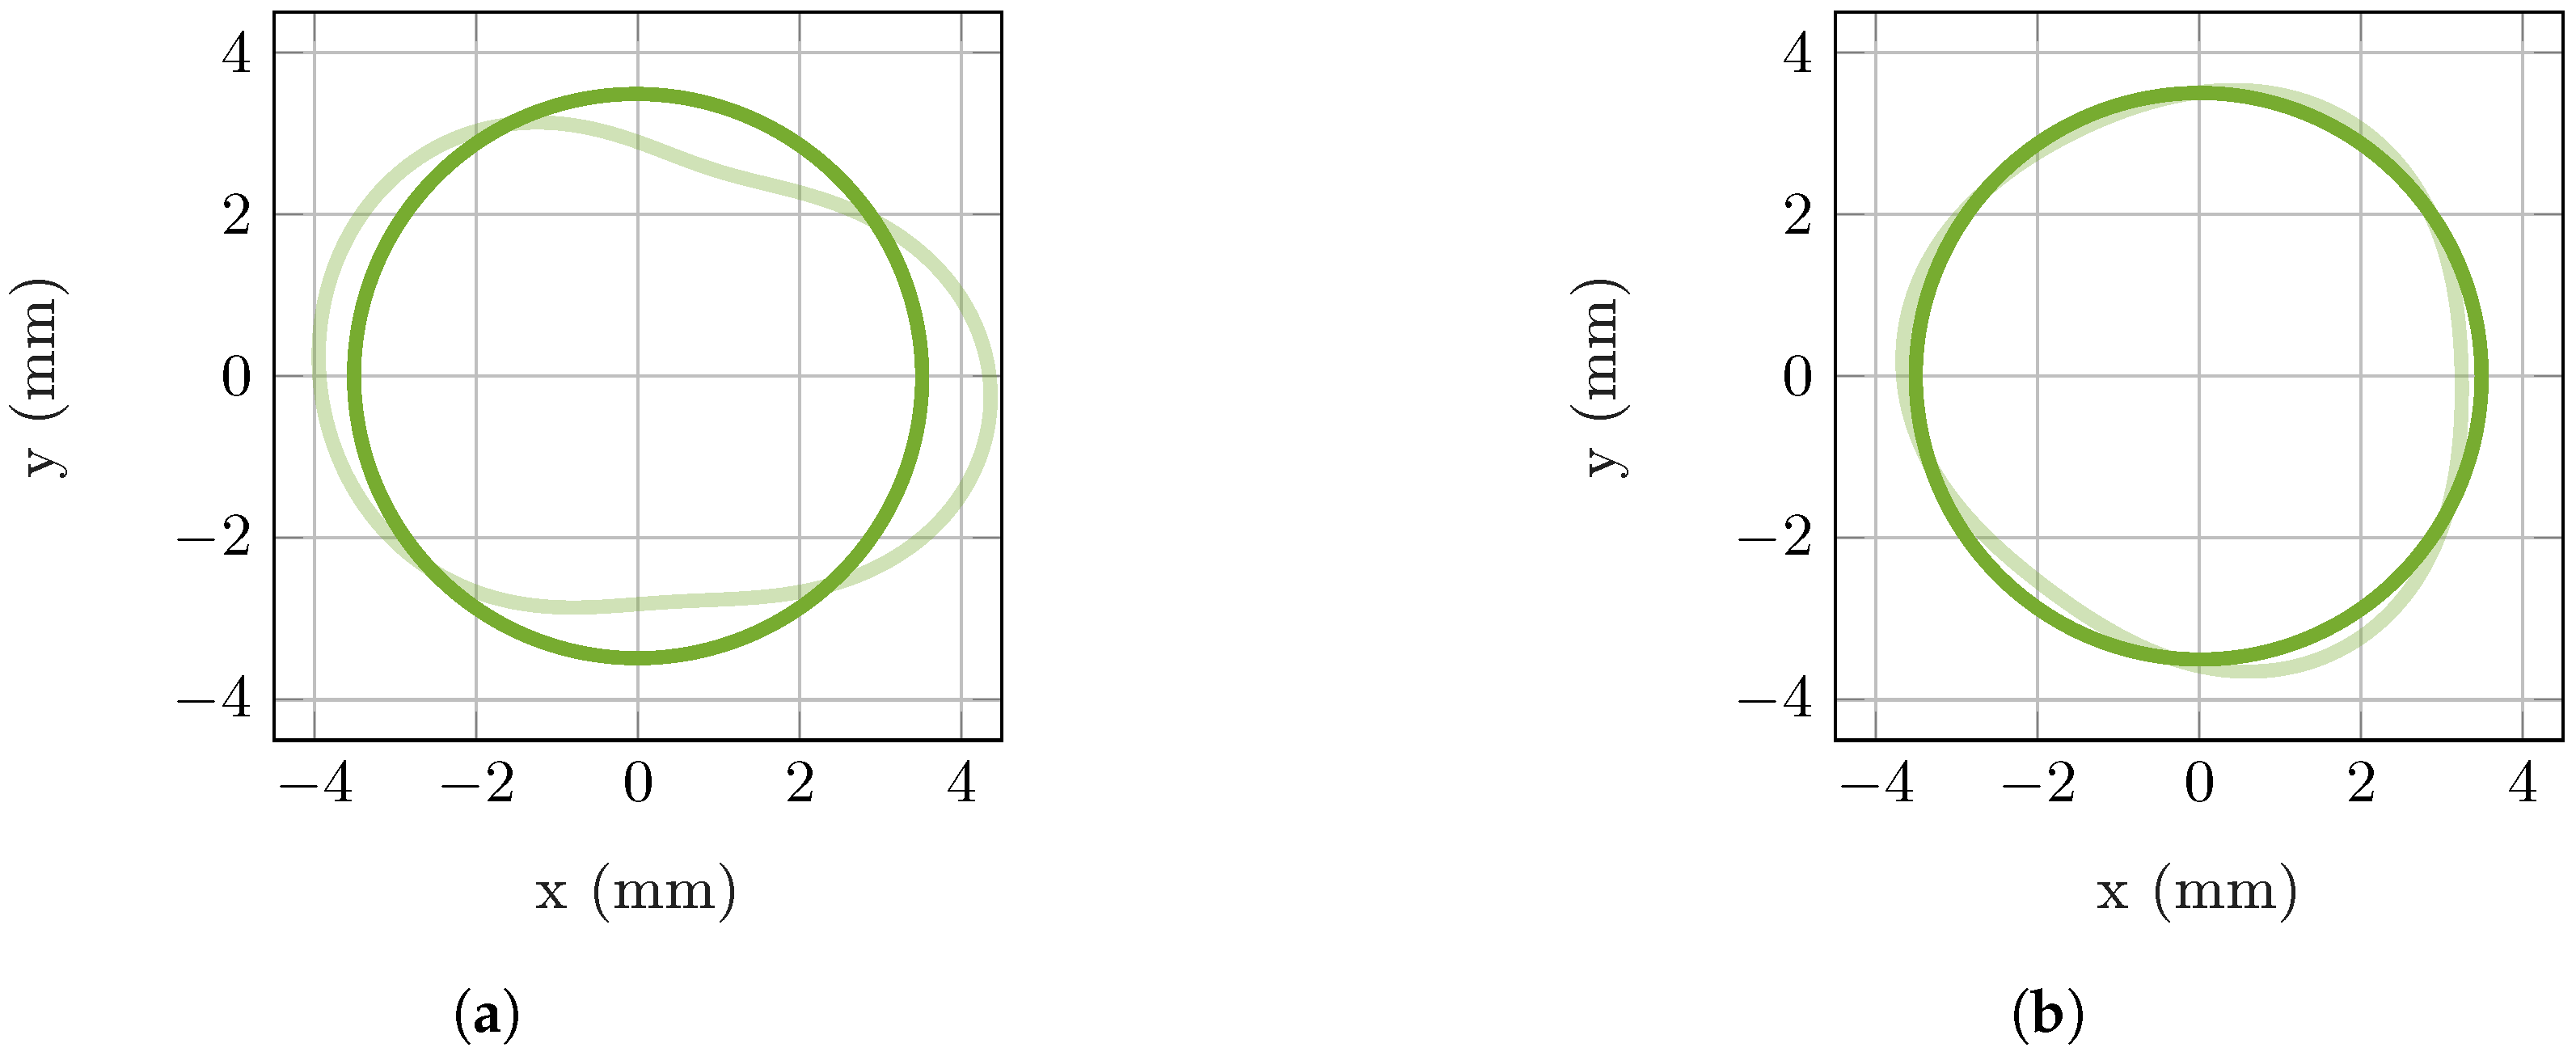
During the long-stroke tests (see Figure 10b), the slider–roller configuration provides better plunger trajectory straightness, with rotation concentrated mainly at the reversal points. Meanwhile, the roller–roller configuration shows rotation developing along the entire runner stroke, reaching larger values than in the slider–roller case. However, during extension and retraction maneuvers, the rotation of the plunger is the same for a given value of Z position, producing a curve overlapping in the graph. This indicates that the lateral displacement is not caused by an asymmetric force distribution at the interface with the runner, but rather by a kinematic effect associated with the rollers’ run-out. In fact, the wheels roll without slipping on the linear runner, producing a repeatable effect on the Y rotation of the plunger head. Note that the run-out of the fixed guide’s rollers dominates since the flexible guide can accommodate the run-out of its rollers by a deformation of the washer spring. During post-test inspection of the BBM components, the rollers’ profile is characterized by a coordinate measuring machine (CMM), quantifying the run-out. Figure 11 shows the data acquired by the CMM for the rollers associated with the fixed roller guide, highlighting fluctuations of about 0.1 mm in the roller thickness. Note that a runner stroke of 7 mm, as the one performed in the long-stroke tests, produces a runner rotation of approximately 100°.
Figure 11.
Rollers’ profile of the fixed roller guide measured by CMM. (a,b) show both the external (out) and internal (in) profile of the rollers, measured at the same level. The external profile is in contact with the runner, while the internal one slides on the pin. (c,d) show the difference of the external and internal pin radius (R), directly associated with the run-out. Max, min, and mean values are highlighted in the plot.
3. Side Guiding Models
The differing causes of plunger head side motion in the slider–roller and roller–roller configurations require distinct modeling approaches. The side motion in the slider–roller is mainly due to different friction forces and components’ stiffness. As a consequence, the model of the contacts between the sliding components plays a pivotal role in the simulation. For these reasons, a FE analysis, performed in ANSYS 2025R2 [27], is used to reproduce the slider–roller behavior, updating the model presented in [26]. The roller–roller behavior, instead, is dominated by the kinematic of the rollers. Due to the run-out, the fixed rollers behave as a cam, displacing the linear runner according to the fluctuation of their thickness. In this case, the contact model and the stiffness of the components become less relevant. As a consequence, a multi-body simulation is adopted to describe such a behavior (MSC ADAMS 2021.3 [28]).
3.1. Slider–Roller Guiding System Finite Element Model
The FE model of the slider–roller BBM is an extension of the one developed in [26]. The mesh is generated by an automatic mesher, with the standard mesh size equal to 2.5 mm. The mesh size is decreased for small components (for the rollers’ assemblies, it is set to 0.6 mm) and at the contact location, where it is reduced to 0.35 mm.
The washer spring, preloading the guiding system, is modeled as a 6 degrees of freedom spring element. The stiffness values are obtained from independent FE analyses and testing.
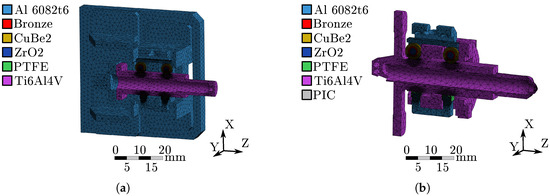
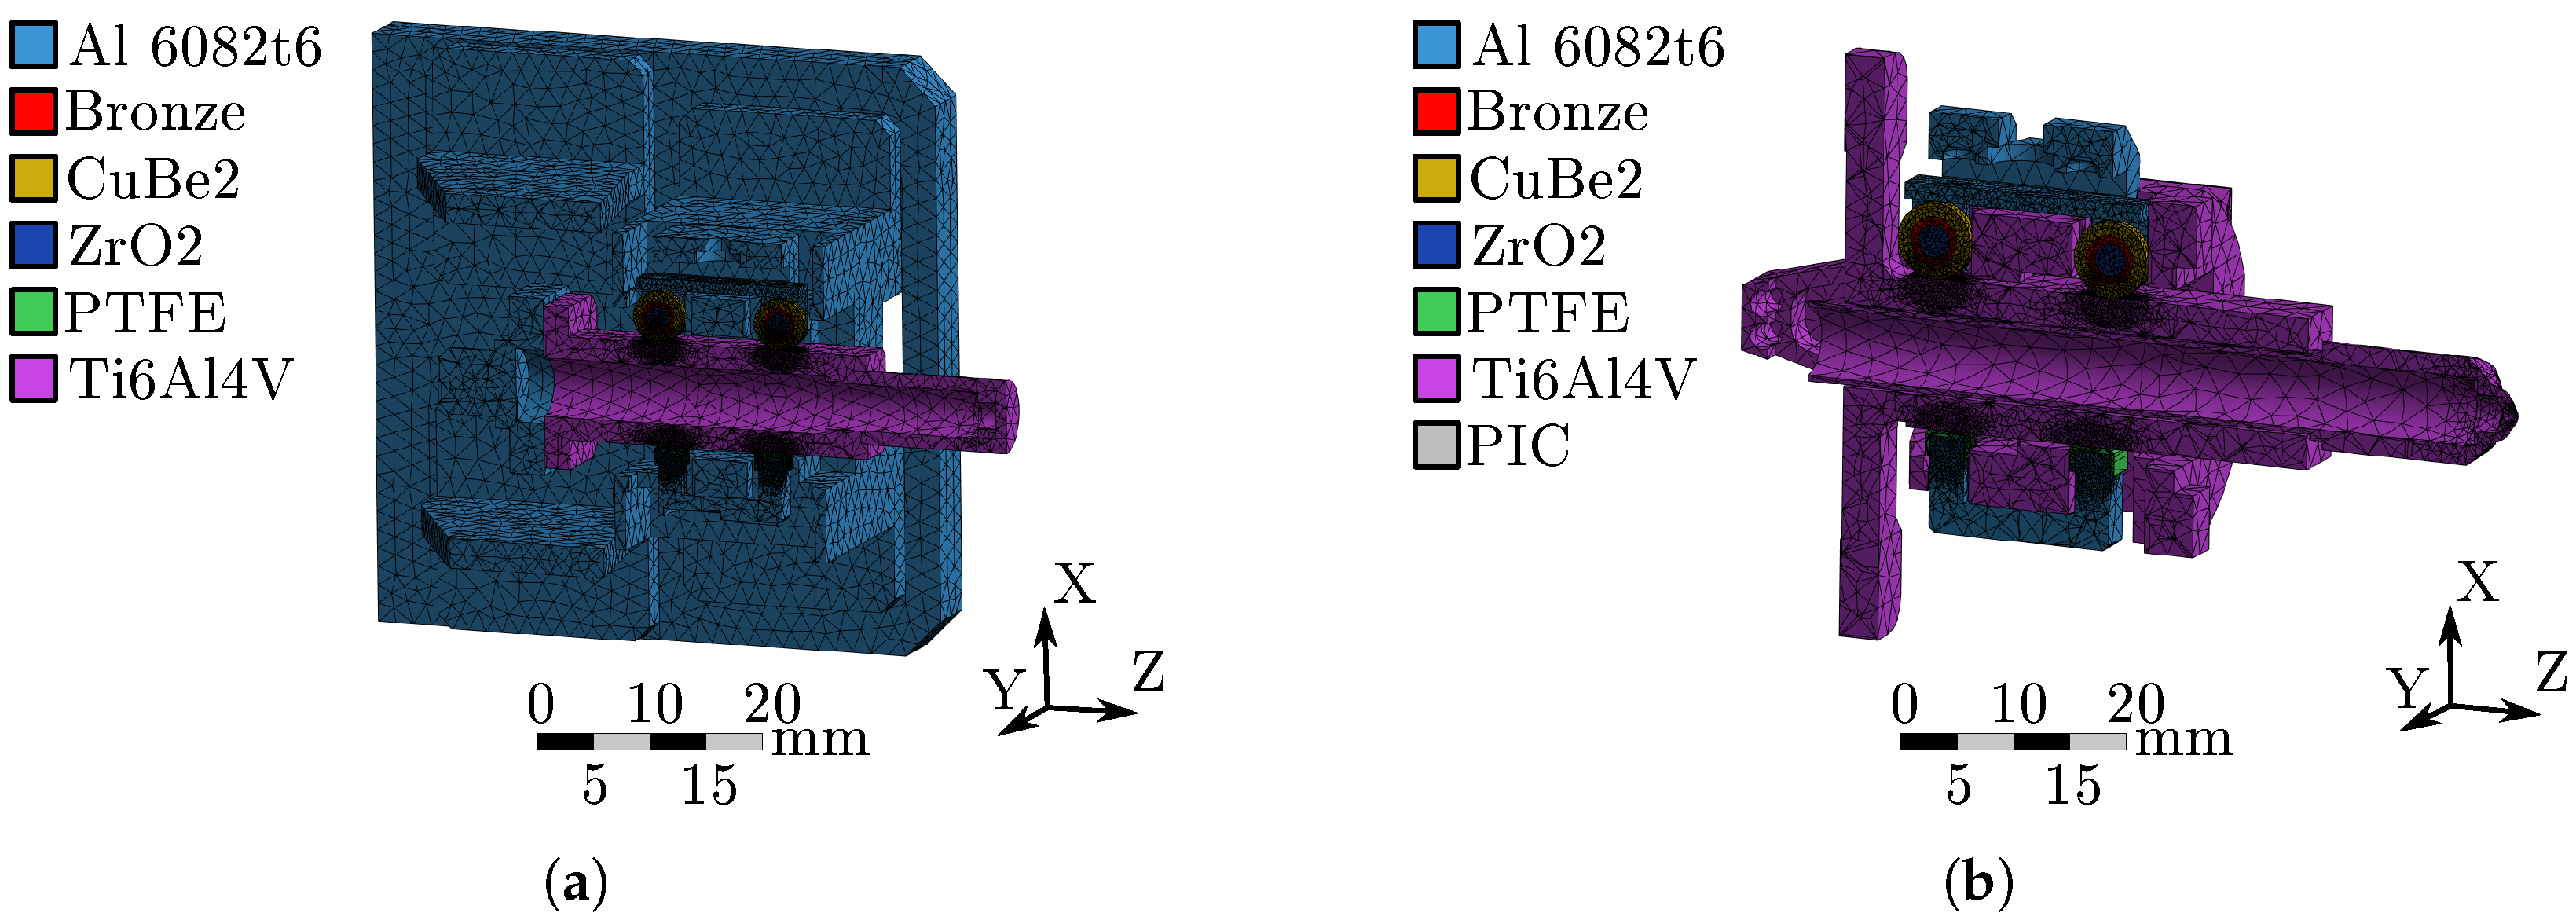
Material properties, reported in Table 2, are assigned according to the actual BBM configuration (shown in Figure 12).
Table 2.
FE model materials’ properties. The piezo-ceramic material is used to simulate the piezo-walkers in the GPRM FM model. They are not present in the BBM since the Nexline actuator is not included.
Figure 12.
Finite element models of the slider–roller configuration, built in ANSYS 2025R2. In (a), the FE model of the BBM is reported. In (b), the extension to the LPF FM is shown.
The driving input is given at the fixation point of the rod on the LR, where a displacement is imposed along the Z direction. The gravity acceleration is included in the BBM model, directed along the BBM axis like in the experimental tests.
The simulation is made of three load steps. At the beginning, the flex roller guide is preloaded to the linear runner. This is a static analysis providing the as-built configuration of the mechanism. Then, a transient simulation brings the mechanism to the hysteresis cycle, by displacing the linear runner forward of 200 μm. Finally, the linear runner is displaced backward of 350 μm. This last phase of the simulation reproduces a reversal of the LR motion, performed during the side guiding tests.
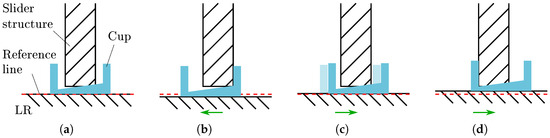
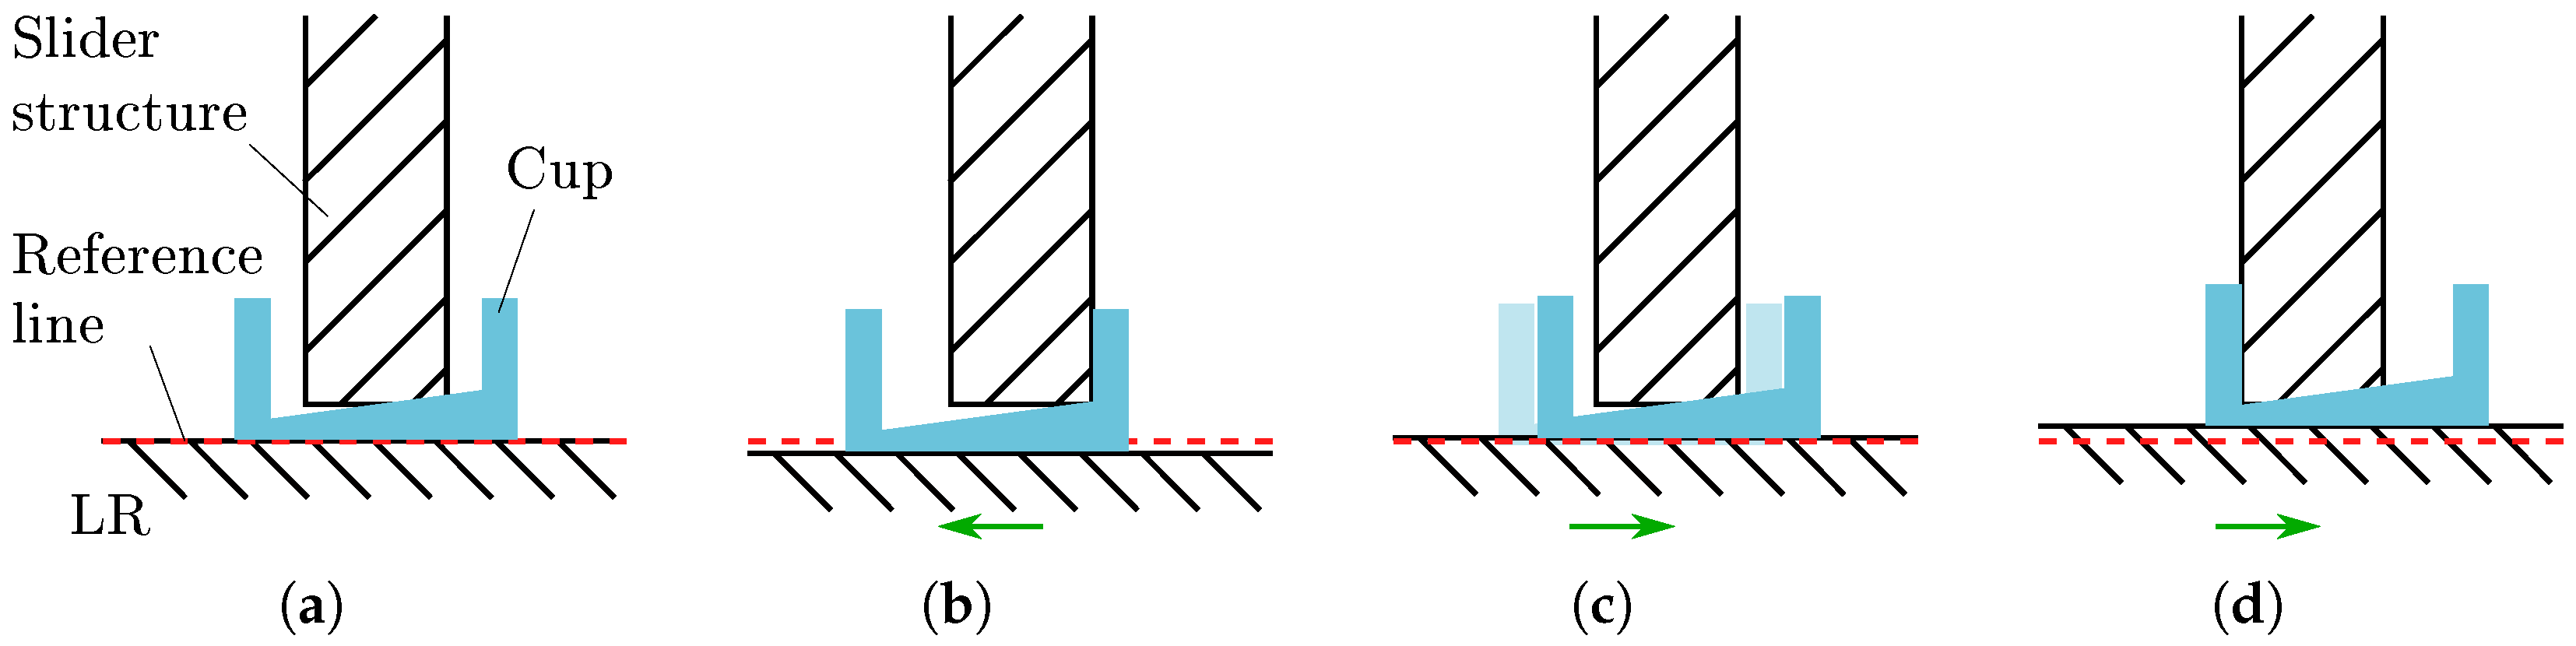
The guiding system behavior presented in [26] shows a lateral displacement that suddenly arises at the incipient axial motion up to a maximum value and then decreases to a lower value. The BBM tests, however, highlighted a different behavior, where the X displacement (or Y rotation) is characterized by a piecewise linear trend. This result can be explained by the presence of clearance between the PTFE slider’s cups and the aluminum slider structure. When the LR starts to move, the friction limit is reached quite fast in the roller guide, producing a marginal effect on the mechanism characteristics. On the other side of the runner, the friction limit is reached first at the interface between the cups and the slider frame. The cups start to slide (Figure 13c), dragged by the runner, until they reach the physical end stop given by the cup shape (Figure 13d), recovering the gap. During the cup sliding on its frame, the side displacement of the plunger head increases by a small amount. This is produced only by the tolerance in the parallelism between the two surfaces of the slider cups. Since the cups are symmetrically mounted on the slider structure, during this intermediate sliding phase, one cup becomes wedged between the LR and the structure, while the other cup experiences the opposite effect (see the difference between Figure 13b,d). This geometric effect, caused by the cup tolerances, induces a small rotation of the linear runner (and a corresponding lateral displacement of the plunger) during this phase. When the end stop is reached and the cups cannot slide anymore, the friction force at the interface between the cup and the runner grows, further increasing the side motion at the plunger head. Finally, the friction limit is reached also between the cups and the LR, bringing to a straight trajectory of the plunger.
Figure 13.
The figures depict relative configuration between the LR and the slider at the inversion of the runner motion, in case of clearance. The green arrow shows the commanded Z motion of the LR. (a) shows the configuration at the mechanism assembly, before actuating the LR for the first time. In (b), the runner is moved to the left by dragging the cup toward the slider structure. In (c), the direction of the runner motion is inverted: the friction limit is reached at the interface with the cup and the slider structure first. Then, the LR drags the cup toward the structure in the opposite direction with respect to (c). In (d), the cup cannot slide anymore due to the end stop created by the cup shape. The friction force at the LR-cup interface grows up to the friction limit and is achieved when the runner surface starts to slide on the cup. The effect of the cups’ parallelism tolerance is represented as a local vertical displacement of the LR with respect to a fixed reference (the slider structure is fixed).
The correlation between the FE model and the experimental data is determined based on the test results. The data acquired by the force sensor enable the computation of the friction coefficients for both the sliders and the roller guides. In particular, the friction force measured by the force sensor in slider–roller configuration is approximately . By testing the roller–roller guiding system instead, the force sensor measures approximately of friction force. A bush is used to guide the rod: the friction force on the bush is also estimated by independent tests, in which the rod is moved without being connected to the runner, i.e., removing the contribution of the guiding system friction. The friction on the bush is equal to . The friction generated by a single pair of rollers can be computed by considering the total friction force in the roller–roller configuration, removing the bushing contribution, and dividing the results by two assuming equal force contributions of X− and X+ roller guides. In this way, the friction force generated by a single roller pair is . Considering the rollers’ roll on the LR without slipping during the tests, the sliding interface is the one in between the rollers and their pins. By knowing the preload and the rollers and pins’ radius, the friction coefficient is equal to ( if thought as an equivalent friction between the LR and the rollers). Finally, knowing the contribution of the rollers and of the bush, the friction at the slider cups can be computed by using the force sensor signal for the slider–roller tests. The cups-LR friction coefficient results to .
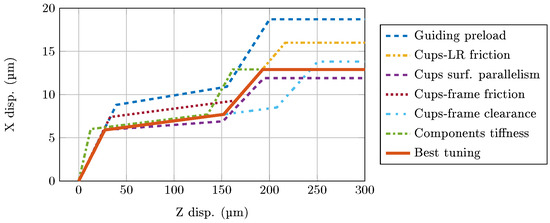
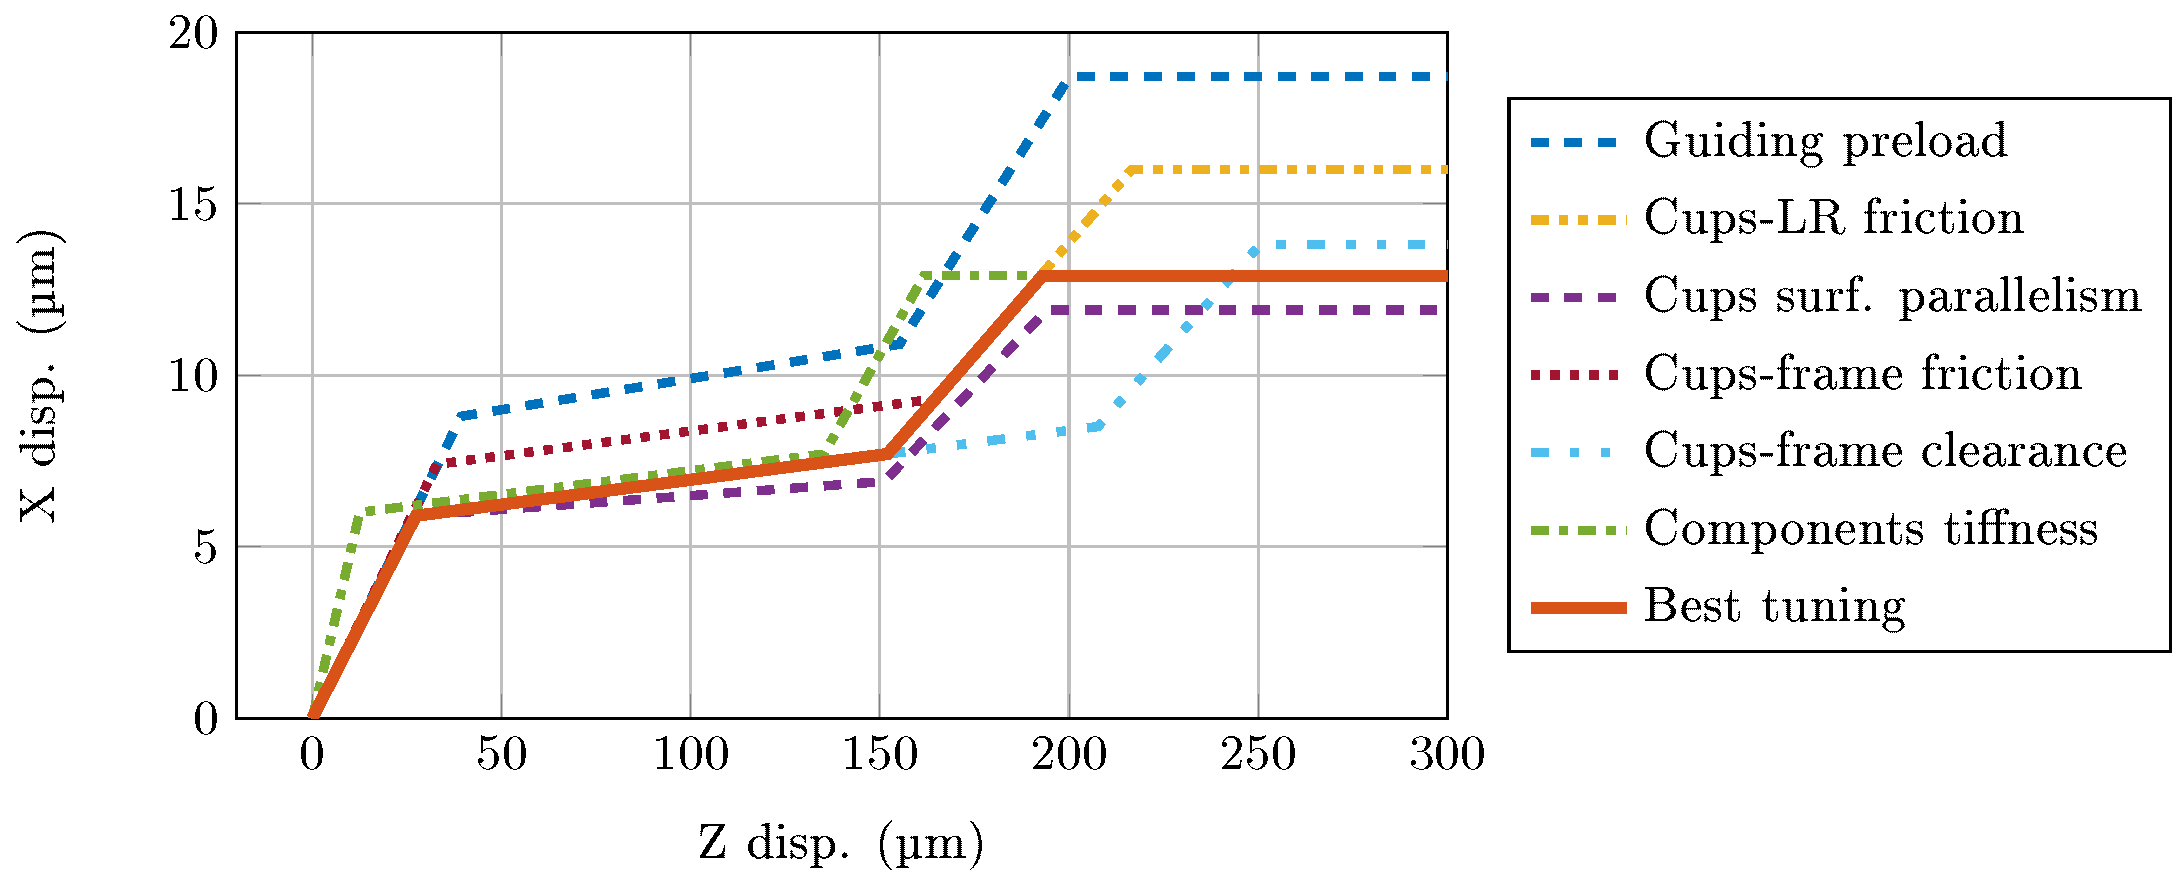
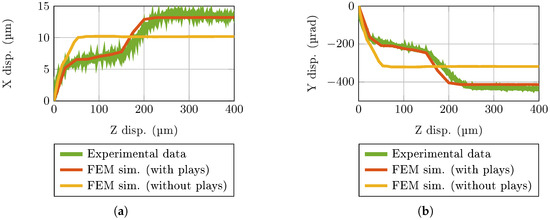
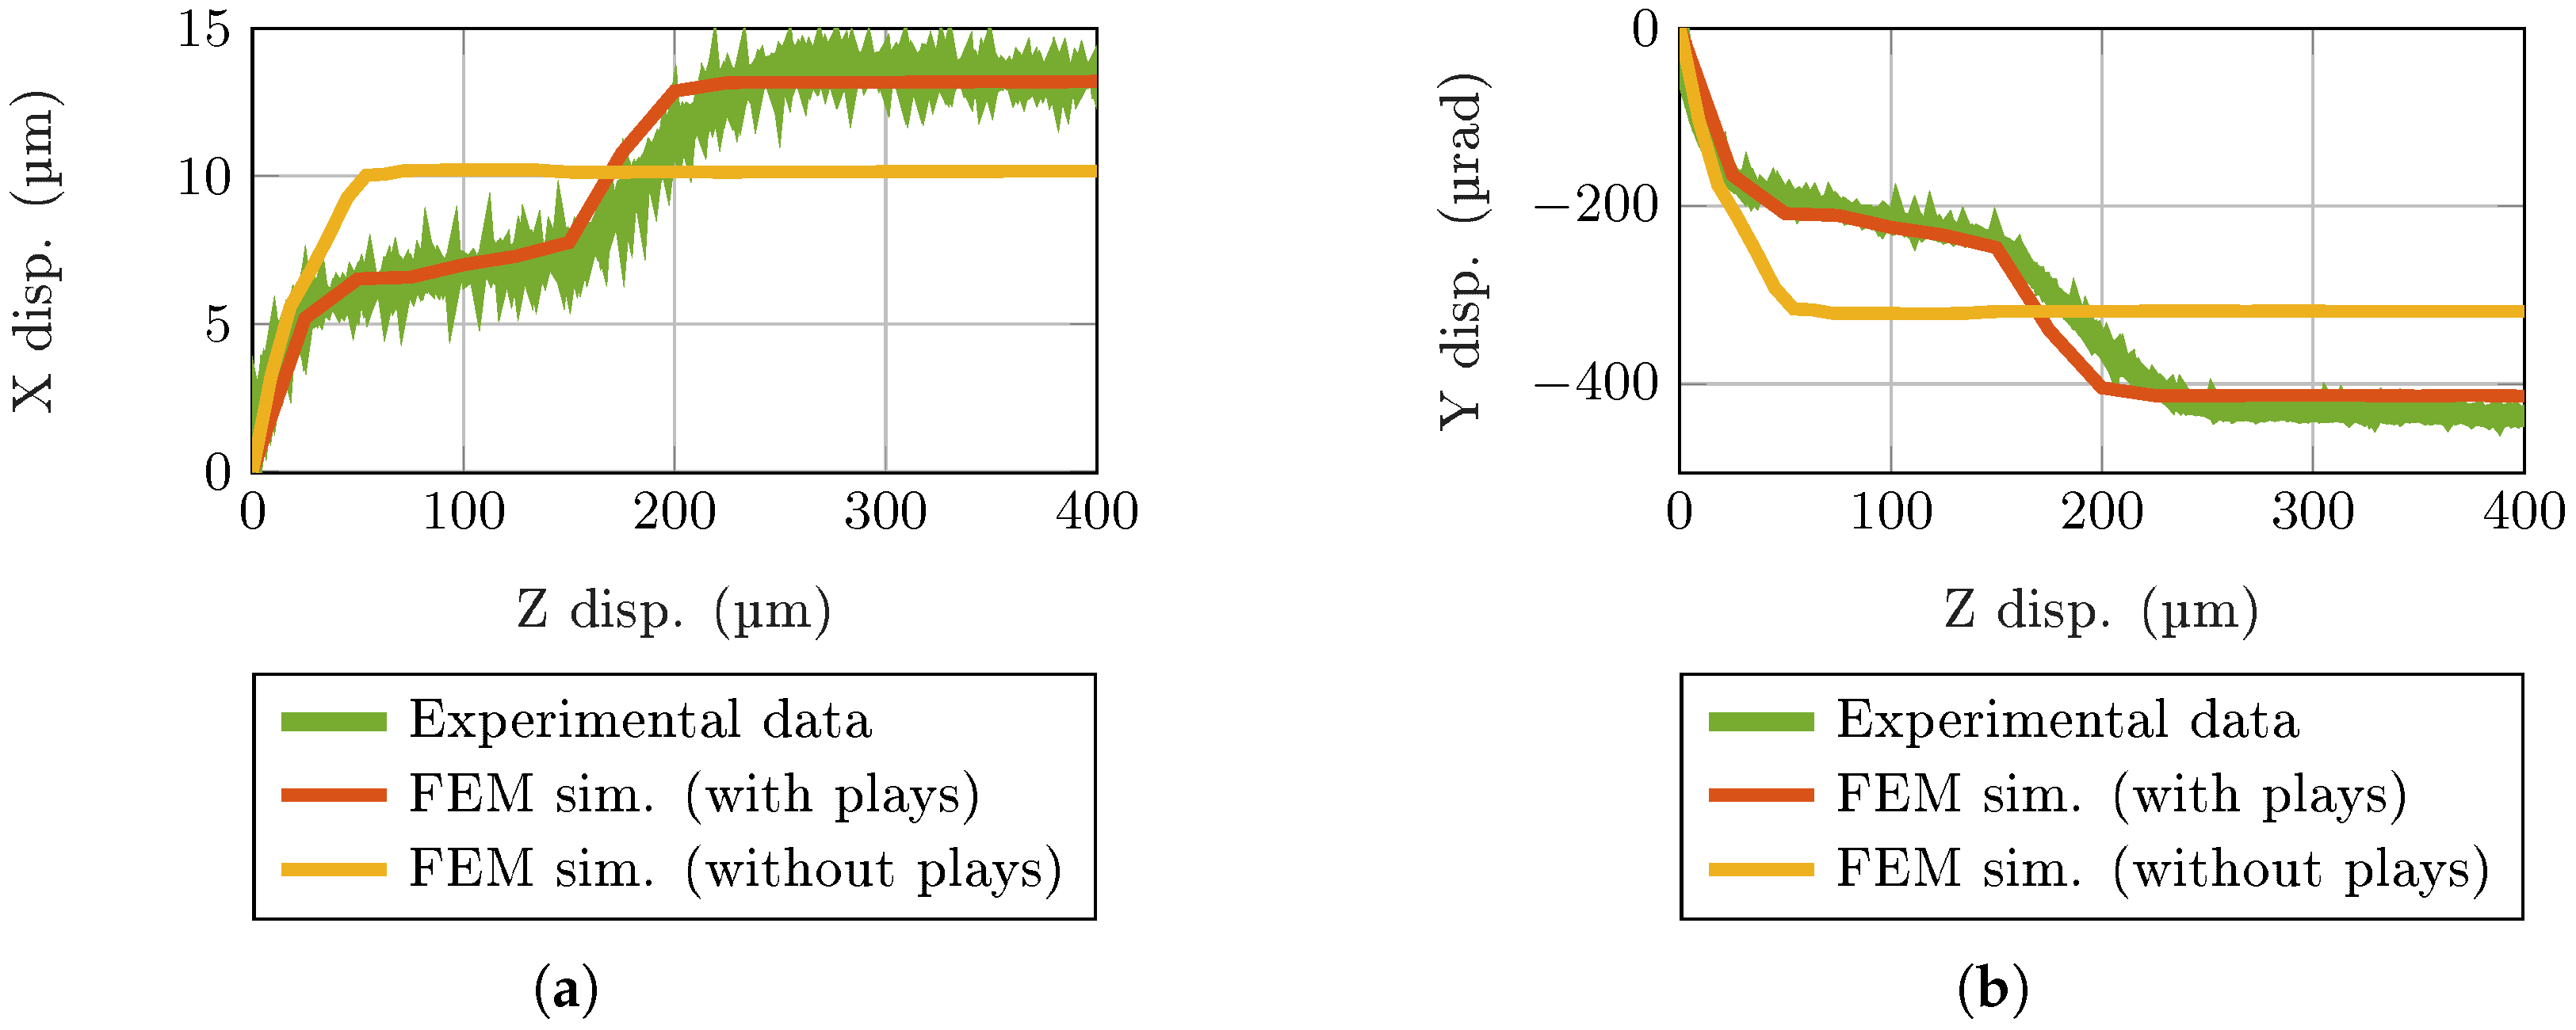
By setting the friction coefficient based on experimental estimates, the remaining model parameters are tuned to fit the experimental data. In Figure 14, the contribution of each parameter is qualitatively reported. As can be seen, each parameter affects a specific aspect of the curve, giving essential insights for the manual tuning.
Figure 14.
A schematic representation of the model results with the best tuning of the parameters is shown in the figure. On top of that, other curves are shown, representing the effects of increasing one of the model parameters at a time. The effect of the parameters is not to scale.
It is worth noticing that the friction coefficient of the rollers is much lower with respect to the one at the slider. This means that the rollers start rolling as soon as the LR moves. For this reason, the roller side of the guiding system (X+) does not actually contribute in shaping the curve, except for applying the preload.
The friction coefficient between the slider cup and the slider structure is set to 0.010 to match the measured plunger side motion/runner rotation. It is reasonable to consider for this parameter the same uncertainty used for the cups-on-LR friction, i.e., 0.002.
The clearance is assumed to be the same for the two cups, equal to 120 μm, with an uncertainty of approximately 10%. This is also justified by the high repeatability of the hysteresis cycle. The curve slope during the cups’ sliding on the structure, i.e., the second branch of the piecewise curve, is justified by the parallelism tolerances of the cup. The caps are assumed to be equal, with a planarity tolerance of 10 ± 1 μm.
The screws connecting the slider structure to the mechanism frame are modeled with bush elements, i.e., six-component spring. By tuning the parameters, it has been observed that the stiffness of the bolt connection dominates in defining the initial slope of the curve. The shear stiffness of the bolt connection is set to 140 N mm−1. By fitting a line to the first part of the graph, the fitting uncertainty is below 5%. This relative uncertainty can be propagated and considered to be equal to the uncertainty of the bushing’s stiffness.
Figure 15 reports the simulation results (with and without clearance) for the FE model, correlated with the experimental data. The figure shows that the role of the clearance is fundamental, introducing the change of slope in the lateral displacement and rotation and influencing the final saturation level. In addition, the figure shows that the final saturation occurs for a longer Z stroke of the runner, with respect to the case in which the clearance is not present.
Figure 15.
Correlation of the slider–roller FE model to the experimental data. The plot shows the simulation results by considering 120 μm of clearance between the slider cup and the structure and by removing the clearance effects (without clearance). (a) shows the lateral (in X) displacement, observed at the plunger head, available only for the first part of a long stroke test, before the signal is lost. (b) shows the LR rotation around Y.
3.2. Roller–Roller Guiding System Multi-Body Model
The roller–roller behavior is dominated by the roller run-out of the fixed roller guide. In order to estimate the run-out of both rollers, a simple analytical model is used, approximating the kinematic of the two cams. The profile of each roller is defined by using polar coordinates around the roller center. The run-out is approximated by using harmonic functions with a period equal to multiples of the roller complete rotation. The expression of the roller radius affected by run-out (, with ) is reported in the following Equation (1):
is the mean value of the roller radius, N is the number of sine components used to model the run-out, and are the amplitude and the phase of the k-th run-out component of the i-th roller, and is its rotation.
Considering the wheelbase of the two rollers equal to d, the linear runner rotation produced by the run-out can be approximated by the following Equation (2):
Assuming that the rollers roll without slipping on the LR and that the run-out components () are small compared with , the rollers’ rotation can be written as in the following Equation (3):
By using Equations (2) and (3), the linear runner rotation around Y can be written as a function of its axial displacement.
An iterative procedure is used to find an educated initial guess for the run-out parameters. In particular, it is observed that the first harmonic component does not provide any contribution: mm. Additionally, the number of harmonic components N is set to be equal to 3.
Having a reasonable initial guess as an initial condition, the curve obtained by Equation (2) can be fit to the experimental data to estimate the values of and . The cost function to be minimized for estimating the run-out parameters is reported in the following:
where is the linear runner rotation predicted by the analytical model as a function of the runner’s Z displacement at the m-th sampling point, , and the run-out amplitude and phase terms ( and ), and is the rotation measured experimentally for the same runner Z displacement.
The estimation problem is ill-conditioned due to the possibility of having a cancellation of the runner rotation, caused by in-phase run-out terms. For this reason, an additional term is included in the cost function for parameter fitting (see the last part of Equation (4)) to minimize the absolute values of . The factor w serves as a weighting coefficient. As a result, the estimated run-out amplitudes represent lower bounds for the actual roller run-out values. In other words, the primary contribution to the runner rotation comes from the relative phases of the run-out components, rather than their absolute magnitudes.
The roller profiles obtained by the fitting procedure are used to generate the cam profile of the rollers. These cams are used as fixed guide rollers in an MSC ADAMS model of the mechanism, simulating the runner repositioning in order to reproduce the experimental data obtained during the long stroke tests. A schematic representation of the model is reported in Figure 16.
Figure 16.
Schematic representation of the multi-body model, in MSC ADAMS. The rollers of the fixed guide are not circular, and their profile is defined by Equation (1). The rollers of the flexible guides are also affected by run-out, but the run-out effect is compensated by the washer spring. For this reason, they are considered circular in the simulation.
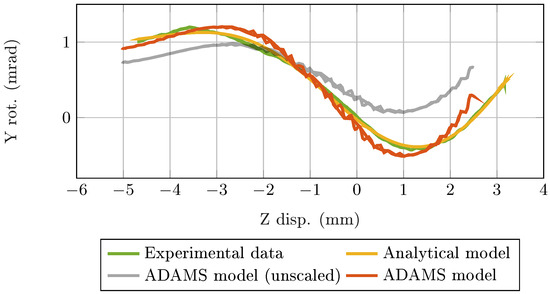
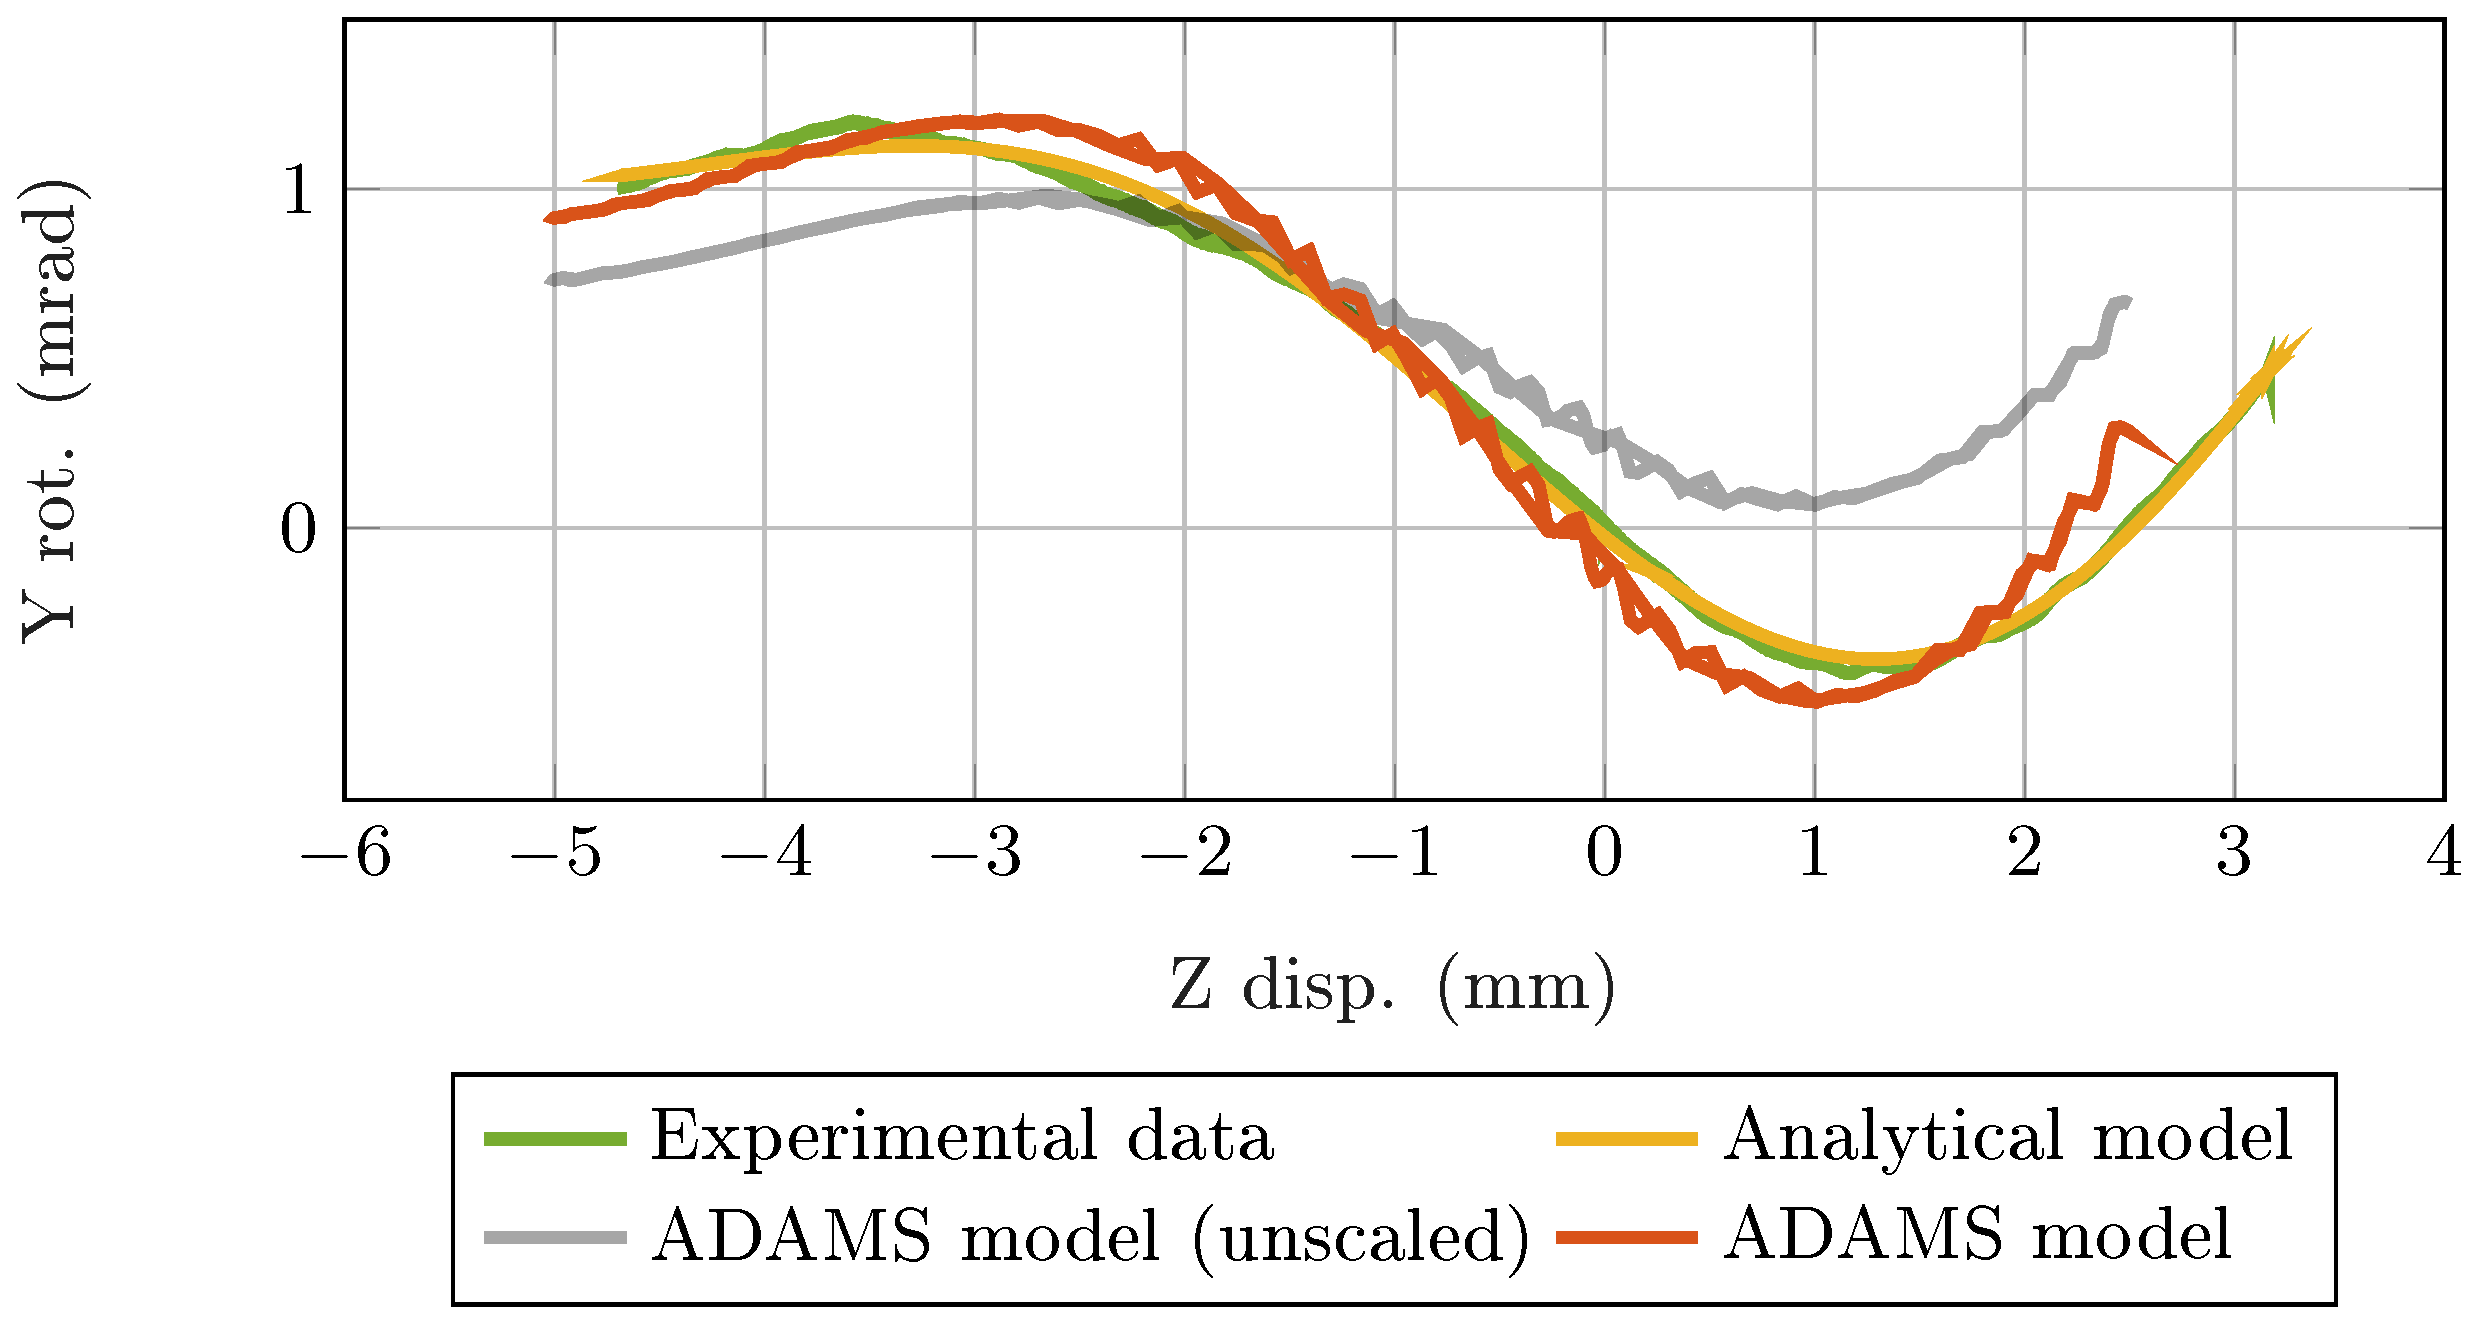
Due to the penetration-based model used to compute the contact forces [28] and the simplifications adopted in the analytical model, the runner rotation observed in the simulation is smaller than the rotation predicted by Equation (2) (see Figure 17). In the analytical model, the contact point between each roller and the runner is assumed to be always vertically aligned with the roller center. In reality, due to the actual cam profile, the contact point can shift slightly forward or backward from its nominal position, depending on both the roller profile and the runner’s rotation. In order to compensate for the observed attenuation, the run-out parameters are scaled before generating the cam profile to be used in MSC ADAMS.
Figure 17.
Results of the multi-body model simulation. The LR Y rotation during a long-stroke test is reported and compared with analytical computation and multi-body simulation, using MSC ADAMS. Results of the MSC ADAMS model with the parameters not scaled are also reported as a reference.
The rollers’ run-out parameters estimated by the fitting procedure are reported in Table 3. However, this corresponds just to a single possible solution of the estimation problem. This means that, by properly adjusting the phase of the run-out components, the run-out amplitude can be selected arbitrarily, larger than the ones reported in Table 3. For this reason, the uncertainties computed for the model parameters are very large.
Table 3.
Fixed roller guide run-out parameters (see Equation (1)). The run-out parameters are scaled by a factor of 1.55 to generate the final cam profile simulated in MSC ADAMS.
The run-out measured by the CMM reported in Figure 11 is larger with respect to the estimated one (Table 3). In this sense, the results are comparable, with the estimated run-out just a lower limit for the actual one. Additionally, the CMM data refer to the run-out observed on a specific section plane of the rollers. The actual run-out behavior will be an average of the rollers’ run-out, integrated along the rollers’ thickness. Moreover, the CMM inspects a set of points along the roller circumference. However, the guiding system preload presses the pin against the roller surface, and the roller against the runner. This means that the contacts are not located on a specific point (or a line, considering the roller thickness) but on a patch: the bodies, and, consequently, the run-out profiles, deform in the contact patch, making the undeformed profile not directly comparable with the experimental data. However, the run-out reported in Figure 11c, approximately equal to 10 μm, for a roller angle (theta) between 40° and 180°, is qualitatively comparable with the values reported in Figure 11. The same holds true for the run-out of Figure 11d, for a roller angle (theta) between −120 and 40° approximately equal to 20 μm. Note that, as already stated in the previous section, the 7 mm of a runner stroke spanned during the long-stroke tests explored only 100° of rollers’ rotation. Graphical results are shown in Figure 17 and Figure 18.
4. In-Flight Performance Prediction for LISA
The validated models available allow for evaluating the possible flight performance of the guiding system in LISA, in particular during a TM repositioning test (see Figure 3).
The FE model of the BBM slider–roller side guide is extended to the flight hardware by substituting the BBM frame with the LPF flight one (see Figure 12b). The plunger geometry is included in the simulation and connected to the LR with bush elements, replicating the stiffness of the flexures connecting the plunger and the runner. Due to a relevant computational burden, a single GPRM unit is simulated. The symmetrical behavior of the mechanism is exploited to approximate the effect of having the second unit acting on the other side of the TM. The TM center is constrained to move along Z, blocking its X and Y displacements but allowing all the TM rotations. This assumption is supported by the LPF telemetry data, which highlight Y rotation as critical while showing negligible TM displacement in the X direction during repositioning (see Figure 3a,b). Additionally, the TM is preloaded in the Z direction to the GPRM plunger to simulate the preload force exerted by the unit not included in the model. The friction coefficient between the plunger and the TM is selected starting from pin-on-disk tests results, collected into the LPF GPRM data package, not available for public consultation. The test results return a friction coefficient equal to . Starting from this reference value, the friction coefficient is tuned by looking at its effect on the TM Y rotation during a TM repositioning test. The TM Y rotation at the reversal is limited by friction between the plunger and the indent. Using mechanism parameters derived from the standalone behavior characterized during the BBM test campaign, the TM–plunger friction can be estimated to reproduce the observed Y-rotation step. At the end of the tuning process, the friction coefficient is set to 1.2, which lies within the uncertainty range of the experimentally determined value.
As already done for the BBM slider–roller simulation, a preload analysis sets the initial configuration of the guiding system. A cycle spanning approximately 500 μm along Z, in forward and backward direction, is simulated to replicate the in-flight repositioning tests. The TM rotation observed during the simulation is reported in Figure 19, for both cases with and without clearance between the slider cups and the slider structure. The clearance brings an increment of the X displacement of the plunger head (as shown Figure 15) and, consequently, of the overall Y rotation of the TM during repositioning.
Figure 19.
TM rotation around Y during a repositioning simulation. (a) reports the case with clearance between the slider cup and the slider structure. (b) reports the case without clearance between the slider cup and the slider structure. The color code refers to the time: lighter points come earlier in time.
The simulation considering the clearance shows the piecewise linear effect (Figure 19a) observed for the plunger side motion. Since the LPF case (Figure 3) corresponds to an as-built flight GPRM whose guiding performance was not tested on the ground, the comparison with Figure 19 can only be qualitative. The overall range of TM Y rotation during a 500 μm repositioning, shown in Figure 19a, appears consistent with an in-flight value of approximately 130 μrad. Similarly, by focusing on Figure 19b, the sudden Y rotation concentrated at the inversion is similar to the in-flight one (about 90 μrad). In both cases, the Y rotation after the inversion shows a saturated behavior, different from the LPF telemetry data. However, the drifting effect of the Y rotation level is justified by the misalignment between the mechanism and the sensing reference frames.
To simulate a realistic repositioning test in the case of roller–roller guiding, both units must be included in the model. In this case, the assumption of symmetrical behavior is no longer valid. For this reason, the MSC ADAMS model of the single unit, correlated as shown in Figure 17, is mirrored on the opposite side of the TM. The rollers are rotated about their axes to adjust the initial phase of the run-out. This corresponds to a different mechanism’s assembly configuration, with the same rollers’ run-out level. The model of the units is completed with the geometries of the plungers, which are connected to the relative LR by bush elements, as done for the FE model of the GPRM. The friction coefficient between the plungers and the TM is set to 1.2, as for the slider–roller simulation.
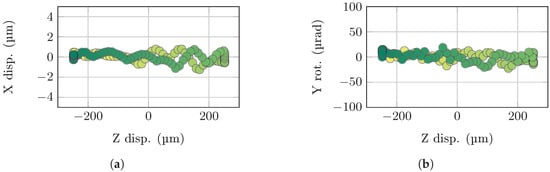
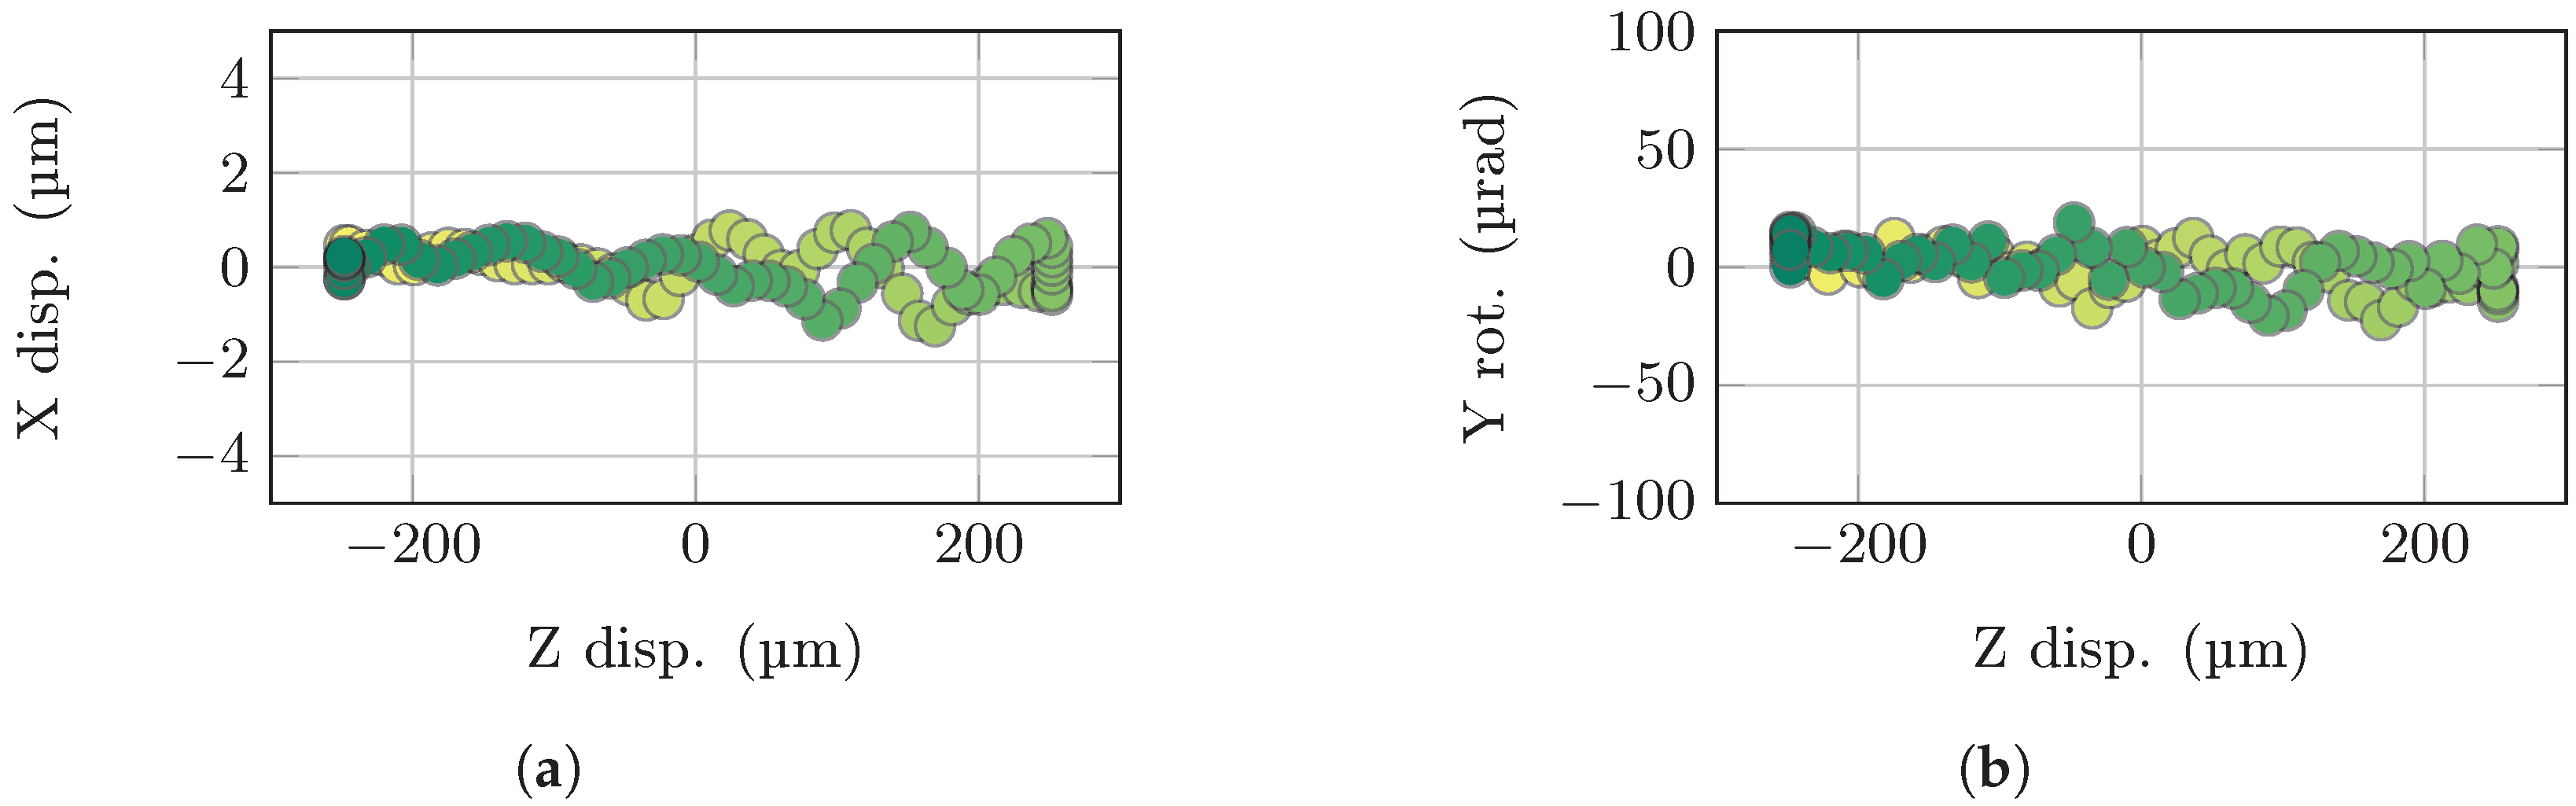
Simulation results are reported in Figure 20. In the case of roller–roller, the behavior of the system is not symmetric. Non-negligible X TM displacement can be observed during the repositioning test, as reported in Figure 20a. Small differences between the forward and backward branches can be associated with small slipping of the rollers on the linear runner. When the LR is actuated freely, the rollers are expected to roll without sliding on the runner surface, as highlighted by ground tests on the BBM. This has already been confirmed also by simulation (see Figure 18). Conversely, the forces exchanged with the grabbed TM can modify the force balance at the guiding interface, introducing a sliding effect at the runner-roller interface. Identifying the boundary conditions for roller slipping is not straightforward, as it is governed by the complex interaction between the plunger head and the TM indent in terms of both geometry and friction. To investigate this boundary, multiple simulations are performed with artificially varied friction coefficients between the TM and the plunger. As expected, the slipping is reduced by reducing the friction, but it is not fully eliminated. Given the sliding of the rollers, the trajectory of the TM, in the two directions, is not overlapped, as expected in the case of rollers rolling without slipping. However, the overall Y rotation of the TM is significantly reduced (about 50 μrad) with respect to the slider–roller configuration (90 ÷ 130 μrad).
Figure 20.
Simulation results for TM repositioning test with the GPRM having a roller–roller guiding system. (a) shows the TM displacement in X, while (b) reports the TM rotation around Y. The color code refers to the time: lighter points come earlier in time.
5. Lessons Learned and Conclusions
The LISA Pathfinder mission provided crucial insights into the Grabbing, Positioning, and Release Mechanism, enabling performance improvements in preparation for its development for the LISA mission. In particular, the non-ideal behavior of the GPRM guiding system significantly impacted the performance of both the repositioning function and the preliminary operations (handover) before the release of the test mass (TM) into free fall. This behavior has been linked to the guiding system’s asymmetric stiffness and friction, which cause the runner to rotate and the plunger head to shift laterally when the direction of motion is reversed. Limiting the lateral displacement during the plunger motion reversal in the handover phase is crucial for maintaining a consistent TM–plunger gap before release, ensuring successful TM injection into the geodesic.
Breadboard-level tests are performed to evaluate the actual flight configuration of an LPF mechanism guiding system (slider–roller) and to analyze the effects of a potential design improvement (roller–roller). FE model correlation with test results shows that slider clearance is one of the sources of non-linearity and, potentially, of additional lateral displacement. However, after a first transient occurring immediately after the reversal, the plunger moves following an almost rectilinear trajectory over a long stroke of the runner. An alternative solution, based on a symmetric roller–roller configuration, shows that it significantly reduces the hysteretic lateral motion observed in the LPF slider–roller design. However, the rollers’ run-out brings a large runner rotation over a long stoke.
An extension of the BBM model to a flight case is made to predict mechanism performance during TM repositioning. The switching between two different levels of TM rotation around Y is observed, confirming the source of this hysteretic behavior, evident from LPF telemetry data. Although the roller–roller is affected by rollers’ slip on the LR during TM repositioning, bringing a non-repeatable trajectory of the TM, the absolute value of the TM Y rotation is significantly reduced, while marginally increasing the positioning uncertainty in the X direction.
The discriminant aspect in the definition of the guiding system baseline for LISA is the mechanism performance at the TM injection into geodesic. In particular, improving the TM–plunger gap prior to the TM release instant is highlighted to be critical during LPF. By considering that the release procedure is performed after a grabbing operation, the retraction of the plungers (at the handover) is performed after its extension (at the grabbing), strengthening the effects of the side plunger motion in eroding the gap between the TM and the indent. For this reason, the proposed GPRM baseline for LISA embeds a roller–roller guiding system configuration, giving a lower side motion of the plunger for the same amount of runner stroke. Additionally, it will also improve the repositioning accuracy, having a lower uncertainty in the TM states while performing repositioning operation.
Author Contributions
Conceptualization, M.T., A.A.G. and G.A.; methodology, M.T. and C.Z.; software, C.Z., M.T. and A.A.G.; validation, C.Z. and M.T.; formal analysis, C.Z. and M.T.; investigation, M.T., F.M., A.A.G., G.A., A.P.M., M.G. and R.F.; resources, D.B., A.P.M. and R.F.; data curation, M.T., M.G. and A.P.M.; writing—original draft preparation, A.A.G., F.M., M.T., E.D.R. and D.B.; writing—review and editing, M.T., E.D.R., F.M., A.A.G. and D.B.; visualization, M.T., F.M. and A.A.G.; supervision, D.B., C.Z. and E.D.R.; project administration, D.B. and R.F.; funding acquisition, D.B. and R.F. All authors have read and agreed to the published version of the manuscript.
Funding
This research is financially supported by ESA (European Space Agency), ASI (Italian Space Agency, grant number 2017-29-H.1-2020 “Attività per la fase A della missione LISA”), and INFN (National Institute for Nuclear Physics).
Data Availability Statement
Some or all data, models, or codes that support the findings of this study are available from the corresponding author upon reasonable request.
Acknowledgments
The authors wish to thank the GPRM baseline review board, composed of William J. Weber, Stefano Vitale, Valerio Ferroni, Paolo Sarra, Davide Vignotto, Rita Dolesi, Antonella Cavalleri, and Daniele Vetrugno.
Conflicts of Interest
The authors declare no conflicts of interest.
Abbreviations
The following abbreviations are used in this manuscript:
| BBM | breadboard model |
| CMM | coordinate measuring machine |
| EQM | Engineering Qualifying Model |
| FE | finite element |
| FM | Flight Model |
| GPRM | Grabbing, Positioning, and Release Mechanism |
| INFN | National Institute for Nuclear Physics |
| LISA | Laser Interferometer Space Antenna |
| LPF | LISA Pathfinder |
| LR | linear runner |
| PI | Physik Instrumente |
| TM | test mass |
References
- ESA-Website. Lisa. Available online: https://sci.esa.int/web/lisa (accessed on 30 November 2025).
- Bell, T.E. Hearing the heavens: The cosmos is thought to be awash with gravitational waves to which humanity is, as yet, deaf. Trudy E. Bell reports on LISA, an experiment on an unprecedented scale designed to put that right. Nature 2008, 452, 18–22. [Google Scholar] [CrossRef] [Scilit] [PubMed]
- Seoane, P.A.; Aoudia, S.; Audley, H.; Auger, G.; Babak, S.; Baker, J.; Barausse, E.; Barke, S.; Bassan, M.; Beckmann, V.; et al. The gravitational universe. arXiv 2013, arXiv:1305.5720. [Google Scholar] [CrossRef] [Scilit]
- Arun, K.G.; Belgacem, E.; Benkel, R.; Bernard, L.; Berti, E.; Bertone, G.; Besancon, M.; Blas, D.; Böhmer, C.G.; Brito, R.; et al. New horizons for fundamental physics with LISA. Living Rev. Relativ. 2022, 25, 4. [Google Scholar] [CrossRef] [Scilit]
- Pitkin, M.; Reid, S.; Rowan, S.; Hough, J. Gravitational wave detection by interferometry (ground and space). Living Rev. Relativ. 2011, 14, 5. [Google Scholar] [CrossRef] [Scilit] [PubMed]
- Chiavegato, V. Performance of the Electrostatic Control Force System for LISA Test Masses: Experimental Results from LISA Pathfinder and New On-Ground Measurements. Ph.D. Thesis, Università degli Studi di Trento, Trento, Italy, 2025. [Google Scholar]
- Zahnd, B.; Zimmermann, M.; Spörri, R. LISA-Pathfinder cage and vent mechanism development and qualification. In Proceedings of the 15th ESMATS Proceeding, Noordwijk, The Netherlands, 25–27 September 2013. [Google Scholar]
- Lee, J.; Han, J.H. Separation and release devices for aeronautical and astronautical systems: A review. Int. J. Aeronaut. Space Sci. 2025, 26, 131–161. [Google Scholar] [CrossRef] [Scilit]
- Liu, L.; Deng, H.; Luo, J.; Wang, W.; Liu, J. Statics and dynamics of a lunar anchored tethered system. Adv. Space Res. 2025, 75, 1277–1296. [Google Scholar] [CrossRef] [Scilit]
- Grimm, C.D.; Lange, C.; Lange, M.; Mierheim, O.; Witte, L.; Sasaki, K.; Chand, S.; Ksenik, E.; Grundmann, J.T.; Ho, T.M.; et al. The MASCOT separation mechanism: A reliable, low-mass deployment system for nano-spacecraft. CEAS Space J. 2020, 12, 343–365. [Google Scholar] [CrossRef] [Scilit]
- Zhong, Y.; Zhang, H.; Xue, C. Testing Scheme Design for Grabbing Positioning and Release Mechanism in Space Microgravity Environment. Sensors 2025, 25, 3010. [Google Scholar] [CrossRef] [Scilit] [PubMed]
- Mäusli, P.; Romano, R.; Lips, K.; Nellen, P. GPRM-Design description. In ESA Internal Document S2-HTS-DDD-3001; ESA: Paris, France, 2007. [Google Scholar]
- Neukom, A.; Romano, R.; Nellen, P.M. Testing and lessons learnt of LISA GPRM. In Proceedings of the 13rd ESMATS Proceedings, Vienna, Austria, 23–25 September 2009. [Google Scholar]
- Hordon, M.; Roehring, J. Investigation of the Adhesion of Metals in Ultra-High Vacuum; Technical Report; National Research Corp.: Cambridge, MA, USA; Norton Exploratory Research Division: Louisville, KY, USA, 1966. [Google Scholar]
- Miyoshi, K. Considerations in vacuum tribology (adhesion, friction, wear, and solid lubrication in vacuum). Tribol. Int. 1999, 32, 605–616. [Google Scholar] [CrossRef] [Scilit]
- Miyoshi, K. Aerospace mechanisms and tribology technology: Case study. Tribol. Int. 1999, 32, 673–685. [Google Scholar] [CrossRef] [Scilit]
- Roberts, E. Space tribology: Its role in spacecraft mechanisms. J. Phys. D Appl. Phys. 2012, 45, 503001. [Google Scholar] [CrossRef] [Scilit]
- American Society for Testing and Materials. Adhesion or Cold Welding for Materials in Space Environments; Vol. ASTM Special Technical Publication No. 431; American Society for Testing and Materials: Conshohocken, PA, USA, 1967; p. 19103. [Google Scholar]
- Armano, M.; Audley, H.; Baird, J.; Binetruy, P.; Born, M.; Bortoluzzi, D.; Castelli, E.; Cavalleri, A.; Cesarini, A.; Cruise, A.M.; et al. Beyond the Required LISA Free-Fall Performance: New LISA Pathfinder Results down to 20 μHz. Phys. Rev. Lett. 2018, 120, 061101. [Google Scholar] [CrossRef] [Scilit] [PubMed]
- Wanner, G. Space-based gravitational wave detection and how LISA Pathfinder successfully paved the way. Nat. Phys. 2019, 15, 200–202. [Google Scholar] [CrossRef] [Scilit]
- Vignotto, D. Analysis of the In-Flight Performance of a Critical Space Mechanism. Ph.D. Thesis, Doctorial School in Matherials, Mechatronics and Systems Engineering, Università degli Studi di Trento, Trento, Italy, 2021. [Google Scholar]
- Dalla Ricca, E.; Bortoluzzi, D.; Zanoni, C. An Improved Vibration Multi Mode-Based Technique for the Characterization of Metallic Adhesion Impulses. AIAA J. 2024, 62, 3988–3998. [Google Scholar] [CrossRef] [Scilit]
- Dalla Ricca, E.; Bortoluzzi, D.; Vignotto, D. Analysis and interpretation of the in-flight dynamics of a critical space mechanism. Adv. Space Res. 2025, 75, 542–559. [Google Scholar] [CrossRef] [Scilit]
- Tomasi, M.; Dalla Ricca, E.; Vignotto, D.; Bortoluzzi, D. Development of a dynamical model of a release mechanism for in-flight performance prediction. Adv. Space Res. 2023, 72, 4950–4964. [Google Scholar] [CrossRef] [Scilit]
- Köker, I.; Rozemeijer, H.; Stary, F.; Reichenberger, K. Alignment and testing of the GPRM as part of the LTP caging mechanism. In Proceedings of the 15th ESMATS Proceeding, Noordwijk, The Netherlands, 25–27 September 2013. [Google Scholar]
- Vignotto, D.; Zanoni, C.; Tomasi, M.; Bortoluzzi, D.; Ricca, E.D.; Pretto, I.; Radaelli, P. The role of friction in the LISA-pathfinder release mechanism anomaly. AIAA J. 2023, 61, 5232–5241. [Google Scholar] [CrossRef] [Scilit]
- Ansys 2025 R2 Product Release and Updates. 2025. Available online: https://www.ansys.com/products/release-highlights (accessed on 26 January 2026).
- Hexagon. MSC ADAMS Documentation. 2021. Available online: https://help-be.hexagonmi.com/bundle/Adams_2022.3_Getting_Started_Using_Adams_View/raw/resource/enus/Adams_2022.3_Getting_Started_Using_Adams_View.pdf (accessed on 5 December 2025).

Disclaimer/Publisher’s Note: The statements, opinions and data contained in all publications are solely those of the individual author(s) and contributor(s) and not of MDPI and/or the editor(s). MDPI and/or the editor(s) disclaim responsibility for any injury to people or property resulting from any ideas, methods, instructions or products referred to in the content. |
© 2026 by the authors. Licensee MDPI, Basel, Switzerland. This article is an open access article distributed under the terms and conditions of the Creative Commons Attribution (CC BY) license.