


Abstract
The mixture of honey and propolis has become increasingly popular due to its potential functional and antimicrobial properties, generating interest in its stability and quality during storage. This study aimed to evaluate the evolution of physico-chemical and microbiological parameters of honey enriched with different propolis concentrations (0.1%, 0.2%, and 0.3%, w/w) over a 30-day period under controlled storage conditions. Honey samples with and without propolis were stored at 20 °C in the absence of light, and physico-chemical parameters (moisture content, electrical conductivity, pH, and acidity), antioxidant-related indicators (total phenolic content, total flavonoid content, and DPPH radical scavenging activity), and microbiological parameters (the total aerobic viable count, yeast and mold counts, and coliform bacteria counts) were analyzed at defined intervals. The results showed that the monitored physico-chemical parameters remained stable throughout the storage period, indicating good product stability. Antioxidant-related parameters increased proportionally with the concentration of propolis added, reflecting the contribution of phenolic compounds and flavonoids present in propolis. Microbiological analysis confirmed the absence of coliform bacteria in all samples, while a gradual increase in total viable count and in yeast and mold counts was observed in propolis-enriched honey samples during storage. Overall, the findings indicate that honey–propolis mixtures maintain physico-chemical stability, comply with microbiological safety requirements, and exhibit enhanced antioxidant potential during short-term storage. These conclusions are limited to the 30-day storage period investigated and should not be extrapolated to long-term storage stability.
1. Introduction
Bee products, which include honey, propolis, pollen, royal jelly, beeswax, and bee venom, have been recognized for their rich content of bioactive compounds and have been utilized since ancient times in traditional medicine due to their potent therapeutic effects [1].
These products are valued as important natural resources, reflecting the broad range of benefits associated with beekeeping practices [2]. The physicochemical properties, nutritional profiles, and bioactive compound content of bee products exhibit considerable variability depending on the specific product type. Such differences are influenced by multiple factors, including the bee species, botanical origin of raw materials, geographical location, climatic and seasonal conditions, soil composition, and production methods [3,4]. In modern applications, honey, propolis, and bee pollen remain widely used across various sectors, particularly in the food, pharmaceutical, and cosmetic industries, due to their functional properties and reported health-related potential.
Honey is the most widely consumed bee product and is defined as a natural sweet substance synthesized by Apis mellifera bees. The production of honey begins with the collection of floral nectar and honeydew, which are enzymatically processed within the body of bees, combined with specific bee secretions, and subsequently dehydrated and stored in honeycombs to mature [2,5]. By the end of the production process, honey is a supersaturated mixture of sugars, and its physicochemical properties and composition can vary considerably among different types, primarily due to the botanical origin of the nectar. Additional factors such as climate, geographical location, and soil characteristics also contribute to these variations [6,7]. Within the European Union, there are standards that define honey as a food product and regulate the quality of honey intended for commercialization. According to Council Directive 2001/110/EC, honey is defined as a natural sweet substance produced by Apis mellifera bees from the nectar of plants or from secretions of living parts of plants or excretions of plant-sucking insects on the living parts of plants, which the bees collect, transform by combining with specific substances of their own, deposit, dehydrate, store and leave in honeycombs to ripen and mature. Council Directive 2001/110/EC, Council Regulation (EU) No 1308/2013, and the Codex Alimentarius standard (CXS 12-1981, amended in 2022) describe the quality factors and requirements for the commercial quality of honey. These include general criteria related to foreign tastes or odours, acidity, and natural enzyme content, as well as specific compositional parameters such as sugar content, moisture content, water-insoluble content, electrical conductivity, free acid, diastase activity, and hydroxymethylfurfural (HMF) content.
Particularly noteworthy properties of honey are its antioxidant and antimicrobial activities, which are closely related, as many of the same bioactive compounds, such as phenolic acids and flavonoids, contribute to both oxidative stress reduction and the inhibition of microbial growth. In addition to its polyphenolic content, the antimicrobial activity of honey is also attributed to its high osmotic pressure, natural acidity, and hydrogen peroxide content. The antimicrobial properties of both monofloral and polyfloral honeys have been extensively investigated against various microbial species, including Staphylococcus aureus and Escherichia coli [8,9], and compared to those of manuka honey [10], which is known for its strong antibacterial activity. The combination of honey with other bee-derived products, such as propolis, may further enhance its antimicrobial efficacy. Propolis is a resinous material collected by honeybees from plant exudates, which is mixed with beeswax to produce a glue-like material used to seal cracks and gaps in the hive structure [11]. Bioactive compounds determined in high concentrations, particularly pinocembrin, quercetin, chrysin, and artepillin C, contribute to the pronounced antimicrobial activity of propolis, which has been demonstrated against several pathogenic microorganisms, including Listeria monocytogenes and Clostridium perfringens [12,13]. Furthermore, propolis is known to exhibit a broad spectrum of biological activities, including antioxidant, anti-inflammatory, antineurodegenerative, antitumor, antiparasitic, antiviral, hepatoprotective, local anesthetic, and free radical scavenging properties [4].
The antimicrobial activity of honey–propolis mixtures has been investigated in several studies. Spanish thyme (Thymus spp.) and chestnut (Castanea sativa) honeys enriched with 10% ethanolic extract of propolis demonstrated synergistic antimicrobial effects against Listeria monocytogenes and Clostridium perfringens [12]. Similarly, honey combined with ethanolic extract of propolis from Egypt exhibited activity against multidrug-resistant uropathogens, including Pseudomonas aeruginosa, Escherichia coli, Klebsiella pneumoniae, Staphylococcus saprophyticus, and Candida albicans [14]. In another study, Romanian honey mixed with propolis extract was found to be effective against Pseudomonas aeruginosa, Escherichia coli, and Staphylococcus aureus strains [15]. The addition of propolis extract to honey has also been shown to significantly increase the content of phenolic compounds, particularly flavonoids and phenolic acids such as chrysin, pinocembrin, p-coumaric acid, and ferulic acid, and to enhance its antioxidant, antiradical, and reducing activities in a dose-dependent manner [16].
The studies discussed above were conducted using honey samples mixed with ethanolic extracts of propolis, whereas commercially available mixtures often contain raw propolis rather than standardized extracts. For this reason, the present study focused on the changes in antioxidant properties and the microbiota of honey supplemented with propolis at concentrations of 0.1%, 0.2%, and 0.3%. These properties were evaluated on the first day of mixture preparation and after 30 days to obtain comprehensive information regarding the stability of the honey–propolis mixture. This study represents a novel investigation of the combined effects of raw propolis on both microbiological quality and antioxidant activity of honey over time, providing insights into the stability, functional potential, and practical applicability of honey–propolis mixtures in commercially relevant formulations.
2. Materials and Methods
2.1. Materials
All solvents used were of analytical grade. Sodium hydroxide (NaOH), Folin–Ciocalteu reagent, sodium carbonate (Na2CO3), methanol, hydrochloric acid (HCl), sodium nitrite (NaNO2), aluminum chloride (AlCl3), and 1,1-diphenyl-2-picrylhydrazyl (DPPH) were obtained from Merck KGaA (Darmstadt, Germany). The Plate Count Agar (PCA) culture medium, Dichloran Rose Bengal Chloramphenicol (DRBC) agar culture medium, Violet Red Bile Lactose (VRBL) agar culture medium, and liquid Brilliant Green Bile Lactose Broth (BGBLB) used for microbiological analysis were also purchased from Merck KGaA (Darmstadt, Germany).
Polyfloral honey and propolis were purchased from a registered beekeeper in Suceava County, Romania. Two polyfloral honey samples (H1 and H2) from the autumn 2024 harvest were used in this study; despite their common origin, the two samples were expected to differ in physicochemical parameters, allowing evaluation of how honey composition influences the properties of the honey–propolis mixture. One raw propolis (Pr) sample was used in the study. Prior to enrichment, the propolis was frozen at −20 °C for 5 h, ground using a laboratory processor, and sieved with a shaker system; the fraction with particle sizes below 50 μm was selected. The propolis powder was stored under freezing conditions to prevent agglomeration. Freezing, grinding, and sieving were carried out to obtain a fine and homogeneous propolis powder, facilitating uniform dispersion within the honey matrix and ensuring reproducible characteristics of the honey–propolis mixture.
2.2. Mixture Preparation
The honey–propolis mixtures were prepared using two polyfloral honey samples (H1 and H2), each supplemented with propolis at concentrations of 0.1%, 0.2%, and 0.3% (w/w). The resulting formulations were designated as H1, H1–Pr 0.1, H1–Pr 0.2, H1–Pr 0.3, H2, H2–Pr 0.1, H2–Pr 0.2, and H2–Pr 0.3. Two separate sets of each mixture were prepared: one set was analyzed on the first day of preparation (day 0), and a second set was stored under controlled conditions and analyzed after 30 days to evaluate physico-chemical and microbiological changes. During the storage period, samples were kept at room temperature (20 ± 2 °C), protected from light, in airtight glass containers.
2.3. Physico-Chemical and Microbiological Analysis
2.3.1. Determination of Moisture Content
The moisture content of each honey sample and its corresponding honey–propolis mixture was determined by refractometry using an Abbé Mark II Plus refractometer (Ametek Reichert Technologies, Depew, NY, USA). This method is based on measuring the refractive index of honey. Prior to analysis, samples were liquefied at 50 °C to ensure homogenization. Moisture content values (%) corresponding to the refractive index were determined according to the Chataway table [17].
2.3.2. pH Determination
The pH of each honey sample and its corresponding honey–propolis mixture was measured using a 10% (w/w) solution and a high-precision pH meter, Mettler Toledo FiveGo (Mettler Toledo, Columbus, OH, USA) [17].
2.3.3. Determination of Free Acidity
Free acidity, an important quality parameter of honey, reflects the total content of free acids and is expressed in milliequivalents per kilogram of product. The analysis was performed using a standardized titrimetric method. Ten grams of each honey sample or honey–propolis mixture were dissolved in 75 mL of distilled water and stirred to achieve a homogeneous solution. The initial pH of the solution was measured, followed by titration with 0.1 M NaOH until reaching a final pH of 8.30, using an automatic titrator TITROLINE easy (Schott Instruments, Mainz, Germany) [17]. Free acidity was calculated using the following formula:
Free acidity = mL 0.1 M NaOH × 10.
2.3.4. Color Determination
The color profile of each honey sample and its corresponding honey–propolis mixture was evaluated using a CR-5 colorimeter (Konica Minolta, Tokyo, Japan). The CIE L*a*b* color space coordinates were measured, where L* represents lightness (0–100 scale), and a* and b* correspond to chromatic coordinates associated with red/green and yellow/blue tones, respectively. In this system, positive a* and b* values indicate red-orange-yellow hues; negative a* and positive b* indicate yellow-green; negative values for both indicate green-blue; positive a* and negative b* correspond to blue-purple-red tones. The device was calibrated with a white standard plate, and each sample was measured in triplicate. Chroma (C*ab) and hue angle (h*ab) were also calculated.
2.3.5. Electrical Conductivity Determination
Electrical conductivity was measured using a portable HQ14d conductometer (Hach, Loveland, CO, USA). Analyses were performed on solutions prepared by dissolving 20 g of each honey sample or honey–propolis mixture in 100 mL of distilled water. Results are expressed in microsiemens per centimeter (μS/cm) and reflect the ionic concentration and mineral composition of the sample, serving as a relevant parameter for characterizing honey’s physico-chemical quality [17].
2.3.6. Total Polyphenol Content Determination
Total polyphenol content (TPC) was evaluated following the method of Biesaga & Pyrzyńska [18]. Samples were prepared by mixing 1 g of each honey sample or its corresponding honey–propolis mixture with 5 mL of 40% methanol in acidified water (v/v, pH = 2, adjusted with HCl) and stirred for 15 min with a magnetic stirrer to extract phenolic compounds. Subsequently, 0.2 mL of the extract was combined with 2 mL of 1:10 diluted Folin–Ciocalteu reagent and 1.8 mL of 7% Na2CO3 solution (w/v) [19]. After incubation in the dark, absorbance was measured at 750 nm using a UV-3600 Plus UV-Vis-NIR spectrophotometer (Shimadzu Corporation, Kyoto, Japan). Total polyphenol content was quantified using a calibration curve prepared with gallic acid (0–1000 mg/L). Results are expressed as milligrams of gallic acid equivalents (GAE) per 100 g of honey.
2.3.7. Determination of Flavonoid Content
Flavonoid content was evaluated using the standardized method described by Pauliuc et al. [19]. One gram of each honey sample or its corresponding honey–propolis mixture was dissolved in 5 mL of 40% methanol in acidified water (v/v, pH = 2, adjusted with HCl) and stirred for 15 min with a magnetic stirrer to ensure uniform extraction of flavonoid compounds. From the obtained extract, 5 mL was mixed with 300 µL of 5% NaNO2 and 300 µL of 10% AlCl3 (w/v), and the mixture was incubated for 5 min in the dark. Subsequently, 2 mL of 1 N NaOH was added, followed by an additional 6 min incubation. Absorbance was measured at 510 nm using a UV-3600 Plus UV-Vis-NIR spectrophotometer (Shimadzu Corporation, Kyoto, Japan), and total flavonoid content was determined using a calibration curve prepared with quercetin (0–1000 mg/L) [19].
2.3.8. Determination of Antioxidant Activity by the DPPH Method (1,1-Diphenyl-2-picrylhydrazyl)
The antioxidant activity of honey samples was evaluated using the DPPH free radical, according to the method described by Brand et al. [20]. The samples were prepared by dissolving 1 g of each honey sample or its corresponding honey–propolis mixture in 5 mL of 40% (v/v) methanol with acidified water and were stirred for 15 min using a magnetic stirrer to ensure complete extraction of antioxidant compounds [19]. For the analysis, 35 µL of the obtained extract were mixed with 250 µL of DPPH solution. The absorbance of the solutions was measured at 515 nm using a UV-3600 Plus UV-Vis-NIR spectrophotometer (Shimadzu Corporation, Kyoto, Japan). DPPH activity was expressed as a percentage (%DPPH) according to the following equation:
where A0 is the absorbance of the DPPH solution and A1 is the absorbance of the sample. All measurements were performed in triplicate.
2.3.9. Microbiological Analysis
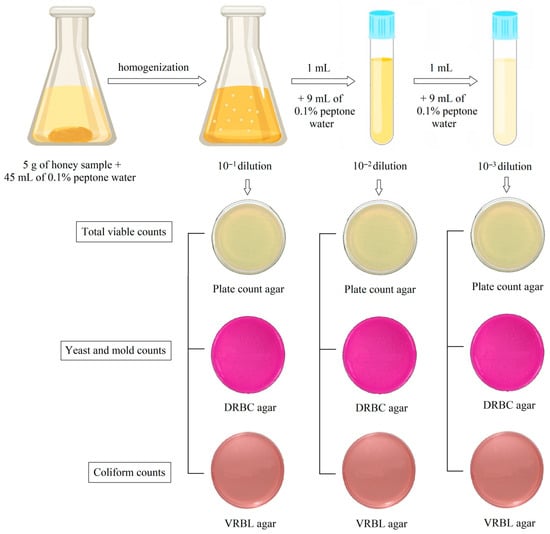
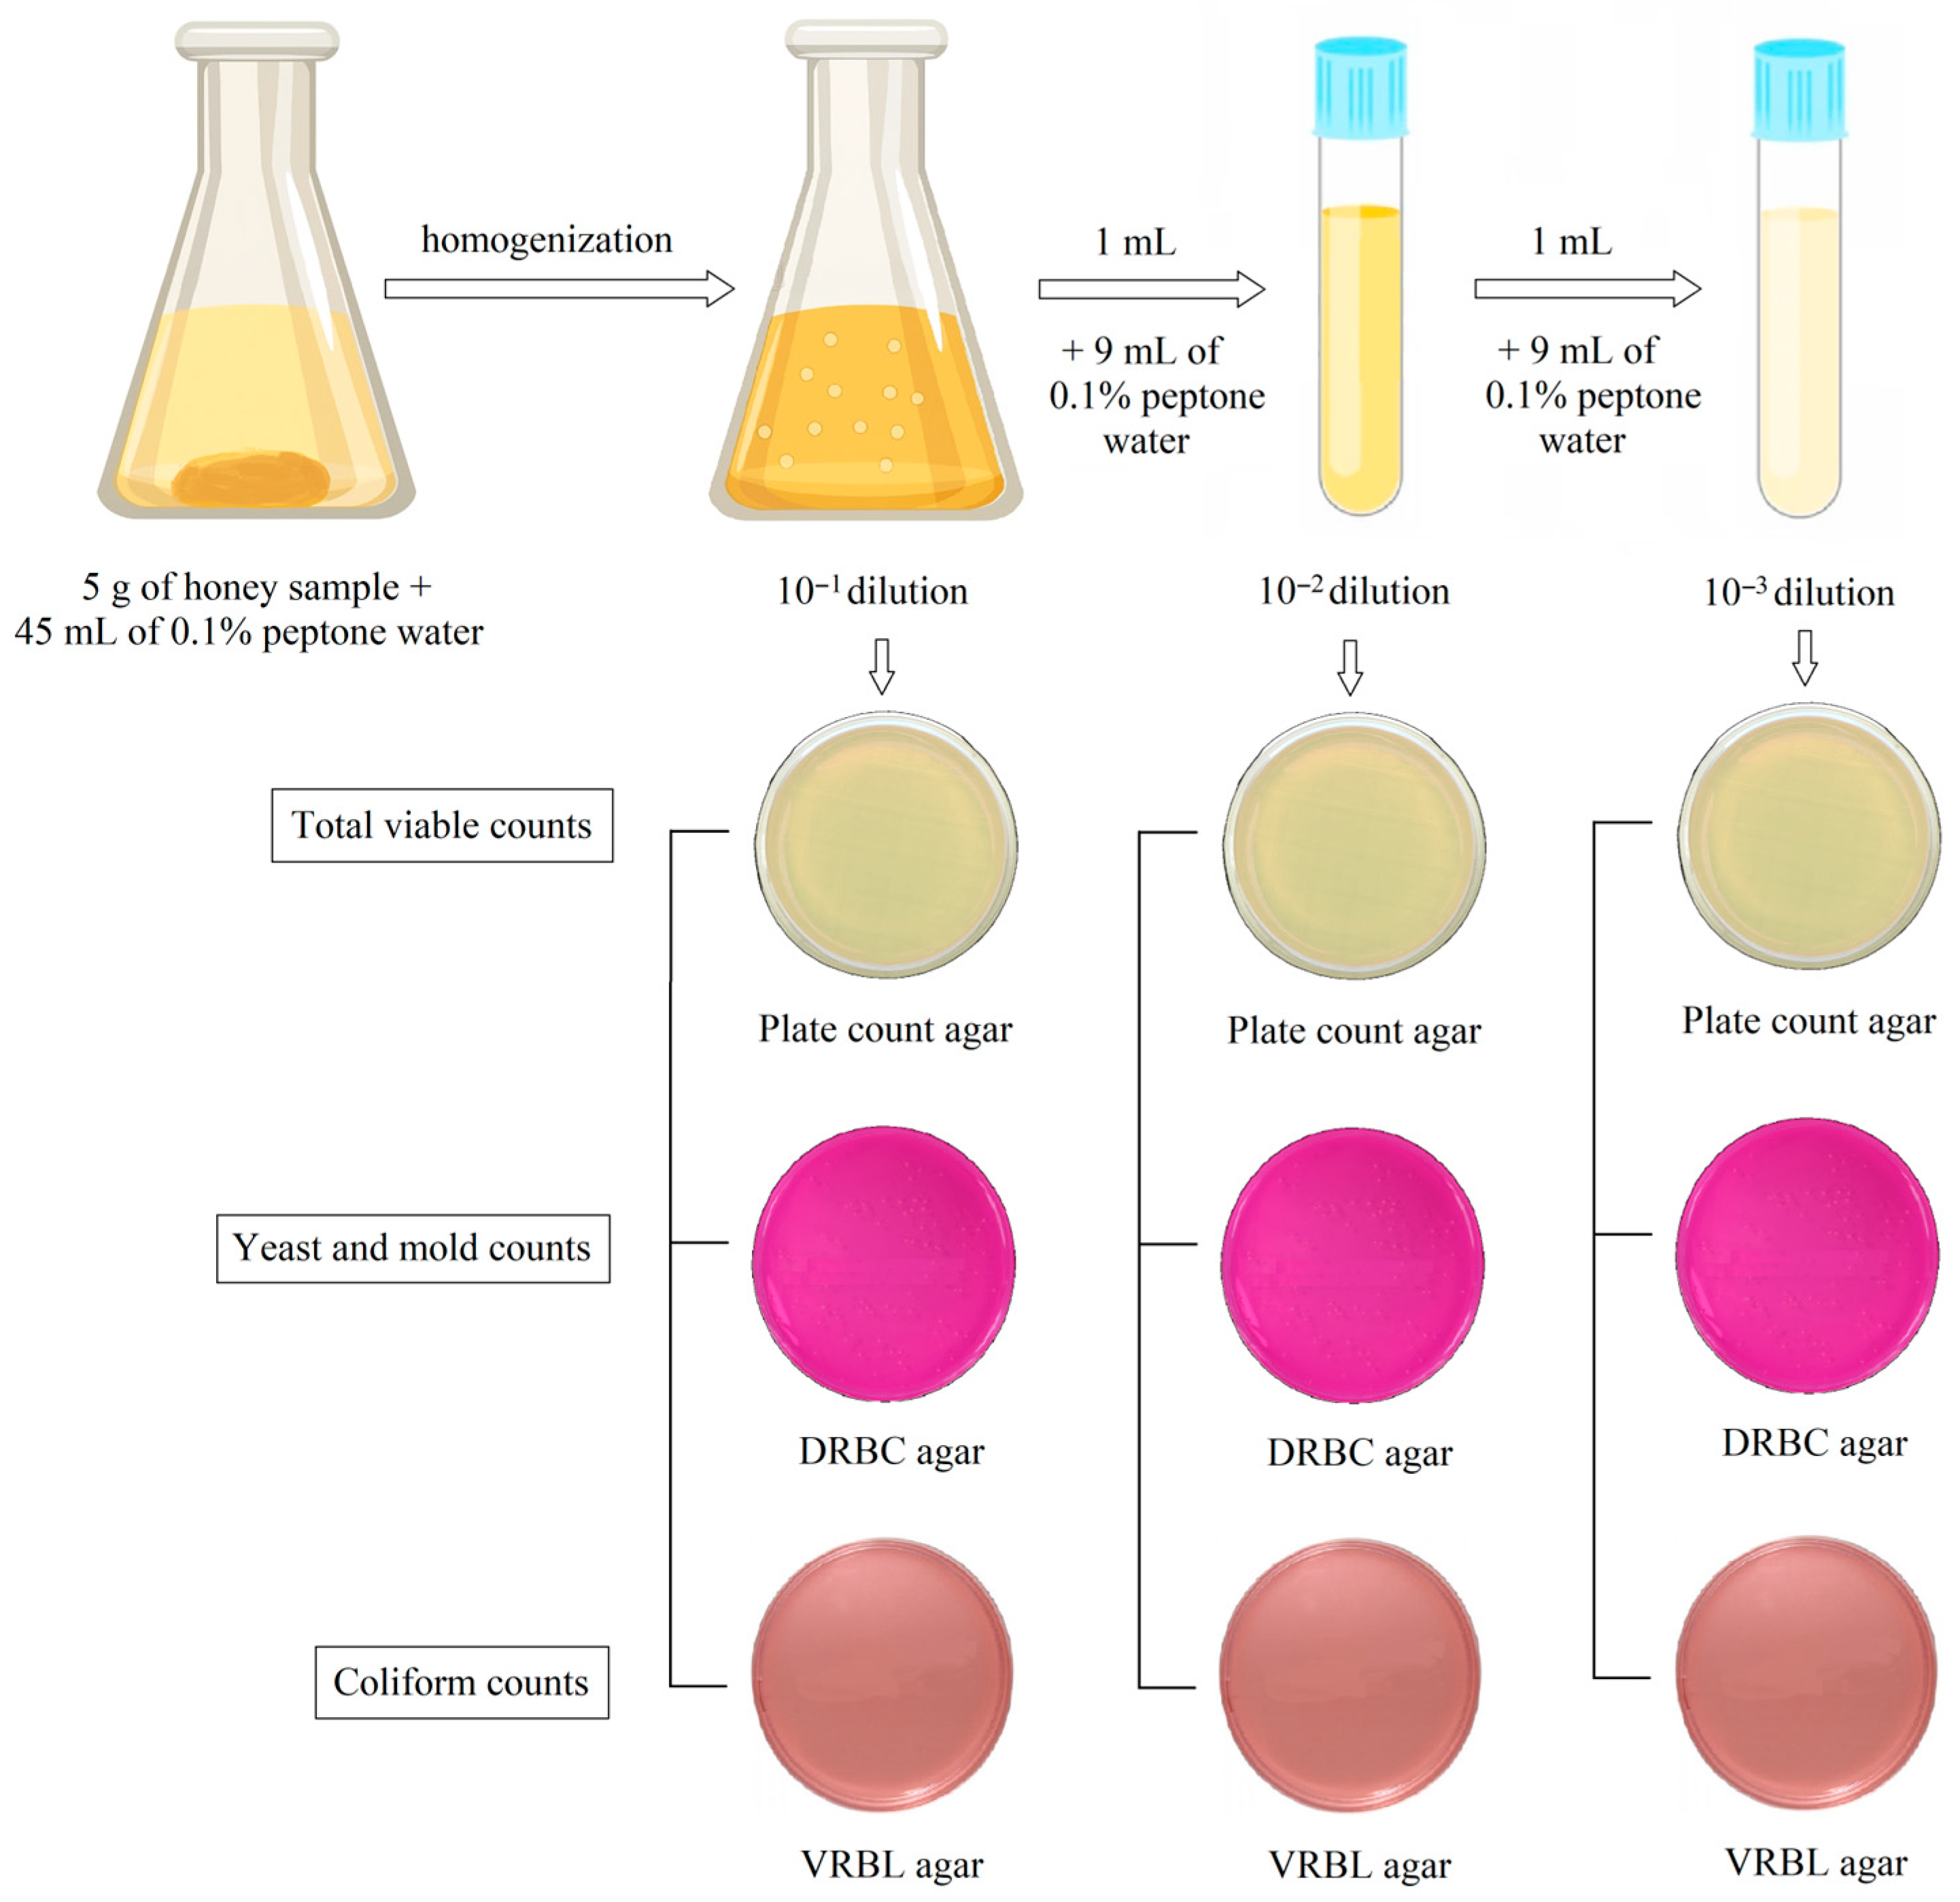
The microbiota of polyfloral honey samples and honey samples supplemented with propolis at concentrations of 0.1%, 0.2%, and 0.3% was evaluated by determining the total aerobic viable count, yeast and mold counts, and coliform bacteria counts. The sample preparation procedure for microbiological analysis is illustrated in Figure 1. For analysis, 5 g of each sample were aseptically weighed and homogenized with 45 mL of 0.1% peptone water to obtain the first dilution (10−1). The second dilution (10−2) was prepared by transferring 1 mL of the first dilution into a test tube containing 9 mL of 0.1% peptone water, while the third dilution (10−3) was prepared similarly from the second dilution. The total aerobic viable count was determined according to ISO 4833-1:2013 [21], using Plate Count Agar (PCA) as a non-selective culture medium [21]. Yeast and mold counts were determined using Dichloran Rose Bengal Chloramphenicol (DRBC) selective medium, in accordance with ISO 21527-2:2008 [22]. The number of coliform bacteria was determined following ISO 4832:2006 [23], using Violet Red Bile Lactose (VRBL) agar as a selective medium, which contains crystal violet, neutral red, bile salts, and lactose, with confirmation performed in liquid Brilliant Green Bile Lactose Broth (BGBLB), containing brilliant green, bile salts, and lactose [23]. All results are expressed as colony-forming units per gram of sample (CFU/g) and reported as log10 CFU/g to support statistical analysis and comparison.
Figure 1.
Microbiological analysis: sample preparation and procedure of analysis.
2.4. Statistical Analysis
All experiments were performed in triplicate (n = 3), and the results are expressed as mean values and standard deviation (SD). Data were analyzed by one-way ANOVA using OriginPro 2025b software (trial version, OriginLab, Northampton, MA, USA) and IBM SPSS Statistics 26 software (trial version, IBM, Chicago, IL, USA). The F-value obtained from ANOVA was used to assess the overall significance of differences among group means, with statistical significance set at p < 0.05. When ANOVA indicated significant differences, pairwise comparisons were performed using Fisher’s Least Significant Difference (LSD) post hoc test at a 95% confidence level. Prior to analysis, data were checked for normality and homogeneity of variances to meet ANOVA assumptions.
3. Results and Discussion
The present study focused on changes in the physico-chemical parameters and microbiota of honey supplemented with propolis at concentrations of 0.1%, 0.2%, and 0.3%. These parameters were evaluated both on the first day of mixture preparation and after 30 days, in order to obtain detailed information regarding the stability of the honey–propolis mixture. It should be noted that the present study is limited by the lack of detailed chemical characterization of the propolis used. Given the well-known variability of propolis composition depending on botanical and geographical origin, the results should be interpreted in the context of the specific sample analyzed. Previous Romanian studies [4,24] provide general context regarding variability in the chemical composition of propolis. Such variability may affect reproducibility and limit direct comparison with other studies; therefore, future research will focus on detailed chemical characterization of propolis from the Bucovina region.
3.1. Physico-Chemical Analysis
3.1.1. Moisture Content
According to the international standards established by the Codex Alimentarius [25], the maximum allowable moisture content of honey is 20%. This limit is of major importance, as the water present in the product directly influences the stability and quality of honey. Moisture content is affected by factors such as the season, climatic conditions, botanical origin of the nectar, harvesting methods, as well as processing and storage procedures [26]. High water content promotes fermentation, a phenomenon associated with the growth of yeasts and bacteria, which leads to the formation of acetic acid and product degradation [27]. Conversely, low moisture levels result in changes in the physicochemical properties of honey, such as viscosity, crystallization, and solubility, and may contribute to caramelization and the initiation of the Maillard reaction during storage [28]. In the present study, the moisture content values ranged from 18.02% to 18.72% (Table 1), which falls within the allowable range and aligns with previously reported literature data. The incorporation of propolis in powdered form into honey did not cause significant changes in moisture content. This finding has practical significance, as honey stability is directly correlated with its water content, and maintaining this parameter within standardized limits ensures the prevention of fermentation processes and preserves the physicochemical, organoleptic, and functional characteristics of the product. Consequently, the addition of solid propolis can be considered a safe method for enriching honey without negatively affecting its shelf life or quality. Furthermore, the analysis of the data presented in Table 1 indicates that the moisture content values remained stable over the 30-day storage period. Maintaining honey samples and honey–propolis mixtures at different concentrations at a controlled temperature of 20 °C and under dark conditions ensured the stability of this parameter, with no significant variations observed. Albu et al. [29] reported that honey samples from Romania exhibited moisture content ranging from 16.20% to 20.52%.
Table 1.
Analysis of variance (ANOVA) of the physicochemical parameters of honey samples supplemented with propolis at different concentrations (0.1%, 0.2%, and 0.3%) on day 1 and day 30.
3.1.2. pH
Honey is a natural product with acidic properties, and its pH represents an important indicator for both microbiological stability and quality assessment. According to the literature, normal pH values of honey generally range between 3.2 and 4.5 [26], an interval considered unfavorable for microbial growth. In contrast, pH values above 7 create conditions conducive to microbial proliferation. In the present study, pH values measured ranged from 4.12 to 4.18 for both honey samples and honey–propolis mixtures (Table 1). In a study by Ciulu et al. [30], 40 strawberry honey samples exhibited a mean pH of 4.0, whereas Ciursa et al. [31] reported an average pH of 4.4 for authentic Romanian honey. More recently, Luca et al. [10] reported pH values ranging from 3.61 in hawthorn honey to 4.14 in honeydew honey. Maintaining pH within this optimal range ensures product stability, protects against microbial contamination, and contributes to the preservation of its organoleptic and functional properties.
3.1.3. Free Acidity
Honey acidity is determined by the presence of organic acids, as well as other chemical compounds such as lactones, internal esters, inorganic anions, phenolic acids, vitamin C, and honey proteins [26]. Assessing acidity plays an important role in evaluating the freshness of honey samples. In general, free acidity increases with product deterioration, as carbohydrate fermentation leads to the formation of additional organic acids. According to the Codex Alimentarius [25] standards and the European Council Directive [32], the upper limit for free acidity is 50 milliequivalents of acid per kilogram of honey. Acidity analysis is influenced by the content of organic acids and can serve as an indicator of fermentation and product degradation. Exceeding the maximum allowable value may indicate alcoholic fermentation, with acetic acid formation in the presence of yeasts [25,33].
In the present study, none of the analyzed samples exceeded the maximum allowable value for free acidity (50 mEq/kg). The addition of propolis at different concentrations, as well as the 30-day storage period, did not result in significant changes in the free acidity values measured on day 1. In the study by Luca et al. [10], free acidity values ranged from 21.02 mEq/kg for monofloral honey to 33.42 mEq/kg for honeydew honey. These results are comparable to previously reported data by Sakač et al. [27], who reported the lowest mean acidity for acacia honey (9.77 ± 2.08 mEq/kg), compared to meadow honey (19.3 ± 1.88 mEq/kg) and sunflower honey (19.1 ± 3.19 mEq/kg). It is important to note that pH and free acidity are not always directly correlated, as the presence of various acids and minerals can generate buffering effects Alqarni et al. [34].
3.1.4. Electrical Conductivity
Determination of electrical conductivity is an essential tool for evaluating the botanical origin of honey and, consequently, its authenticity and purity. This physicochemical parameter is frequently used in honey quality control and is recognized as a criterion for differentiating between honey types [5]. Conductivity values are primarily influenced by the content of minerals, organic acids, and proteins, which, upon dissociation in aqueous solution, generate ions that contribute to increased conductivity [19]. According to international standards, the established limits for this parameter vary: 500–800 µS/cm for polyfloral honey, below 500 µS/cm for most monofloral varieties, and values exceeding 800 µS/cm are characteristic of honeydew honey [35]. In the present study, electrical conductivity values for honey samples and honey–propolis mixtures at various concentrations ranged from 566.33 to 575.50 µS/cm, indicating that the analyzed honey belongs to the polyfloral category. As shown in Table 1, neither the variation in propolis concentration nor the 30-day storage period had a significant effect on this parameter. In the study by Luca et al. [10], honey samples were classified according to botanical origin based on electrical conductivity values. Monofloral honey samples exhibited conductivity values below 500 µS/cm, consistent with pure floral honey. Honeydew honey showed the highest value at 990.15 µS/cm, whereas polyfloral honey presented a conductivity of 578.52 µS/cm.
3.1.5. Color
The color of honey represents an important parameter for identifying its various types, being influenced by both botanical and geographical origin as well as specific production conditions [36]. This characteristic is determined by the colored compounds present in nectar and may range from very light, almost colorless shades to dark, even black tones [37]. Generally, honey has a yellow color, although brown or green hues may occasionally occur, albeit less frequently. During the storage period, the color of honey changes, becoming darker, while crystallization tends to result in a lighter appearance. Table 2 presents the values of color parameters (L*, C*ab, and h*ab) for honey samples with added propolis (Pr) at different concentrations (0.1%, 0.2%, and 0.3%) on day 1 and day 30. The lightness values (L*) showed a slight increase in honey samples (H1 and H2), indicating a tendency toward color lightening during the storage period, with a more pronounced variation observed for sample H1 (from 83.92 to 91.16). In contrast, the propolis-supplemented samples exhibited significantly lower L* values, particularly for samples H1–Pr 0.2 (50.26) and H1–Pr 0.3 (45.32) on day 30, suggesting a noticeable darkening compared to the honey-only samples. Regarding the chroma parameter (C*ab), the highest values were recorded for sample H1, which showed a slight increase from 71.54 to 74.01 over the 30-day period. Sample H2 exhibited significantly lower values, around 30, with no notable variation during the storage period. In the case of honey samples with added propolis, fluctuations in C*ab values were observed. The hue angle (h*ab) reached the highest values in sample H2, indicating a hue closer to the yellow–green region, with a slight increase on day 30. By contrast, sample H1 and the propolis-supplemented samples showed lower h*ab values, ranging between 88.61 and 93.99, reflecting a difference in hue compared to H2. In a study conducted by Pant et al. [38], 30 propolis samples from northern India were analyzed, with L* values ranging from 38.15 to 41.99. The h*ab values for propolis samples ranged between 11.09 and 17.59, indicating intermediate red tones. The results obtained in the present study suggest that the addition of propolis to honey leads to significant modifications in colorimetric characteristics, affecting lightness, hue, and color saturation of the final product.
Table 2.
Analysis of variance (ANOVA) of the color parameters of honey samples supplemented with propolis at different concentrations (0.1%, 0.2%, and 0.3%) on day 1 and day 30.
3.1.6. Total Phenolic Content, Total Flavonoid Content, and Antioxidant Activity
The composition of honey, especially its content of phenolic compounds and flavonoids, is closely linked to its antioxidant potential. Phenolic compounds exert their antioxidant activity through multiple mechanisms, including scavenging of free radicals, chelation of metal ions, and inhibition of oxidative chain reactions. These compounds originate mainly from the pollen and floral nectar collected by bees. Consequently, the antioxidant activity of honey is influenced by the level of natural antioxidants derived from pollen and floral nectar [19]. The most important class of polyphenols in honey consists of phenolic acids (derivatives of cinnamic and benzoic acids) and flavonoids, whose sources include floral nectar, propolis, and pollen. The type and concentration of these compounds in honey may vary depending on climatic, seasonal, and technological factors; however, the main determining factor is botanical origin, as these compounds are transferred from plants to honey through the nectar collected by bees [39]. Table 3 presents the values of total polyphenol content (TPC) for honey samples with added propolis at different concentrations (0.1%, 0.2%, and 0.3%) on day 1 and day 30. The propolis sample (Pr) exhibited the highest TPC, with values of 1431.98 mg GAE/100 g on day 1 and 1433.31 mg GAE/100 g on day 30. M. Afonso et al. [37] investigated propolis extracts from the Sabugal region (Portugal) and reported TPC values ranging between 21,747 and 28,947 mg GAE/100 g of propolis sample. An increase in total phenolic content was observed with higher levels of propolis addition in honey sample H1 at all tested concentrations on both sampling days, with a comparable trend observed for honey sample H2. The addition of propolis at different concentrations (0.1%, 0.2%, and 0.3%) resulted in a statistically significant increase (p < 0.05) in TPC values. This increase can be attributed to the high polyphenol content of propolis, which is transferred to the honey mixture in proportion to the amount added. Habryka et al. [16] reported higher TPC values (44.46–133.60 mg GAE/100 g) in honey samples supplemented with propolis extract (0.1%, 0.3%, 0.6%, 0.8%, and 1%) compared with honey without propolis extract (30.75 mg GAE/100 g). A similar trend was observed in honey samples from the Sabugal region (Portugal) with the addition of propolis extract at concentrations of 0.3% and 0.5% [37]. The authors reported TPC values ranging from 1219 to 3506 mg GAE/100 g for honey samples supplemented with propolis extract, compared with honey samples without propolis extract (29–107 mg GAE/100 g) [37].
Table 3.
Analysis of variance (ANOVA) of the total phenolic content (TPC), total flavonoid content (TFC), and antioxidant activity (DPPH) of honey samples (H1 and H2) supplemented with propolis at different concentrations (0.1%, 0.2%, and 0.3%) on day 1 and day 30.
The flavonoid content of honey may reach up to 6 mg/kg of honey; however, these compounds are found in significantly higher concentrations in pollen (0.5%) and propolis (10%). According to data reported in the scientific literature, the main flavonoids identified in honey include quercetin, luteolin, apigenin, kaempferol, pinocembrin, galangin, pinobanksin, isorhamnetin, and hesperidin [40]. Many flavonoids present in honey, such as pinocembrin, pinobanksin, and chrysin, originate not from floral nectar but from propolis [36]. Although flavonoids have a low molecular weight, they are essential compounds contributing both to the aroma of honey and to its antioxidant properties [41].
The values of total flavonoid content (TFC) for honey samples with added propolis at different concentrations (0.1%, 0.2%, and 0.3%) on day 1 and day 30 are presented in Table 3. Similar to TPC, the propolis sample (Pr) exhibited the highest TFC, with values of 904.70 mg QE/100 g on day 1 and 905.11 mg QE/100 g on day 30. Alaerjani et al. [42] analyzed various propolis extracts obtained using different solvents (ethyl acetate, butanol, hexane, and methanol) and reported values ranging from 34.04 mg QE/g extract for hexane-extracted propolis to 96.65 mg QE/g extract for methanol-extracted propolis. Total flavonoid content (TFC) increased proportionally with increasing propolis concentration in honey sample H1 on both day 1 and day 30. A similar concentration-dependent trend was observed for honey sample H2. The addition of propolis at concentrations of 0.1%, 0.2%, and 0.3% had a statistically significant effect (p < 0.05) on TFC. Habryka et al. [16] also reported elevated flavonoid contents in honey samples supplemented with propolis extract. The authors observed that the values obtained for honey samples with propolis extract added at different concentrations (0.1%, 0.3%, 0.6%, 0.8%, and 1%) were significantly higher (3.43–14.90 mg QE/100 g) compared with honey samples without added propolis extract (2.77 mg QE/100 g). M. Afonso et al. [37] studied honey samples from the Sabugal region (Portugal) with propolis extract added at concentrations of 0.3% and 0.5% and reported TFC values ranging between 54 and 452 mg QE/100 g sample.
The antioxidant activity of the samples was evaluated using the DPPH method and expressed as the percentage of free radical inhibition. In this study, the highest free radical scavenging capacity (as shown in Table 3) was observed in the propolis sample, with a value of 86.60% on day 1 and a slight increase to 87.00% on day 30. Similar to the trends observed for TPC and TFC, the DPPH scavenging activity of the honey samples increased proportionally with the concentration of added propolis (0.1%, 0.2%, and 0.3%). Accordingly, sample H1 exhibited higher DPPH radical-scavenging activity than sample H2 on day 1, and both samples showed a slight increase in activity after 30 days of storage. The significant increase in antioxidant activity can be attributed to the presence of high concentrations of flavonoids and phenolic compounds in propolis, which are capable of donating electrons and neutralizing free radicals in the DPPH system. A similar trend was reported by M. Afonso et al. [37], who observed an increase in antioxidant activity measured by the DPPH method (7.921–8.396% inhibition per 100 g sample) following the addition of propolis (0.3% and 0.5%) compared with honey samples without propolis addition (0.133–0.431% inhibition per 100 g sample).
It should be noted that the DPPH assay reflects the in vitro free radical scavenging capacity of the samples under chemical conditions and does not directly represent biological or physiological antioxidant effects in vivo. Therefore, the observed increases in antioxidant activity indicate an enhanced chemical antioxidant potential of the honey–propolis mixtures rather than confirmed health-related outcomes.
3.2. Microbiota and Microbial Quality of Honey
Honey contains a diverse microbiota, including bacteria, yeasts, molds, and viruses, some of which may provide beneficial effects on human health Luca et al. [43]. The composition of this microbiota is shaped by primary factors related to honey production by bees (e.g., intrinsic microbial communities and environmental microbiota), as well as secondary factors such as extraction, handling, and storage, which are human-mediated processes and represent critical points for potential contamination. Similar to honey, propolis contains a diverse community of bacteria and fungi, including species also present in other hive products. Certain microbial isolates exhibit metabolic adaptations that enable persistence within the resinous environment of propolis Casalone et al. [44]. Moreover, some bacterial strains are capable of producing antimicrobial compounds active against insect pathogens and other bacteria, indicating that the propolis-associated microbiota may contribute to the maintenance of its ecological disinfectant function within the hive. Some authors reported that propolis exhibits the most diverse and distinctive microbial community profile among hive products [45], suggesting that supplementation of honey with propolis may promote diversification of its microbiota.
The results of the microbiological analyses, including total viable count (TVC), yeast and mold count (YMC), and coliform count (CC), for raw honey, propolis, and honey supplemented with propolis are summarized in Table 4. Coliform bacteria were not detected in any of the honey samples and were likewise absent in propolis, indicating minimal environmental contamination during propolis collection and suggesting that honey supplementation with propolis was performed under appropriate hygienic conditions. This finding complies with the microbiological requirements established by current EU regulations [46]. The total viable count and yeast and mold count of the raw honey samples were comparable to values reported in previous studies on polyfloral honey from Romania, Slovakia, and other European regions [10,47]. EU legislation does not specify quantitative limits for TVC or YMC in honey, and microbiological quality is assessed based on hygienic practices and the absence of pathogens rather than predetermined colony-forming unit thresholds [46]. Propolis exhibited relatively high values for both TVC and YMC, consistent with the diverse microbial community previously reported for this hive product [44]. The intrinsic microbiota of propolis appears to have influenced the microbiological profile of honey supplemented with propolis, as evidenced by the progressive increase in TVC and YMC with higher propolis concentrations. This observation highlights that, while propolis possesses antimicrobial compounds, it also carries a naturally diverse microbial population that can contribute to the overall microbial load of propolis-supplemented honey. The total viable count and yeast and mold count of honey supplemented with propolis also increased over 30 days compared to the first day. This increase indicates that microorganisms introduced by propolis into the honey matrix survived and slowly proliferated during storage, suggesting that the moisture content of the honey and the storage conditions were favorable for microbial activity. Despite this increase, the absolute values of total viable count and yeast and mold count remained low (≤3.04 log10 CFU/g) and within ranges commonly reported for raw and minimally processed honey. From a practical perspective, these levels are not associated with spoilage or safety concerns, particularly considering the intrinsic antimicrobial barriers of honey, including low water activity, acidic pH, and high osmotic pressure [48]. Furthermore, the consistent absence of coliform bacteria across all samples confirms satisfactory hygienic quality and indicates that propolis supplementation did not introduce microbiological safety risks. Therefore, while propolis addition influences the microbial profile of honey, the observed changes are unlikely to adversely affect shelf life or consumer safety under normal storage conditions.
Table 4.
Microbiological analysis.
One-way ANOVA was performed separately for samples analyzed on Day 1 and Day 30 to compare differences among honey–propolis formulations with different propolis concentrations at each storage time. This approach was used to evaluate the effect of propolis concentration within the same storage period. For physicochemical parameters, color attributes (L*, C*ab, and h*ab), total phenolic content (TPC), total flavonoid content (TFC), and antioxidant activity assessed by the DPPH assay, statistically significant differences among samples were observed on both Day 1 and Day 30 (p < 0.05). In most cases, higher F-values were recorded after 30 days of storage, indicating clearer separation among formulations. The high F-values reflect low within-group variability and consistent differences among samples, rather than excessive data dispersion. In contrast, for microbiological parameters (total viable count and yeast and mold count), no statistically significant differences among samples were detected at either storage time (p > 0.05), despite numerical increases. Coliforms were not detected in any sample at either time point, confirming compliance with microbiological safety requirements. Different lowercase letters in the tables indicate statistically significant differences (p < 0.05) among samples analyzed at the same storage time.
4. Conclusions
The present study demonstrates that the incorporation of propolis into polyfloral honey influences product quality in multiple and interconnected ways. Under controlled short-term storage conditions, propolis addition contributes to enhanced phenolic content and antioxidant-related properties, while the physicochemical characteristics of honey remain within acceptable and stable ranges. These findings indicate that propolis can be considered a technological ingredient capable of modifying the compositional and functional profile of honey-based formulations.
At the same time, the study highlights the importance of considering the microbiological contribution associated with propolis. Although microbiological safety requirements were met, the gradual increase in total viable counts and yeast and mold populations suggests that microorganisms naturally associated with propolis may persist and slowly develop in the honey matrix during storage. This aspect underscores the need for appropriate processing and storage strategies when propolis is used as an ingredient.
It should be noted that the conclusions of this study are based on a 30-day storage period under controlled conditions (20 °C, absence of light). Therefore, the observed physicochemical stability, antioxidant enhancement, and microbiological trends apply to short-term storage only. Further studies are required to assess the long-term stability and safety of honey–propolis mixtures over extended storage periods.
Author Contributions
Conceptualization. M.O. and D.P.; methodology. F.D., M.S. and I.P.; software. F.D., M.S., and S.R.; validation. M.O., D.P., F.D. and M.S.; formal analysis. I.P.; investigation. S.R.; resources. I.P.; data curation. F.D., M.S. and S.R.; writing—original draft preparation. D.P., F.D., I.P., and M.S.; writing—review and editing. S.R. and M.O.; visualization. M.O.; supervision. M.O.; project administration. M.O., D.P., F.D. and M.S. All authors have read and agreed to the published version of the manuscript.
Funding
This research received no external funding.
Institutional Review Board Statement
Not applicable.
Informed Consent Statement
Not applicable.
Data Availability Statement
The data presented in this study are available in the article.
Conflicts of Interest
The authors declare no conflicts of interest.
References
- Martinello, M.; Mutinelli, F. Antioxidant Activity in Bee Products: A Review. Antioxidants 2021, 10, 71. [Google Scholar] [CrossRef] [Scilit]
- Kieliszek, M.; Piwowarek, K.; Kot, A.M.; Wojtczuk, M.; Roszko, M.; Bryła, M.; Trajkovska Petkoska, A. Recent Advances and Opportunities Related to the Use of Bee Products in Food Processing. Food Sci. Nutr. 2023, 11, 4372–4397. [Google Scholar] [CrossRef] [Scilit]
- Durazzo, A.; Lucarini, M.; Plutino, M.; Lucini, L.; Aromolo, R.; Martinelli, E.; Souto, E.B.; Santini, A.; Pignatti, G. Bee Products: A Representation of Biodiversity, Sustainability, and Health. Life 2021, 11, 970. [Google Scholar] [CrossRef] [Scilit] [PubMed]
- Oroian, M.; Dranca, F.; Ursachi, F. Comparative Evaluation of Maceration, Microwave and Ultrasonic-Assisted Extraction of Phenolic Compounds from Propolis. J. Food Sci. Technol. 2020, 57, 70–78. [Google Scholar] [CrossRef] [Scilit]
- Baloš, M.Ž.; Popov, N.; Vidaković, S.; Pelić, D.L.; Pelić, M.; Mihaljev, Ž.; Jakšić, S. Electrical Conductivity and Acidity of Honey. Arh. Vet. Med. 2018, 11, 91–101. [Google Scholar] [CrossRef] [Scilit]
- Bora, F.D.; Andrecan, A.F.; Călugăr, A.; Bunea, C.I.; Popescu, M.; Petrescu-Mag, I.V.; Bunea, A. Comprehensive Elemental Profiling of Romanian Honey: Exploring Regional Variance, Honey Types, and Analyzed Metals for Sustainable Apicultural and Environmental Practices. Foods 2024, 13, 1253. [Google Scholar] [CrossRef] [Scilit]
- Schmidlová, S.; Javůrková, Z.; Tremlová, B.; Hernik, J.; Prus, B.; Marcinčák, S.; Marcinčáková, D.; Štarha, P.; Čížková, H.; Kružík, V.; et al. Exploring the Influence of Soil Types on the Mineral Profile of Honey: Implications for Geographical Origin Prediction. Foods 2024, 13, 2006. [Google Scholar] [CrossRef] [Scilit]
- Combarros-Fuertes, P.; M. Estevinho, L.; Teixeira-Santos, R.; G. Rodrigues, A.; Pina-Vaz, C.; Fresno, J.M.; Tornadijo, M.E. Antibacterial Action Mechanisms of Honey: Physiological Effects of Avocado, Chestnut, and Polyfloral Honey upon Staphylococcus aureus and Escherichia coli. Molecules 2020, 25, 1252. [Google Scholar] [CrossRef] [Scilit]
- Romário-Silva, D.; Alencar, S.M.; Bueno-Silva, B.; Sardi, J.D.C.O.; Franchin, M.; Carvalho, R.D.P.D.; Ferreira, T.E.D.S.A.; Rosalen, P.L. Antimicrobial Activity of Honey against Oral Microorganisms: Current Reality, Methodological Challenges and Solutions. Microorganisms 2022, 10, 2325. [Google Scholar] [CrossRef] [Scilit] [PubMed]
- Luca, L.; Pauliuc, D.; Ursachi, F.; Oroian, M. Physicochemical Parameters, Microbiological Quality, and Antibacterial Activity of Honey from the Bucovina Region of Romania. Sci. Rep. 2025, 15, 4358. [Google Scholar] [CrossRef] [Scilit]
- Oroian, M.; Ursachi, F.; Dranca, F. Influence of Ultrasonic Amplitude, Temperature, Time and Solvent Concentration on Bioactive Compounds Extraction from Propolis. Ultrason. Sonochem. 2020, 64, 105021. [Google Scholar] [CrossRef] [Scilit]
- Sánchez-Martín, V.; López-Parra, M.B.; Iriondo-DeHond, A.; Wojdyło, A.; Michalska-Ciechanowska, A.; Haza, A.I.; Morales, P.; Del Castillo, M.D. Natural Honey-Propolis Combinations with Health-Promoting Potential: Antibacterial Activity Against Foodborne Pathogens. Pharmaceuticals 2025, 18, 988. [Google Scholar] [CrossRef] [Scilit]
- Zheng, X.; Al Naggar, Y.; Wu, Y.; Liu, D.; Hu, Y.; Wang, K.; Jin, X.; Peng, W. Untargeted Metabolomics Description of Propolis’s in Vitro Antibacterial Mechanisms against Clostridium Perfringens. Food Chem. 2023, 406, 135061. [Google Scholar] [CrossRef] [Scilit]
- Helmy, A.K.; Sidkey, N.M.; Abdel-Aziz, M.M.; El-Hela, A.A. Chemical Composition of Egyptian Propolis and Studying Its Antimicrobial Activity and Synergistic Action with Honey against Some Multidrug-Resistant Uropathogens. Sci. Rep. 2025, 15, 17484. [Google Scholar] [CrossRef] [Scilit]
- Vică, M.L.; Glevitzky, M.; Tit, D.M.; Behl, T.; Heghedűş-Mîndru, R.C.; Zaha, D.C.; Ursu, F.; Popa, M.; Glevitzky, I.; Bungău, S. The Antimicrobial Activity of Honey and Propolis Extracts from the Central Region of Romania. Food Biosci. 2021, 41, 101014. [Google Scholar] [CrossRef] [Scilit]
- Habryka, C.; Socha, R.; Juszczak, L. The Effect of Enriching Honey with Propolis on the Antioxidant Activity, Sensory Characteristics, and Quality Parameters. Molecules 2020, 25, 1176. [Google Scholar] [CrossRef] [Scilit]
- Bogdanov, S.; Lüllmann, C.; Martin, P.; Von Der Ohe, W.; Russmann, H.; Vorwohl, G.; Oddo, L.P.; Sabatini, A.-G.; Marcazzan, G.L.; Piro, R.; et al. Honey Quality and International Regulatory Standards: Review by the International Honey Commission. Bee World 1999, 80, 61–69. [Google Scholar] [CrossRef] [Scilit]
- Biesaga, M.; Pyrzyńska, K. Stability of Bioactive Polyphenols from Honey during Different Extraction Methods. Food Chem. 2013, 136, 46–54. [Google Scholar] [CrossRef] [Scilit] [PubMed]
- Pauliuc, D.; Dranca, F.; Oroian, M. Antioxidant Activity, Total Phenolic Content, Individual Phenolics and Physicochemical Parameters Suitability for Romanian Honey Authentication. Foods 2020, 9, 306. [Google Scholar] [CrossRef] [Scilit] [PubMed]
- Brand-Williams, W.; Cuvelier, M.E.; Berset, C. Use of a Free Radical Method to Evaluate Antioxidant Activity. LWT Food Sci. Technol. 1995, 28, 25–30. [Google Scholar] [CrossRef] [Scilit]
- ISO 4833-1:2013; Microbiology of the Food Chain—Horizontal Method for the Enumeration of Microorganisms. ISO: Geneva, Switzerland, 2013.
- ISO 21527-1:2008; Microbiology of Food and Animal Feeding Stuffs—Horizontal Method for the Enumeration of Yeasts and Moulds. ISO: Geneva, Switzerland, 2008.
- ISO 4832; Microbiology of Food and Animal Feeding Stuffs—Horizontal Method for the Enumeration of Coliforms—Colony-Count Technique. ISO: Geneva, Switzerland, 2006.
- Pătruică, S.; Alexa, E.; Obiștioiu, D.; Cocan, I.; Radulov, I.; Berbecea, A.; Lazăr, R.N.; Simiz, E.; Vicar, N.M.; Hulea, A.; et al. Chemical Composition, Antioxidant and Antimicrobial Activity of Some Types of Honey from Banat Region, Romania. Molecules 2022, 27, 4179. [Google Scholar] [CrossRef] [Scilit] [PubMed]
- Codex Alimentarius. Revised Codex Standard for Honey, Standards and Standard Methods; Codex Alimentarius Commission FAO/OMS: Rome, Italy, 2001. [Google Scholar]
- Da Silva, P.M.; Gauche, C.; Gonzaga, L.V.; Costa, A.C.O.; Fett, R. Honey: Chemical Composition, Stability and Authenticity. Food Chem. 2016, 196, 309–323. [Google Scholar] [CrossRef] [Scilit] [PubMed]
- Sakač, M.B.; Jovanov, P.T.; Marić, A.Z.; Pezo, L.L.; Kevrešan, Ž.S.; Novaković, A.R.; Nedeljković, N.M. Physicochemical Properties and Mineral Content of Honey Samples from Vojvodina (Republic of Serbia). Food Chem. 2019, 276, 15–21. [Google Scholar] [CrossRef] [Scilit]
- Escuredo, O.; Carmen Seijo, M.; Salvador, J.; Inmaculada González-Martín, M. Near Infrared Spectroscopy for Prediction of Antioxidant Compounds in the Honey. Food Chem. 2013, 141, 3409–3414. [Google Scholar] [CrossRef] [Scilit]
- Albu, A.; Radu-Rusu, C.-G.; Pop, I.M.; Frunza, G.; Nacu, G. Quality Assessment of Raw Honey Issued from Eastern Romania. Agriculture 2021, 11, 247. [Google Scholar] [CrossRef] [Scilit]
- Ciulu, M.; Serra, R.; Caredda, M.; Salis, S.; Floris, I.; Pilo, M.I.; Spano, N.; Panzanelli, A.; Sanna, G. Chemometric Treatment of Simple Physical and Chemical Data for the Discrimination of Unifloral Honeys. Talanta 2018, 190, 382–390. [Google Scholar] [CrossRef] [Scilit]
- Ciursă, P.; Pauliuc, D.; Dranca, F.; Ropciuc, S.; Oroian, M. Detection of Honey Adulterated with Agave, Corn, Inverted Sugar, Maple and Rice Syrups Using FTIR Analysis. Food Control 2021, 130, 108266. [Google Scholar] [CrossRef] [Scilit]
- European Council. Council Directive 2001/110/EC of 20 December 2001 relating to honey. Off. J. Eur. Communities L 2002, 10, 47–52. [Google Scholar]
- Crăciun, M.E.; Pârvulescu, O.C.; Donise, A.C.; Dobre, T.; Stanciu, D.R. Characterization and Classification of Romanian Acacia Honey Based on Its Physicochemical Parameters and Chemometrics. Sci. Rep. 2020, 10, 20690. [Google Scholar] [CrossRef] [Scilit]
- Alqarni, A.S.; Owayss, A.A.; Mahmoud, A.A. Physicochemical Characteristics, Total Phenols and Pigments of National and International Honeys in Saudi Arabia. Arab. J. Chem. 2016, 9, 114–120. [Google Scholar] [CrossRef] [Scilit]
- Oroian, M.; Sonia, S.; Amariei, A.; Leahu, A.; Gutt, G. Multi-Element Composition of Honey as a Suitable Tool for Its Authenticity Analysis. Pol. J. Food Nutr. Sci. 2015, 65, 93–100. [Google Scholar] [CrossRef] [Scilit]
- Santos-Buelga, C.; González-Paramás, A.M. Chemical composition of honey. In Bee Products–Chemical and Biological Properties; Springer Nature: Cham, Switzerland, 2025; pp. 47–104. [Google Scholar] [CrossRef] [Scilit]
- M. Afonso, A.; Gonçalves, J.; Luís, Â.; Gallardo, E.; Duarte, A.P. Evaluation of the In Vitro Wound-Healing Activity and Phytochemical Characterization of Propolis and Honey. Appl. Sci. 2020, 10, 1845. [Google Scholar] [CrossRef] [Scilit]
- Pant, K.; Thakur, M.; Chopra, H.K.; Nanda, V.; Javed Ansari, M.; Pietramellara, G.; Pathan, S.I.; Alharbi, S.A.; Almoallim, H.S.; Datta, R. Characterization and Discrimination of Indian Propolis Based on Physico-Chemical, Techno-Functional, Thermal and Textural Properties: A Multivariate Approach. J. King Saud Univ. Sci. 2021, 33, 101405. [Google Scholar] [CrossRef] [Scilit]
- Dranca, F.; Ursachi, F.; Oroian, M. Bee Bread: Physicochemical Characterization and Phenolic Content Extraction Optimization. Foods 2020, 9, 1358. [Google Scholar] [CrossRef] [Scilit]
- Lazaridis, D.G.; Kitsios, A.-P.; Koutoulis, A.S.; Malisova, O.; Karabagias, I.K. Fruits, Spices and Honey Phenolic Compounds: A Comprehensive Review on Their Origin, Methods of Extraction and Beneficial Health Properties. Antioxidants 2024, 13, 1335. [Google Scholar] [CrossRef] [Scilit]
- Zawawi, N.; Chong, P.J.; Mohd Tom, N.N.; Saiful Anuar, N.S.; Mohammad, S.M.; Ismail, N.; Jusoh, A.Z. Establishing Relationship between Vitamins, Total Phenolic and Total Flavonoid Content and Antioxidant Activities in Various Honey Types. Molecules 2021, 26, 4399. [Google Scholar] [CrossRef] [Scilit] [PubMed]
- ALaerjani, W.M.A.; Khan, K.A.; Al-Shehri, B.M.; Ghramh, H.A.; Hussain, A.; Mohammed, M.E.A.; Imran, M.; Ahmad, I.; Ahmad, S.; Al-Awadi, A.S. Chemical Profiling, Antioxidant, and Antimicrobial Activity of Saudi Propolis Collected by Arabian Honey Bee (Apis Mellifera Jemenitica) Colonies. Antioxidants 2022, 11, 1413. [Google Scholar] [CrossRef] [Scilit]
- Luca, L.; Pauliuc, D.; Oroian, M. Honey Microbiota, Methods for Determining the Microbiological Composition and the Antimicrobial Effect of Honey—A Review. Food Chem. X 2024, 23, 101524. [Google Scholar] [CrossRef] [Scilit]
- Casalone, E.; Cavalieri, D.; Daly, G.; Vitali, F.; Perito, B. Propolis Hosts a Diversemicrobial Community. World J. Microbiol. Biotechnol. 2020, 36, 50. [Google Scholar] [CrossRef] [Scilit] [PubMed]
- Grubbs, K.J.; Scott, J.J.; Budsberg, K.J.; Read, H.; Balser, T.C.; Currie, C.R. Unique Honey Bee (Apis Mellifera) Hive Component-Based Communities as Detected by a Hybrid of Phospholipid Fatty-Acid and Fatty-Acid Methyl Ester Analyses. PLoS ONE 2015, 10, e0121697. [Google Scholar] [CrossRef] [Scilit]
- European Commission. COMMISSION REGULATION (EC) No 2073/2005. Available online: https://eur-lex.europa.eu/legal-content/EN/TXT/HTML/?uri=CELEX:02005R2073-20200308 (accessed on 10 August 2025).
- Kunová, S.; Kačániová, M.; Haščík, P.; Čuboň, J. Microbiological and Chemical Quality of Slovak and European Honey. J. Microbiol. Biotechnol. Food Sci. 2015, 4, 41–44. [Google Scholar] [CrossRef] [Scilit]
- Al-Sayaghi, A.M.; Al-Kabsi, A.M.; Abduh, M.S.; Saghir, S.A.M.; Alshawsh, M.A. Antibacterial Mechanism of Action of Two Types of Honey against Escherichia Coli through Interfering with Bacterial Membrane Permeability, Inhibiting Proteins, and Inducing Bacterial DNA Damage. Antibiotics 2022, 11, 1182. [Google Scholar] [CrossRef] [Scilit] [PubMed]

Disclaimer/Publisher’s Note: The statements, opinions and data contained in all publications are solely those of the individual author(s) and contributor(s) and not of MDPI and/or the editor(s). MDPI and/or the editor(s) disclaim responsibility for any injury to people or property resulting from any ideas, methods, instructions or products referred to in the content. |
© 2026 by the authors. Licensee MDPI, Basel, Switzerland. This article is an open access article distributed under the terms and conditions of the Creative Commons Attribution (CC BY) license.