


Abstract
Vibration signals generated during hydraulic fracturing drilling in coal mining are critical dynamic indicators for revealing borehole conditions and evaluating drilling efficiency and safety. However, the power supply methods of existing vibration sensors limit the practical application of this technology. To address this, this study was inspired by the African drum and developed a vibration sensor based on a triboelectric nanogenerator (TENG), enabling simultaneous measurement of vibration frequency and acceleration in a self-powered mode. Tests demonstrate that the device measures vibration frequencies from 0 to 9 Hz with an error below 3%. It achieves vibration acceleration measurements at thresholds of 1 g and 2 g with an error less than 4%. The sensor operates effectively at temperatures range of 15 °C to 75 °C and relative humidity below 90%. Additionally, the device possesses energy-harvesting capabilities, delivering a maximum power output of 72 nW at a load resistance of 1000 MΩ and a vibration frequency of 9 Hz. Unlike existing underground vibration sensors, this sensor’s high redundancy design and self-power generation features make it particularly suitable for the practical working conditions of upward drilling in coal mines.
1. Introduction
In deep coal mining, hydraulic fracturing borehole technology for in situ stress measurement is a critical method. It is used for obtaining the stress state of surrounding rock and guiding roadway support and disaster prevention [1,2]. The successful implementation of this technology relies heavily on the precise formation of high-quality boreholes. During the construction of these boreholes in coal mine roadways, the vibration signals induced by the drilling process contain abundant information [3,4]. Specifically, the vibration patterns resulting from the interaction between the drilling tool and the coal or rock mass are significant. These patterns directly reflect drill bit wear [5], lithological changes in the formation [6], and drill string system stability [7]. Therefore, vibration parameters act as core dynamic indicators for revealing borehole status and assessing drilling efficiency and safety. Consequently, real-time monitoring of these parameters is essential [8].
Currently, vibration measurement of the bottom hole assembly (BHA) is primarily achieved by installing accelerometers inside measurement-while-drilling (MWD) instruments [9,10]. However, both cable-powered and battery-powered methods restrict the practical application of this technology. Specifically, complex cable laying construction increases the complexity and cost of drilling operations when using cable power. This method also carries the risk of cable wear or even breakage [11]. Alternatively, battery-powered systems are limited by battery life. Once the downhole battery is depleted, the entire set of downhole tools must be retrieved to the surface for replacement [12]. This process leads to severe non-productive time. It significantly reduces operational efficiency and increases additional costs. Therefore, sensors capable of generating electricity from downhole conditions would better adapt to the actual downhole environment.
The triboelectric nanogenerator (TENG), representing a novel form of technique applied to energy scavenging and sensing, offers a means for breaking through existing downhole power generation methods. The concept of this nanogenerator was initially introduced via Academician Wang and his team during 2012 [13]. Its basic mechanism is based on the combined interaction of triboelectric contact electrification coupled with electrostatic induction, which transforms ambient mechanical energy to electrical energy. Triboelectric nanogenerators have achieved widespread use within the domains of sensors and power generators [14]. For instance, in the field of generators, triboelectric power generation from wave energy [15,16], wind energy [17,18], rainfall [19], sound energy [20], and kinetic energy [21,22] has been achieved, making great progress. In the field of sensors, it can also realize sensing of displacement [23,24], pressure [25,26], gas [27], flow rate [28], trajectory [29], angle [30,31], etc. Some researchers have even introduced triboelectric nanogenerators into the field of geosciences, such as landslide monitoring sensors [32], environmental detection sensors [33], and drill pipe speed sensors [34], which greatly expands the application range. In light of this, the present study presents a drum-shaped multifunctional vibration detector utilizing a triboelectric nanogenerator. Through structural design, vibration is induced to force the nanomaterials inside the sensor to generate triboelectric charges, and the subsequent triboelectric signal analysis is used to achieve the simultaneous measurement of both vibration frequency and acceleration parameters.
2. Structural Composition and Working Principle
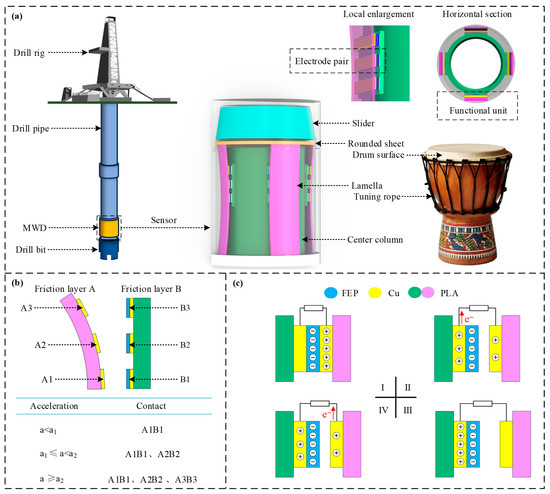
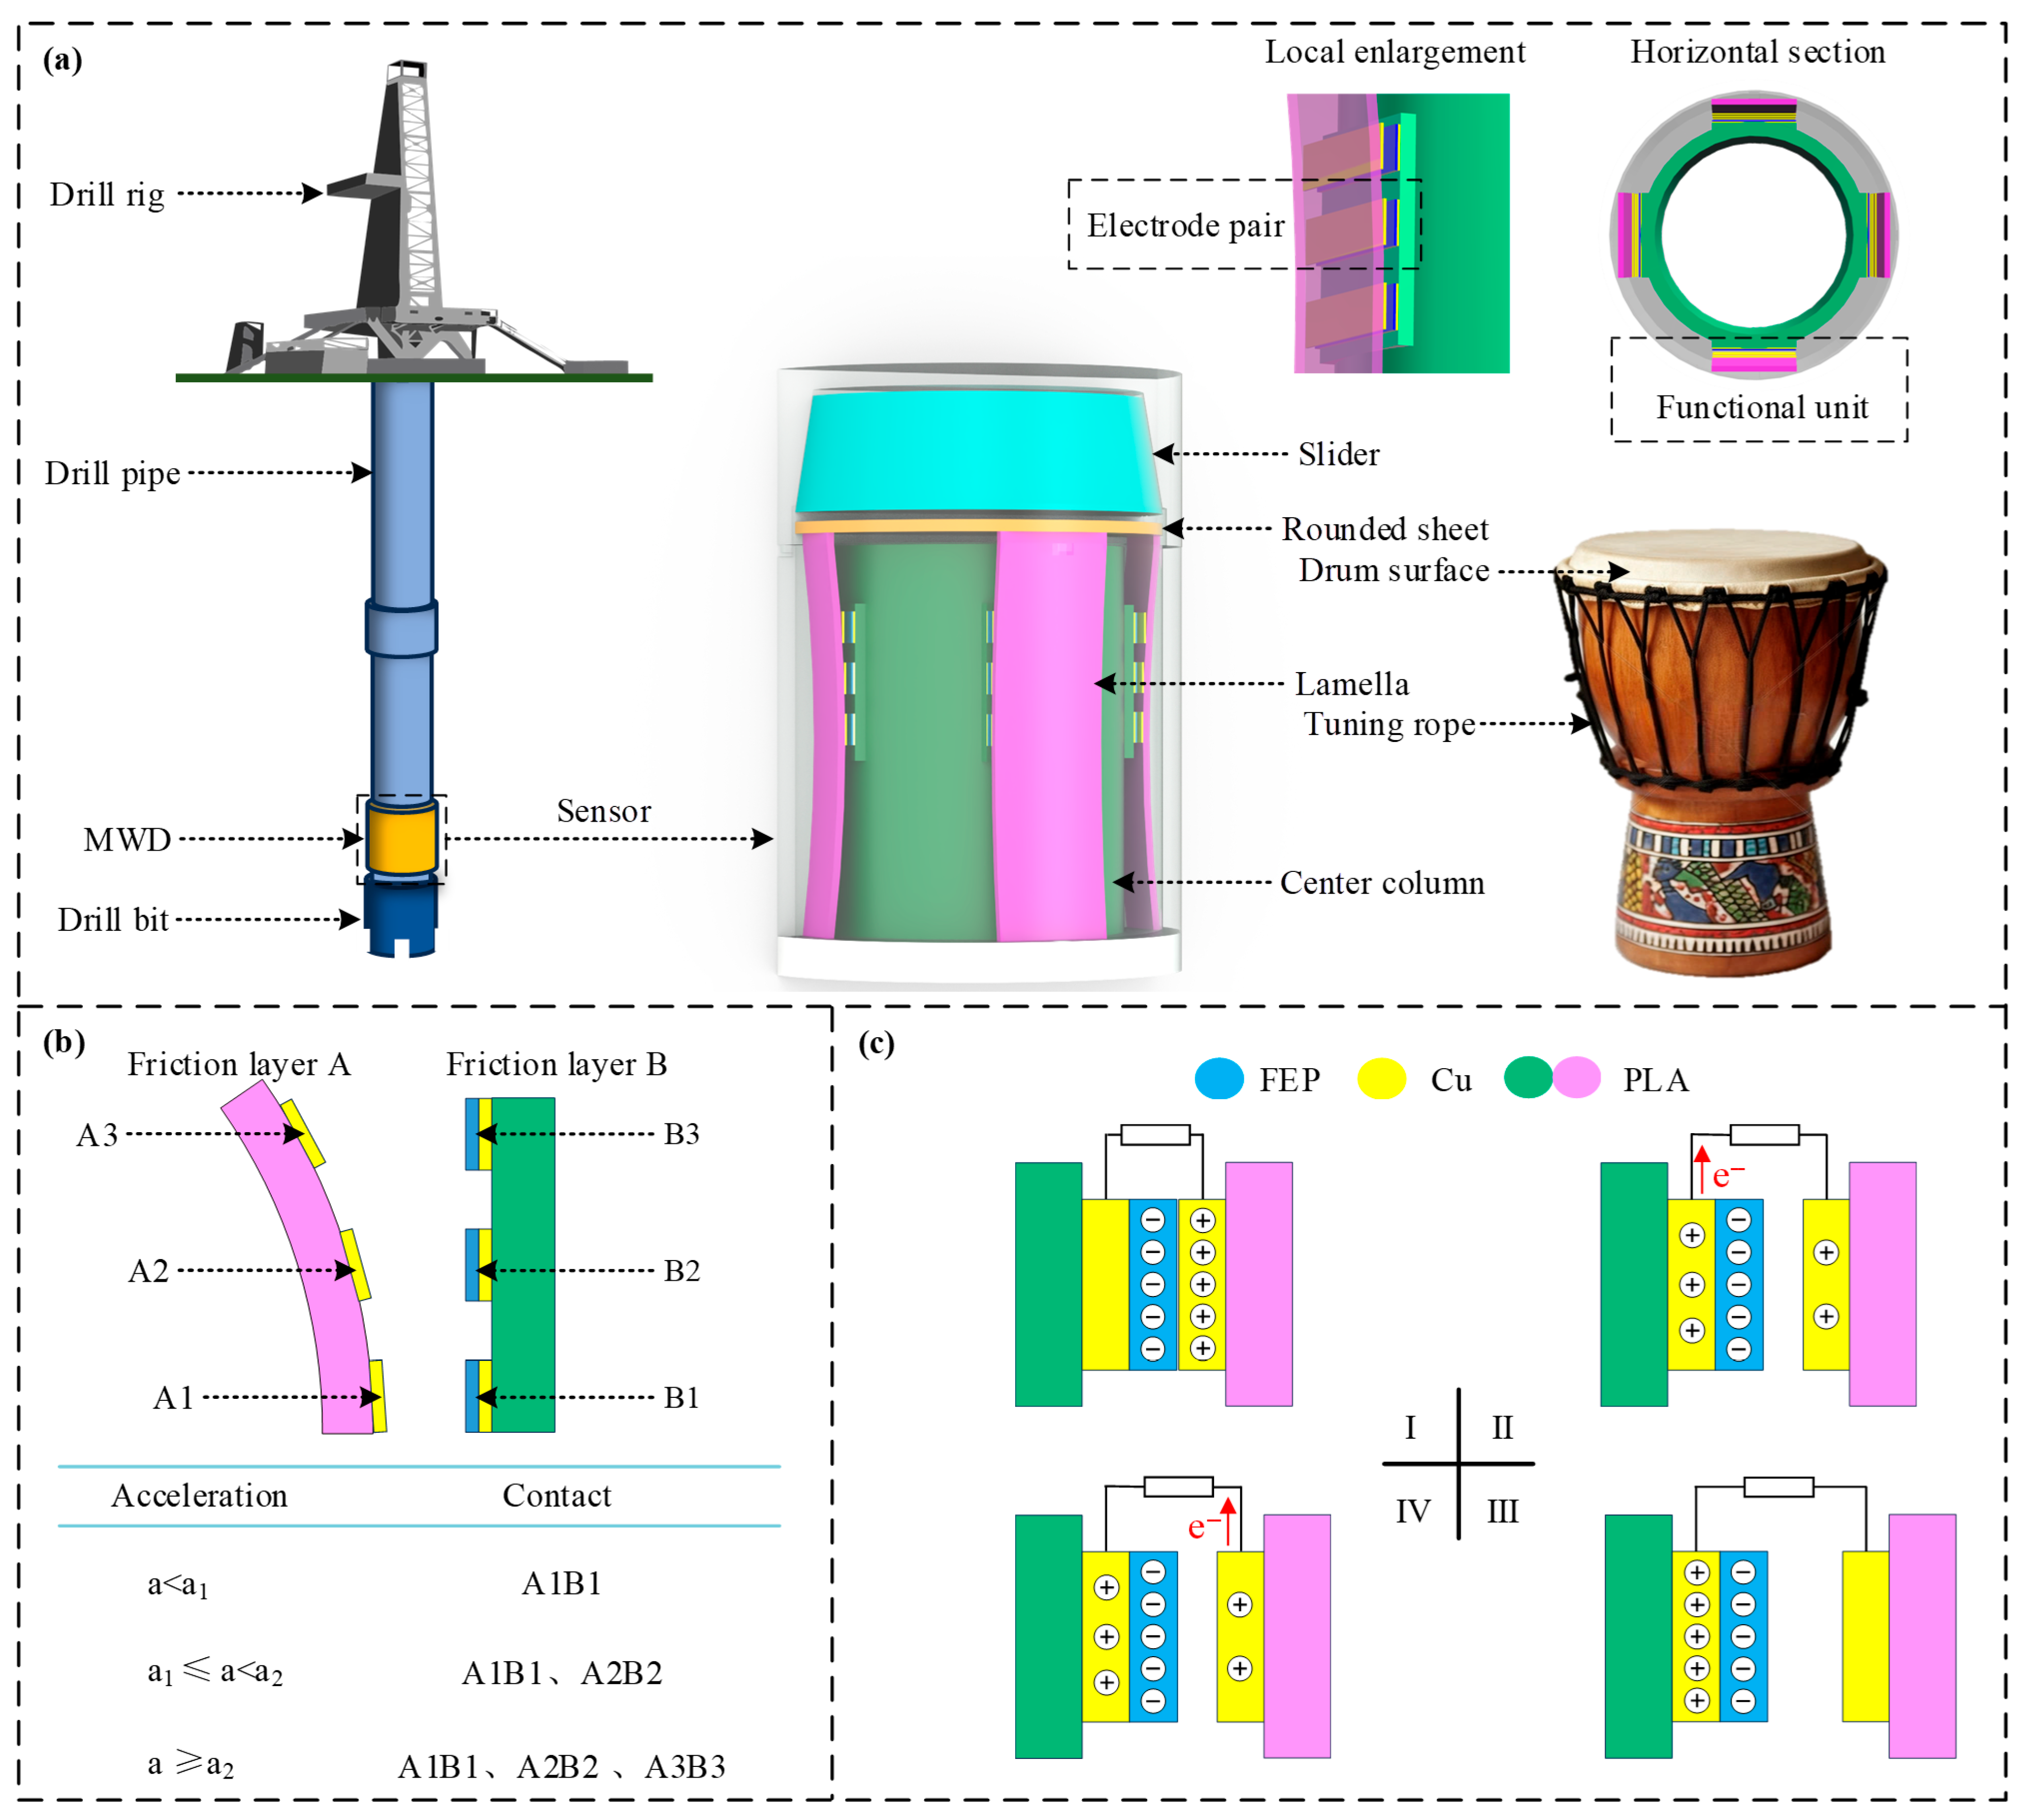
As illustrated in Figure 1a, the vibration-detecting unit is housed within a sealed measurement-while-drilling (MWD) tool, and it is secured onto the drill pipe via threads, protecting it from the corrosive chemical environment of the wellbore. The device’s design is derived from the architecture of an African djembe drum, abstracting the drumhead into a circular sheet to collect the normal force generated by vibration, and abstracting the tuning ropes into curved lamellae to convert mechanical force into displacement variables. The vibration characteristics of inhomogeneous objects provide a theoretical basis for structural optimization [35]. The sensor consists of a housing, slider, circular sheet, four sets of curved lamellae, and a central column, with an overall external dimension of Φ110 mm × 150 mm. Each curved lamella is integrated with a functional unit group, and each unit group is pasted with three TENG electrode groups to form friction layer A. The electrode material is Cu material, measuring 5 mm × 20 mm while possessing a thickness measuring 0.1 mm. Three friction layers B are pasted on the central column at positions corresponding to the three TENG electrode groups. Friction layer B is FEP material sized at 5 mm × 20 mm and being 0.1 mm thick. The complete device is manufactured via 3D printing utilizing PLA (polylactic acid). A printing temperature of 200 °C is used for the housing, circular sheet, curved lamellae, and central column, with a layer thickness of 0.1 mm, and an infill rate of 40% to achieve a lightweight design. The slider is printed with an 80% infill rate to enhance the inertial mass.
Figure 1.
Sensor structure and operational principle. (a) Illustration of the installation and structure; (b) Illustration of the principle for acceleration measurement; (c) Illustration of the TENG’s operational steps.
As shown in Figure 1b, when downhole vibration occurs, the slider moves axially under the action of inertial force, causing the four sets of curved lamellae to contact the central column. That is, friction layer A on the four sets of curved lamellae comes into contact with friction layer B on the central column, at which point a triboelectric signal is generated. Since the frequency of the triboelectric signal matches the oscillation rate, this specific value is acquired via subsequently calculating the frequency associated with the friction pulse output through a circuit. A total of three groups of electrodes are pasted on different positions of the A and B friction layers. When the drill string has an acceleration that is less than a certain threshold a1, the A1 and B1 electrodes on the A and B friction layers are in contact. When a is between the threshold a1 and the threshold a2, the A1 and A2 electrodes are in contact with the B1 and B2 electrodes, respectively. When a is greater than the threshold a2, the A1, A2, and A3 electrodes are in contact with the B1, B2, and B3 electrodes, respectively. Therefore, by judging whether the electrodes at different positions output triboelectric signals, the vibration acceleration range in which the downhole drill string is located can be obtained.
Since the basic principles of vibration frequency measurement and vibration acceleration measurement are grounded in the dual mechanisms of triboelectric charging and electrostatic induction taking place between the electrodes found in the A and B friction layers, the specific working steps and principles are explained using the A1 and B1 electrodes as a representative case. Illustrated in Figure 1c(I), denoting the frictional contact state, the A1 and B1 electrodes are in contact due to vibration induction. Because of the triboelectric phenomenon and the distinct electron-attracting capabilities of the materials, positive charges accumulate on the A1 electrode surface, while the surface of the B1 electrode becomes negatively charged. In the transition into the condition illustrated in Figure 1c(II), a gradual separation of the two electrodes occurs under the action of the elastic restoring force of the lamellae. As the electrostatic attraction between the A1 and B1 electrodes gradually weakens, electrostatic induction occurs between the copper conductive layer behind the B1 electrode and the A1 electrode, causing the charge of the copper conductive layer to gradually transfer to the A1 electrode, yielding an induced electrical current throughout the circuit. Subsequently, the separation distance between the A1 and B1 electrodes expands until the system attains the state presented in Figure 1c(III). At this stage, the circuit’s charge transfer terminates; the charge has reached a new equilibrium, and thus no current flows. As the next phase of vibration begins, bringing the system towards the phase presented in Figure 1c(IV), the proximity between the A1 and B1 electrodes is gradually brought closer again due to vibration induction. Driven by electrostatic induction, the charge residing on the A1 electrode shifts reversely towards the copper conductive layer, and an inverse current flow manifests within the circuit. Until it reaches the phase illustrated in Figure 1c(I) once more, the circuit’s charge migration is completed, and no transfer current is generated. It can be seen that a triboelectric pulse signal is produced in the circuit within one vibration cycle. Consequently, the oscillation frequency may be derived via calculating the total count of triboelectric pulse signals per unit time.
In practical deployment, the triboelectric signals are transmitted via wired connections to the downhole microcontroller, data are processed locally, and only critical status indicators (e.g., frequency values and acceleration alarm levels) are transmitted to the surface via mud pulse telemetry, adapting to the low-bandwidth characteristics of deep coal mine communications.
3. Test Results and Analysis
This experiment includes three parts: a measurement function test, an evaluation of its power generation capabilities, and a test of its environmental adaptability. The measurement function test serves to confirm the effectiveness and precision of the device for measuring vibrations, the power generation test assesses the sensor’s capacity for generating power, and the environmental adaptability test is for evaluating the sensor’s output under various environmental conditions, including temperature and humidity.
3.1. Testing Equipment
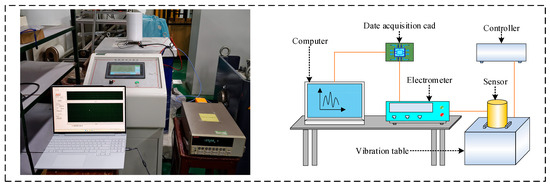
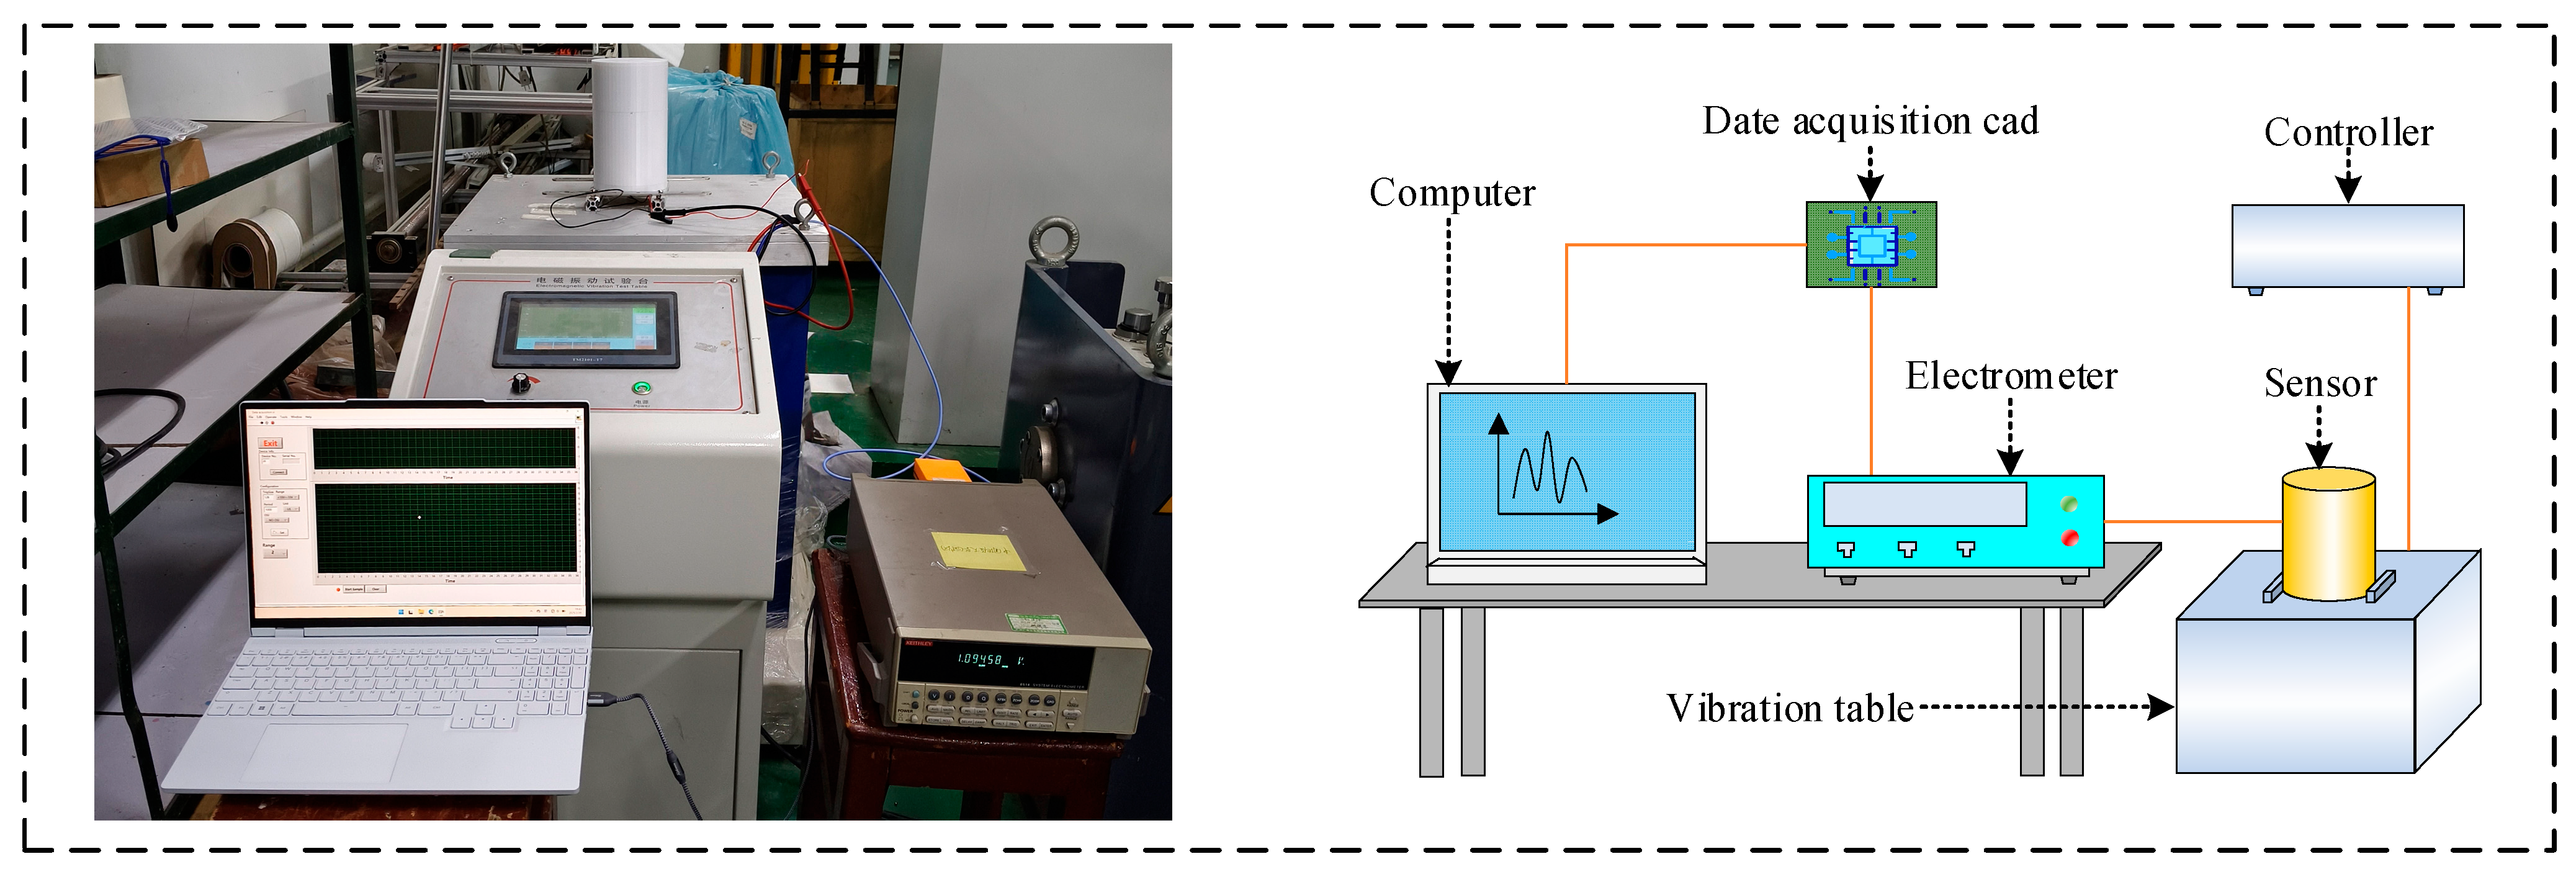
As illustrated in Figure 2, the experimental configuration comprises a vibration shaker, an electrometer, a data collection board, and a PC. The sensing unit is fixed onto the vibration table, and the frequency and acceleration of the vibration table are regulated by a vibration controller. The electrical output produced by the sensor is recorded via the electrometer, then input to the computer through the data acquisition card, and these data are subsequently displayed and stored by the computer’s software.
Figure 2.
Test equipment.
3.2. Measurement Function Test
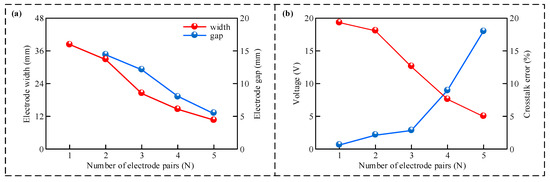
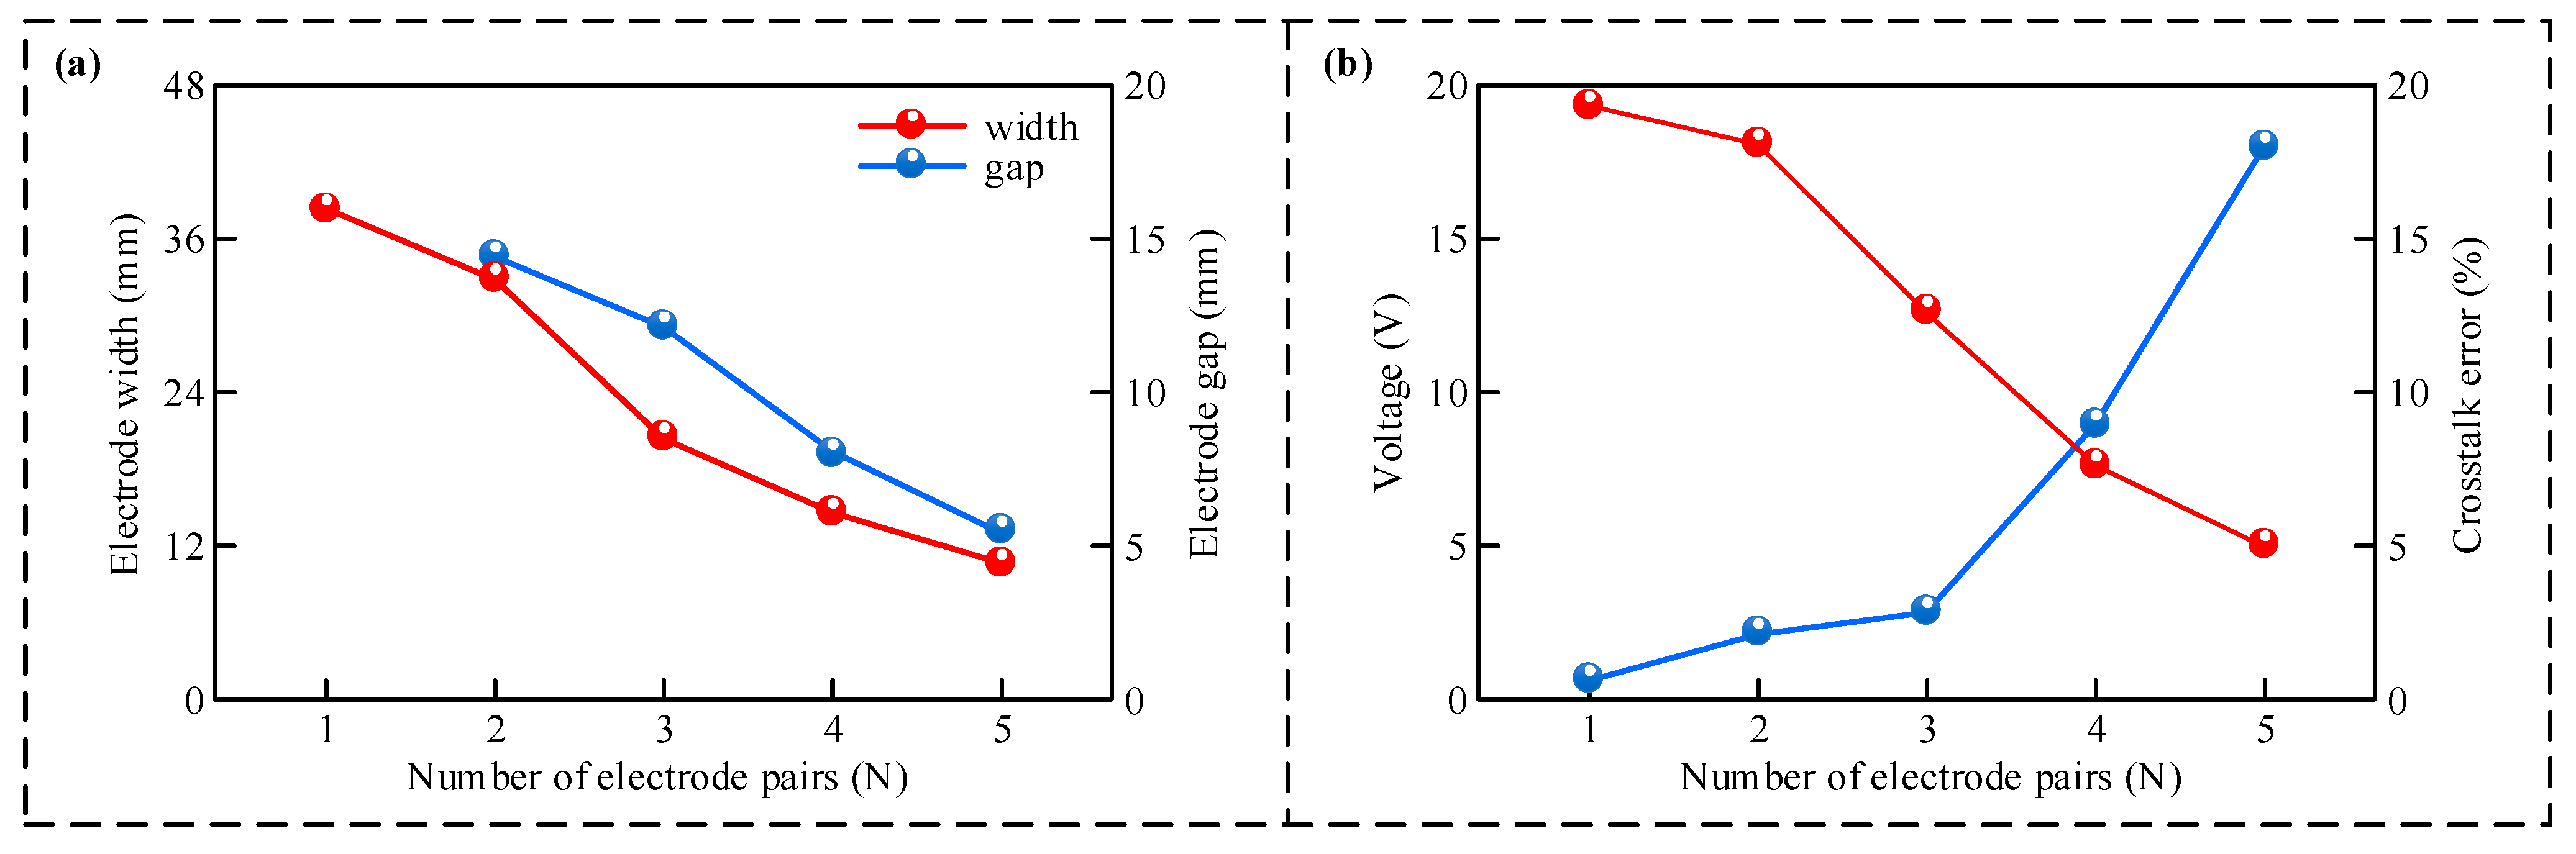
To optimize the sensor’s resolution and signal reliability within the limited structural space, the influence of the number of electrode pairs (N) was investigated. In this experiment, the total effective sensing length of the central column was kept constant. Consequently, as N increases, the available space for each electrode unit diminishes. Figure 3a illustrates the geometric changes: as N increases from 1 to 5, the single electrode width significantly decreases from approximately 38 mm to 11 mm, and the inter-electrode gap narrows correspondingly. These structural changes directly impact the electrical output, as shown in Figure 3b. The open-circuit voltage exhibits a downward trend due to the reduced effective contact area of the narrower electrodes, dropping from 19 V to 5 V. Conversely, the signal crosstalk error rises as the gap shrinks, increasing sharply when N exceeds 3 due to the heightened interference between adjacent electrodes. The results indicate a critical tradeoff. While increasing number improves the theoretical resolution of acceleration measurement, it compromises signal strength and accuracy. The configuration of N = 3 achieves the optimal balance, maintaining a sufficient output voltage for robust detection while keeping the crosstalk error at a negligible level. Therefore, the three-electrode-pair structure was adopted as the final design for this study.
Figure 3.
Experimental results for different number of electrode pairs (N). (a) Electrode width and electrode spacing for different values of N; (b) Voltage and crosstalk error for different values of N.
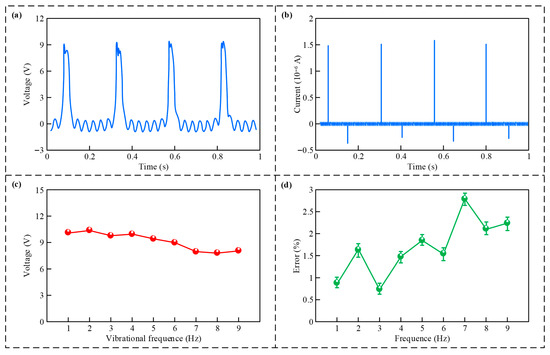
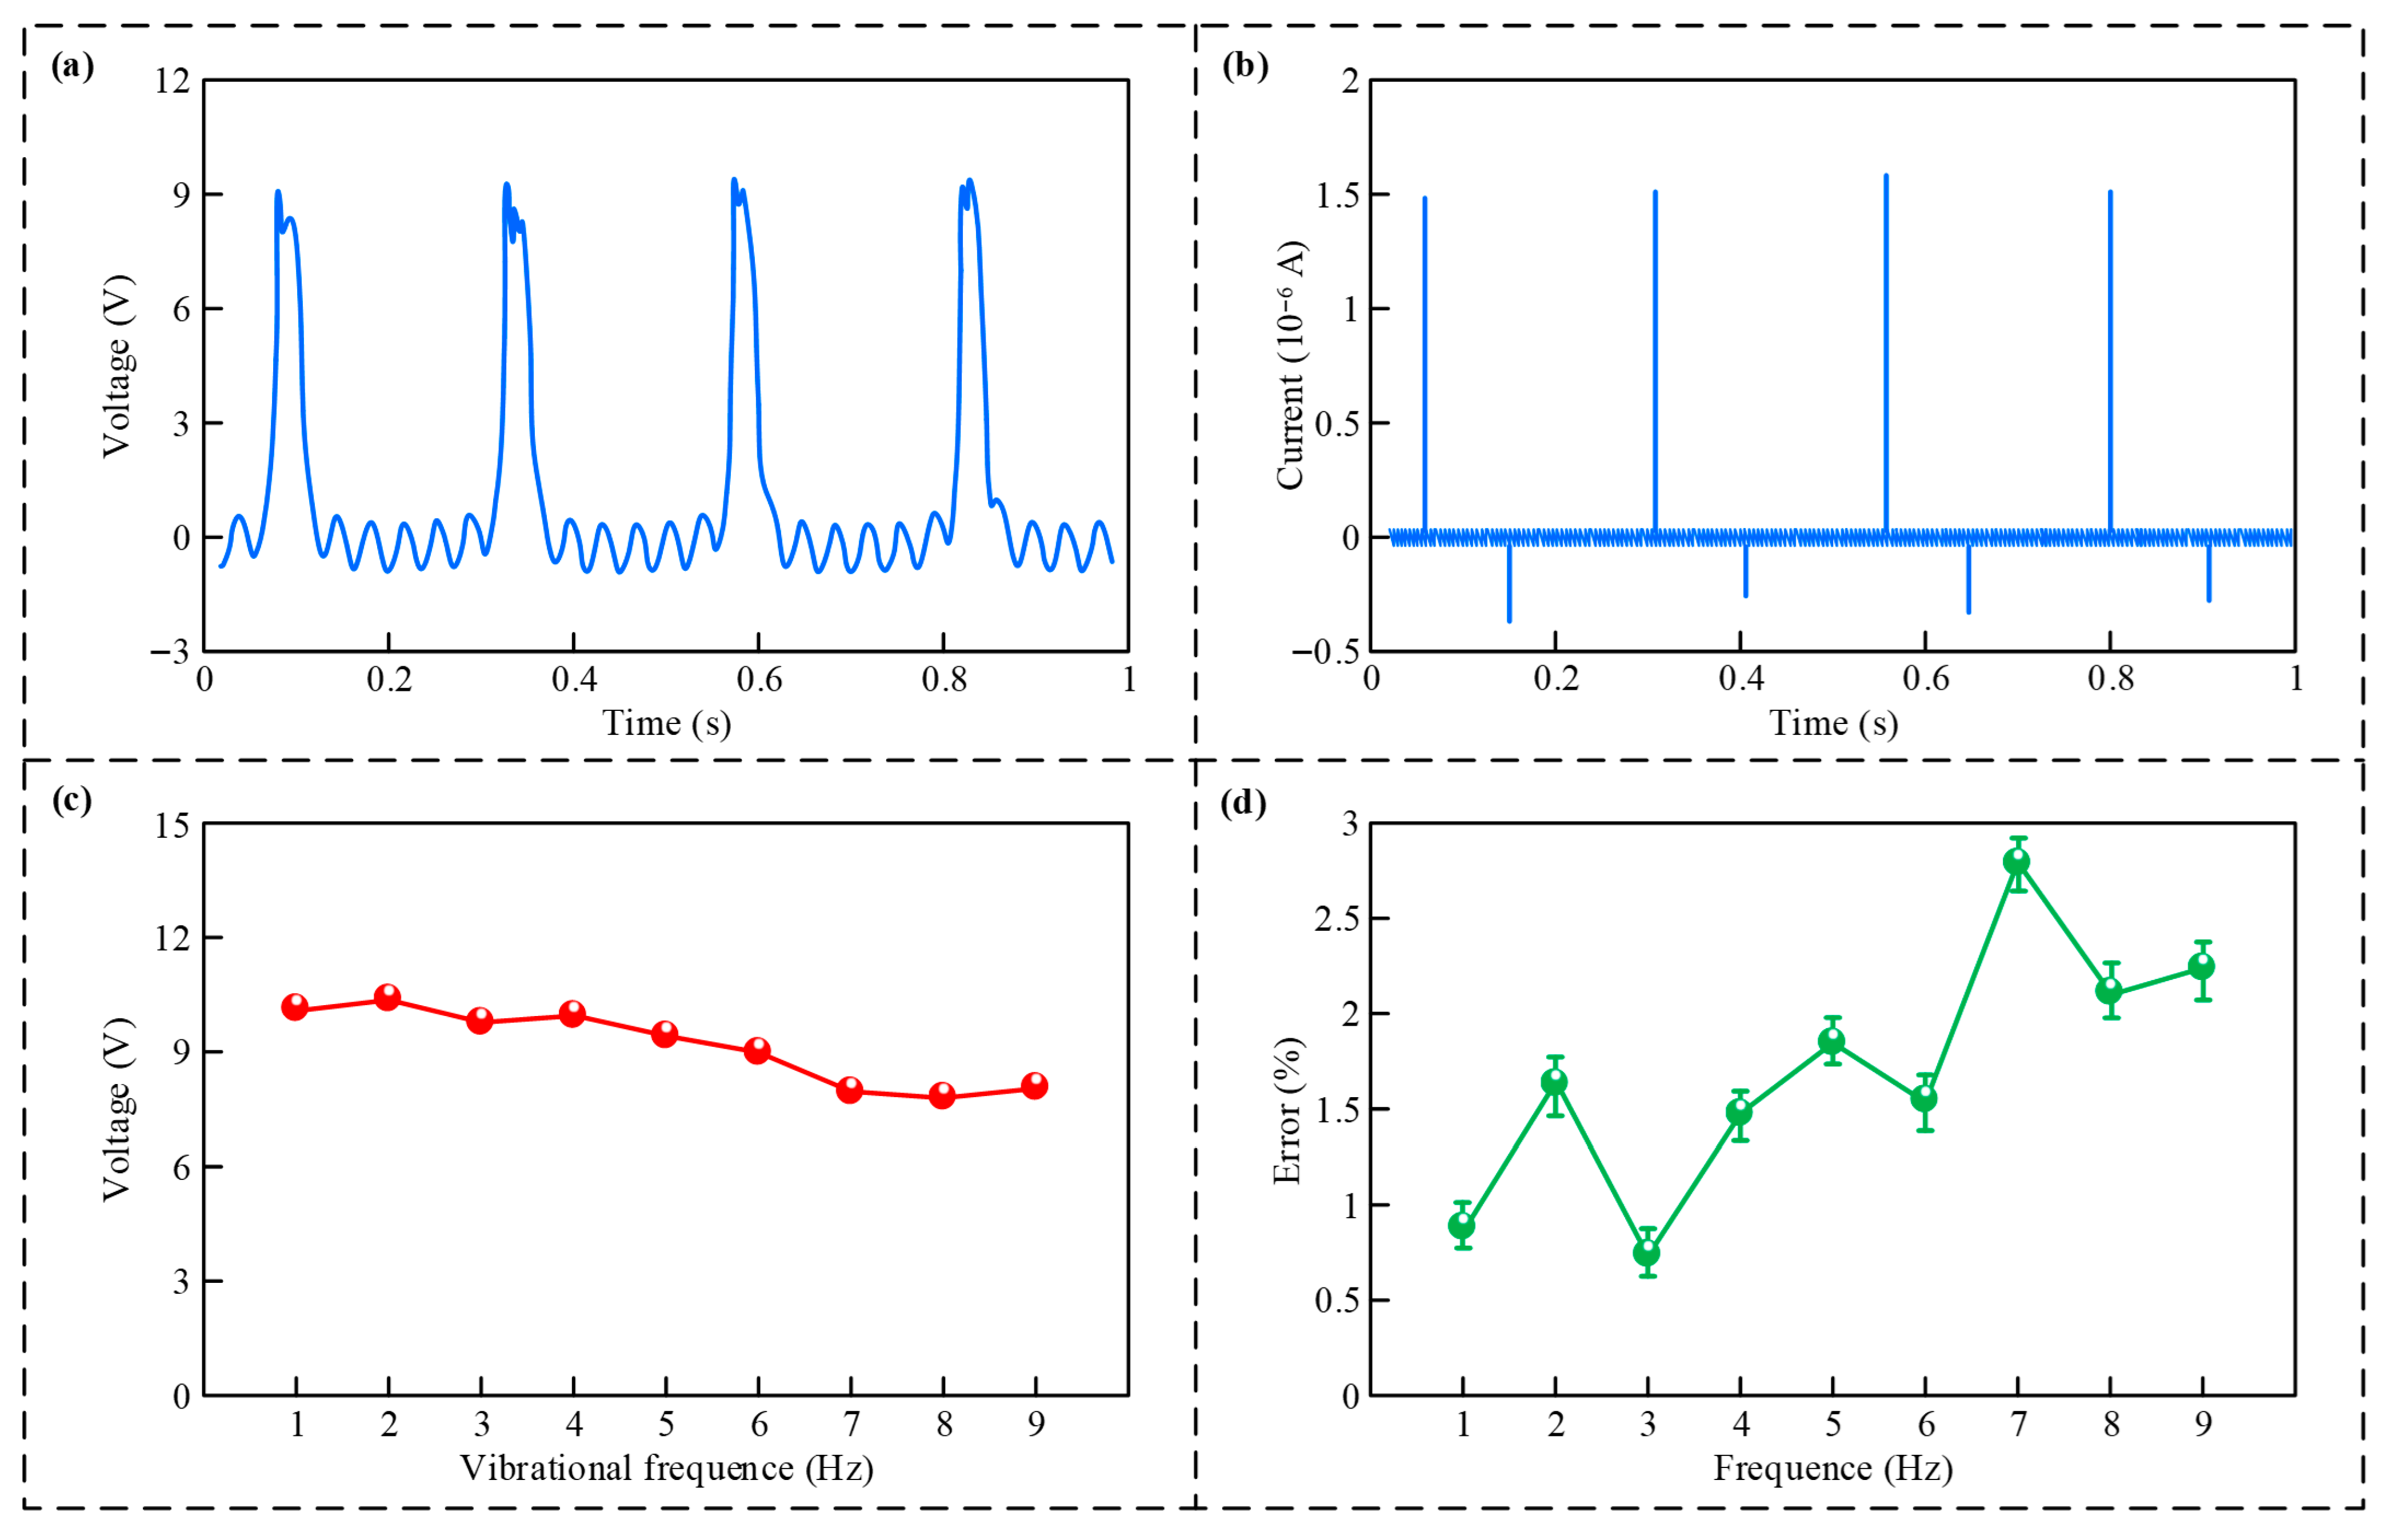
The results of the sensor vibration frequency measurement function test are shown in Figure 4. Figure 4a,b show the respective open-circuit voltage alongside the short-circuit current generated by the sensor during 4 Hz vibrations. It is apparent that the quantity of voltage and current pulses aligns with the vibration frequency. Therefore, either the voltage signal or the current signal may be utilized as the sensor’s output indicator. Nevertheless, the magnitude of the voltage signal is on the order of V, whereas the current signal’s magnitude falls within the nA range, indicating that the sensor output exhibits features of high voltage paired with low current. Therefore, this sensor chooses the voltage signal to function as the device’s output to obtain higher anti-interference ability. The sensor’s open-circuit voltage across various vibration frequencies was further tested. Figure 4c’s curve illustrates that for vibration frequencies below 4 Hz, the open-circuit voltage fluctuates slightly, but it is generally relatively stable. However, once the vibration frequency surpasses 4 Hz, the open-circuit voltage shows a slight downward trend as the vibration frequency increases. This occurs because, at excessive frequencies, the frictional engagement involving the nanomaterials inside the sensor is too fast, resulting in insufficient contact and reducing the effective friction contact area, resulting in a minor reduction of the sensor’s output. In particular, for frequencies of vibration above 9 Hz, the number of output waveforms of the sensor no longer corresponds to the vibration frequency. Consequently, the effective detection scope regarding the sensor’s oscillation frequency is defined as 0 to 9 Hz. It can be seen that the output voltage of the sensor within the range of 0–9 Hz exhibits no sharp abrupt peaks, which verifies that the system is far from the resonance point in this frequency band. While the current study utilizes time-domain pulse counting to monitor the fundamental rotation speed, we acknowledge that this is a baseline measurement [36].
Figure 4.
Outcomes of the vibration frequency test. (a) Output voltage waveform at 4 Hz; (b) Output current waveform at 4 Hz; (c) Open-circuit voltage across various vibration frequencies; (d) Fitted curve for the vibration frequency measurement error.
Subsequently, the sensor’s measurement discrepancy within this range was tested. During the experiment, 1000 sets of data were tested under each vibration frequency value. The experimental data presented in Figure 4d indicates that the measurement error curve for the sensor exhibits some fluctuation, but overall, it grows as the vibration frequency rises, while the peak measurement error stays below 3%. This occurs because under high-frequency vibration, the nanomaterials may not have time to rub before entering the next round of friction contact, which leads to fewer friction contact times than the actual vibration times, introducing measurement errors, and the introduction of this error is positively correlated with the frequency value.
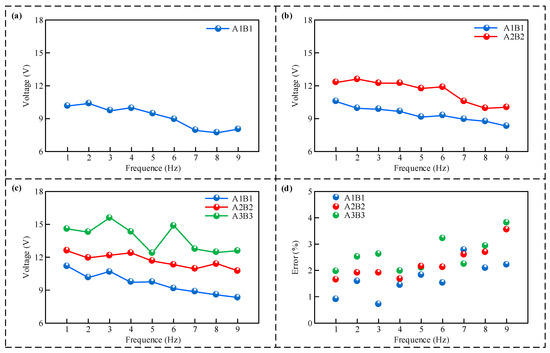
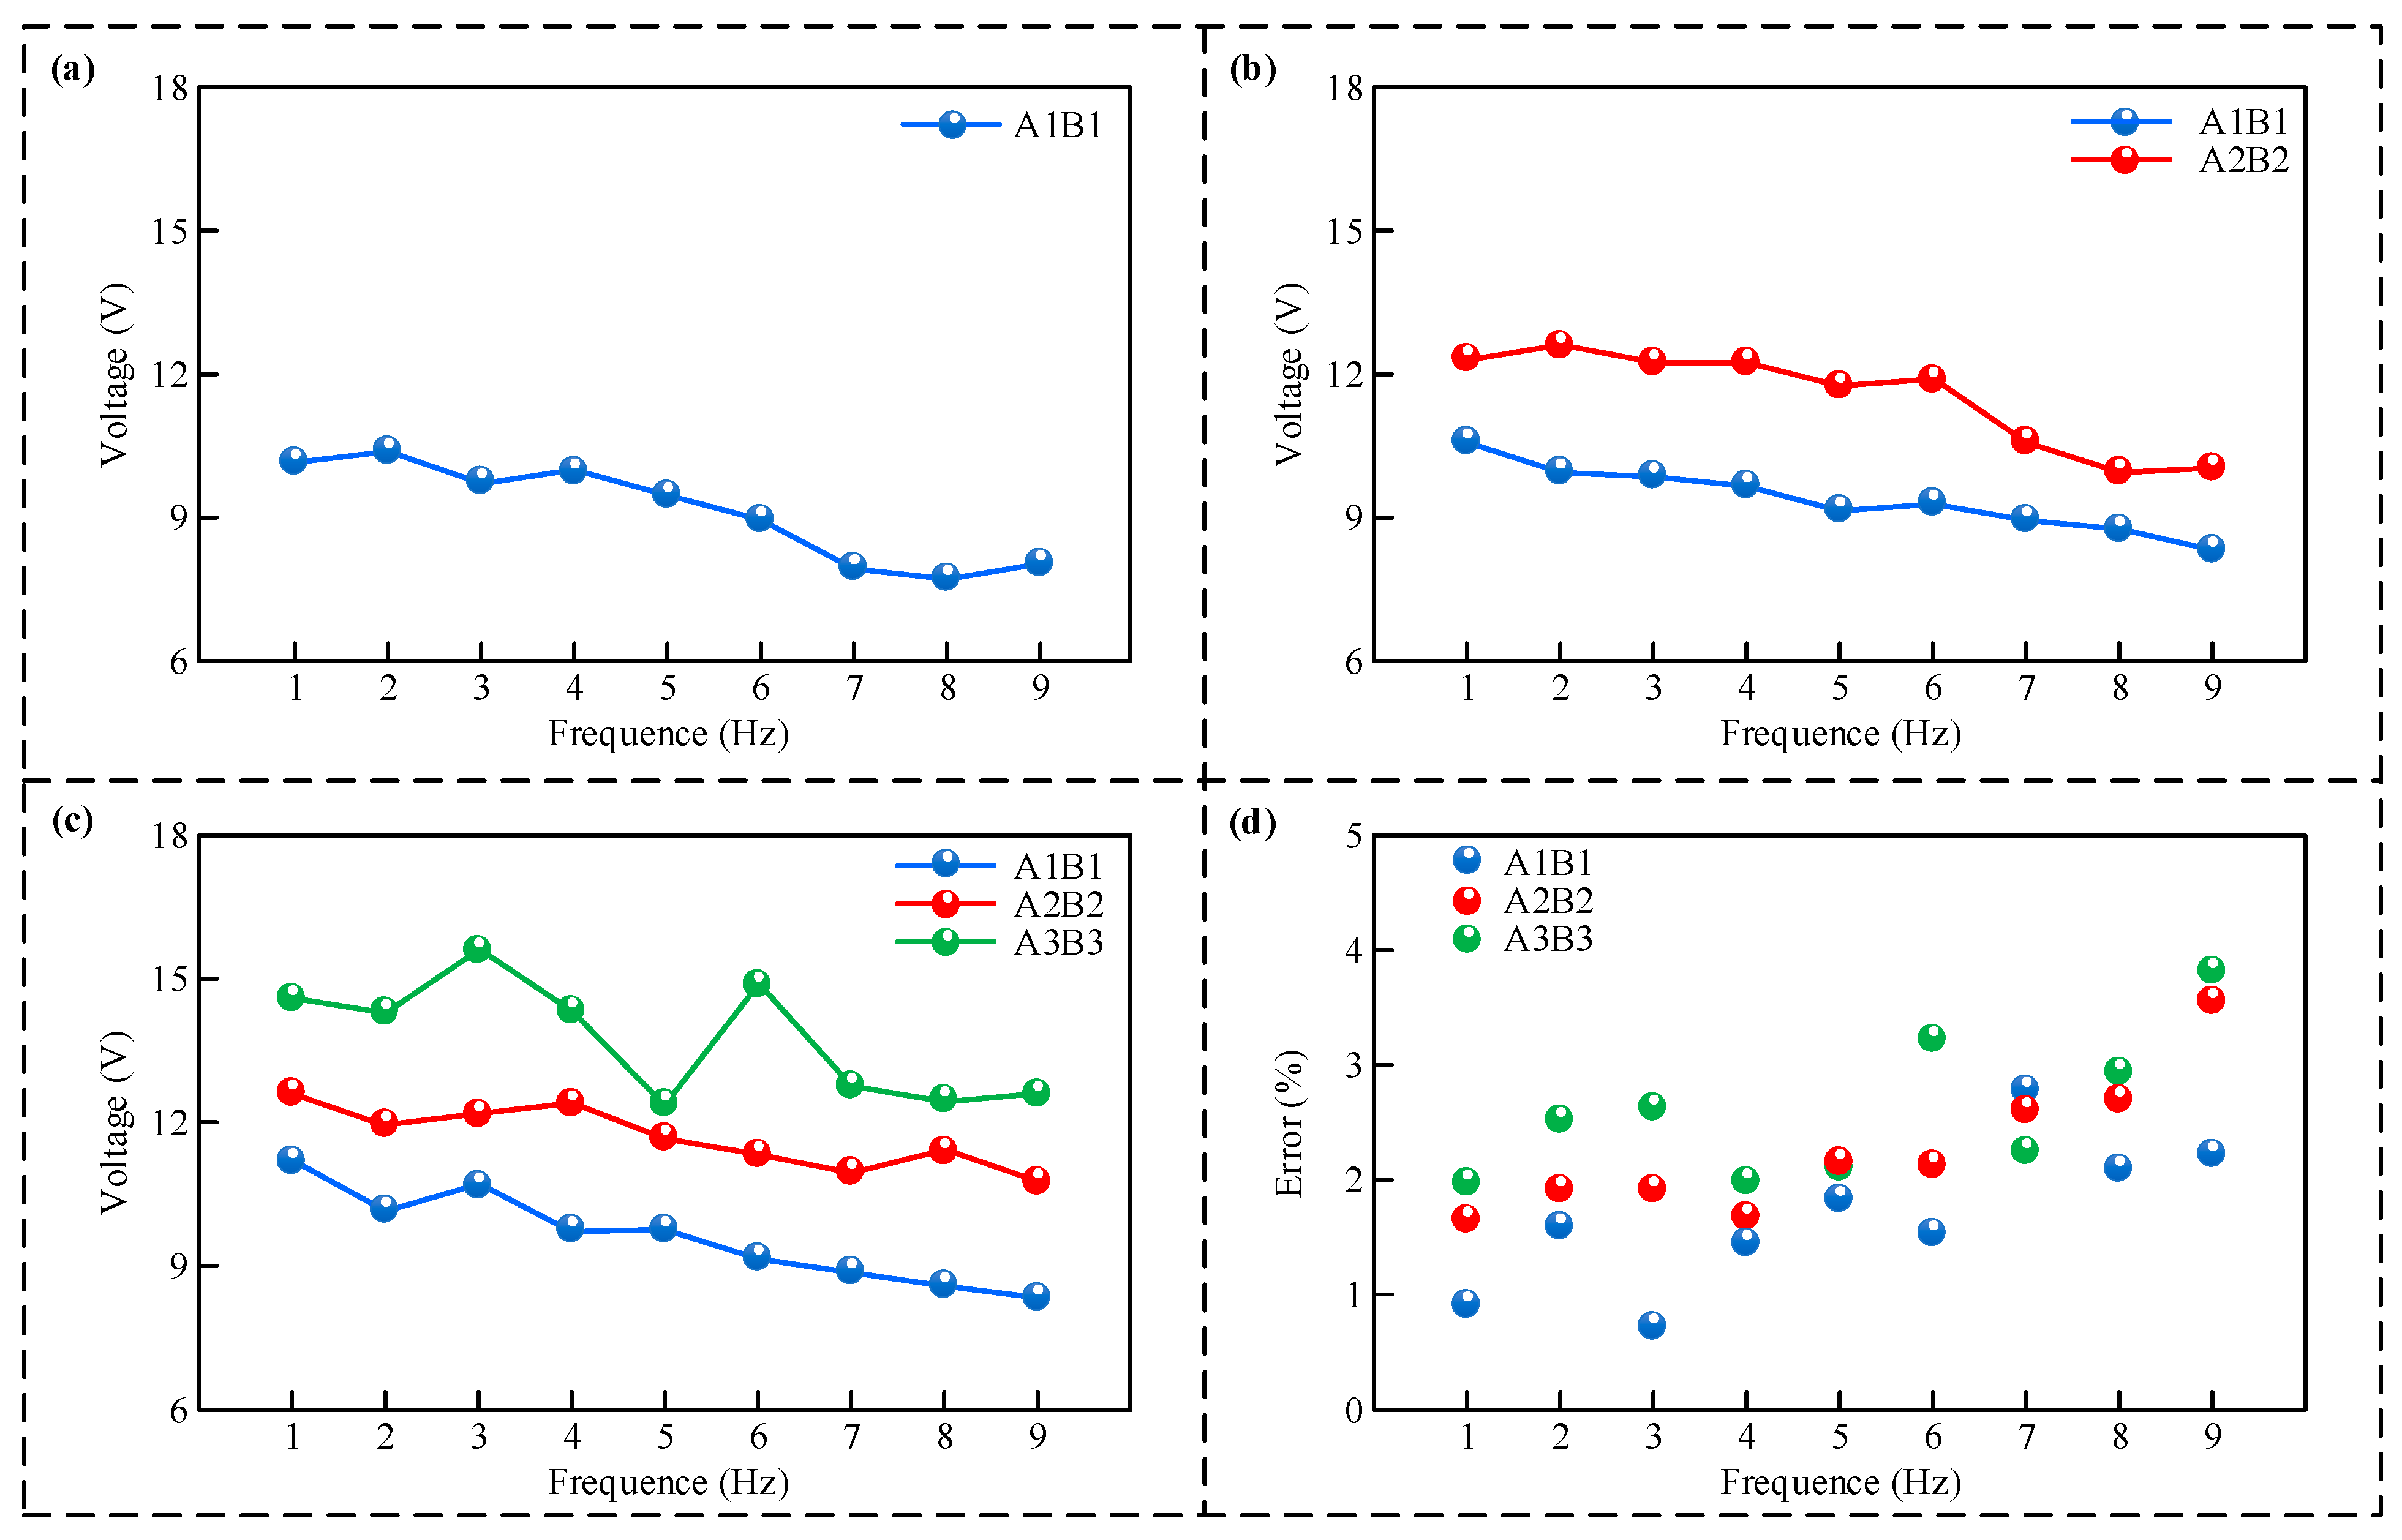
The results of the sensor vibration acceleration measurement function test are shown in Figure 5. Figure 5a–c systematically show the output signal curves of different electrodes of the sensor under different acceleration thresholds. It can be seen that when the acceleration is less than 1 g, only the A1 and B1 electrodes are in contact. When the acceleration is between 1 g and 2 g, the A1 and A2 electrodes are in contact with the B1 and B2 electrodes, respectively. When the acceleration is greater than 2 g, the A1, A2, and A3 electrodes are in contact with the B1, B2, and B3 electrodes, respectively. Therefore, connect the microprocessor chip to the output signal lines of different electrodes. When only the A1B1 electrode outputs an electrical pulse signal, the acceleration is less than 1 g. When both the A1B1 electrode and the A2B2 electrode output electrical pulse signals, the acceleration is between 1 g and 2 g. When A3B3 outputs an electrical pulse signal, the acceleration is greater than 2 g. Therefore, the sensor can monitor the acceleration threshold range. The measurement error of the sensor measuring acceleration was further tested. During the experiment, 1000 sets of data were tested under each vibration frequency value. As can be seen from the measurement error shown in Figure 5d, the average error from the acceleration-measuring sensor is typically in proportion to the vibration acceleration value, meaning a higher acceleration leads to a larger measurement error. This occurs because as the acceleration rises, the sensor’s frictional contact is insufficient or even too late to rub, which introduces measurement errors. The overall maximum measurement error is less than 4%, so the error of the sensor measuring acceleration is defined as 4%. The vibration frequency range of the sensor covers the primary vibrations induced by drill string rotation, thereby reflecting the safe operating status of the downhole drilling tools to a certain extent. Furthermore, the measured vibration acceleration threshold can serve as a typical critical value for distinguishing stable drilling states [37].
Figure 5.
Vibration acceleration test outcomes. (a) The output voltage from the A1B1 sensor electrode across various vibration frequencies for vibrational accelerations below 1 g; (b) The output voltage from the A1B1 and A2B2 sensor electrodes across various vibration frequencies for vibrational accelerations ranging from 1 g to 2 g; (c) The output voltage from the A1B1, A2B2, and A3B3 sensor electrodes at various vibration frequencies for vibrational accelerations exceeding 2 g; (d) Scatter plot of vibration acceleration measurement error.
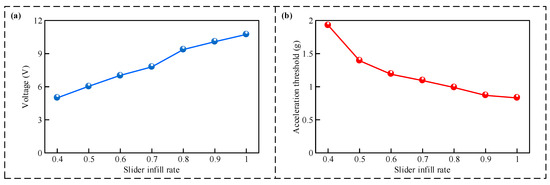
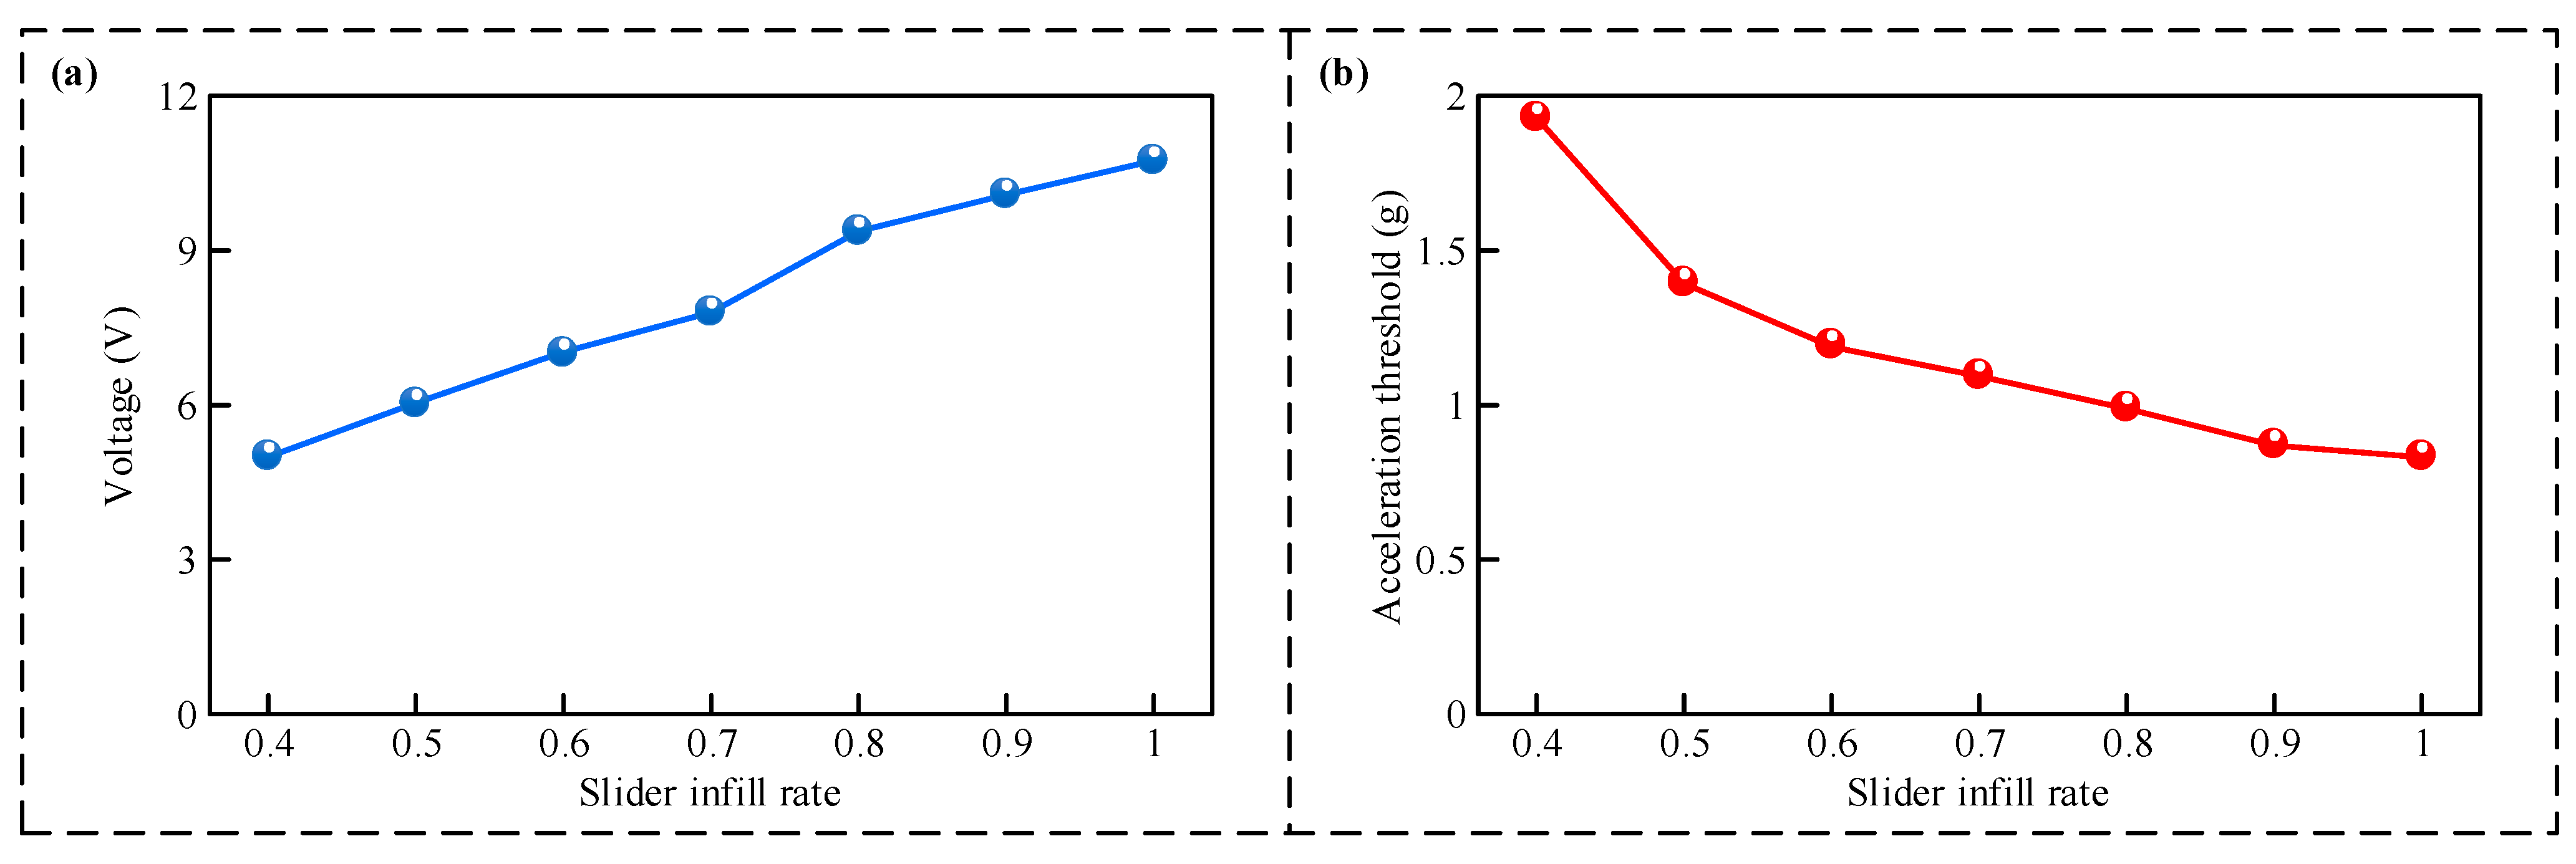
The slider infill rate for all experiments above was 0.8. Below, we will alter the slider infill rate to investigate its impact on the output. The relationship between output voltage and slider infill rate is shown in Figure 6a. At a vibration frequency of 5 Hz and a vibration acceleration of 1 g, the increased slider mass due to higher fill rate results in more complete contact between friction layers, leading to an increase in the open-circuit voltage of the A1B1 electrodes. The relationship between acceleration threshold and slider infill rate is shown in Figure 6b. Sliders with low infill rates require greater acceleration to bring the A2B2 electrodes into contact and generate voltage. The acceleration threshold at which A2B2 generates voltage decreases overall as the slider infill rate increases.
Figure 6.
Experimental results for different slider infill rates. (a) Open-circuit voltage under different slider infill rates at 5 Hz and 1 g; (b) Acceleration threshold for different slider infill rates at 5 Hz.
3.3. Power Generation Performance Test
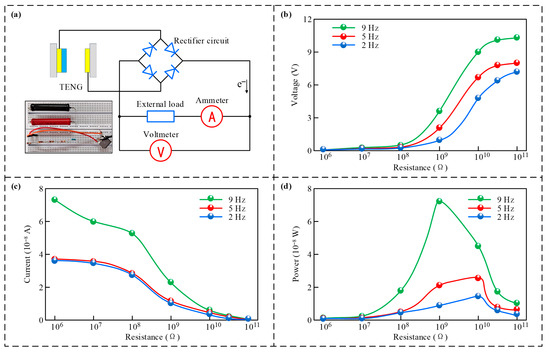
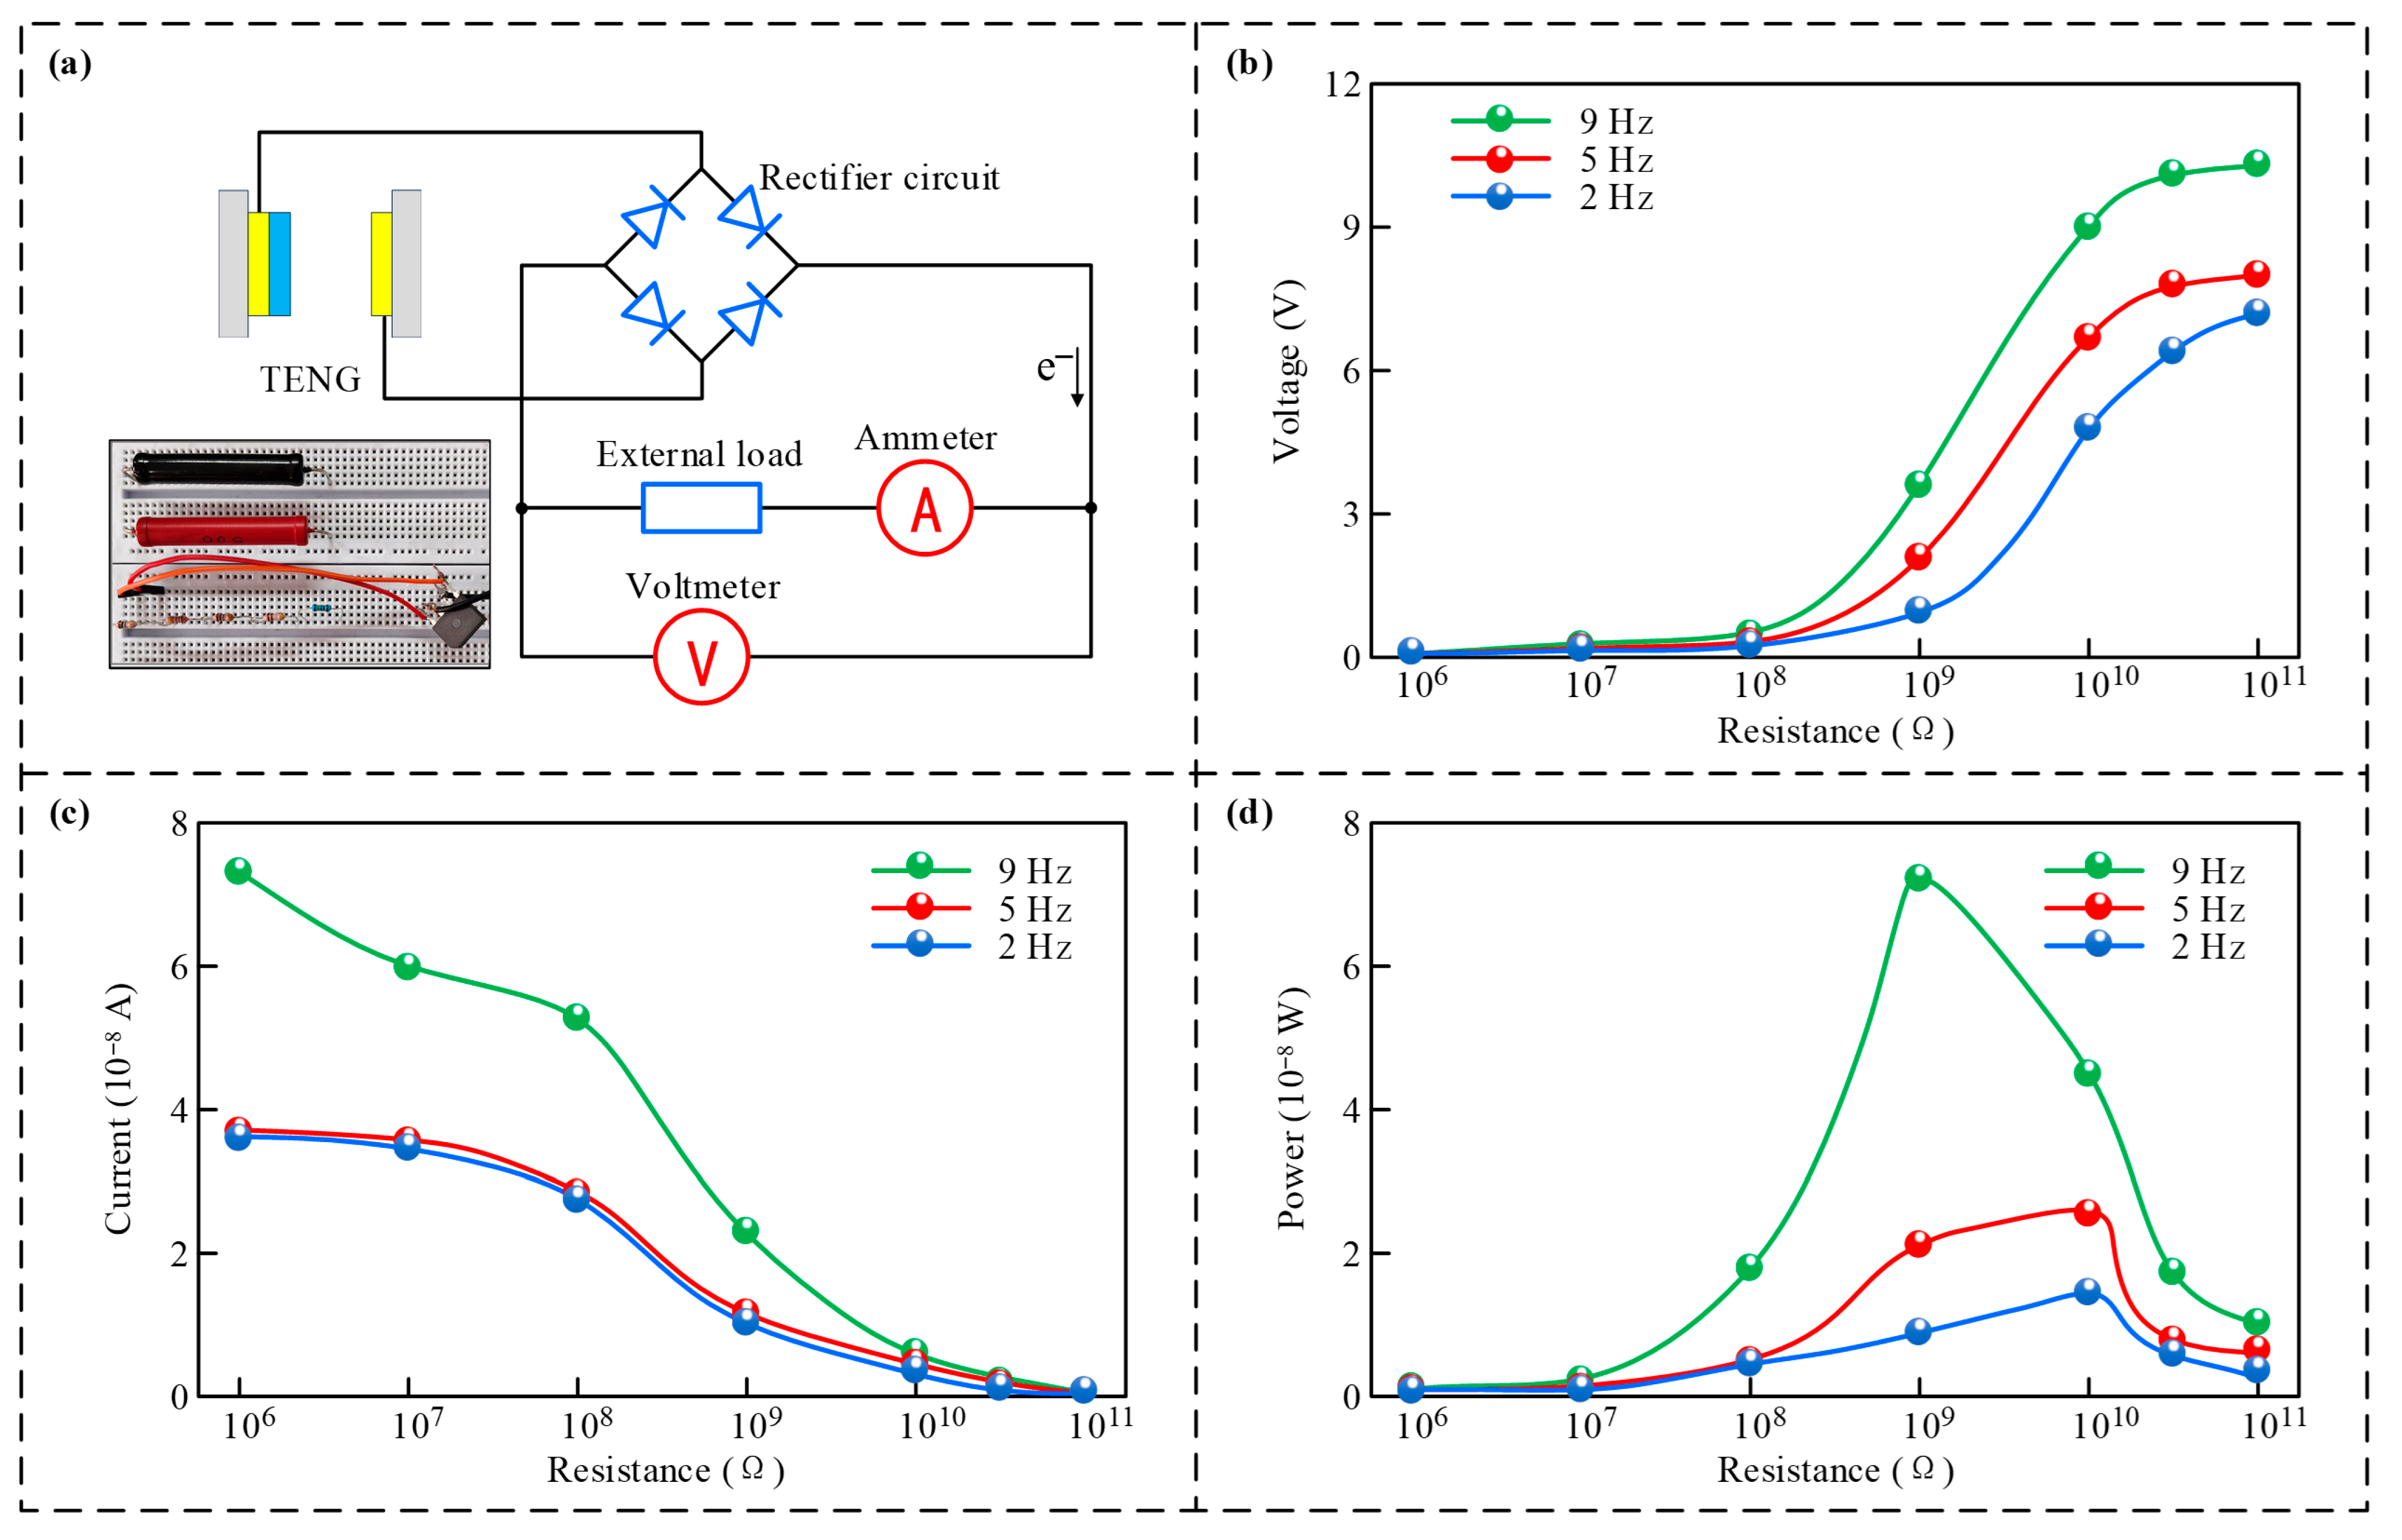
The energy-harvesting performance outcomes for this device are illustrated in Figure 7. As depicted in Figure 7a, since a signal generated by this contact–separation triboelectric nanogenerator is alternating current (AC), a bridge rectification unit is employed for realizing the transformation from AC to DC conversion. The output potential and current from the device across various resistance conditions were subsequently examined. The experimental findings depicted within Figure 7b,c indicate that the generated voltage and current produced by the device exhibit significant non-linear characteristics with the change of resistance value. When the load resistance is higher than 50,000 MΩ, the generated potential and current levels are basically stable. As the external resistance is between 100 MΩ and 10,000 MΩ, the generated electrical signals change most fastest. This output power characteristics under different loads are shown in Figure 7d. It can be seen that under 2 Hz, 5 Hz, and 9 Hz vibration excitation, with a resistance value of 1000 MΩ, this sensor achieves a peak power generation of 14.4 nW, 25.5 nW, and 72 nW, respectively, showing a clear positive correlation with frequency. This phenomenon is due to the increase in the number of contact and separation times of the friction interface under high-frequency vibration, which increases the interface charge transfer density per unit time, and then manifests as an increase in output power.
Figure 7.
Results of the power generation performance test. (a) Schematic of the test circuit; (b) Output voltage across various loads; (c) Output current across various loads; (d) Output power across various loads.
3.4. Environmental Adaptability Test
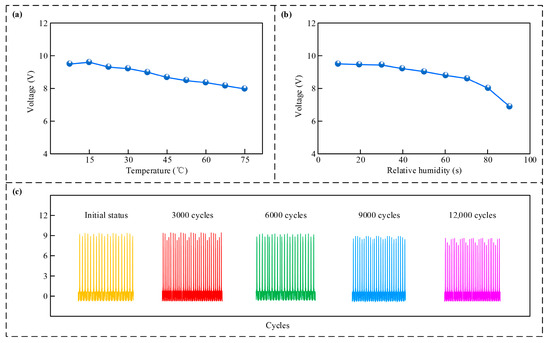
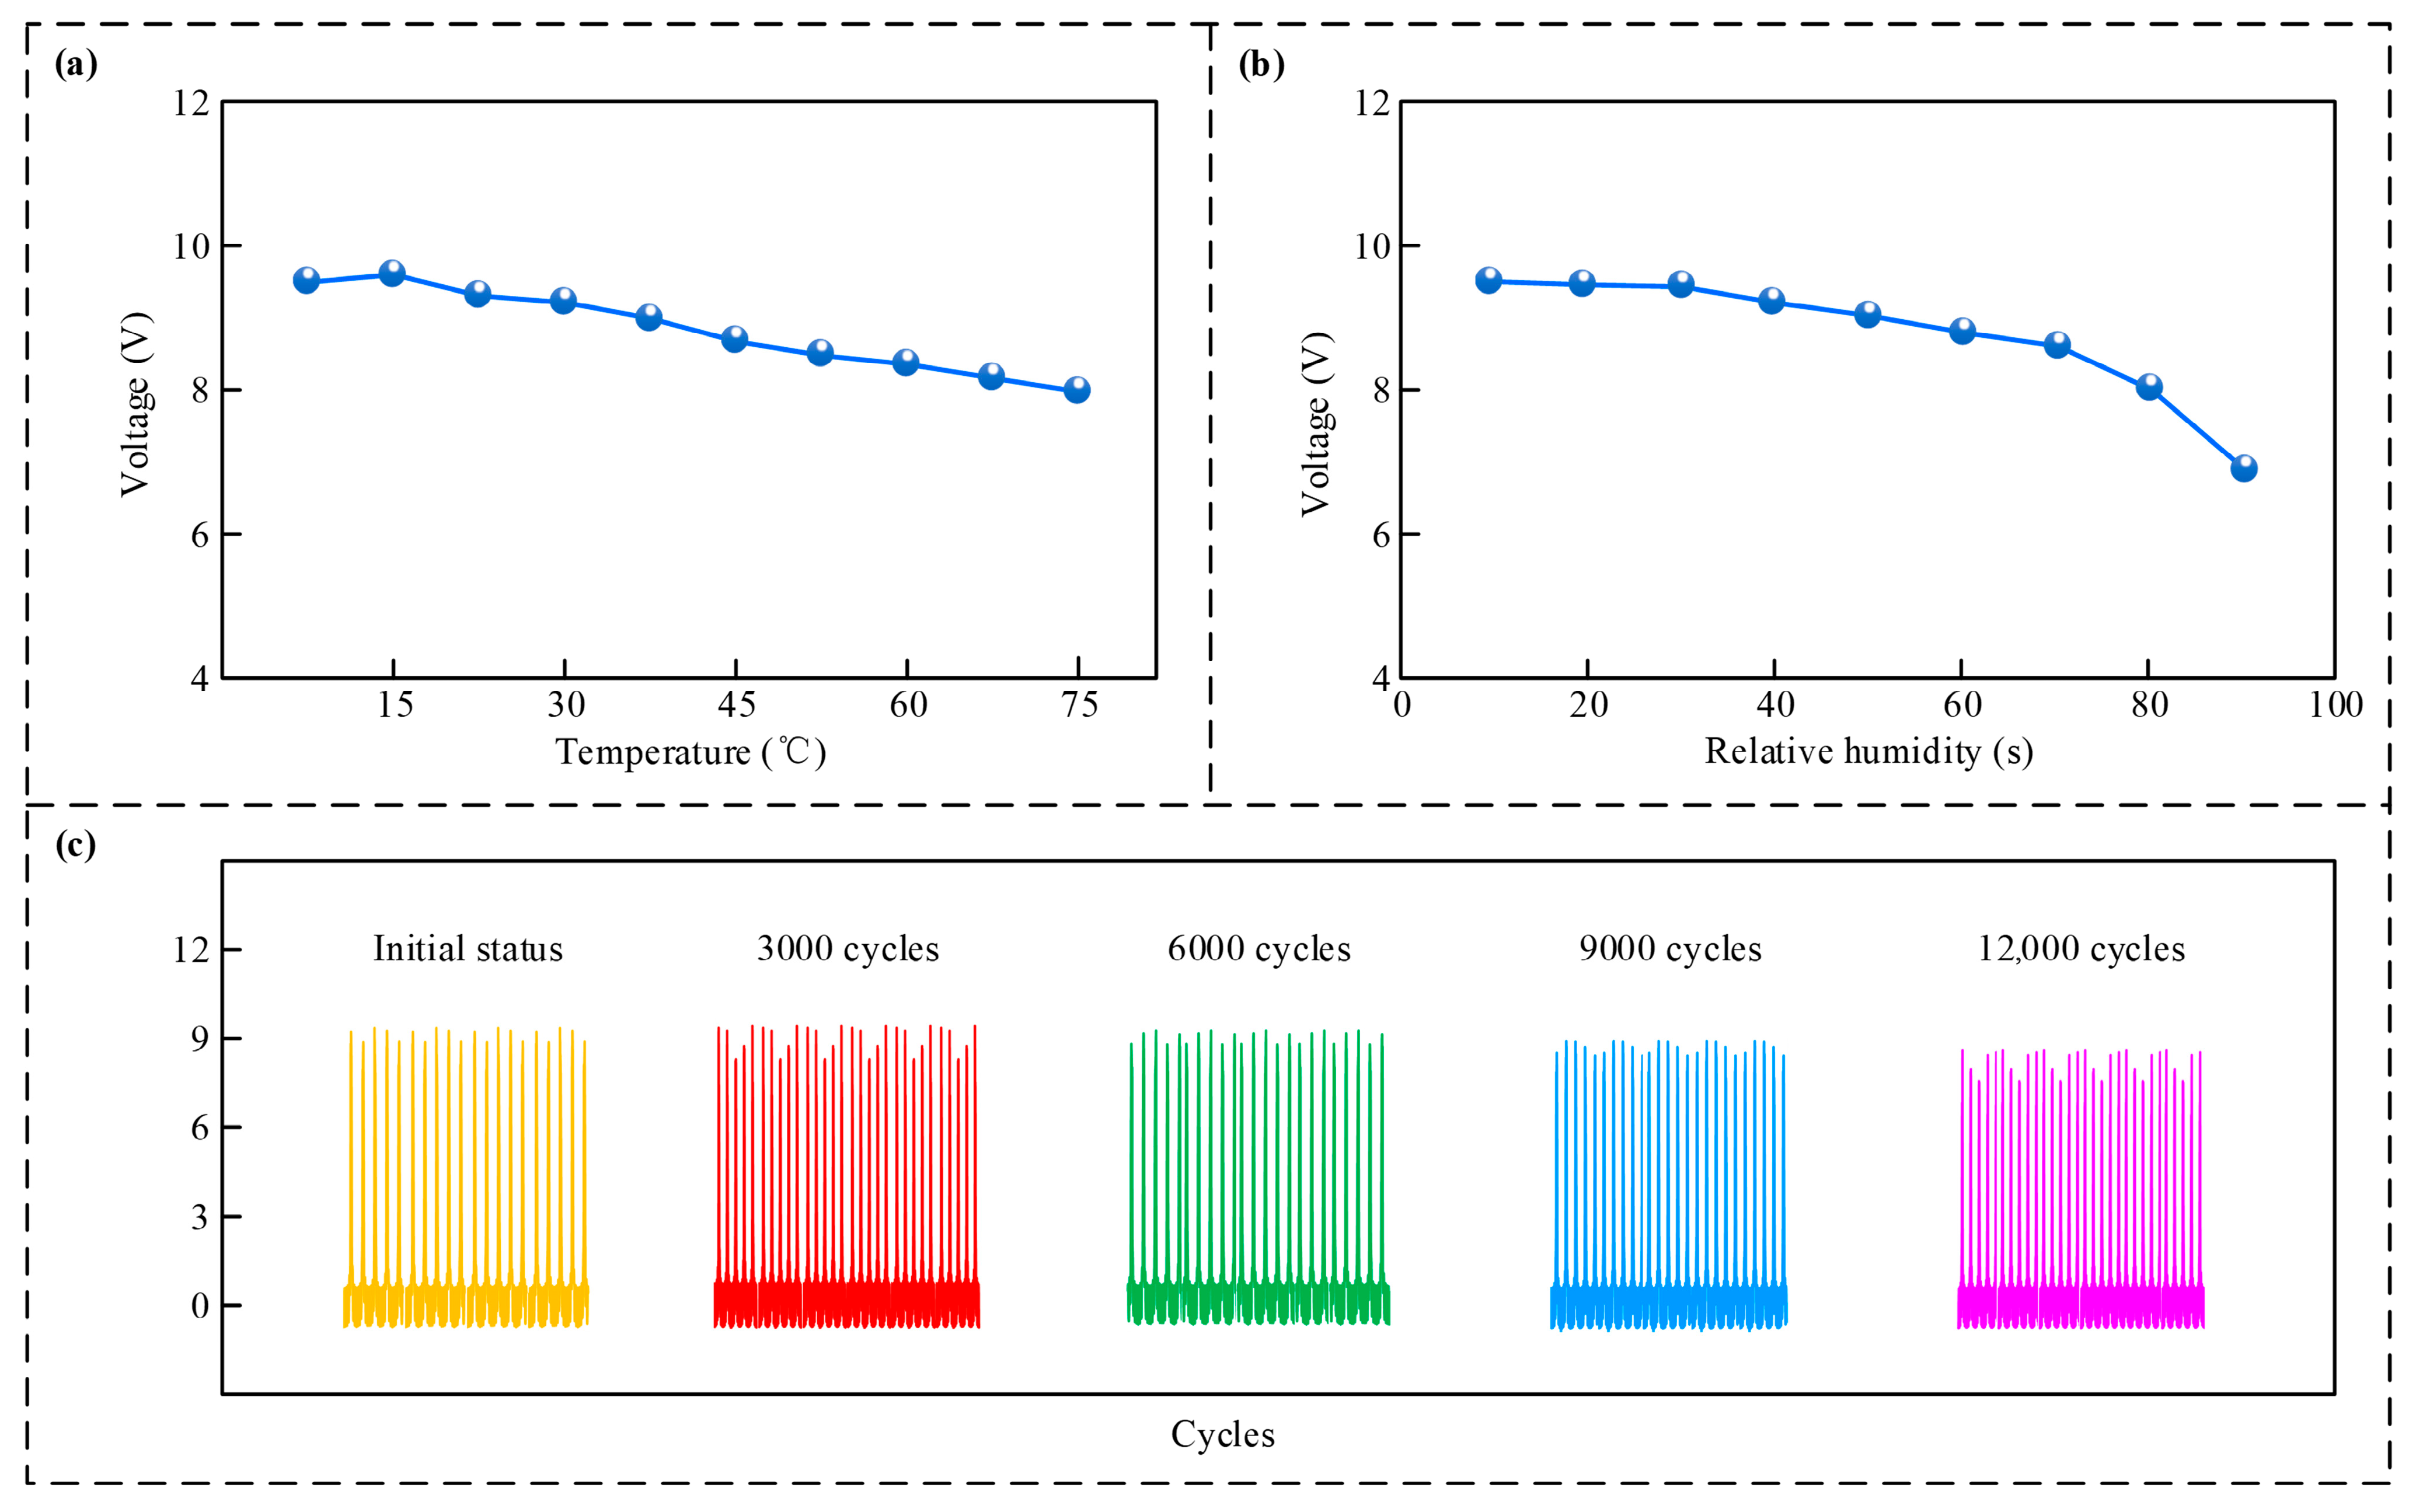
To evaluate the sensor’s reliability under real-world engineering conditions [38], the test parameters were selected based on the typical environment of deep coal mines. Given that coal mine roadway temperatures are controlled by ventilation and typically remain below 40 °C [39,40], a test range up to 75 °C was selected to ensure a sufficient safety margin. Similarly, considering the high humidity caused by dust suppression sprays, the humidity test range was set up to 90% RH. The environmental adaptability experimental findings regarding this device are illustrated within Figure 8. As depicted in Figure 8a, at temperatures below 75 °C, the voltage generated by the sensor demonstrates a linearly declining trend as the temperature increases. However, it can still maintain an effective output of 8 V at the highest temperature. The experimental results confirm that the sensor maintains reliable performance across the tested range of 15 °C to 75 °C, which covers the typical operating conditions of coal mines. For the subsequent microprocessor, its effective voltage is still at the V level, which is much higher than the 2 V level voltage standard that the chip can read. Therefore, it shows that the sensor has reliable temperature resistance. As shown in Figure 8b, as the ambient relative humidity increases from 10% up to 90%, the generated potential falls from 9.4 V to 6.8 V. The voltage drop in the humidity > 80% range is intensified. Nevertheless, the resulting voltage magnitude remains above the recognition threshold standard, indicating that the device possesses good resistance to humidity. The sensor’s stability over long-term operation was further tested. During the test, each test was performed in groups of 20 s, and the working frequency was 9 Hz. As shown by the experimental results in Figure 8c, after 12,000 operational cycles, the sensor’s output potential is maintained at 8.6 V, while the signal attenuation amounts to just 6.5%, which confirms the device’s stability during long-term operation.
Figure 8.
Environmental adaptability test results. (a) Output voltage at different temperatures; (b) Output voltage at different relative humidity levels; (c) Output voltage after different numbers of cycles of use.
3.5. Comparison of Sensor Types
To clarify the position of the proposed device in the field of downhole monitoring, a comparison with commercial MEMS accelerometers and conventional frequency-only TENG sensors is presented in Table 1. While the proposed sensor has lower resolution compared to commercial MEMS devices, its self-powered nature and threshold detection capability offer a unique advantage over conventional TENGs, making it an ideal candidate for low-power event triggering applications.
Table 1.
Comparison of different types of sensors.
4. Discussion
Compared to traditional sensors, the sensor developed in this study offers several advantages. First, it operates based on the triboelectric mechanism of a nanogenerator, achieving energy autonomy and eliminating reliance on external power sources. However, the power output of the sensor is relatively low. Currently, it can only function as a self-powered sensor, meaning it requires no external power supply for its own operation. To serve as a power source for downstream measurement-while-drilling (MWD) instruments or circuit boards, further measures to enhance power generation are still necessary. This design effectively overcomes the limitations of conventional power supply methods, thereby improving drilling efficiency. Second, the sensor integrates multiple subsurface physical parameter detection functions, enabling not only vibration frequency measurement but also simultaneous measurement of vibration acceleration thresholds. Third, the sensor’s triboelectric contact unit comprises four sets of arc-shaped thin-film electrodes. Any single set of triboelectric electrodes can independently detect vibration frequency and acceleration. This means the sensor remains functional even if up to three arc-shaped electrode sets are damaged, ensuring high reliability.
However, the sensor still has room for improvement. For the next iteration, We plan to use new nanomaterials such as CDs/PVDF composite nanofibers to improve the output power [41]. To improve acceleration resolution, we plan to increase the number of contact points and optimize the mechanical structure of the lamellae. Meanwhile, while this study evaluated temperature and humidity independently to characterize their individual effects, future work will involve coupled environmental testing to further assess the sensor’s stability under simultaneous thermal and mechanical stresses.
5. Conclusions
This study introduces a drum-shaped multifunctional vibration detector based on the TENG, capable of simultaneously measuring vibration frequency and acceleration. Experimental results demonstrate that the sensor can measure vibration frequencies ranging from 0 to 9 Hz with a measurement error below 3%. It achieves vibration acceleration measurements at thresholds of 1 g and 2 g, with an acceleration measurement error less than 4%. The sensor operates reliably in environments with temperatures below 75 °C and relative humidity below 90%. Additionally, the sensor possesses energy-harvesting capabilities. Experiments show that, under a 1000 MΩ external load and a 9 Hz vibration frequency, the sensor generates a peak energy output of 72 nW.
Author Contributions
Conceptualization, Y.F.; methodology, Y.F. and J.L.; validation, Y.F.; investigation, C.W.; data curation, X.C.; writing—original draft preparation, X.C. and X.S.; writing—review and editing, J.L. and X.S.; project administration, Y.F.; funding acquisition, C.W. All authors have read and agreed to the published version of the manuscript.
Funding
This work was funded by the National Key Research and Development Program of China (No. 2023YFC2907502); CNPC Innovation Fund (No. 2022DQ02-0309).
Institutional Review Board Statement
Not applicable.
Informed Consent Statement
Not applicable.
Data Availability Statement
The original contributions presented in this study are included in the article. Further inquiries can be directed to the corresponding authors.
Conflicts of Interest
Author Jiangbin Liu was employed by the company Shaanxi Shaanxi Coal Caojiatan Mining Co., Ltd. The remaining authors declare that the research was conducted in the absence of any commercial or financial relationships that could be construed as a potential conflict of interest.
Abbreviations
The following abbreviations are used in this manuscript:
| TENG | Triboelectric nanogenerator |
| BHA | Bottom hole assembly |
| MWD | Measurement-while-drilling |
References
- Kun, Z.; Ke, W.; Jianxi, R.; Shangxin, F.; Pengbo, C.; Yutao, Z.; Yanping, M.; Jian, H. Analyzing in-situ stress response characteristics of coals based on optimized measurement-while-drilling parameters. Coal Geol. Explor. 2025, 53, 20. [Google Scholar]
- Piao, S.; Huang, S.; Wang, Q.; Ma, B. Experimental and numerical study of measuring in-situ stress in horizontal borehole by hydraulic fracturing method. Tunn. Undergr. Space Technol. 2023, 141, 105363. [Google Scholar] [CrossRef] [Scilit]
- Yang, Q.; Liu, Z.; Wang, X.; Liu, B.; Tian, F.; Wang, X. Physical model test and numerical modeling of cross-sectional shape effect on evolution mechanism of time-delayed deformation and rockburst in deep tunnels. Rock Mech. Rock Eng. 2025, 1–29. [Google Scholar] [CrossRef] [Scilit]
- Zhou, H.; Liu, Z.; Shao, J.; Shen, W.; Hamdi, E. Effects of stress direction and magnitude on strength and failure of weakly anisotropic sandstone under true triaxial compression. Rock Mech. Rock Eng. 2025, 1–22. [Google Scholar] [CrossRef] [Scilit]
- Kalhori, H.; Bagherpour, R.; Tudeshki, H. Monitoring of drill bit wear using sound and vibration signals analysis recorded during rock drilling operations. Model. Earth Syst. Environ. 2024, 10, 2611–2659. [Google Scholar] [CrossRef] [Scilit]
- Wang, C.; Xue, Q.; He, Y.; Wang, J.; Li, Y.; Qu, J. Lithological identification based on high-frequency vibration signal analysis. Measurement 2023, 221, 113534. [Google Scholar] [CrossRef] [Scilit]
- Shan, Y.; Xue, Q.; Wang, J.; Li, Y.; Wang, C. Analysis of the influence of downhole drill string vibration on wellbore stability. Machines 2023, 11, 762. [Google Scholar] [CrossRef] [Scilit]
- Zhang, Q.; Liu, H.; Li, L.; Li, Y.; Liu, Z.; Sun, Z. A real-time prediction model for tunnel rock strength using geological drilling data and physics-informed neural networks. Tunn. Undergr. Space Technol. 2026, 170, 107272. [Google Scholar] [CrossRef] [Scilit]
- Yang, H.; Zheng, Y.; Xie, T.; Yan, Y.; Liang, H.; Zou, J. Research on the calibration method of vibration error of accelerometer gyroscope for guided drilling near drill bit. IEEE Trans. Instrum. Meas. 2025, 74, 6506117. [Google Scholar] [CrossRef] [Scilit]
- Yang, Y.; Geng, Y.; Wang, W. Multiple-sensor fault isolation based on spatial distances for accelerometer system in drilling tools. IEEE Trans. Instrum. Meas. 2023, 72, 3537014. [Google Scholar] [CrossRef] [Scilit]
- Liang, Y.; Li, A.-Z.; Chen, W.-H.; Li, C.-W.; Chen, S.-X.; Sun, Y. Design of a downhole high-power voltage-regulated power supply system for logging-while-drilling systems based on PWM. Appl. Geophys. 2023, 20, 1–8. [Google Scholar] [CrossRef] [Scilit]
- Chupin, E.; Frolov, K.; Korzhavin, M.; Zhdaneev, O. Energy storage systems for drilling rigs. J. Pet. Explor. Prod. Technol. 2022, 12, 341–350. [Google Scholar] [CrossRef] [Scilit]
- Fan, F.-R.; Tian, Z.-Q.; Wang, Z.L. Flexible triboelectric generator. Nano Energy 2012, 1, 328–334. [Google Scholar] [CrossRef] [Scilit]
- Walden, R.; Kumar, C.; Mulvihill, D.M.; Pillai, S.C. Opportunities and challenges in triboelectric nanogenerator (TENG) based sustainable energy generation technologies: A mini-review. Chem. Eng. J. Adv. 2022, 9, 100237. [Google Scholar] [CrossRef] [Scilit]
- Shan, C.; He, W.; Wu, H.; Fu, S.; Li, K.; Liu, A.; Du, Y.; Wang, J.; Mu, Q.; Liu, B. Dual mode TENG with self-voltage multiplying circuit for blue energy harvesting and water wave monitoring. Adv. Funct. Mater. 2023, 33, 2305768. [Google Scholar] [CrossRef] [Scilit]
- Wang, Y.; Du, H.; Yang, H.; Xi, Z.; Zhao, C.; Qian, Z.; Chuai, X.; Peng, X.; Yu, H.; Zhang, Y. A rolling-mode triboelectric nanogenerator with multi-tunnel grating electrodes and opposite-charge-enhancement for wave energy harvesting. Nat. Commun. 2024, 15, 6834. [Google Scholar] [CrossRef] [Scilit]
- Cao, L.N.; Su, E.; Xu, Z.; Wang, Z.L. Fully enclosed microbeads structured TENG arrays for omnidirectional wind energy harvesting with a portable galloping oscillator. Mater. Today 2023, 71, 9–21. [Google Scholar] [CrossRef] [Scilit]
- He, L.; Zhang, C.; Zhang, B.; Yang, O.; Yuan, W.; Zhou, L.; Zhao, Z.; Wu, Z.; Wang, J.; Wang, Z.L. A dual-mode triboelectric nanogenerator for wind energy harvesting and self-powered wind speed monitoring. ACS Nano 2022, 16, 6244–6254. [Google Scholar] [CrossRef] [Scilit]
- Zheng, Y.; Liu, T.; Wu, J.; Xu, T.; Wang, X.; Han, X.; Cui, H.; Xu, X.; Pan, C.; Li, X. Energy conversion analysis of multilayered triboelectric nanogenerators for synergistic rain and solar energy harvesting. Adv. Mater. 2022, 34, 2202238. [Google Scholar] [CrossRef] [Scilit]
- Rani, G.M.; Wu, C.-M.; Motora, K.G.; Umapathi, R.; Jose, C.R.M. Acoustic-electric conversion and triboelectric properties of nature-driven CF-CNT based triboelectric nanogenerator for mechanical and sound energy harvesting. Nano Energy 2023, 108, 108211. [Google Scholar] [CrossRef] [Scilit]
- Li, C.; Zhu, Y.; Sun, F.; Jia, C.; Zhao, T.; Mao, Y.; Yang, H. Research progress on triboelectric nanogenerator for sports applications. Energies 2022, 15, 5807. [Google Scholar] [CrossRef] [Scilit]
- Xu, B.; Peng, W.; He, J.; Zhang, Y.; Song, X.; Li, J.; Zhang, Z.; Luo, Y.; Meng, X.; Cai, C. Liquid metal-based triboelectric nanogenerators for energy harvesting and emerging applications. Nano Energy 2024, 120, 109107. [Google Scholar] [CrossRef] [Scilit]
- Hajara, P.; Shijeesh, M.; Rose, T.P.; Saji, K. ZnO-based triboelectric nanogenerator and tribotronic transistor for tactile switch and displacement sensor applications. Sens. Actuators A Phys. 2024, 377, 115728. [Google Scholar] [CrossRef] [Scilit]
- Wang, Z.L. From contact electrification to triboelectric nanogenerators. Rep. Prog. Phys. 2021, 84, 096502. [Google Scholar] [CrossRef] [Scilit]
- Chang, K.-B.; Parashar, P.; Shen, L.-C.; Chen, A.-R.; Huang, Y.-T.; Pal, A.; Lim, K.-C.; Wei, P.-H.; Kao, F.-C.; Hu, J.-J. A triboelectric nanogenerator-based tactile sensor array system for monitoring pressure distribution inside prosthetic limb. Nano Energy 2023, 111, 108397. [Google Scholar] [CrossRef] [Scilit]
- Wu, G.; Wu, L.; Zhang, H.; Wang, X.; Xiang, M.; Teng, Y.; Xu, Z.; Lv, F.; Huang, Z.; Lin, Y. Research progress of screen-printed flexible pressure sensor. Sens. Actuators A Phys. 2024, 374, 115512. [Google Scholar] [CrossRef] [Scilit]
- Wang, D.; Zhang, D.; Chen, X.; Zhang, H.; Tang, M.; Wang, J. Multifunctional respiration-driven triboelectric nanogenerator for self-powered detection of formaldehyde in exhaled gas and respiratory behavior. Nano Energy 2022, 102, 107711. [Google Scholar] [CrossRef] [Scilit]
- Pan, Y.C.; Dai, Z.; Ma, H.; Zheng, J.; Leng, J.; Xie, C.; Yuan, Y.; Yang, W.; Yalikun, Y.; Song, X. Self-powered and speed-adjustable sensor for abyssal ocean current measurements based on triboelectric nanogenerators. Nat. Commun. 2024, 15, 6133. [Google Scholar] [CrossRef] [Scilit]
- Ding, C.; Li, C.; Xiong, Z.; Li, Z.; Liang, Q. Intelligent identification of moving trajectory of autonomous vehicle based on friction nano-generator. IEEE Trans. Intell. Transp. Syst. 2023, 25, 3090–3097. [Google Scholar] [CrossRef] [Scilit]
- Fang, L.; Zheng, Q.; Hou, W.; Gu, J.; Zheng, L. A self-powered tilt angle sensor for tall buildings based on the coupling of multiple triboelectric nanogenerator units. Sens. Actuators A Phys. 2023, 349, 114015. [Google Scholar] [CrossRef] [Scilit]
- Xu, J.; Wang, Y.; Li, H.; Xia, B.; Cheng, T. A triangular electrode triboelectric nanogenerator for monitoring the speed and direction of downhole motors. Nano Energy 2023, 113, 108579. [Google Scholar] [CrossRef] [Scilit]
- Zhang, Y.; Chuan, W. Self-powered landslide displacement sensor based on triboelectric nanogenerator. IEEE Sens. J. 2023, 23, 18042–18049. [Google Scholar] [CrossRef] [Scilit]
- Chang, A.; Uy, C.; Xiao, X.; Chen, J. Self-powered environmental monitoring via a triboelectric nanogenerator. Nano Energy 2022, 98, 107282. [Google Scholar] [CrossRef] [Scilit]
- Zhang, Y.; Su, S.; Zhang, L.; Gao, Y.; Wu, C. Multifunctional downhole drilling motor speed sensor based on triboelectric nanogenerator. Micromachines 2024, 15, 1395. [Google Scholar] [CrossRef] [Scilit]
- Wrat, G.; Devsoth, L.; Pandey, A.K. Experimental analysis of non-uniform cantilever beam in fluid with variable depth. Mater. Today Proc. 2024, 108, 104–108. [Google Scholar] [CrossRef] [Scilit]
- Karpenko, M.; Ževžikov, P.; Stosiak, M.; Skačkauskas, P.; Borucka, A.; Delembovskyi, M. Vibration research on centrifugal loop dryer machines used in plastic recycling processes. Machines 2024, 12, 29. [Google Scholar] [CrossRef] [Scilit]
- Wang, W.; Guo, B.; Liu, G.; Zha, C.; Chen, T.; Li, J. Investigation of Axial–Torsional Vibration Characteristics and Vibration Mitigation Mechanism in Compound Percussive Drilling. Appl. Sci. 2026, 16, 536. [Google Scholar] [CrossRef] [Scilit]
- Li, J.; Fan, J.; Sun, J.; Wang, Z.; Lv, K.; Qu, Y.; Xu, G.; Ma, F.; Li, W.; Ma, W. A hyperbranched copolymer as high-temperature and salt-resistance fluid loss reducer for water-based drilling fluids: Preparation, evaluation, and mechanism study. SPE J. 2025, 30, 7347–7363. [Google Scholar] [CrossRef] [Scilit]
- Rudakov, D.; Inkin, O.; Wohnlich, S.; Schiffer, R. Numerical modelling of flow and heat transport in closed mines. Case study Walsum drainage province in the Ruhr coal-mining area. In Proceedings of the E3S Web of Conferences, Münster, Germany, 7 May 2024; p. 01002. [Google Scholar]
- Shi, Z.; Yao, K.; Tian, H.; Li, Q.; Yao, N.; Tian, D.; Yin, X.; Xu, C. Present situation and prospect of directional drilling technology and equipmentwhile drilling measurement in underground coal mine. Coal Sci. Technol. 2019, 47, 22–28. [Google Scholar]
- Guo, R.; Hu, Q.; Luo, H.; Zhou, X.; Zhang, D.; Guan, D.; Zhang, W.; Zi, Y. Carbon Quantum Dot Functionalized Nanofiber-Based Triboelectric Nanogenerator with Boosted Output and Fluorescence Function. Interdiscip. Mater. 2025, 4, 359–372. [Google Scholar] [CrossRef] [Scilit]

Disclaimer/Publisher’s Note: The statements, opinions and data contained in all publications are solely those of the individual author(s) and contributor(s) and not of MDPI and/or the editor(s). MDPI and/or the editor(s) disclaim responsibility for any injury to people or property resulting from any ideas, methods, instructions or products referred to in the content. |
© 2026 by the authors. Licensee MDPI, Basel, Switzerland. This article is an open access article distributed under the terms and conditions of the Creative Commons Attribution (CC BY) license.