


Featured Application
A PFC2D model is developed to simulate the shallow rupture of the Milun Fault during the 2024 Hualien earthquake. Interlayer bonding strength controls rupture continuity and surface uplift, with the 350 kPa model best matching the observed vertical displacement. Shear stress and the second deviatoric stress invariant indicate that rupture propagates upward but becomes scattered in shallow layers due to energy dissipation.
Abstract
Understanding the shallow rupture mechanisms on coseismic faults and assessing the influence of fault area propagation is essential for disaster prevention. Since 2000, Hualien and nearby areas in eastern Taiwan have experienced frequent earthquakes, making it a good area to study the evolution of fault rupture. This study proposes a two-dimensional dynamic discrete element model to simulate the shallow rupture behavior of the Milun Fault. Results indicate that the rupture process proceeds through multiple evolutionary stages, with fractures propagating upward from depth but failing to fully break through to the surface, resulting instead in surface cracking without complete rupture. The second deviatoric stress invariant serves as an effective indicator of stress accumulation and release during rupture progression. For the preferred model, the modeled vertical uplift near the fault reached 0.6 m, consistent with field observations reporting a maximum coseismic uplift of approximately 0.585 m along the Milun Fault. Given the scarcity of near-fault observational constraints, the simulation represents a physically plausible scenario rather than a unique reconstruction. The integration of stress evolution, crack propagation, and near-field displacement provides new insight into the mechanical processes governing shallow thrust fault rupture and can be applied to similar fault systems exhibiting near-surface deformation.
1. Introduction
Surface rupture caused by a strong earthquake poses a significant hazard to public safety and infrastructure. Understanding the coseismic fault rupture mechanisms and assessing the influence of fault area propagation are essential for disaster prevention and resilience [1,2,3,4,5]. Eastern Taiwan, particularly in the Hualien region, has experienced 38 earthquakes since 2000, which serve as an ideal natural laboratory to study fault rupture processes [6].
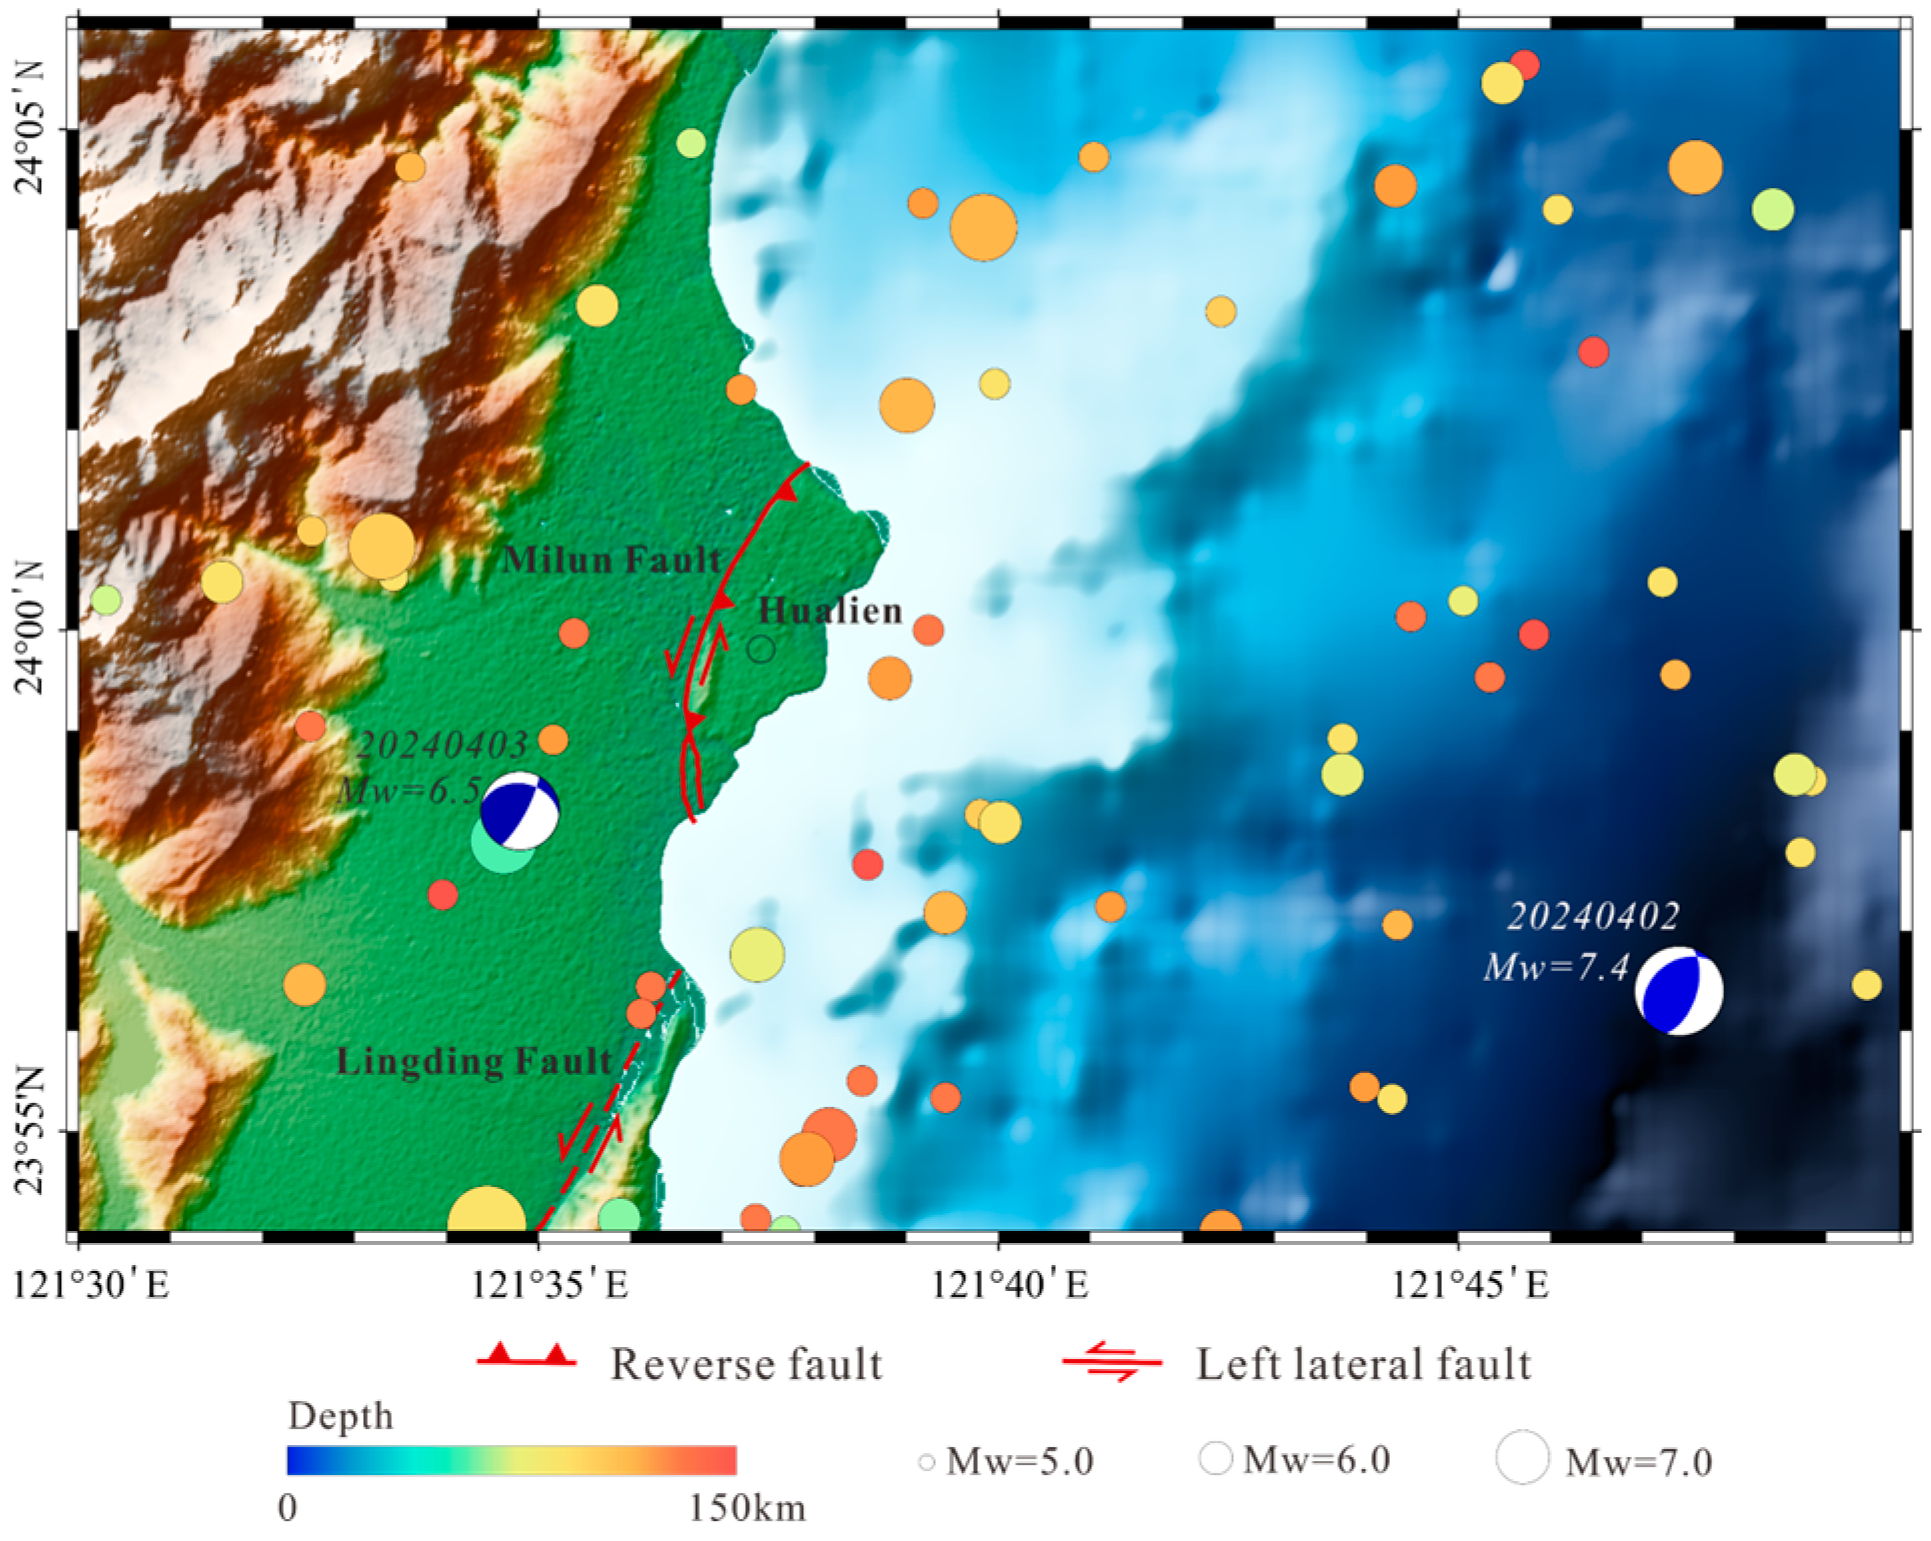
Among the active faults in this region, the Milun Fault plays a vital role in regional seismicity. The Milun Fault is a left-lateral fault with a minor thrust component (Figure 1). The fault is oriented north–south with a dip of approximately 69° [7,8,9]. The Milun Fault has repeatedly generated surface-rupturing events, such as the 1951 and 2018 events, both of which caused substantial damage to local communities [10,11]. Previous modeling studies on the Milun Fault have focused on constraining kinematic slip distributions via geodetic inversions [9,12] or simulating dynamic source processes to explain strong ground motions [13]. While these continuum-based approaches have effectively resolved the macroscopic fault geometry and deep slip behavior, the micromechanical mechanisms controlling rupture propagation within the shallow, weakly cemented overburden remain underexplored. Although the 2024 Hualien earthquake generated no significant surface rupture along the Milun Fault [14,15], it provides a rare opportunity to examine the absence of clear surface rupture despite strong regional shaking and to place constraints on the mechanical conditions controlling rupture propagation and near-surface deformation. Such studies are crucial for enhancing the assessment of future seismic hazard potential and improving disaster preparedness in seismically active areas.
With the advancement of seismology and geodynamic modeling techniques, integrating post-earthquake field investigations with numerical simulations has become a powerful approach for understanding the complexity of shallow fault rupture and deformation. Structural and geological observations suggest that fault rupture propagation models based on numerical methods can explain the geometry of fault-related folding and surface deformation [16,17,18,19,20]. Previous studies have demonstrated that parameters such as fault dip angle, sedimentary cover thickness, cumulative slip, and mechanical strength of the overburden significantly influence rupture propagation patterns and surface deformation characteristics [21,22,23,24,25]. Discrete element method (DEM) is particularly suitable for simulating the Milun Fault’s shallow surface because they can explicitly represent granular materials and heterogeneous cementation in weakly lithified sediments, allowing both localized rupture and distributed near-surface deformation to emerge naturally from particle interactions. To capture the quasi-brittle behavior of shallow cemented materials, we implemented the linear parallel bond model (PB model). This model effectively represents inter-particle cementation and its progressive breakage, which is critical for evaluating how bond strength variations control surface rupture propagation during coseismic slip.
This study developed a dynamic discrete element model to simulate fault rupture evolution. We then applied the model to the rupture behavior of the 2024 Hualien earthquake. We constructed a series of numerical models with varying bond strengths to investigate how different mechanical properties influence shallow rupture behavior. The simulation results reveal a possible shallow rupture evolution pattern associated with this earthquake, offering new insights into the mechanisms controlling near-surface fault rupture and surface uplift. These findings contribute to a better understanding of shallow faulting processes and have implications for seismic hazard assessment in eastern Taiwan.
Figure 1.
Seismotectonic framework of the study area. The background earthquake data (1950–2025, ) were obtained from the USGS earthquake catalog [26] and the Global CMT catalog [27,28]. The size of the circle indicates the magnitude, while the color indicates the focal depth. Beachball diagrams show focal mechanism solutions of the major earthquakes in the 2024 Hualien earthquake sequence.
2. Methodology
We investigated the mechanics of the rupture of the Milun Fault induced by the 2024 Hualien earthquake based on the discrete element method. The numerical modeling tool used in our experiments is a 2D particle flow code (PFC2D), which typically employs spherical particles to simulate rock mechanical properties.
2.1. DEM Model
DEM is a numerical approach based on the interaction of discrete particles using the laws of contact physics [29]. DEM applies Newton’s second law to each particle and the force–displacement law to the contact points. The PFC5.0 software provides a DEM model wrapped in a graphical user interface. The PFC model comprises bodies and mechanical contacts, which are used to simulate the mechanical properties of granular materials through the motion and interaction of spherical particles. Previous granular element studies demonstrate that discontinuous numerical methods can effectively address practical problems involving complex deformation patterns [30,31].
In most simulation scenarios, the connections between particles are represented by constant normal and shear springs, as well as dampers. Due to the granular weak cementation and brittle failure characteristics of the shallow sedimentary layers of the Milun Fault, our study used the linear parallel bond model to establish the experiment. By introducing finite-sized bonds capable of transmitting moments, the PB model effectively captures the rotational resistance and stiffness of cemented materials. This kind of mechanism naturally characterizes the progressive failure process from a continuous cemented state to a discontinuous ruptured state, making it highly suitable for studying shallow rupture propagation in our research. The constitutive relation and mechanical description of the PB model are as follows.
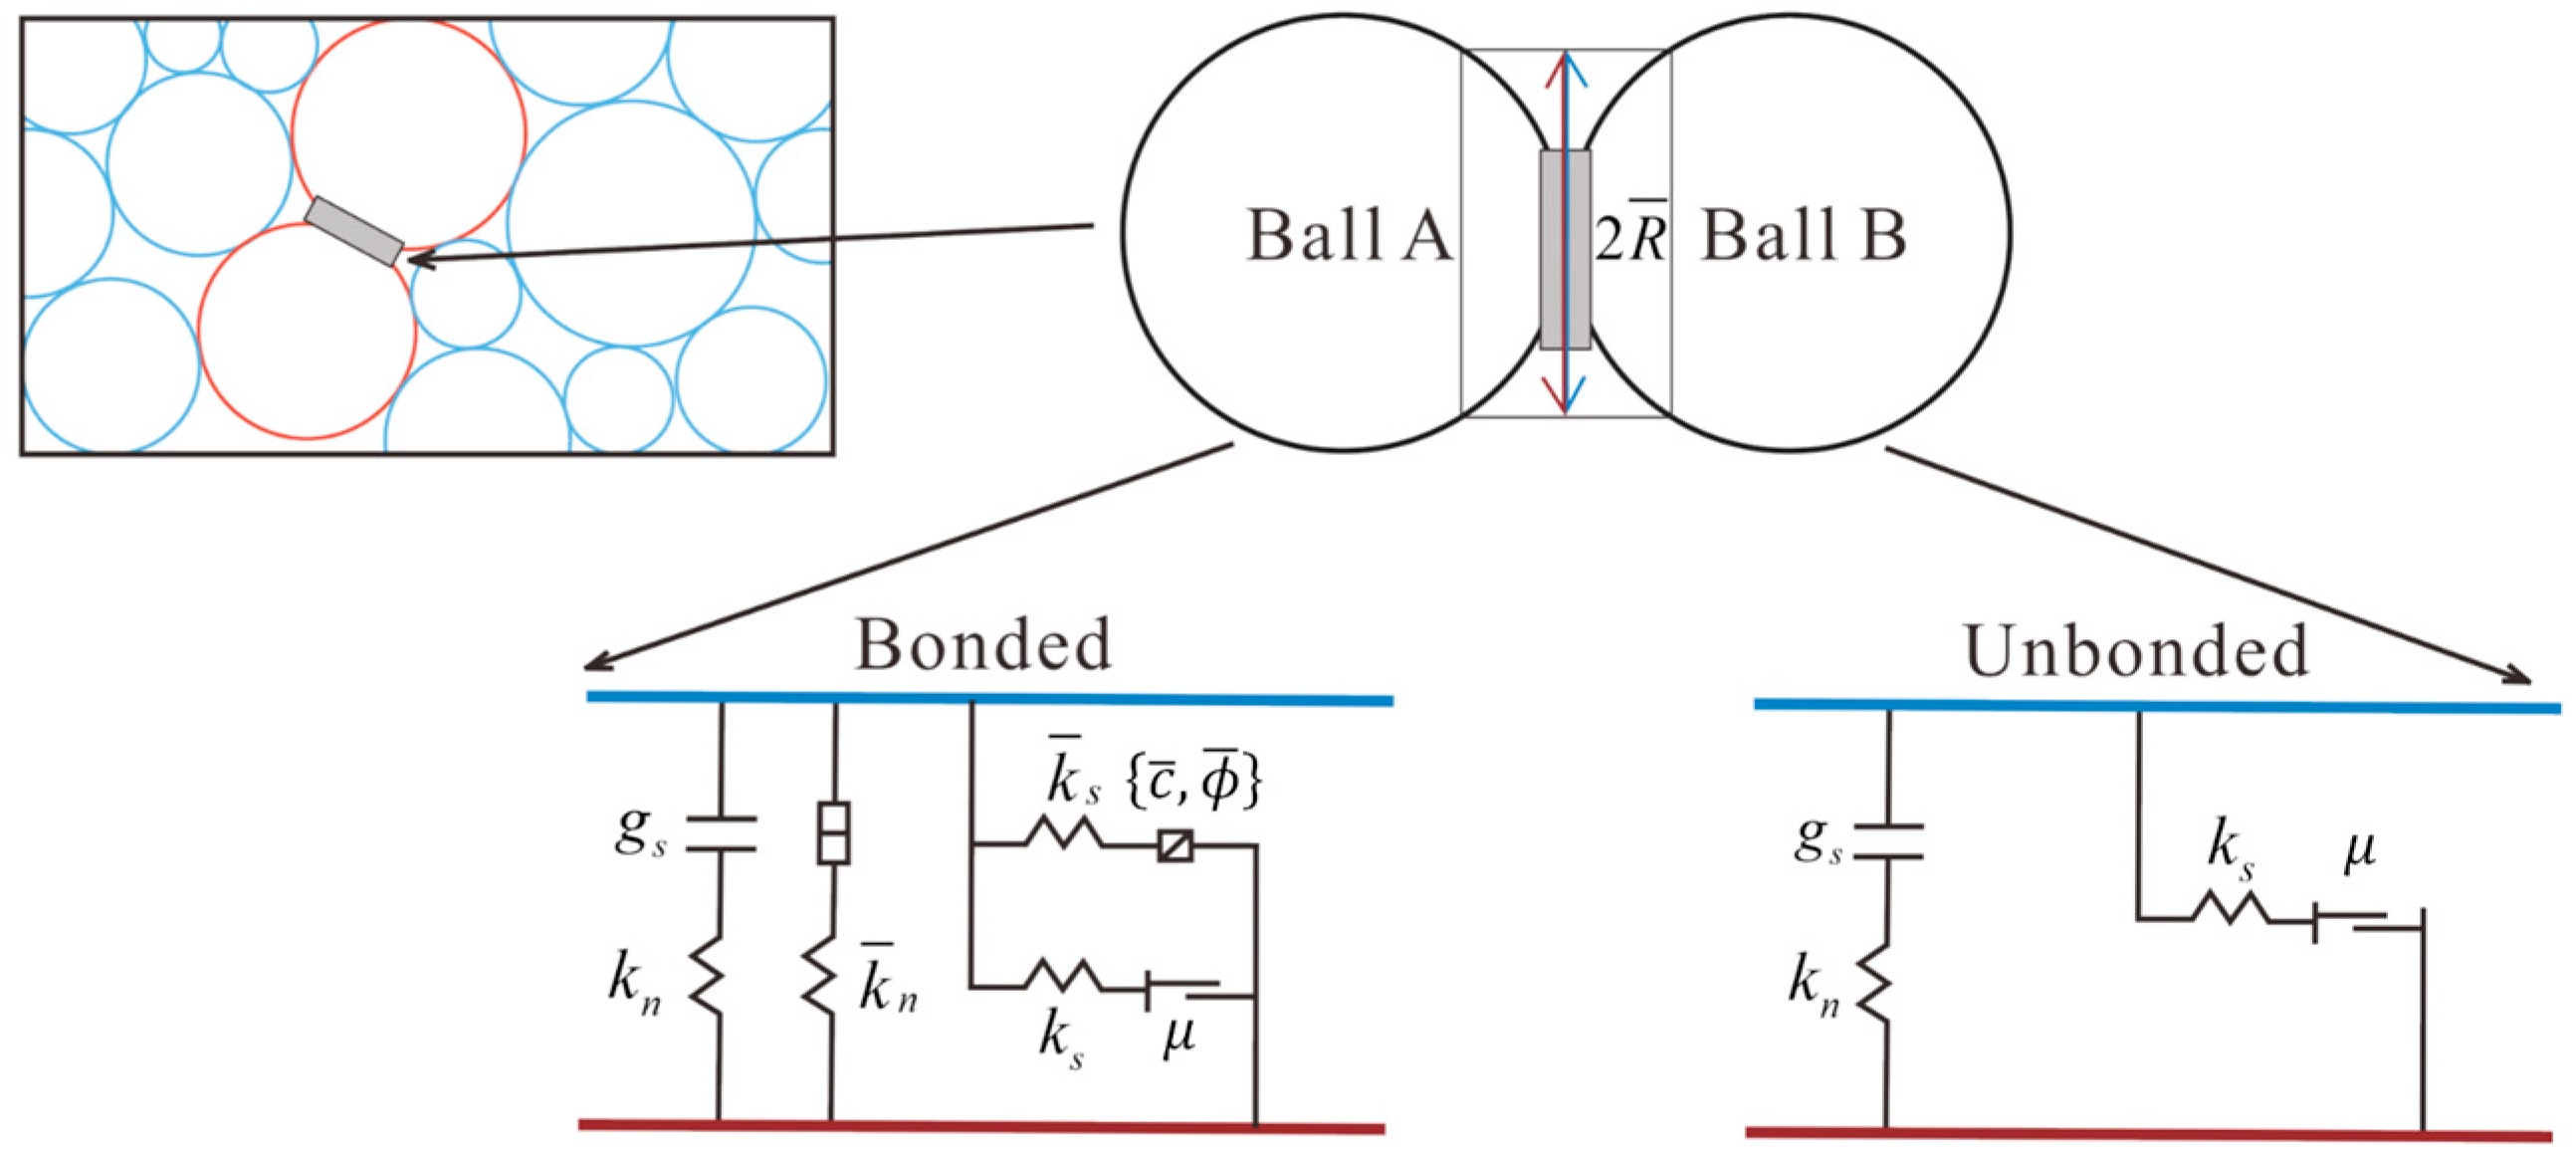
The parallel bond component acts in parallel with the linear component, establishing an elastic interaction between the particles. As shown in Figure 2, the PB model introduces two types of mechanical interactions: The first component is equivalent to the linear elastic model (no-tension), which cannot resist relative rotation and regulates slip by applying Coulomb limits to shear forces. The other interface is referred to as a parallel bond, which carries forces and moments that are uniformly distributed across a constant plane (acting as a rectangle in 2D, gray region in Figure 2) at the center of the contact point. Upon formation, it resists rotational deformation through linear elastic behavior until the strength limit is exceeded, at which point bond breakage occurs. After debonding, the parallel bond no longer carries any load, and the contact reverts to a linear contact model.
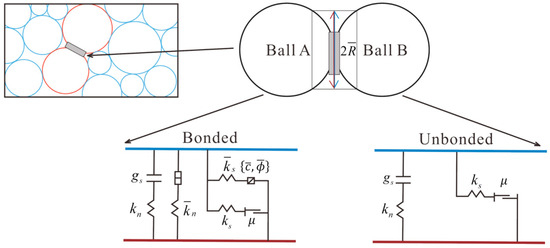
Figure 2.
Behavior and rheological components of the linear parallel bond model (modified by [32]). is surface gap; is normal stiffness; is shear stiffness; and are the normal stiffness and shear stiffness of the bond, respectively; is the friction coefficient; and and represent bond cohesion and bond friction angle, respectively.
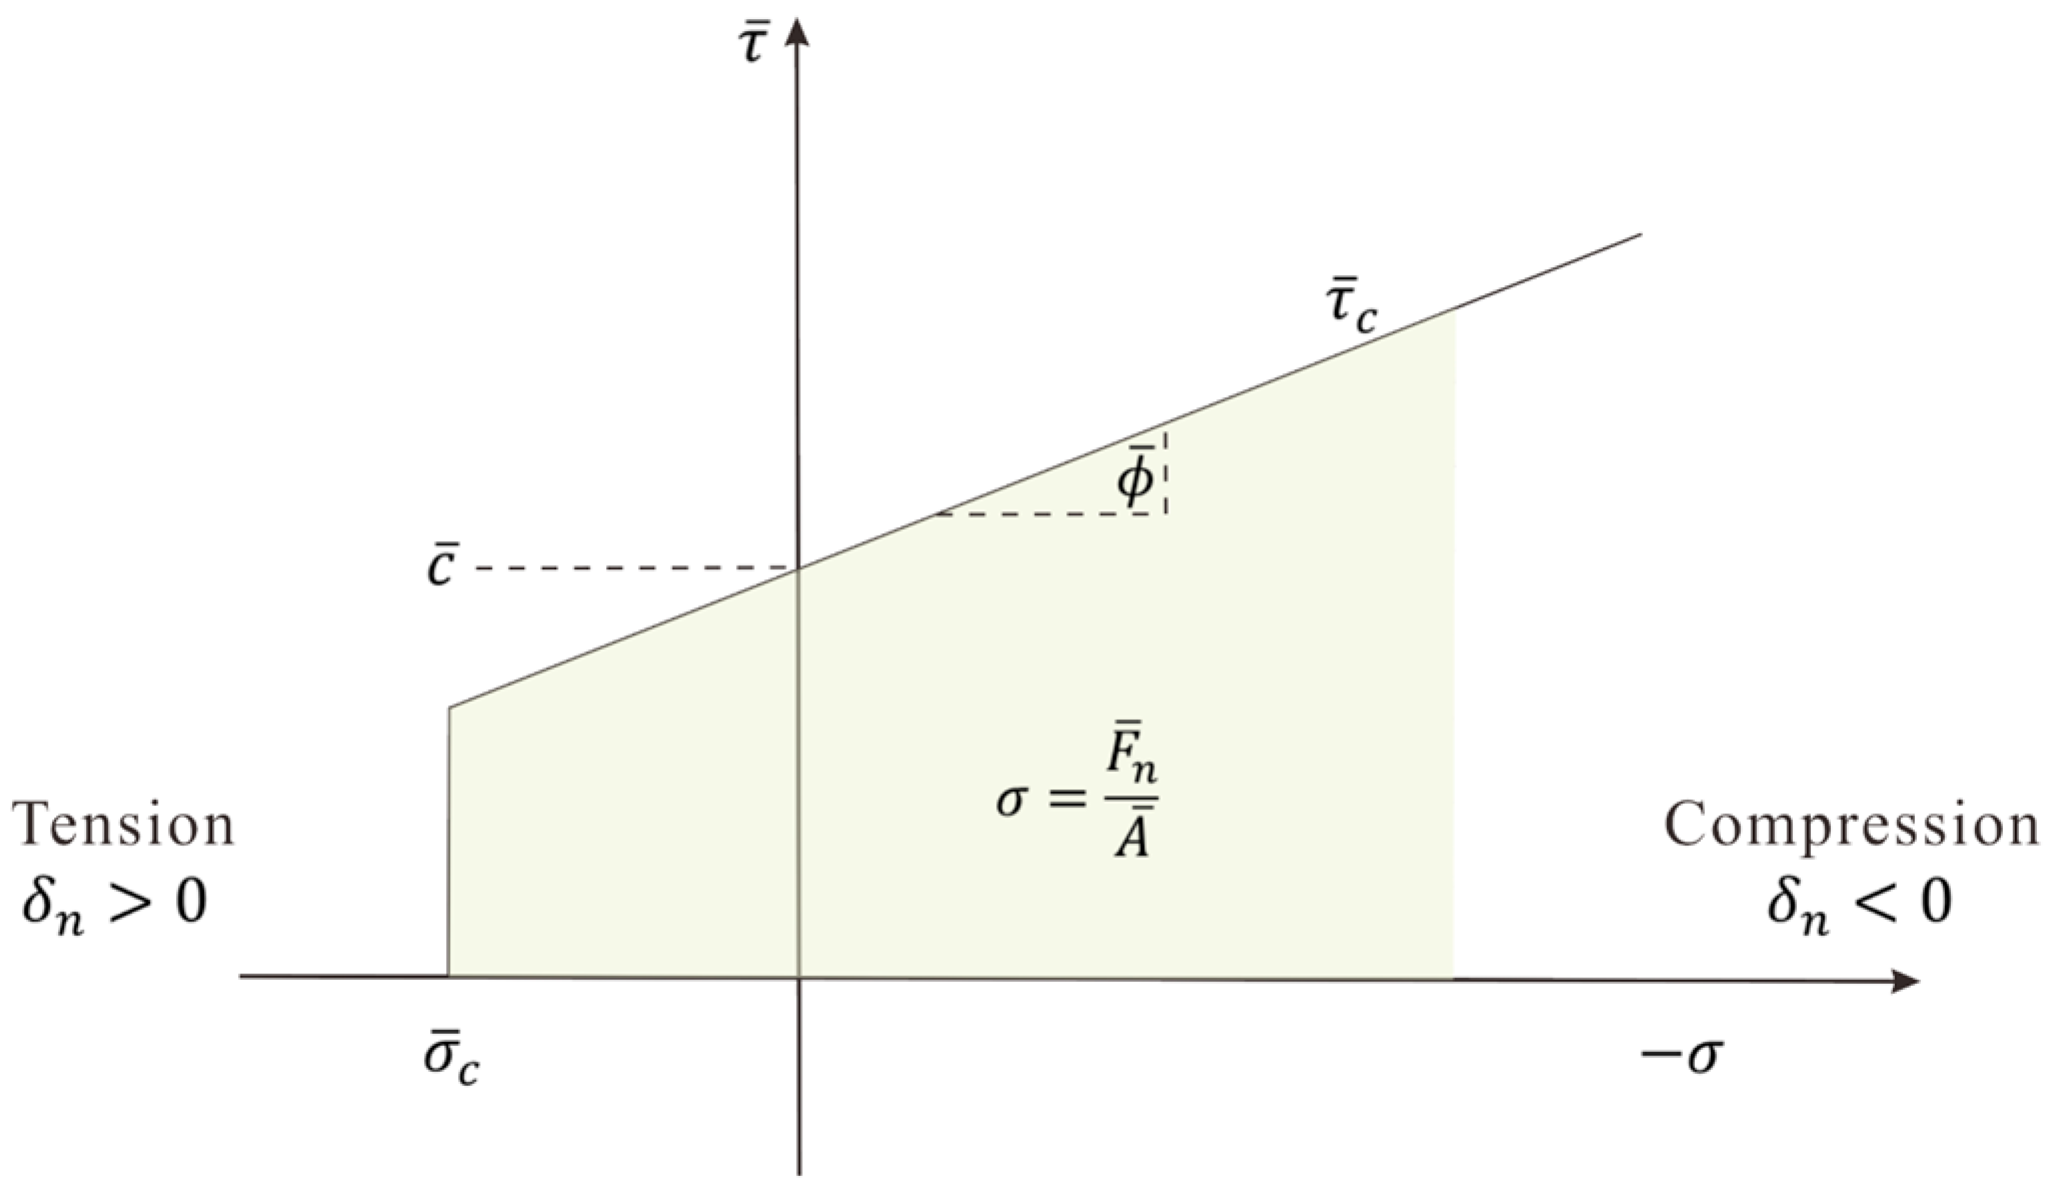
Failure envelope for the parallel bond: σ denotes normal stress, denotes tensile bond strength; denotes the normal parallel bonding force; denotes the cross-sectional area; and represent shear stress and shear bond strength, respectively; and is the normal displacement between the centers of two particles.
where and are the normal and shear contact forces, and and are the bending and twisting moments. , , , and are the relative translational and rotational displacements. The stiffness parameters , , , and depend on the material properties and the bond radius R.
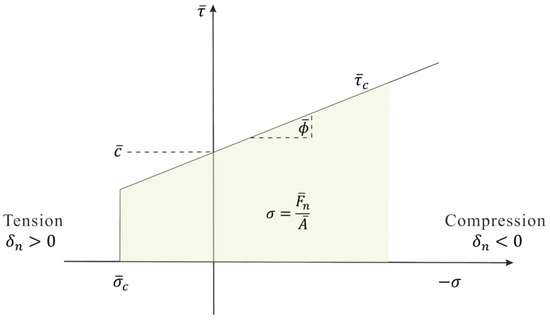
The enforcement of strength limits follows a two-stage process (Figure 3). If the tensile normal stress exceeds the tensile bond strength , then the bond is broken in tension: , bonded failure in tension.
Figure 3.
Failure envelope for the parallel bond. denotes normal stress; denotes tensile bond strength; denotes the normal parallel bonding force; denotes the cross-sectional area; and represent shear stress and shear bond strength, respectively; is the normal displacement between the centers of two particles; and denotes the bond cohesion.
If the bond has not failed in tension, the bond is checked for shear failure using a Mohr–Coulomb-like criterion. The shear strength is defined as follows:
where is the shear stress; if this criterion exceeds , the bond fails in shear.
Exceeding either strength threshold results in instantaneous and irreversible bond breakage, after which the contact behaves as an unbonded linear contact. The associated bond-break callback is activated, enabling continuous tracking of individual crack-break events throughout the simulation.
2.2. Model Description
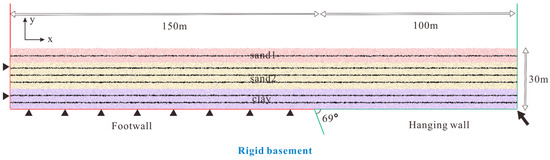
This study modeled the deformation of the soft soil cover above the rigid basement based on borehole data from the Milun Fault. The model used in this study represented a sedimentary cover with a length of 250 m and a height of 30 m (Figure 4). The fault dip angle was 69°, with the footwall fixed, while the hanging wall was driven upward along the basal fault plane. We set the displacement increment per time step to 0.0001 m. The minimum and maximum particle radius in the model were 10 cm and 12.5 cm [15,25,33,34], and the density of the particles was . The size of the particle range represents the numerical discretization scale in the model rather than the true grain size of the sediments, and it was chosen to balance computational efficiency and model resolution. The soft soil cap layer consisted of 59,170 particles whose radii followed a Gaussian distribution and was generated by a standard sample procedure. A Gaussian distribution was used to introduce variation in particle sizes. This ensures a random packing structure and prevents the artificial regular patterns that typically occur when using uniform-sized particles. To simplify the model, the sedimentary cover was assumed to be mechanically homogeneous. Based on the geological data [35,36], the sedimentary cover was divided into three layers, each assigned a different color to investigate various bond strengths that affect fault–propagation folding. Table 1 and Figure 4 show the parameters used in the model.
Figure 4.
Geometry and boundary conditions of the model. Black triangles denote fixed boundary conditions applied to the model. Black layers (composed of black balls) represent the marker layer and do not alter particle properties. The black arrow indicates the displacement applied to the hanging wall.
Table 1.
Micro-properties and macro-properties of the parallel bond model.
We first calibrated the mechanical properties of shallow lithological units along the Milun Fault through the numerical biaxial compression tests. The primary objective was to obtain micro-parameters, including cohesion, internal friction angle, and bond stiffnesses, which can be used in numerical modeling. The calculation process follows the Mohr–Coulomb failure criterion (Equation (5)). Table 1 summarizes the calibration results.
We did not conduct any additional direct shear tests to evaluate the interlayer contacts. Instead, we assigned interface tensile strengths within empirically reasonable ranges (200, 250, 300, 350, and 450 kPa), based on previous experimental and numerical studies of shallow fault rupture and fault mud materials in shear zones [25,37,38,39].
3. Results and Discussion
3.1. Fault Rupture and Deformation Characteristics
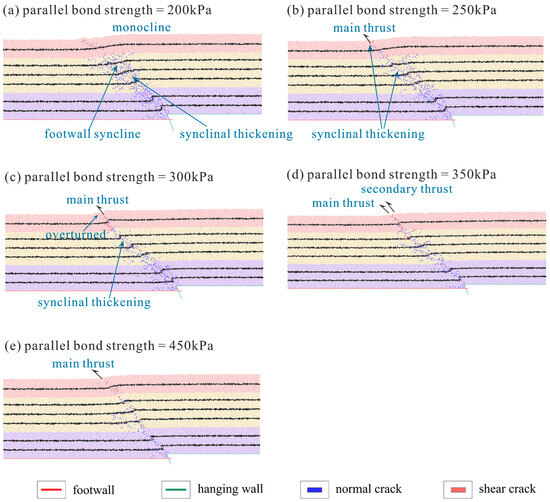
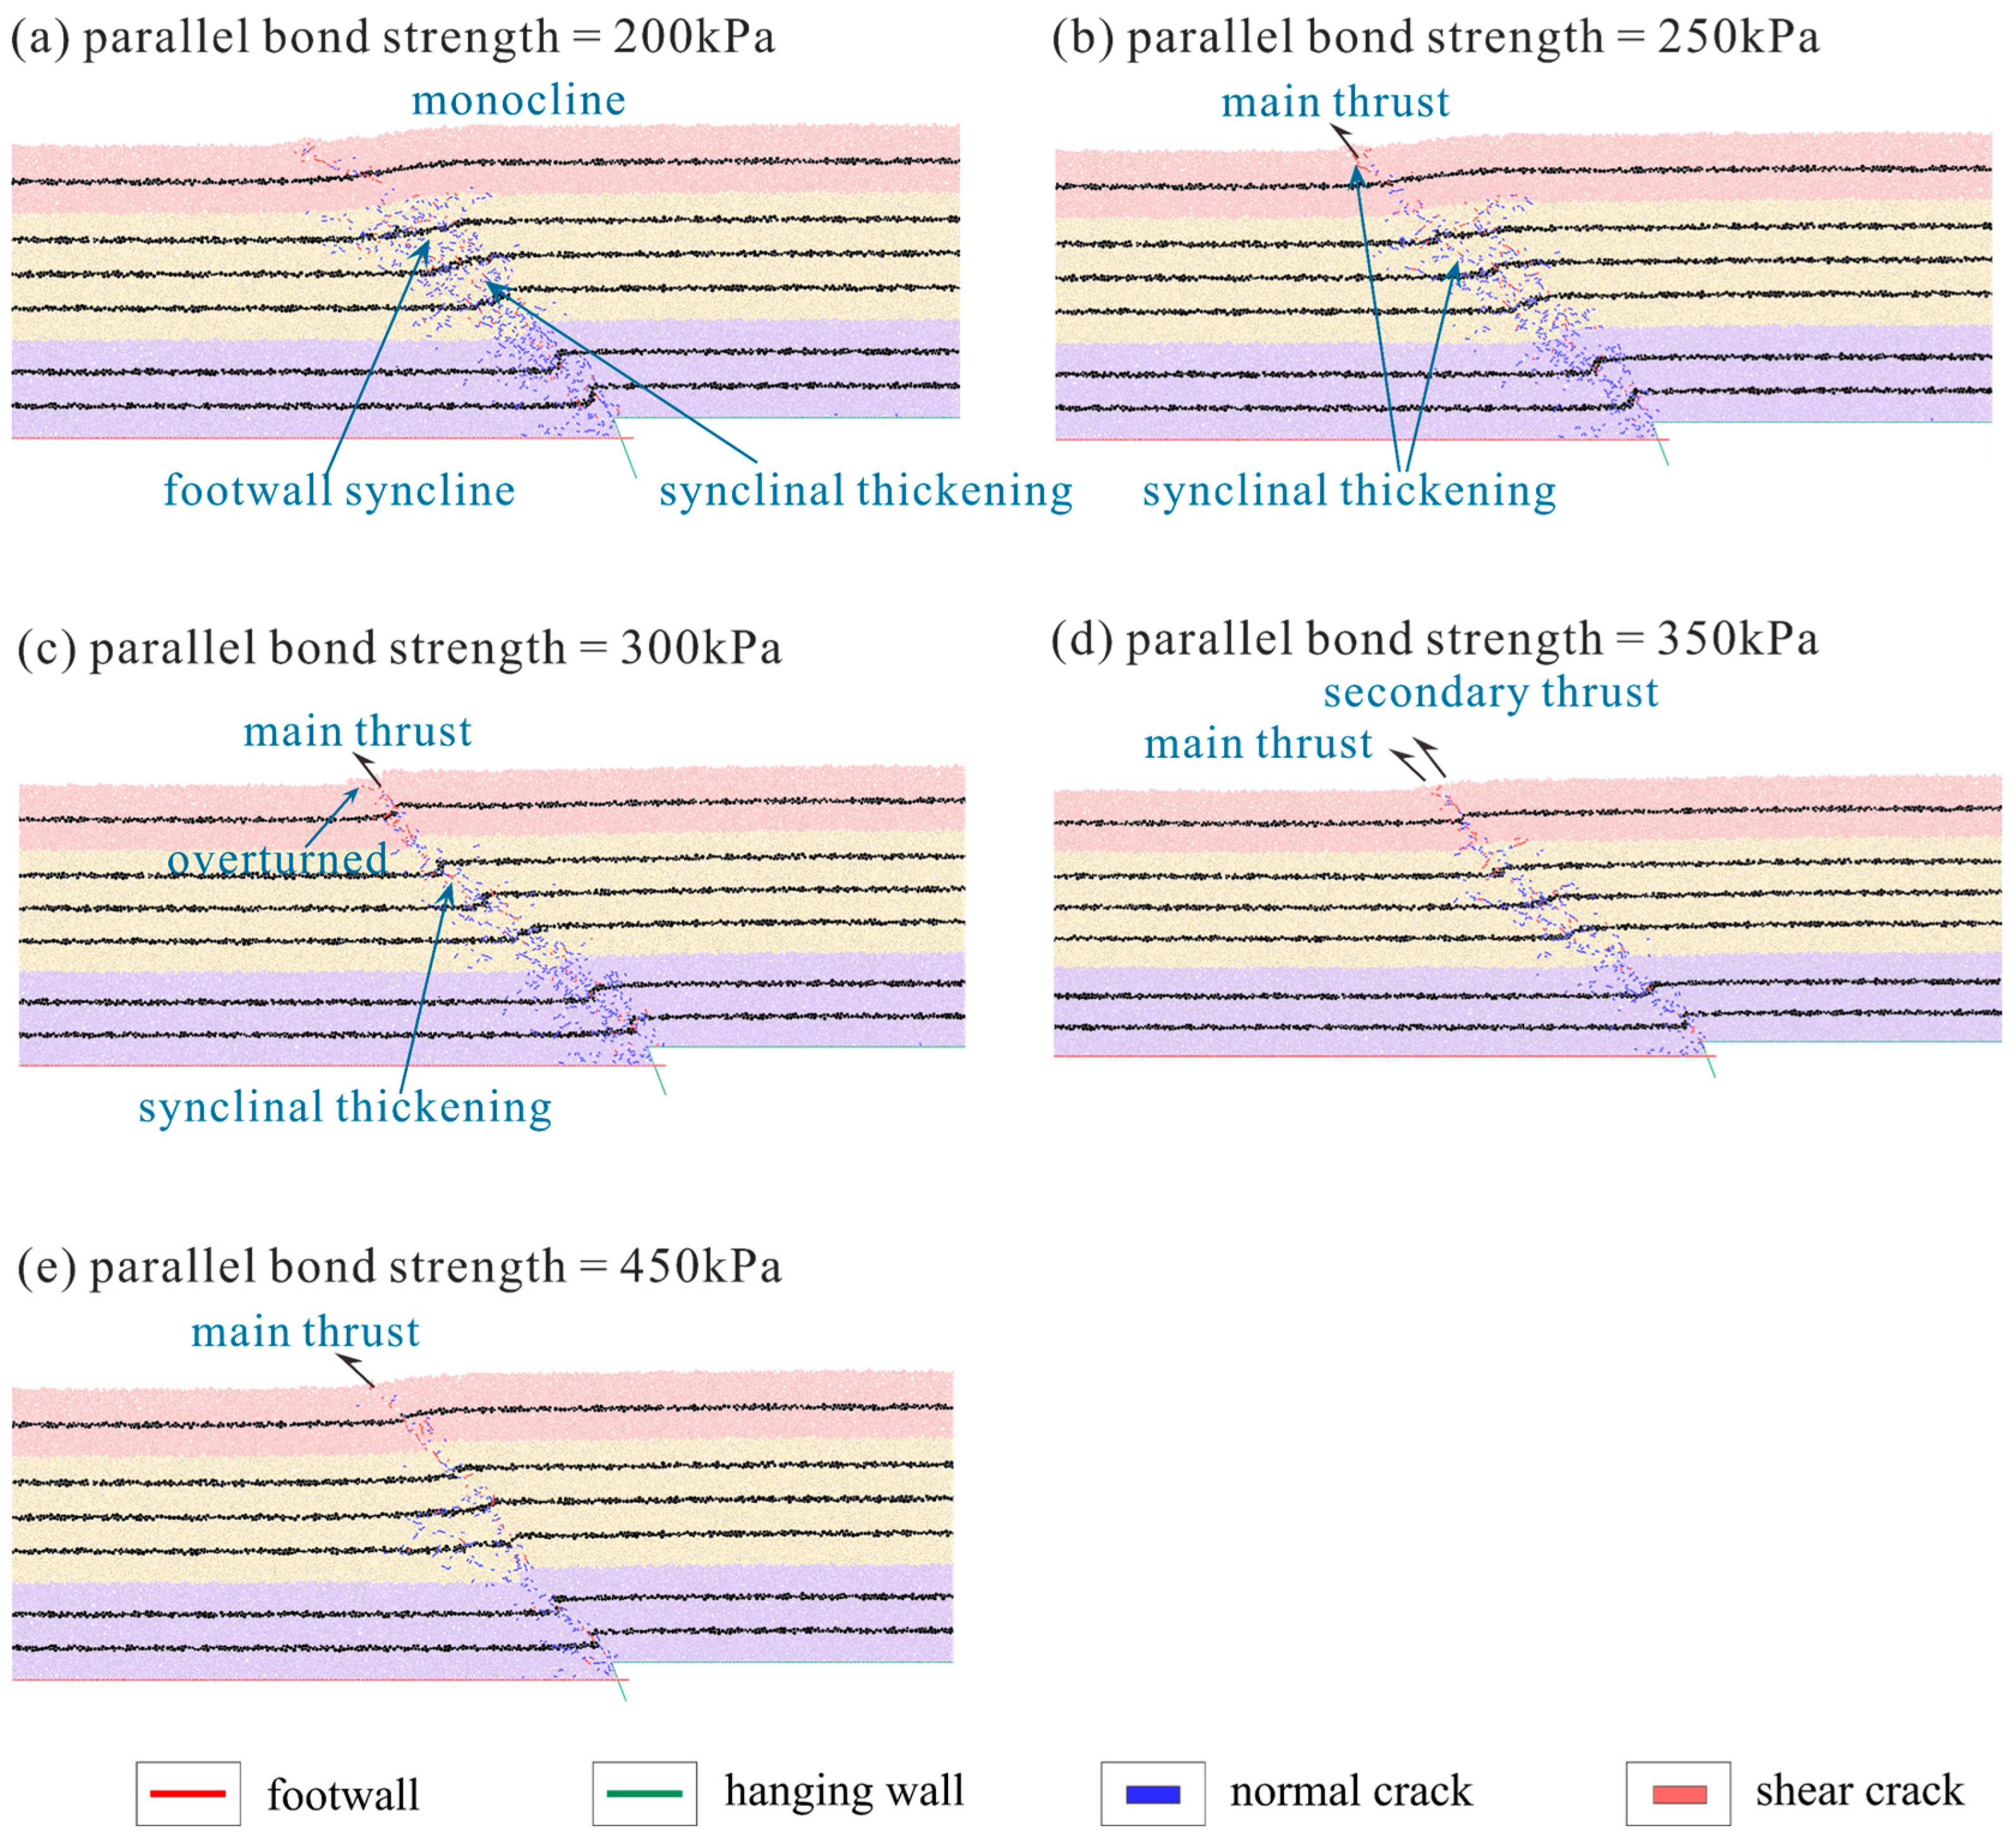
To investigate the evolution of fault development and rupture propagation under varying interlayer bonding strength, we constructed five numerical models for comparative analysis, with parallel bond strengths assigned as 200, 250, 300, 350, and 450 kPa (Figure 5). The simulation results show that variations in the bonding strength significantly affect the rupture behavior, fracture distribution patterns, and the folding deformation around the fault. As the interlayer strength increases, the rupture zone becomes narrower, the fracture distribution becomes progressively more localized toward the main rupture plane, and the rupture trace develops a clearer and increasingly steep inclination.
Figure 5.
Parallel bond model with different interlayer bond strengths (200, 250, 300, 350, and 450 kPa). The blue bar indicates the normal crack, and the red bar indicates the shear crack.
In terms of fault development, all five models exhibited a primary fault that followed the prescribed fault plane and cut through multiple layers. As the model bonding strength increased, the penetration capacity of the main fault progressively enhanced. In the weakly bonded models (200–250 kPa), although deformation was significant, it failed to form distinct fault morphology, primarily manifesting as folding deformation and interlayer compression. As interlayer strength increased, the fault geometry became progressively clearer, and fractures increasingly localized onto a single rupture surface, producing a narrower and more steeply inclined rupture band. Secondary thrust was also observed in the intermediate bond strength model (300–350 kPa), indicating that higher bonding strength locally impedes upward propagation of the main fault and causes stress and strain to redistribute and initiate new rupture pathways in the hanging wall. In the strongly bonded model (450 kPa), while rupture remained concentrated, the secondary fracture plane became more pronounced and shallow rupture weakened, indicating that excessively high interlayer strength may have hindered the continued upward propagation of the fault.
Regarding rupture propagation characteristics, all models showed upward-directed rupture growth from the fault tip, with distinct differences observed across models of varying strength. In the weakly bonded models, rupture initiated in a dispersed manner within the hanging wall, producing short and discontinuous fractures without forming a coherent rupture zone. With higher bonding strength, fractures concentrated along the main fault and developed into a clearer and more continuous rupture path. In the 300 kPa model, an overturned structure was observed, which may indicate that the rupture path shifted as it traversed layers with contrasting mechanical properties. However, further increases in strength inhibit sustained propagation, preventing penetration to the near surface, and more pronounced secondary rupture planes were observed.
In terms of stratigraphic deformation, synclinal folding of the footwall was observed across all models, particularly pronounced in the weakly bonded model. This indicates that the overall geometric framework of thrust-related deformation was broadly consistent across models. However, the style and spatial extent of syncline development varied markedly with bonding strength. In the weakly bonded models, synclinal thickening occurred at multiple locations, and folding was broadly distributed rather than concentrated, indicating a diffuse deformation pattern. In the intermediate bonded models, deformation became more focused around the main rupture zone, and the folds developed clearer orientations, while deformation outside the rupture zone remained limited. In the strongly bonded model, synclinal structures were much less pronounced, and shallow structural involvement decreased, suggesting that high interlayer strength restricted overall shallow deformation.
Overall, the interlayer bonding strength has a strong influence on the rupture style, propagation pattern, and shallow deformation near the fault. As bonding strength increases, the rupture pattern shifts from a dispersed form to a more localized and coherent pathway. The fault geometry also becomes clearer, and folding gradually concentrates around the main rupture zone. With further strengthening, the deformation transitions from broad fold-related compaction to more discrete faulting. However, bonding strength cannot increase indefinitely. Beyond a certain threshold, shallow fracture propagation becomes constrained, and overall deformation weakens. These observations highlight the key role of interlayer bonding strength over fracture energy release pathways and stratigraphic rupture processes. Nevertheless, fracture patterns and stratigraphic deformation alone are insufficient to determine which model best matches the 2024 earthquake event, and additional constraints from near-surface displacement are required.
3.2. Displacement Characteristics
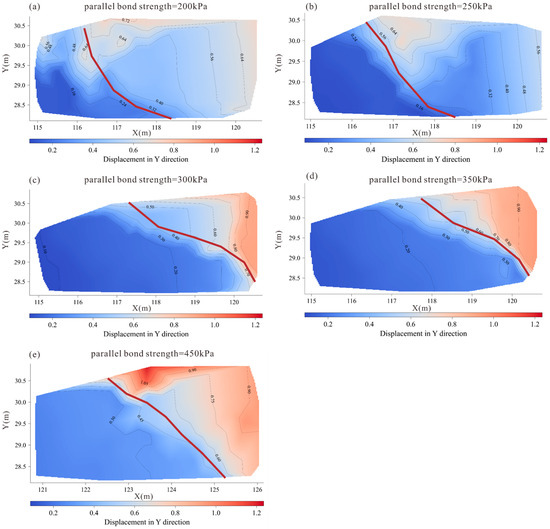
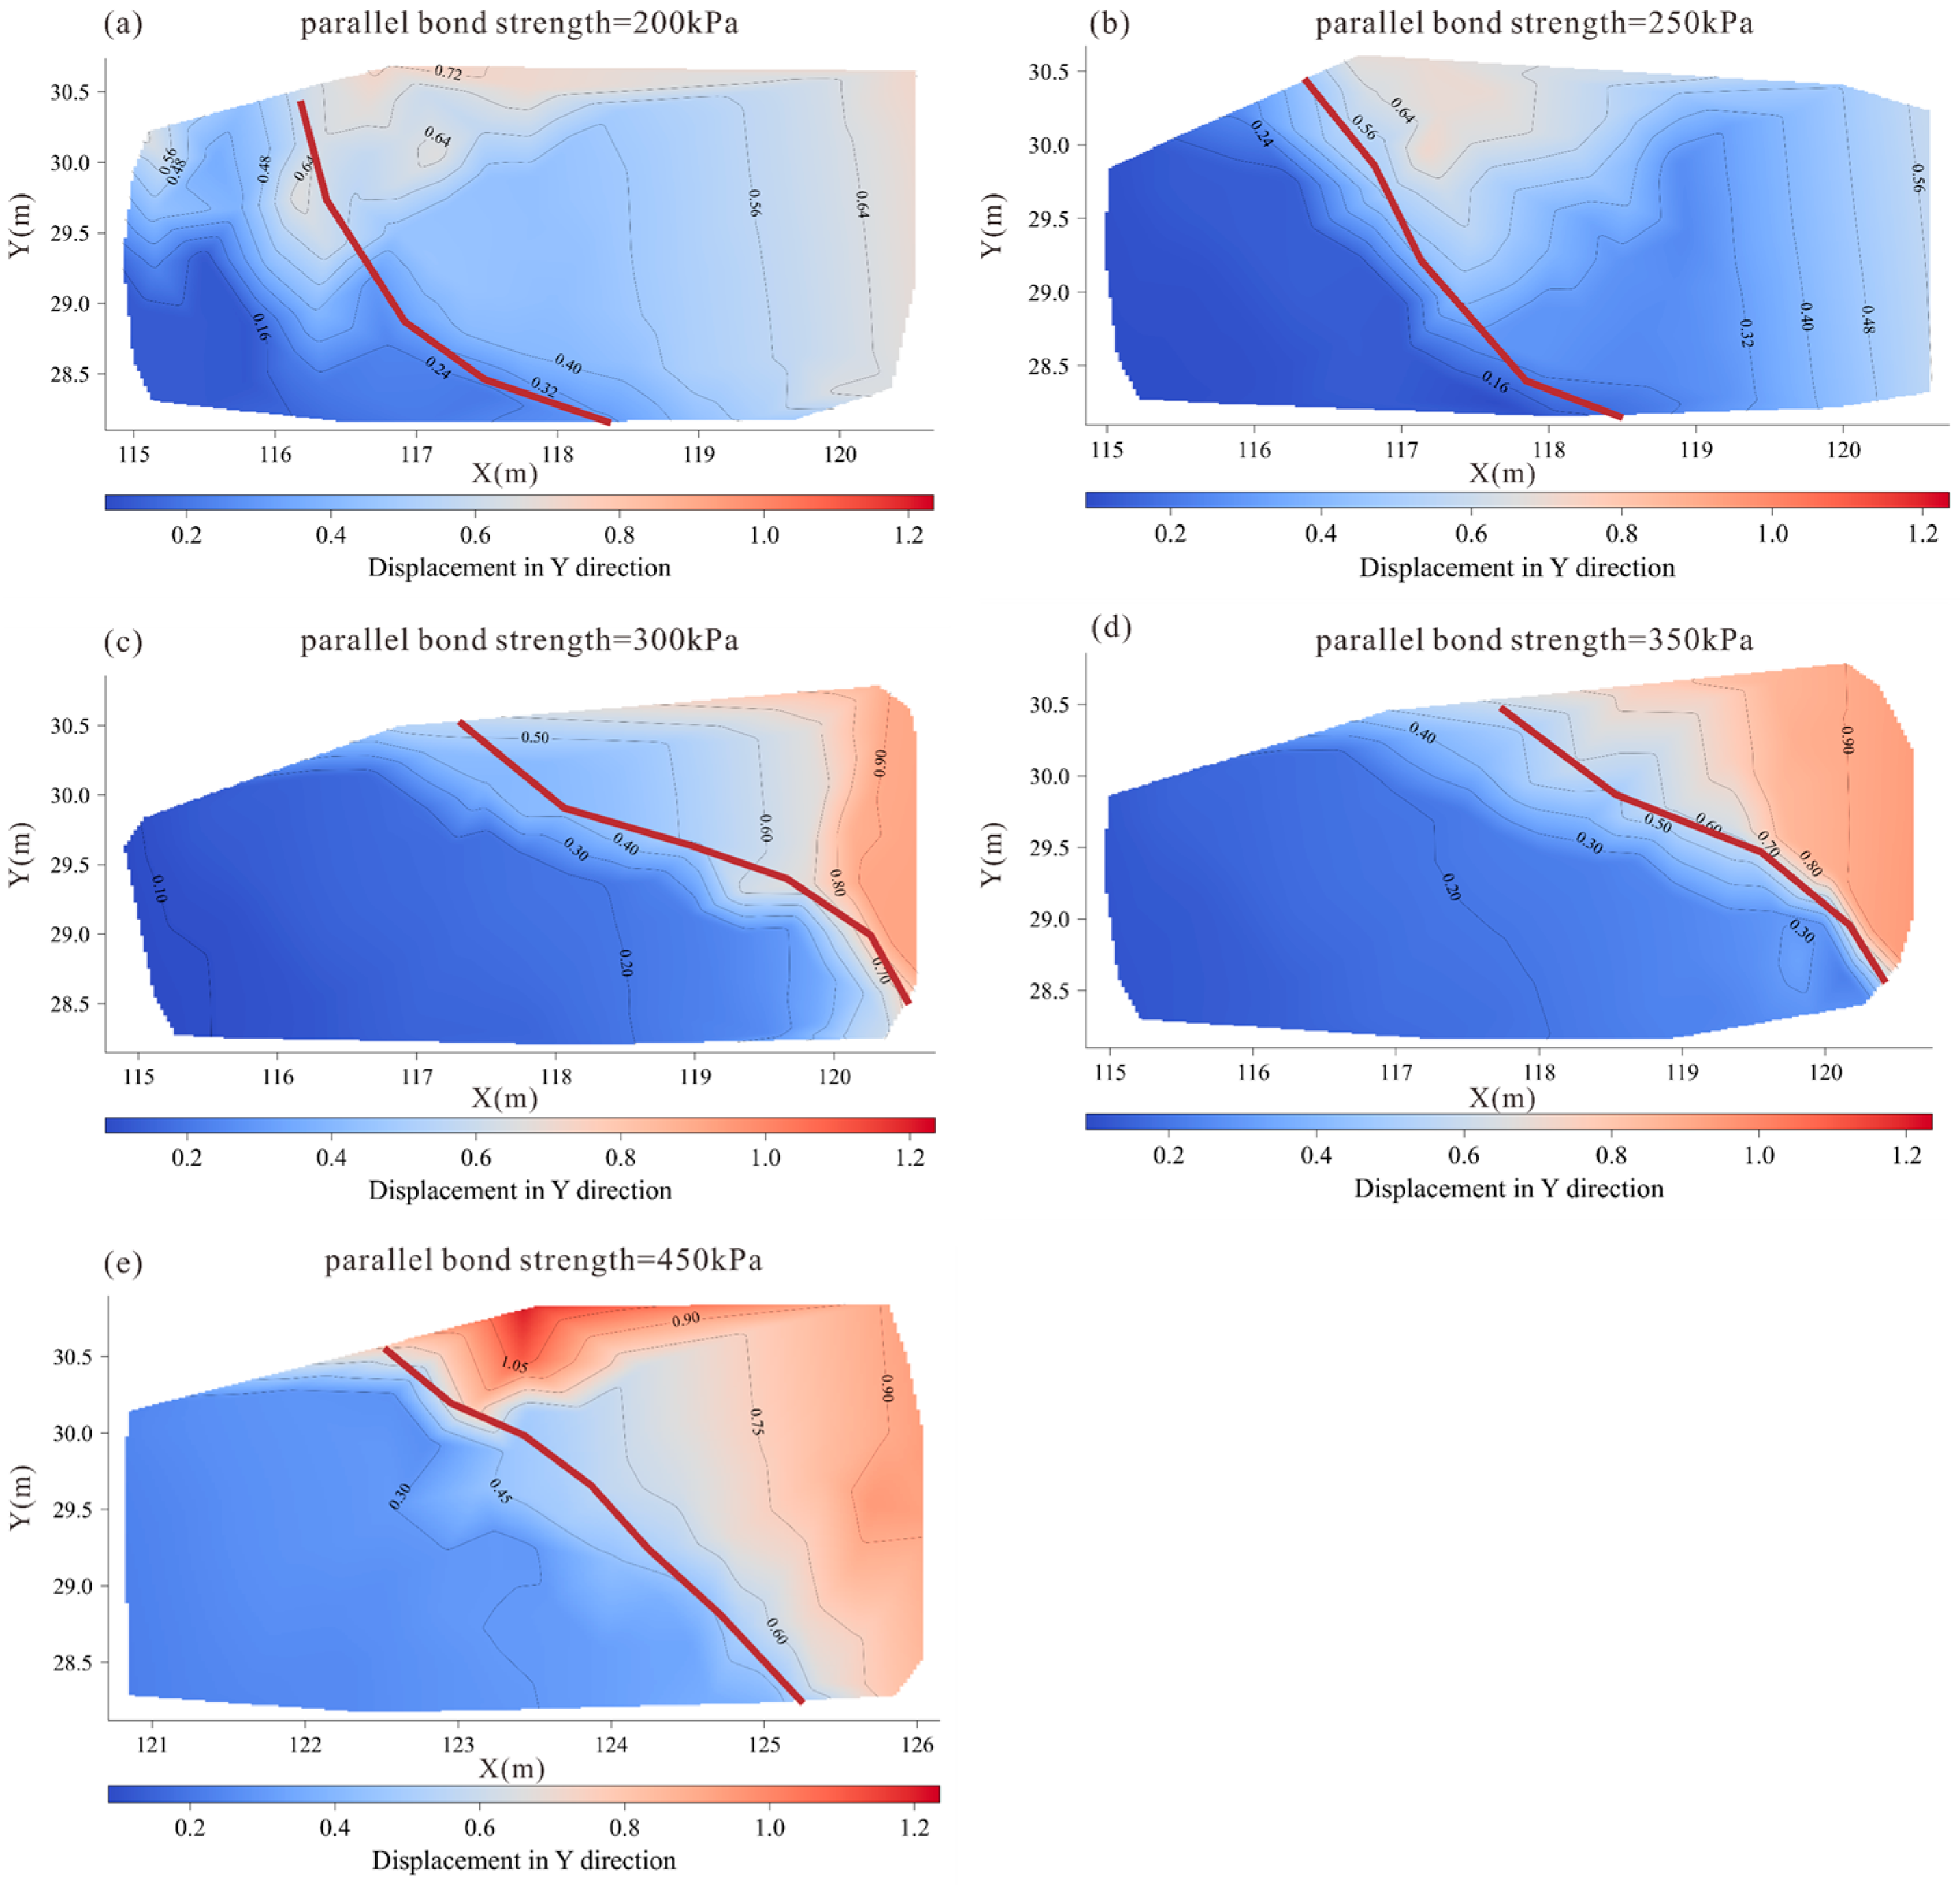
As shown in Figure 6, all bonded models exhibited a typical vertical deformation pattern of a thrust fault. The hanging wall experienced significant uplift, while vertical displacement remained small farther from the fault, with deformation primarily concentrated near the rupture zone. However, the magnitude of uplift, the width of the deformation zone, and the spatial distribution varied markedly among the different bonding strengths, indicating that shallow interlayer bonding strength plays an important role in controlling the upward propagation of rupture.
Figure 6.
Vertical displacement field for models with different interlayer bonding strengths. (a) 200 kPa, (b) 250 kPa, (c) 300 kPa, (d) 350 kPa, and (e) 450 kPa. Colors show vertical displacement in meters, with warmer colors indicating greater hanging wall uplift. The red line marks the main rupture band. Only the shallow portion of the model is shown.
In weakly bonded models (200–250 kPa), vertical displacement was mainly concentrated in the mid-depth portion of the fault, with only minor uplift observed in the shallow hanging wall. This indicates that weak bonding strength limits the effective transmission of rupture toward the upper layers, resulting in negligible shallow deformation and a broad, diffuse deformation zone. As the bonding strength increased to 300 and 350 kPa, uplift in the hanging wall became significantly stronger, with maximum vertical displacement reaching 0.75 to 0.8 m. The deformation zone also propagated continuously from depth to the shallow surface, forming a more concentrated rupture band with clearer geometric morphology. This transition suggests that intermediate bonding strength facilitates upward propagation of ruptures, enabling shallow deformation to fully respond to the deep rupture process. Notably, the shallow uplift response does not increase monotonically with bond strength; instead, it reflects a competition between efficient upward transmission of deformation from depth and the ability of the shallow sediments to develop persistent strain localization through progressive damage.
When the bonding strength was further increased to 450 kPa, the hanging wall still exhibited considerable uplift, but the vertical displacement difference was smaller than in the 350 kPa model. The shallow uplift zone narrowed markedly, concentrating within a small area near the fault rather than forming a continuous uplift zone along the fault. This phenomenon suggests that excessively high bonding strength may partially inhibit rupture propagation toward the surface. Mechanistically, a high bond strength increases the stiffness and integrity of the shallow sediments, making widespread distributed damage less favorable. Consequently, deformation becomes highly localized within a tight band while the surrounding rigid hanging wall resists broad flexural folding. As a result, uplift remains significant but becomes spatially concentrated near the shallow fault tip, and the differential uplift across the wider hanging wall decreases relative to the 350 kPa model. This is consistent with the partial arrest or confinement of rupture in an overly strong bonded cover. Similar observations have been documented in previous sandbox experiments and numerical simulations of thrust faults, where strong bonded layers were shown to suppress or locally deflect rupture propagation, thereby reducing shallow displacement [40,41,42,43].
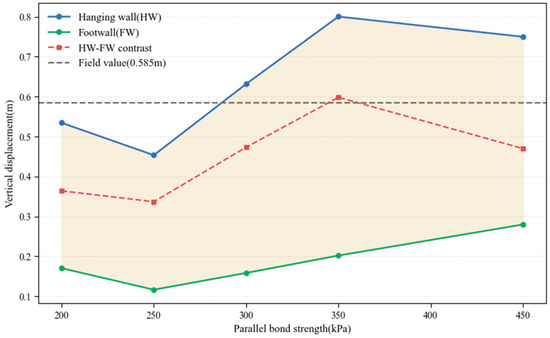
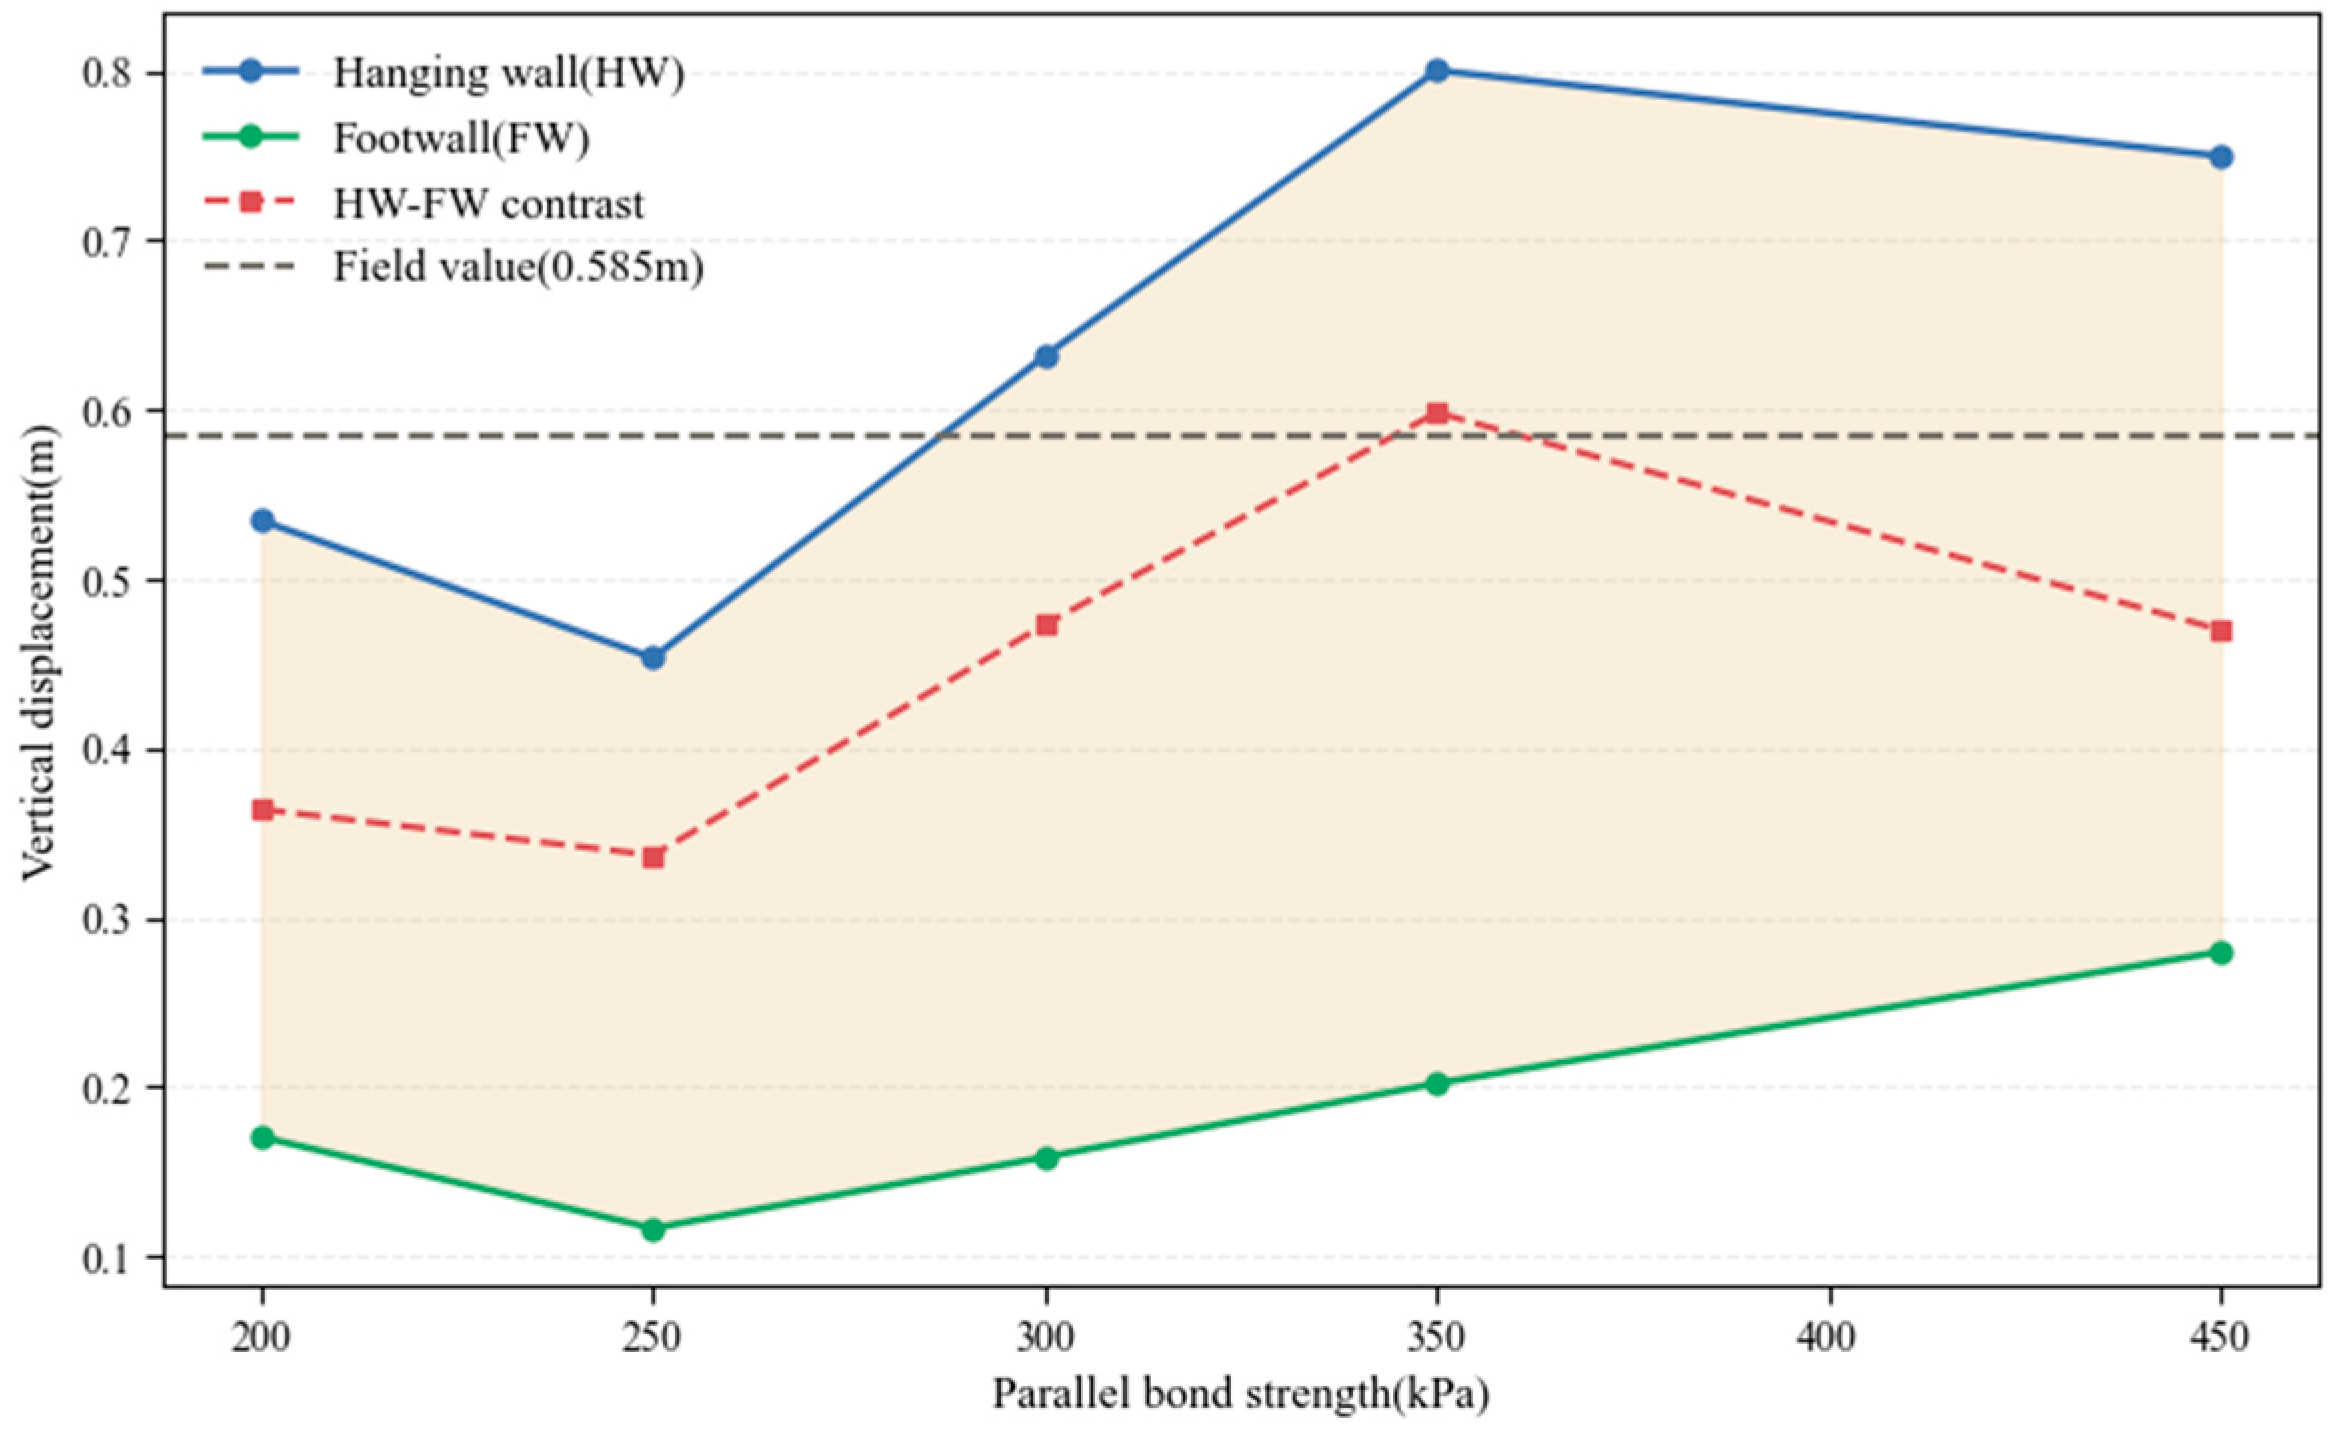
The average displacement of the hanging wall and the footwall further validates the aforementioned spatial deformation patterns. In all models, the hanging wall displacement was significantly greater than that of the footwall, reflecting the characteristic asymmetry of thrust fault deformation. Displacement near the footwall exhibited minimal overall variation, increasing only slightly with strength. Conversely, uplift near the hanging wall showed a pronounced upward trend with increasing bonding strength, peaking at 350 kPa. Under this condition, the difference between hanging wall and footwall displacement also reached its peak, indicating that rupture is efficiently transferred upward without being suppressed by excessively strong bonded layers.
According to the post-event field surveys and geodetic data synthesized by the Taiwan Ministry of Economic Affairs [14], the vertical uplift in the Hualien area ranges from 0.45 to 0.6 m, with a peak value of approximately 0.585 m observed near the Milun Fault. As the observations were collected during the post-event period and may incorporate contributions from aftershock activity and early post-seismic deformation, the reported uplift is interpreted as the cumulative surface response of the 2024 Hualien earthquake sequence, rather than displacement solely attributable to a single event. Consequently, we utilize this observed range and peak value as a macroscopic constraint to benchmark the modeled uplift. The weakly bonded models produced only minor displacement contrasts and were unable to reproduce the observed uplift. In the 450 kPa model, although the hanging wall exhibited sustained uplift, the vertical displacement difference was lower than that of the 350 kPa model, and the shallow uplift zone remained limited in extent. By contrast, the 350 kPa model generated ~0.6 m of vertical uplift, closely matching the field observation (Figure 7). Considering the magnitude of uplift, deformation distribution, and rupture continuity, the model with an interlayer bonding strength of 350 kPa most accurately reproduces the shallow deformation characteristics of the Milun Fault during the Hualien earthquake. Subsequent analysis will further examine the stress distribution under this bonding strength.
Figure 7.
Variation in hanging wall and footwall vertical displacement with interlayer bonding strength. Average vertical displacement for the hanging wall (blue) and footwall (green) is shown together with the hanging wall–footwall displacement contrast (red dashed). The horizontal dashed line (gray) indicates the field-measured maximum uplift of ~0.585 m during the 2024 Hualien earthquake.
3.3. Stress Characteristics and Rupture Mechanisms
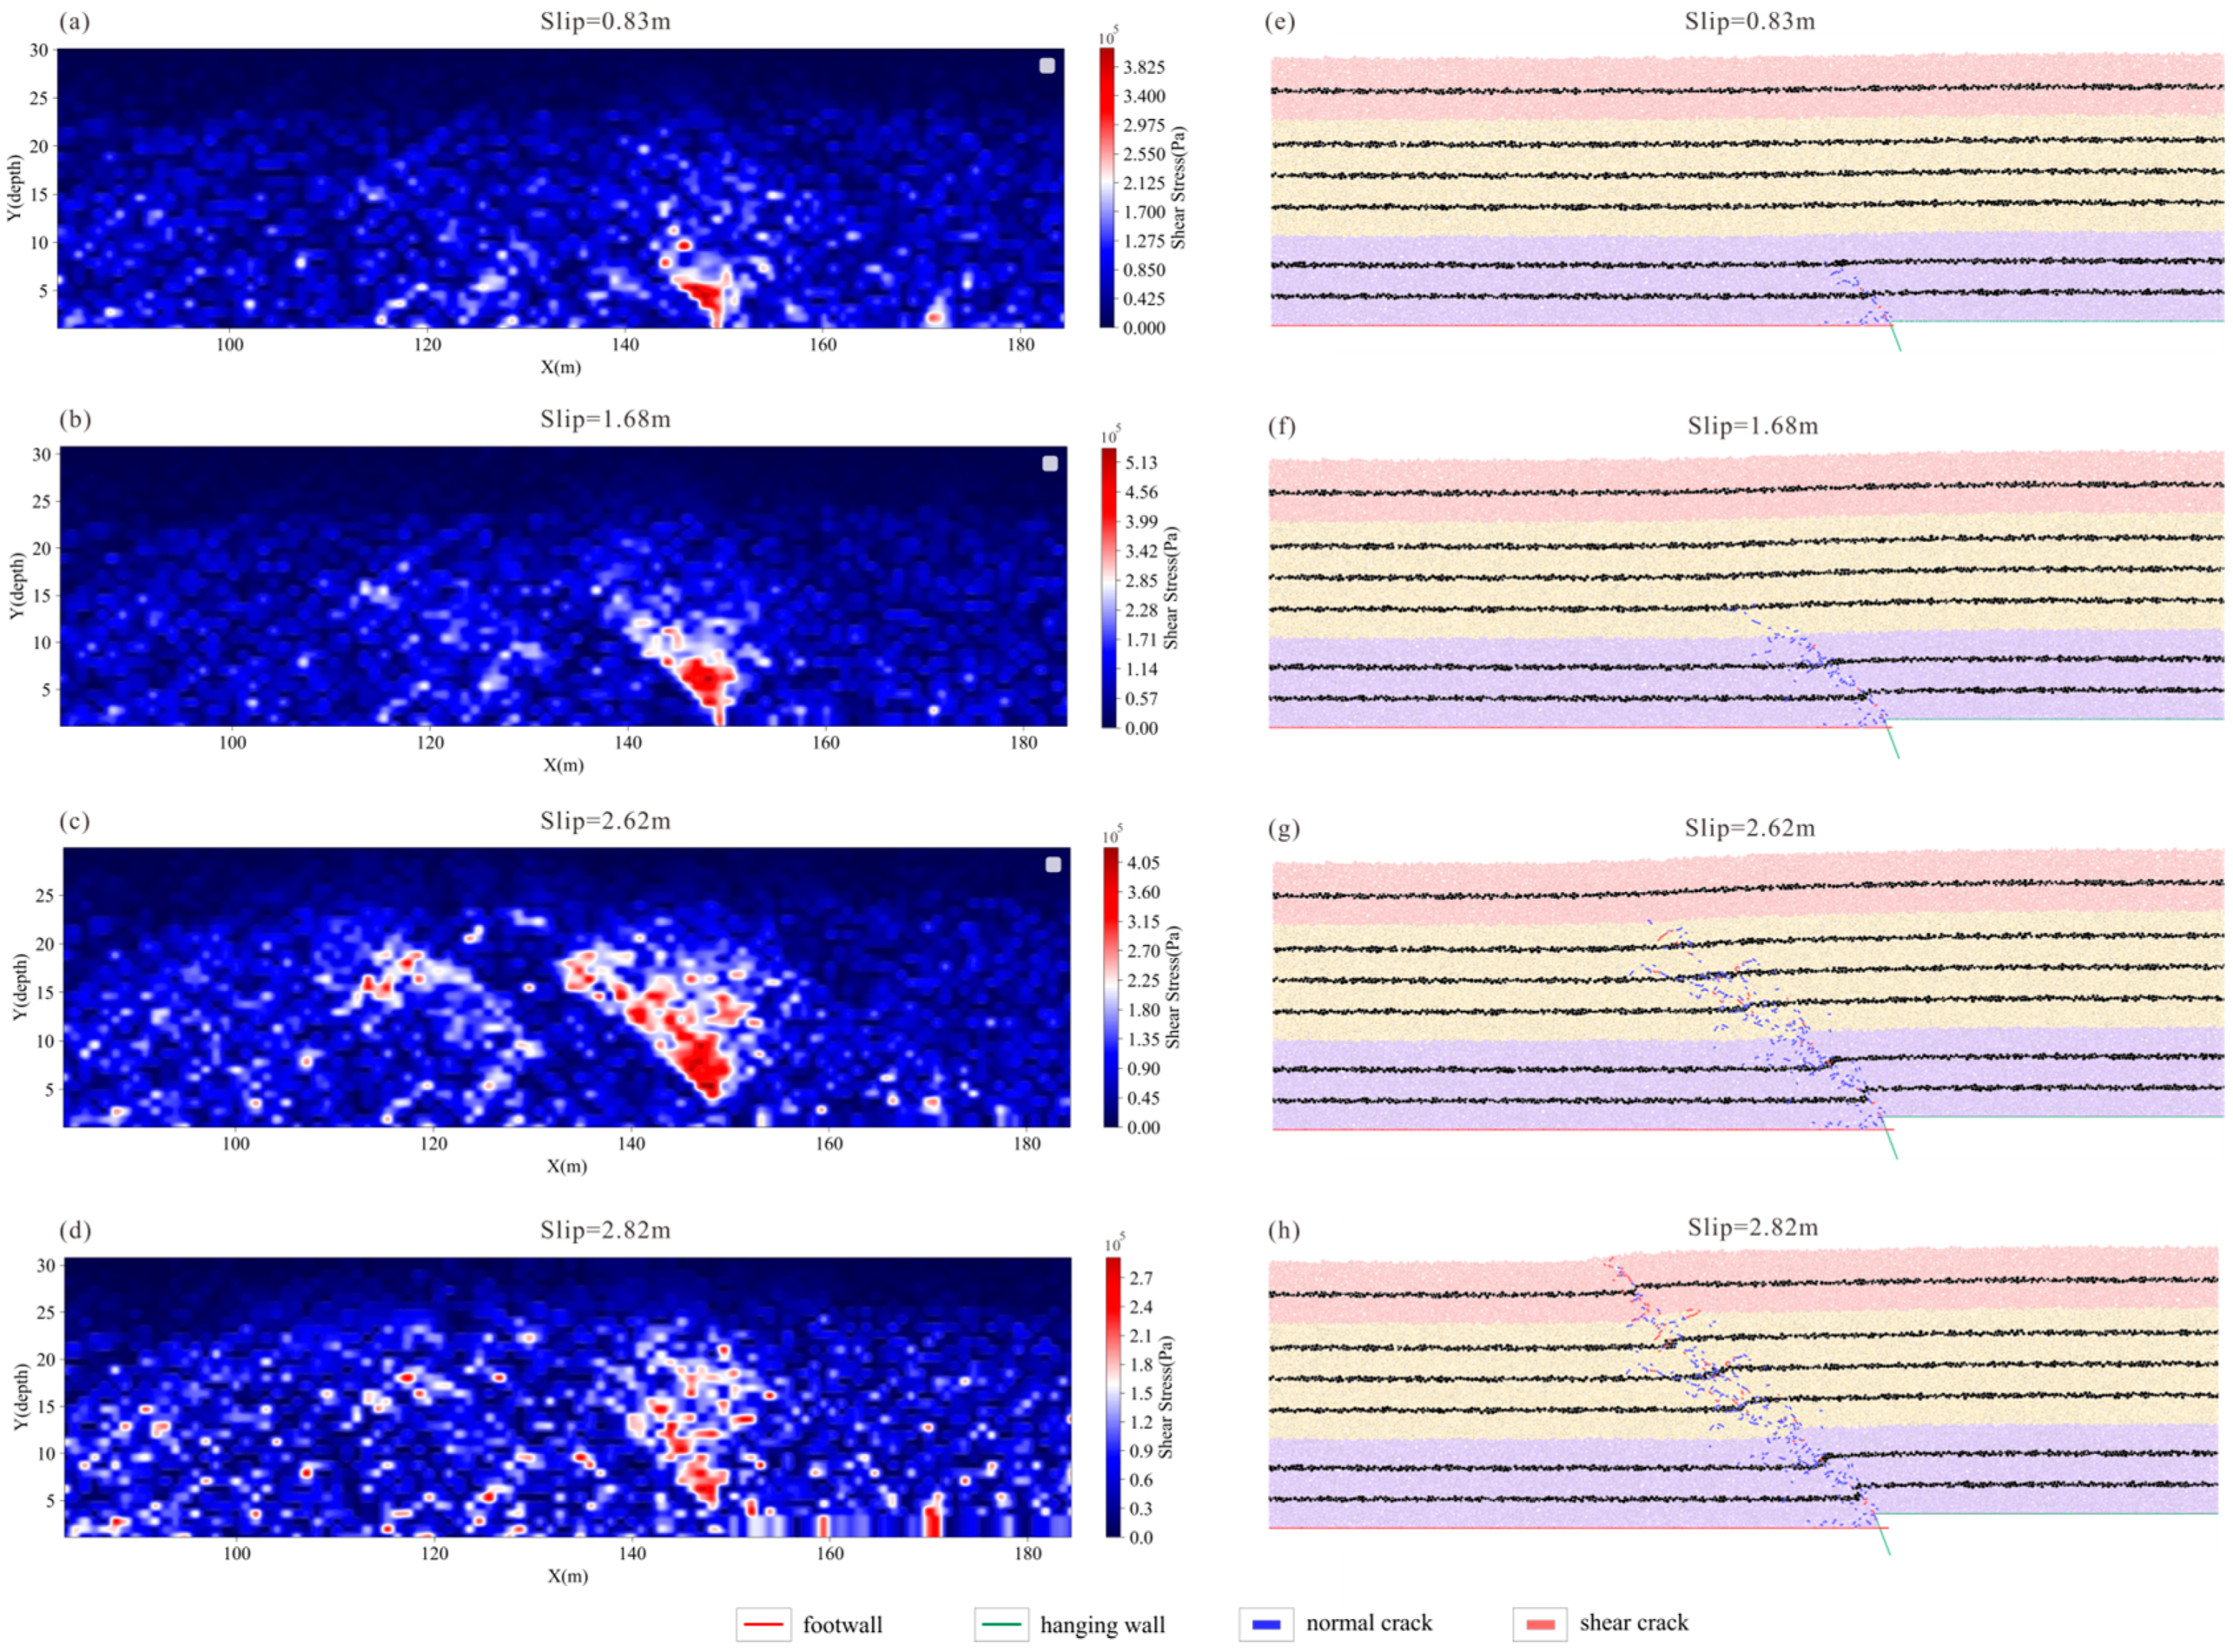
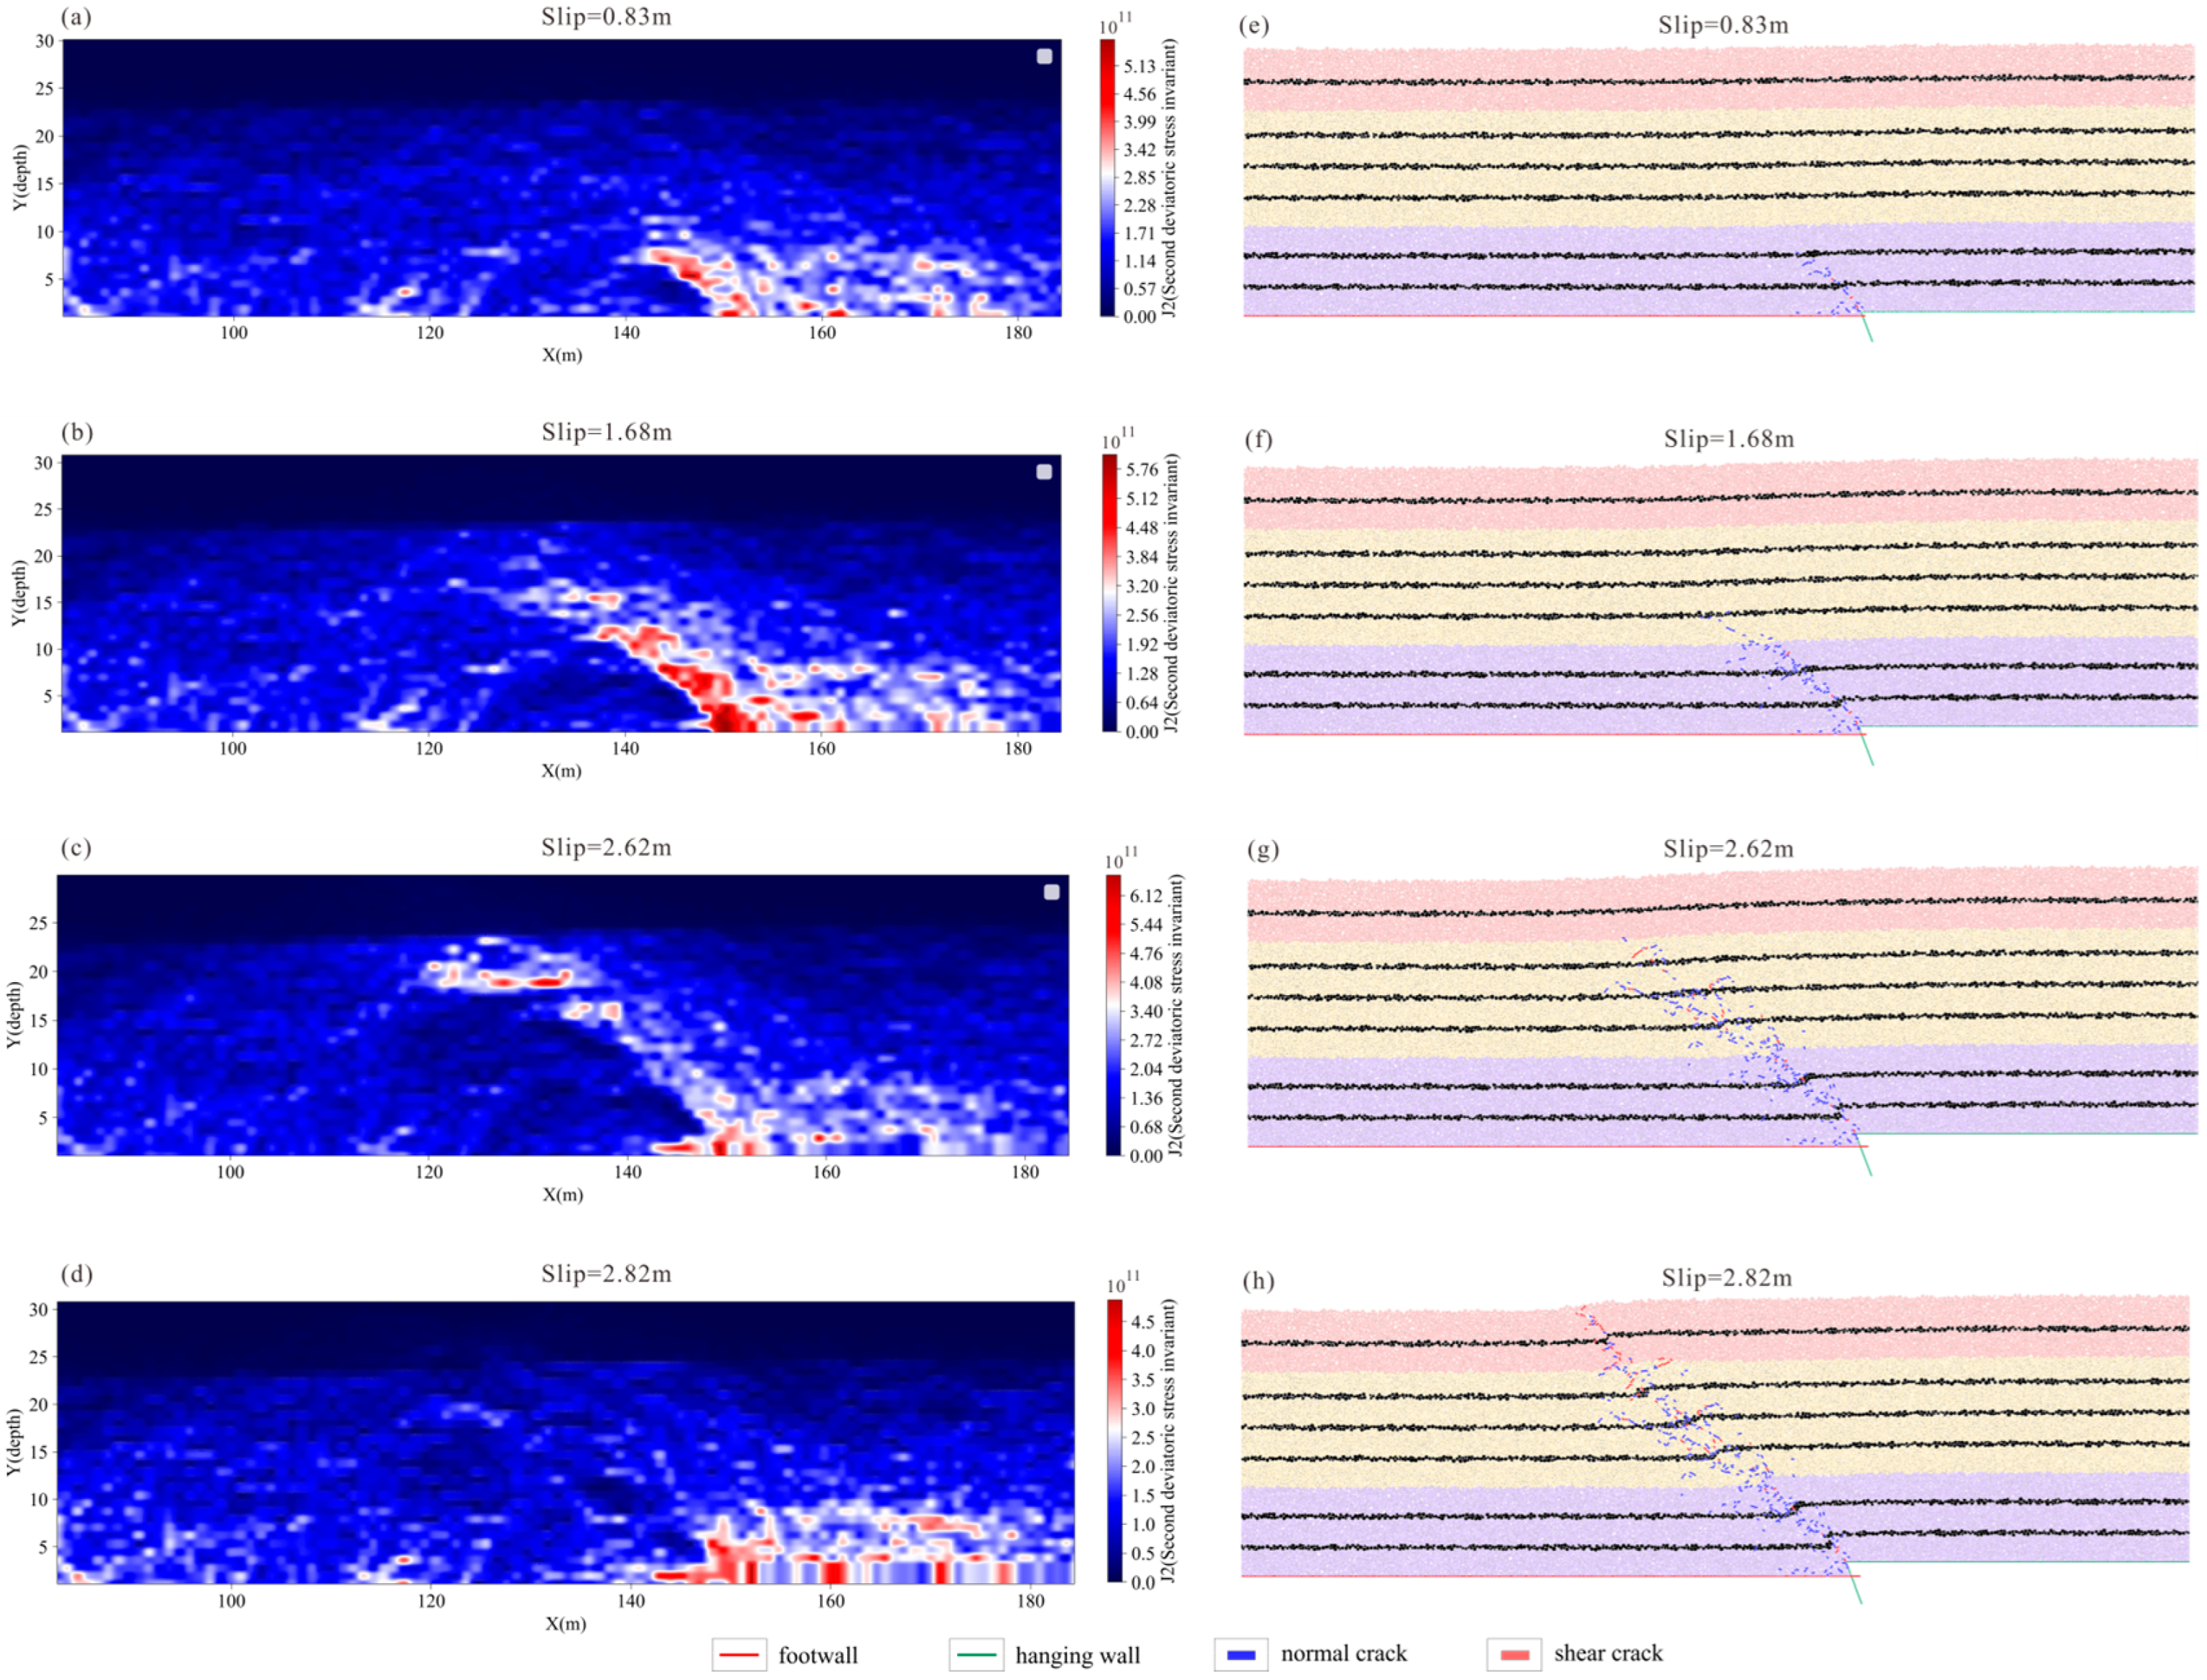
Figure 8 and Figure 9 illustrate the distribution of shear stress and the second deviatoric stress invariant () at different slip stages for the model with a bonding strength of 350 kPa. Overall, the stress field within the model does not exhibit a simple monotonic accumulation but rather undergoes continuous redistribution as cracks initiate and propagate. At the early stage of rupture (slip = 0.83 m, Figure 8a), high shear stress first appeared in the deeper part of the fault tip, which was accompanied by a localized zone of elevated , indicating that initial energy accumulation and stress concentration occur primarily at depth. As slip increased (slip = 1.68–2.62 m, Figure 8b,c), the shear stress migrated upward along the fault plane, and the high region similarly developed into a band-like pattern along the rupture surface. During this stage, stress concentration accompanies the continuous development of new cracks, gradually forming a continuous rupture zone. This result reflects the development process of rupture under the influence of stress redistribution at depth.
Figure 8.
Shear stress evolution and crack development at different slip stages (350 kPa model). (a–d) Shear stress fields at slip levels of 0.83, 1.68, 2.62, and 2.82 m. Stress concentrates near the fault tip during early rupture, migrates upward as slip increases, and becomes dispersed after the rupture reaches shallow layers due to rapid energy release. (e–h) Corresponding crack distributions at different slip stages. Cracks nucleate at depth, propagate upward, and eventually form a through-going rupture. After the rupture reaches the shallow surface, cracks become more scattered, consistent with the stress relaxation in (d).
Figure 9.
Evolution of the and crack development at different slip stages (350 kPa model). (a–d) distribution at slip levels of 0.83, 1.68, 2.62, and 2.82 m. High values initially concentrate near the fault tip, then migrate upward along the developing rupture as slip increases. After the rupture reaches the shallow surface, becomes dispersed, and overall magnitudes decrease. (e–h) Corresponding crack patterns at different slip stages.
Notably, when the slip reached 2.62 m (Figure 8c), the peak shear stress decreased while continued to increase, revealing a characteristic mechanical response during rupture propagation. As local contacts failed and new cracks rapidly formed, high shear stress contacts were destroyed, leading to rapid shear stress release in localized regions. In contrast, particles near the rupture front experienced renewed deviatoric loading under geometric constraints, resulting in sustained accumulation. The decrease in shear stress and increase during this phase reflects two coupled processes: shear stress release within the ruptured zone and renewed stress concentration at the advancing rupture front.
When the rupture reached the shallow layers and cut through the major strata (slip = 2.82 m, Figure 8d), both the shear stress and fields underwent a marked transition. High-value zones no longer exhibited concentrated banding but transformed into multiple dispersed localized residual stress points, and the overall peak stresses dropped sharply. This pattern does not indicate continued stress accumulation in the shallow section. It reflects rapid energy release after the rupture breaks through, causing the previous stress concentration zones to weaken and disperse. The scattered shallow stress pattern matches the crack distribution after full rupture development, showing that once the rupture reaches the near surface, the system shifts from stress buildup to energy dissipation and stress relaxation.
From a mechanical perspective, shear stress and jointly reveal the rupture development process. At the early stage, peak stresses concentrated at the fault tip, with both shear stress and increasing simultaneously, indicating that this region serves as the primary nucleation zone. As the slip progresses, high values extended upward along the rupture path toward the surface, showing that deviatoric stress dominates the development of the rupture front. Meanwhile, local shear stress dropped rapidly once cracks formed, reflecting the immediate stress release that occurs at rupture initiation. After the rupture breaks through to the shallow layers, the overall stress field weakens and becomes more dispersed. At this stage, multiple scattered clusters of high values appeared near the surface, while deeper levels retained a more continuous high-stress band. This contrast arises because shallow materials are weaker-bonded, less confined, and structurally looser, allowing rupture energy to spread out rather than maintaining a narrow, concentrated stress zone as in deeper regions. Overall, controls the rupture propagation path, shear stress governs its local triggering, and shallow structural conditions influence the final geometry of the rupture.
4. Conclusions
In this study, we employed the PFC2D method to simulate the shallow rupture process of the Milun Fault under the influence of the 2024 Hualien earthquake. We evaluated the model comprehensively through multiple perspectives, including displacement field analysis, the evolution of the shear stress and second deviatoric stress invariant, and crack development. The major conclusions are summarized as follows:
(1) The simulation results indicate that fault rupture progressed through multiple evolutionary stages, with fractures propagating from depth toward the surface. However, complete surface rupture did not occur; instead, under the combined control of the low-confinement environment and the weak cementation of the shallow sediments, the rupture transitioned into a diffuse fracture pattern near the surface. This indicates that shallow geological conditions promote the release of deformation in a distributed manner, thereby inhibiting the formation of continuous surface ruptures.
(2) Interlayer bond strength exerts a significant control on shallow rupture geometry and surface uplift. Under weak bonding conditions, rupture and deformation remain diffuse, preventing effective transmission from depth to the surface. Conversely, when bond strength is excessively high, strain becomes highly localized, causing the shallow uplift band to narrow and the differential uplift to decrease. The results show that the 350 kPa model produced a vertical uplift of ~0.6 m, which best matches the field survey. This suggests that intermediate bond strength most accurately reproduces the shallow deformation characteristics of this earthquake sequence at the model scale.
(3) In terms of stress evolution, concentrated at depth governs the development of the rupture and progressively migrates upward. Following crack formation, local shear stress is rapidly released, while stress continues to accumulate at the rupture tip. In the shallow subsurface, the weak cohesion and low confinement facilitate energy dissipation and distributed deformation. This leads to a diffuse stress pattern, which restricts the formation of a through-going surface rupture.
(4) Although the model results are generally consistent with macroscopic observations, certain limitations still exist. This study simplified the shallow sediment structure into a two-dimensional model. Additionally, the interlayer bond strength was constrained primarily through parametric sensitivity analysis, rather than direct calibration with field data. In the future, we will focus on developing a three-dimensional discrete element model to incorporate strike-slip components. We also aim to conduct relevant experiments to further constrain the micro-contact parameters, allowing for a more comprehensive assessment of near-surface seismic hazards with complex fault systems.
Author Contributions
Conceptualization, X.-F.G.; methodology, X.-F.G.; validation, X.-F.G.; writing—original draft preparation, X.-F.G.; writing—review and editing, Y.A.; visualization, X.-F.G.; funding acquisition, J.-H.L. All authors have read and agreed to the published version of the manuscript.
Funding
This research was funded by the China Scholarship Council (CSC), the National Key R&D Program of China (project 2023YFC2906501), and the National Science and Technology Major Project (projects No. 2025ZD1006600-2025ZD1006601-01). Computational resources were provided by the High-performance Computing Platform of Peking University.
Institutional Review Board Statement
Not applicable.
Informed Consent Statement
Not applicable.
Data Availability Statement
The original contributions presented in this study are included in the article. Further inquiries can be directed to the corresponding author.
Conflicts of Interest
The authors declare no conflicts of interest. The funders had no role in the design of the study; in the collection, analyses, or interpretation of data; in the writing of the manuscript; or in the decision to publish the results.
Abbreviations
| DEM | Discrete element method |
| PFC2D | Two-dimensional particle flow code |
| PB model | Linear parallel bond model |
References
- De Paola, N.; Bullock, R.J.; Holdsworth, R.E.; Marco, S.; Nielsen, S. Off-fault damage controls near-surface rupture behaviour in soft sediments. Nat. Commun. 2025, 16, 11295. [Google Scholar] [CrossRef] [Scilit] [PubMed]
- Xi, X.; Li, C.L.; Li, T.; Wei, Z.Y.; Ma, Z.F.; Zhang, G.H.; Qu, C.Y.; He, H.L.; Shan, X.J. Fault geometry and rupture speed as controls on off-fault deformation in the 2023 Turkey-Syria earthquakes. Commun. Earth Environ. 2025, 6, 103. [Google Scholar] [CrossRef] [Scilit]
- Antoine, S.L.; Klinger, Y.; Wang, K.; Bürgmann, R. Coseismic shallow slip deficit accounted for by diffuse off-fault deformation. Geophys. Res. Lett. 2024, 51, e2024GL110798. [Google Scholar] [CrossRef] [Scilit]
- Sboras, S.; Lazos, I.; Mouzakiotis, E.; Karastathis, V.; Pavlides, S.; Chatzipetros, A. Fault modelling, seismic sequence evolution and stress transfer scenarios for the 20 July 2017 (MW 6.6) Kos–Gökova Gulf earthquake, SE Aegean. Acta Geophys. 2020, 68, 1245–1261. [Google Scholar] [CrossRef] [Scilit]
- Hao, K.X.; Si, H.; Fujiwara, H.; Ozawa, T. Coseismic surface-ruptures and crustal deformations of the 2008 Wenchuan earthquake Mw7.9, China. Geophys. Res. Lett. 2009, 36, L11303. [Google Scholar] [CrossRef] [Scilit]
- Tang, X.W.; Guo, R.; Li, L.; Xu, Y.; Xu, J.Q.; Zheng, Y.; Sun, H.P. Earthquake interactions in eastern Taiwan: Insight from the 2024 Mw 7.3 Hualien earthquake. Seismol. Res. Lett. 2025, 96, 9–18. [Google Scholar] [CrossRef] [Scilit]
- Shyu, J.B.H.; Chen, C.F.; Wu, Y.M. Seismotectonic characteristics of the northernmost Longitudinal Valley, eastern Taiwan: Structural development of a vanishing suture. Tectonophysics 2016, 692, 295–308. [Google Scholar] [CrossRef] [Scilit]
- Hsu, Y.C.; Chang, C.P.; Yen, J.Y.; Kuo-Chen, H.; Wang, C.C. Investigating the structure of the Milun fault from surface ruptures of the 2018 Hualien earthquake. Terr. Atmos. Ocean. Sci. 2019, 30, 337–350. [Google Scholar] [CrossRef] [Scilit]
- Kuo, Y.T.; Wang, Y.; Hollingsworth, J.; Huang, S.Y.; Chuang, R.Y.; Lu, C.H.; Hsu, Y.C.; Tung, H.; Yen, J.Y.; Chang, C.P. Shallow fault rupture of the Milun fault in the 2018 Mw 6.4 Hualien earthquake: A high-resolution approach from optical correlation of Pléiades satellite imagery. Seismol. Res. Lett. 2019, 90, 97–107. [Google Scholar] [CrossRef] [Scilit]
- Chu, T.M.; Huang, W.J.; Lin, T.Y.; Lu, S.T.; Liu, Y.C.; Chiang, C.S.; Chang, Y.H. Benefits of defining geological sensitive zones in the mitigation of disasters along earthquake fault zones in Taiwan—The case of Milun fault. J. Disaster Res. 2021, 16, 1257–1264. [Google Scholar] [CrossRef] [Scilit]
- Gao, J.C.; Chan, C.H.; Ma, K.F.; Lee, C.T. Probabilistic fault displacement hazards along the Milun fault. Bull. Seismol. Soc. Am. 2022, 112, 2745–2757. [Google Scholar] [CrossRef] [Scilit]
- Yen, J.Y.; Lu, C.H.; Dorsey, R.J.; Kuo-Chen, H.; Chang, C.P.; Wang, C.C.; Chang, W.Y.; Chuang, R.Y.; Kuo, Y.T.; Chiu, C.Y.; et al. Insights into seismogenic deformation during the 2018 Hualien, Taiwan, earthquake sequence from InSAR, GPS, and modeling. Seismol. Res. Lett. 2019, 90, 78–87. [Google Scholar] [CrossRef] [Scilit]
- Lin, Y.Y.; Kanamori, H.; Zhan, Z.; Ma, K.F.; Yeh, T.Y. Modelling of pulse-like velocity ground motion during the 2018 M w 6.3 Hualien earthquake, Taiwan. Geophys. J. Int. 2020, 223, 348–365. [Google Scholar] [CrossRef] [Scilit]
- Geological Survey and Mining Management Agency; Ministry of Economic Affairs (MOEA); Taiwan. Geological Investigation Report of the April 3, 2024 Hualien Earthquake, Taiwan. Available online: https://fault.gsmma.gov.tw/Reports/More/3a082bc3a22b46d2b55c68d7c354e112 (accessed on 1 December 2024).
- Enokida, R.; Fukushima, Y.; Tang, C.H.; Pan, T.Y.; Kuo, C.L.; Ikago, K.; Izumi, T.; Kuriyama, S. Earthquake disaster resilience in Taiwan observed from the April 2024 ML 7.1 Hualien earthquake. Front. Built Environ. 2025, 11, 1593942. [Google Scholar] [CrossRef] [Scilit]
- Taniyama, H. Numerical analysis of overburden soil subjected to strike-slip fault: Distinct element analysis of Nojima fault. Eng. Geol. 2011, 123, 194–203. [Google Scholar] [CrossRef] [Scilit]
- Yang, Y.R.; Hu, J.C.; Lin, M.L. Evolution of coseismic fault-related folds induced by the Chi–Chi earthquake: A case study of the Wufeng site, Central Taiwan by using 2D distinct element modeling. J. Asian Earth Sci. 2014, 79, 130–143. [Google Scholar] [CrossRef] [Scilit]
- Chu, S.S.; Lin, M.L.; Huang, W.C.; Nien, W.T.; Liu, H.C.; Chan, P.C. Simulation of growth normal fault sandbox tests using the 2D discrete element method. Comput. Geosci. 2015, 74, 1–12. [Google Scholar] [CrossRef] [Scilit]
- Liu, C.Y.; Li, C.H.; Chan, P.C.; Hung, C.H.; Lin, M.L. 3D sandbox and numerical modeling of coseismic surface rupture induced by oblique-slip faulting and its interaction with embedded shallow foundation. Eng. Geol. 2021, 282, 105990. [Google Scholar] [CrossRef] [Scilit]
- Jiao, L.Q.; Wang, T.; Feng, G.C.; Tapponnier, P.; Simanjuntak, A.V.; Chan, C.H. Impact of rupture complexity on seismic hazar: Case of the 2018 Mw 7.5 Palu earthquake. EGUsphere 2022. [Google Scholar] [CrossRef] [Scilit]
- Chang, Y.Y.; Lee, C.J.; Huang, W.C.; Hung, W.Y.; Huang, W.J.; Lin, M.L.; Chen, Y.H. Evolution of the surface deformation profile and subsurface distortion zone during reverse faulting through overburden sand. Eng. Geol. 2015, 184, 52–70. [Google Scholar] [CrossRef] [Scilit]
- Garcia, F.E.; Bray, J.D. Distinct element simulations of earthquake fault rupture through materials of varying density. Soils Found. 2018, 58, 986–1000. [Google Scholar] [CrossRef] [Scilit]
- Huang, W.C.; Le, H.K.; Chen, K.Y. The Micromechanical Features of Shear Bands in Sandy Soils Subject to Reverse Fault Offsets. In Geotechnics for Sustainable Infrastructure Development; Duc Long, P., Dung, N., Eds.; Lecture Notes in Civil Engineering; Springer: Singapore, 2020; Volume 62, pp. 1259–1265. [Google Scholar]
- Donzé, F.V.; Klinger, Y.; Bonilla-Sierra, V.; Duriez, J.; Jiao, L.Q.; Scholtès, L. Assessing the brittle crust thickness from strike-slip fault segments on Earth, Mars and icy moons. Tectonophysics 2021, 805, 228779. [Google Scholar] [CrossRef] [Scilit]
- Chiama, K.; Chauvin, B.; Plesch, A.; Moss, R.; Shaw, J.H. Geomechanical modeling of ground surface deformation associated with thrust and reverse-fault earthquakes: A distinct element approach. Bull. Seismol. Soc. Am. 2023, 113, 1702–1723. [Google Scholar] [CrossRef] [Scilit]
- U.S. Geological Survey Earthquake Catalogue (Mw≥5.0, 1950–2025). Available online: https://earthquake.usgs.gov/earthquakes/search/ (accessed on 30 May 2025).
- Dziewonski, A.M.; Chou, T.A.; Woodhouse, J.H. Determination of earthquake source parameters from waveform data for studies of global and regional seismicity. J. Geophys. Res. Solid Earth 1981, 86, 2825–2852. [Google Scholar] [CrossRef] [Scilit]
- Ekström, G.; Nettles, M.; Dziewoński, A.M. The global CMT project 2004–2010: Centroid-moment tensors for 13,017 earthquakes. Phys. Earth Planet. Inter. 2012, 200, 1–9. [Google Scholar] [CrossRef] [Scilit]
- Dean, S.; Morgan, J.; Brandenburg, J.P. Influence of mobile shale on thrust faults: Insights from discrete element simulations. AAPG Bull. 2015, 99, 403–432. [Google Scholar] [CrossRef] [Scilit]
- Cundall, P.A. A computer model for simulating progressive large scale movement in blocky rock systems. In Proceedings of the Symposium of the International Society of Rock Mechanics, Nancy, France, 4–6 October 1971. [Google Scholar]
- Cundall, P.A.; Strack, O.D.L. A discrete numerical model for granular assemblies. Géotechnique 1979, 29, 47–65. [Google Scholar] [CrossRef] [Scilit]
- Itasca Consulting Group, Inc. Particle Flow Code in 2 Dimensions (PFC2D), Version 6.0: User’s Guide; Itasca: Minneapolis, MN, USA, 2018; Available online: https://docs.itascacg.com/pfc600/contents.html (accessed on 30 July 2025).
- Ding, X.B.; Zhang, L.Y.; Zhu, H.H.; Zhang, Q. Effect of model scale and particle size distribution on PFC3D simulation results. Rock Mech. Rock Eng. 2014, 47, 2139–2156. [Google Scholar] [CrossRef] [Scilit]
- Taniyama, H. Distinct element analysis of overburden subjected to reverse oblique-slip fault. J. Struct. Geol. 2017, 96, 90–101. [Google Scholar] [CrossRef] [Scilit]
- Central Geological Survey. Investigation and Research on the Structural Characteristics of Important Active Faults—Study on the Near-Surface Deformation Characteristics of Active Faults (3/4); Ministry of Economic Affairs: Taipei, Taiwan, 2013. [Google Scholar]
- Zeng, Y.Z. Paleoseismics Study of Milun Active Fault in Hualien, Eastern Taiwan. Ph.D. Thesis, National Central University, Taoyuan City, Taiwan, 2019. [Google Scholar]
- Brooks, B.A.; Minson, S.E.; Glennie, C.L.; Nevitt, J.M.; Dawson, T.; Rubin, R.; Zaccone, D.; Ericksen, T.L.; Lockner, D.; Hudnut, K.; et al. Buried shallow fault slip from the South Napa earthquake revealed by near-field geodesy. Sci. Adv. 2017, 3, e1700525. [Google Scholar] [CrossRef] [Scilit]
- Bao, H.; Qi, Q.; Lan, H.X.; Yan, C.G.; Xu, W.; Liu, X.; Li, L.P. Shear mechanical behaviours and multistrength parameter characteristics of fault gouge. Adv. Civ. Eng. 2019, 1, 4208032. [Google Scholar] [CrossRef] [Scilit]
- Silva, D.C.A.; Skurtveit, E.; Soldal, M.; Braathen, A. Frictional strength of siliciclastic sediment mixtures in fault stability assessment. J. Struct. Geol. 2024, 187, 105232. [Google Scholar] [CrossRef] [Scilit]
- Hughes, A.N.; Shaw, J.H. Insights into the mechanics of fault-propagation folding styles. Geol. Soc. Am. Bull. 2015, 127, 1752–1765. [Google Scholar] [CrossRef] [Scilit]
- Bonanno, E.; Bonini, L.; Basili, R.; Toscani, G.; Seno, S. How do horizontal, frictional discontinuities affect reverse fault-propagation folding? J. Struct. Geol. 2017, 102, 147–167. [Google Scholar] [CrossRef] [Scilit]
- del Castillo, E.M.; Fávero Neto, A.H.; Borja, R.I. Fault propagation and surface rupture in geologic materials with a meshfree continuum method. Acta Geotech. 2021, 16, 2463–2486. [Google Scholar] [CrossRef] [Scilit]
- Zwaan, F.; Schreurs, G.; Madritsch, H.; Herwegh, M. Influence of rheologically weak layers on fault architecture: Insights from analogue models in the context of the Northern Alpine Foreland Basin. Swiss J. Geosci. 2022, 115, 26. [Google Scholar] [CrossRef] [Scilit]

Disclaimer/Publisher’s Note: The statements, opinions and data contained in all publications are solely those of the individual author(s) and contributor(s) and not of MDPI and/or the editor(s). MDPI and/or the editor(s) disclaim responsibility for any injury to people or property resulting from any ideas, methods, instructions or products referred to in the content. |
© 2026 by the authors. Licensee MDPI, Basel, Switzerland. This article is an open access article distributed under the terms and conditions of the Creative Commons Attribution (CC BY) license.