


Featured Application
The method proposed in this study can be applied to the design and optimization of pinhole-based ion microbeam systems toward micrometer-scale beam confinement, with potential application to site-selective ion implantation for the fabrication of silicon-vacancy color centers in diamond.
Abstract
Micrometer-scale pinholes provide a compact approach for generating localized ion beams, but ion scattering from the pinhole wall can produce spatially extended background that degrades implantation selectivity. To clarify the transport mechanisms underlying a SiV implantation experiment, 28Si ion transport through a 1 μm tapered pinhole was investigated using PHITS. The spatial distributions and exit angles of wall-scattered ions were evaluated, with attention to beam-energy dependence. Within the investigated parameter ranges and selected response metric, sensitivity analysis identified incident energy as the dominant parameter controlling transverse broadening. At 0.4 MeV, strong energy loss during ion–wall interactions limited forward transport, and exit angles of 10–30° corresponded to transverse displacements of approximately 170–580 μm at a 1 mm pinhole-to-sample distance. In contrast, 1–3 MeV ions retained more residual energy and produced a more continuous peripheral distribution near the beam axis. Separately, the radial flux distribution showed that the scattered-ion flux decreased rapidly within about 100 μm of the beam center and then formed a weak long-range tail. No distinct transport threshold was found at 400 μm, indicating that the >400 μm separation used experimentally is better interpreted as a conservative measure for suppressing scattering-induced background rather than a sharply defined physical threshold.
1. Introduction
1.1. Approaches and Challenges in Microbeam Formation
Techniques for producing particle beams with diameters on the micrometer scale or smaller have been extensively investigated in various scientific and engineering fields. Currently, three principal methods are commonly used to generate microbeams: magnetic focusing, pinhole collimation, and glass-capillary focusing [1,2,3,4,5,6]. Although conventional magnetic-focusing microbeam systems employing quadrupole lenses are effective, their configurations are relatively complex and require considerable installation space. Therefore, this study presents the results of a fundamental investigation into a simple method for generating microbeams using a micrometer-scale pinhole.
Pinhole collimation is a representative beam-forming approach suitable for applications that do not require exceptionally high transverse resolution and can tolerate relatively low beam intensity. Owing to its simple structure, low cost, ease of operation, and compatibility with existing accelerator systems, this method plays an important role in many practical research and application settings. Micrometer-scale beams generated by pinhole collimation have been employed in a wide range of experimental applications, including localized irradiation in radiobiology; targeted irradiation of small organisms, tissues, and organs [2,3]; single-event-effect testing of semiconductor devices; site-specific ion implantation; and the fabrication of quantum and photonic devices [7,8,9,10,11,12,13]. These applications generally place greater emphasis on achieving an overall balance among beam localization, system feasibility, apparatus complexity, operational stability, and experimental cost.
1.2. Spatial Selectivity Issues in Micro-Pinhole-Based Measurements
Pinhole collimation has several inherent limitations. At the micrometer scale, particularly for apertures of approximately 1 μm, fabrication constraints make it difficult to produce an ideal straight-through hole with a finite thickness and sidewalls approaching 90°. In practice, pinholes generally exhibit a tapered geometry, with a larger entrance and a smaller exit. Consequently, incident particles may interact with the aperture edges or inner walls and undergo scattering. This process can generate low-intensity, spatially extended components outside the primary beam, resulting in non-ideal features such as lateral beam broadening, side tails, or beam halos [2,3,14,15]. These effects can degrade the spatial resolution of the beam at the target, reduce the useful beam intensity, and increase the energy spread, thereby compromising the accuracy and reliability of experimental results. Previous studies have also emphasized the importance of spatial implantation resolution in ion-beam applications. Spinicelli et al. [9], Schukraft et al. [10], and Schröder et al. [11] demonstrated the importance of precise ion implantation for the controlled fabrication of color centers in diamond and their integration into nanophotonic structures. However, the achievable spatial resolution of pinhole-generated microbeams can be limited by ion scattering. Gerardi et al. [2] reported limitations in the minimum achievable beam diameter and potential increases in energy spread associated with pinhole collimation. Funayama [3] further indicated that reducing the pinhole diameter does not necessarily improve the effective beam size because the relative contribution of scattered particles may increase. Similarly, Alves et al. [14] demonstrated that ion scattering imposes fundamental limitations on the spatial accuracy of deterministic ion implantation.
Professor Mario Agio and his colleagues at the University of Siegen, Germany, investigated the scalable fabrication of deeply embedded silicon-vacancy (SiV) color centers in diamond by ion implantation through a 1 μm pinhole. They explicitly proposed controlling ion scattering and performed corresponding SRIM (Stopping and Range of Ions in Matter) simulations to evaluate the influence of ions scattered by the pinhole. The objective was to determine suitable conditions for the fabrication of single emitters and to achieve deeply embedded, spatially localized, and position-controlled SiV centers over a relatively broad range of ion energies. However, the primary objective of the aforementioned study was to achieve controlled ion implantation for the creation of SiV color centers and to optimize the corresponding experimental conditions, rather than to specifically investigate the ion transport mechanisms following interactions with the pinhole walls and their effects on lateral microbeam broadening. Although that study employed SRIM simulations to investigate the trajectories of scattered ions and their spatial distributions at the sample surface, it did not systematically discuss the different transport pathways of ions following interactions with the pinhole walls, the exit-angle characteristics of wall-scattered ions, or the quantitative relationships between these transport behaviors and the resulting lateral spatial distributions. In particular, regarding the selection of incident ion energy, the previous study demonstrated that a relatively low energy of 0.4 MeV was favorable for reducing the scattering background. However, it did not further elucidate the physical relationship between the directional transport behavior of scattered ions at different incident energies and the near-axis scattering background through an analysis of the exit-angle distributions of scattered ions and their energy dependence. Similarly, regarding the experimental separation distance of more than 400 μm, the previous study demonstrated the practical effectiveness of this condition in reducing the scattering background through simulations and experimental observations. However, it did not further quantitatively investigate the local ion fluence attenuation characteristics in the vicinity of this distance or the physical relationship between the experimental separation distance and the degree of scattering background reduction [12,13,16,17,18,19].
1.3. Objective of This Study
Building on the experimental findings reported by Hunold et al. [15,20], the present study focuses on the transport behavior of 28Si ions passing through a 1 μm tapered pinhole and further employs PHITS simulations to investigate the particle transport mechanisms underlying the previously observed ion-scattering behavior [21,22]. Particular attention is given to the dependence of wall-scattered ion transport on incident ion energy, including the contributions of different transport pathways, exit-angle distributions, and radial particle fluence attenuation characteristics. By distinguishing different ion transport pathways following interactions with the pinhole wall, this study establishes a physical framework for examining how wall-related transport processes contribute to energy loss, angular redistribution, and lateral particle spreading. This pathway-resolved analysis provides a basis for understanding the energy-dependent scattering behavior and interpreting the radial distribution of the scattering background. The primary objective of this study is to elucidate the physical mechanisms responsible for the reduced near-axis scattering background under the low-energy irradiation condition of 0.4 MeV and to provide a quantitative physical interpretation of the experimental separation distance greater than 400 μm. By establishing the relationships between ion-wall interactions and the resulting angular and spatial distributions, this study aims to extend the understanding of pinhole-generated ion microbeam formation and transverse broadening beyond the characterization of ion-scattering behavior reported in previous studies.
2. Methods
2.1. PHITS Simulation of Ion Transport Through a Micro-Pinhole Structure
The PHITS-based model was used to investigate ion transport within the tapered-pinhole geometry and to evaluate particle distributions at different scoring locations, providing a consistent computational framework for the subsequent transport-pathway and angular-distribution analyses. PHITS version 3.280 was used in this study.
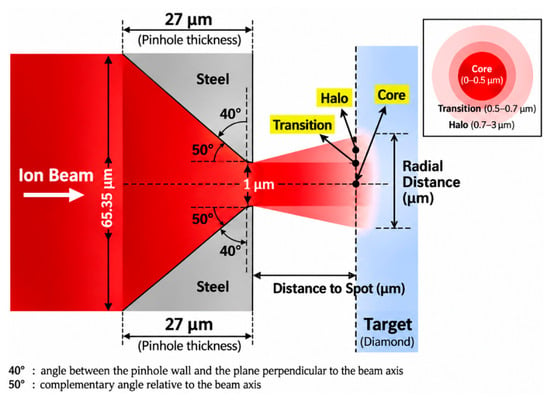
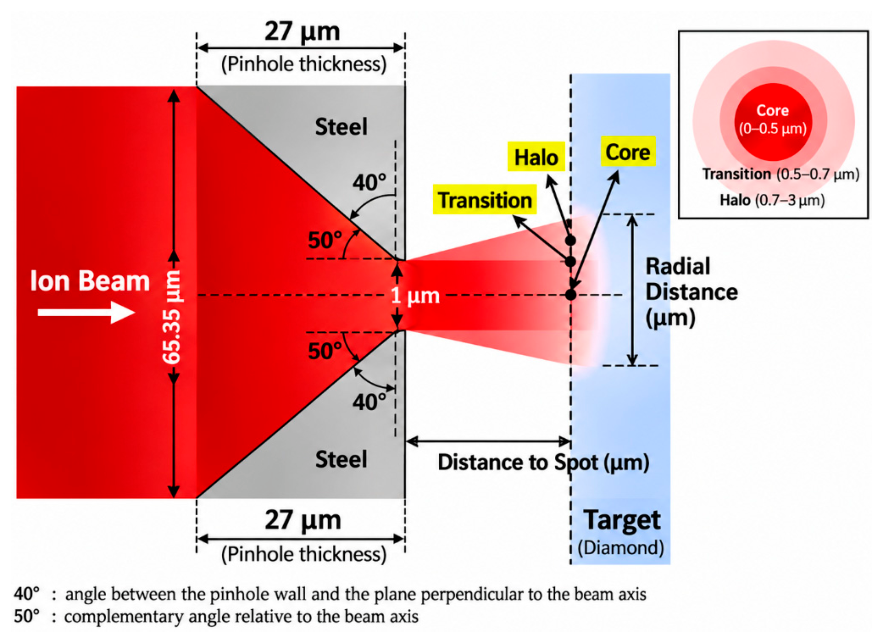
A representative ion-implantation system equipped with a 1 μm pinhole was adopted as the baseline configuration to establish a general analytical framework for elucidating the formation mechanism of pinhole-generated microbeams and evaluating the effects of key system parameters [15]. The ion-transport simulations were performed using PHITS [21,22,23,24]. In the baseline model, as shown in Figure 1, the pinhole had a tapered geometry, with entrance and exit diameters of 0.006535 cm and 0.0001 cm. The pinhole thickness was 0.0027 cm, and the angle between the pinhole wall and the plane perpendicular to the beam axis was set to 40°. The pinhole was made of steel with a density of 8.03 g/cm−3 and was mounted in the forward orientation. The detailed composition of the steel was Fe (−0.68995), Cr (−0.19000), Ni (−0.09000), Mn (−0.02000), Si (−0.00750), C (−0.00080), N (−0.00100), P (−0.0004), and S (−0.00030). According to the PHITS material input format, these negative values represent the mass fractions of the respective elements rather than physically negative quantities. Regarding the incident-beam conditions, the beam divergence angle was set to 0.3 mrad, and ion energies of 0.4, 1.0, 2.0, and 3.0 MeV were considered. The incident beam energy was specified in the [Source] section of the PHITS input file. For example, for a total incident energy of 0.4 MeV, the energy of the incident 28Si ions was defined as e0 = 0.4000/28. The incident particles were 28Si ions, and the incident beam diameter was 0.00325 cm. The incidence angle was set to 0°, with the beam axis assumed to be perfectly aligned with the central axis of the pinhole. The vacuum pressure was approximately 10−7 mbar, and no external magnetic or electric fields were considered. In terms of the geometrical arrangement, the sample-to-pinhole distance was set to 1 mm, while the source-to-pinhole distance was 40 cm. The target material was diamond with a density of 3.515 g/cm−3 and dimensions of 2 cm × 2 cm × 0.5 cm. The transport-related parameters were specified separately in the [Parameters] section, with emin(11) = 1.0 × 10⁻³ and cmin(11) = 1.0 × 10⁻³. The detailed simulation parameters are summarized in Table 1.
Figure 1.
Schematic illustration of the tapered pinhole geometry and radial beam distribution at the diamond target.
Table 1.
Specific parameters of the 1 μm pinhole ion implantation system.
It should be emphasized that a one-factor-at-a-time approach was adopted in the subsequent sensitivity analysis of the pinhole wall angle. During the analysis, the pinhole thickness and exit diameter were kept constant at 27 μm and 1 μm, respectively, with the pinhole wall angle treated as the only independently varied geometric parameter. Owing to the geometric constraints of the tapered pinhole, the entrance diameter was adjusted accordingly as the wall angle varied. Meanwhile, all other simulation parameters, including the incident beam conditions, pinhole material, and pinhole-to-sample distance, were maintained unchanged.
2.2. Tally Configuration and Spatial Scoring
The calculated radial distribution of the ion beam at the target surface was found to be highly sensitive to the tally scoring window. Therefore, the results depend not only on the physical model itself but also on the tally configuration and the method used to extract the data. An excessively thick tally slice or an overly broad integration range can introduce additional spatial averaging effects, thereby altering the resulting distribution. Following a systematic comparison of different tally parameters, an R-Z mesh tally was adopted in this study. The particle flux calculated using the R-Z mesh tally is expressed in units of cm−2/source and characterizes the intensity of ion transport per unit area and per source particle within the specified scoring region. A thin slice extending from z = 40.1027 to 40.1030 cm was selected to characterize the radial spreading behavior of the 28Si ion beam in the near-surface region of the diamond target. In the radial direction, the integration range was restricted to 0–0.0003 cm, with the number of radial mesh divisions set to nr = 100, in order to improve the spatial resolution of the localized beam distribution at the target surface. The radial scoring range of 0–3 μm was selected to investigate the influence of pinhole-wall scattering on the spatial distribution and transverse broadening of the central microbeam. This selection is also consistent with the near-axis ion-density distributions reported by Hunold et al. [15]. The 3 μm boundary represents the selected range for local analysis rather than a physical cutoff for scattered-ion transport. Scattered ions at larger radial distances were investigated separately in Section 3.4 and Section 3.5. It should be emphasized that the tally was positioned immediately after the ions entered the target surface. Ion transport in free space and ion transport within the target represent two distinct physical problems. The former primarily concerns ion propagation, divergence, and spatial distribution in vacuum or free space after the beam exits the pinhole. The latter focuses on the lateral broadening, intensity distribution, and energy distribution generated within the material immediately after the ions enter the diamond target. The present study addresses the latter problem, with particular emphasis on ion transport under the specified target conditions.
The [T-Cross] tally was primarily employed to investigate ion transport within the tapered pinhole geometry. By defining scoring surfaces at different locations, the f-curr and b-curr modes were used to analyze forward ion transport and backward scattering, respectively, while the a-curr mode was employed to obtain the angular distribution of ions crossing the specified surfaces. In addition, the [T-Track] tally with an R–Z mesh was used to further investigate the radial ion fluence distribution near the diamond target surface. This tally provides a track-length-based estimate of the volume-averaged particle fluence within the specified scoring regions.
2.3. Classification and Identification Criteria for Ion Transport Pathways
Based on the outcomes of particle–pinhole interactions, the incident particles were classified into four categories: Direct, Wall-scattered, Lost-reflect, and Lost-stop. Direct particles are those that pass through the pinhole without interacting with the aperture wall. Wall-scattered particles interact with the aperture wall but subsequently continue to propagate downstream through the pinhole. Lost-reflect particles interact with the aperture wall, are deflected backward, and return upstream. Lost-stop particles are decelerated and eventually stopped within the pinhole material. These categories represent not only differences in particle transport trajectories but also distinct spatial and energetic characteristics of the resulting beam. Direct particles exhibit strong forward transmission, limited angular divergence, and relatively low energy loss. Wall-scattered particles undergo scattering and energy loss within the pinhole wall and therefore generally exhibit larger exit angles and broader spatial distributions. These particles may contribute to the central beam region while simultaneously producing low-intensity peripheral tails or halo components. In contrast, Lost-reflect and Lost-stop particles do not belong to the forward-transmitted beam component and therefore do not directly contribute to the formation of the downstream microbeam.
Particle classification was performed using the [Counter] function in combination with the [T-Cross] and [T-Time] tallies in PHITS. In the simulation geometry, the steel material region forming the pinhole wall was designated as the region monitored by Counter 1, which was used to record whether a tracked 28Si ion had entered this region. For particles crossing the downstream scoring plane in the forward direction output=f-curr, ctmax(1) = 0 was used to identify Direct particles that had never entered the steel-wall region, whereas ctmin(1) = 1 was used to identify Wall-transmitted particles that had entered this region at least once. Particles crossing the upstream scoring plane in the backward direction output = b-curr after entering the steel-wall region were identified as Lost-reflect particles. Lost-stop particles were identified using the cutoff output of the [T-Time] tally within the steel-wall region, together with the corresponding counter condition. The classification criteria and their corresponding PHITS counter conditions and tally outputs are summarized in Table 2.
Table 2.
Particle classification criteria based on PHITS counter conditions and tally outputs.
3. Results
3.1. Transmission Efficiency and Ion-Path Decomposition
Each simulation was performed using 107 source particle histories. The statistical uncertainties of the calculated particle fluxes were evaluated using the relative errors (err.) reported by PHITS. These errors were examined for individual radial mesh intervals to assess the statistical reliability of the simulated intensity distributions, particularly in the low-flux peripheral regions.
The transmission fraction was defined as the ratio of the number of transmitted ions to the total number of incident source ions. Regarding the collective exhaustiveness of the particle classification, the fraction of each particle category was calculated by dividing the corresponding particle count by the total number of incident source particles. After normalization to the total number of incident particles, the fractions of the four particle categories were 2.38 × 10⁻⁴ for Direct particles, 2.70 × 10⁻⁴ for Wall-transmitted particles, 6.36 × 10⁻⁴ for Lost-reflect particles, and 9.9886 × 10⁻¹ for Lost-stop particles, corresponding to 0.0238%, 0.0270%, 0.0636%, and 99.886%. It should be noted that the relative contributions calculated within the near-axis radial range of 0–3 μm should be distinguished from the overall fraction of wall-transmitted particles. These results indicate that, under the baseline conditions of the present ion-implantation system, the overwhelming majority of incident particles are lost within the pinhole wall. The forward-transmitted beam is therefore composed only of the Direct and Wall-scattered components, whereas the Lost-reflect and Lost-stop particles do not contribute to downstream beam formation. The relative contributions of the core and halo components within the transmitted beam were subsequently evaluated. Direct particles undergo almost no significant scattering and therefore exhibit strong forward directionality and relatively low energy loss. They mainly form the high-intensity central beam spot and are thus assigned to the core component. In contrast, Wall-transmitted particles interact with the pinhole wall before emerging downstream at larger exit angles. Consequently, they contribute not only to the central core region but also to the low-intensity peripheral halo. To isolate the contribution of Wall-transmitted particles to the core component, the incident beam was configured with a hollow annular profile, with an inner radius of rmin = 0.00005 cm and rmax = 0.0003 cm. This configuration eliminates the influence of Direct particles on the core evaluation, such that the calculated core component originates entirely from Wall-scattered particles. The results show that, within the Wall-scattered population, 98.55% of the particles are distributed in the core region, whereas only 1.4516% are located in the peripheral halo region. The calculation method is presented in Equations (1) and (2). Specifically, the average forward surface-current densities obtained using the PHITS [T-Cross] tally in the forward surface-current mode (output = f-curr, unit = 1) were 7133.070 cm−2/source and 3.001 cm−2/source for the core region (0–0.5 μm) and the peripheral region (0.5–3.0 μm), respectively. By multiplying these values by their corresponding scoring areas, π(0.5 × 10⁻⁴)2 cm2 and π[(3 × 10⁻⁴)2 − (0.5 × 10⁻⁴)2] cm2, the area-integrated forward-current contributions were calculated to be 5.6023 × 10⁻⁵ source−1 and 8.2521 × 10⁻⁷ source−1, respectively. These source-normalized contributions were then multiplied by the total number of simulated source-particle histories 107, yielding estimated numbers of forward-crossing ions of 560.23 and 8.2521 ions in the corresponding regions, respectively.
Contribution of wall-transmitted particles to the core/halo region:
To further evaluate the spatial confinement characteristics of the transmitted ion beam, the contributions from the 0–0.5 μm region and the 0.5–3 μm region, comprising the transition and halo regions, were analyzed. When normalized to the total number of incident source-particle histories, the forward-crossing contributions from the core region (0–0.5 μm) and the combined transition and halo regions (0.5–3 μm) are approximately 0.0504% and 0.000392%, respectively. These results indicate that the transmitted beam is strongly concentrated within the central core region, while the contribution from the peripheral region is considerably smaller within the investigated radial range. These results demonstrate that, although a pinhole-generated microbeam inevitably contains a halo component produced by wall-scattered particles, the transmitted beam remains overwhelmingly dominated by the core component.
The consistency of the particle classification was evaluated based on the PHITS counter conditions and the normalized fractions of the four transport categories. As summarized in Table 2, Direct and Wall-transmitted particles were distinguished at the same downstream scoring plane using ctmax(1) = 0 and ctmin(1) = 1, respectively. These conditions distinguish particles that never entered the steel-wall region from those that entered it at least once, thereby ensuring that the two forward-transmitted categories are mutually exclusive under the specified scoring conditions. The normalized fractions of Direct, Wall-transmitted, Lost-reflect, and Lost-stop particles were 0.0238%, 0.0270%, 0.0636%, and 99.886%, respectively, yielding a total of 100.0004%. The negligible deviation of 0.0004 percentage points from 100% is attributable to rounding of the reported values. To further validate the classification method, the PHITS particle dump function was employed to examine the transport histories of individual primary particles and assess the consistency of their event assignments. Each primary-particle history was assigned to a single transport category, with no overlapping assignments or unclassified histories identified.
3.2. Beam Intensity Distribution in the Micro-Pinhole System
To evaluate the statistical reliability of the radial intensity distributions, the relative errors (err.) reported by PHITS were further analyzed. The results show that, at incident ion energies of 0.4, 1, 2, and 3 MeV, the median relative errors in the core region were 0.52%, 0.15%, 0.15%, and 0.31%, respectively, while those in the transition region were 2.25%, 0.39%, 0.37%, and 0.80%, respectively. These results indicate that the statistical uncertainties in both regions were generally low. In contrast, the relative errors in the halo region were substantially higher due to the low particle fluence. The median relative errors for nonzero scoring bins were 100%, 20.61%, 8.74%, and 11.05% at 0.4, 1, 2, and 3 MeV, respectively. In particular, at 0.4 MeV, 51 out of 77 radial scoring bins in the halo region recorded no particle contributions, indicating that the available particle statistics in this region were limited. With these statistical limitations in mind, the energy-dependent radial intensity distributions are examined below.
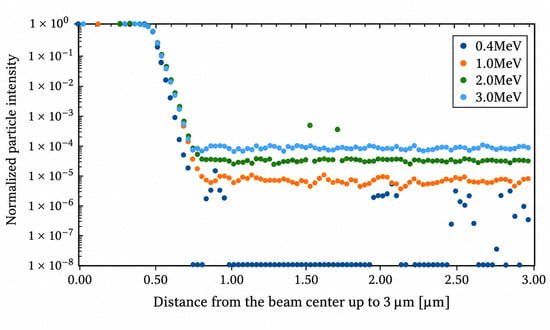
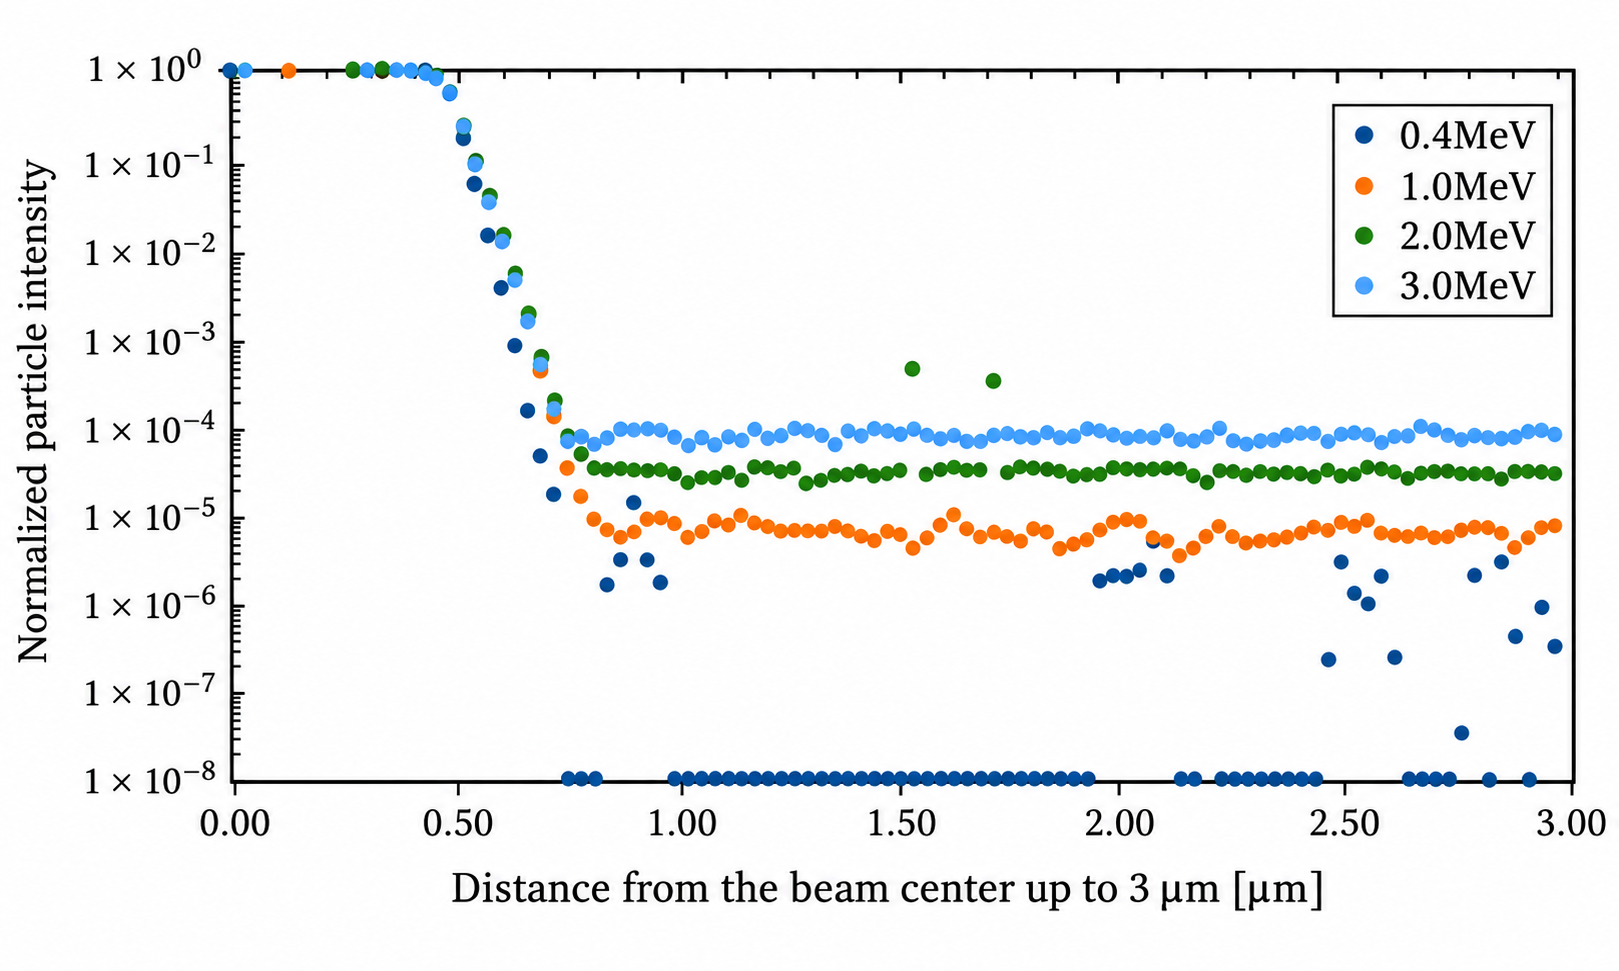
Using the established particle-transport model, representative 28Si ion beams with energies ranging from 0.4 to 3 MeV were incident on the target material. The lateral spatial distributions of the particle intensity generated near the target surface were calculated using PHITS, as shown in Figure 2. The horizontal axis represents the radial distance from the beam center over a range of 0–3 μm, while the vertical axis represents the normalized particle intensity. The normalized intensity distribution was obtained by dividing the particle flux calculated using PHITS by the maximum particle flux within the specified radial range, resulting in a dimensionless quantity. The core-halo decomposition discussed in Section 3.1 provides an overall description of the dominant central beam component and the peripheral contribution associated with wall-scattered ions. However, the radial intensity distribution exhibits a gradual transition from the high-intensity central peak to the low-intensity peripheral halo, rather than an abrupt boundary between these two components. To characterize this spatial variation more precisely, a transition region was introduced between the core and halo in the radial intensity analysis. According to the calculated intensity distribution, the resulting beam spot was divided into three regions: the core region from 0 to 0.5 μm, the transition region from 0.5 to 0.7 μm, and the halo region from 0.7 to 3.0 μm. The core region corresponds to the high-intensity central component and is composed primarily of directly transmitted particles, representing the main body of the microbeam. The transition region lies between the core and halo regions and is characterized by a rapid decrease in beam intensity. It reflects the gradual change from a distribution dominated by directly transmitted particles to one increasingly influenced by wall-scattered particles. The halo region is characterized by a broad spatial distribution and relatively low intensity, representing the peripheral component generated by particles scattered through interactions with the pinhole wall.
Figure 2.
Intensity distribution within 3 μm from the beam center.
Particular attention should be paid to the radial intensity distribution obtained at an incident energy of 0.4 MeV, where a distinct low-flux region appears outside the core. Specifically, within the halo region beyond approximately 0.7 μm, the calculated flux remains at an extremely low level and does not form a continuously increasing peripheral distribution. This feature indicates that low-energy 28Si ions undergo substantial energy loss and significant changes in their scattering trajectories after interacting with the inner wall of the pinhole. Owing to the low incident energy, some Wall-scattered particles retain only limited residual energy after penetrating or leaving the pinhole wall, which markedly reduces the probability that they will continue propagating forward and reach the corresponding radial region. Moreover, this low-flux region should not be interpreted simply as a conventional characteristic of the halo component. Instead, it is more likely a condition-dependent feature jointly determined by energy loss, the angular distribution of scattered particles, and their residual range under low-energy irradiation conditions. When the incident energy is increased to 1, 2, or 3 MeV, the scattered particles retain greater residual energy and exhibit stronger forward-transport capability. Consequently, the distinct low-flux region is no longer observed, and the spatial distributions of the halo and transition components become smoother and more continuous.
3.3. Sensitivity Analysis of Beam Intensity to Key Parameters
In this study, a sensitivity coefficient S is introduced to quantify the response of the beam intensity to variations in a given influencing parameter [25]. It is defined as the ratio of the relative change in beam intensity to the relative change in the corresponding parameter:
where I and ∗ denote the baseline beam intensity and the baseline value of the investigated parameter, respectively, while ΔI and Δ∗ represent their corresponding changes. The numerator describes the relative variation in the beam-intensity response, whereas the denominator represents the relative variation in the influencing parameter itself. A larger sensitivity coefficient indicates that a small variation in the parameter can produce a substantial change in beam intensity, suggesting that the parameter is more critical for controlling microbeam characteristics. Conversely, a smaller sensitivity coefficient indicates that the parameter has a relatively weak influence on the beam intensity. The key parameters affecting microbeam formation and lateral broadening were classified into three categories for parametric scanning: pinhole-related parameters, including the pinhole taper angle, pinhole material, and material density; beam-condition parameters, including the beam divergence angle and incident energy; and geometrical parameters, represented by the sample-to-pinhole distance. Starting from the baseline model, the effects of these parameters were systematically evaluated using a one-factor-at-a-time approach. The sensitivity analysis was performed based on the radial ion fluence distributions calculated by PHITS. For each simulation condition, the fluence values at different radial positions were normalized by the maximum local flux under the corresponding simulation condition, yielding a dimensionless relative intensity distribution. Subsequently, the normalized radial intensity distributions obtained under different parameter perturbations were compared with those of the baseline simulation at the corresponding radial positions.
As shown in Table 3, the comprehensive analysis indicates that the core region exhibits relatively low sensitivity to all investigated parameters. The effects of incident-beam energy, pinhole taper angle, sample-to-pinhole distance, beam divergence angle, and incidence angle are generally of the same order of magnitude. Therefore, this region can be regarded as a relatively stable primary peak region. Although the generated microbeam remains quantitatively dominated by the core component, the principal factor responsible for the degradation of lateral spatial resolution is not the core itself, but rather the lateral broadening of the transition and halo regions outside the core at the sample surface. To improve the lateral spatial resolution, the transition region between the core and halo should be made as narrow and steep as possible. Accordingly, the transition region between the core and halo was selected as the primary quantitative evaluation region for the sensitivity analysis. This region provides sufficient particle statistics while also reflecting the onset of lateral beam broadening caused by scattering from the pinhole wall. For the sensitivity analysis, seven radial tally bins near the core–transition boundary were selected. The particle flux in each bin was normalized by the maximum local flux under the corresponding simulation condition. Taking 0.4 MeV as the baseline, the signed relative changes in normalized intensity were calculated for each bin under the perturbed conditions (1.0, 2.0, and 3.0 MeV). The arithmetic mean of these seven changes was then obtained, and its absolute value was divided by the relative change in the corresponding parameter to calculate the sensitivity coefficient defined in Equation (3). Thus, the absolute value was applied after averaging, allowing positive and negative changes to partially cancel. To further evaluate the statistical reliability of the sensitivity analysis, the relative errors (r.err) reported by PHITS were examined for the seven radial mesh intervals used to calculate the sensitivity coefficients. At incident energies of 0.4, 1.0, 2.0, and 3.0 MeV, the relative errors ranged from 0.41% to 2.86%, 0.13% to 0.45%, 0.12% to 0.43%, and 0.26% to 0.94%, respectively. Among the investigated parameters, the incident-beam energy exhibited a particularly large sensitivity coefficient. When the beam energy was increased from 0.4 MeV to 1–3 MeV, the sensitivity coefficient in the transition region reached 10.12–45.83%, the highest values among all evaluated parameters. It should be emphasized that these results are specific to the parameter ranges and simulation conditions investigated in this study. Therefore, the incident beam energy is identified as the most influential parameter only within the present simulation framework, rather than as a universally dominant factor governing the transverse broadening of pinhole-generated ion microbeams. It should also be noted that relatively small sensitivity coefficients, particularly those associated with geometrical parameters and the pinhole-to-sample distance, may be influenced by statistical uncertainties in the Monte Carlo simulations. Therefore, these results should be interpreted with caution and should not be regarded as definitive evidence of physical insensitivity without further quantitative uncertainty assessment.
Table 3.
The contribution of each parameter to the beam intensity in the transition region.
It should be noted that the above discussion is based on a tally position located 1 mm downstream of the pinhole exit. Because the ions undergo geometrically induced beam spreading and scattering during downstream transport, the relative proportions of the core and halo components vary noticeably with the pinhole-to-target distance. For the baseline annular ion-implantation configuration in which the central beam component is excluded, a change of 0.1 mm in the pinhole-to-target distance results in an approximately ±0.05% variation in the calculated results.
3.4. Angular Distribution of Wall-Transmitted Ions
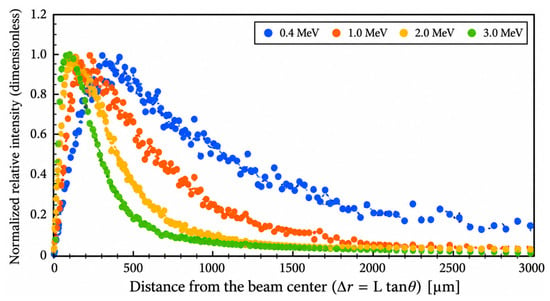
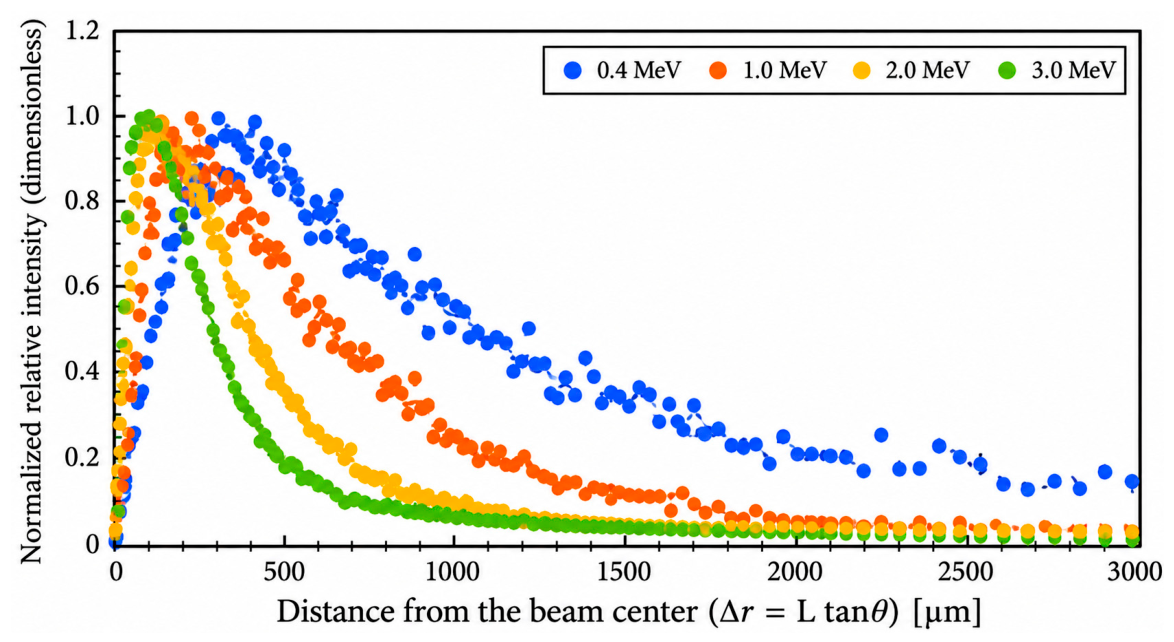
As discussed above, the lateral beam broadening exhibits particularly high sensitivity to the incident beam energy. To further interpret this phenomenon, the underlying mechanism was analyzed from the perspective of particle-pinhole interactions. The theoretical analysis indicates that any parameter capable of significantly modifying the particle exit angle also produces a strong influence on the lateral beam distribution. The effect of the exit angle on the spatial intensity distribution can be understood primarily as geometric lateral expansion during free-space propagation. Using the baseline annular ion-implantation configuration with the central beam excluded, the a-curr output function in PHITS was employed to calculate the angular distribution of particles crossing the pinhole exit plane. Figure 3 shows the angular distributions immediately after ions of different incident energies interacted with the pinhole wall and emerged through the pinhole exit. The angular distributions were calculated using the [T-Cross] tally in PHITS with the a-curr output option. The horizontal axis represents the radial displacement from the beam center corresponding to the particle exit angle, whereas the vertical axis represents the normalized relative intensity. The relative intensity was normalized to its maximum value within the specified range, resulting in a dimensionless quantity. It should be noted that the lateral displacement calculated using △r = Ltanθ represents an equivalent geometric lateral displacement rather than the actual radial position of an ion at the target surface. In principle, the actual transverse position of an ion also depends on its initial position at the pinhole exit. Under a simplified two-dimensional geometric approximation, the lateral displacement can be expressed as r = r0 + Ltanθ. Based on the SRIM simulation results and the pinhole geometry, the maximum initial lateral displacement r0 was estimated to be approximately 0.3950 μm, corresponding to only about 0.08–0.40% of the characteristic lateral broadening range of 100–500 μm. Therefore, the influence of the initial exit position is considered relatively small at these spatial scales.
Figure 3.
Angular distributions of ions immediately after passing through the wall at different beam energies.
The beam emerging after transmission through the pinhole wall exhibits a relatively broad angular distribution. At a pinhole-to-sample distance of 1 mm, the use of a lower incident beam energy allows the large exit angles of Wall-scattered particles to displace them from the central microbeam region toward more distant radial positions, thereby reducing contamination near the beam center. At an incident energy of 0.4 MeV, the particle exit angles are concentrated primarily within the range of 10–30°, with a maximum at approximately 20°. The corresponding lateral displacements at the target surface are therefore approximately 170–580 μm, with a relatively enhanced contribution near 360 μm, rather than in the vicinity of the central microbeam region. To verify this relationship, the radial tally scoring range was extended to 1 cm. The relative area-integrated track-length fluence contribution within each radial interval was then evaluated by multiplying the average particle fluence obtained from the PHITS [T-Track] tally by the corresponding annular area. Since the annular areas corresponding to different radial intervals are not identical, a direct comparison of the flux values in each interval cannot fully reflect their area-integrated contributions. Therefore, to evaluate the relative contribution of each radial interval, the average particle flux in the i-th radial interval was multiplied by the corresponding annular area, as expressed by the following equation:
where Φi represents the average particle flux in the i-th radial interval, with a unit of cm−2/source, and denote the inner and outer radii of the interval, respectively, with a unit of cm, and Ci represents the area-integrated track-length fluence contribution in the i-th radial interval, with a unit of source−1. This area-weighting method enables the comparison of the relative area-integrated track-length fluence contributions of different radial intervals. The calculated quantity represents the track-length-based fluence contribution within each annular region and should not be directly interpreted as the actual number of ions reaching the target surface. Because the spatial flux calculated by PHITS is expressed in units of 1/cm2/source, it is normalized per unit area and per source particle. The annular area must therefore be taken into account when evaluating the area-integrated track-length fluence contribution in each radial interval. The results show that, although the overall intensity decreases with increasing radial distance, a distinct locally enhanced peak remains within the radial range of approximately 100–500 μm. This range is generally consistent with the lateral displacements corresponding to particle exit angles of 10–30°.
To further clarify the relationship between energy loss and angular broadening, we performed an additional energy-angle analysis of Wall-transmitted ions at a fixed incident energy of 0.4 MeV. The exit-angle range was divided into 5° intervals, and the corresponding residual-energy spectra were extracted for each interval. The representative residual energy was calculated as the fluence-weighted mean energy. The results show that the mean residual energy generally decreases with increasing exit angle, from approximately 0.29 MeV at smaller angles to approximately 0.15 MeV at larger angles. Relative to the initial energy of 0.4 MeV, these values correspond to mean energy losses of approximately 0.11 MeV and 0.25 MeV, respectively. This trend indicates that ions emerging at larger angles generally exhibit greater energy loss following interactions with the pinhole wall. This energy-angle relationship also provides further insight into the physical basis for selecting the relatively low incident energy of 0.4 MeV. At this energy, ions interacting with the pinhole wall undergo substantial energy degradation, particularly those emerging at larger exit angles. When considered together with the energy-dependent exit-angle distributions presented in Section 3.4, it is suggested that the combined effects of energy degradation and angular redistribution may contribute to the broader transverse scattering distribution at 0.4 MeV and potentially help explain the reduced near-axis scattering background.
3.5. Evaluation of Spatial Resolution Effects in a Micro-Pinhole System
For the subsequent radial distribution analysis extending to 600 μm, it should be noted that the relatively large statistical uncertainties observed in the halo region at 0.4 MeV mainly occurred in the near-axis scoring analysis using fine radial mesh bins and do not directly represent the statistical precision over a larger radial range. Specifically, the median relative error of 100% reported in Section 3.2 was limited to the nonzero scoring bins within the narrowly defined halo region of 0.7–3 μm, where 51 out of 77 radial bins recorded no particle contributions. This value does not represent the statistical uncertainty of the entire radial distribution. In contrast, the extended analysis in Section 3.5 covers a radial range of 0–600 μm. To further evaluate the statistical reliability of the large-range radial distribution results, the relative errors (err.) reported by the corresponding PHITS [T-Track] tally were examined. The results show that, at an incident energy of 0.4 MeV, the relative errors of the radial mesh bins within 0–600 μm ranged from 0.17% to 0.58%. In particular, the relative errors of the two adjacent radial bins near the experimentally relevant separation distance of 400 μm were 0.49% and 0.53%, respectively. These values are substantially below the commonly used 5% relative-error reference criterion in Monte Carlo particle transport simulations, indicating high statistical precision of the large-range radial fluence distribution within the investigated region. Therefore, the relatively large statistical fluctuations observed in individual near-axis halo bins do not necessarily imply a comparable level of statistical uncertainty in the subsequent large-range radial distribution analysis.
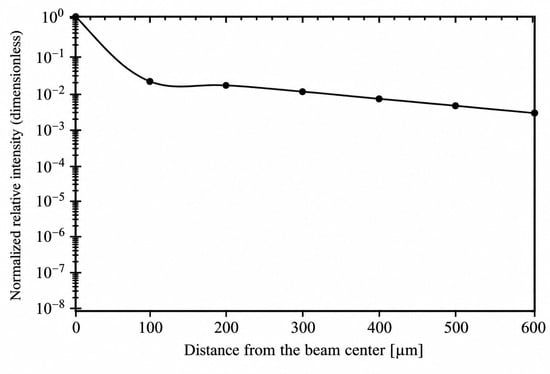
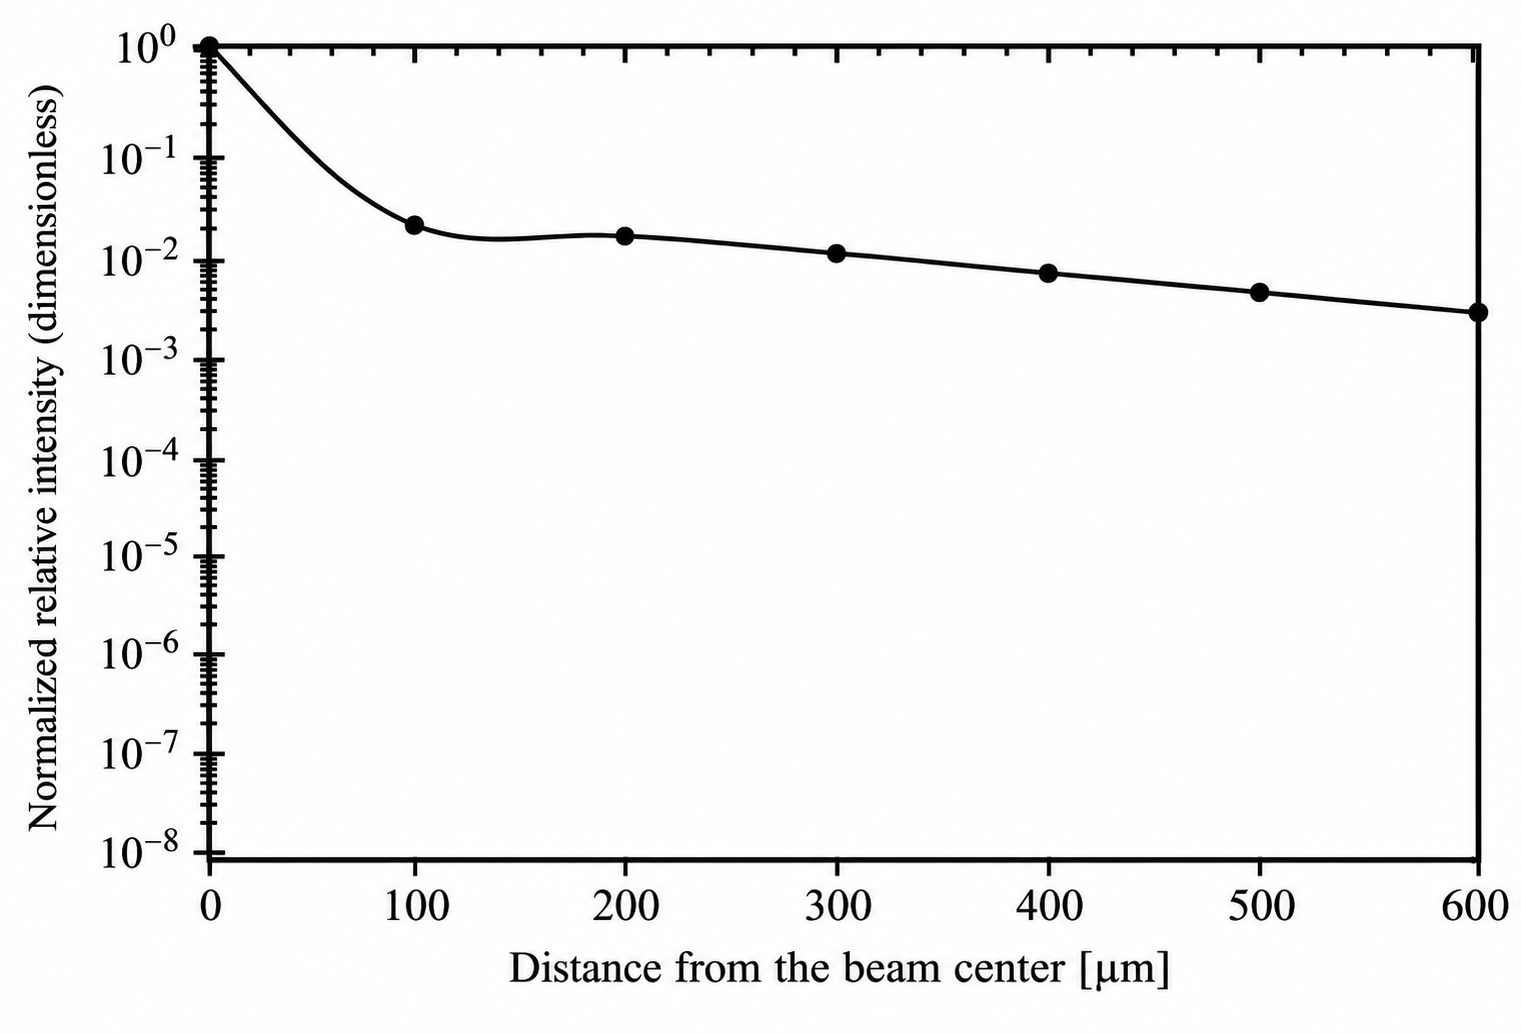
As shown in Figure 4, the R-Z mesh tally in PHITS was used to evaluate the ion-flux distribution at the target surface over a radial range extending to 600 μm, characterizing the variation in particle intensity with radial distance from the beam center. The horizontal axis represents the radial distance from the beam center over a range of 0–600 μm, while the vertical axis represents the normalized relative intensity. The calculated relative intensity was normalized by its maximum value within the specified radial range, resulting in a dimensionless quantity. Although weak off-axis components produced by ions transmitted through or scattered from the pinhole wall remain outside the central region, their influence on spatial selectivity depends on whether their intensity exceeds the experimental detection threshold. Only off-axis components above this threshold contribute to a measurable background signal and thereby reduce the effective spatial selectivity.
Figure 4.
Relationship between distance from the beam center and intensity.
The calculated local ion flux decreases rapidly within approximately 100 μm of the beam center, followed by a slowly decaying long-range tail. No distinct transport threshold is observed at 400 μm; however, the local scattered-ion flux at this distance is already reduced to approximately 8.07 × 10⁻³ of that in the core region, indicating a relatively low background contribution from the halo. The value of approximately 8.07 × 10⁻³ was obtained from the normalized radial ion-flux distribution. Specifically, all radial flux values were normalized by the maximum local flux within the core region, according to the following equation:
where represents the maximum local ion flux among all radial scoring bins within the core region. Therefore, the normalized flux of approximately 8.07 × 10⁻³ at a radial distance of 400 μm indicates that the local scattered-ion flux at this position is approximately 0.807% of the reference maximum flux in the core region. It should be noted that the local ion flux and the area-integrated track-length fluence contribution over a finite radial region represent different physical quantities. The local ion flux characterizes the particle flux within a specified radial scoring bin, whereas the integrated particle contribution is obtained by accounting for the corresponding radial area over a defined region. Therefore, the separation distance of more than 400 μm adopted in the reference experiment is more appropriately interpreted as a conservative experimental measure for suppressing the scattered-ion background, rather than as a uniquely defined physical threshold. This interpretation is consistent with the experimentally observed low PL(Photoluminescence) background beyond 400 μm in the reference study. It should be emphasized that the normalized local scattered-ion flux of approximately 8.07 × 10⁻³ at 400 μm represents the relative flux intensity at this specific radial position, rather than the integrated particle contribution over the entire peripheral region. Although the integrated contribution over a large radial area may remain non-negligible, the scattered-ion background affecting an individual, spatially localized implantation site is more directly related to the local ion flux and the effective area of that site. Therefore, the relatively low local scattered-ion flux at 400 μm provides a physical explanation, from the perspective of ion transport, for the larger spatial separation adopted in the reference experiment. However, this flux ratio should not be directly interpreted as an equivalent reduction in the experimentally observed photoluminescence (PL) background, since the PL signal also depends on SiV-center formation and optical detection conditions. The reduced local halo background may help suppress unwanted off-axis irradiation, thereby providing useful physical insight into the spatial selectivity of pinhole-assisted SiV-center implantation [26,27,28,29,30].
4. Conclusions
This study investigated 28Si ions in a representative 1 μm tapered-pinhole system. A PHITS-based model was developed to simulate ion transport through the microscale pinhole structure. The formation mechanism and lateral broadening characteristics of the pinhole-generated ion microbeam were analyzed in terms of particle transport trajectories, radial intensity distributions at the target surface, the effects of key parameters, and the exit-angle distributions of ions scattered by the pinhole wall.
- After interaction with the pinhole, the incident ions can be classified into four categories: Direct, Wall-scattered, Lost-reflect, and Lost-stop. The vast majority of incident ions eventually stop within the pinhole-wall material, whereas the microbeam is formed only by Direct and Wall-scattered ions, which account for 0.02% and 0.03% of the total incident ions, respectively. These results demonstrate that the overall transmission efficiency of the micrometer-scale pinhole system is relatively low.
- The ions forming the transmitted microbeam are predominantly concentrated in the central core region. When normalized to the total number of incident source particles, the core component (0–0.5 μm) accounts for approximately 0.0504%, whereas the combined halo and transition components (0.5–3.0 μm) account for approximately 0.000392%. These results indicate that, although a pinhole-generated microbeam inevitably contains a halo component arising from wall scattering, the transmitted beam remains quantitatively dominated by the core component.
- The central core region is only weakly affected by variations in the investigated system parameters, whereas the transition region between the core and halo is more sensitive to such variations. Among the examined parameters, beam energy has the most pronounced effect on the beam intensity in the transition region. When the incident energy is increased from 0.4 MeV to 1–3 MeV, the normalized sensitivity coefficient of the transition-region intensity reaches 10.12–45.83%, which is substantially greater than the effects of the pinhole-wall angle, pinhole material, beam divergence angle, and pinhole-sample distance. These results demonstrate that beam energy is a key parameter governing the transverse broadening of the microbeam.
- The emission-angle distribution of wall-scattered ions provides a physical explanation for their off-axis transport under low-energy conditions. At a beam energy of 0.4 MeV, the emission angles of Wall-scattered ions are mainly distributed between 10° and 30°, with a peak at approximately 20°. For a pinhole-sample distance of 1 mm, this angular range corresponds to a transverse displacement of approximately 170–580 μm, which is broadly consistent with the local enhancement in the area-integrated track-length fluence contribution observed within the radial range of approximately 100–500 μm. This result indicates that low-energy ions interacting with the pinhole wall can be transported to remote off-axis regions because of their relatively large emission angles, thereby reducing the scattered-ion background near the central microbeam. Furthermore, the energy-angle correlation analysis revealed that, at an incident energy of 0.4 MeV, the average residual energy of Wall-transmitted ions generally decreased with increasing exit angle, from approximately 0.29 MeV at smaller exit angles to approximately 0.15 MeV at larger exit angles. This result indicates that larger angular deflections are generally associated with more significant energy losses during ion interactions with the pinhole wall. Combined with the exit-angle distributions obtained at different incident energies, these findings suggest that substantial energy loss and angular redistribution jointly influence the subsequent transport of wall-scattered ions, causing some particles to propagate farther away from the beam axis.
- The local flux of scattered ions decreases rapidly within approximately 100 μm of the beam center, followed by a slowly decaying long-range tail. No distinct transport threshold is observed at 400 μm; however, the local flux at this distance is reduced to approximately 8.07 × 10⁻³ of that in the core region. These quantitative results indicate that the separation distance of more than 400 μm adopted in the reference experiment is more appropriately interpreted as a conservative safety margin that balances the suppression of scattering-induced background with experimental positioning, rather than as a unique physical threshold.
Overall, the present results provide a quantitative interpretation of the ion-transport behavior underlying the reference ion-implantation experiment and clarify its implications for the spatially localized fabrication of color centers in diamond. These results support the experimental strategy adopted in the reference study and indicate that appropriate control of the beam energy, pinhole geometry, and pinhole-sample distance can effectively confine the implantation region while suppressing unwanted off-axis irradiation. Therefore, the present particle-transport analysis provides a physical and quantitative basis for understanding and optimizing pinhole-assisted ion implantation, with potential implications for improving the spatial selectivity of localized SiV-center fabrication in diamond.
Author Contributions
Conceptualization, Y.W. and N.H.; methodology, N.H.; software, Y.W.; validation, Y.W. and N.H.; formal analysis, Y.W.; investigation, Y.W.; resources, N.H.; data curation, Y.W.; writing—original draft preparation, Y.W.; writing—review and editing, N.H.; visualization, Y.W.; supervision, N.H.; project administration, N.H.; funding acquisition, N.H. All authors have read and agreed to the published version of the manuscript.
Funding
The APC was funded by Tokyo City University.
Institutional Review Board Statement
Not applicable.
Informed Consent Statement
Not applicable.
Data Availability Statement
The data presented in this study are available on request from the corresponding author.
Acknowledgments
During the preparation of this manuscript, the authors used ChatGPT-6 (OpenAI) for language editing and improvement of English expression. The authors have reviewed and edited the output and take full responsibility for the content of this publication.
Conflicts of Interest
The authors declare no conflicts of interest. The funders had no role in the design of the study; in the collection, analysis, or interpretation of data; in the writing of the manuscript; or in the decision to publish the results.
Abbreviations
The following abbreviations are used in this manuscript:
| PHITS | Particle and Heavy Ion Transport Code System |
| SiV | Silicon-vacancy center |
| PL | Photoluminescence |
| SRIM | Stopping and Range of Ions in Matter |
References
- Oikawa, M.; Satoh, T.; Sakai, T.; Miyawaki, N.; Kashiwagi, H.; Kurashima, S.; Okumura, S.; Fukuda, M.; Yokota, W.; Kamiya, T. Focusing high-energy heavy ion microbeam system at the JAEA AVF cyclotron. Nucl. Instrum. Methods Phys. Res. B 2007, 260, 85–90. [Google Scholar] [CrossRef] [Scilit]
- Gerardi, S. Ionizing Radiation Microbeam Facilities for Radiobiological Studies in Europe. J. Radiat. Res. 2009, 50, A13–A20. [Google Scholar] [CrossRef] [Scilit]
- Funayama, T. Heavy-Ion Microbeams for Biological Science: Development of System and Utilization for Biological Experiments in QST-Takasaki. Quantum Beam Sci. 2019, 3, 13. [Google Scholar] [CrossRef] [Scilit]
- Nebiki, T.; Yamamoto, T.; Narusawa, T.; Breese, M.B.H.; Teo, E.J.; Watt, F. Focusing of MeV ion beams by means of tapered glass capillary optics. J. Vac. Sci. Technol. A 2003, 21, 1671–1674. [Google Scholar] [CrossRef] [Scilit]
- Ikeda, T.; Kanai, Y.; Kojima, T.M.; Iwai, Y.; Kambara, T.; Yamazaki, Y.; Hoshino, M.; Nebiki, T.; Narusawa, T. Production of a microbeam of slow highly charged ions with a tapered glass capillary. Appl. Phys. Lett. 2006, 89, 163502. [Google Scholar] [CrossRef] [Scilit]
- Ikeda, T. Applications of Microbeams Produced by Tapered Glass Capillary Optics. Quantum Beam Sci. 2020, 4, 22. [Google Scholar] [CrossRef] [Scilit]
- Meijer, J.; Burchard, B.; Domhan, M.; Wittmann, C.; Gaebel, T.; Popa, I.; Jelezko, F.; Wrachtrup, J. Generation of single color centers by focused nitrogen implantation. Appl. Phys. Lett. 2005, 87, 261909. [Google Scholar] [CrossRef] [Scilit]
- Toyli, D.M.; Weis, C.D.; Fuchs, G.D.; Schenkel, T.; Awschalom, D.D. Chip-Scale Nanofabrication of Single Spins and Spin Arrays in Diamond. Nano Lett. 2010, 10, 3168–3172. [Google Scholar] [CrossRef] [Scilit]
- Spinicelli, P.; Dréau, A.; Rondin, L.; Silva, F.; Achard, J.; Xavier, S.; Bansropun, S.; Debuisschert, T.; Pezzagna, S.; Meijer, J.; et al. Engineered arrays of nitrogen-vacancy color centers in diamond based on implantation of CN− molecules through nanoapertures. New J. Phys. 2011, 13, 025014. [Google Scholar] [CrossRef] [Scilit]
- Schukraft, M.; Zheng, J.; Schröder, T.; Mouradian, S.L.; Walsh, M.; Trusheim, M.E.; Bakhru, H.; Englund, D.R. Invited Article: Precision nanoimplantation of nitrogen vacancy centers into diamond photonic crystal cavities and waveguides. APL Photonics 2016, 1, 020801. [Google Scholar] [CrossRef] [Scilit]
- Schröder, T.; Trusheim, M.E.; Walsh, M.; Li, L.; Zheng, J.; Schukraft, M.; Sipahigil, A.; Evans, R.E.; Sukachev, D.D.; Nguyen, C.T.; et al. Scalable focused ion beam creation of nearly lifetime-limited single quantum emitters in diamond nanostructures. Nat. Commun. 2017, 8, 15376. [Google Scholar] [CrossRef] [Scilit]
- Bayn, I.; Chen, E.H.; Trusheim, M.E.; Li, L.; Schröder, T.; Gaathon, O.; Lu, M.; Stein, A.; Liu, M.; Kisslinger, K.; et al. Generation of Ensembles of Individually Resolvable Nitrogen Vacancies Using Nanometer-Scale Apertures in Ultrahigh-Aspect Ratio Planar Implantation Masks. Nano Lett. 2015, 15, 1751–1758. [Google Scholar] [CrossRef] [Scilit]
- Pezzagna, S.; Wildanger, D.; Mazarov, P.; Wieck, A.D.; Sarov, Y.; Rangelow, I.; Naydenov, B.; Jelezko, F.; Hell, S.W.; Meijer, J. Nanoscale Engineering and Optical Addressing of Single Spins in Diamond. Small 2010, 6, 2117–2121. [Google Scholar] [CrossRef] [Scilit]
- Alves, A.D.C.; Newnham, J.; A van Donkelaar, J.; Rubanov, S.; McCallum, J.C.; Jamieson, D.N. Controlled deterministic implantation by nanostencil lithography at the limit of ion-aperture straggling. Nanotechnology 2013, 24, 145304. [Google Scholar] [CrossRef] [Scilit]
- Hunold, L.; Lagomarsino, S.; Flatae, A.M.; Kambalathmana, H.; Sledz, F.; Sciortino, S.; Gelli, N.; Giuntini, L.; Agio, M. Scalable Creation of Deep Silicon-Vacancy Color Centers in Diamond by Ion Implantation through a 1-μm Pinhole. Adv. Quantum Technol. 2021, 4, 2100079. [Google Scholar] [CrossRef] [Scilit]
- van Donkelaar, J.; Yang, C.; Alves, A.D.C.; McCallum, J.C.; Hougaard, C.; Johnson, B.C.; E Hudson, F.; Dzurak, A.S.; Morello, A.; Spemann, D.; et al. Single atom devices by ion implantation. J. Phys. Condens. Matter 2015, 27, 154204. [Google Scholar] [CrossRef] [Scilit]
- Lagomarsino, S.; Flatae, A.M.; Kambalathmana, H.; Sledz, F.; Hunold, L.; Soltani, N.; Reuschel, P.; Sciortino, S.; Gelli, N.; Massi, M.; et al. Creation of Silicon-Vacancy Color Centers in Diamond by Ion Implantation. Front. Phys. 2021, 8, 601362. [Google Scholar] [CrossRef] [Scilit]
- Sipahigil, A.; Evans, R.E.; Sukachev, D.D.; Burek, M.J.; Borregaard, J.; Bhaskar, M.K.; Nguyen, C.T.; Pacheco, J.L.; Atikian, H.A.; Meuwly, C.; et al. An integrated diamond nanophotonics platform for quantum-optical networks. Science 2016, 354, 847–850. [Google Scholar] [CrossRef] [Scilit]
- Evans, R.E.; Sipahigil, A.; Sukachev, D.D.; Zibrov, A.S.; Lukin, M.D. Narrow-Linewidth Homogeneous Optical Emitters in Diamond Nanostructures via Silicon Ion Implantation. Phys. Rev. Appl. 2016, 5, 044010. [Google Scholar] [CrossRef] [Scilit]
- Lagomarsino, S.; Sciortino, S.; Gelli, N.; Flatae, A.M.; Gorelli, F.; Santoro, M.; Chiari, M.; Czelusniac, C.; Massi, M.; Taccetti, F.; et al. The center for production of single-photon emitters at the electrostatic-deflector line of the Tandem accelerator of LABEC (Florence). Nucl. Instrum. Methods Phys. Res. B 2018, 422, 31–40. [Google Scholar] [CrossRef] [Scilit]
- Sato, T.; Iwamoto, Y.; Hashimoto, S.; Ogawa, T.; Furuta, T.; Abe, S.-I.; Kai, T.; Tsai, P.-E.; Matsuda, N.; Iwase, H.; et al. Features of Particle and Heavy Ion Transport code System (PHITS) version 3.02. J. Nucl. Sci. Technol. 2018, 55, 684–690. [Google Scholar] [CrossRef] [Scilit]
- Sato, T.; Iwamoto, Y.; Hashimoto, S.; Ogawa, T.; Furuta, T.; Abe, S.-I.; Kai, T.; Matsuya, Y.; Matsuda, N.; Hirata, Y.; et al. Recent improvements of the particle and heavy ion transport code system—PHITS version 3.33. J. Nucl. Sci. Technol. 2024, 61, 127–135. [Google Scholar] [CrossRef] [Scilit]
- Ziegler, J.F.; Ziegler, M.D.; Biersack, J.P. SRIM—The stopping and range of ions in matter (2010). Nucl. Instrum. Methods Phys. Res. B 2010, 268, 1818–1823. [Google Scholar] [CrossRef] [Scilit]
- Biersack, J.P.; Haggmark, L.G. A Monte Carlo computer program for the transport of energetic ions in amorphous targets. Nucl. Instrum. Methods 1980, 174, 257–269. [Google Scholar] [CrossRef] [Scilit]
- Saltelli, A.; Annoni, P. How to avoid a perfunctory sensitivity analysis. Environ. Model. Softw. 2010, 25, 1508–1517. [Google Scholar] [CrossRef] [Scilit]
- Rabeau, J.R.; Reichart, P.; Tamanyan, G.; Jamieson, D.N.; Prawer, S.; Jelezko, F.; Gaebel, T.; Popa, I.; Domhan, M.; Wrachtrup, J. Implantation of labelled single nitrogen vacancy centers in diamond using 15N. Appl. Phys. Lett. 2006, 88, 023113. [Google Scholar] [CrossRef] [Scilit]
- Pezzagna, S.; Naydenov, B.; Jelezko, F.; Wrachtrup, J.; Meijer, J. Creation efficiency of nitrogen-vacancy centres in diamond. New J. Phys. 2010, 12, 065017. [Google Scholar] [CrossRef] [Scilit]
- Neu, E.; Agio, M.; Becher, C. Photophysics of single silicon vacancy centers in diamond: Implications for single photon emission. Opt. Express 2012, 20, 19956–19971. [Google Scholar] [CrossRef] [Scilit]
- Drobny, J.T.; Curreli, D. RustBCA: A High-Performance Binary-Collision-Approximation Code for Ion-Material Interactions. J. Open Source Softw. 2021, 6, 3298. [Google Scholar] [CrossRef] [Scilit]
- Drobny, J.; Hayes, A.; Curreli, D.; Ruzic, D.N. F-TRIDYN: A Binary Collision Approximation code for simulating ion interactions with rough surfaces. J. Nucl. Mater. 2017, 494, 278–283. [Google Scholar] [CrossRef] [Scilit]

Disclaimer/Publisher’s Note: The statements, opinions and data contained in all publications are solely those of the individual author(s) and contributor(s) and not of MDPI and/or the editor(s). MDPI and/or the editor(s) disclaim responsibility for any injury to people or property resulting from any ideas, methods, instructions or products referred to in the content. |
© 2026 by the authors. Licensee MDPI, Basel, Switzerland. This article is an open access article distributed under the terms and conditions of the Creative Commons Attribution (CC BY) license.