


Abstract
Atlantic salmon aquaculture faces persistent welfare challenges from handling, confinement, disease, and delousing, yet established welfare indicators typically require capture or invasive sampling and signal problems only after they have developed. Melanin-based pigmentation in salmonids is associated with stress responsiveness, but quantitative methods for measuring stress-associated fading of individual spots are lacking, and longitudinal photometry in live fish is vulnerable to between-session drift in illumination and camera settings. We present a computer vision framework for quantifying the appearance of melanin-based opercular spots in Atlantic salmon before and after an 18 h confinement challenge (21 fish, 42 opercula; 8 reference fish). Opercular regions were detected with YOLOv8, registered by projective transformation, and spots segmented with a fine-tuned SAM 2.1 model (Dice 0.895 ± 0.064, against 0.798 ± 0.173 and 0.778 ± 0.195 for intensity-thresholding baselines). Images were linearized through the inverse sRGB transfer function and corrected by a two-point affine transform anchored on the eye and an in-frame identification tag, a procedure that cancels both the multiplicative and the additive components of the camera response while preserving linearity. At the level of the individual fish, confinement was associated with an increase in the skin-referenced log-ratio between spot and surrounding skin (change +0.366, 95% CI [0.291, 0.440], dz = 2.24, p < 0.001), with increases in spot and background luminance, and with a 10.6% reduction in segmented spot area. Spots lightened proportionally more than adjacent skin (a factor of 1.91 versus 1.36, p < 0.001), indicating a response localized to pigmented tissue rather than a generalized change in opercular luminance. Results were confirmed by non-parametric tests, by a cluster bootstrap resampling fish, and by mixed-effects models with fish as a random intercept. Because reference fish were imaged at a single timepoint and at a different working distance, no inference is drawn from that comparison. Pre- and post-confinement images were acquired under different anesthetic protocols, so anesthetic depth cannot be separated from the treatment, and physiological validation remains required before opercular spot fading can be established as a stress biomarker. The framework nonetheless provides a photometrically controlled basis for studying pigmentation dynamics in aquaculture under stressful conditions.
1. Introduction
The aquaculture industry is currently challenged by extraordinarily high Atlantic salmon mortality, which has intensified the search for new welfare indicators and management practices capable of reducing these losses. In 2024, 45.8 million salmon were reported to have died during land-based hatchery production, and a further 57.8 million during the marine phase, largely from injuries sustained during delousing, complex gill disease, and winter ulcers [1]. Salmon aquaculture is frequently characterized by adverse conditions, including disease outbreaks and routine management procedures such as delousing and handling [2,3,4]. Growing recognition of how these stressors affect fish welfare has stimulated considerable scholarly interest in advanced methodologies for assessing welfare across diverse production systems [5,6].
Operational welfare indicators for farmed Atlantic salmon are well established [7], but the most informative of them share two limitations. Physiological indicators such as plasma cortisol require capture, restraint and blood sampling, procedures that themselves elicit a stress response, and which can therefore be applied only to a small subset of animals at discrete timepoints [8,9]. Morphological indicators such as fin damage, scale loss and ulceration are non-invasive, but they register damage only after it has occurred. Neither class supports continuous, individual-level monitoring of physiological state. As the industry expands, more sophisticated technologies are required to monitor fish farms in line with the precision livestock farming concept [10]. One under-researched avenue is the assessment of visual traits using artificial intelligence [11,12], and in particular of melanin-based spots on the salmon body [13,14,15].
The bodies of Atlantic salmon are covered with black spots formed by aggregations of chromatophores, principally melanophores, which produce and store melanin. Melanin is primarily a light-absorbing pigment that serves diverse ecological functions in vertebrates, including photoprotection, camouflage and communication [16,17,18,19,20,21]. Its functions in fish are likely equally diverse but have been studied less extensively. Nevertheless, previous work indicates that the number of melanin spots on salmonid fish carries information about individual physiology and behavior. In strains of Atlantic salmon (Salmo salar) and rainbow trout (Oncorhynchus mykiss), individuals with more spots exhibited a reduced cortisol response to stress, recovered feed intake more rapidly after transfer to a novel environment, and harbored fewer female egg-bearing ectoparasites such as sea lice [22,23,24].
Melanin signaling may therefore serve as a non-invasive indicator of stress and welfare in Atlantic salmon, and two endocrine pathways provide a mechanistic basis for stress-induced fading. The first involves melanin-concentrating hormone (MCH). MCH does not bind the Gs-protein-coupled melanocortin receptors (MC1–MC5), among which MC1 primarily regulates pigmentation [25]; instead, it binds selectively to the Gi-protein-coupled receptor MCH-R1 [26,27]. Receptor binding inhibits adenylyl cyclase and thereby suppresses the conversion of adenosine triphosphate (ATP) to cyclic adenosine monophosphate (cAMP) [28,29]. Reduced cAMP causes melanosomes to aggregate toward the center of the melanophore rather than disperse throughout its dendrites, exposing the underlying iridophores and causing the skin to appear paler. This mechanism operates over seconds to minutes and is readily reversible [30].
The second pathway involves agouti signaling protein (ASP), an antagonist of alpha-melanocyte-stimulating hormone (α-MSH), the hormone that normally promotes melanosome dispersion [31,32]. Under stressful conditions, elevated plasma cortisol increases ASP expression [22,32,33]. Binding of ASP to MC1 receptors prevents activation of adenylyl cyclase and halts cAMP production, again reducing melanosome dispersion. Unlike MCH-mediated translocation, ASP acts transcriptionally and therefore over hours to days [34]. The two pathways make partially distinguishable predictions: rapid melanosome aggregation should alter spot intensity while leaving spot boundaries largely intact, whereas sustained suppression of melanin dispersion should also erode spot margins.
Testing these predictions requires measuring the appearance of the same spots, on the same fish, at more than one timepoint and this is where the principal methodological obstacle lies. Photometric measurement of individual animals is acutely sensitive to image acquisition. Between-session differences in illumination, camera exposure, viewing geometry and working distance produce changes in recorded pixel intensity that are, in the resulting images, indistinguishable from genuine changes in pigmentation. A camera operating in automatic exposure mode varies its settings from frame to frame in response to scene composition, and consumer image formats apply a non-linear transfer function that renders pixel values non-proportional to scene radiance. The study of animal coloration has long recognized this problem and addressed it through calibrated photography [35,36], but such calibration has not been applied to melanin spot quantification in salmonids. Without it, a reported reduction in spot contrast cannot be confidently attributed to the animal rather than to the instrument.
In our previous studies [37,38], we presented a pipeline for detecting, registering and segmenting melanin-based opercular spots, and reported as proof of principle that spot grayscale intensity shifts toward pigmentation fading following a confinement episode. Gunnes et al. [37] further associated the quantified fading with regional variation in serotonin transmission in Atlantic salmon. Both studies were framed as demonstrations that image-based methods can detect temporal change in opercular spots, rather than as quantifications of the effect, and neither examined image acquisition as a source of that change. The photographs were taken with a consumer camera in automatic exposure mode, in a booth open at the front to ambient daylight, and the resulting exposure settings varied by up to 2.7 stops between paired images of the same individual, variation that alters recorded pixel intensity independently of pigmentation and that is not removed by geometric registration or spatial illumination correction.
The present study addresses this directly. We introduce a photometric normalization procedure that linearizes images through the inverse sRGB transfer function and then applies a two-point affine correction anchored on reference regions present in every frame, and we extend the descriptor set beyond spot intensity to local background luminance, the skin-referenced log-ratio between spot and surrounding skin, Weber contrast, and spot area. This allows the effect to be reported as an estimate with confidence intervals at the level of the individual fish, rather than as a demonstration of detectability.
On this basis, we hypothesized that confinement stress produces measurable, spot-specific fading that can be distinguished from variation introduced during image acquisition.
The contributions of this work are as follows:
- -
- A photometric normalization procedure for longitudinal fish imaging. Images are linearized through the inverse sRGB transfer function and corrected by a two-point affine transform anchored on the eye and an in-frame identification tag. Because both anchors are measured in linear light, the correction cancels both the multiplicative and the additive components of the camera response while preserving linearity end to end. In the present dataset, this addressed sensor exposure differences of up to 2.7 stops between paired images of the same individual, together with the variable additive contribution of ambient light entering the imaging booth.
- -
- A per-spot feature set that operationalizes fading as a measurable quantity. Spot luminance, local background luminance, the skin-referenced log-ratio, Weber contrast and spot area are extracted for each individually matched spot in linear light, replacing qualitative assessment of pigmentation change with quantities that can be compared across sessions. Because the log-ratio and Weber contrast are ratios, they are invariant to any per-image multiplicative factor, and one of them is designated the primary outcome on that basis.
- -
- A fish-level statistical framework. Opercular values are averaged within each individual so that the fish, not the operculum, is the unit of analysis, and effects are reported with confidence intervals obtained both parametrically and by cluster bootstrap resampling fish. Mixed-effects models with fish as a random intercept and operculum-level sensitivity analyses are reported alongside, so that no conclusion rests on treating the two opercula of an animal as independent observations.
- -
- A quantitative test of whether opercular spot responds to confinement. Twenty-one Atlantic salmon were imaged before and after an 18 h confinement challenge, with plasma cortisol confirming the physiological response; eight reference fish were imaged once as a reference group.
- -
- An open-source implementation, including model weights and per-image acquisition metadata, enabling replication on independent stocks and facilities.
2. Related Work
2.1. Computer Vision Applied to Melanin Spots in Salmonids
Work applying computer vision to melanin spots in Atlantic salmon has concentrated almost entirely on melanized discoloration in the fillet rather than on the skin of live fish [39,40]. This emphasis follows from the commercial context. Melanin spots in fillets are a downgrading defect with direct economic consequence, and the imaging conditions on a processing line are controlled and repeatable: a stationary subject, fixed working distance, and uniform illumination. Broader reviews of machine vision in aquaculture report the same pattern, documenting extensive application to biomass estimation, species identification and quality grading, but comparatively little to pigmentation on living animals [41]. The consequence is that the existing literature measures pigmentation at a single terminal timepoint, post mortem, and at the level of the whole fillet. It offers no basis for tracking an individual spot on a living fish over time, which is the measurement a welfare indicator requires.
2.2. Deep Learning for Fish Monitoring, Disease Detection and Re-Identification
A second and larger body of work applies detection and classification models to monitoring tasks in aquaculture. Ahmed et al. [42] combined image processing, hand-crafted feature engineering and classical machine learning to identify disease-infected salmon, and Gupta et al. [43] trained a convolutional neural network to classify wounds and lice infestation under varying lighting conditions. Object detectors have been applied widely to counting and surveillance: Banno et al. [44] used YOLOv4 to count wild fish around sea cages, Yu et al. [45] modified the YOLOv5 architecture for lateral line detection, and Ranjan et al. [46] combined YOLOv7 with edge computing and IoT infrastructure for real-time mortality monitoring in tanks.
Most relevant to the present work is the re-identification literature, which establishes the premise on which our design depends. Cisar et al. [47] re-identified individual salmon across images acquired on different dates, using a convolutional neural network for short-term identification and histogram-of-oriented-gradient features for long-term identification. Bekkozhayeva et al. [48] achieved comparable performance using body scale patterns. Zhou et al. [49] re-identified brook trout through a four-stage pipeline: region-of-interest extraction with Faster R-CNN, foreground and pigmentation-pattern extraction by morphological and spectral filtering, feature encoding with a deep residual network, and matching by cosine similarity.
The significance of these studies for the present work is that they demonstrate melanin spot patterns to be individually distinctive and temporally stable, stable enough to serve as a biometric key across months. We exploit that stability differently. Rather than using the pattern to establish identity, we treat each matched spot as a repeated measure and ask whether its appearance changes. This distinction carries a methodological consequence that is easily overlooked. Re-identification is largely invariant to photometric variation, because the identity signal resides in spot geometry and topology rather than in absolute intensity; a re-identification pipeline will succeed on images that differ substantially in exposure and illumination. The demonstrated success of these methods therefore provides no assurance that intensity measurements extracted from the same images are comparable across sessions. Photometric measurement imposes requirements that re-identification does not.
2.3. Calibrated Photography for Quantitative Color Measurement
Quantitative measurement of animal coloration from digital photographs is a mature methodology with a well-developed treatment of precisely the problems that arise here. Stevens et al. [35] set out step-by-step guidelines for obtaining accurate data from digital cameras, observing that many studies employing digital photography are unaware of critical acquisition issues, particularly the non-linearity of camera response to light intensity. Their procedure requires linearizing the camera response, equalizing color channels against reflectance standards, and mapping camera color space to a target space. Akkaynak et al. [50] formalized the processing chain for commercial off-the-shelf cameras and demonstrated applications across biomedical engineering, artwork photography, marine biology and underwater imaging; they state the precondition explicitly, namely that such cameras yield quantitative data only if images are captured in raw format and processed so as to preserve a linear relationship with scene radiance. Troscianko and Stevens [36] implemented these steps in a freely available toolbox that generates radiance-linear images from the raw files of numerous camera brands, normalizes them against in-frame grey standards, and additionally requires that images be rescaled to a common number of pixels per unit length before patterns are compared across photographs. These methods define the standard for quantitative color measurement, and they share two preconditions that are difficult to satisfy in an aquaculture setting: first, they require raw sensor data; second, they require a physical reflectance standard within the frame of every photograph.
Imaging in a research or production facility is performed on wet, mobile animals under time pressure, frequently with a rugged compact camera operating in automatic exposure mode and writing only compressed output. Under these conditions the camera selects its own exposure in response to scene composition, and the in-camera pipeline applies a non-linear transfer function and tone curve before the file is written [51], so that recorded pixel values bear no fixed relationship to scene radiance. Neither precondition can be satisfied retrospectively. Existing image archives, including our own, therefore fall outside the scope of these established methods, and the pigmentation literature in salmonids has consequently proceeded without photometric control of any kind.
The present study addresses this gap by substituting an analytically recoverable radiometric reference for a physical one. Exposure metadata recorded in the EXIF header of every consumer image file—shutter speed, aperture and sensitivity—fully determines the sensor exposure applied to the scene. Inverting the standard sRGB transfer function and dividing by this exposure factor places images acquired under automatic exposure onto a common relative radiometric scale, without raw data and without a calibration target. Applied to the present dataset, this procedure removed exposure differences of up to 2.7 stops between paired images of the same individual.
We regard this as complementary to calibrated photography rather than a replacement for it. The procedure recovers relative exposure, not absolute reflectance, and cannot correct for changes in scene illumination, in spectral composition, or in camera-specific tone curves that depart from the sRGB standard. Two safeguards follow from this limitation. Residual per-image exposure differences are carried into the statistical models as covariates, so that reported effects estimate the change expected at zero exposure difference. Additionally, following the image-scaling requirement identified by Troscianko and Stevens [36], between-group comparisons are restricted to features invariant to image scale, since our reference-group images were acquired at a different working distance.
2.4. Positioning
Our methodology draws on the fish detection and re-identification literature, employing an object detector for opercular region localization and a promptable transformer-based segmentation model for spot delineation within the detected regions [38,52]. It departs from that literature in what it measures, and in how the validity of the measurement is established. Where prior work on salmonid melanin spots measures pigmentation post mortem in the fillet, we measure it on whole fish, in situ on the operculum. Where re-identification work treats spot patterns as a stable identity signal, we treat individual spots as repeated measures of a changing physiological state. Additionally, where both bodies of work take image intensity at face value, we make the recovery of comparable intensity across imaging sessions an explicit component of the method. The present study differs from our own previous work [38] in the domain in which the correction is applied rather than in the choice of reference regions: the same in-frame eye and ID-tag anchors are used, but the correction is an affine map on linearized values rather than a correction of the CIELAB luminance channel. Because the map is affine on a radiance-proportional scale, it cancels both the multiplicative and the additive components of the camera response, and all descriptors are subsequently computed in linear light. Table 1 summarizes this positioning.
Table 1.
Positioning of the present study relative to prior work on melanin spot quantification and fish re-identification.
The objective of this study is to quantify fading in melanin-based opercular spots in Atlantic salmon from photometrically normalized images, and to evaluate whether such fading constitutes a candidate non-invasive indicator of stress and welfare.
3. Materials and Methods
The methodology consists of a photometrically normalized pipeline for quantifying individual melanin-based opercular spots in Atlantic salmon images acquired before and after a standardized stressor. Opercular regions were first detected using a YOLOv8 detector [53] and subsequently cropped. The resulting crops were linearized using the inverse sRGB transfer function and corrected by a two-point affine transform anchored on the eye and an in-frame identification tag, which removes both the multiplicative and the additive components of the camera response while preserving linearity. Corresponding opercula from the two imaging sessions were matched through projective registration. Individual spots within the registered opercula were subsequently detected and matched across sessions, and fine-grained spot masks were generated using a box-prompted, fine-tuned Segment Anything Model 2.1 [54]. Finally, photometric and morphological features were extracted from the spot masks in linear light, with pixels averaged within each mask before any ratio was formed. The complete pipeline is illustrated in Figure 1. The imaging dataset, confinement protocol, and trained models are shared with our previous studies [37,38]; the two-point photometric normalization procedure, the descriptor set, the fish-level statistical framework, and all results presented here are new.
Figure 1.
Quantification of fading in melanin-based skin spots under stress in Atlantic salmon (Salmo salar) methodology pipeline.
3.1. Dataset
The dataset was the same as described in our previous study [38] and was collected at the Institute of Marine Research (IMR), Matre Research Centre, Norway. It included images of 130 Atlantic salmon, approximately 2.2 years of mean age and weighing 2–10 kg, photographed using an Olympus TG-6 camera (Olympus Corporation, Tokyo, Japan) with automatic camera settings against a blue background. All fish were netted from the holding tank and anesthetized before photography. Reference fish (n = 8) and fish photographed after confinement received a lethal dose of MS-222, whereas the pre-confinement images were acquired under sedation. Fish were photographed immediately after removal from the anesthetic bath. The full husbandry and anesthesia protocol is reported in Laique et al. [38]. The original dataset included both head and body images. In the present study, only 520 close-up head images were used because the operculum regions and the enclosed melanin-based spots were clearly visible. Representative left- and right-side close-up head images are shown in Figure 2.
Figure 2.
Close-up head images of the left and right sides of a salmon specimen on a blue background.
3.2. Annotations
Annotation followed the protocol established in our previous study [38] and is summarized here for completeness. Operculum and spot regions were annotated in 275 close-up head images using Roboflow’s annotation toolkit [55] by a single annotator (TL), with annotations reviewed and agreed by the supervisory team at scheduled project meetings. Spots were annotated as polygons under an instance-segmentation strategy to accommodate variation in spot size, shape and texture, yielding 275 operculum regions and approximately 9000 enclosed spots. Images were partitioned into training, validation and test sets in an approximate 70:20:10 ratio (193, 55 and 27 images, respectively), and geometric and pixel-intensity augmentations were applied to the training images to increase variation [56], expanding the training set to 1065 images representing approximately 35,000 spot instances. Because individual fish contributed multiple images, partitioning was performed at the image level and fish-level independence between subsets was not enforced; the reported detection and segmentation metrics should therefore be interpreted as within-population performance rather than as generalization to entirely unseen individuals. The 100 close-up head images used for downstream analysis (8 control, 21 stressed fish) were held out entirely from model development and used only at the inference stage. Examples of annotated spots and operculum region are shown in Figure 3.
Figure 3.
Spots (left) and operculum (right) region in the close-up image annotated with smart and standard polygon tools in Roboflow.
3.3. Segmentation Models
Three computer vision models were used in the segmentation pipeline. YOLOv8-seg [53] was used for both operculum identification and spot segmentation. To refine the spot masks, YOLO-derived spot predictions were converted into bounding boxes and point prompts, which were then provided together with the corresponding operculum image to a fine-tuned Segment Anything Model 2.1 (SAM 2.1) [54].
3.3.1. Fine-Tuning and Validation of Models
The YOLOv8x-seg model, comprising 68.2 million parameters, was fine-tuned separately on the operculum and spot datasets. Segment Anything Model 2 (SAM 2.1) was fine-tuned on the spot dataset. The YOLOv8x-seg models were fine-tuned and evaluated using the Ultralytics library [53], and SAM 2.1 using the official SAM 2 training code ([54]). Fine-tuning and evaluation were performed in Google Colab on an NVIDIA A100 GPU with 40 GB of memory. Inference was conducted locally on an NVIDIA RTX 3500 Ada Generation GPU in an Anaconda3 environment (version 2024.02-1) configured with Python 3.10.14, PyTorch 2.8.0, CUDA 12.6 and Ultralytics 8.4.56.
3.3.2. Yolov8 for Operculum
A YOLOv8-seg model pretrained on the COCO dataset [57] was fine-tuned for operculum segmentation on the 275 annotated operculum images using the Ultralytics framework [53]. Training hyperparameters are given in Table 2. Regularization was applied through dropout and early stopping, halting training when validation performance had not improved for 25 consecutive epochs. Augmentations were applied on-the-fly during training via the Albumentations library [58] and included Gaussian blur, contrast-limited adaptive histogram equalization, grayscale conversion and tile-size adjustment. The photometric augmentations are of particular relevance here, as they reduce the sensitivity of the trained model to the between-session exposure variation. Model performance was evaluated using precision, recall and mean average precision (mAP), defined below. Quantitative results are presented in Table 3 and training and validation loss curves in Figure 4.
where TP, FP, and FN represent true positives, false positives, and false negatives, respectively. Recall describes the proportion of true objects detected by the model, whereas precision describes the proportion of model detections that were correct. C is the number of classes, and T denotes the set of confidence or IoU thresholds used to compute average precision.
Table 2.
Training configuration.
Table 3.
Operculum segmentation performance of the fine-tuned YOLOv8-x (YOLOv8-seg) model across the training, validation, and test splits.
Figure 4.
YOLOv8-Operculum: (a) bounding-box training and validation loss plots, (b) segmentation training and validation loss plots, (c) classification loss, and (d) distributed focal loss training and validation loss plots. Across all loss curves, the model exhibits slight underfitting, specifically the segmentation loss.
3.3.3. Yolov8 for Spots
A pretrained YOLOv8-seg model was fine-tuned for spot localization on the augmented spot dataset using the Ultralytics segmentation framework [53]. Training configuration was identical to that used for the operculum model (Table 2). Quantitative performance metrics for the spot-localization model are presented in Table 4, and training and validation loss curves in Figure 5.
Table 4.
Spot segmentation performance of the fine-tuned YOLOv8-x (YOLOv8-seg) models across the training, validation, and test splits.
Figure 5.
YOLOv8-spots: (a) bounding-box training and validation loss plots, (b) segmentation training and validation loss plots, (c) classification loss, and (d) distributed focal loss training and validation loss plots. Across all loss curves, the model exhibits slight underfitting.
3.3.4. Segment Anything Model 2.1 for Spot-Mask Refinement
SAM 2.1 was fine-tuned from the pretrained Hiera-B+ checkpoint [54,60] on the augmented spot dataset. The image encoder, memory attention module and memory encoder were optimized with AdamW under mixed precision, using a cosine learning-rate schedule and layer-wise decay; the image encoder was assigned a lower base learning rate than the remaining modules to preserve the pretrained representation. The training objective combined mask, Dice, IoU and object-classification losses, with the mask term weighted most strongly [54]. Point and box prompts were sampled with equal probability during training, so that the model adapted to both prompt types produced by the upstream detector. The full training configuration is given in Table 5 and training loss curves are shown in Figure 6. The fine-tuned model was validated on a held-out test set and the intersection-over-union (IoU) and Dice similarity coefficient (DICE) metrics separated by prompt type are mentioned in Table 6.
where A is the set of pixels in predicted segmentation mask, B is the set of pixels in the ground-truth mask, is number of pixels in both masks (TP), is number of pixels in either mask (TP + FP + FN), |A|, |B| are pixel counts of the predicted and ground-truth masks respectively.
Table 5.
Training configuration.
Figure 6.
SAM 2 training losses: (a) mask loss plot, (b) intersection-over-union loss plot, (c) Dice loss plot. All the loss functions are converging.
Table 6.
IoU and Dice metrics on held-out test set.
3.3.5. Comparison with Intensity Thresholding Methods
The spots are darker than the surrounding opercular skin, so the SAM 2-based method was additionally benchmarked against two classical intensity-thresholding baselines: global Otsu thresholding [61] and local adaptive (Gaussian-weighted mean) thresholding, both implemented in OpenCV [62]. A single threshold applied to the full 1080 × 1080 image is uninformative for this task, because the image-level intensity histogram is dominated by skin rather than by spot-to-background contrast. Each baseline was therefore given the same spatial prior as the SAM bounding-box prompt, thresholding a crop padded around each instance’s annotated bounding box by max (6 px, 0.4 × the longer bounding-box side). Within each crop, Otsu selected a single data-driven threshold from the crop’s bimodal intensity histogram, and the adaptive method thresholded each pixel against a Gaussian-weighted local mean (block size 60% of the crop’s shorter side, offset C = 2); both were inverted to select the darker mode. Where thresholding yielded more than one connected foreground component, for example when a neighboring spot fell inside the padded crop, the component nearest the bounding-box center was retained as the predicted mask and mapped back to full-image coordinates; if no foreground component survived, the predicted mask was empty. This gives both baselines the same localization information as the SAM box prompt, isolating the comparison to segmentation quality rather than localization. Both methods were scored on the same set of 832 spot instances; IoU and Dice values are reported in Table 6.
3.4. Inference Workflow
The inference workflow extends that reported in our previous study [38] by replacing the illumination-correction stage with a single two-point affine photometric normalization applied in linear light, and by deferring that normalization until immediately before measurement. This ordering is deliberate. Spot detection, segmentation and matching are geometric operations that take no photometric quantity from the images, so they can be performed on the registered crops; normalization is then applied once, and the corrected linear values are measured in place without an intervening re-encoding step. Every reported quantity—spot luminance, background luminance, the skin-referenced log-ratio, Weber contrast and spot area—is therefore derived from pixel values that have been placed on a common radiometric scale. The complete workflow comprises six stages: (1) operculum extraction, (2) projective registration, (3) spot segmentation, (4) spot matching, (5) photometric normalization, and (6) feature extraction. The workflow is illustrated in Figure 1.
3.4.1. Operculum Extraction
Left and right opercular regions were localized in each close-up head image using the fine-tuned YOLOv8-seg operculum model. The predicted mask was used to crop the opercular region, which formed the input to all subsequent stages.
3.4.2. Projective Registration:
Extracted opercular regions were sorted into pre- and post-stress groups and registered side-wise, so that each operculum of a given individual at the pre-stress session was aligned to corresponding operculum of the same individual post-stress, left to left and right to right. Registration establishes the spatial correspondence required for spot-level pairing and follows the procedure reported in Laique et al. [38], implemented with OpenCV [62]:
- Pre- and post-stress opercular regions were converted to grayscale.
- Keypoints and descriptors were detected using the scale-invariant feature transform, SIFT [63].
- Descriptors were matched using a FLANN-based approximate nearest-neighbor matcher [64].
- Lowe’s ratio test [63] was applied to retain only unambiguous correspondences.
- A homography matrix was estimated from the retained correspondences using RANSAC [65,66], which rejects outlying matches.
- The homography was applied to the pre-stress region to align it with its post-stress counterpart.
3.4.3. Spot Segmentation
Spots were detected within each registered opercular region using the fine-tuned YOLOv8-seg spot model. Predicted spot masks were converted to bounding boxes, and box centers were taken as point prompts. The two prompt types were evaluated separately against manual annotations (Table 6): box prompting gave closer agreement than point prompting (Dice 0.895 ± 0.064 versus 0.864 ± 0.099), and box-prompted masks were therefore used for all subsequent feature extraction. The spot segmentation stages are shown in Figure 7.
Figure 7.
(a) YOLOv8-based detections of spots in the operculum region, (b) YOLOv8-driven SAM-2 segmentations, (c) final spot segmentation for feature extraction and downstream analysis.
3.4.4. Spot Matching and Curation
Corresponding spots were paired across sessions by nearest-neighbor matching of mask centroids in the registered coordinate frame, using Euclidean distance. Every assignment was then reviewed against the paired images, and spots that had been assigned the wrong counterpart were relabeled by hand, so the final correspondence was established by visual confirmation rather than by a distance cut-off. Spots present in only one image of a pair, for example where a spot fell outside the registered crop, were excluded from the paired analysis.
Matched spots were then manually curated on the registered image pairs. Spots obscured by mucus, affected by specular reflection, or partially occluded were removed prior to feature extraction. Exclusion was applied symmetrically: a spot removed from one image of a pair was also removed from its counterpart, so every retained spot contributes a complete pre- and post-confinement observation. Relabeling and exclusions were reviewed by a second assessor (Figure 7c).
3.4.5. Photometric Normalization
Images were acquired with a consumer compact camera operating in program auto-exposure mode. Under this mode, the camera selects shutter speed in response to scene composition, so that two photographs of the same subject taken in different sessions may be exposed differently even when illumination is unchanged. The camera also writes gamma-encoded sRGB output, in which recorded pixel values are a non-linear function of scene radiance [51]. In addition, ambient light entering the open front of the imaging booth contributes a variable additive component that is not removed by any purely multiplicative correction. Neither effect is corrected by geometric registration. Photometric normalization therefore proceeds in two steps: linearization and two-point affine correction.
- Linearization: Each 8-bit channel value V ∈ [0, 255] was scaled to v = V/255 and mapped to relative scene radiance by the inverse sRGB electro-optical transfer function:This inverts the encoding applied in-camera and yields values proportional to the light reaching the sensor. Channel values were combined into luminance using the Rec. 709 weights (0.2126 R, 0.7152 G, 0.0722 B) applied to the linearized values.
- Two-point affine correction: Two reference regions are present in the frame of every photograph: the eye, which provides a dark anchor, and the ID tag, which provides a light anchor. Both were annotated using the smart polygon tool in Roboflow [55]. Within the segmented eye region, linearized luminances were sorted in ascending order and the darkest 20% averaged to give the black reference (Lmin); within the segmented ID-tag region, values were sorted in descending order and the brightest 20% averaged to give the white reference (Lmax). Averaging a tail rather than taking a single extreme pixel makes the anchors robust to specular highlights on wet tissue and to isolated sensor noise. Each opercular region was then corrected asBoth reference values are measured in linear light, so the correction is affine on a radiance-proportional scale and linearity is preserved end to end. This is the property that motivates the choice. For a camera response of the form (L′ = gL + o), comprising a multiplicative gain (g) and an additive offset (o), both terms cancel exactly:The distinction is material. Rescaling by the sensor exposure recorded in the EXIF header removes only the multiplicative term g. A multiplicative factor already cancels in any ratio, so such a rescaling leaves the skin-referenced log-ratio and Weber contrast algebraically unchanged. The additive term (o) does not cancel in a ratio, and it is therefore the component to which these descriptors are genuinely vulnerable. The two-point correction removes both, using references physically present in the scene rather than metadata describing the camera.
3.4.6. Feature Extraction
For each retained spot, pixel values were linearized and then averaged within the relevant mask; the descriptors below were formed from those means. Linearizing before averaging is necessary because the transfer function is non-linear, so the mean of linearized pixels is not the linearization of the mean, and the discrepancy is larger for the heterogeneous background annulus than for spot interiors.
- Spot luminance (Lspot): The mean linear luminance of pixels within the SAM 2.1 mask.
- Background luminance (Lbkg): The mean linear luminance of an annulus formed by dilating the spot polygon 1.5 times its original size and subtracting the spot mask itself. The annulus is immediately adjacent to the spot, so the illumination incident on the two regions is to a good approximation the same and largely cancels in the ratio defined below.
- Skin-referenced log-ratio (R): The natural logarithm of the ratio of spot to background luminance, . This is the primary descriptor used in the analysis.
- Weber contrast (C): The luminance difference between spot and background expressed relative to the background,
- Spot area: The number of pixels within the segmentation mask.
R and C are both ratios of luminances measured within the same frame and are therefore invariant to any per-image multiplicative factor: scaling Lspot and Lbkg by a common constant leaves both unchanged. They are related deterministically, C = eR − 1, so although both are reported, only one is treated as an independent test (Section 3.5). R was adopted as the primary descriptor because differences of logarithms are ratios, which is the natural scale for the paired comparison, and because it is the descriptor used in the companion analysis of spot architecture [52].
Because the reference group images were acquired at a different working distance from the stressed group images, spot area is not comparable between groups and is reported for within-individual comparison only. The different feature annotations can be seen in Figure 8.
Figure 8.
(a) Operculum grayscale image, (b) extracted spots through spots masks, (c) extracted background regions, (d,e) pre-and post-stress operculum regions with spot and background regions highlighted in green and red, respectively.
3.5. Statistical Analysis
All analyses were conducted in Python 3 using scipy.stats and statsmodels. Five descriptors were analyzed, each computed in linear light following two-point photometric normalization: the skin-referenced log-ratio spot luminance, background luminance, spot area, and Weber contrast. Pixels were averaged within each mask before any ratio was formed.
The fish was the unit of analysis. Left and right opercular values were averaged within each individual, giving one paired observation per fish per session (n = 21). The effect of confinement was assessed by paired t-test and by Wilcoxon signed-rank test, with effect sizes reported as Cohen’s dz and 95% confidence intervals obtained both parametrically and by cluster bootstrap resampling fish rather than opercula (10,000 resamples). Operculum-level analyses (n = 42) are reported alongside as a sensitivity analysis. Because opercula from the same animal are not independent, the fish-level estimates are those on which inference is based.
Side was retained in two further analyses. A repeated-measures two-way ANOVA with day (pre, post) and side (left, right) as within-subject factors was fitted for each descriptor; because the design has two levels of each factor, sphericity is satisfied by construction and no correction was applied. Linear mixed-effects models of the form feature ~ day ×side + (1|fish) were fitted to the operculum-level data, with fish as a random intercept, to confirm that the day effect survives explicit modeling of the within-fish correlation.
Residuals were inspected for normality (Shapiro–Wilk) and homogeneity of variance (Levene’s test). Where assumptions were violated, the non-parametric and bootstrap results are relied upon. No exposure covariate was fitted: the two-point correction removes the per-image gain and offset directly, so sensor exposure is not carried into the statistical models.
The skin-referenced log-ratio was designated the primary outcome and is reported unadjusted. Spot luminance, background luminance and spot area are secondary outcomes, with p-values adjusted across the three by the Benjamini–Hochberg procedure. Weber contrast is reported for comparability with the pigmentation literature; as a deterministic transform of the log-ratio it is not an independent test.
Reference fish (n = 8) were photographed at a single timepoint, so a group × time interaction was not estimable and all reference comparisons are cross-sectional. These used Welch’s two-sample t-test and the Mann–Whitney U test on fish-level means, with Cohen’s d, and two one-sided tests (TOST) against an equivalence bound equal to the observed confinement effect. As set out in Section 4.7, the reference session differed from the stressed sessions in both illumination and working distance, and these comparisons are reported descriptively rather than as a basis for inference.
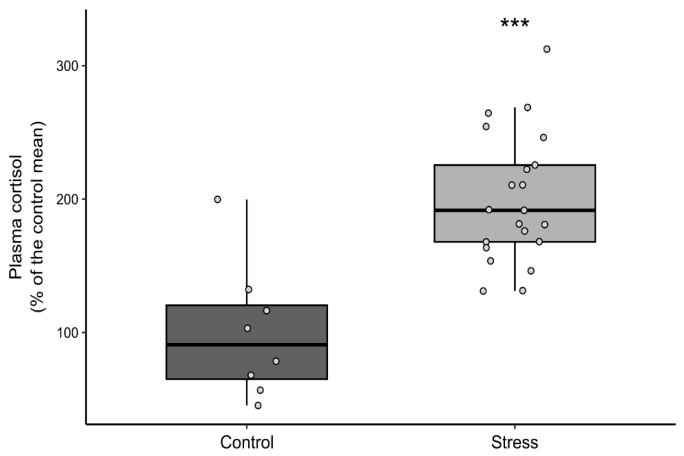
Features are presented as mean ± SEM unless otherwise stated. Plasma cortisol was measured in reference (n = 8) and stressed (n = 21) fish; the detailed assay procedure is reported in Laique et al. [38]. Cortisol was expressed as a percentage of the reference-group mean and was higher in stressed fish (Wilcoxon rank-sum test: W = 14, p < 0.001).
4. Results
4.1. Image Acquisition and Photometric Variation
Photographs were acquired with the camera in program auto-exposure mode. Aperture (f/2.8), sensitivity (ISO 100), white balance (manual) and flash suppression were constant across all 84 images of stressed fish, with a single exception at f/8. Shutter speed and exposure compensation, however, varied both within and between sessions. To quantify the resulting variation, we computed the relative sensor exposure of each image from its EXIF record as H = t × (S/100)/N2, where t is the shutter speed, N the f-number and S the sensitivity; this quantity is used here only to characterize the acquisition and plays no part in the correction. Sensor exposure differed by a mean of +0.008 stops between the pre- and post-stress sessions, indicating no systematic difference in exposure between imaging days, but the per-fish paired difference had a standard deviation of 0.90 stops and ranged from −2.68 to +2.32 stops. A share of 22 of 42 image pairs (52%) differed by more than 0.5 stops and 9 (21%) by more than one stop.
Acquisition variation of this magnitude would propagate into every photometric descriptor if left uncorrected. The two-point affine correction described in Section 3.4.5 removes both the multiplicative and the additive components of the camera response using references physically present in each frame, and all features reported below were computed from the corrected images in linear light. Because the correction is applied to the image before measurement, no exposure covariate is carried into the statistical models.
4.2. Statistical Approach and Assumption Checks
The fish was the unit of analysis: left and right opercular values were averaged within each individual, giving 21 paired observations. Changes were tested by paired t-test and by Wilcoxon signed-rank test, with 95% confidence intervals obtained both parametrically and by cluster bootstrap resampling fish. Repeated-measures two-way ANOVA (day × side) and linear mixed-effects models with fish as a random intercept were fitted in addition, and operculum-level results (n = 42) are reported as a sensitivity analysis.
Residual normality and homogeneity of variance were assessed for every descriptor. Where assumptions were not met, the non-parametric and bootstrap results are relied upon; these agreed closely with the parametric estimates in every case and are reported alongside them throughout. Because the design has two levels of each within-subject factor, sphericity is satisfied by construction and no correction was applied. The fraction of opercular pixels saturated at the top of the encoded range was recorded for every image as a quality flag. It did not differ significantly between sessions (0.097 before confinement versus 0.134 after, paired t(20) = 1.37, p = 0.185), and its change was unrelated to the change in the primary outcome (r = 0.285, p = 0.211) or in spot area (r = −0.138, p = 0.549). It was, however, associated with the change in background luminance (r = 0.504, p = 0.020) and marginally with spot luminance (r = 0.414, p = 0.062); these associations are noted where the affected descriptors are reported.
4.3. Skin-Referenced Log-Ratio
The skin-referenced log-ratio, , computed in linear light, increased from −2.0747 ± 0.0666 before confinement to −1.7088 ± 0.0637 afterwards (mean ± SEM, n = 21 fish). Because the log-ratio is negative for dark spots on lighter skin, this shift toward zero represents a reduction in the magnitude of spot-to-background separation: spots became less distinct from the surrounding opercular tissue.
The paired change was +0.3658 (95% CI [0.2914, 0.4403]), a large within-subject effect (dz = 2.24, 95% CI [1.39, 3.09]), t(20) = 10.25, p < 0.001, confirmed non-parametrically (Wilcoxon signed-rank W = 0, p < 0.001) and by cluster bootstrap resampling fish (95% CI [0.2989, 0.4344]). The repeated-measures ANOVA showed a significant main effect of day, F(1, 20) = 105.11, p < 0.001, partial η2 = 0.840, with no effect of side, F(1, 20) = 0.68, p = 0.418, and no day × side interaction, F(1, 20) = 0.16, p = 0.690. The mixed-effects model confirmed the day effect with fish as a random intercept (coefficient = +0.355, z = 5.11, p < 0.001), and the operculum-level sensitivity analysis was consistent (dz = 1.81, p < 0.001, n = 42).
Weber contrast, the equivalent transform of the same quantity, increased from −0.8358 ± 0.0107 to −0.7692 ± 0.0150, a change of +0.0665 (95% CI [0.0507, 0.0823]), dz = 1.91, t(20) = 8.77, p < 0.001 (Wilcoxon W = 0, p < 0.001). Because Weber contrast is a deterministic, strictly monotonic transform of the log-ratio, computed per spot as C = eR − 1, the two yield identical rank orderings and this is not an independent test.
Individual trajectories and distributions by session and side are shown in Figure 9 and Figure 10, respectively.
Figure 9.
Within-fish change in opercular spot features before and after 18 h confinement, following two-point photometric normalization and measurement in linear light. Each grey line represents one fish (n = 21); markers show group means ± SEM. Standardized effect sizes (dz) are annotated and the bracket gives the paired pre-versus-post significance; values marked (BH) are Benjamini–Hochberg adjusted across the three secondary descriptors (* p < 0.05, ** p < 0.01, *** p < 0.001).
Figure 10.
Distribution of opercular spot features by session and side (opercula, n = 42). Boxes show median and interquartile range with individual opercula overlaid; whiskers extend to 1.5 × IQR. Side-wise paired pre-versus-post tests are shown separately for left and right opercula; values marked (BH) are Benjamini–Hochberg adjusted (* p < 0.05, ** p < 0.01, *** p < 0.001).
4.4. Spot Luminance
Mean spot luminance increased from 0.0702 ± 0.0077 to 0.1254 ± 0.0119 in linear light (mean ± SEM, n = 21 fish), indicating that the spots themselves became lighter.
The paired change was +0.0552 (95% CI [0.0399, 0.0704]), dz = 1.65, t(20) = 7.55, p < 0.001 (Benjamini–Hochberg-adjusted p < 0.001); Wilcoxon W = 1, p < 0.001; cluster bootstrap 95% CI [0.0414, 0.0690]. The main effect of day was significant, F(1, 20) = 57.01, p < 0.001, partial η2 = 0.740, with no effect of side, F(1, 20) = 0.005, p = 0.946, and no day × side interaction, F(1, 20) = 0.11, p = 0.739. The mixed-effects model confirmed the day effect (coefficient = +0.0534, z = 4.67, p < 0.001), and the operculum-level sensitivity analysis was consistent (dz = 1.34, p < 0.001, n = 42).
4.5. Background Luminance
Mean luminance of the local background annulus surrounding each spot increased from 0.3505 ± 0.0208 to 0.4600 ± 0.0188 in linear light (mean ± SEM, n = 21 fish).
The paired change was +0.1095 (95% CI [0.0729, 0.1462]), dz = 1.36, t(20) = 6.23, p < 0.001 (Benjamini–Hochberg-adjusted p < 0.001); Wilcoxon W = 7, p < 0.001; cluster bootstrap 95% CI [0.0747, 0.1420]. The main effect of day was significant, F(1, 20) = 38.85, p < 0.001, partial η2 = 0.660, with no effect of side, F(1, 20) = 0.18, p = 0.672, and no day × side interaction, F(1, 20) = 4.05, p = 0.058. The mixed-effects model confirmed the day effect with fish as a random intercept (coefficient = +0.1406, z = 5.80, p < 0.001).
The background lightened by a greater absolute amount than the spots themselves (+0.110 versus +0.055 in linear luminance), while the proportional increase was greater for the spots (1.91 ± 0.11 versus 1.36 ± 0.06 fold; fish-level means ± SEM, n = 21). Because the skin-referenced log-ratio and Weber contrast are ratios, it is the proportional change that determines them; this comparison is examined in Section 5.2. Background luminance is also the one descriptor whose change was associated with the saturated pixel fraction of the image (r = 0.504, p = 0.020; Section 4.2), and it should be interpreted with that in mind.
4.6. Spot Area
Mean segmented spot area decreased from 26,271 ± 1906 px to 23,484 ± 2126 px, a reduction of 10.6% (95% CI [5.7%, 15.5%]). The paired change was −2787 px (95% CI [−4074, −1499]), dz = −0.99, t(20) = −4.52, p < 0.001 (Benjamini–Hochberg-adjusted p < 0.001); Wilcoxon W = 14, p < 0.001; cluster bootstrap 95% CI [−4030, −1652]. The main effect of day was significant, F(1, 20) = 20.39, p < 0.001, partial η2 = 0.505, with no effect of side, F(1, 20) = 0.21, p = 0.655, and no day × side interaction, F(1, 20) = 0.90, p = 0.353. The mixed-effects model, however, did not reach significance for spot area (coefficient = −3194, z = −1.40, p = 0.162), making this the least robust of the four descriptors once the within-fish correlation is modeled explicitly. Spot area is, in any case, derived from the segmentation mask, and a spot with reduced contrast against its background may yield a smaller mask independently of any change in the underlying pigmented region. This result should therefore be interpreted alongside, rather than as independent confirmation of, the photometric findings; the limitation is addressed in Section 5.6.
4.7. Comparison with the Reference Group
Reference fish (n = 8) were photographed at a single timepoint on the first experimental day, so a group × time interaction was not estimable and all comparisons with the stressed group are cross-sectional. The reference session also differed from the stressed sessions in illumination and in working distance: reference images show approximately 2.4 times the spot area and 2.3 times the spot count of the stressed images, indicating a closer camera-to-subject distance. These comparisons are therefore reported descriptively, and across all five descriptors rather than for a single one.
On the skin-referenced log-ratio, reference fish (−1.6598 ± 0.0580) differed from stressed fish measured before confinement (−2.0747 ± 0.0666; Welch t = 4.70, p < 0.001, Mann–Whitney p < 0.001, d = 1.51) but were indistinguishable from the same fish after confinement (−1.7088 ± 0.0637; Welch t = 0.57, p = 0.575, Mann–Whitney p = 0.649, d = 0.19). Weber contrast gave the same pattern (reference versus pre-stress Welch t = 4.23, p < 0.001, d = 1.50; reference versus post-stress p = 0.911, d = 0.04). Equivalence testing against a bound equal to the observed confinement effect did not establish equivalence between reference and pre-stress fish (TOST p = 0.708 for the log-ratio; p = 0.553 for Weber contrast).
We repeated the comparison across all five descriptors (Figure 11). On the log-ratio, Weber contrast and spot luminance, the reference group resembles post-confinement fish; on background luminance, it resembles pre-confinement fish (reference versus pre p = 0.462, versus post p = 0.010); and on spot area, it differs from both (p < 0.001 in each case), the last being a direct consequence of the working-distance difference, reference images showing approximately 2.4 times the spot area of the stressed images. Two features of this pattern limit what can be concluded from it. The reference group was imaged once, in a separate session and at a different magnification, so its position relative to the stressed animals is determined as much by acquisition as by biology. Additionally, the reference and post-confinement images were acquired under the same terminal anesthetic protocol, whereas the pre-confinement images were acquired under sedation alone, so the grouping observed here coincides with anesthetic state as well as with treatment. We therefore draw no inference from the between-group comparison and treat it as a design limitation (Section 5.6). The within-fish comparison, which is paired and in which session-level differences cancel, is unaffected and is the basis for the conclusions drawn below.
Figure 11.
Reference and paired pre/post measurements under two-point normalization, for all five descriptors. Reference comparisons (n = 8 versus n = 21) are cross-sectional and descriptive; paired pre-versus-post comparisons use fish-level tests (n = 21). The reference group resembles post-stress fish on the log-ratio and Weber contrast, pre-stress fish on spot and background luminance, and differs from both on spot area, reflecting the different working distance of the reference session (* p < 0.05, ** p < 0.01, *** p < 0.001).
4.8. Plasma Cortisol
As previously reported in Laique et al. [38], plasma cortisol, expressed as a percentage of the reference-group mean, was higher in confined fish (n = 21) than in reference fish (n = 8) (Wilcoxon rank-sum test, W = 14, p < 0.001), confirming that the confinement protocol elicited a physiological stress response (Figure 12). Assay details are reported in Laique et al. [38].
Figure 12.
Plasma cortisol (% of control mean) in control (n = 8) and stress-treated fish (n = 21). Boxplots show medians and IQR; points represent individual fish. Cortisol levels were higher in the stress group (Wilcoxon rank-sum test, W = 14, p < 0.001; *** p < 0.001). Data previously published in Laique et al. [38], reproduced under CC-BY.
5. Discussion
5.1. Summary of Findings
The aim of this study was to establish whether fading of melanin-based opercular spots in Atlantic salmon can be quantified reliably enough to support its evaluation as a stress indicator, and specifically whether such fading can be distinguished from the image-acquisition variation that confounds longitudinal photometry in live animals. Following 18 h of confinement, the skin-referenced log-ratio between spot and surrounding skin increased by 0.366 (95% CI [0.291, 0.440]), spot luminance increased by 0.055 (95% CI [0.040, 0.070]), background luminance increased by 0.110 (95% CI [0.073, 0.146]), and segmented spot area decreased by 10.6% (95% CI [5.7%, 15.5%]). Effects were large (dz = 0.99 to 2.24), consistent in direction across both opercula, and confirmed by non-parametric tests, by cluster bootstrap resampling fish, and by mixed-effects models with fish as a random intercept.
The photometric control is central to interpreting these results. Sensor exposure varied by up to 2.7 stops between paired photographs of the same individual, with a within-session standard deviation of approximately 0.9 stops, and the open front of the imaging booth admitted a variable additive contribution from ambient light. The two-point correction removes both components using references present in each frame. It is worth stating explicitly that a purely multiplicative correction could not have served this purpose: the skin-referenced log-ratio and Weber contrast are ratios, and any per-image multiplicative factor cancels in them algebraically. It is the additive term, which does not cancel, that these descriptors are vulnerable to, and which the two-point correction removes. A separate caveat applies to the interpretation of the change itself: pre-confinement images were acquired under sedation and post-confinement images following a lethal dose of MS-222, so anesthetic depth is confounded with imaging session (Section 5.6).
5.2. Spots Faded More than the Surrounding Skin
Expressed in linear reflectance, spot luminance increased by a factor of 1.91 ± 0.11 while background luminance increased by 1.36 ± 0.06 (fish-level means ± SEM, n = 21). The proportional increase was significantly greater for spots than for the surrounding tissue (paired t-test on log fold-change, t(20) = 9.84, p < 0.001; Wilcoxon W = 1, p < 0.001), and the ratio of the two fold-changes exceeded unity in 20 of 21 fish.
This is the result that distinguishes the two interpretations. Generalized paling of the operculum would produce a common multiplicative change in both regions and would leave normalized contrast unaltered, since Weber contrast is invariant to multiplicative scaling. The observed reduction in contrast magnitude therefore requires that the two regions changed by different proportions, and the direction of that difference indicates that the pigmented spots lightened more than the tissue around them. Melanin-bearing regions responded more strongly to confinement than adjacent non-spotted skin.
The comparison must be made in linear light. Weber contrast and the log-ratio are invariant to multiplicative scaling of the signal only when the signal is proportional to scene radiance; on gamma-encoded values, the fold-changes are compressed and the margin between spot and background is understated. Linearization therefore determines both the magnitude of the effect and the validity of the invariance argument on which the interpretation rests.
5.3. Mechanistic Interpretation
Two endocrine pathways predict stress-associated fading of melanin-based pigmentation, and they differ in the timescale and the morphological signature they produce. MCH-mediated melanosome aggregation operates within seconds to minutes, is readily reversible, and produces a change in apparent intensity through translocation of pigment organelles within existing melanophores; spot boundaries should be largely preserved [30]. Cortisol-driven upregulation of ASP antagonizes α−MSH and suppresses melanosome dispersion over hours to days, and sustained suppression would be expected to affect the spot margin, where melanophore density is lowest, before the spot center [34].
Our observations are consistent with a contribution from both. The magnitude of the intensity change over 18 h, together with the reduction in spot area, is more readily explained by a process acting on the spot as a whole, including its periphery, than by rapid melanosome translocation alone. We interpret the area reduction as consistent with fading progressing inward from the spot margin, but with an important caveat addressed in Section 5.6: spot area is derived from a segmentation mask, and a spot of reduced contrast may yield a smaller mask irrespective of any change in the underlying pigmented region. Discriminating these pathways would require sampling at multiple timepoints within the first hours after the stressor and following recovery, which the present design cannot support.
5.4. Relationship to Previous Work
Previous research on melanin-based pigmentation in salmonids has reported that individuals with more spots show reduced cortisol responsiveness and differ in behavioral stress coping [22,23,24], and Thorsen [15] reported that opercular spots fade in response to crowding and netting. These studies relied on manual identification of spots and qualitative or semi-quantitative assessment of change. Our previous study [38] automated spot detection, registration and segmentation, and demonstrated as proof of principle that spot grayscale intensity shifts following confinement. The present study extends that work by establishing that the shift survives photometric control, by quantifying it with effect sizes and confidence intervals, and by showing that it is spot-specific rather than a generalized change in skin luminance.
A tension in this literature deserves comment. Stress in salmonids is frequently associated with skin darkening rather than paling: subordinate Arctic charr darken during social interaction, mediated by α−MSH and other POMC-derived peptides [67], and prolonged stress and dark-background adaptation both elevate circulating α−MSH, which disperses melanosomes and darkens the skin. Our result runs in the opposite direction. We suggest this reflects a genuine distinction rather than a contradiction. Chronic social subordination and background matching act on dermal melanophore populations across the body surface over days, whereas acute confinement engages MCH- and cortisol-mediated pathways that aggregate pigment and suppress dispersion over hours. The discrete opercular spots may also be regulated differently from diffuse dermal pigmentation. Resolving this would require simultaneous measurement of α−MSH, MCH and cortisol alongside imaging, which we identify as a priority for subsequent work.
The direction of our finding also bears on one of the principal confounds in this experiment. The fish were held in dark green tanks, and background adaptation to a dark substrate predicts skin darkening. The observed lightening is therefore opposite to what background adaptation would produce, which argues against it as an explanation for the present result, though it does not exclude it as a source of variance.
5.5. Methodological Contribution
Quantitative measurement of animal coloration from digital photographs is an established methodology, and the acquisition problems encountered here have been described in that literature since at least 2007. Stevens et al. [35] noted that studies using digital photography are frequently unaware of the non-linearity of camera response to light intensity, and set out procedures for linearizing camera response and calibrating against reflectance standards. Akkaynak et al. [50] and Troscianko and Stevens [36] formalized these procedures, the latter in a freely available toolbox. Both approaches, however, require raw sensor data and a physical reflectance standard within the frame of every photograph.
Neither precondition is typically met in aquaculture research or production, where imaging is performed on wet, mobile animals under time pressure, and neither can be satisfied retrospectively for an existing image archive. The procedure adopted here substitutes anchors already present in the scene for an external standard: the eye and the ID tag provide dark and light references in every frame, and a two-point affine map in linear light removes both the multiplicative and the additive components of the camera response. We regard this as complementary to calibrated photography rather than a substitute for it. Neither anchor is a traceable reflectance standard, so the procedure establishes a common relative scale rather than absolute reflectance, and it cannot correct for changes in spectral composition or for camera-specific tone curves departing from the sRGB standard. It is, however, applicable to data already collected, which conventional calibration is not.
Segmentation quality bounds the validity of every photometric feature reported here, since spot luminance, background luminance and area are all computed from the predicted mask. The fine-tuned SAM 2.1 model achieved a Dice of 0.895 ± 0.064 against manual annotations, compared with 0.798 ± 0.173 for global Otsu thresholding and 0.778 ± 0.195 for local adaptive thresholding (Table 6). Because both baselines were given the same bounding-box prior as the model prompt, the margin is attributable to segmentation rather than localization. The difference in variability is more consequential than the difference in means: the standard deviation of the learned segmenter is roughly a third that of either baseline. For a measurement instrument, this consistency matters more than mean accuracy, since sporadic segmentation failures introduce feature errors that are neither detectable nor correctable downstream, and such failures would be expected to be most frequent where spot margins are diffuse, which is the condition that becomes more common after confinement as spot-to-background separation declines.
A companion manuscript on the same dataset [52] characterizes spot architecture and its repeatability using a skin-referenced intensity descriptor with an in-frame exposure proxy. The present study differs in that the acquisition correction is derived from reference regions in the scene and applied to the image before measurement, and in that spot area and local background are analyzed alongside the skin-referenced descriptor; the two approaches are complementary tests of whether the same change survives different acquisition controls.
5.6. Limitations
- Reference group design: Reference fish were photographed at a single timepoint on the first experimental day, at a different working distance and under different illumination from the stressed sessions. A group × time interaction is therefore not estimable, and the cross-sectional comparison in Section 4.7 cannot be interpreted as evidence about the treatment. Across the five descriptors, the reference group resembles post-confinement fish on the log-ratio, Weber contrast and spot luminance, resembles pre-confinement fish on background luminance, and differs from both on spot area, the last reflecting a working distance at which reference images show approximately 2.4 times the spot area of the stressed images. The grouping also coincides with anesthetic state, since reference and post-confinement images share a terminal protocol that the pre-confinement images do not. We therefore draw no inference from it. This is the principal limitation of the study, and it constrains the design rather than the analysis: no reanalysis of the present data can address it. The within-fish comparison, in which each animal serves as its own control and session-level differences cancel, is unaffected.
- Spot area is not independent evidence: A spot with reduced contrast against its background may yield a smaller segmentation mask under any threshold-dependent method. The area result should therefore be read as consistent with, rather than as independent confirmation of, the photometric findings. It is also the only descriptor for which the mixed-effects model did not reach significance (p = 0.162), and the only one for which the reference group differs from both stressed sessions, both of which are consistent with a measurement that is sensitive to acquisition geometry.
- Acquisition conditions: Images were captured in a booth open at the front, so ambient daylight contributed variably to the interior illumination, and the camera operated in automatic exposure mode. The two-point correction removes the resulting per-image gain and offset, but it cannot recover information absent from the recorded data. Two consequences follow. Underexposed frames carry lower signal-to-noise ratios; and pixels saturated at the top of the encoded range carry no information about how much brighter the surface actually was, so an image with a large saturated fraction underestimates background luminance. The saturated fraction did not differ significantly between sessions (p = 0.185), and its change was unrelated to the change in the primary outcome (p = 0.211), but it was associated with the change in background luminance (r = 0.504, p = 0.020), which is one reason that descriptor is interpreted more cautiously than the others. The anchors are also not calibrated standards: the eye is not a true black and the wetted ID tag is not a true white, so the correction establishes a common relative scale rather than absolute reflectance. Raw capture with an in-frame reflectance target would remove these limitations entirely.
- Statistical assumptions: Where residual normality or homogeneity of variance was not met, conclusions were verified by Wilcoxon signed-rank tests and by cluster bootstrap resampling fish; these agreed closely with the parametric estimates throughout. Analyses are reported at the level of the fish (n = 21); operculum-level results (n = 42) are given as a sensitivity analysis and are consistent in direction and magnitude.
- Generalizability: The study involved a single stock at a single facility, one stressor, one post-stress timepoint, and 29 animals in total. Whether the effect generalizes across stocks, pigmentation phenotypes, stressor types and production environments is untested.
- Anesthesia and handling: All images were acquired from netted, anesthetized fish, and the post-confinement and reference images were taken following a lethal dose of MS-222, whereas the pre-confinement images were taken under non-lethal sedation. Deep anesthesia may alter sympathetic control of chromatophores and can therefore affect apparent pigmentation, so anesthetic state is confounded with imaging session. The cross-sectional comparison bears directly on this. On the skin-referenced log-ratio and Weber contrast, the two groups that are indistinguishable are precisely the two imaged under terminal anesthesia (reference and post-confinement, p = 0.575 and p = 0.911), while the group that differs is the one imaged under sedation alone (pre-confinement, p < 0.001 for both descriptors). Anesthetic depth therefore remains a plausible alternative explanation for part or all of the observed change, and it cannot be separated from the confinement treatment in the present design. Resolving this requires a design in which pre- and post-stressor images are acquired under an identical anesthetic protocol.
- Physiological linkage: Plasma cortisol confirmed at the group level that the confinement protocol elicited a stress response, but individual cortisol concentrations were not related to individual fading. Establishing that association is the necessary next step toward biomarker status.
5.7. Implications and Future Directions
Operational welfare indicators currently used in salmon production comprise a mixture of handling-based and invasive measures. Morphological indicators such as fin condition, skin condition, vertebral deformity and sea lice burden require capture and close manual inspection [7,68]. Physiological indicators such as plasma cortisol require blood sampling, and their interpretation is sensitive to sampling latency because the handling required to obtain the sample itself elicits a cortisol response [8,9]. Both classes register a welfare problem principally after it has developed, which limits their utility for preventive management.
An image-based measure of pigmentation offers a different profile: it does not in principle require contact with the animal and could in principle be acquired repeatedly, although the present images were obtained from netted and anesthetized fish, and reflects a physiological rather than a pathological state. The present study does not establish opercular spot fading as a validated biomarker. In an accompanying analysis of the same cohort, spot fading was strongly associated with regional brain monoaminergic activity at the level of the individual animal, indicating that the measured change co-varies with a central stress marker [37]. What the present study establishes is that the change is measurable, that it is large relative to measurement error once acquisition is controlled, and that it is spot-specific rather than a generalized change in skin luminance.
Four priorities follow. First, a longitudinal reference group imaged at the same interval, at the same working distance and under the same anesthetic protocol, without confinement, which would supply the interaction term the present design cannot and would resolve the between-group instability reported in Section 4.7. Second, correlation of individual cortisol with individual fading, which would connect the optical measurement to the physiological axis it is proposed to index. Third, a time-course and recovery design, which would discriminate the MCH and ASP pathways and establish whether the measure indexes a reversible state or accumulated change. Fourth, acquisition under standardized conditions with raw capture, fixed camera settings, controlled illumination, fixed working distance, and an in-frame calibration target, which would replace the in-scene anchors used here with a traceable photometric standard.
Beyond these, testing across multiple stocks, environments and pigmentation phenotypes will be required to assess generalizability and robustness.
6. Conclusions
This study provides a photometrically controlled framework for quantifying the appearance of individual melanin-based opercular spots in Atlantic salmon. Images were linearized and corrected by a two-point affine transform anchored on reference regions present in every frame, a procedure that cancels both the multiplicative and the additive components of the camera response while preserving linearity, and pixels were linearized before averaging so that all descriptors are formed in linear light. Following 18 h of confinement, the skin-referenced log-ratio between spot and surrounding skin increased by 0.366 (95% CI [0.291, 0.440], dz = 2.24, p < 0.001), spot and background luminance both increased, and segmented spot area decreased by 10.6%. Spots lightened proportionally more than adjacent skin (a factor of 1.91 versus 1.36, p < 0.001), indicating a response localized to pigmented regions rather than a generalized change in opercular luminance. Because the reference group was imaged at a single timepoint and at a different working distance, and because pre- and post-confinement images were acquired under different anesthetic protocols, the effect cannot be attributed to confinement to the exclusion of elapsed time, handling or anesthetic depth, and physiological validation remains outstanding. The framework nonetheless establishes that stress-associated pigmentation change in salmonids can be measured quantitatively from consumer photography and provides a methodological foundation for the further work required to determine whether it constitutes a useful non-invasive welfare indicator.
Author Contributions
Conceptualization, T.L. and Ø.Ø.; Methodology, T.L.; Software, T.L.; Validation, T.L., M.G., Ø.Ø., H.U. and M.O.; Formal analysis, T.L.; Investigation, T.L.; Resources, Ø.Ø.; Data curation, T.L.; Writing—original draft, T.L.; Writing—review & editing, T.L., Ø.Ø., H.U. and M.O.; Visualization, T.L.; Supervision, M.G., Ø.Ø., H.U. and M.O.; Project administration, Ø.Ø.; Funding acquisition, Ø.Ø. All authors have read and agreed to the published version of the manuscript.
Funding
The study is funded by Research Council of Norway—NFR VISSIGN (NMBU Category 3 scholarship is NMBU co-funding as pr contract with NFR—Project number: 324571).
Institutional Review Board Statement
The experiment was conducted in accordance with current local legislation governing the use of live animals in research and was approved by the Norwegian Food Safety Authority under FOTS application ID30246, approval date: 18 April 2023.
Data Availability Statement
The data and scripts that support the findings of this study are openly available in Zenodo at DOI: https://doi.org/10.5281/zenodo.23056749, and the tool for feature generation is available on GitHub at https://github.com/laiquet/multimodal-labeling-tool.git (accessed on: 30 October 2026). The additional scripts will be deposited in the same repository (Zenodo) upon acceptance and are available from the corresponding author upon reasonable request.
Acknowledgments
The authors would like to thank the Institute of Marine Research (IMR), Bergen, Norway, for providing the dataset that made this study possible and SINTEF Ocean, applied research, technology and innovation, for their supervisory interest in the Project. OpenAI (GPT 5.5) and Anthropic (Opus 5.5) were utilized during the preparation of this manuscript to assist with paraphrasing, grammar correction and improving overall readability. The content was reviewed and edited as necessary to ensure accuracy and alignment with the final published article.
Conflicts of Interest
The authors declare that the research was conducted in the absence of any commercial or financial relationships that could be construed as a potential conflict of interest.
References
- Norwegian Fish Health Report 2024 (Report No. 1b/2025); Moldal, T., Wiik-Nielsen, J., de Oliveira, V.H.S., Svendsen, J.C., Sommerset, I., Eds.; Norwegian Veterinary Institute: Ås, Norway, 2025; Available online: https://www.vetinst.no/rapporter-og-publikasjoner/rapporter/2025/norwegian-fish-health-report-2024/ (accessed on 1 January 2026).
- Overton, K.; Dempster, T.; Oppedal, F.; Kristiansen, T.S.; Gismervik, K.; Stien, L.H. Salmon lice treatments and salmon mortality in Norwegian aquaculture: A review. Rev. Aquac. 2019, 11, 1398–1417. [Google Scholar] [CrossRef] [Scilit]
- Rey, S.; Little, D.; Ellis, M. Farmed Fish Welfare Practices: Salmon Farming as a Case Study; Global Aquaculture Alliance: Portsmouth, NH, USA, 2019; Available online: https://www.globalseafood.org/ (accessed on 1 January 2026).
- Stien, L.H.; Tørud, B.; Gismervik, K.; Lien, M.E.; Medaas, C.; Osmundsen, T.; Kristiansen, T.S.; Størkersen, K.V. Governing the welfare of Norwegian farmed salmon: Three conflict cases. Mar. Policy 2020, 117, 103969. [Google Scholar] [CrossRef] [Scilit]
- Adams, C.E.; Turnbull, J.F.; Bell, A.; Bron, J.E.; Huntingford, F.A. Multiple determinants of welfare in farmed fish: Stocking density, disturbance, and aggression in Atlantic salmon (Salmo salar). Can. J. Fish. Aquat. Sci. 2007, 64, 336–344. [Google Scholar] [CrossRef] [Scilit]
- Keihani, R.; Gomes, A.S.; Balseiro, P.; Handeland, S.O.; Gorissen, M.; Arukwe, A. Evaluation of stress in farmed Atlantic salmon (Salmo salar) using different biological matrices. Comp. Biochem. Physiol. Part A Mol. Integr. Physiol. 2024, 298, 111743. [Google Scholar] [CrossRef] [Scilit] [PubMed]
- Welfare Indicators for Farmed Atlantic Salmon: Tools for Assessing Fish Welfare; Noble, C., Gismervik, K., Iversen, M.H., Kolarevic, J., Nilsson, J., Stien, L.H., Turnbull, J.F., Eds.; Nofima: Tromsø, Norway, 2018. [Google Scholar]
- Ellis, T.; Yildiz, H.Y.; López-Olmeda, J.; Spedicato, M.T.; Tort, L.; Øverli, Ø.; Martins, C.I.M. Cortisol and finfish welfare. Fish Physiol. Biochem. 2012, 38, 163–188. [Google Scholar] [CrossRef] [Scilit] [PubMed]
- Sadoul, B.; Geffroy, B. Measuring cortisol, the major stress hormone in fishes. J. Fish Biol. 2019, 94, 540–555. [Google Scholar] [CrossRef] [Scilit] [PubMed]
- Burke, M.; Nikolic, D.; Fabry, P.; Rishi, H.; Telfer, T.C.; Rey-Planellas, S. Precision farming in aquaculture: Use of a non-invasive, AI-powered real-time automated behavioural monitoring approach to predict gill health and improve welfare in Atlantic salmon (Salmo salar) aquaculture farms [Preprint]. SSRN 2024. [Google Scholar] [CrossRef] [Scilit]
- Ziaei, M.M.; Urban, J.; Cisar, P. Image-Based Individual Fish Identification as a Substitute for Invasive Methods: State-of-the-Art and Research Gaps. Rev. Aquac. 2025, 17, e70078. [Google Scholar] [CrossRef] [Scilit]
- Yang, X.; Zhang, S.; Liu, J.; Gao, Q.; Dong, S.; Zhou, C. Deep learning for smart fish farming: Applications, opportunities and challenges. Rev. Aquac. 2021, 13, 66–90. [Google Scholar] [CrossRef] [Scilit]
- Gunnes, M.; Green, E.A.L.; Andersen, I.L.; Øverli, Ø. Condition-associated modulation of melanin-based skin pigmentation in juvenile Atlantic salmon (Salmo salar) (under review). R. Soc. Open Sci. 2026, 13, 260816. [Google Scholar] [CrossRef] [Scilit] [PubMed]
- Larsen, S. Objective Analysis of Melanin Spots as Welfare Signals in Atlantic Salmon Using AI-Based Computer Vision. Master’s Thesis, Norwegian University of Science and Technology, Trondheim, Norway, 2024. Available online: https://hdl.handle.net/11250/3154352 (accessed on 1 January 2026).
- Thorsen, D.K. Melanin-Based Skin Pigmentation and Stress in Atlantic Salmon (Salmo salar). Master’s Thesis, Norwegian University of Life Sciences, Ås, Norway, 2019. Available online: https://hdl.handle.net/11250/2605431 (accessed on 1 January 2026).
- Cesarini, J.P. Melanins and their possible roles through biological evolution. Adv. Space Res. 1996, 18, 35–40. [Google Scholar] [CrossRef] [Scilit]
- Hoekstra, H.E. Genetics, development and evolution of adaptive pigmentation in vertebrates. Heredity 2006, 97, 222–234. [Google Scholar] [CrossRef] [Scilit] [PubMed]
- Leclercq, E.; Taylor, J.F.; Migaud, H. Morphological skin colour changes in teleosts. Fish Fish. 2010, 11, 159–193. [Google Scholar] [CrossRef] [Scilit]
- Mackintosh, J.A. The antimicrobial properties of melanocytes, melanosomes and melanin and the evolution of black skin. J. Theor. Biol. 2001, 211, 101–113. [Google Scholar] [CrossRef] [Scilit] [PubMed]
- Riley, P.A. Melanin. Int. J. Biochem. Cell Biol. 1997, 29, 1235–1239. [Google Scholar] [CrossRef] [Scilit] [PubMed]
- Roulin, A. The evolution, maintenance and adaptive function of genetic colour polymorphism in birds. Biol. Rev. 2004, 79, 815–848. [Google Scholar] [CrossRef] [Scilit] [PubMed]
- Khan, U.W.; Øverli, Ø.; Hinkle, P.M.; Pasha, F.A.; Johansen, I.B.; Berget, I.; Silva, P.I.M.; Kittilsen, S.; Höglund, E.; Omholt, S.W.; et al. A novel role for pigment genes in the stress response in rainbow trout (Oncorhynchus mykiss). Sci. Rep. 2016, 6, 28969. [Google Scholar] [CrossRef] [Scilit] [PubMed]
- Kittilsen, S.; Johansen, I.B.; Braastad, B.O.; Øverli, Ø. Pigments, parasites and personality: Towards a unifying role for steroid hormones? PLoS ONE 2012, 7, e34281. [Google Scholar] [CrossRef] [Scilit] [PubMed]
- Kittilsen, S.; Schjolden, J.; Beitnes-Johansen, I.; Shaw, J.C.; Pottinger, T.G.; Sørensen, C.; Braastad, B.O.; Bakken, M.; Øverli, Ø. Melanin-based skin spots reflect stress responsiveness in salmonid fish. Horm. Behav. 2009, 56, 292–298. [Google Scholar] [CrossRef] [Scilit] [PubMed]
- Ludwig, D.S.; Mountjoy, K.G.; Tatro, J.B.; Gillette, J.A.; Frederich, R.C.; Flier, J.S.; Maratos-Flier, E. Melanin-concentrating hormone: A functional melanocortin antagonist in the hypothalamus. Am. J. Physiol.—Endocrinol. Metab. 1998, 274, E627–E633. [Google Scholar] [CrossRef] [Scilit] [PubMed]
- Kawauchi, H. Functions of melanin-concentrating hormone in fish. J. Exp. Zool. Part A Comp. Exp. Biol. 2006, 305, 751–760. [Google Scholar] [CrossRef] [Scilit] [PubMed]
- Willard, D.H.; Bodnar, W.; Harris, C.; Kiefer, L.; Nichols, J.S.; Blanchard, S.; Hoffman, C.; Moyer, M.; Burkhart, W.; Weiel, J.; et al. Agouti structure and function: Characterization of a potent α-melanocyte stimulating hormone receptor antagonist. Biochemistry 1995, 34, 12341–12346. [Google Scholar] [CrossRef] [Scilit] [PubMed]
- Gröneveld, D.; Balm, P.H.M.; Wendelaar Bonga, S.E. Biphasic effect of MCH on α-MSH release from the tilapia (Oreochromis mossambicus) pituitary. Peptides 1995, 16, 945–949. [Google Scholar] [CrossRef] [Scilit] [PubMed][Green Version]
- Shimomura, Y.; Mori, M.; Sugo, T.; Ishibashi, Y.; Abe, M.; Kurokawa, T.; Onda, H.; Nishimura, O.; Sumino, Y.; Fujino, M. Isolation and identification of melanin-concentrating hormone as the endogenous ligand of the SLC-1 receptor. Biochem. Biophys. Res. Commun. 1999, 261, 622–626. [Google Scholar] [CrossRef] [Scilit] [PubMed]
- Nilsson Sköld, H.; Aspengren, S.; Wallin, M. Rapid colour change in fish and amphibians: Function, regulation and emerging applications. Pigment Cell Melanoma Res. 2013, 26, 29–38. [Google Scholar] [CrossRef] [Scilit] [PubMed]
- Cerdá-Reverter, J.M.; Agulleiro, M.J.; Guillot, R.; Sánchez, E.; Ceinos, R.; Rotllant, J. Fish melanocortin system. Eur. J. Pharmacol. 2011, 660, 53–60. [Google Scholar] [CrossRef] [Scilit] [PubMed]
- Lu, D.; Willard, D.; Patel, I.R.; Kadwell, S.; Overton, L.; Kost, T.; Luther, M.; Chen, W.; Woychik, R.P.; Wilkison, W.O.; et al. Agouti protein is an antagonist of the melanocyte-stimulating-hormone receptor. Nature 1994, 371, 799–802. [Google Scholar] [CrossRef] [Scilit] [PubMed]
- Cerdá-Reverter, J.M.; Haitina, T.; Schiöth, H.B.; Peter, R.E. Gene structure of the goldfish agouti-signaling protein: A putative role in the dorsal–ventral pigment pattern of fish. Endocrinology 2005, 146, 1597–1610. [Google Scholar] [CrossRef] [Scilit] [PubMed]
- Sugimoto, M. Morphological color change in fish: Regulation of pigment cell density and morphology. Microsc. Res. Tech. 2002, 58, 496–503. [Google Scholar] [CrossRef] [Scilit] [PubMed]
- Stevens, M.; Párraga, C.A.; Cuthill, I.C.; Partridge, J.C.; Troscianko, T.S. Using digital photography to study animal coloration. Biol. J. Linn. Soc. 2007, 90, 211–237. [Google Scholar] [CrossRef] [Scilit]
- Troscianko, J.; Stevens, M. Image calibration and analysis toolbox—A free software suite for objectively measuring reflectance, colour and pattern. Methods Ecol. Evol. 2015, 6, 1320–1331. [Google Scholar] [CrossRef] [Scilit] [PubMed]
- Gunnes, M.; Laique, T.; Gundersen, H.N.; Folkedal, O.; Nilsson, J.; Øverli, Ø.; Sørensen, C. Stress-induced fading of melanin-based skin pigmentation is associated with brain serotonergic activity in Atlantic salmon. 2026; submitted.
- Laique, T.; Gunnes, M.; Folkedal, O.; Nilsson, J.; Green, E.A.L.; Gundersen, H.N.; Øverli, Ø.; Ullah, H. Quantification of opercular pigmentation changes in farmed Atlantic salmon: A novel application for computer vision in fish welfare assessment. Fishes 2026, 11, 271. [Google Scholar] [CrossRef] [Scilit]
- Mathiassen, J.R.; Misimi, E.; Skavhaug, A. A simple computer vision method for automatic detection of melanin spots in Atlantic salmon fillets. In International Machine Vision and Image Processing Conference (IMVIP 2007); IEEE: New York, NY, USA, 2007; pp. 192–200. [Google Scholar] [CrossRef] [Scilit]
- Zhang, C.; Zhao, Y.; Yang, W.; Gao, L.; Zhang, W.; Liu, Y.; Sun, C.; Zhou, J.; Wang, H. Computer vision-based deep learning modeling for salmon part segmentation and defect identification. Foods 2025, 14, 3529. [Google Scholar] [CrossRef] [Scilit] [PubMed]
- Saberioon, M.; Gholizadeh, A.; Cisar, P.; Pautsina, A.; Urban, J. Application of machine vision systems in aquaculture with emphasis on fish: State-of-the-art and key issues. Rev. Aquac. 2017, 9, 369–387. [Google Scholar] [CrossRef] [Scilit]
- Ahmed, M.S.; Aurpa, T.T.; Azad, M.A.K. Fish disease detection using imagebased machine learning technique in aquaculture. J. King Saud Univ.—Comput. Inf. Sci. 2022, 34, 5170–5182. [Google Scholar] [CrossRef] [Scilit]
- Gupta, A.; Bringsdal, E.; Knausgård, K.M.; Goodwin, M. Accurate wound and lice detection in Atlantic salmon fish using a convolutional neural network. Fishes 2022, 7, 345. [Google Scholar] [CrossRef] [Scilit]
- Banno, K.; Kaland, H.; Crescitelli, A.M.; Tuene, S.A.; Aas, G.H.; Gansel, L.C. A novel approach for wild fish monitoring at aquaculture sites: Wild fish presence analysis using computer vision. Aquac. Environ. Interact. 2022, 14, 97–112. [Google Scholar] [CrossRef] [Scilit]
- Yu, H.; Wang, Z.; Qin, H.; Chen, Y. An automatic detection and counting method for fish lateral line scales of underwater fish based on improved YOLOv5. IEEE Access 2023, 11, 143616–143627. [Google Scholar] [CrossRef] [Scilit]
- Ranjan, R.; Tsukuda, S.; Good, C. MortCam: An artificial intelligence-aided fish detection and alert system for recirculating aquaculture. Aquac. Eng. 2023, 102, 102341. [Google Scholar] [CrossRef] [Scilit]
- Cisar, P.; Bekkozhayeva, D.; Movchan, O.; Saberioon, M.; Schraml, R. Computer vision based individual fish identification using skin dot pattern. Sci. Rep. 2021, 11, 16904. [Google Scholar] [CrossRef] [Scilit] [PubMed]
- Bekkozhayeva, D.; Cisar, P. Image-based automatic individual identification of fish without obvious patterns on the body (scale pattern). Appl. Sci. 2022, 12, 5401. [Google Scholar] [CrossRef] [Scilit]
- Zhou, Z.; Hitt, N.P.; Letcher, B.H.; Shi, W.; Li, S. Pigmentation-based visual learning for Salvelinus fontinalis individual re-identification. In 2022 IEEE International Conference on Big Data (Big Data); IEEE: New York, NY, USA, 2022; pp. 6850–6852. [Google Scholar] [CrossRef] [Scilit]
- Akkaynak, D.; Treibitz, T.; Xiao, B.; Gürkan, U.A.; Allen, J.J.; Demirci, U.; Hanlon, R.T. Use of commercial off-the-shelf digital cameras for scientific data acquisition and scene-specific color calibration. J. Opt. Soc. Am. A 2014, 31, 312–321. [Google Scholar] [CrossRef] [Scilit] [PubMed]
- Kim, S.J.; Lin, H.T.; Lu, Z.; Süsstrunk, S.; Lin, S.; Brown, M.S. A new in-camera imaging model for color computer vision and its application. IEEE Trans. Pattern Anal. Mach. Intell. 2012, 34, 2289–2302. [Google Scholar] [CrossRef] [Scilit] [PubMed]
- Laique, T.; Gunnes, M.; Øverli, Ø.; Ullah, H.; Ocepek, M. Computer vision-based phenotyping of melanin-based opercular spot architecture in farmed Atlantic salmon: Toward image-derived welfare monitoring. J. Anim. Sci. 2026; submitted.
- Jocher, G.; Chaurasia, A.; Qiu, J. Ultralytics YOLOv8 (Version 8.0.0) [Computer Software]. 2023. Available online: https://github.com/ultralytics/ultralytics (accessed on 1 January 2026).
- Ravi, N.; Gabeur, V.; Hu, Y.-T.; Hu, R.; Ryali, C.; Ma, T.; Khedr, H.; Rädle, R.; Rolland, C.; Gustafson, L.; et al. SAM 2: Segment anything in images and videos. arXiv 2024, arXiv:2408.00714. [Google Scholar] [CrossRef] [Scilit]
- Dwyer, B.; Nelson, J.; Hansen, T.; Solawetz, J. Roboflow (Version 1.0) [Computer Software]. 2025. Available online: https://roboflow.com (accessed on 1 January 2026).
- Xu, M.; Yoon, S.; Fuentes, A.; Park, D.S. A comprehensive survey of image augmentation techniques for deep learning. Pattern Recognit. 2023, 137, 109347. [Google Scholar] [CrossRef] [Scilit]
- Lin, T.-Y.; Maire, M.; Belongie, S.; Hays, J.; Perona, P.; Ramanan, D.; Dollár, P.; Zitnick, C.L. Microsoft COCO: Common objects in context. In Computer Vision—ECCV 2014; Fleet, D., Pajdla, T., Schiele, B., Tuytelaars, T., Eds.; Springer: Berlin/Heidelberg, Germany, 2014; pp. 740–755. [Google Scholar] [CrossRef] [Scilit]
- Buslaev, A.; Iglovikov, V.I.; Khvedchenya, E.; Parinov, A.; Druzhinin, M.; Kalinin, A.A. Albumentations: Fast and flexible image augmentations. Information 2020, 11, 125. [Google Scholar] [CrossRef] [Scilit]
- Kingma, D.P.; Ba, J. Adam: A method for stochastic optimization. arXiv 2014, arXiv:1412.6980. [Google Scholar] [CrossRef] [Scilit]
- Ryali, C.; Hu, Y.-T.; Bolya, D.; Wei, C.; Fan, H.; Huang, P.-Y.; Aggarwal, V.; Chowdhury, A.; Poursaeed, O.; Hoffman, J.; et al. Hiera: A hierarchical vision transformer without the bells-and-whistles. In Proceedings of the 40th International Conference on Machine Learning, Honolulu, HI, USA, 23–29 July 2023; PMLR Volume 202. pp. 29441–29454. [Google Scholar]
- Otsu, N. A threshold selection method from gray-level histograms. IEEE Trans. Syst. Man Cybern. 1979, 9, 62–66. [Google Scholar] [CrossRef] [Scilit]
- Bradski, G. The OpenCV library. Dr. Dobb’s J. Softw. Tools 2000, 25, 120–125. [Google Scholar] [CrossRef] [Scilit]
- Lowe, D.G. Distinctive image features from scale-invariant keypoints. Int. J. Comput. Vis. 2004, 60, 91–110. [Google Scholar] [CrossRef] [Scilit]
- Muja, M.; Lowe, D.G. Fast approximate nearest neighbors with automatic algorithm configuration. In Proceedings of the Fourth International Conference on Computer Vision Theory and Applications; SciTePress: Setúbal, Portugal, 2009; Volume 1, pp. 331–340. [Google Scholar] [CrossRef] [Scilit]
- Dubrofsky, E. Homography Estimation. Master’s Thesis, Univerzita Britské Kolumbie, Vancouver, BC, Canada, 2009. [Google Scholar]
- Fischler, M.A.; Bolles, R.C. Random sample consensus: A paradigm for model fitting with applications to image analysis and automated cartography. Commun. ACM 1981, 24, 381–395. [Google Scholar] [CrossRef] [Scilit]
- Höglund, E.; Balm, P.H.M.; Winberg, S. Skin darkening, a potential social signal in subordinate Arctic charr (Salvelinus alpinus): The regulatory role of brain monoamines and pro-opiomelanocortin-derived peptides. J. Exp. Biol. 2000, 203, 1711–1721. [Google Scholar] [CrossRef] [Scilit] [PubMed]
- Stien, L.H.; Bracke, M.B.M.; Folkedal, O.; Nilsson, J.; Oppedal, F.; Torgersen, T.; Kittilsen, S.; Midtlyng, P.J.; Vindas, M.A.; Øverli, Ø.; et al. Salmon Welfare Index Model (SWIM 1.0): A semantic model for overall welfare assessment of caged Atlantic salmon—Review of the selected welfare indicators and model presentation. Rev. Aquac. 2013, 5, 33–57. [Google Scholar] [CrossRef] [Scilit]
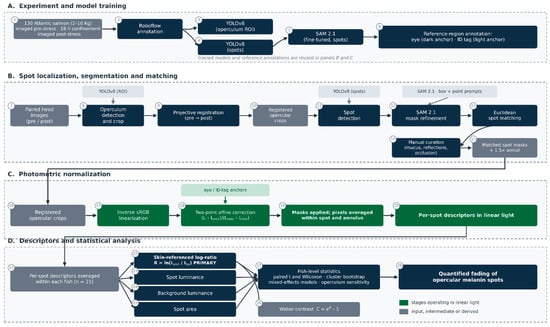
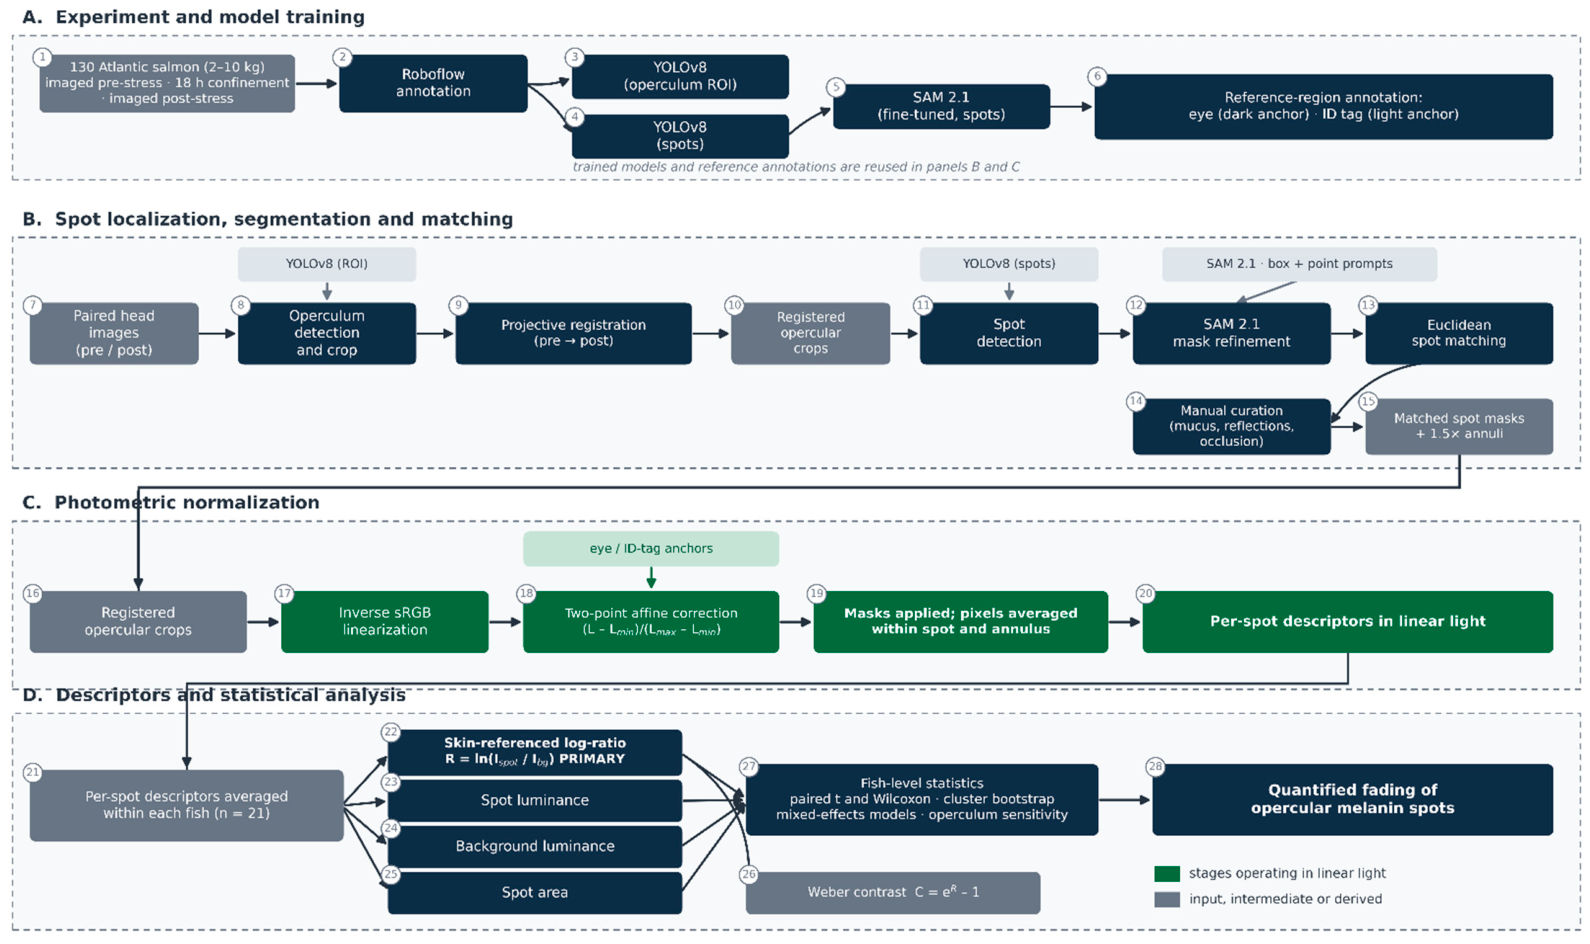
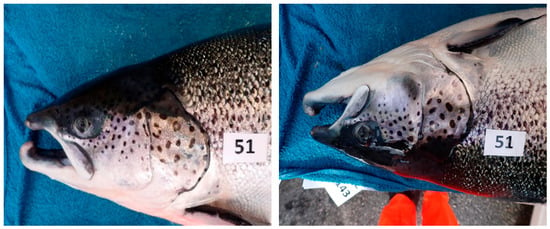
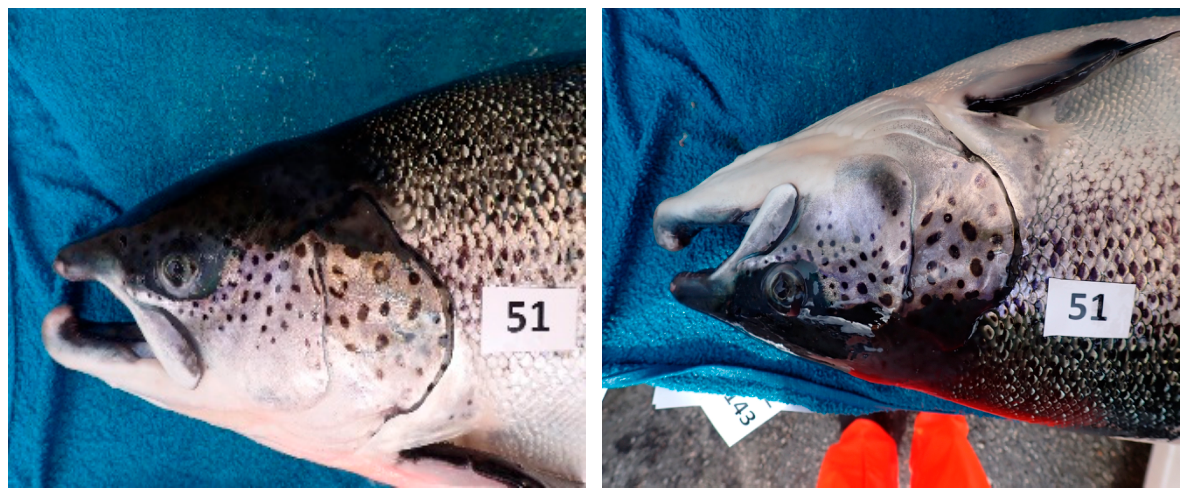
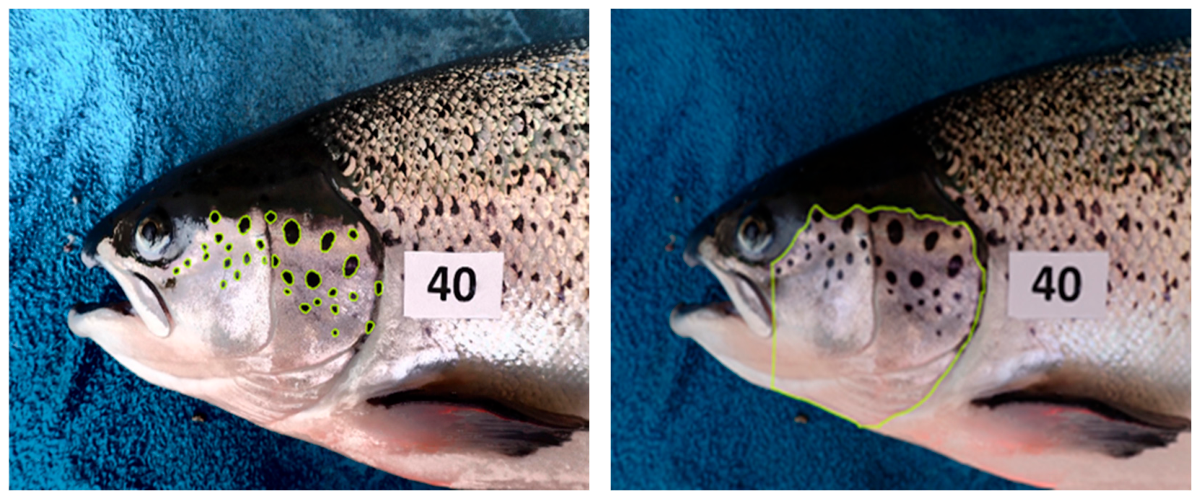
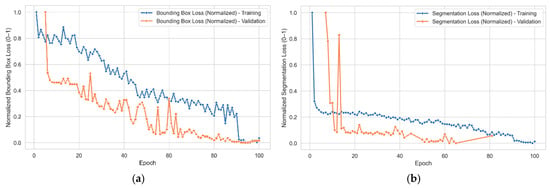
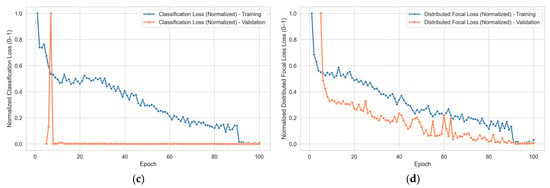
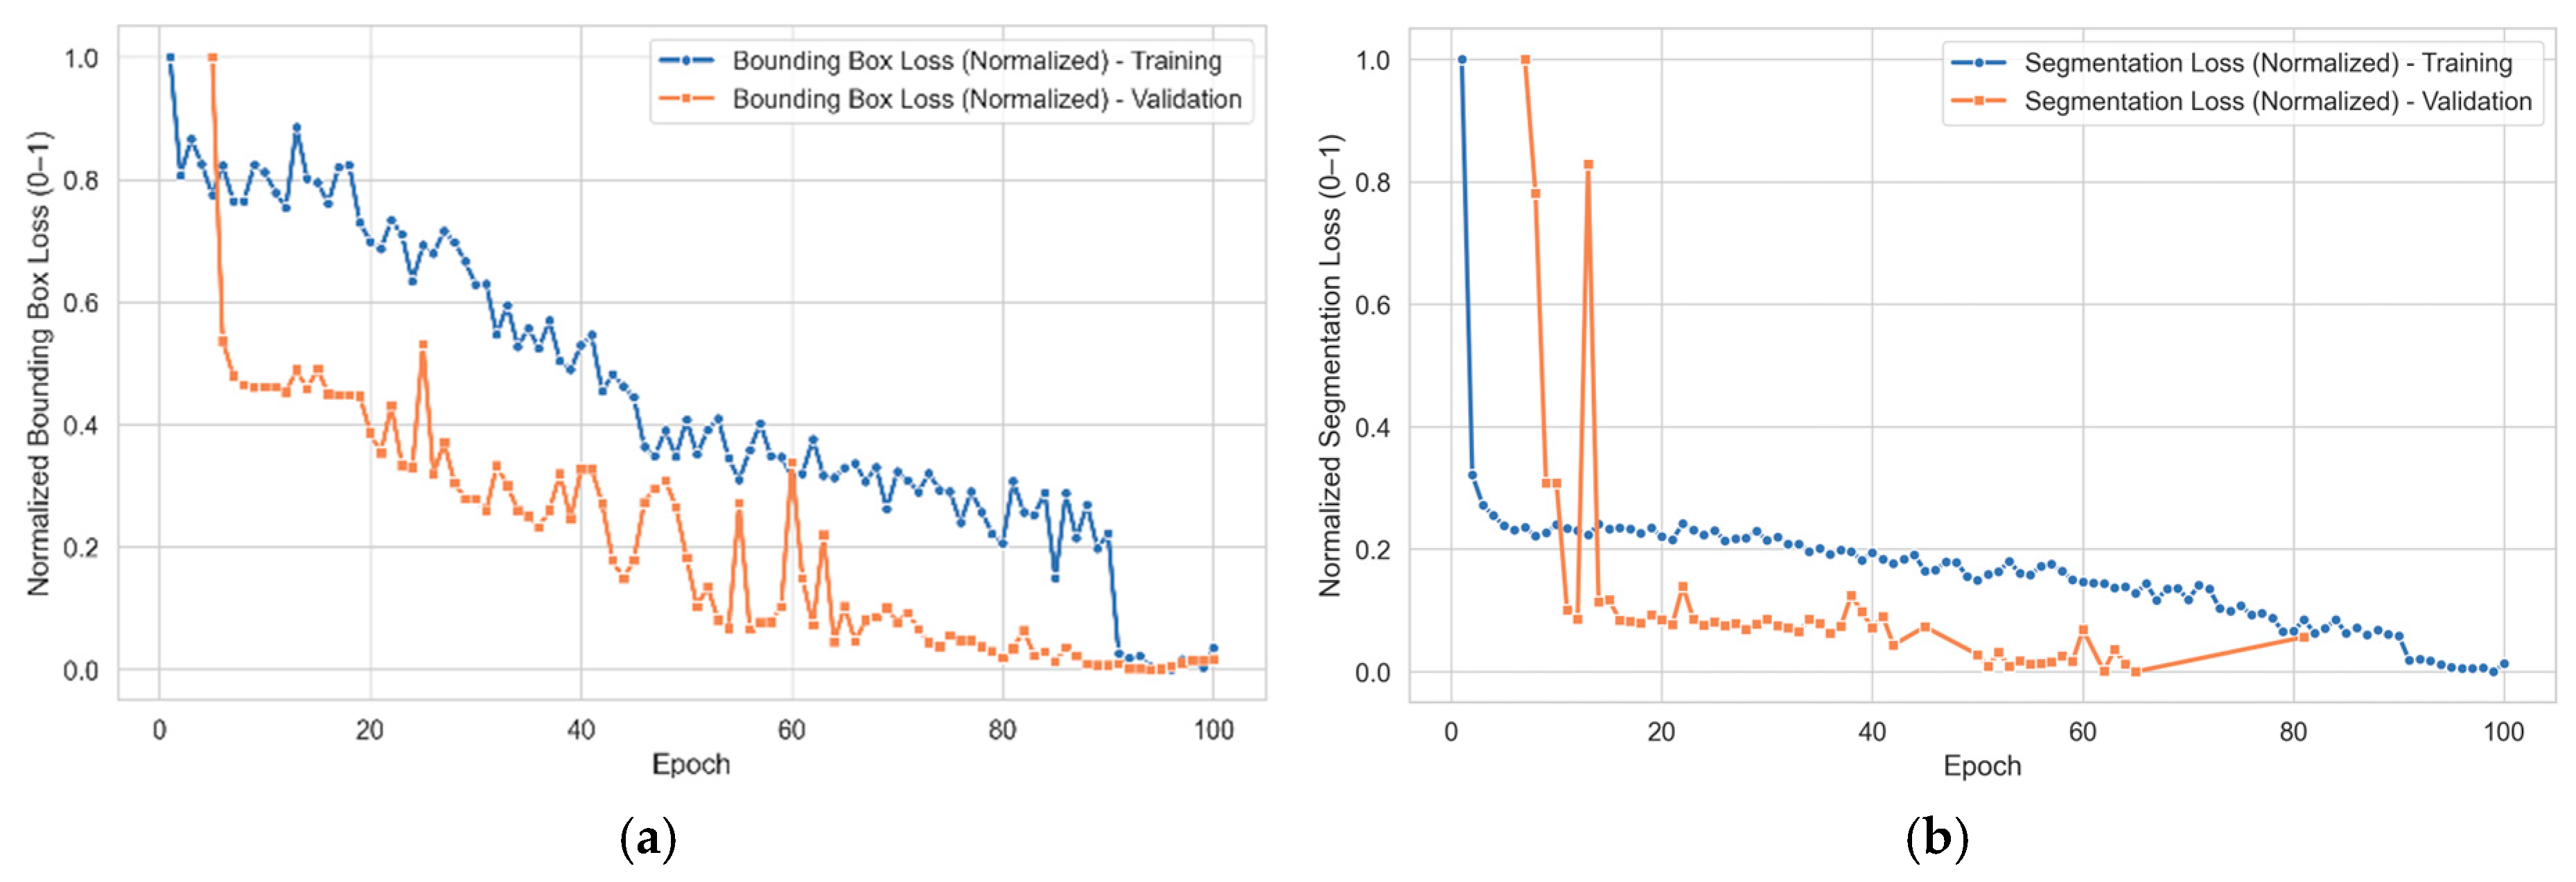
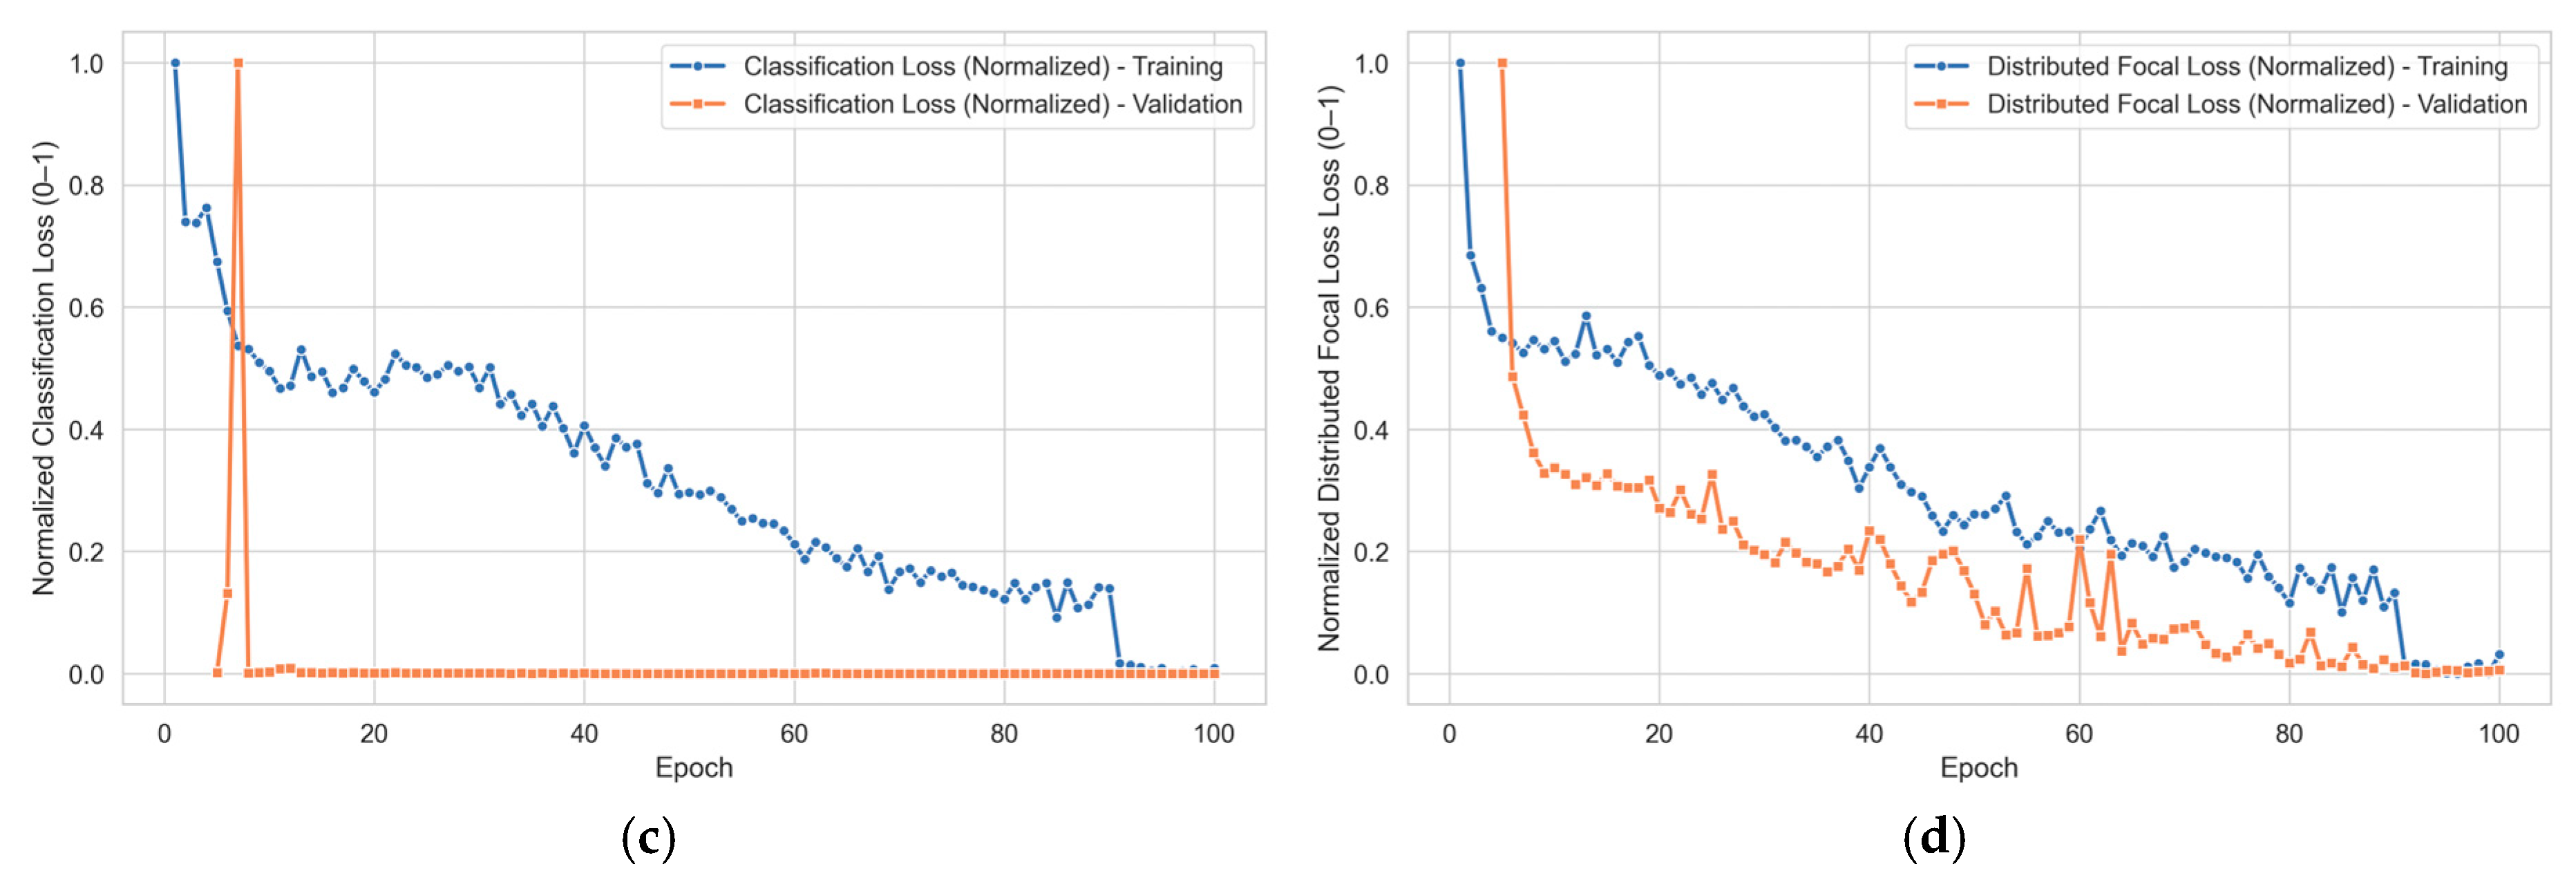
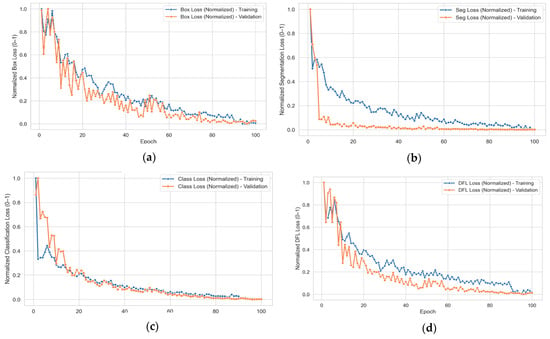
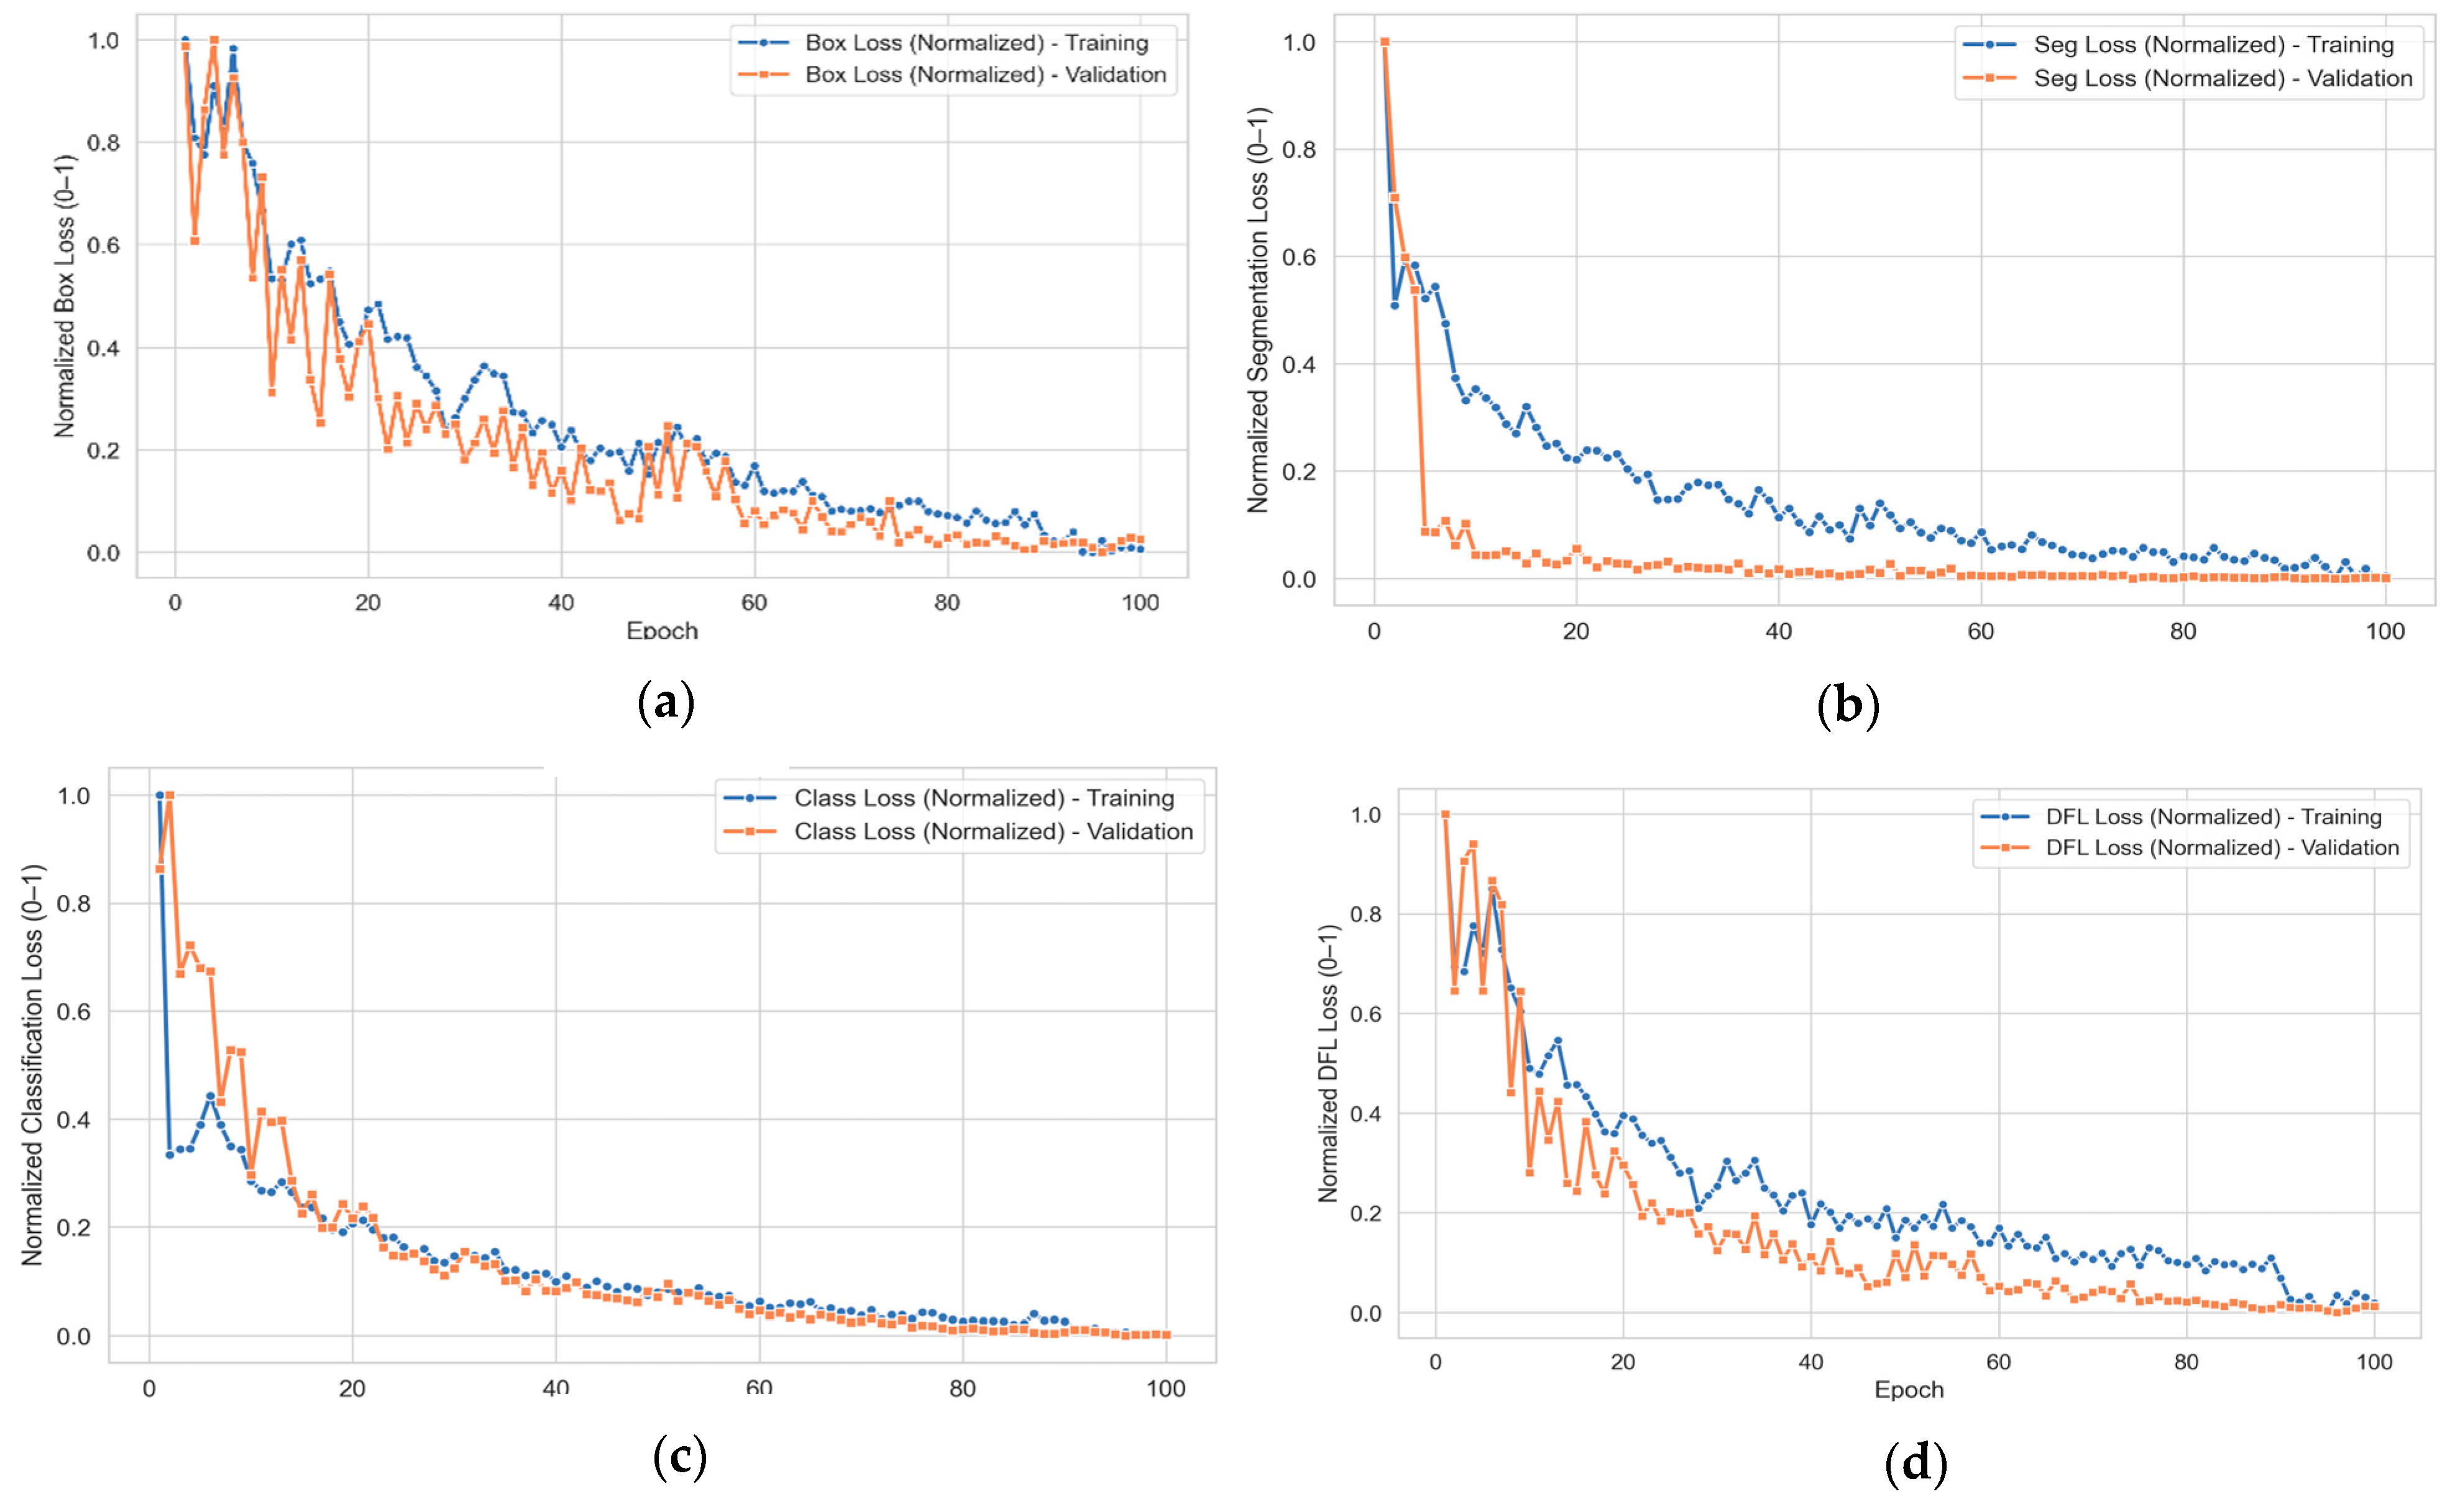
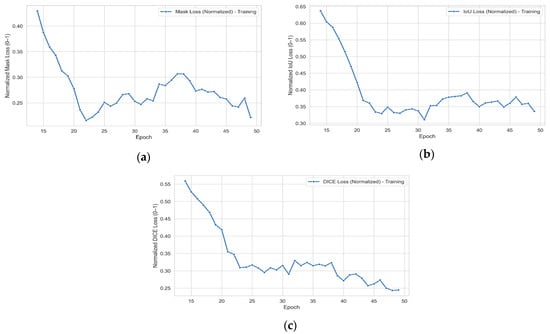
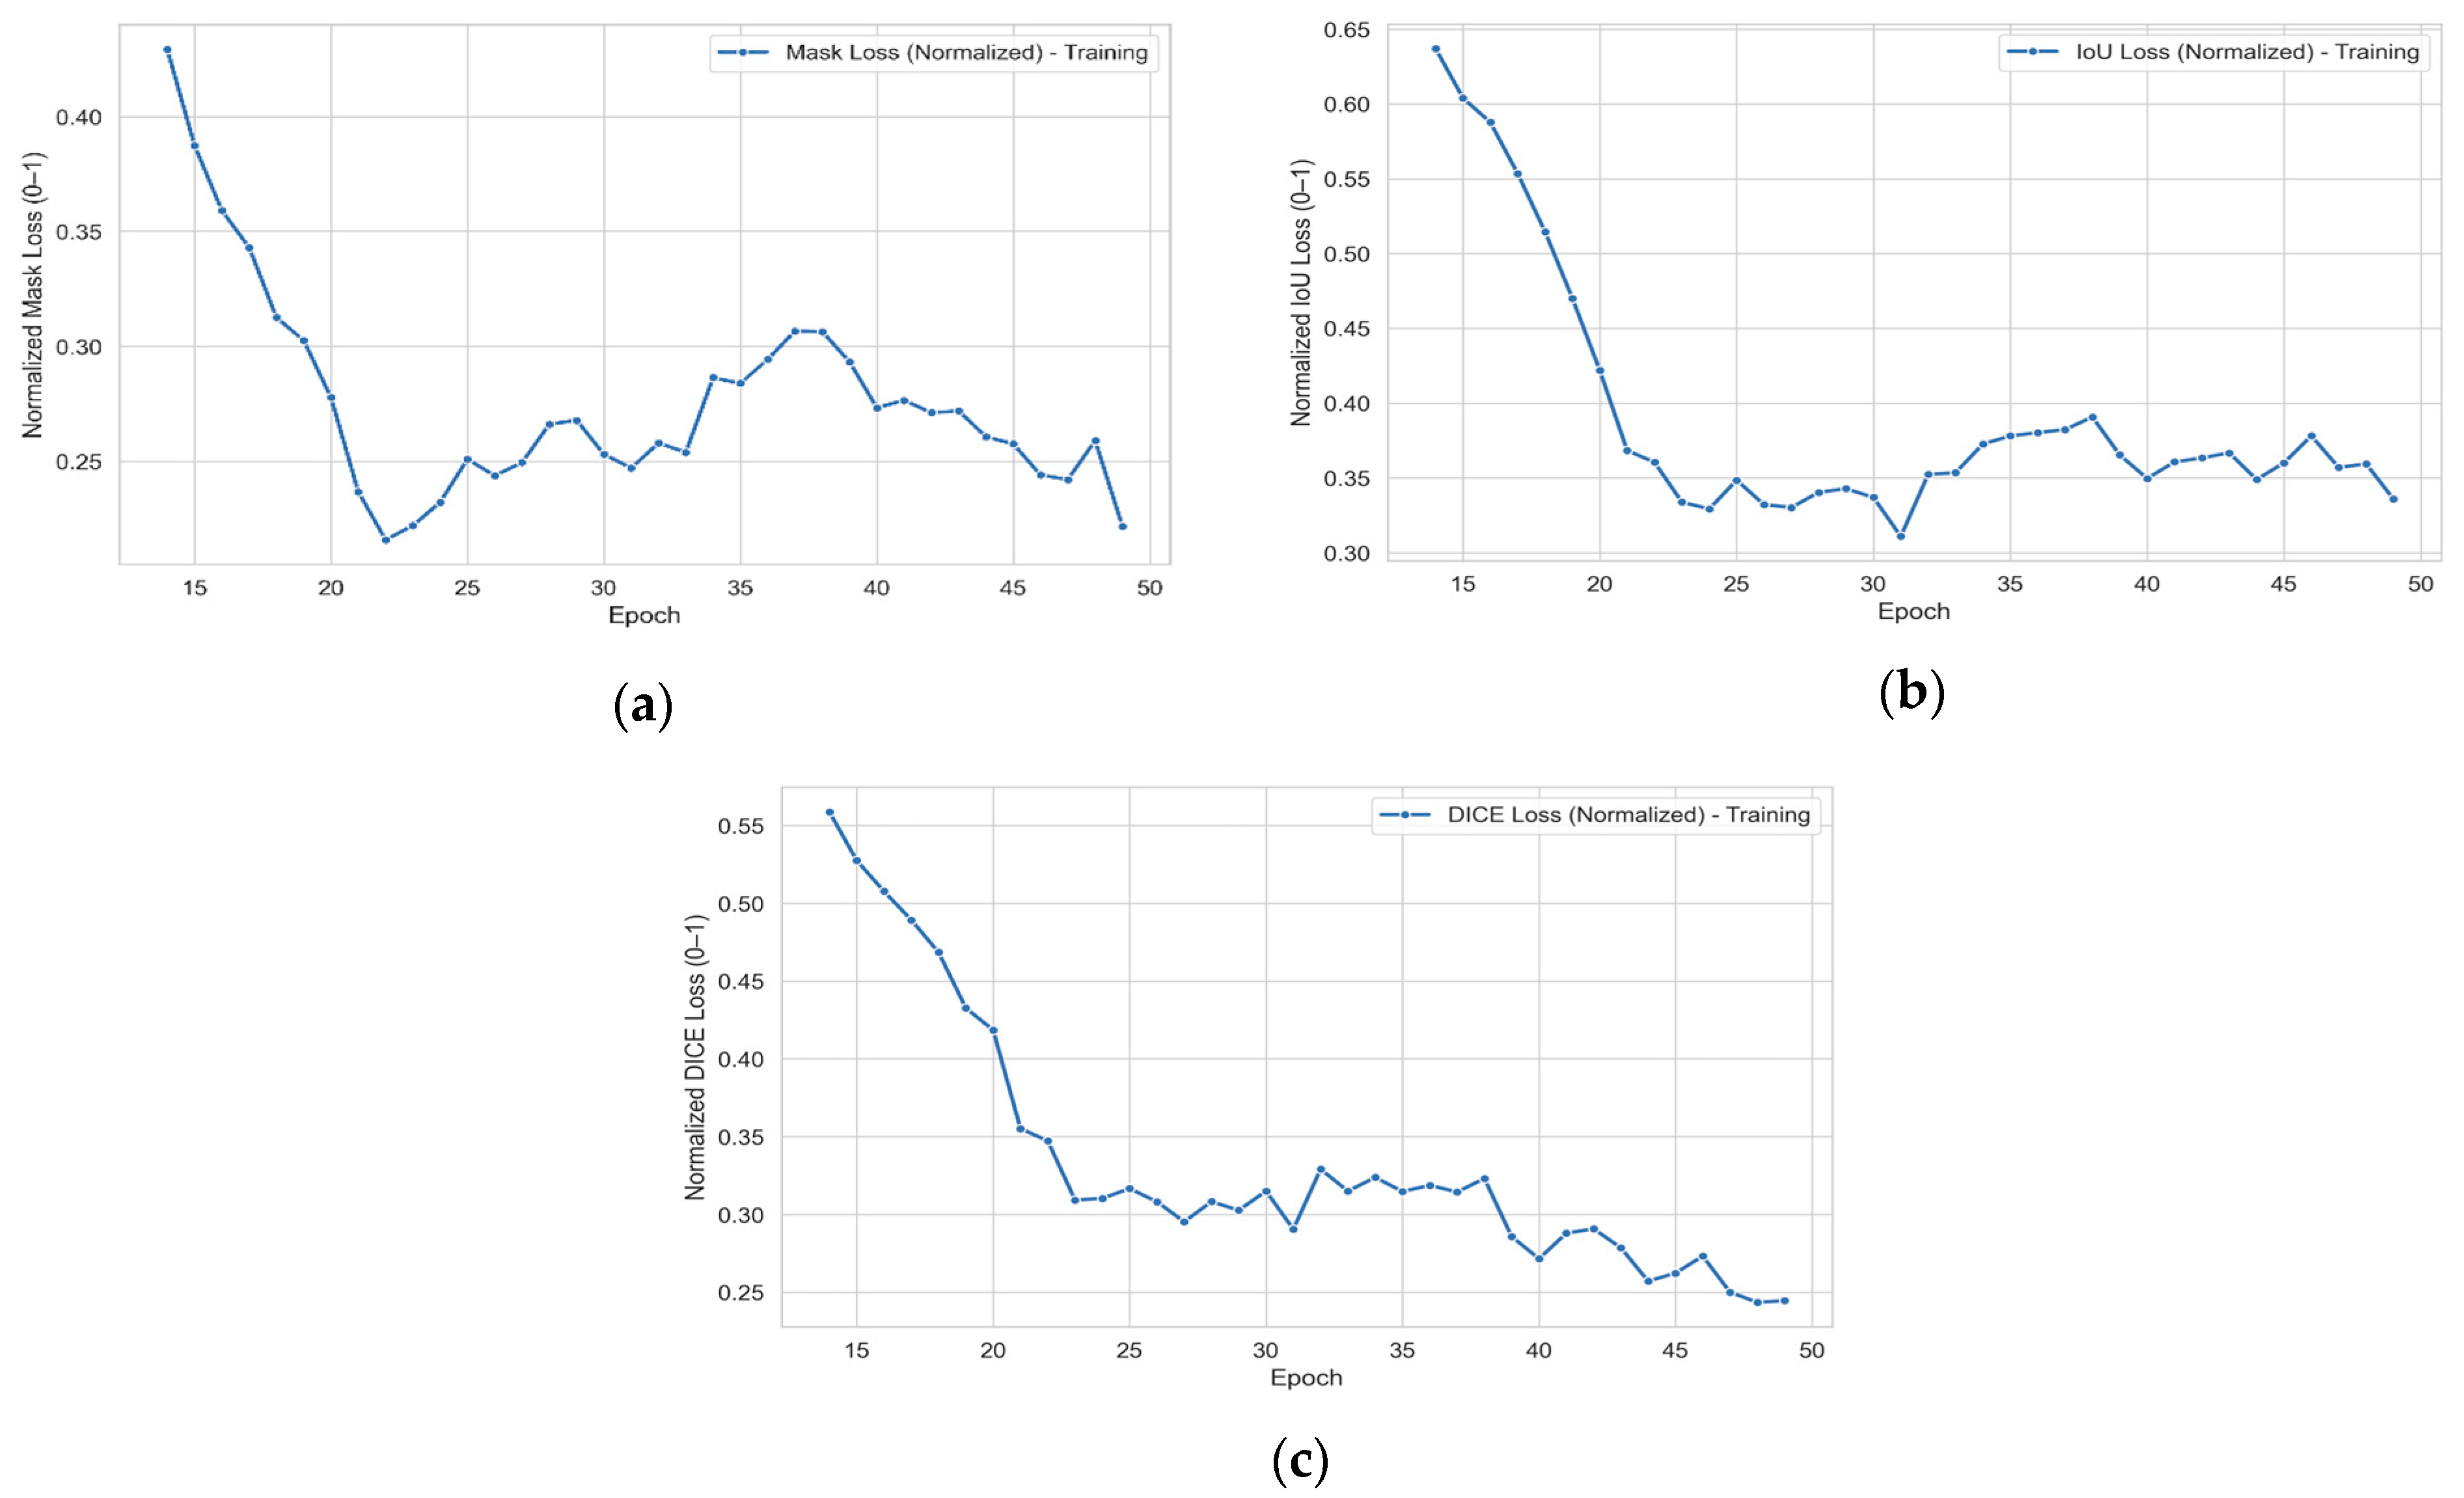
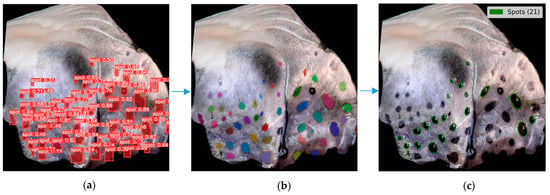
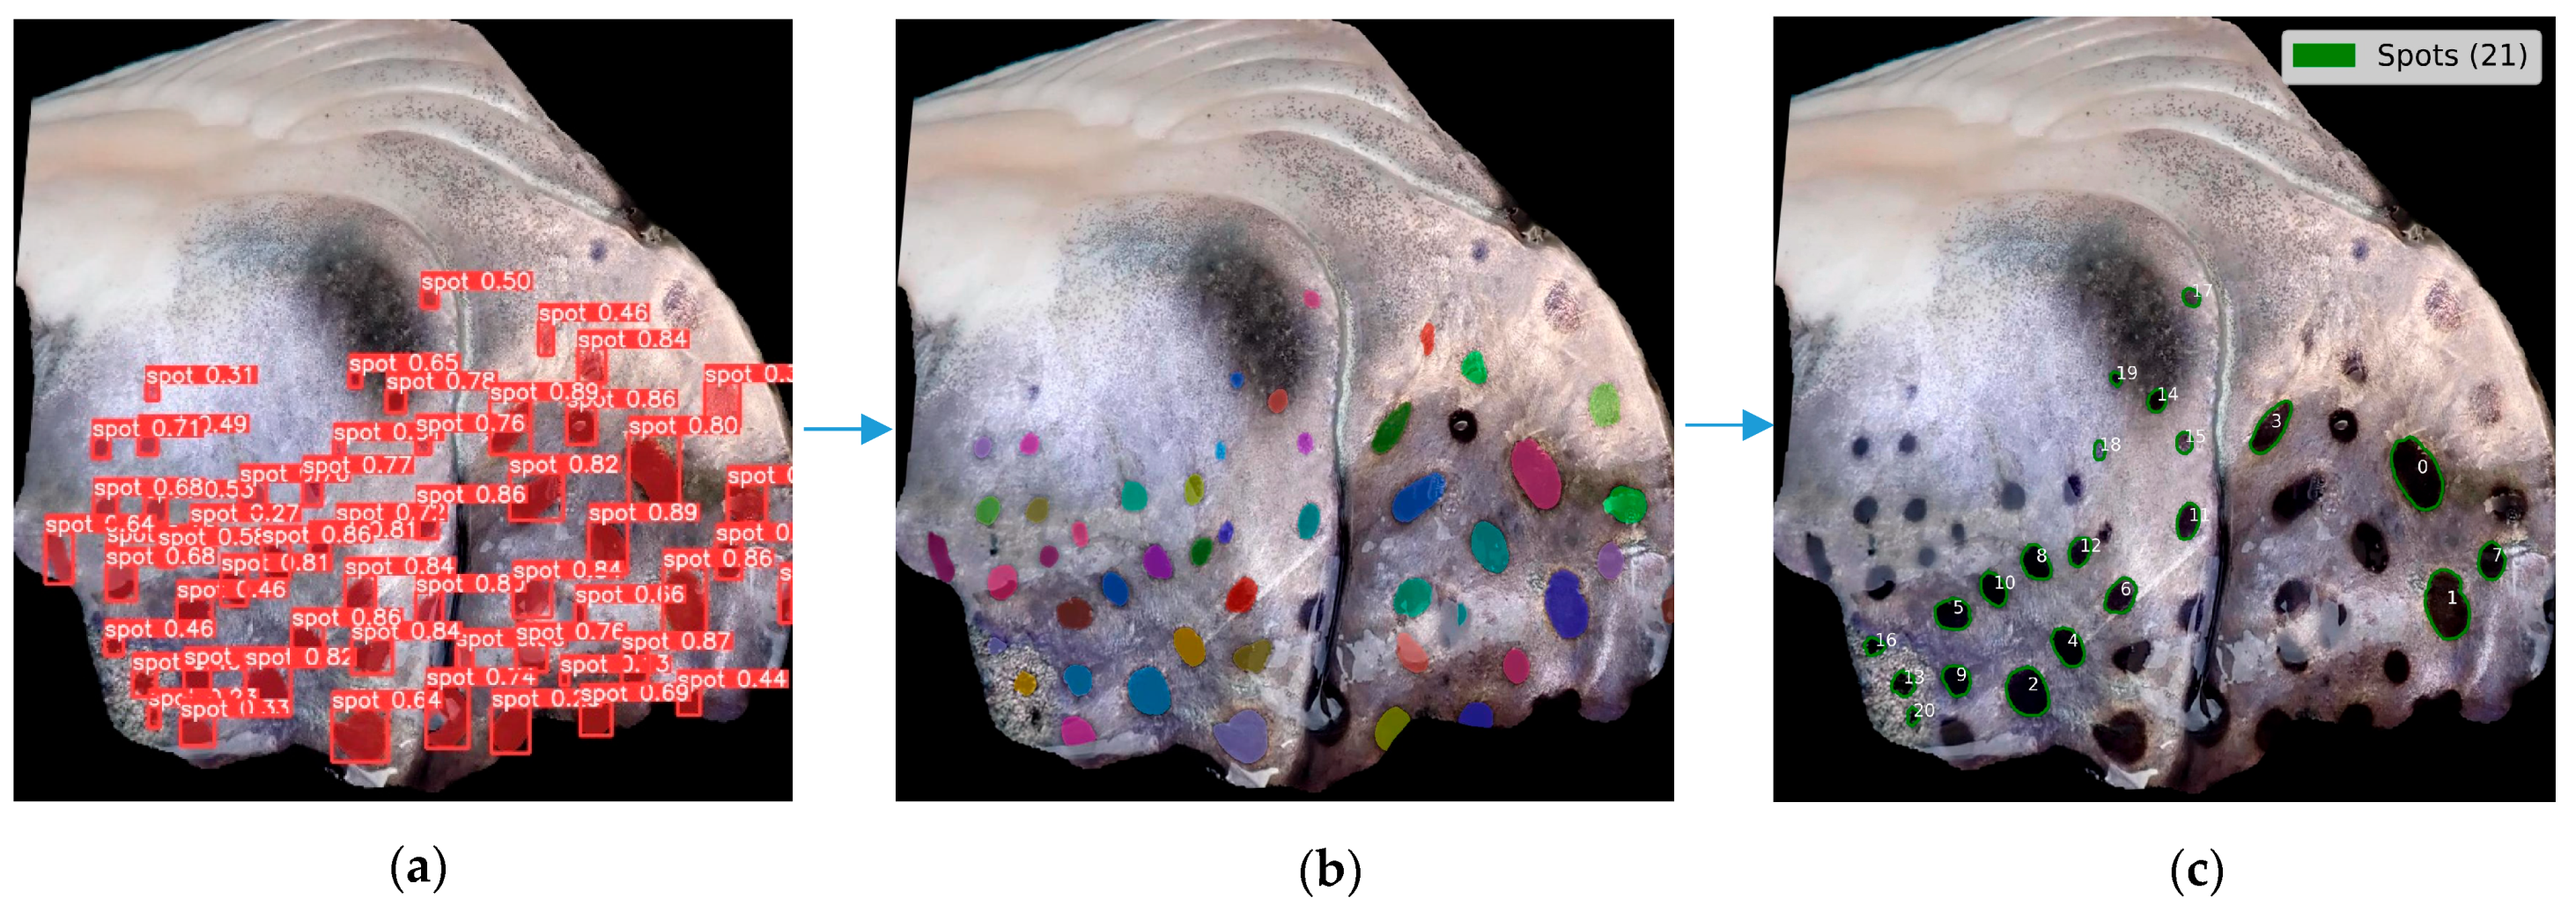
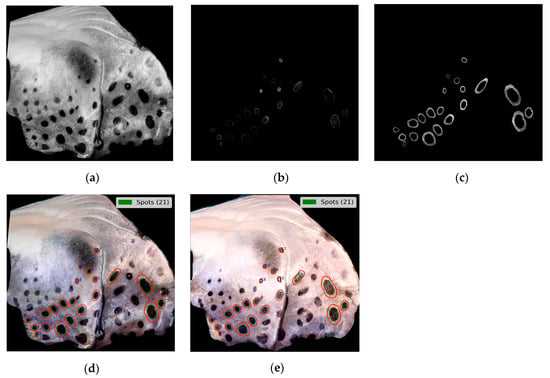
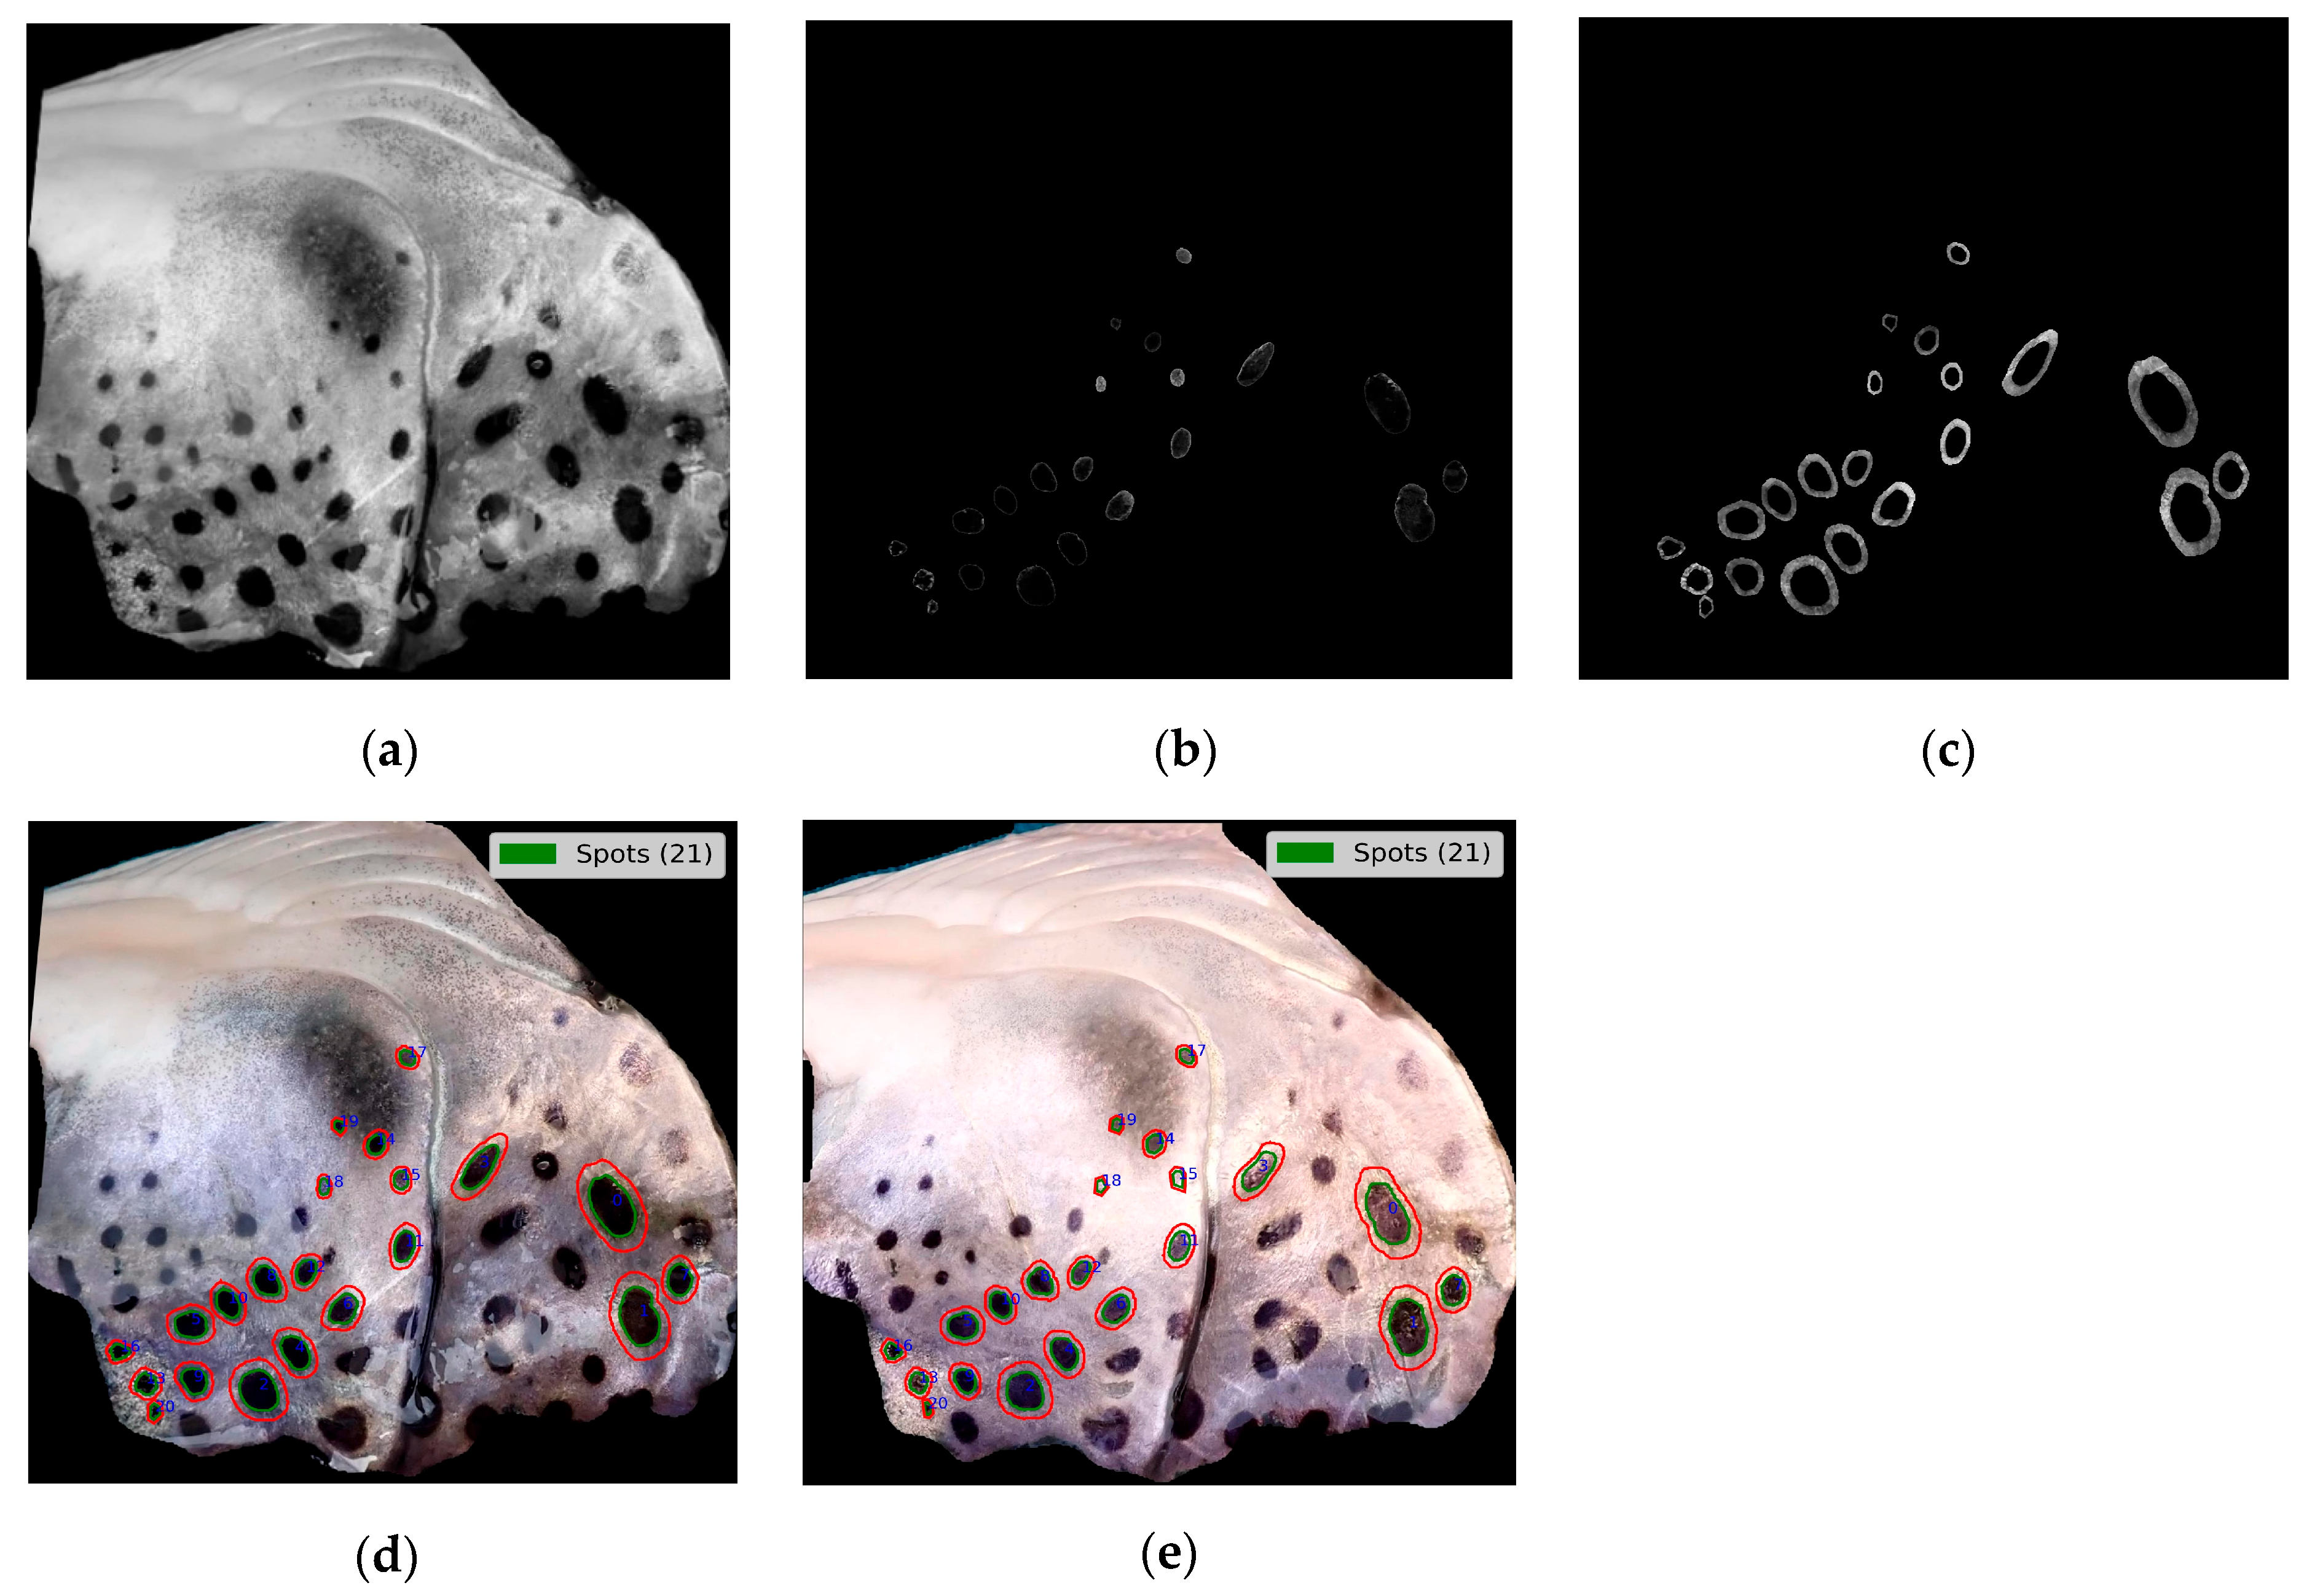
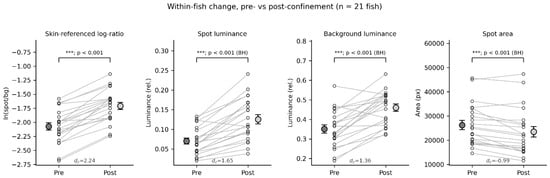
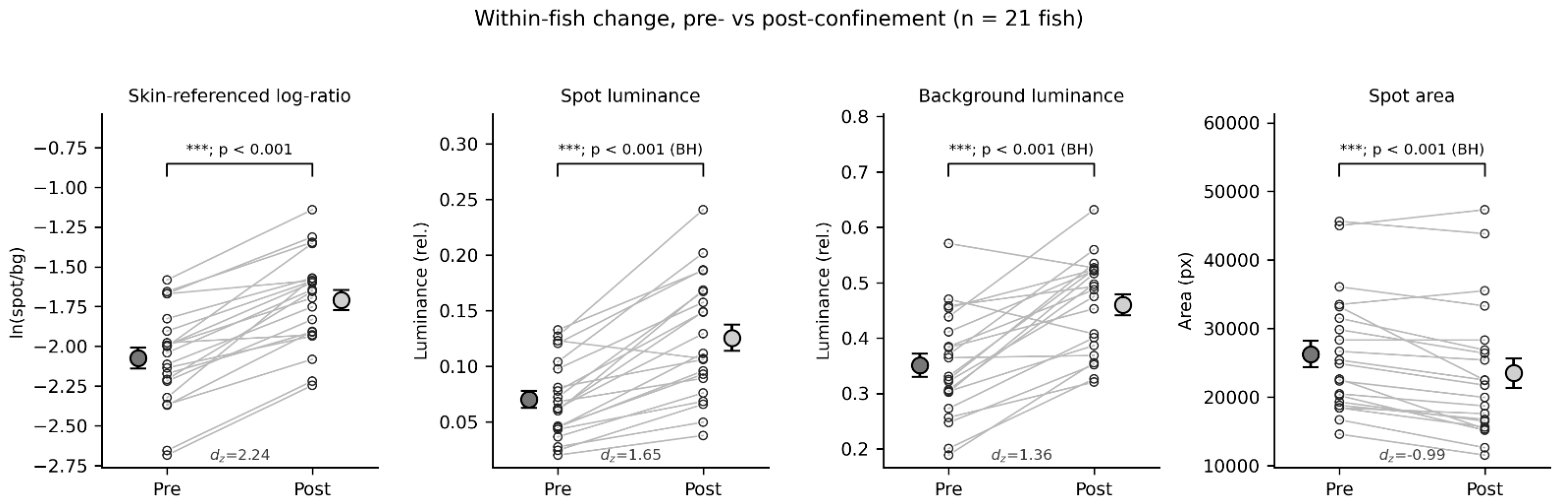
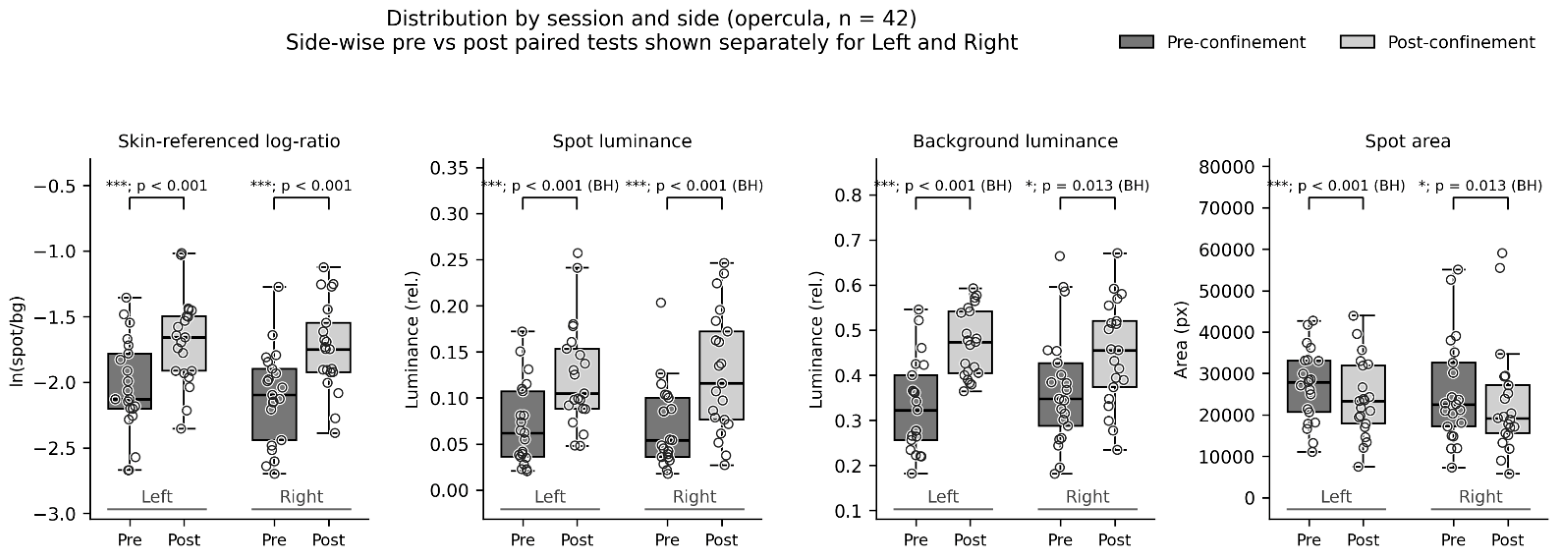
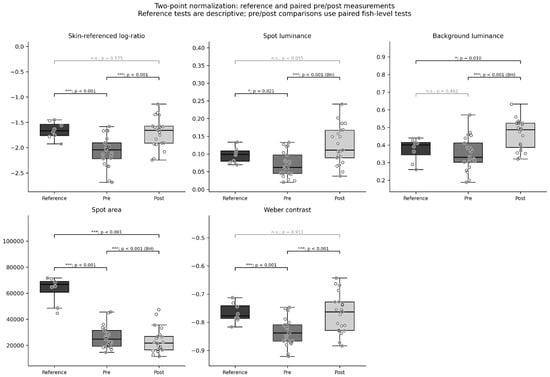
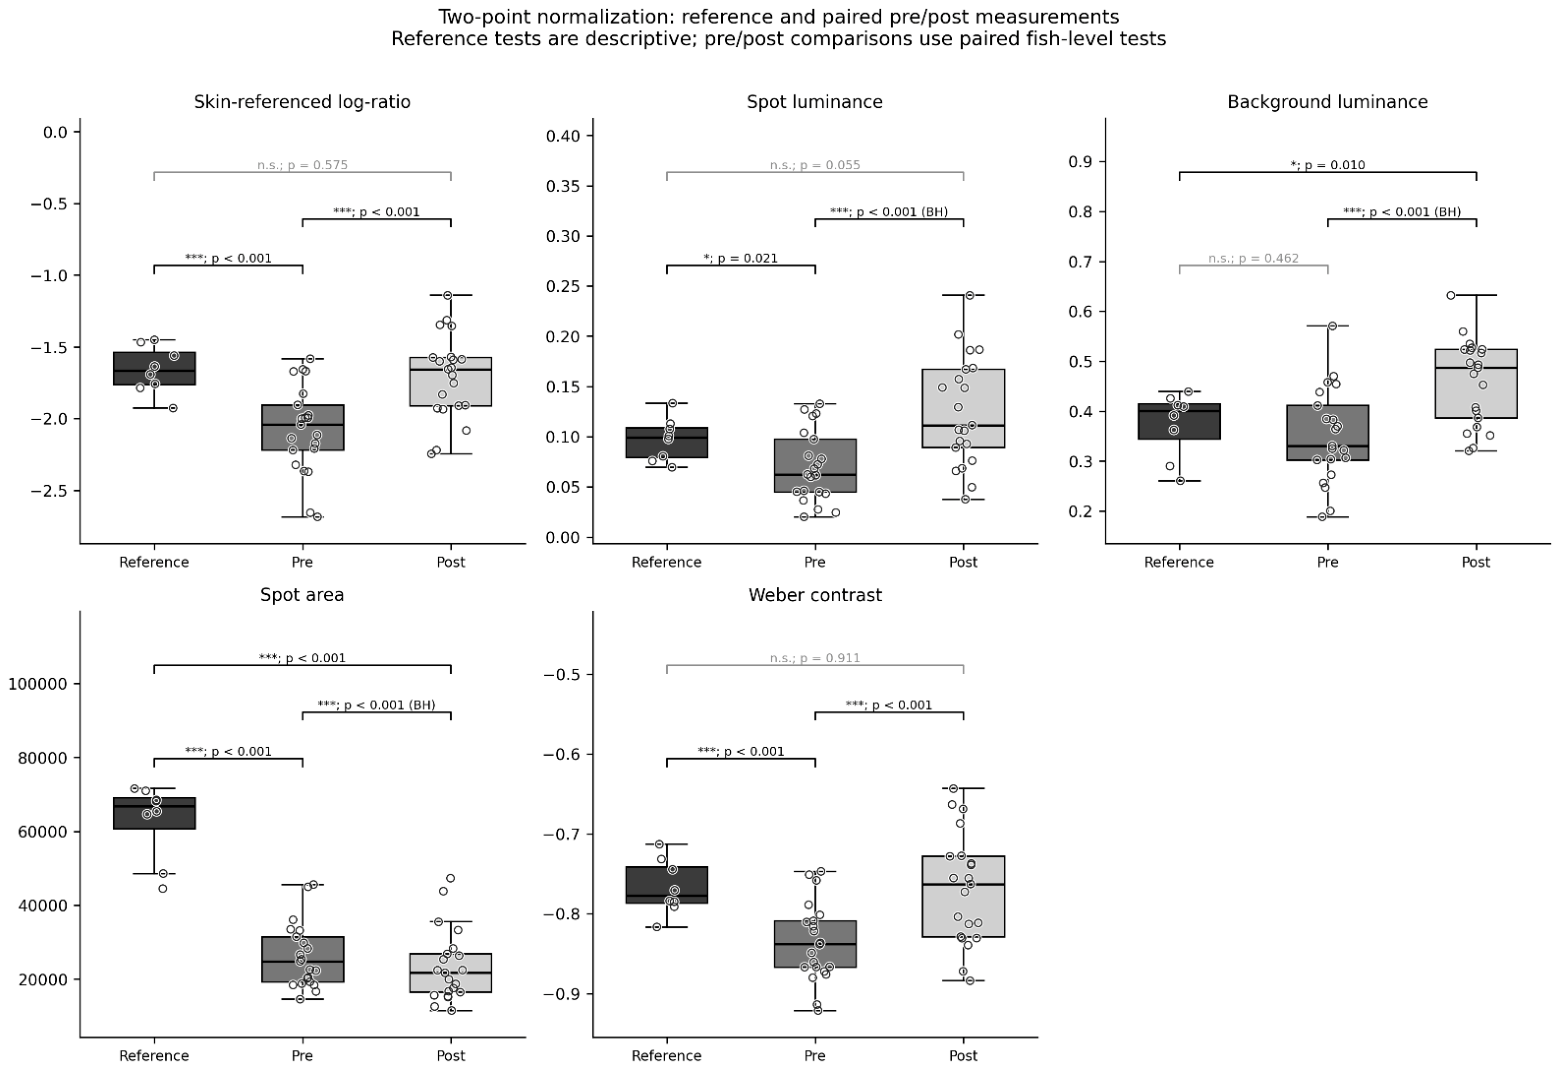

Disclaimer/Publisher’s Note: The statements, opinions and data contained in all publications are solely those of the individual author(s) and contributor(s) and not of MDPI and/or the editor(s). MDPI and/or the editor(s) disclaim responsibility for any injury to people or property resulting from any ideas, methods, instructions or products referred to in the content. |
© 2026 by the authors. Licensee MDPI, Basel, Switzerland. This article is an open access article distributed under the terms and conditions of the Creative Commons Attribution (CC BY) license.